B
Barchart
279點贊0分享3粉絲0關注
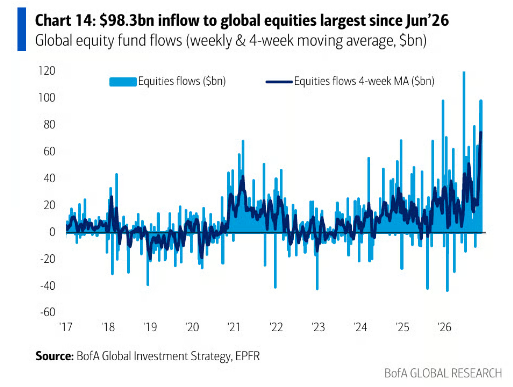
Global stocks pulled in $98.3B last week—the biggest weekly inflow since June. Put it next to what BTC, DXY, the 10Y yield, gold, and U.S. equities did around the same window to see what the market was actually pricing, rather than reading it off a single asset move.
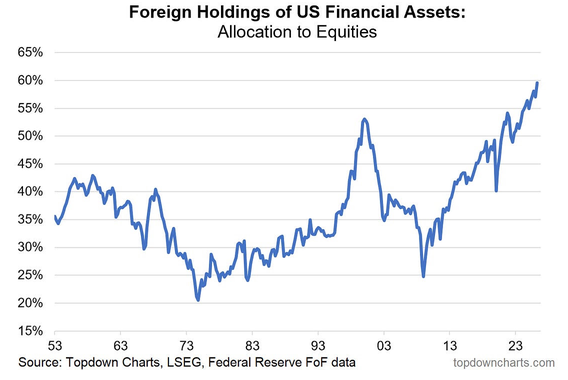
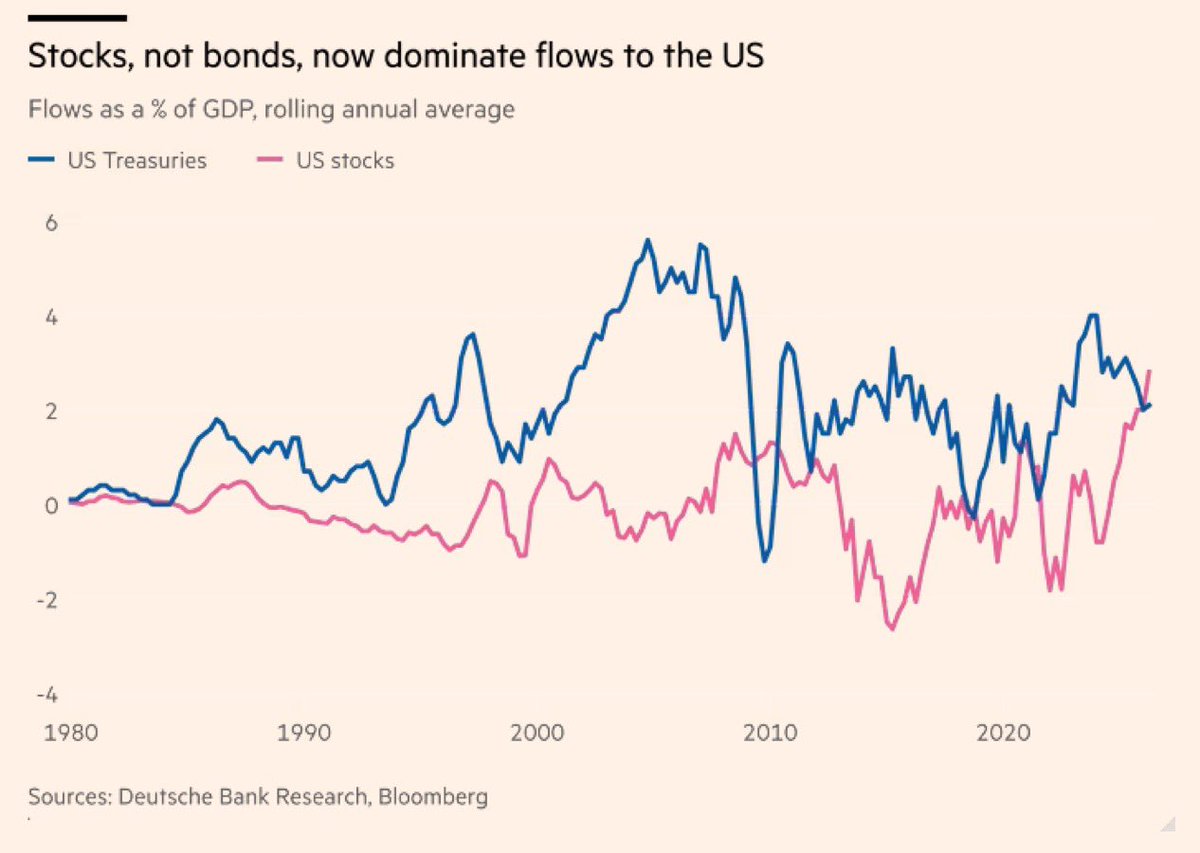
Foreign investors are putting more money into U.S. stocks than Treasuries—something we’ve only seen twice before this century (during the Global Financial Crisis and Covid).
Over 100,000 people—including Elon Musk—have signed a petition calling for Jensen Huang to be reinstated as Nvidia ($NVDA) CEO.

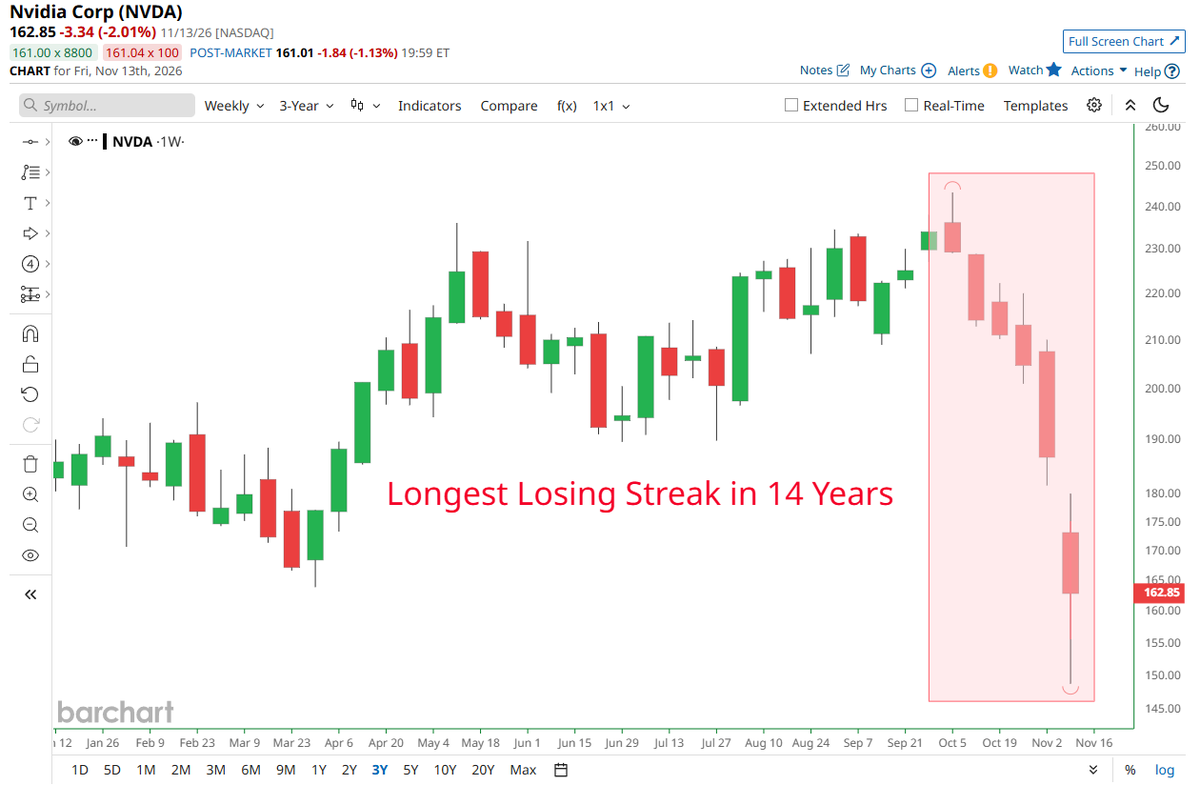
Nvidia ($NVDA) is still in the red again this week—making it 6 straight weekly declines. That’s the longest weekly losing streak for the stock since 2012.
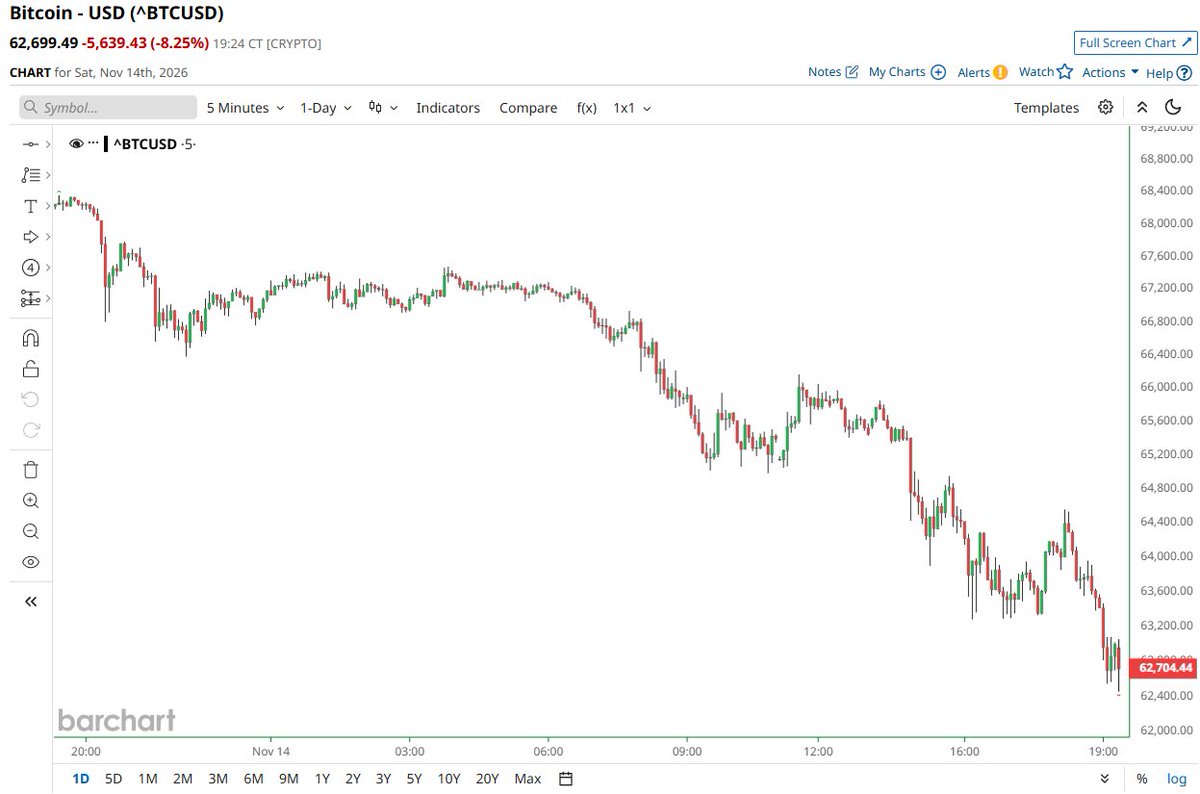
BTC 突然向下插针(Timber…📉)。想知道这波到底在交易什么,别只盯着币价:把消息前后同一时间窗里的 BTC、DXY、10Y 美债收益率、黄金和美股放在一起对照——如果美元走强、收益率上行、黄金走弱且美股承压,更像是在定价“更紧的金融条件/风险偏好降温”;如果美元回落、收益率下行、黄金走强而美股相对抗跌,那更像是“避险/降息预期”在被买入。把这五个资产的方向是否一致作为判断依据,才看得出市场真正押的是哪条信息。
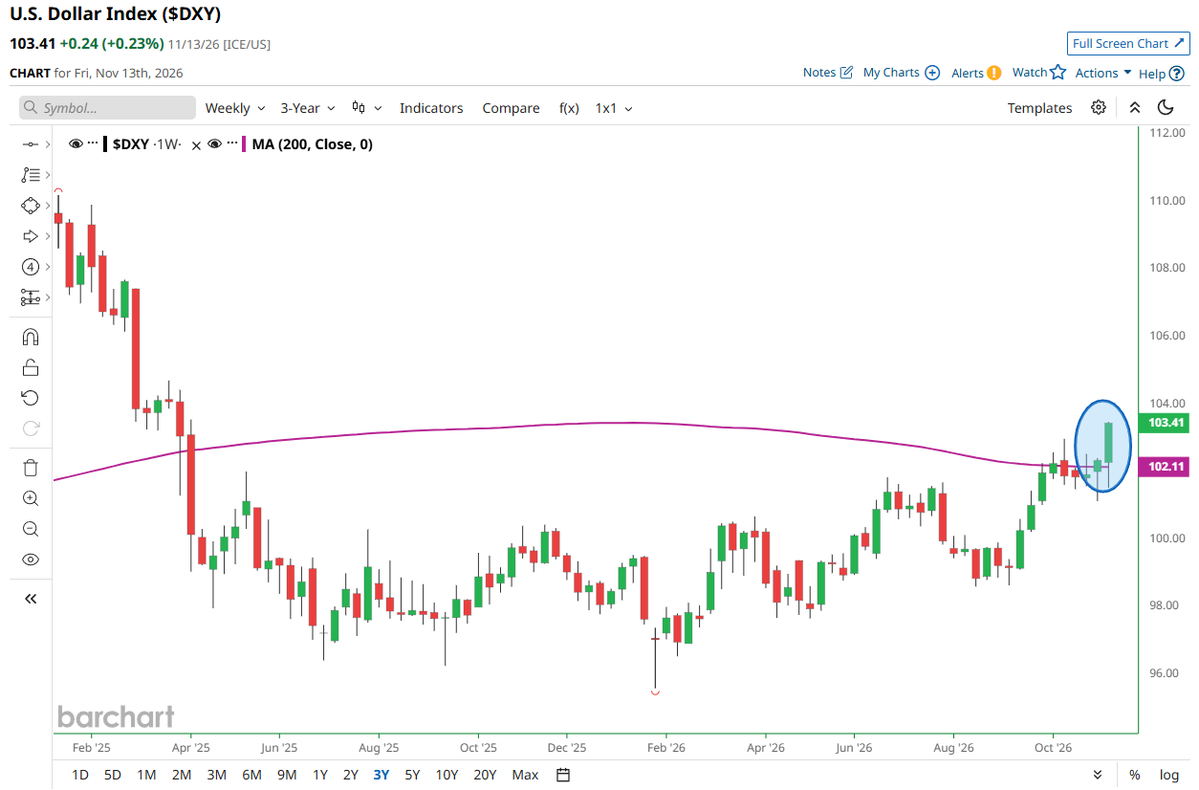
Looking at the tape around the event—and cross-checking BTC, DXY, the 10Y Treasury yield, gold, and U.S. equities—the key isn’t just “DXY is up,” but what the broader mix confirms. With the dollar holding firmly above its 200-week moving average for the first time in 19 months, the market appears to be pricing in sustained tight financial conditions (higher-for-longer rates / resilient U.S. growth), rather than a one-off technical breakout.
Use pre- and post-event market data to compare moves across BTC, DXY, the 10Y Treasury yield, gold, and U.S. equities. Then infer what headline the market is actually pricing and summarize it as: “Event → Data changes → What the market is pricing.” Don’t draw conclusions from a single asset’s up/down move. Original: Which asset is likely to outperform over the next 5 years? Anthropic ($ANT) Bitcoin ($BTC) Gold ($GLD) Nvidia ($NVDA)
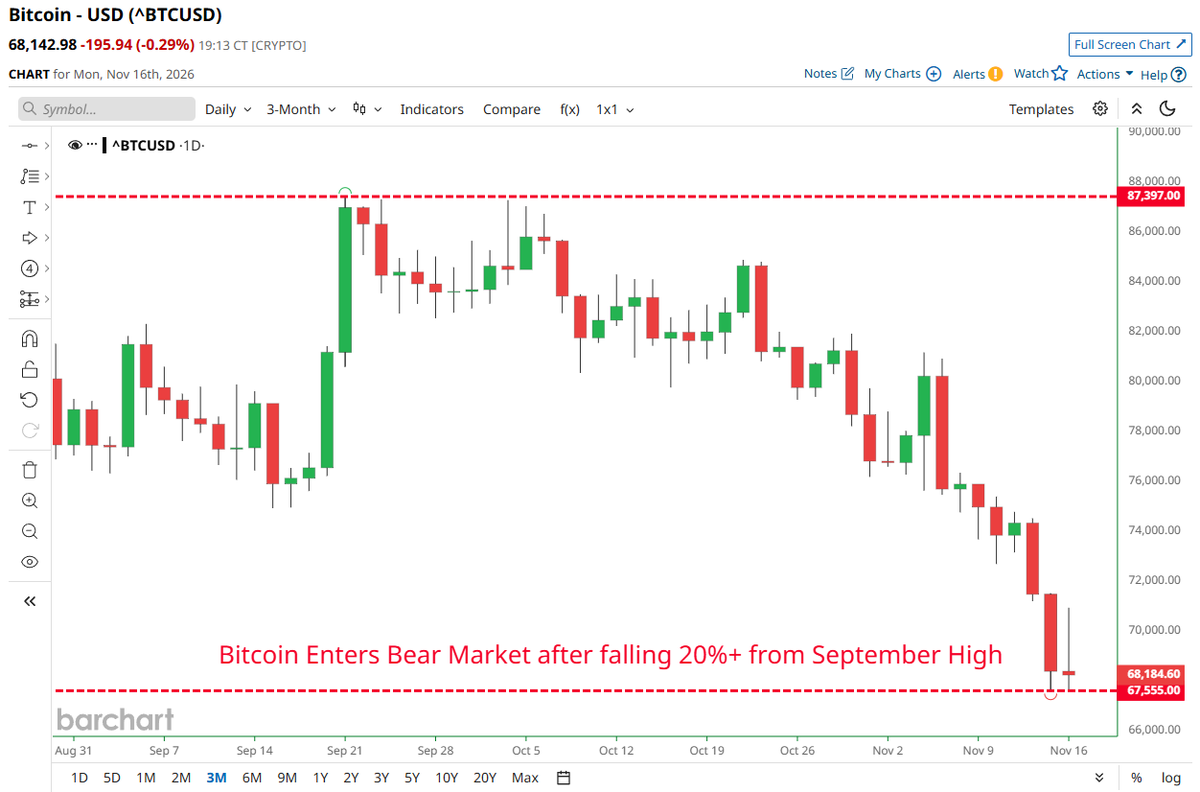
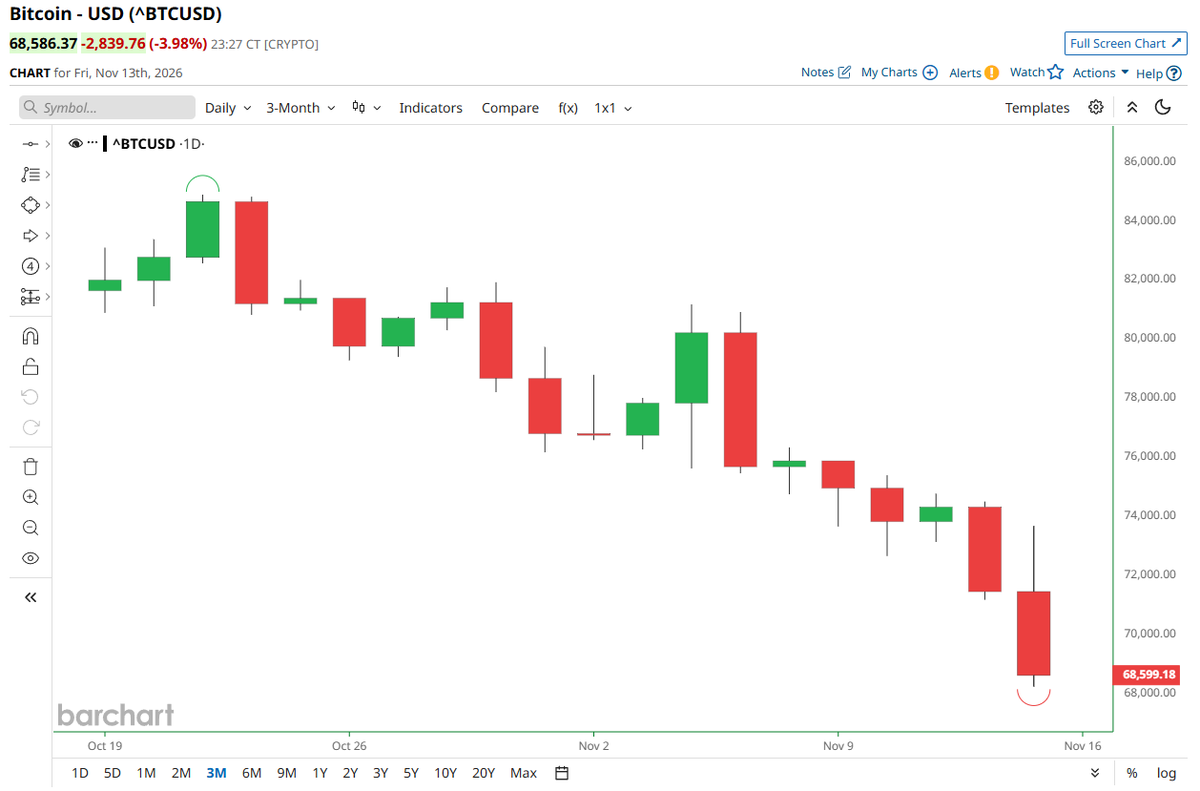
BREAKING 🚨: Bitcoin $BTC Bitcoin has now slipped more than 20% from its September peak—bear-market territory. But to see what the market is *actually* reacting to, check the cross-asset move around the drop: Event → Data change → What the market is pricing Bitcoin >20% off September high → Compare BTC with DXY, 10Y U.S. yields, gold, and U.S. equities before/after the move → Risk-off vs. rates/FX-driven tightening vs. growth scare (don’t call it on BTC alone).
Event: FAA issues a nationwide ground stop → Data check (pre/post headline): BTC / DXY / 10Y UST yields / Gold / US equities need to be compared around the timestamp to see who actually moved and whether the move was risk-off (stocks down, yields down, DXY+gold up) or just noise → What the market is pricing: only call it “aviation disruption / risk-off” if you see a *cross-asset* reaction; if BTC is flat, DXY and 10Y don’t budge, gold doesn’t catch a bid, and equities shrug it off, then the market is effectively pricing “temporary operational issue, limited macro impact,” not a broader shock.

结合事件前后的市场数据,把 BTC、DXY、10Y 美债收益率、黄金和美股的联动变化放在一起对比,判断市场到底在交易哪条消息,并整理成“事件 → 数据变化 → 市场在定价什么”的简洁结论。不要只盯着单一资产的涨跌就下判断。
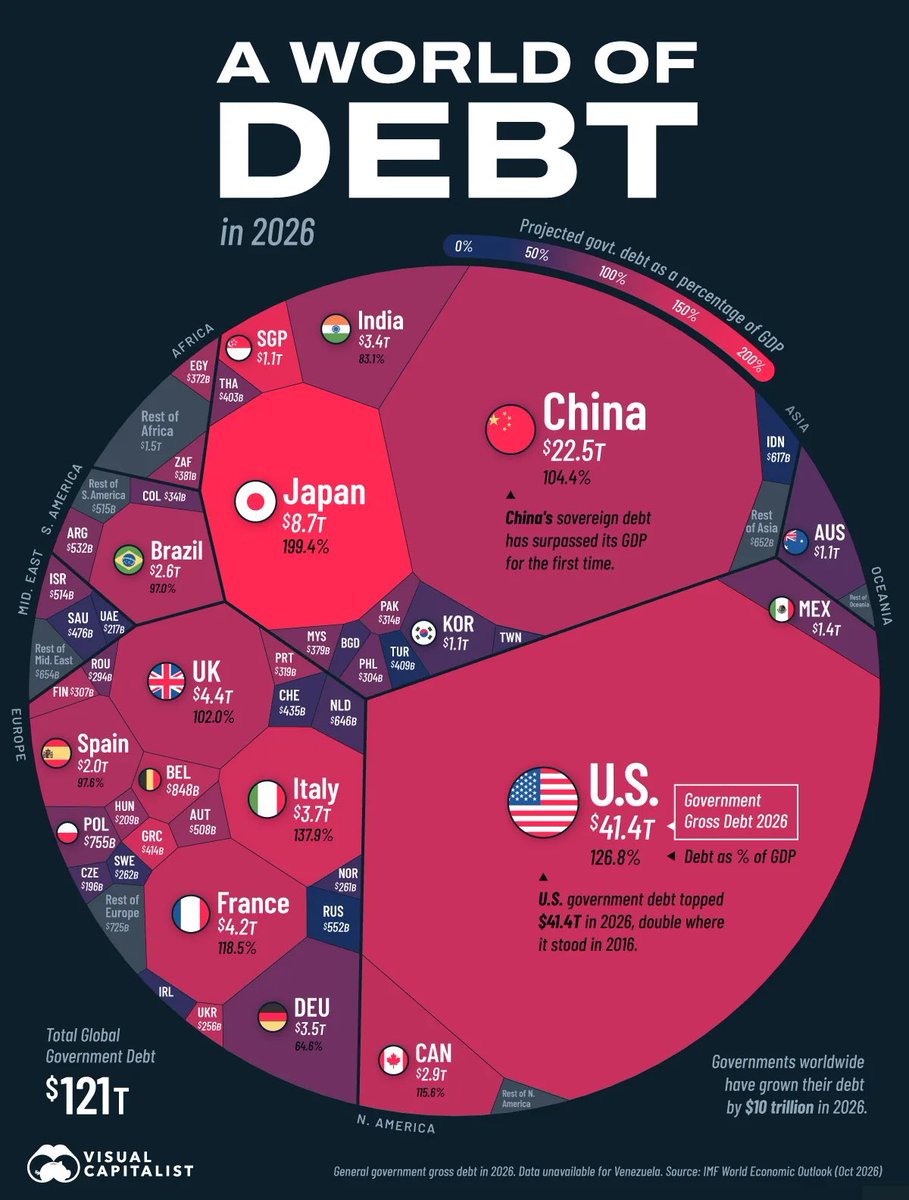
🚨🚨 Global debt has hit $121T. Use pre- and post-event market data to cross-check moves in BTC, DXY, the 10Y Treasury yield, gold, and U.S. equities. Identify what headline the market is actually trading, then summarize it in a clean format: “Event → Data moves → What the market is pricing.” Don’t draw conclusions from a single asset’s up/down move.
Use pre- and post-event market data to compare moves in BTC, DXY, the 10Y Treasury yield, gold, and U.S. equities. From the cross-asset reaction, infer what headline the market is actually trading, then summarize it in a clean format: “Event → Data changes → What the market is pricing.” Don’t lean on a single asset’s direction to draw conclusions.
After Nvidia’s ($NVDA) latest sell-off, are you stepping in—or waiting for the tape to confirm what the market is actually pricing?
结合事件前后的市场数据,把 BTC、DXY、10Y 美债收益率、黄金和美股放在一起对照,看看各自怎么动。由此判断市场真正消化、交易的到底是哪条信息,并把结论压缩成“事件 → 数据变化 → 市场在定价什么”的清单式表达。结论不要只盯着单一资产的涨跌来拍板。 H/T: @dailychartbook 注:输出语言需与原文一致,不做翻译。
Using pre- and post-event market data, compare moves in BTC, DXY, the 10Y Treasury yield, gold, and U.S. equities to see what actually got priced in—then summarize it as: “Event → Data changes → What the market is pricing.” Don’t call it off a single asset’s move.
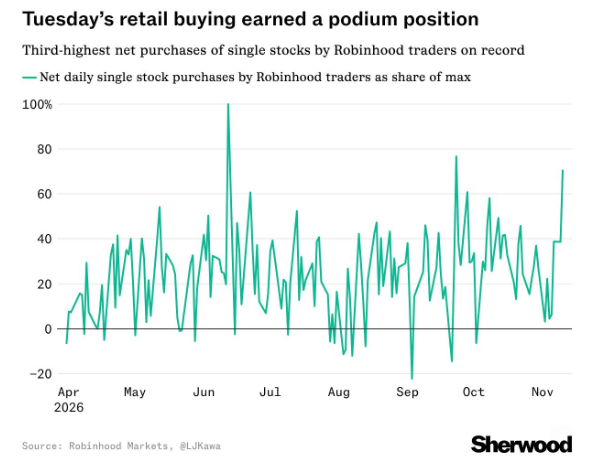
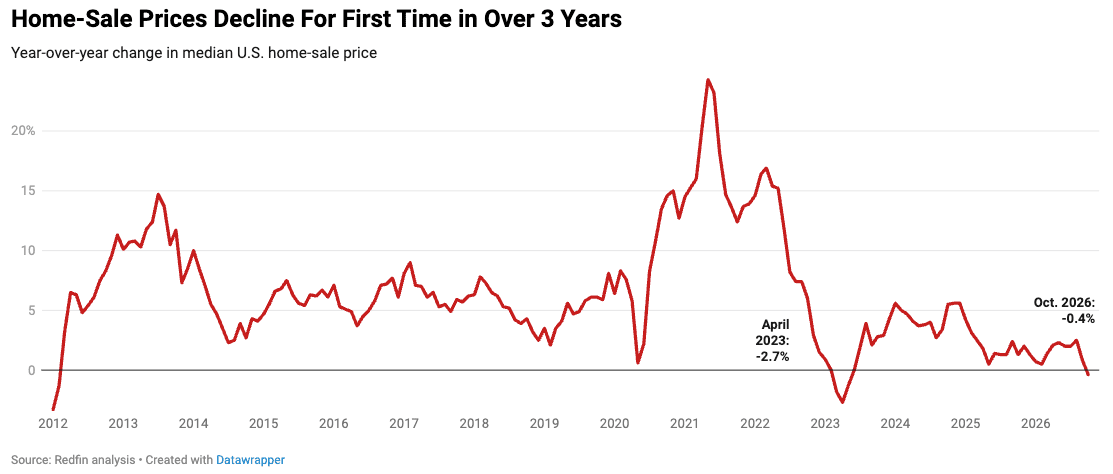
U.S. home sale prices just fell for the first time in over 3 years—now check what BTC, DXY, the 10Y yield, gold, and stocks did before and after to see what the market is *actually* pricing. Summarize it as: “Event → Data moves → What’s being priced,” and don’t lean on a single asset’s move.