Crypto_shark
$GOLD BELIEVER $SOL MAN BETTER DAYS AHEAD
PEPE (PEPEUSDT
$PEPEUSDT One high-profile wallet now sits on nearly 3% of supply. But a hacker just dumped billions of tokens, and the only real institutional path is still just a filing. A coin that is concentrated is not a coin that has new demand. Pepe is showing why that difference matters. What’s new? The concentration. Wallets linked to Justin Sun hold roughly 2.82–3% of PEPE’s supply — about $51 million — making him the largest individual holder outside the exchanges. Most of that position was built in a short window through large Poloniex withdrawals. The selling. A Binance-related hacker dumped around 7.77 trillion PEPE (roughly $32 million) in late October. Price dipped but recovered relatively quickly, helped by some opportunistic buying on the way down. The possible buyer. Canary Capital’s spot PEPE ETF filing remains pending (amended in October, with a decision window stretching toward early December). Until it is approved and live, there is no regulated institutional demand vehicle. My view: the free-float story of Pepe is tighter than the raw 420.69 trillion supply number suggests. But there is a catch for PEPE holders. Whale accumulation and exchange outflows are not the same thing as broad new money. Tokens sitting in a few large wallets (or on exchanges) can leave just as quickly as they arrived. Real sustained demand still has to come from somewhere else — retail rotation inside the meme sector, or the still-unproven ETF path. What does the market show? PEPE has been trading around $0.0000048–$0.000005 this week, with recent support near the mid-to-low $0.000004s and resistance overhead near recent highs. It has shown relative strength versus weaker meme peers at times, even while the broader market has been mixed. Volume remains elevated, but the move is still heavily influenced by large-wallet flows and narrative. The number that stands out is still that ~3%. One individual now controls a meaningful slice of the token, and the largest potential new source of demand (an ETF) is not yet real. Where I land: Pepe’s community and meme status are intact, and the circulating supply is fully unlocked with some tokens already burned. But concentration only helps the price when the concentrated holders are net buyers or at least not sellers — and when new capital is actually arriving. I would watch two things closely: any further moves from the Sun-linked wallets (especially exchange deposits), and progress (or silence) on the Canary PEPE ETF. If large holders keep accumulating or stay quiet while ETF hopes build, the tight-float story can work. If the big wallet starts distributing while the ETF remains stuck in regulatory limbo, the buy side thins out quickly. And here is the question: if the most visible large holder of PEPE is one person, what happens to demand and sentiment the day that wallet decides to sell?#ByXIMPACT #USPayrollsAndRateDecisionsDriveMacroWeek #BitcoinSlidesBelow$80K #BlockchainSecurity #WSOTPicktoEarn10U $SOLUSDT

XUA HAS A NEW MACRO TAILWIN
Oil just took a sharp dump on renewed US-Iran diplomacy hopes, and that could ease one of the biggest near-term headwinds for gold-related pairs like $XAUTUSDT . Lower energy prices help cool inflation fears, which reduces the odds the Fed stays aggressively tight or adds another hike. That takes some pressure off Treasury yields. And when yields ease, non-yielding assets like gold become relatively more attractive again. XUATUSDT has already shown sensitivity to this setup — the recent bounce tracks the oil drop and the temporary relief in real-yield pressure. The interesting part? Gold is still trading well below its early-2026 highs and remains vulnerable if oil stabilizes or yields re-accelerate. The market has been prioritizing higher yields and tighter liquidity over the classic inflation-hedge bid for months. For $XUATUSDT, I’m watching the next reaction closely. If oil stays soft, yields stabilize/decline, and $XUATUSDT holds above key support with volume, the macro setup improves. But if oil rebounds or yields push higher again and $XUATUSDT loses structure, the downside risk can return quickly. My take: this is not a “blind long” signal. It is a reminder to respect the macro conditions driving gold right now instead of just chasing the bounce. What are you watching more closely right now – $XUATUSDT structure or US Treasury yields / oil? #PiecesOf8 #WSOTPicktoEarn10U #BitcoinSlidesBelow$80K #BlockchainSecurity $BTCUSDT #ByXIMPACT#ByXIMPACT
AAVE: THE SAME $141 LEVEL,
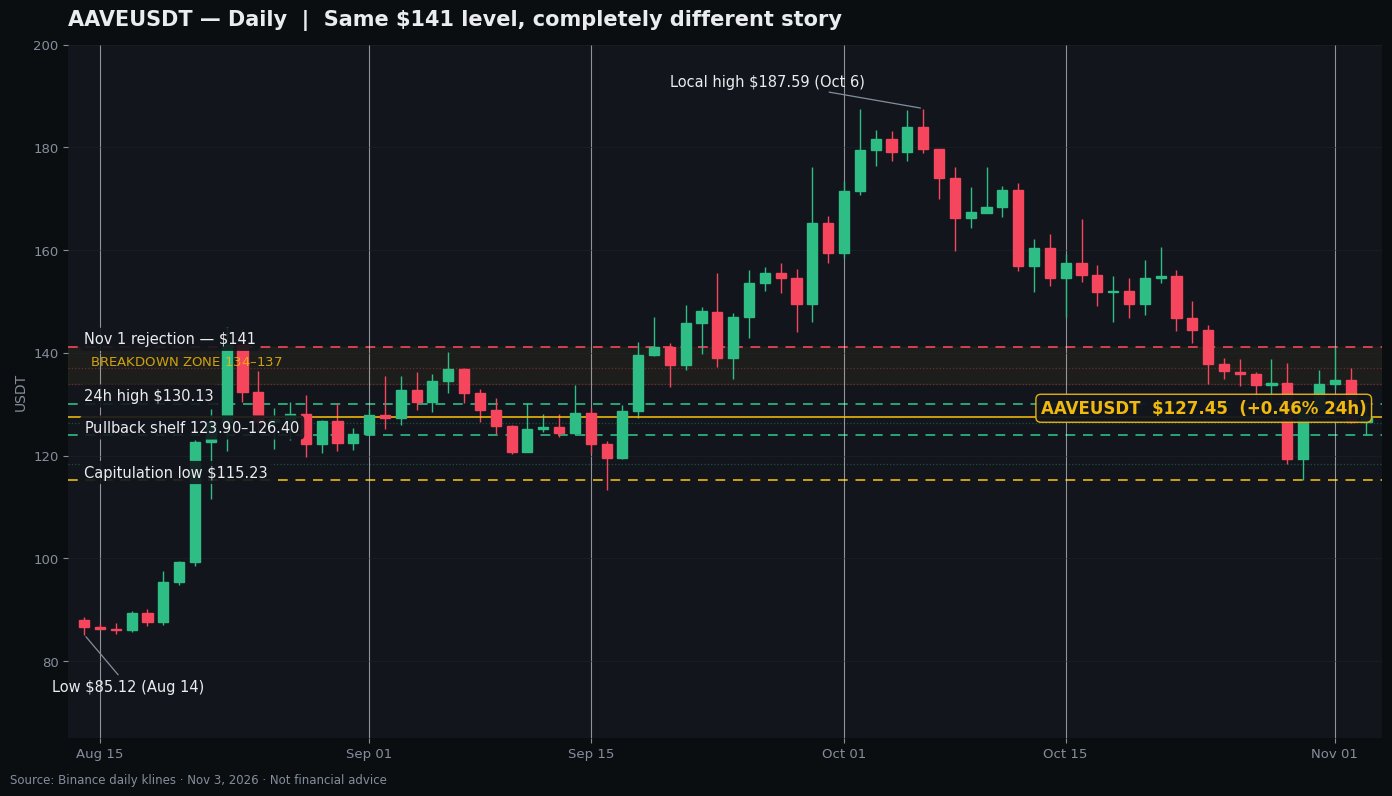
BUTY 🏛️ A COMPLETELY DIFFERENT STOR $AAVEUSDT is trading around 127.4** right now, roughly flat on the day (+0.5%), sitting ~32% below its October 6 local high of **187.59 — and this is where it gets interesting. Back in late September, **141 was the breakout level**. Price spent days knocking on it (Sept 20 high:141.86), finally pushed through on Sept 21, and ran all the way to 187. Fast forward to November 1: AAVE bounced +22.5% off the115.23 capitulation low… and got rejected at almost exactly the same $141 zone. Same level. Completely different story. In September it was the ceiling that launched the rally. Now it's the ceiling capping the recovery. The story so far: ~85 mid-August low → parabolic run to187.59 → a full month of bleed → Oct 29–30 capitulation into **115.23** → sharp V-bounce → rejection at141.17 → cooling off into today's $123.90–130.13 range. Yes, the fundamentals are still there — V4 is live, Horizon just integrated Chainlink's 24/7 institutional feeds, Aave still dominates DeFi lending by deposits. But there are cracks too: the tBTC reserve got frozen on Nov 1 after a bridge issue, GHO's borrow rate was hiked to 4.5%, and the early-October loop-module exploit dented confidence. Price is telling me the market is weighing all of that right now — so I'm trading the levels, not the narrative. 📌 What I'm Watching Now 123.90 (today's low) /126.40 (Nov 2 low) — the pullback is shallow so far. Holding above this shelf keeps the rebound structure intact. Reclaim 130 →134–137 — that's the Oct 22–24 breakdown zone. A daily close back inside it flips short-term momentum. Above 141.17** — the level that matters. Reclaim it and the path reopens toward **144, then the Sept consolidation at $153–156. ⚠️ Risk Management Rejection somewhere between 134 and141 = the bounce is probably just a dead-cat. I'd lighten up and wait. Lose 123.90** and I expect a retest of **118.43 / 115.23**. Those capitulation lows MUST hold — a break below opens the door to the **108–110 region (200-day SMA area). Fear & Greed is sitting in Fear (~26–30). That cuts both ways: panic lows can be great entries, but falling knives don't send warnings. My stance: **cautiously bullish, but only above 115.** The sellers had their chance to push this through the floor twice and failed. Still, a rejected reclaim at141 is not a dip — it's a ceiling. I'm waiting for price to tell me which one it is. I've learned that buying a strong story at the wrong price can still become a bad trade. 85 AAVE in August was a gift.187 was the toll. $127 is just a question mark — and I don't pay for question marks. ⏳#ByXIMPACT #BitcoinSlidesBelow$80K #BlockchainSecurity #Oracle20BFundingPlanTestsTheAITrade #WSOTPicktoEarn10U $BTCUSDT
GRAMUSDT
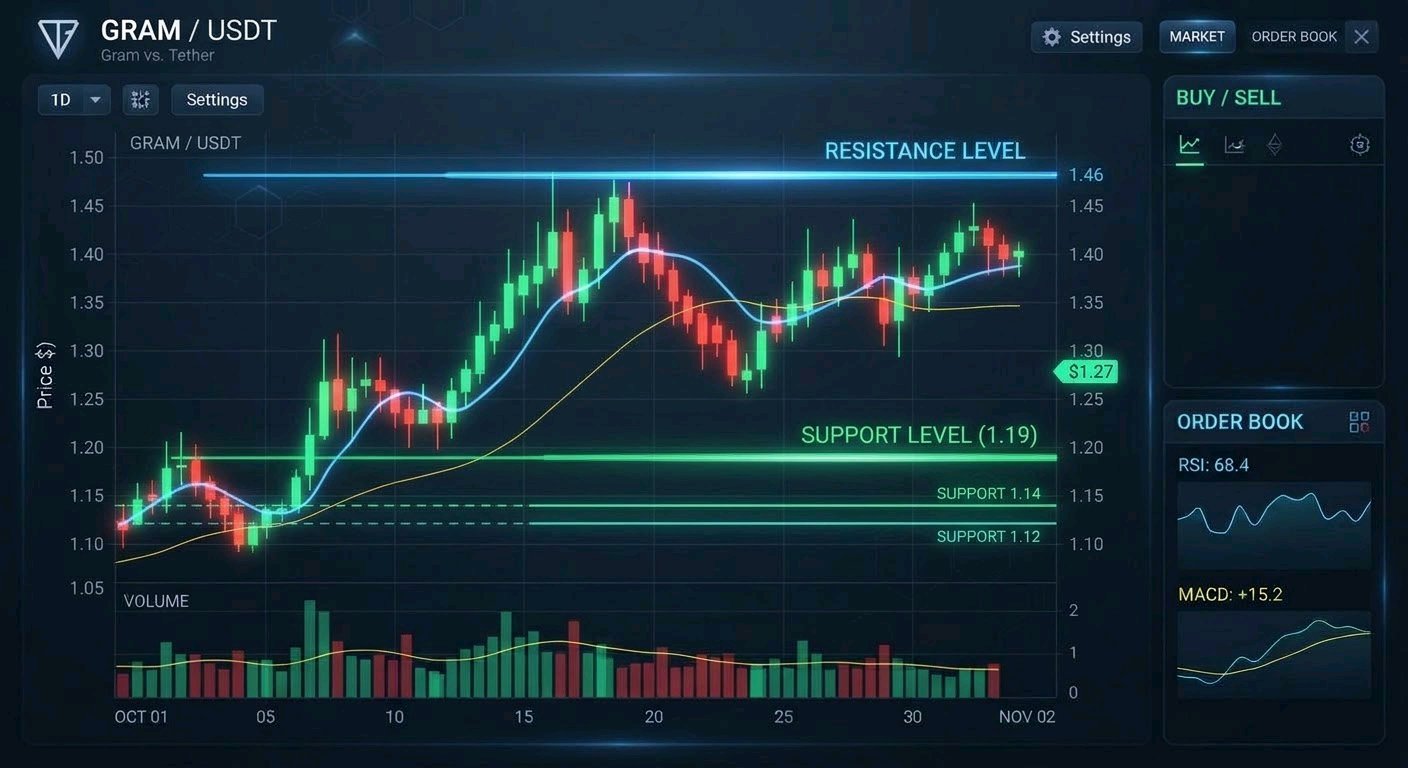
What I'm Watching Now $GRAMUSDT is down roughly 3% on the day, and the daily chart still shows lower highs after the rejection near 1.46 in mid-October. I want to see a strong 4H close back above1.19, followed by a successful retest. That would be an early sign that buyers are regaining control. If that happens, I'm watching 1.24–1.25 first, followed by 1.31–1.36. A recovery toward $1.45 becomes realistic only after these resistance levels are cleared. The Telegram ecosystem story — massive user reach, near-zero fees, fast finality — gives GRAM an interesting long-term narrative. I like that potential, but I want price action to support the bullish story before I act on it. Risk Management A failed reclaim of 1.19 could send GRAM back toward1.14. If that zone gives way, the October 30 low near 1.12 becomes important again, and below that the deeper1.10 area comes into play. I'm not treating my previous DCA reference as a confirmed entry, and an exact R:R requires a defined entry and stop. My view is cautiously bullish, but I'm waiting for confirmation before adding fresh spot exposure. I've learned that buying a strong story at the wrong price can still become a bad trade. Right now, $1.19 matters more to me than another prediction about the old highs. #WSOT2026 #MidtermsMarketWatch #USPayrollsAndRateDecisionsDriveMacroWeek #TelegramEcosystemWatch #GRAM#ByXIMPACT #BitcoinSlidesBelow$80K #BlockchainSecurity #PiecesOf8 #Oracle20BFundingPlanTestsTheAITrade $ETHUSDT
bitcoin new adventure
$BTCUSDT #BitcoinSlidesBelow$80K #BlockchainSecurity #WSOTPicktoEarn10U #PiecesOf8 $SOLUSDT has just pushed into a critical support zone, but the chart is showing a detail I would not ignore: price is defending a double-bottom formation while the 1H MACD histogram quietly expands green below the zero line That creates a very different setup from a clean breakdown backed by expanding selling pressure look 1H chart, BTC is trading around 77,377, down 0.74%, with a visible 24H high of 78,112 and low of 76,388 structure has taken a heavy hit from the recent peak at 81,971. Price moved from those highs into a sequence of lower highs and lower lows, but it is now trying to find a floor right on top of the daily 200 EMA region, while the 1H EMA200 sits overhead at 78,666 MACD is showing early signs of a shift, with DIF at -74.3, DEA at -178.8, and a positive histogram near 104.5. Momentum is therefore starting to curl upward even while both lines remain below zero, but the broader macro trend on this timeframe remains heavy So technically, the short-term downtrend is still in control, but the bears are losing their immediate grip But participation tells a more complicated story latest candles show a massive spike in volume during the initial flush down to 76,388, with a single 1H candle printing over 1,322 BTC in volume, but the subsequent bounce is happening on notably lower volume, with the recovery leg averaging closer to 590 in other words, BTC has already produced the breakdown, but the immediate recovery isn't backed by aggressive buying. The Fibonacci retracement of the 81,971 to 76,326 move shows price still fighting below the 0.236 level at 77,658, just above the absolute local bottom That is the first contradiction I see: the price chart looks like it wants to bounce off this support, but the immediate participation data suggests buyers are hesitant to catch the falling knife The fundamental side makes BTC particularly interesting because this isn't just another generic altcoin Bitcoin is the institutional gateway asset of this cycle, wrapped in spot ETFs, sitting at roughly 59% market dominance, with a fixed supply that just keeps getting absorbed by corporate treasuries and funds. It has built a reputation as the asset that institutions buy when they want crypto exposure without touching an exchange That matters because the underlying demand is connected to real allocation flows rather than relying purely on retail speculation 😬 BTC captures value from being the default collateral and reserve asset of the entire digital asset market, making it the liquidity backbone in a highly competitive sector. There has also been a meaningful structural shift in how traditional finance views Bitcoin, with ETF wrappers becoming the dominant accumulation vehicle. But there is another layer that traders need to watch closely: flow dynamics 😉 US spot Bitcoin ETFs just recorded about 643 million of outflows on October 30 and another398.6 million on November 2, with many ETF holders now sitting underwater below their average cost basis. That creates the second contradiction: Bitcoin's institutional absorption story is structurally intact, while the token is still navigating heavy macro pressure from a hawkish Fed, the aftermath of the late-October Binance security incident, and election-day caution For me, that makes the 77,658 level extremely important If price can reclaim and hold 77,658 (the 0.236 Fibonacci level) with a clear expansion in 1H volume, the current move would have stronger confirmation. In that scenario, I would watch approximately 78,482 first and then the 79,148 region My preferred pullback area is around 76,540 to 77,000, aligning with the base of the bounce, provided the structure remains intact. A loss of roughly 76,326 would weaken the current double-bottom formation, while a deeper move under 74,790 would put the recent structure under much more pressure So my setup is conditional rather than blindly bullish: Bounce trigger: 77,658 with expanding volume Pullback zone: 76,540 to 77,000 Invalidation: below 76,326 TP1: 78,482 TP2: 79,148 TP3: 80,763 The bigger question for BTC isn't whether the institutional thesis has real substance; the ETF wrapper and dominance give that thesis measurable substance the harder question is whether spot demand can return quickly enough to absorb the macro-driven selling flowing through ETFs and leveraged positions Right now, the chart says a relief bounce is brewing at the support levels the next move needs to show real participation, otherwise the heavy short-term downtrend will force another retest of the local lows #IMPACTbyTrade $BTCUSDT#ByXIMPACT

TRUMPUSDT update
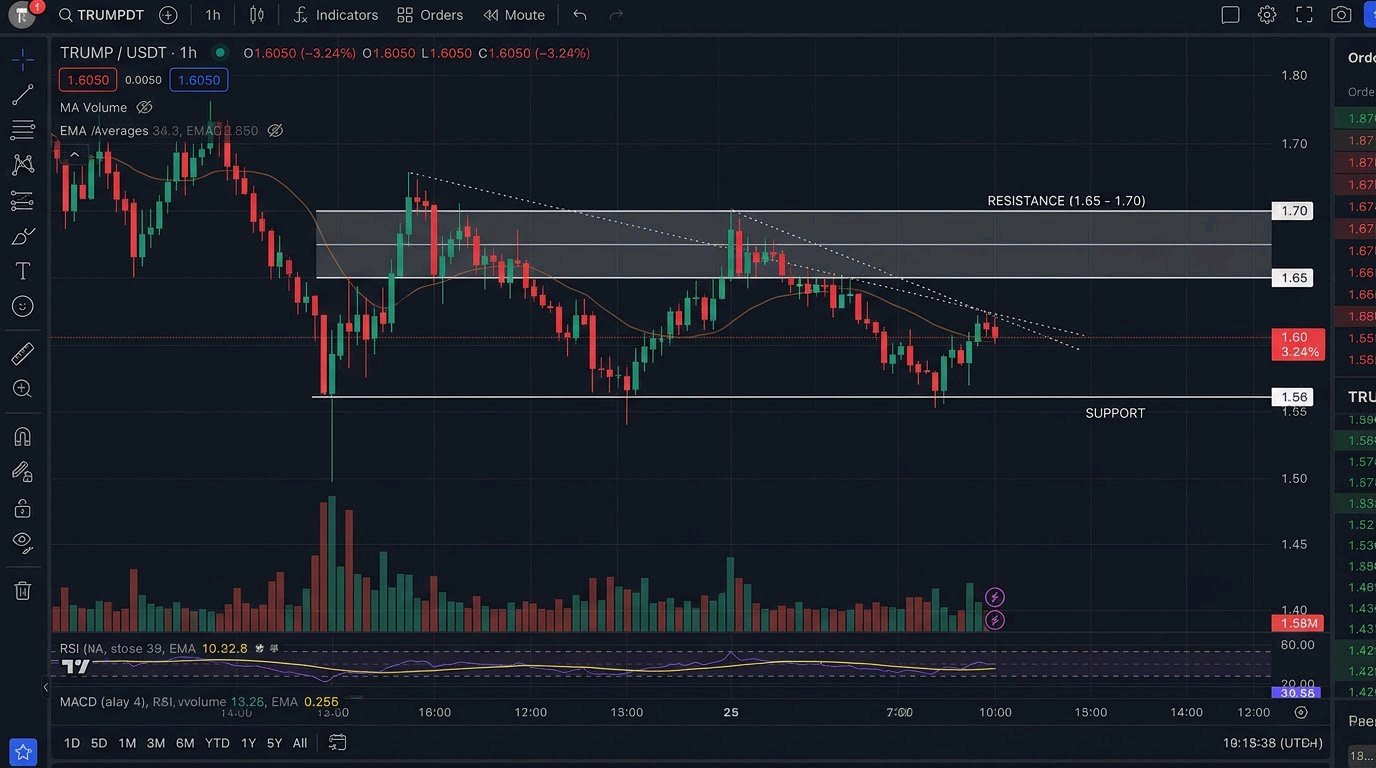
$TRUMPUSDT Price is sitting around 1.60 after another soft session. Here’s the clean version. Then (recent sessions) It was bouncing in the 1.62–1.70 area. A clean hold above 1.65 would have opened the door higher. That didn’t stick. Now (Nov 3) Price has slipped under 1.62, tagged the 1.56 zone, and is trying to stabilize near 1.59–1.61. The short-term structure remains soft. What the chart shows ➤ Sellers still control the higher timeframes — lower highs and price trading below key moving averages ➤ The 1.55–1.56 area is the nearest meaningful support (recent lows + psychological level) ➤ Overhead supply is stacked at 1.65–1.67, then 1.70–1.72 Levels I’m watching ▸ Support: 1.55–1.56 ▸ Invalidation: 1h close below 1.53 ▸ Resistance: 1.65–1.67, then 1.70–1.72 ▸ Next upside: 1.80+ only after a clear reclaim of 1.70 Plan Entry: near 1.55–1.57 on a retest of support with confirmation, or after a 1h close back above 1.66 Stop-loss: 1.52 Targets: 1.67, 1.72, 1.80 From ~1.56 the risk is roughly 2.5% with upside of ~7%, 10%, and 15% to the targets. That’s about 2.8 to 1, 4 to 1, and 6 to 1. Chasing it here at 1.60 with the same stop is thinner R:R, so I’d rather wait for either the support test or a stronger reclaim. My read This is still a corrective/bearish structure until buyers prove otherwise with a decisive close above 1.66–1.70. One bounce off 1.56 doesn’t change the bigger picture. A clean break under 1.53 opens the door toward 1.50 and lower. Keep position size small and leverage low. TRUMP can move fast in both directions. Not financial advice. Do your own research and only risk what you can afford to lose.#ByXIMPACT #USPayrollsAndRateDecisionsDriveMacroWeek #BitcoinSlidesBelow$80K #BlockchainSecurity #NewFinancialPlatform $BTCUSDT
Technical Indicators Breakdown
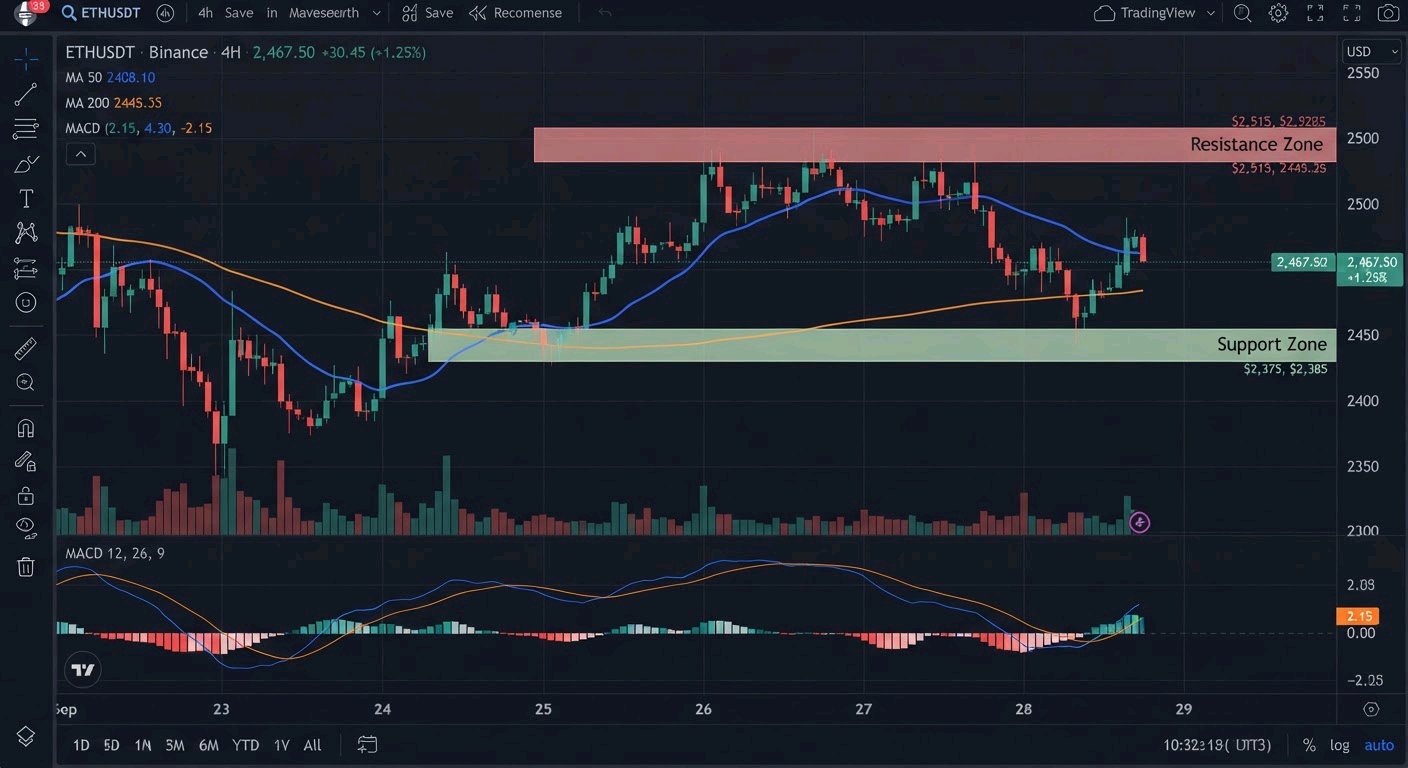
$ETHUSDT MA / EMA (Moving Averages): The short-term moving averages (MA5 & MA10) have formed a bearish crossover above current price levels, indicating immediate overhead resistance. Volume: Trading volume shows mild selling pressure following a recent retest of resistance levels. MACD & KDJ: The MACD histogram is trending downward near the zero line, while KDJ indicators signal short-term consolidation before the next directional break. Support & Resistance: 🔴 Key Resistance: $2,520 – $2,580 🟢 Key Support: $2,380 – $2,320 💡 Trading Strategy & Key Scenarios Bullish Scenario: A clean breakout above $2,520 on high volume could open the path toward $2,650. Bearish Scenario: If price breaks below $2,380, expect potential retests around the lower support zone at $2,320. 💬 What's your take on ETHUSDT? Are you buying the dip or holding out for lower levels? Share your thoughts in the comments below#ByXIMPACT #WSOTPicktoEarn10U #IMPACTbyTrade #BybitStocks #MidtermsMarketWatch $BTCUSDT

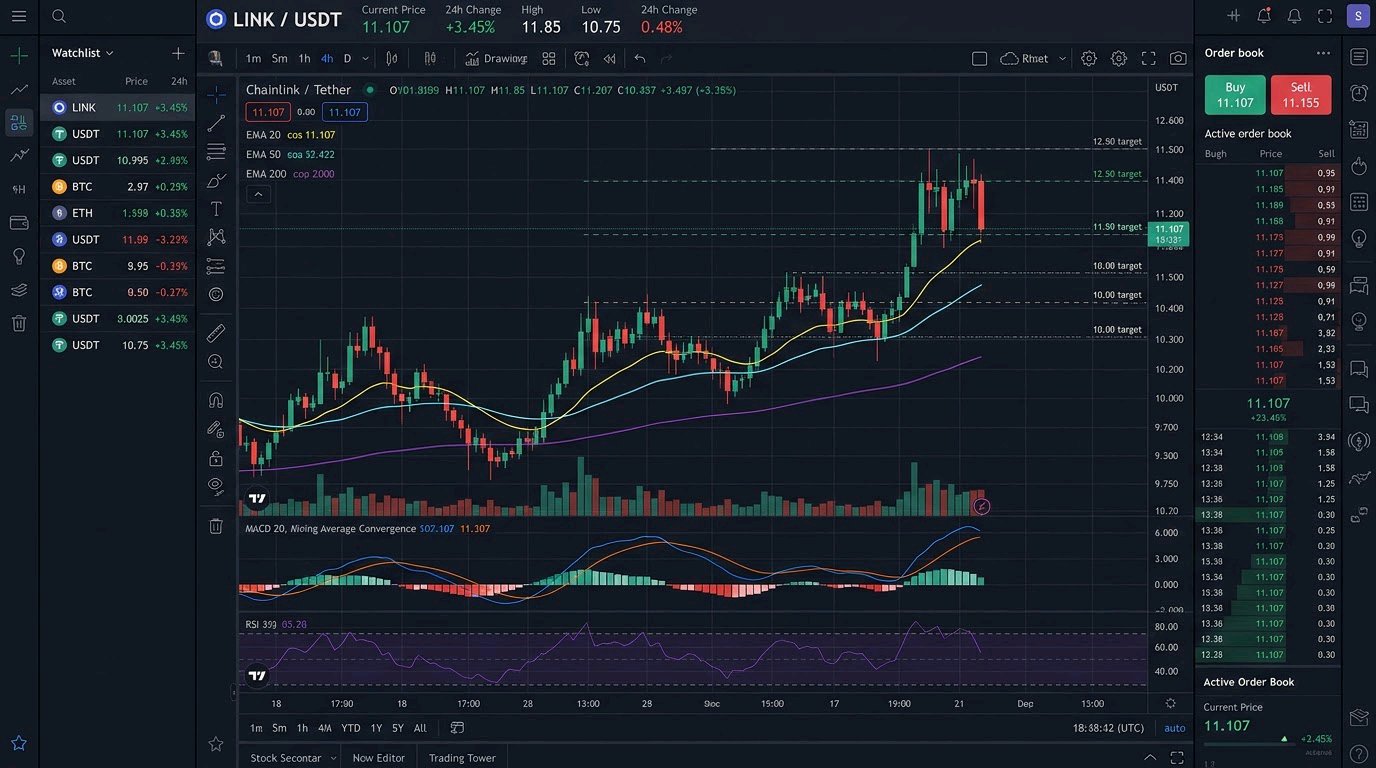
Chainlink : Infrastructure Growth vs. Token Demand
$LINKUSDT is hovering near $11.10, but the bigger question is whether Chainlink's expanding institutional infrastructure can generate enough real token demand to reverse the decline from September's highs. It has moved well beyond its oracle identity, launching 24/7 asset pricing and CCIP Vault Adapters spanning 80+ chains. However, the token still trades deep below its 50-day average, leaving a clear gap between ecosystem growth and market performance. LINK recently traded near 11.14, with a market capitalization around8.33B and 24-hour trading volume near 292M. Its latest 24-hour range is roughly11.00–11.42, while the seven-day range stands at10.53–11.91. The11.00 area is immediate support, while 11.65–11.91 is the first recovery resistance. A sustained reclaim of $12.60, near the 50-day average, would provide stronger evidence that buyers are returning. The broader structure remains weak after a 21% decline over 30 days. The fundamental development worth watching is Chainlink's institutional expansion. Its 24/7 Data Feeds went live on November 2 with Aave's Horizon platform, pricing tokenized U.S. equity collateral on weekends and holidays. CCIP volume reportedly reached $4.9B in Q2, up 353% year over year, and DTCC's collateral AppChain targets production in Q4 2026. These developments demonstrate real traction, but integrations and announced frameworks do not automatically translate into recurring LINK purchases. Token utility and supply deserve equal attention. LINK pays node operators and secures oracle networks through staking, but it does not represent equity in Chainlink Labs, and the share of service revenue converted into token demand is not transparently reported. Approximately 748M LINK circulate against a 1B maximum, leaving roughly 252M tokens outside the float. I would focus on actual spot participation and staking growth rather than assuming partnership announcements alone can create a sustained recovery. Key figures 11.14 — Current price area11.65–11.91 — Immediate resistance11.00 — Immediate support 10.53 — Seven-day low11.91 — Seven-day high 8.33B — Market capitalization292M — 24H trading volume 748.1M — Circulating supply 1B — Maximum supply Bullish confirmation: Reclaim 11.91 and hold above it with stronger spot volume. That would put12.60 and 13.35 in focus, with further recovery possible toward14.10. Bearish confirmation: Lose 11.00 and fail to recover it. That would expose10.53, followed by the $10.00 area if selling accelerates. Chainlink has expanded its infrastructure at an impressive pace, but the market still needs evidence that these developments create recurring LINK demand. The decisive signal is whether institutional deployments move from pilots to production and whether buyers can establish acceptance above 11.91#ByXIMPACT #BybitStocks #AnthropicS1Filing #MidtermsMarketWatch #IMPACTbyTrade $SOLUSDT

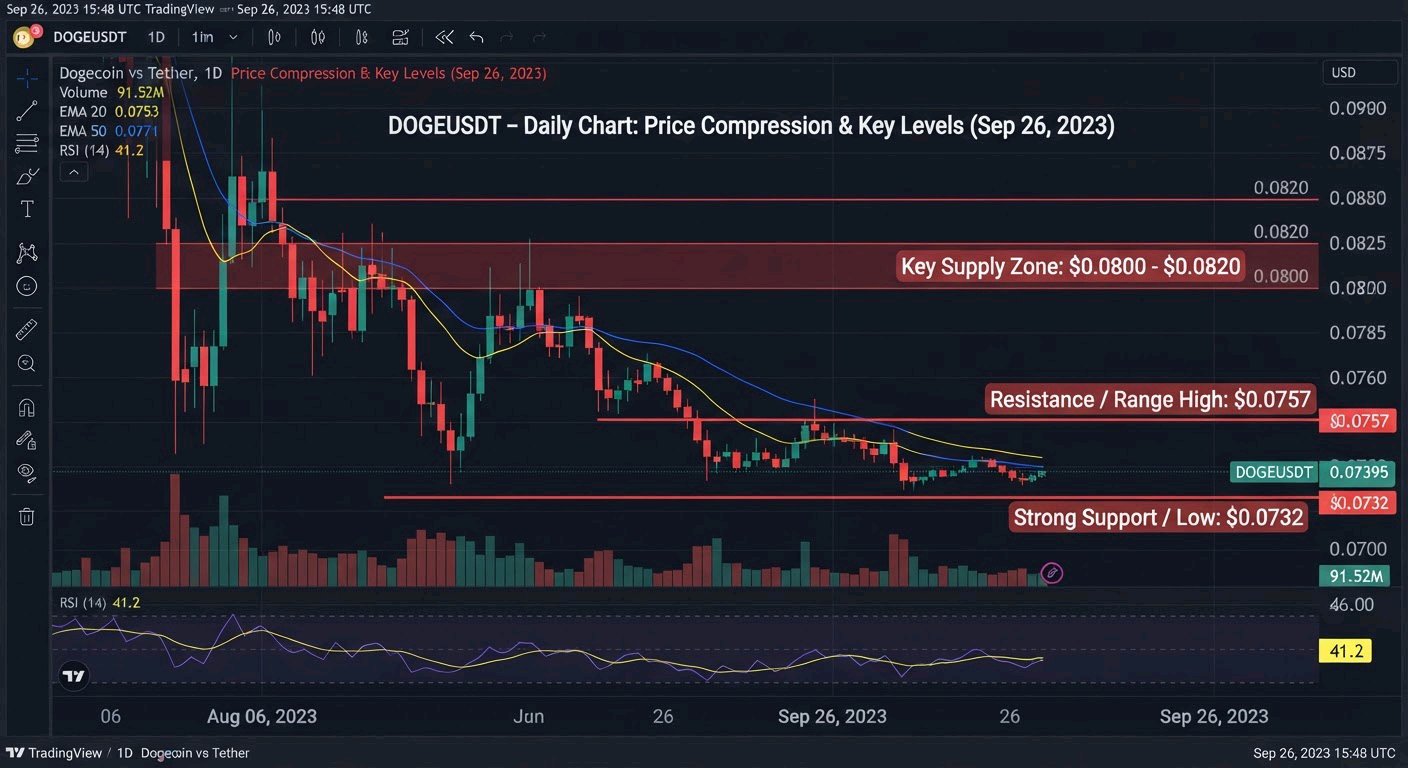
DOGEUSDT current behaviour
$DOGEUSDT is interesting because the market appears to be moving from sustained selling pressure into a much quieter phase. But a slowdown in selling doesn’t automatically mean buyers are back. Looking at the daily chart, DOGE has experienced a prolonged decline with a clear sequence of lower highs, showing sellers have maintained control over the broader structure. Now, price is hovering around $0.0739, with recent candles showing considerably less directional movement. This creates an interesting situation: the market is consolidating near recent lows, but the broader recovery still needs confirmation. I’m paying attention to three areas: $0.0732: The current 24-hour low. Losing this area could expose DOGE to another test of lower prices. $0.0757: The 24-hour high. Reclaiming this level would be an early indication of improving short-term demand. $0.0800–0.0820: A broader chart reference that could become relevant if buyers manage to establish stronger upward momentum. What matters now is whether DOGE can turn its current consolidation into a meaningful recovery or whether this pause eventually gives way to another downward move. I’m not looking for a prediction here. I’m watching for evidence that the market structure is actually changing. Price compression after a prolonged decline is worth watching, but confirmation will matter more than anticipation. $DOGEUSDT #ByXIMPACT#ByXIMPACT #IMPACTbyTrade #BybitStocks #MidtermsMarketWatch #NewFinancialPlatform $MNTUSDT
ANALYZING XAU USDT
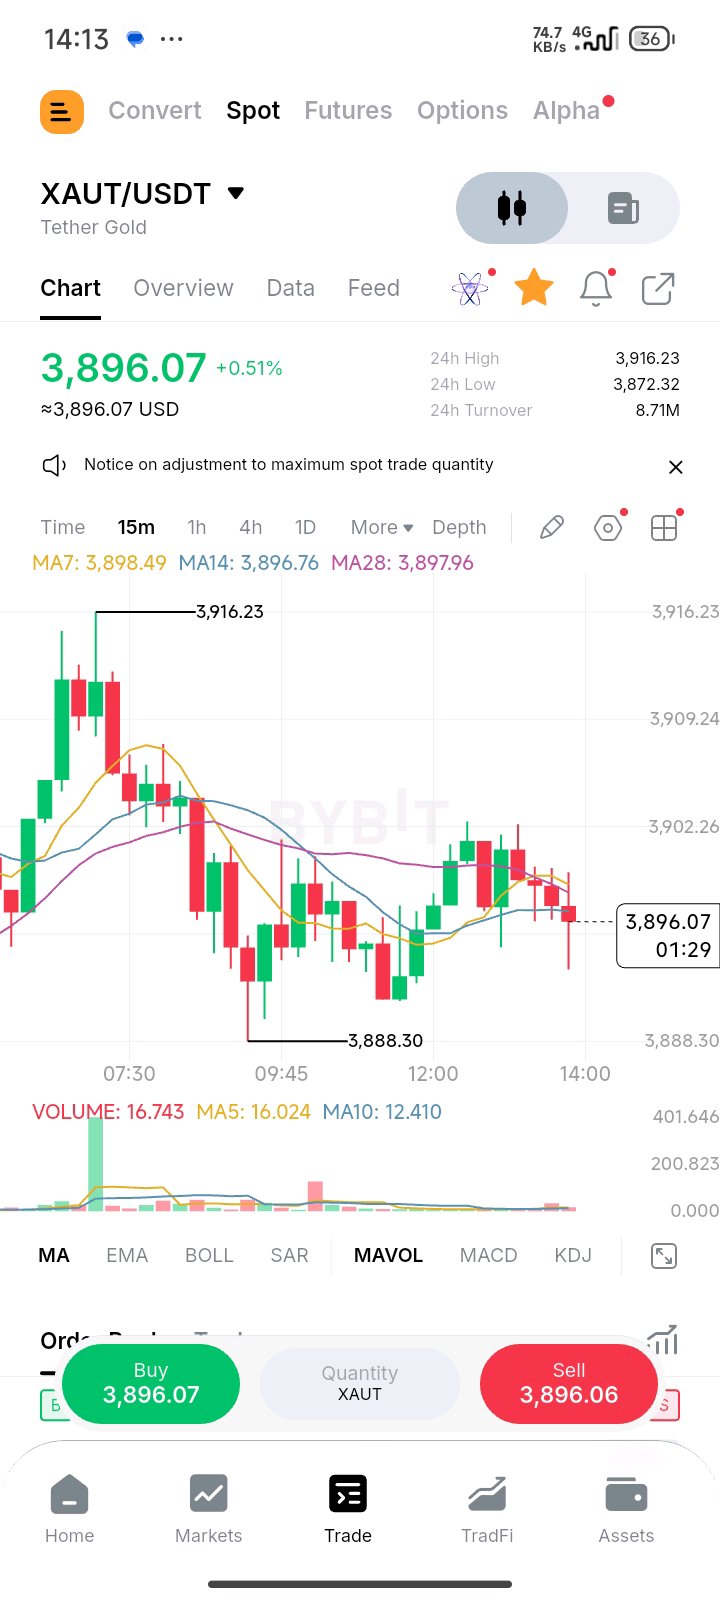
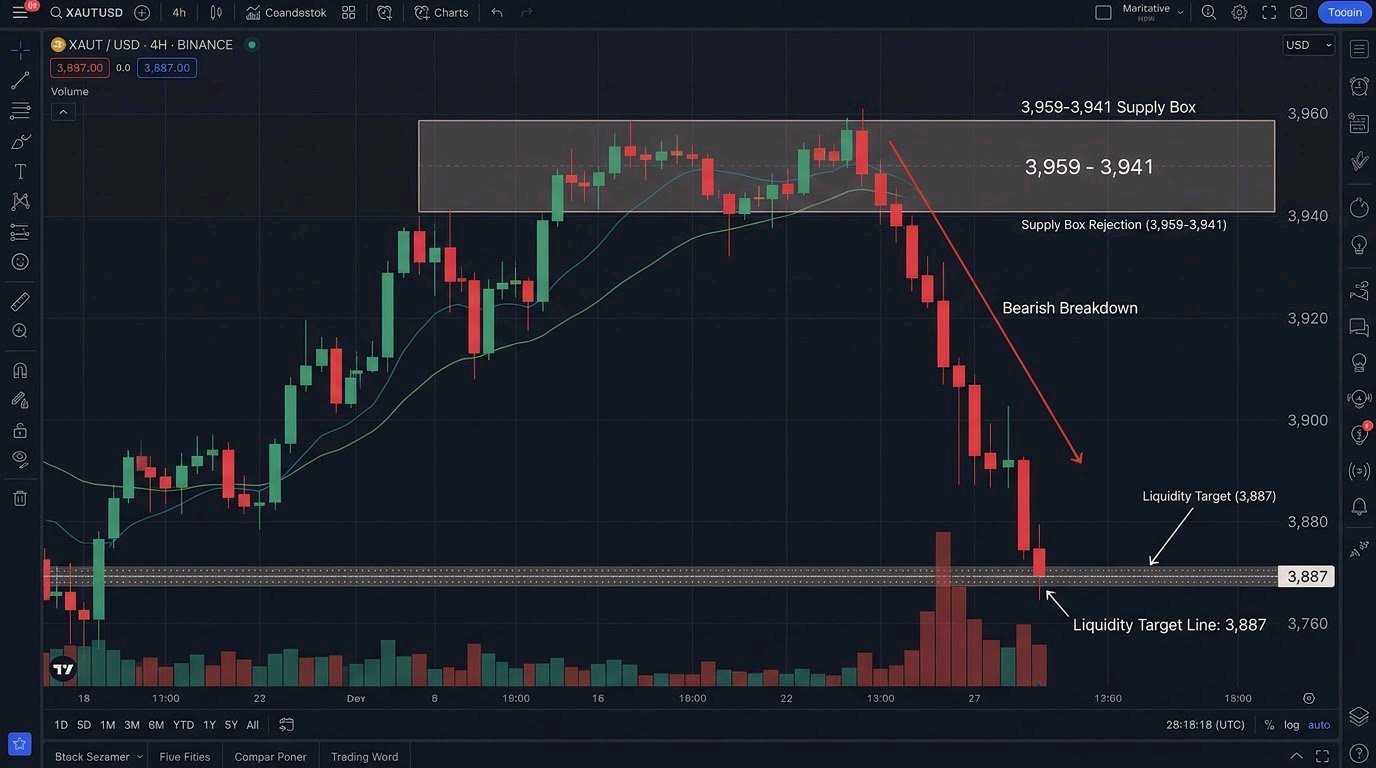
$XAUTUSDT Melt-Down Played Out Exactly As Mapped — 3,959–3,941 supply box I marked yesterday finally cracked and 3,887 liquidity tap hit same session, textbook breakdown trading while gold spot slid from4,000 and BTC dumped 78k to76.5k, with 10x leverage a "boring" 1% gold move becomes double-digit ROI — gold is the lowest-beta asset in crypto until it isn't, and when $4,000 cracks the vol regime expands fast, plan executed to the tick. KEY POINTS Explanation 3,959–3,941 Box Break Confirmed = 3,887 TP Hit: Current3,896.61 +0.04% 24h after flush, 3,946.16 +1.37% intraday,3,907.95 +0.45%, 24h high 3,958.71 /3,944.94, 24h low 3,887.34 /3,896.61 cluster, range 3,887.34–3,958.71 = 71.37 range. Marked3,959–3,941 decision box — break below3,941 triggered. TP 3,887 =3,887.34 wick low = 34c off perfect liquidity hit. 3,958.71 high to3,887.34 low = -1.81% move, tiny for crypto but with 10x = 18.1% ROI on a low-vol safe-haven asset, that is the whole edge of trading XAUT with leverage. 10x ROI Math On Small Target: Entry 3,958.71 box top, exit3,887.34 = $71.37 move = -1.80% price change 10x leverage = -18.0% leveraged move = +18.0% ROI on short, minus fees 0.05% = clean +17.9%. Volume 233.69M 24h across 497 markets, Binance XAUT/USDT pair alone19.46M, mcap 2.92B with 749.42k XAUT circulating, FDV3.22B. 3,887 TP sits right at the 24h low cluster before3,866 spot liquidity = smart TP front-running the order book instead of being greedy into the wick. Why 3,959–3,941 Area Was Key: Gold already cracked 4,000 last week and sliced under the July low near3,941 that every chart trader had flagged as the line in the sand — so the box was literally the market's most-watched support. Oct 11 high 4,201.68 to Nov 3 low3,887.34 = -7.5% correction in three weeks, first real drawdown after the January 2026 blow-off top at 5,595.46. BTC76,531 -2.1% risk-off cascade dragged the whole complex down and XAUT offered zero escape — gold beta to a liquidation wave is real. 3,887 low held on first test — if it breaks, next demand zone3,868-$3,900 adjustment range where the 52-week low cluster sits. 3,959–3,941 box break planned and hit 3,887 nearly perfect,3,887 low held not wicked further, 71 move with 10x = 18% ROI on the world's lowest-vol asset class, volume233M confirms institutional breakdown participation, gold spot -0.99% on the day helped the short, 3,887 TP before3,866 liquidity smart. - Possible dead-cat bounce, gold already +0.77% off the low and reclaiming 3,900, Fed December hike still in play which is gold-bearish but headline-risky, 52-week range bottom3,866.02 is a major magnet both ways, if BTC recovers 78k risk appetite returns and XAUT squeeze hits fast, holding short below3,887 into Swiss-vault narrative headlines is risky. One troy ounce per token, Swiss vault backing, but on a chart it is still just supply and demand — respect the box. $XAUTUSDT#ByXIMPACT #WSOTPicktoEarn10U #IMPACTbyTrade #BybitStocks #MidtermsMarketWatch $DOGEUSDT
ANALYZING HYPEUSDT
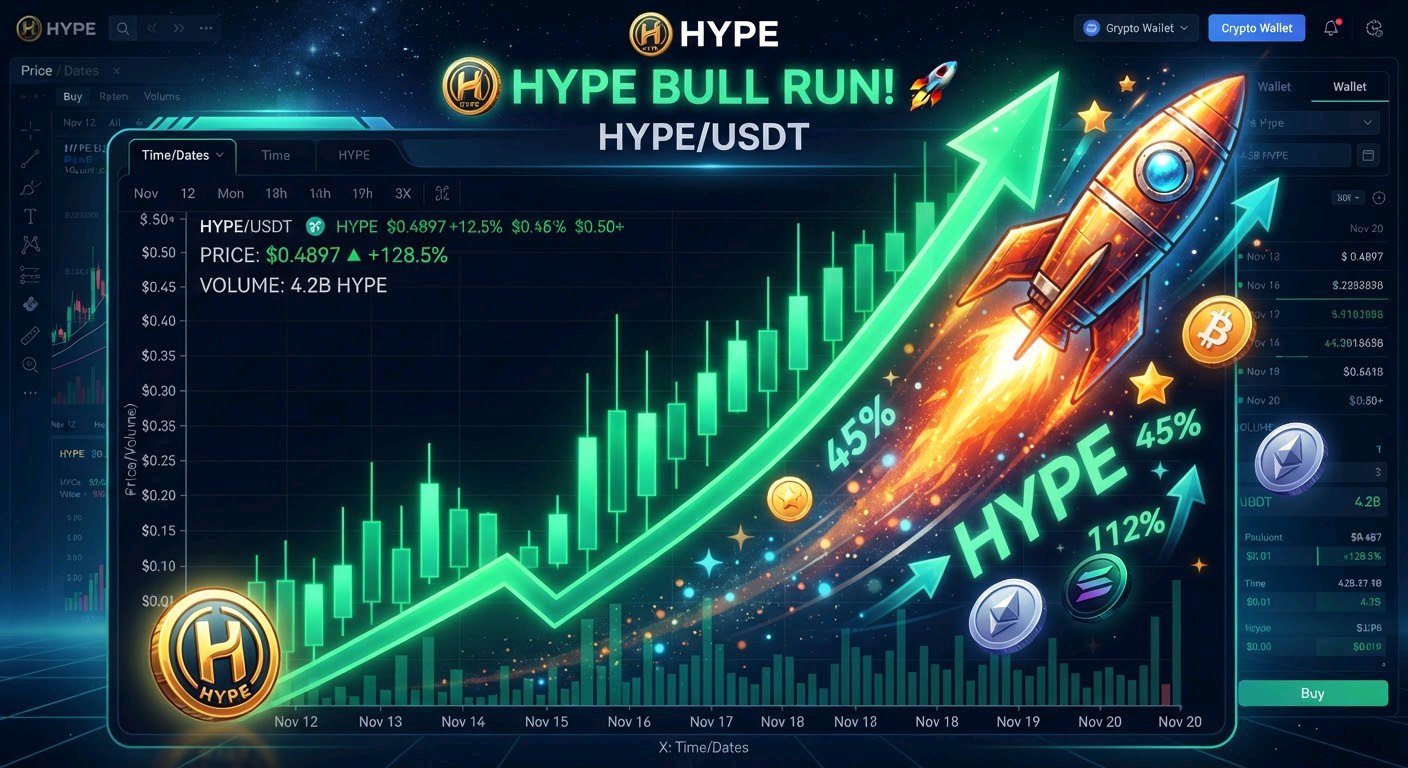
$HYPEUSDT is pulling back toward the $83 area after last week's strong rebound, and the key question now is whether this is a healthy retest or the start of another leg down. What makes this move interesting is the contrast between accelerating protocol-level buyback demand and a token price that still can't hold its highs. Is the market pricing the fundamentals correctly, or is short-term profit-taking still stronger than the value-accrual story? HYPE recently traded near 83.78, down roughly 4.2% over 24 hours but up approximately 7.6% over seven days, rebounding from last week's low near75.54. The token remains about 15% below its all-time high of 97.96 from late September and is down around 3.6% over 30 days. The immediate resistance sits at88–89, last week's recovery high, while80 is the first psychological support. Below that, $75.54 is the critical weekly low that bulls must defend to keep the rebound structure intact. The news flow remains unusually constructive. Today, November 3, Hyperliquid's AQAv2 mechanism is set to distribute an estimated $15.3M in USDC reserve yield toward HYPE buybacks, adding fresh firepower to the protocol's automatic open-market purchases. The recent ICE–Trade[XYZ] partnership to develop regulated U.S. perpetual markets has also raised HYPE's institutional profile, with Morgan Stanley even citing the platform as a competitive threat in its Coinbase downgrade. However, markets are forward-looking, and after a 16% weekly rebound, some of this optimism may already be priced in. This makes the current dip a test of conviction rather than a confirmed reversal. The underlying demand story offers an important contrast. September protocol revenue reportedly reached around 105M, with roughly 64% from core trading fees and about38M from non-core sources like USDC yield and builder fees. That revenue diversification directly supports the buyback engine, applying consistent buy-side pressure regardless of short-term price action. Stronger protocol revenue and higher token demand are aligned here, but that alignment takes time to show up in price when profit-taking dominates. Derivatives show that leverage remains elevated. Aggregate HYPE perpetual open interest is approximately 3.64B, with 24-hour futures volume near3.0B and around $13.7M in positions liquidated over the same period. Elevated open interest after a sharp weekly rally means crowded positioning in both directions. If resistance holds and selling accelerates, leveraged longs from the rebound could unwind quickly and add pressure to the downside. Key figures 83.78 — Current price area88–89 — Immediate resistance80 — Psychological support 75.54 — Last week's recovery low97.96 — All-time high (September 2026) +7.6% — Seven-day performance -3.6% — 30-day performance 15.3M — Expected AQAv2 buyback distribution3.64B — Aggregate perpetual open interest $13.7M — 24-hour liquidations Bullish confirmation: Reclaim 88–89 and hold above it with rising spot volume. That would put 92–95 in focus, with a retest of the $97.96 all-time high possible if buyback flows and derivatives positioning align. Bearish confirmation: Lose 80 and fail to recover it. That would expose77, followed by the $75.54 weekly low if profit-taking accelerates and leveraged longs unwind. HYPE has one of the strongest value-accrual mechanics in the market right now, but its immediate direction still depends on whether the rebound can absorb profit-taking near resistance. The decisive signal is whether buyback demand and institutional momentum can push HYPE back above $89, or whether elevated leverage and short-term sellers drag it toward another support test.#ByXIMPACT #IMPACTbyTrade #BybitStocks #MidtermsMarketWatch #BitcoinSlidesBelow$80K $ETHUSDT

BTCUSDT SUPPORT
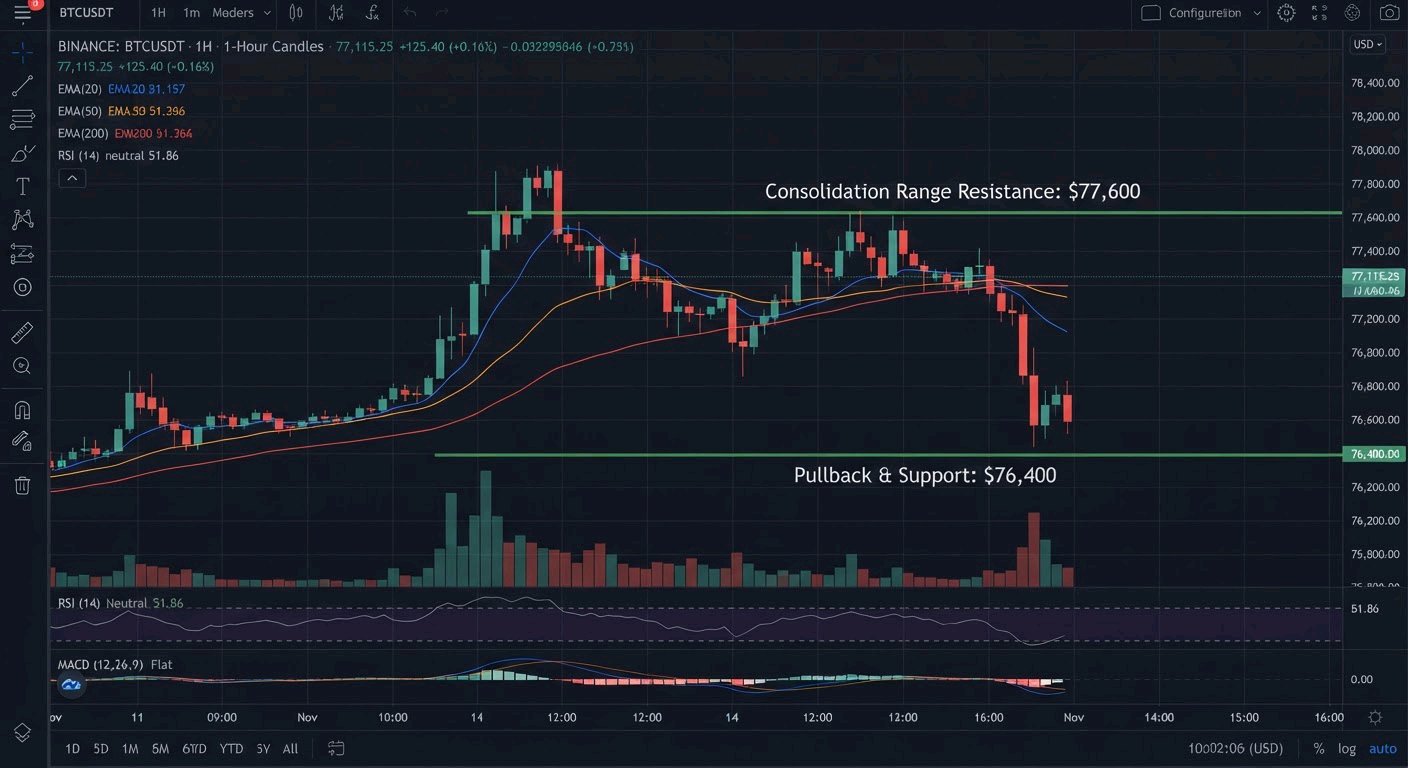
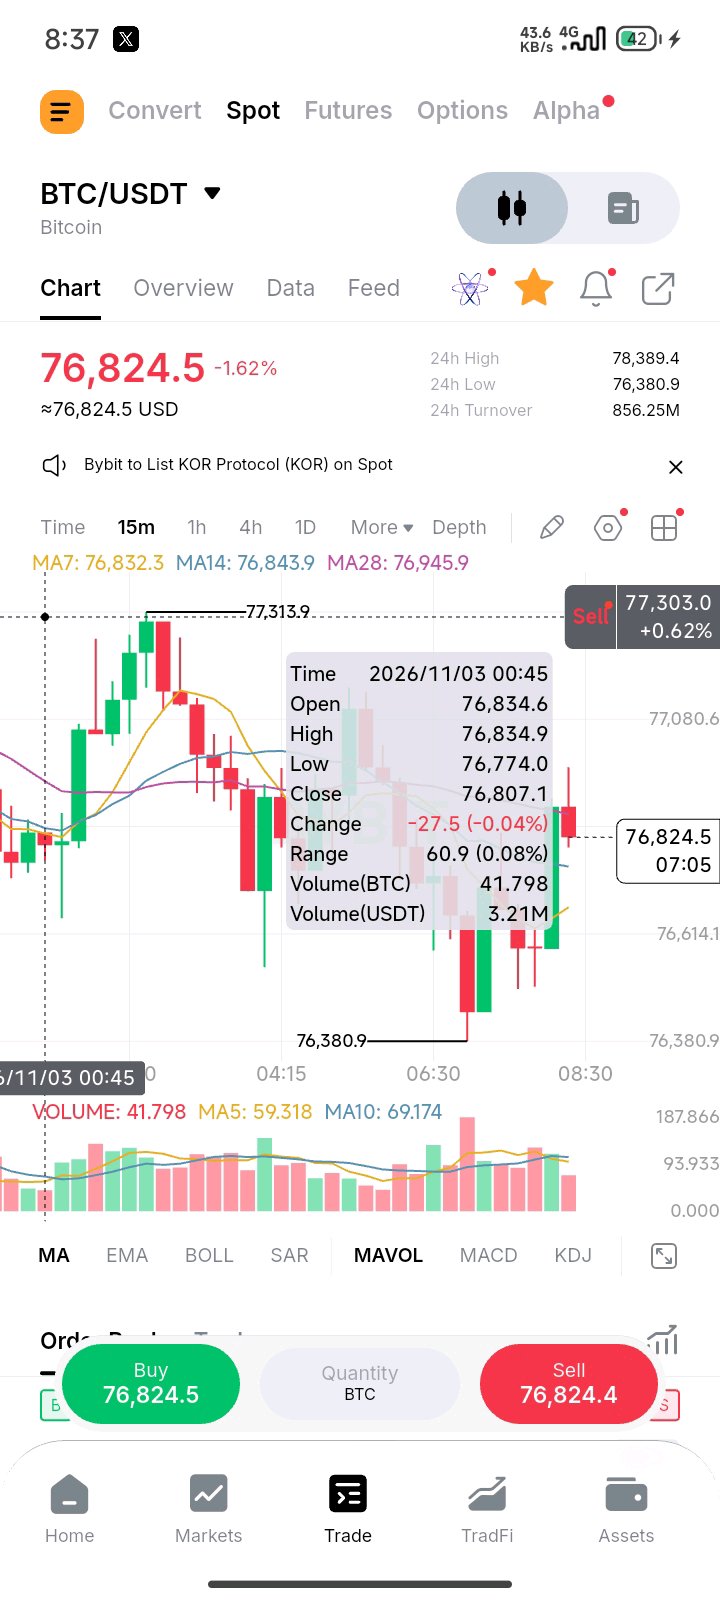
$BTCUSDT is trading around $76,520–$76,850, down ~1.5–2.2% on the day, after sliding from the recent $78k–$80k area and finding buyers near the $76,390–$76,410 zone. That is a clean multi-day pullback. Price has stopped making aggressive lower lows on the lower timeframes and is trying to stabilize, but the higher timeframes remain firmly in control of the sellers. On the 1H chart: Price is sitting below the short-term MAs. The 1H structure is still a clear downtrend — lower highs, lower lows, and the MAs are stacked bearish and sloping down. The nearest real test overhead is the $77,100–$77,300 cluster (recent 1H resistance + short MAs). On the 15m chart: Price has managed a small bounce and is hovering around or just under the short MAs. Buyers are attempting to defend, but the bounce so far lacks strong conviction. Short-term, the 15m is trying to repair while the 1H remains bearish. Volume is the key watchpoint. The rebound candles have not shown meaningful expansion yet. Without volume confirmation, this looks more like a pause than a reversal. So the structure is basically: $76,390–$76,410 → major support (24h low / recent defended zone) $76,500–$76,700 → current consolidation range $77,100–$77,300 → first real resistance / 1H MA cluster $77,600–$78,000 → stronger resistance zone $79,000+ → previous swing area What makes this setup interesting isn’t the daily percentage move. It’s that the 15m and the 1H disagree. The lower timeframe is trying to stabilize, but the 1H MAs are still stacked and sloping lower. Whichever timeframe gives way first decides the next move. If buyers push through $77,300 and then reclaim $77,600–$78,000 with volume, the 1H structure starts to repair. If price loses the $76,390–$76,410 zone, the whole bounce needs to be reassessed and lower levels open up quickly. For now I wouldn’t focus on the small percentage move. I’d watch the $76,400 to $77,600 range closely. After a drop like this one, the next expansion comes from whichever side wins it.#ByXIMPACT #WSOTPicktoEarn10U #IMPACTbyTrade #AnthropicS1Filing
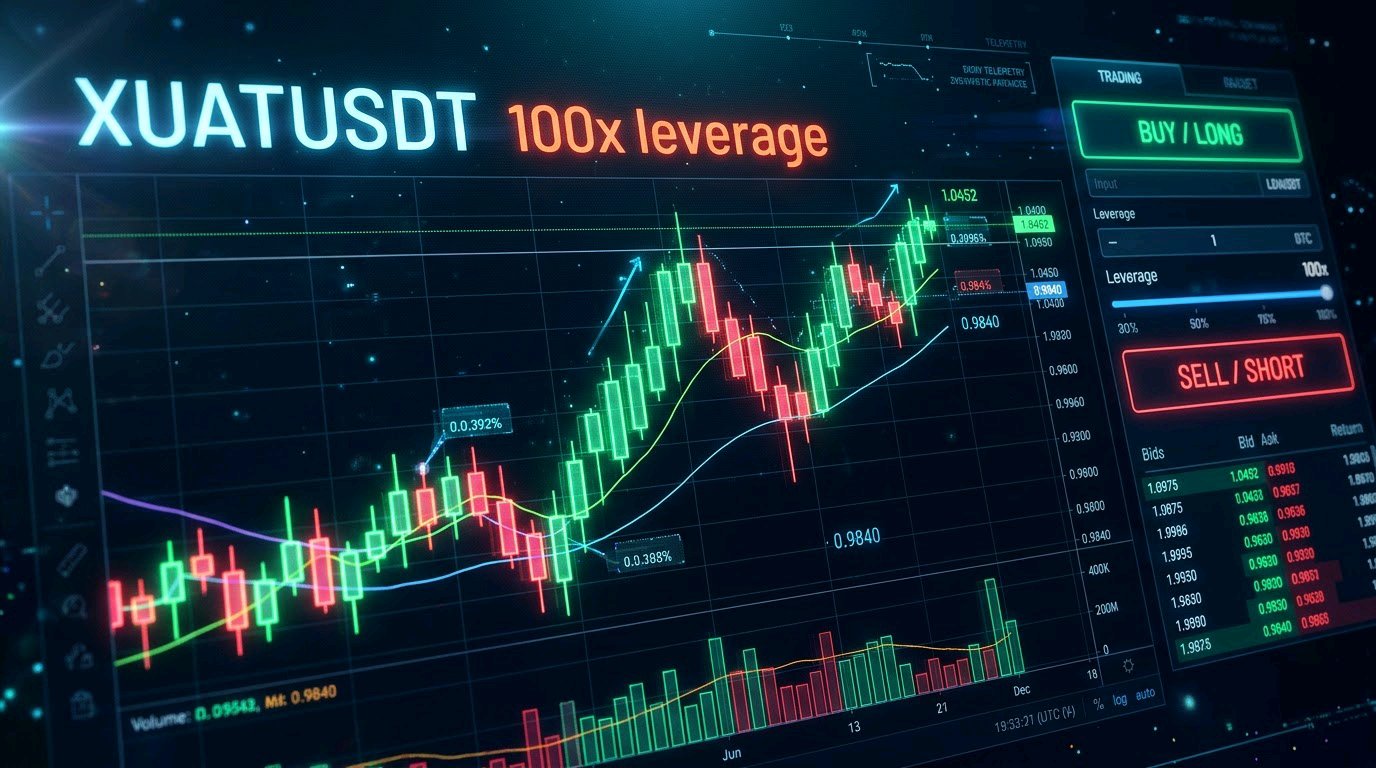
Bybit has officially listed the XUATUSDT Perpetual Contract, offering up to 100x leverage. Key Highlights: Trading Pair: XUATUSDT Settlement Asset: USDT Maximum Leverage: Up to 100x Trading Bots Support: Spot Grid, Futures Grid, and DCA Bots available upon launch Copy Trading Support: Master Traders can now trade XUATUSDT and allow Followers to mirror trades seamlessly#ByXIMPACT #BlockchainSecurity #BitcoinSlidesBelow$80K #WSOT2026 #WSOTPicktoEarn10U
consolidating
$TRXUSDT recorded strong on-chain network activity and steady volume, yet TRX/USDT trades near key technical resistance as the market weighs supply dynamics. That divergence—steady blockchain utility against crucial price levels—is the key signal. This remains a watch, not a confident long or short. Network strength is real, but it requires a decisive breakout to confirm further upside. Trade Levels: A daily close above immediate resistance would provide stronger evidence of renewed demand, with higher targets ahead. On the downside, critical support holds near recent swing lows. A confirmed breakdown below support would weaken the structure considerably. Timeframe: Next 1–2 weeks, tracking broader market momentum. Invalidation: A sustained daily close beyond key resistance or support ranges would invalidate the current cautious technical thesis.#ByXIMPACT

Near adventure
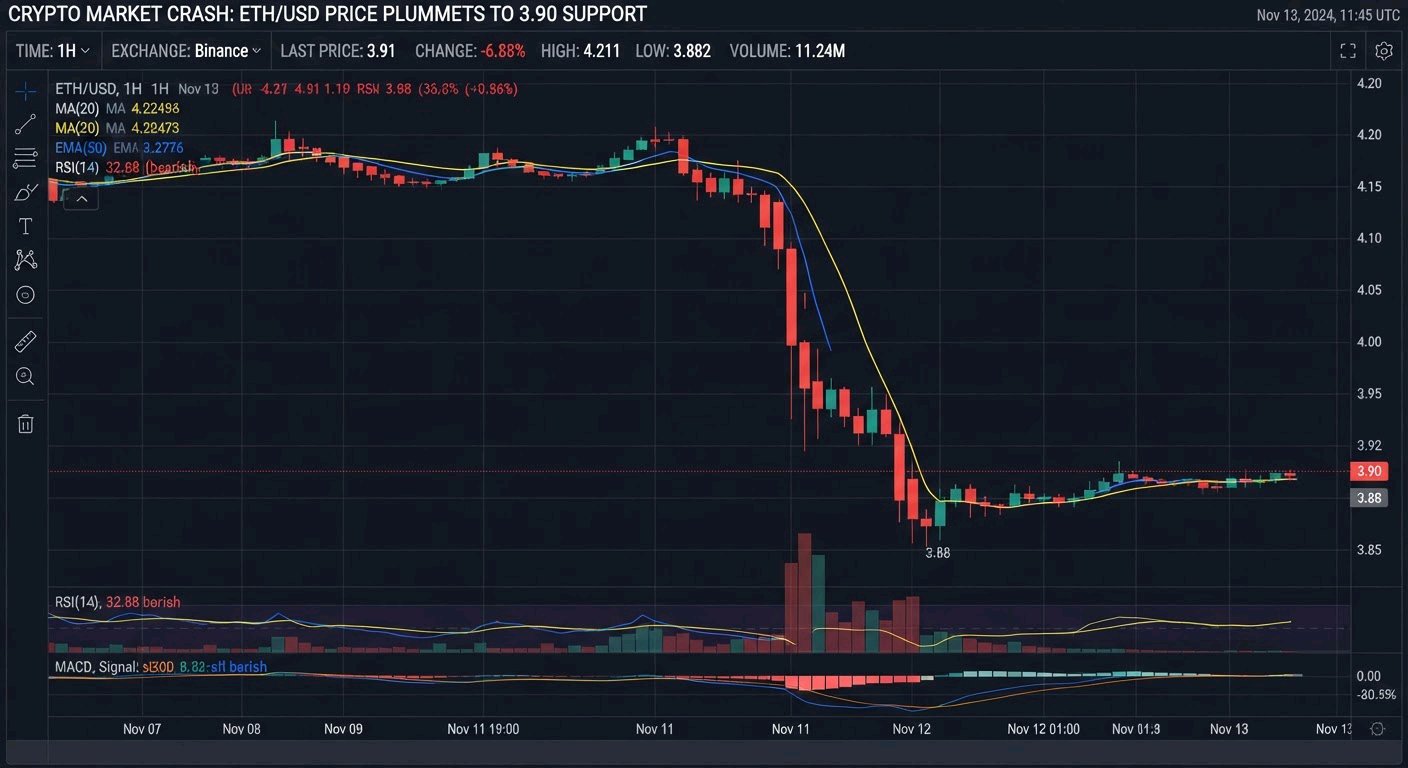
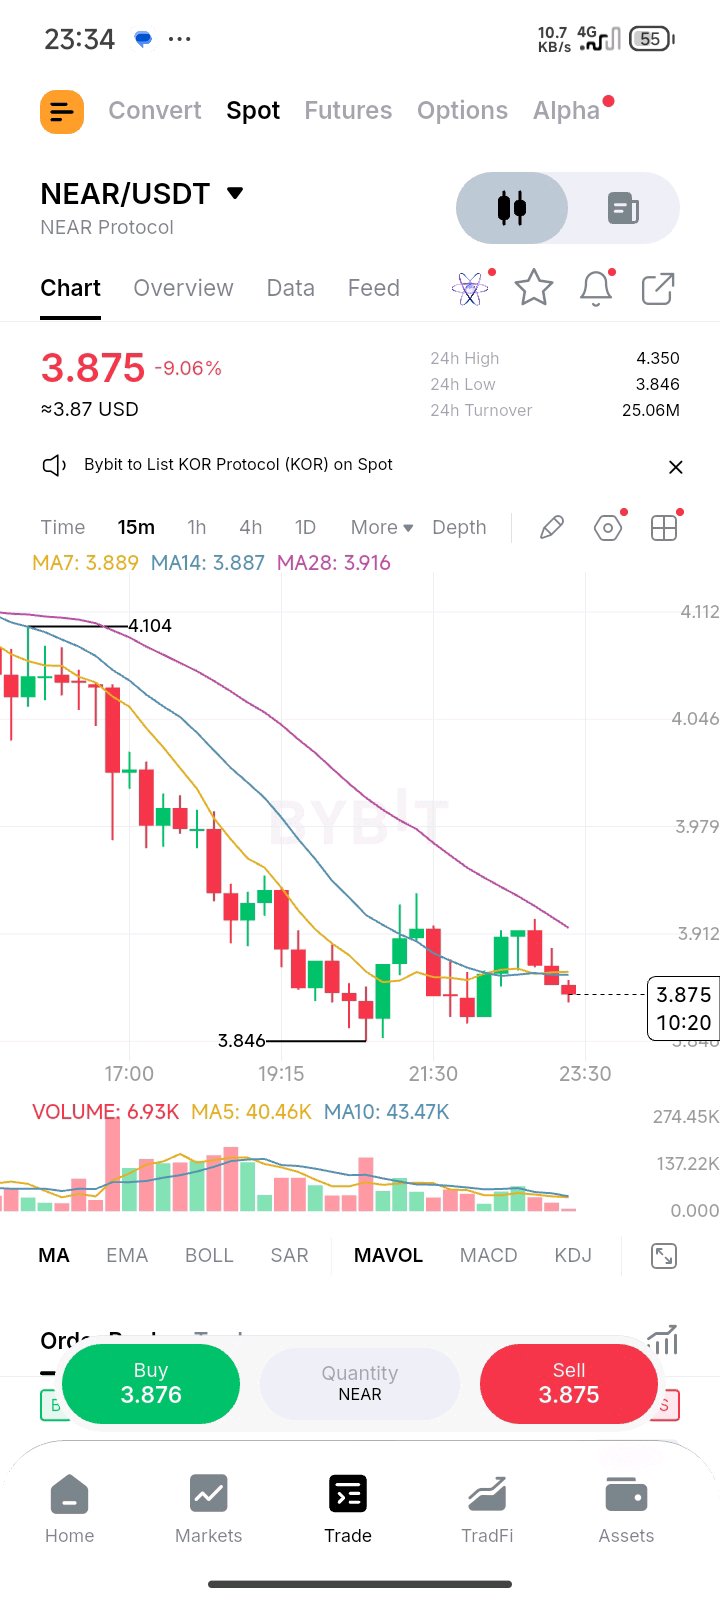
$NEARUSDT : Holding Near 3.90 After the Sharp Flush, but This Is Not a Recovery Yet NEAR is trading near 3.90, roughly 2–3% above the recent 3.85 area low, after a ~9% daily drop. I am not treating the current stabilization as a recovery. The larger concern is that heavy selling pressure, breakdown below short-term averages, and a still long-tilted derivatives book may remain unresolved. The question is whether spot demand can absorb supply, or whether another liquidity sweep is still ahead. Price Action Price: ~3.90 (-8.5% to -9.5% on the day), well below the recent 4.30–4.35 zone Recent low: ~3.85 (24h flush), with prior sharp selling on 10/29–10/30 that was only partially reclaimed 24h range: 3.85 to 4.34 Immediate resistance: 4.05–4.10, then the 4.20–4.30 zone where the post-correction bounce failed First support: 3.85–3.88, then the psychological 3.80 area A reclaim of 4.20–4.30 on rising volume would show buyers regaining control of the recent range. Even then, the broader structure of lower highs remains under pressure. Large Capital Picture NEAR has ETF-related flow mentions in the background, but the relevant near-term read is large wallets, exchange flows, and the persistent offer. The multi-day slide into early November was not a single clean capitulation. Vertical moves higher have been fully retraced, typical of liquidity-driven spikes that failed to attract sustained follow-through. Demand has been inconsistent: bounces have been sold into rather than extended. Liquidity & Range Conditions Price has compressed after the sharp decline, but turnover remains elevated relative to quieter periods (spot volume in the $600M area). A narrow range after a sharp drop is not automatic evidence of accumulation. It more likely reflects reduced aggressive participation at the lows. Stronger spot volume on up-moves is still missing, and thin books at the extremes leave price vulnerable to another sweep in either direction. Derivatives Positioning These figures are estimates from available chart and market data, not live exchange snapshots. Open interest: still elevated (aggregate ~$800M+ range across major venues), with leverage present into the bounce attempts Funding: mildly positive (longs paying shorts, ~0.01% per 8h on major venues) Long/short ratio: roughly 55–62% of positions long on tracked venues This is the key vulnerability. A bounce led by leverage rather than clean spot demand leaves crowded longs exposed if 3.85 fails. Recent liquidations have already shown how quickly cascades can develop in this book. Key Figures Current price: ~3.90 Immediate resistance: 4.05–4.10, then 4.20–4.30 Support: 3.85–3.88 Recent low: ~3.85 Recent spike/rejection zone: 4.30–4.35 24h turnover: elevated (~$600M spot range) Funding: mildly positive (est.) Long positioning: ~55–62% (est.) Confirmation Levels Bullish: a sustained hourly close above 4.20–4.30 on rising spot volume. That would open 4.50–4.55, but the structure stays unconfirmed until spot leads. Bearish: a break and close below 3.85. That exposes a retest of deeper supports near 3.70–3.75, and a loss of those levels would open a fresh leg lower with long liquidations accelerating it. Closing The market has stabilized near the lows, but temporarily. Selling pressure and crowded long positioning are still competing with any recovery attempt. The decisive signal is whether spot buyers return while leverage stays controlled, or whether another support breakdown triggers fresh long liquidations. Until spot demand shows up with conviction, rallies into resistance deserve skepticism. Not financial advice.#ByXIMPACT
new evolution
$SOLUSDT Perpetual Contract on our derivatives trading platform! Traders can now leverage up to 100x on SOL/USDT with the following key features: Trading Pair: SOL/USDT Settlement Asset: USDT Contract Type: Linear Perpetual Maximum Leverage: Up to 100x Trading Hours: 24/7 Key Highlights & Platform Support Flexible TP/SL Settings: Set Take-Profit and Stop-Loss orders seamlessly for full or partial positions directly from the order panel. Unified Trading Account (UTA) Compatible: Use cross-margin functionality and multi-asset collateral options to maximize capital efficiency. Sub-Second Execution: Experience ultra-low latency execution backed by Bybit’s high-frequency matching engine.#ByXIMPACT

New Opportunity on Bybit:
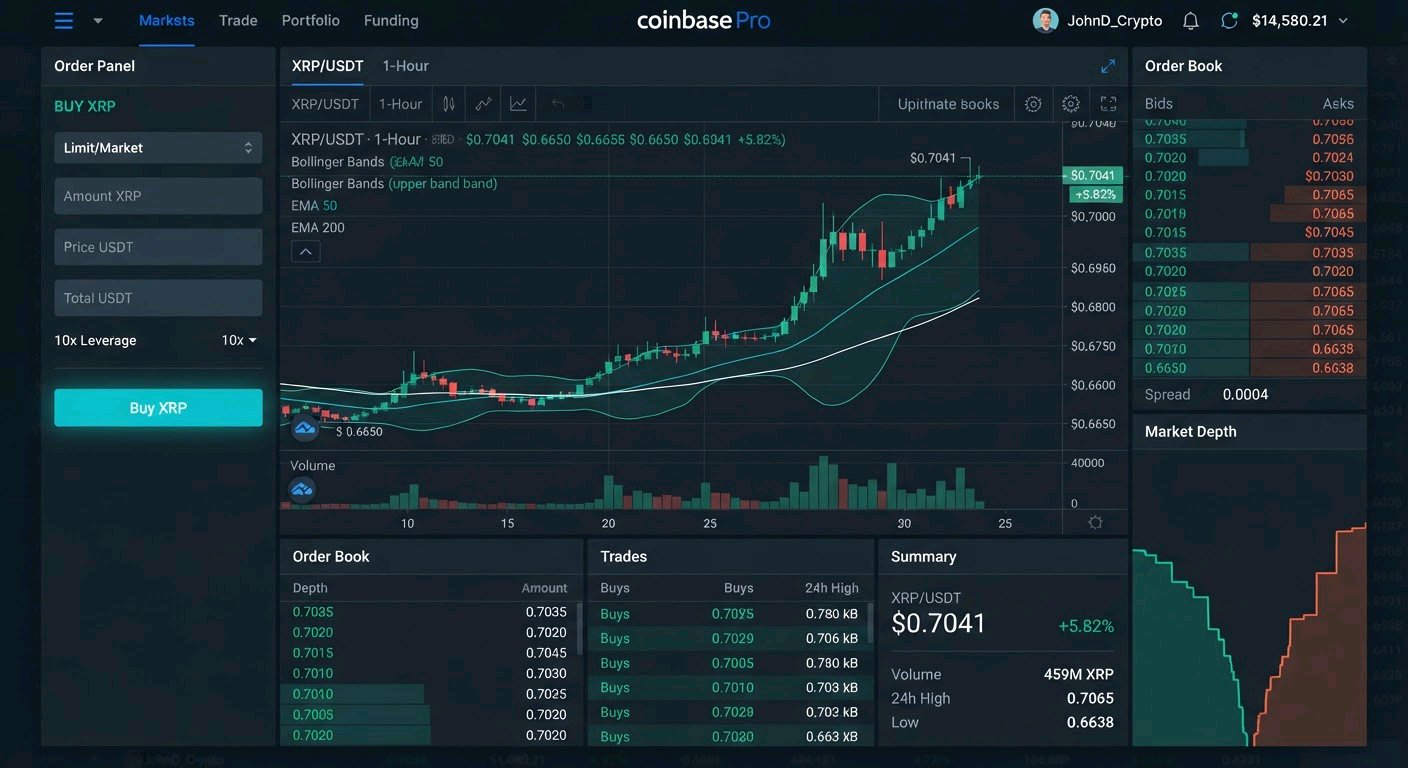
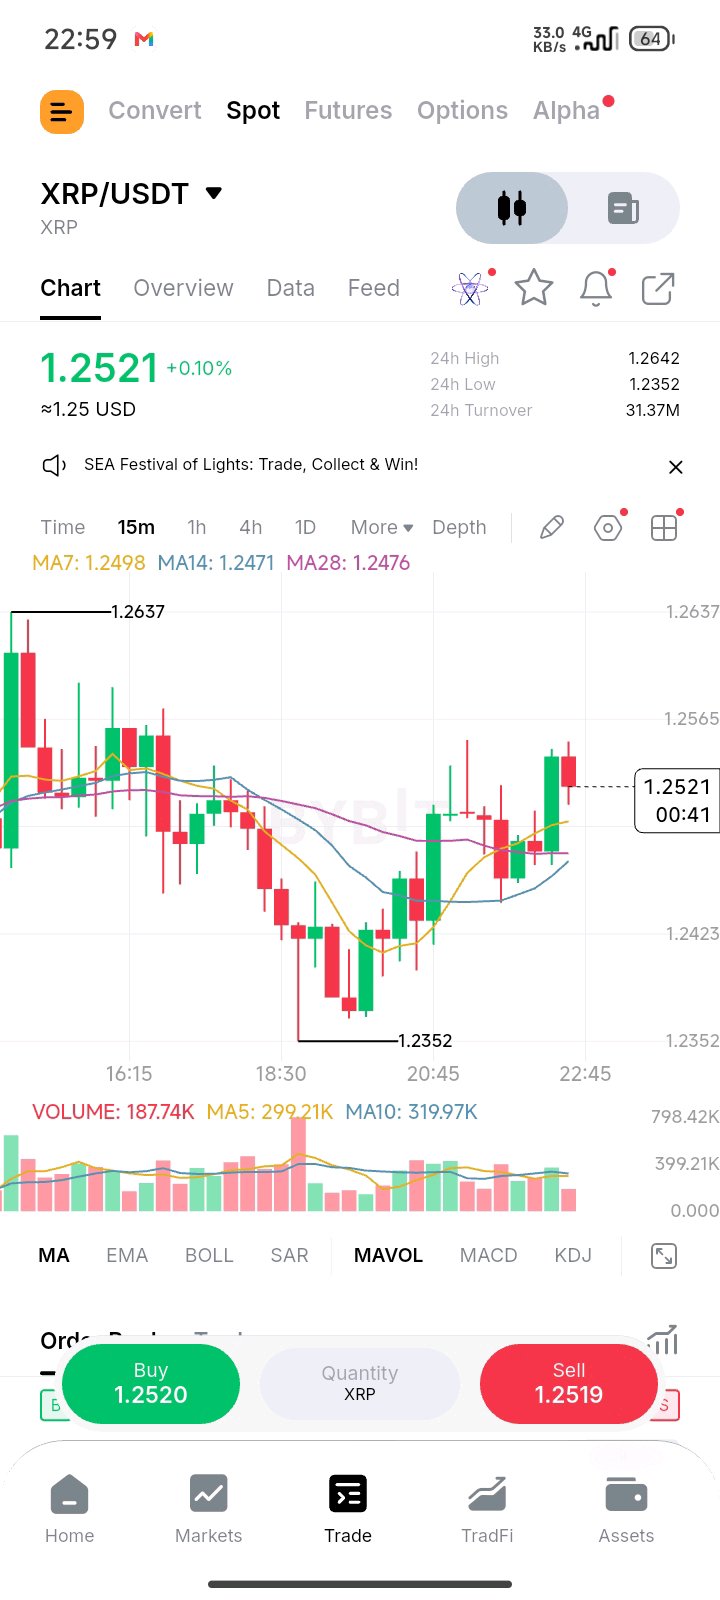
🚨 $XRPUSDT Trading & Rewards! 🚨 Looking to capitalize on recent market momentum? Trade XRP/USDT with ultra-low fees, high-speed execution, and deep liquidity on Bybit! ⚡️ 🔥 Highlights: • Zero-Fee Options: Enjoy competitive spot & contract trading fees. • Automated Trading: Deploy Bybit's Grid & DCA Bots to automate your XRP strategy 24/7. • Flexible Earn: Put your unused USDT to work and earn up to competitive APRs while waiting for your next entry. 🎁 New User Bonus: Register, deposit, and trade to unlock welcome rewards up to 5,000 USDT!#ByXIMPACT #BlockchainSecurity #WSOTPicktoEarn10U #IMPACTbyTrade
HYPE INNOVATION
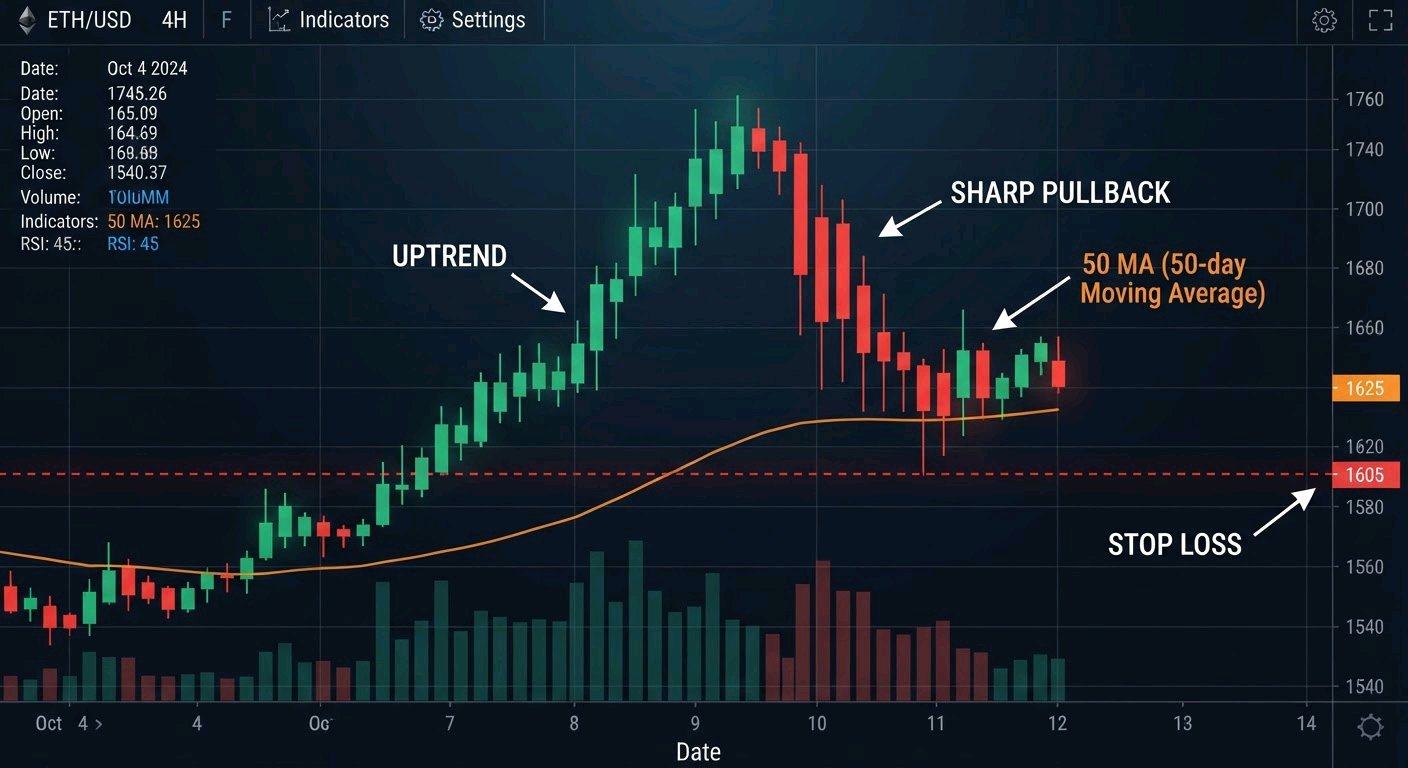
$HYPEUSDT : the ICE pump cooled to its 50-day average. I bought the pullback at 20x, and the leverage chose my stop. 🛑 The setup looked clean on the chart. The stop wasn’t a decision it was what 20x allowed. 📊 My trade LONG HYPE/USDT, 20x 📍 Entry: $85.80 (market) 🛑 Stop: $85.25 (filled) 📦 Size: 0.5 HYPE 📉 Result: price −0.64%, ROI −12.8% 📜 Why I took it On Oct 29, ICE announced plans for CFTC-regulated US perpetuals built on Hyperliquid’s tech. HYPE ripped ~14–18% in a day toward the high $90s. By early November the move had faded on profit-taking with no fresh catalyst, and price sat near the 50-day average. I bought the pullback expecting the average to act as a floor after the news-driven spike. Positioning added a second angle — reports of heavy short interest among top Hyperliquid traders, with sizable unrealized losses. The catalyst was still only a plan (no approval, no launch date), but the technical bounce setup into the 50-day looked worth a shot. What I wanted to test: does the 50-day hold as support after a news pump fades? 📍 Key levels 🔹 Entry: $85.80 🔹 My stop: $85.25 🔹 50-day average: ~$85.60 🔹 50-day EMA: ~$82.70–83.00 🔹 Above: recent high ~$90.97, then the $97.99 ATH 📌 What would have proven me wrong A decisive close under the 50-day EMA (~$82.70–83.00). My actual stop sat only ~0.6% below entry — well inside normal noise. ⚠️ Risk At 20x, a 0.64% move wiped 12.8% of margin. Crowded shorts can stay crowded longer than a tight stop survives. A bounce after a 14%+ pump can also fail when the broader market is soft. 🚨 Where I was wrong The honest stop was under the 50-day EMA, roughly 3–3.5% below entry. The nearest realistic target was only ~5–6% higher (back toward the recent high). That is a workable ~1.5–2:1 setup on paper. At 20x a 3.5% stop would have risked ~70% of margin. So leverage forced the tiny stop, turning a decent idea into a coin-flip that looked like 30+:1 on the chart. A stop is supposed to mark where the thesis is invalid. Mine marked where my leverage ran out. 📚 What I learned from this trade 🔹 Write the honest stop and nearest target before entering. Then check the risk/reward. 🔹 Leverage must fit the stop. A 3.5% stop on 20x risks most of the margin; 4–6x keeps it manageable. 🔹 If the stop sits inside normal volatility, the stop is wrong, not the market. 🔹 If no leverage fits the honest stop, skip the trade. 💡 My Takeaway −12.8% is just 0.64% × 20. The numbers that matter are the real ratio (~1.6–2:1) and the margin risk at proper size. Rule going forward: honest stop first, then the leverage that fits it. If nothing fits, I skip.#ByXIMPACT #BybitStocks #AnthropicS1Filing

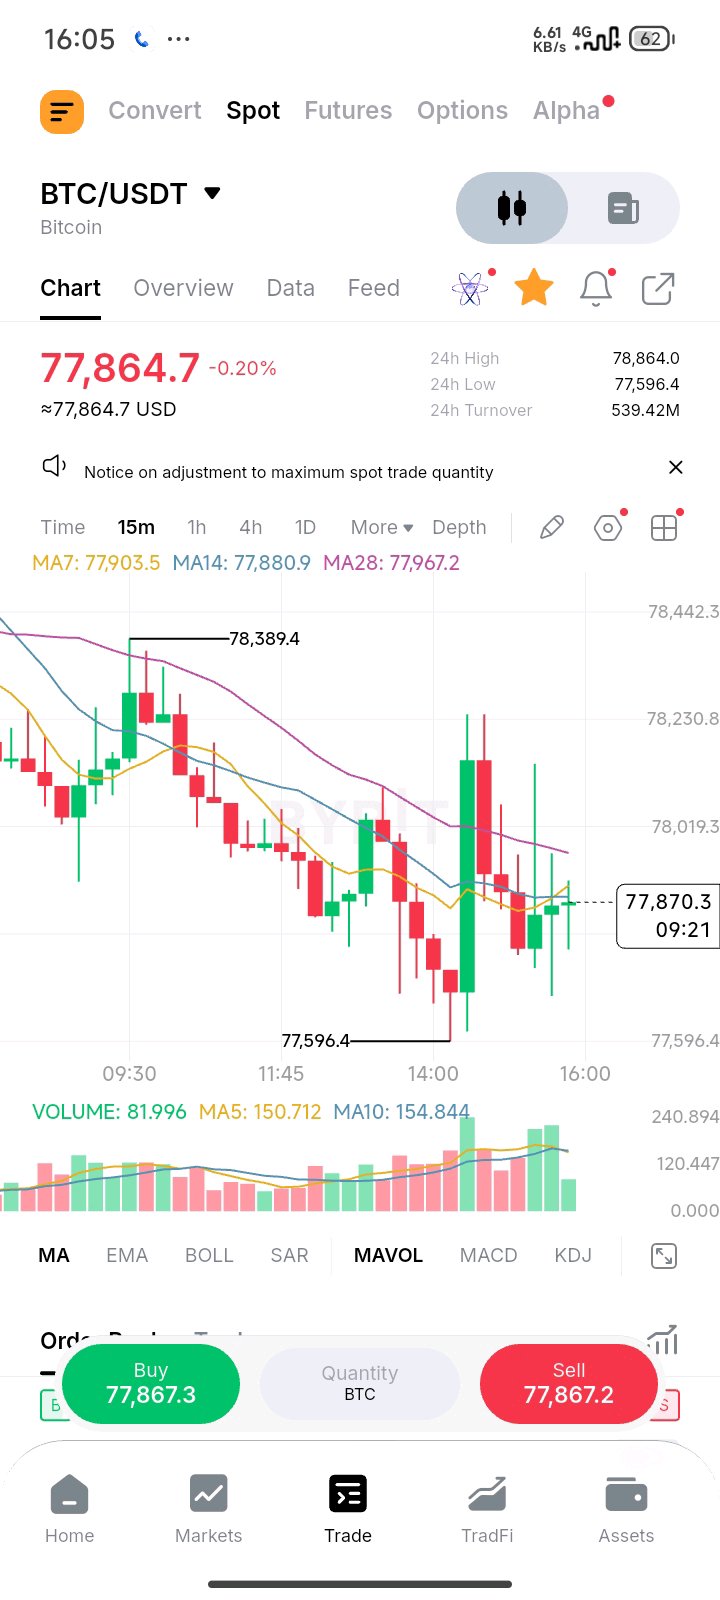
$BTCUSDT has just settled into a critical short-term range, but the chart is showing a detail I would not ignore: price is holding right around the recent local support cluster while the 15m MACD is still trying to stabilize after heavy selling pressure. That creates a very different setup from a clean breakdown backed by expanding selling pressure. 👀 15m chart, BTC is trading around 77,850, down roughly 0.5–0.6%, with a visible 24H high near 78,880 and low around 77,600. The structure has clearly weakened. Price moved from the local highs and is now sitting below several short-term moving averages, with the broader short-term trend still pointing lower. MACD is showing early signs of potential stabilization, but the histogram remains soft and the macro trend on this timeframe is still heavy. So technically, the short-term downtrend is still in control, but the bears are losing some of their immediate grip near the current levels. But participation tells a more complicated story. The latest candles show elevated volume during the flush toward the 77,600 area, yet any bounce attempts are happening on relatively muted follow-through. In other words, BTC has already produced the downside move, but the immediate recovery isn’t backed by aggressive buying. Fib retracement and key structure show price fighting to hold the recent swing low zone just above the absolute local bottom. That is the first contradiction I see: the price chart looks like it wants to bounce off this support cluster, but the immediate participation data suggests buyers are still hesitant to step in aggressively. The fundamental side makes BTC particularly interesting because this isn’t just another speculative asset. Bitcoin remains the dominant macro crypto asset, with deep institutional infrastructure, ETF flows, and real global liquidity. It continues to act as the market’s primary risk-on/risk-off barometer rather than relying purely on narrative farming. There has also been a meaningful structural shift in how the market digests pullbacks. But there is another layer that traders need to watch closely: liquidity and flow dynamics. BTC has real demand from ETFs, corporates, and long-term holders, while short-term leveraged positioning and occasional outflows still create volatility. That creates the second contradiction: Bitcoin’s underlying network and institutional rails keep expanding, while the token is still navigating short-term distribution and positioning resets. For me, that makes the 78,300–78,500 region extremely important. If BTC can reclaim and hold roughly 78,400–78,500 with a clear expansion in 15m volume, the current move would have stronger confirmation. In that scenario, I would watch approximately 78,900 first and then the 79,500–80,000 region. My preferred pullback area is around 77,400 to 77,700, provided the structure remains intact. A loss of roughly 77,400 would weaken the current bottom formation, while a deeper move under 76,800–77,000 would put the recent structure under much more pressure. So my setup is conditional rather than blindly bullish: Bounce trigger: 78,400–78,500 with expanding volume Pullback zone: 77,400 to 77,700 Invalidation: below 76,800 TP1: 78,900 TP2: 79,500 TP3: 80,000–80,500 🤑 The bigger question for BTC isn’t whether the asset has real utility and institutional demand; the liquidity, ETF infrastructure, and network security give that thesis measurable substance. The harder question is whether short-term demand can absorb the ongoing positioning and flow pressure without another leg lower. Right now, the chart says a relief bounce is possible from the current support cluster. 🤔 The next move needs to show real participation, otherwise the heavy short-term downtrend will force another retest of the local lows. #IMPACTbyTrade#ByXIMPACT #IMPACTbyTrade

$XAUTUSDT Tether Gold (XAUT): Bybit just made holding gold productive. But does the yield change the thesis? For years XAUT was pure exposure — 1:1 physical gold, no yield, pure hedge. This month Bybit changed that. What’s new? The product. Bybit partnered with XAUE Protocol to launch a 90-day fixed-term XAUT savings product offering 2.83% fixed APR. Limited pool of 2,000 XAUT, first-come first-served, principal + yield paid at maturity in XAUT. Minimum 0.05 XAUT. The context. Gold itself has cooled hard. After printing highs near $5,400 earlier in 2026, spot is now hovering around $3,900. XAUT is tracking it tightly, currently trading near $3,890–3,900 on most venues. The bigger picture. Tokenized gold remains one of the strongest RWA categories. XAUT continues to hold meaningful market share, Bybit has been one of the deepest liquidity venues for it, and Tether has been steadily adding physical gold to the XAUT reserve (while trimming a bit of the gold held against USDT). My view: Turning non-yielding gold into a modestly productive asset is smart product design. 2.83% on fully backed physical gold is not life-changing, but it removes the pure opportunity-cost argument against holding XAUT versus just sitting in stables or Treasuries. But there is one important detail. The yield comes from the XAUE Protocol layer, not from the gold itself. You’re still exposed to gold price risk, plus the smart-contract / protocol risk of the yield mechanism. The 2.83% is fixed for 90 days and the pool is tiny (only 2,000 XAUT). This is a pilot, not a structural change in how XAUT works. So XAUT holders benefit from the yield only if they lock into the product. Spot holders get the same gold exposure they always had — nothing more. What does the market show? XAUT has been relatively quiet compared with the pure crypto beta names. While gold corrected ~15–25% from the January peaks, XAUT simply followed. No dramatic depeg, no major premium/discount drama. Volume remains healthy on Bybit and the usual suspects. The number I keep coming back to is the size of the savings pool: 2,000 XAUT. At current prices that’s under $8 million. It’s a proof-of-concept, not a liquidity event. Where I land: Bybit just made the most liquid gold token slightly more attractive to hold. That’s constructive for the RWA narrative and for XAUT specifically. But a 2.83% fixed yield on a 90-day lock does not rewrite the gold thesis. Price still lives and dies with physical gold and the macro backdrop. I would watch: Whether the 2,000 XAUT pool fills quickly (demand signal) Any expansion of the yield product or higher APRs later Gold’s ability to stabilize above $3,850–3,900 after the recent flush And here is the question: if the biggest exchanges start turning tokenized gold into a yield-bearing asset, does that finally make XAUT a core portfolio holding instead of just a hedge? #ByXIMPACT #IMPACTbyTrade