
Jehoshaphat150
698Like2Shares45Fans2Follow
We're here for the bag💰 anyway
We're here for the bag💰 anyway
So I tried longing today🤧 $ONDOUSDT #bearish
$BTCUSDT Trading at $77,339.60 | Market Analysis Bitcoin is down 0.74% on the day, trading in a market that's firmly in Fear — the Fear & Greed Index sits at 26, just one point above Extreme Fear. That kind of sentiment reading tends to make people uncomfortable, but historically it's exactly where the most interesting setups begin to form. Looking at the price structure, BTC is currently sitting in a fairly dense support cluster between $76,232 and $77,539. The 4H Bollinger Band lower band, VWAP, and Fibonacci retracement levels all agree on this zone, which gives it meaningful confluence. Price hasn't broken below it with conviction yet, and that matters. **Key Levels:** - 4H Support: $76,232 — $76,828 - 4H Resistance: $78,311 — $80,659 - 1D Support: $74,026 — $77,179 - 1D Resistance: $83,484 — $86,637 - Stop Loss: $74,000 (below 1D support floor) On the capital flow side, the picture is quietly bullish. Whale positioning is at 1.6:1 long — $1.2B on longs versus $738M on shorts. Fund sentiment is reading bullish. These aren't retail traders reacting to a red candle; this is institutional money sitting comfortably on the long side while the market panics. Open interest has grown from 57,092 BTC to 68,597 BTC over the past 30 days — a 20% increase. Rising OI alongside a Fear-driven price dip suggests new positions are being built rather than closed. That's accumulation behaviour, not distribution. The one thing to watch is the funding rate, currently at the maximum positive cap of 0.01% — longs are paying shorts. That tells you the long trade is becoming slightly crowded on the derivatives side, which could cause short-term turbulence. It doesn't invalidate the setup, but it's a reason not to chase aggressively at current prices. The cleanest entry sits on a confirmed bounce from the $76,232-$76,828 zone. A hold there with recovering volume points toward $78,311 first, then $80,659 as the next significant level. Above that, the 1D resistance at $83,484 becomes the real target. **Trade Plan:** - Entry Range: $76,232 — $77,000 - Stop Loss: $74,000 - Target 1: $78,311 - Target 2: $80,659 - Target 3: $83,484 - Risk:Reward: ~1:2.5 The fear in the market is real, but the smart money positioning tells a different story. Worth watching closely over the next 24-48 hours. @BybitX #ByXImpact #IMPACTbyTrade #CryptoTrading$BTCUSDT

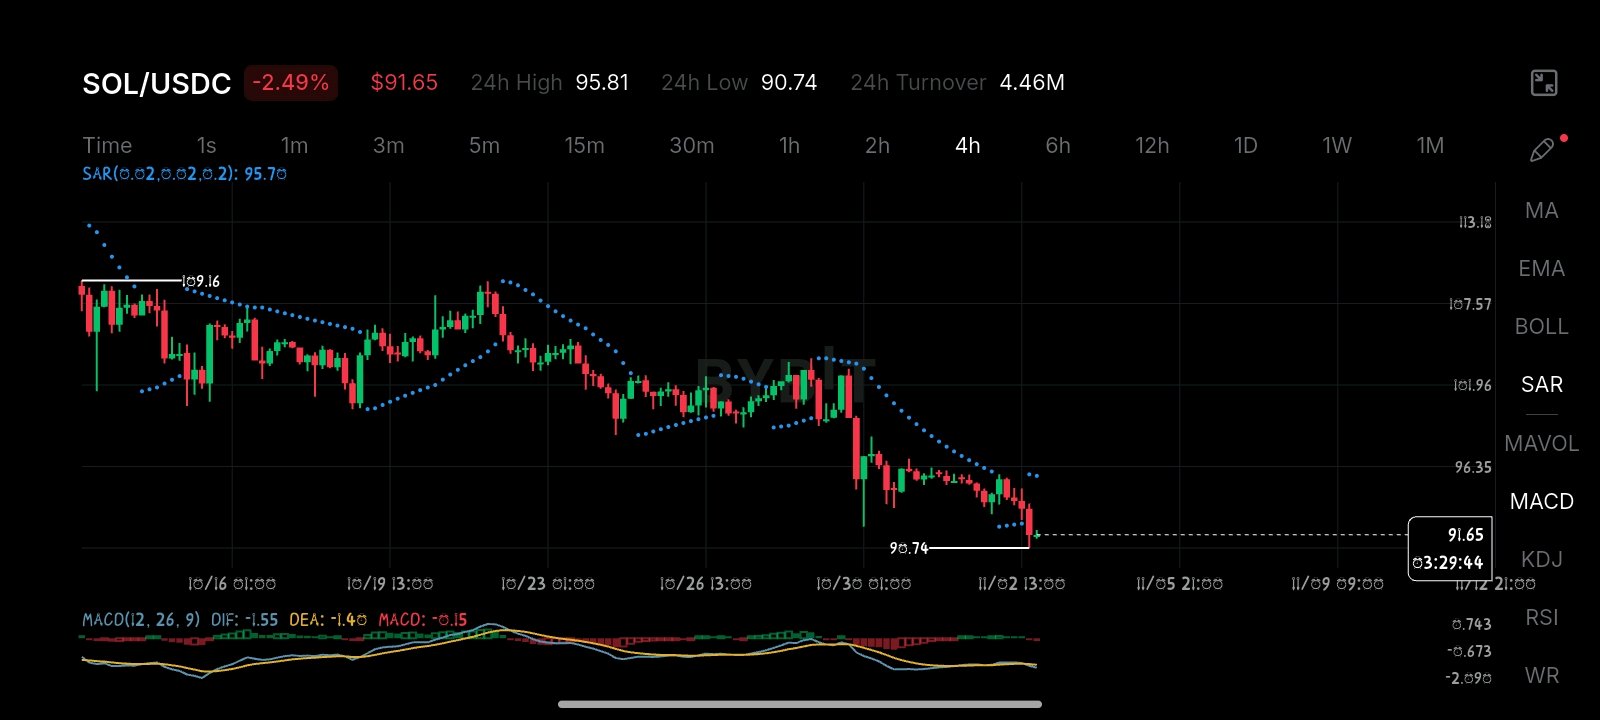
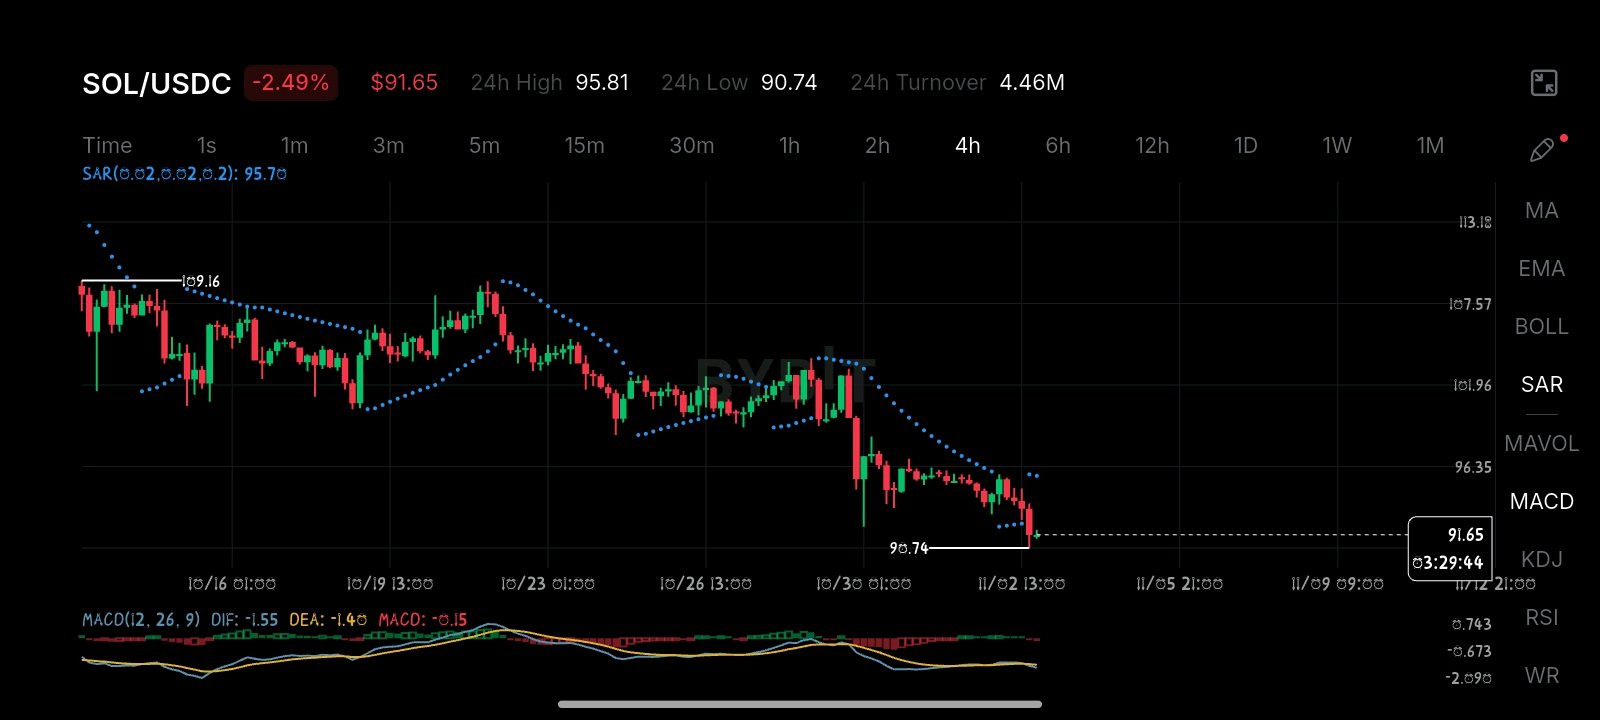
SOL is down 2.06% on the day, pulled back alongside the broader market which is sitting in Fear territory at 37 on the Fear & Greed Index. But this kind of dip on SOL, given the underlying data, is worth paying close attention to. The 4H Bollinger Band lower band, VWAP, and volume profile all converge around the $90.78-$92.22 region which is a zone that has absorbed selling pressure consistently. The fact that price is sitting right at this confluence instead of breaking through it is encouraging for bulls, right? Key Levels - 4H Support: $90.78 — $92.22 - 4H Resistance: $96.69 — $100.85 - 1D Support: $89.75 — $93.69 - 1D Resistance: $107.46 — $117.52 - Stop Loss: $89.50 (below 1D support floor) Digging into the capital flow, whales are sitting at a 1.3:1 long ratio which is although not the most aggressive reading but still leaning bullish. More interesting is the fund sentiment, which is reading bullish despite the price dip. The buy/sell ratio at 2.67:1 suggests buyers are quietly accumulating while retail is reacting to the red candle. However, open interest has actually grown from 5.7M to 6.19M over the past 30 days — rising OI alongside relatively stable price is a sign of fresh money building positions rather than exits. That's a healthy signal💪 The funding rate is sitting at near zero on average (0.0000263), meaning the trade isn't overcrowded. No forced liquidations looming from either side. Therefore, here'y intended setup: if SOL holds $90.78 and reclaims $93.00 with volume, the next targets become $96.69 and $100.85. A break below $89.50 would change the picture entirely. Trade Plan - Entry Range: $90.78 — $92.50 - Stop Loss: $89.50 - Target 1: $96.69 - Target 2: $100.85 - Risk:Reward: ~1:2.3 I've traded SOL before and the structure has always respected these key levels. Right now the fear in the market is creating the exact kind of dip that sets up the next leg higher, provided the support holds. $SOLUSDT @BybitX #IMPACTbyTrade #ByXImpact #CryptoTrading
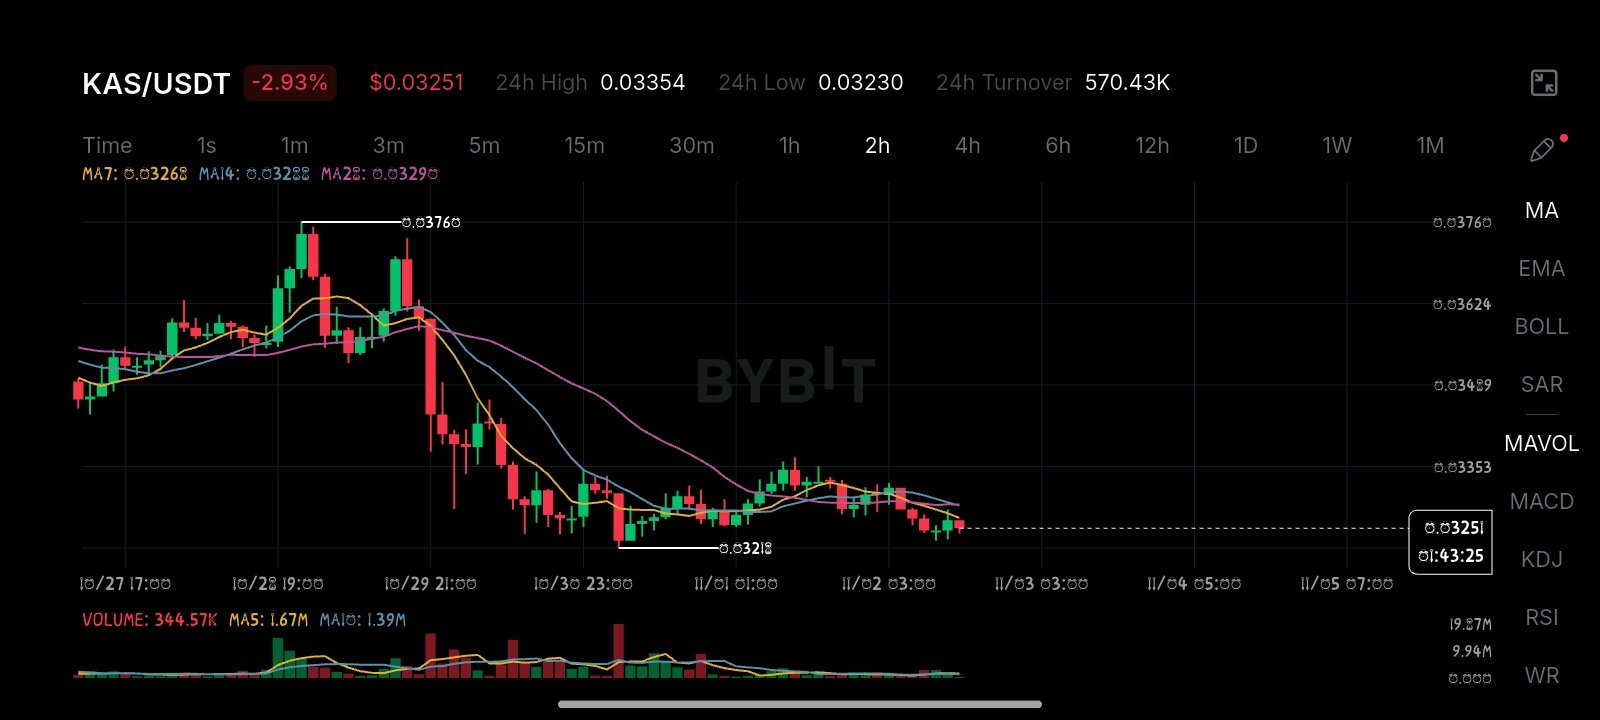
$KASUSDT Trading at $0.03242 | Market Analysis The broader market is sitting in Fear territory right now — Fear & Greed at 37 — and KAS is feeling it, down 2.82% on the day. That pullback is obviously what makes this interesting, innit? Looking at the 4H chart, price is currently hovering right around the $0.0324 zone, which lines up with a relatively tight support cluster across multiple methods. The Bollinger Band lower band, VWAP, and volume profile all converge around $0.0322-$0.0324, which gives that level some meaningful confluence. However, here's what makes the setup more compelling; Whale positioning sits at 1.9:1 long — not extreme, but clearly leaning bullish. The fund sentiment is also reading bullish, and the buy/sell ratio is at 2.67:1, meaning buyers are significantly outpacing sellers despite the price dip. That kind of divergence — price dropping while buying pressure stays elevated — is often a sign of accumulation rather than distribution. Funding rate is near zero at 0.00005, which tells you the trade isn't overcrowded in either direction. No one's getting squeezed, no excessive longs piling in. So yeah, It's definitely a clean slate. The resistance levels to watch are $0.0333 on the 4H and $0.0361-$0.0363 above that. A clean reclaim of $0.0333 with decent volume would be a meaningful structural shift. On the downside, a break below $0.0322 would weaken the current support thesis and put $0.0303 in play. But let's note this — open interest has dropped from 240M to 182M over the past 30 days. That means overleveraged positions have been flushed out, which tends to reduce the risk of sudden liquidation cascades. Cleaner OI environment generally supports more stable price action. The setup is conditional. If KAS holds $0.0322-$0.0324 and reclaims $0.0333, the next targets sit at $0.0361 and $0.0380. If it loses $0.0322, the thesis needs a reassessment. Entry Range: $0.0322 - $0.0328 Stop Loss: $0.0303 Target 1: $0.0333 Target 2: $0.0361 Risk:Reward: ~1:2 The fear in the market is real, but KAS's underlying buying pressure suggests this dip might not last long. @BybitX #IMPACTbyTrade #CryptoTrading
Backing Team Mark for this one. We trade $TSLA better than anyone else in the competition😎. Not even talking about the entries, the exits and the way we ride the momentum yet coz it’s proper clean and consistent, and that’s where our edge sits. Mark’s the captain and he’s different. The bloke's a proper strategic trader who reads the charts in a way no AI comes close to matching — spots the structure, the traps, the real levels before most people even notice them. However, what defines us is the way we stay calm and disciplined under pressure. No chasing, no emotional decisions, just solid process every single time❌ That’s our trading DNA. And the cooperation in the squad is next level🔥Everyone’s on the same page, sharing ideas, covering each other. That’s exactly why I reckon we can take this. Team Mark to the moon🚀🚀🚀 @BybitX #WSOTPicktoEarn10U
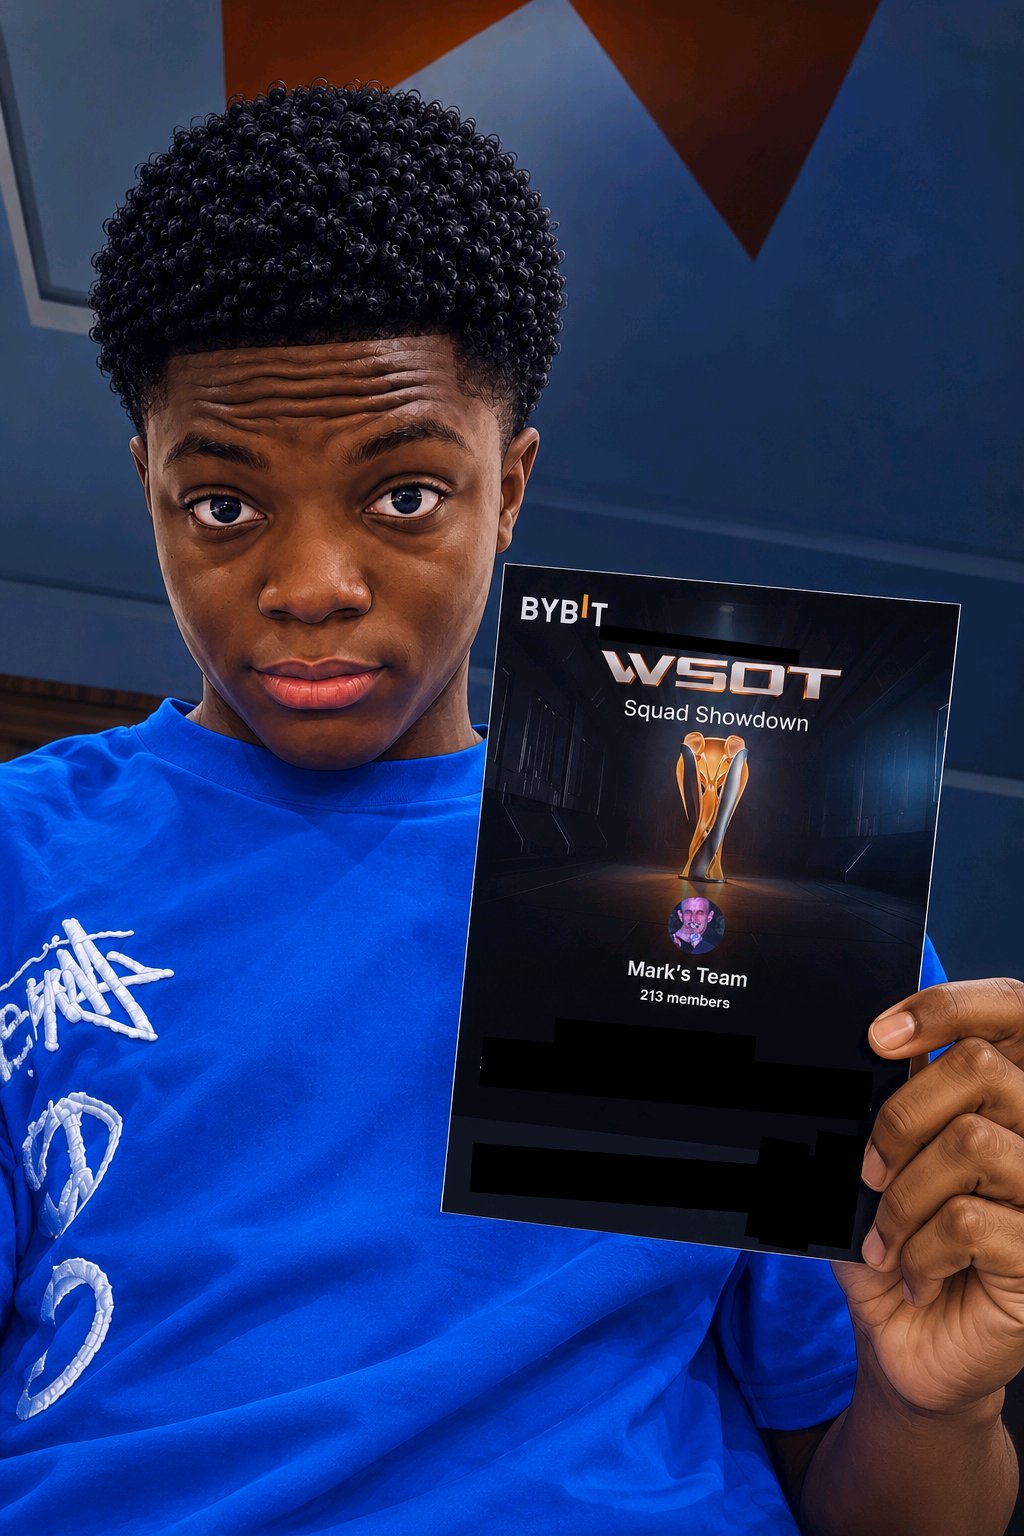

TEAM Mark to the moon!!!! let's go🚀🚀🚀

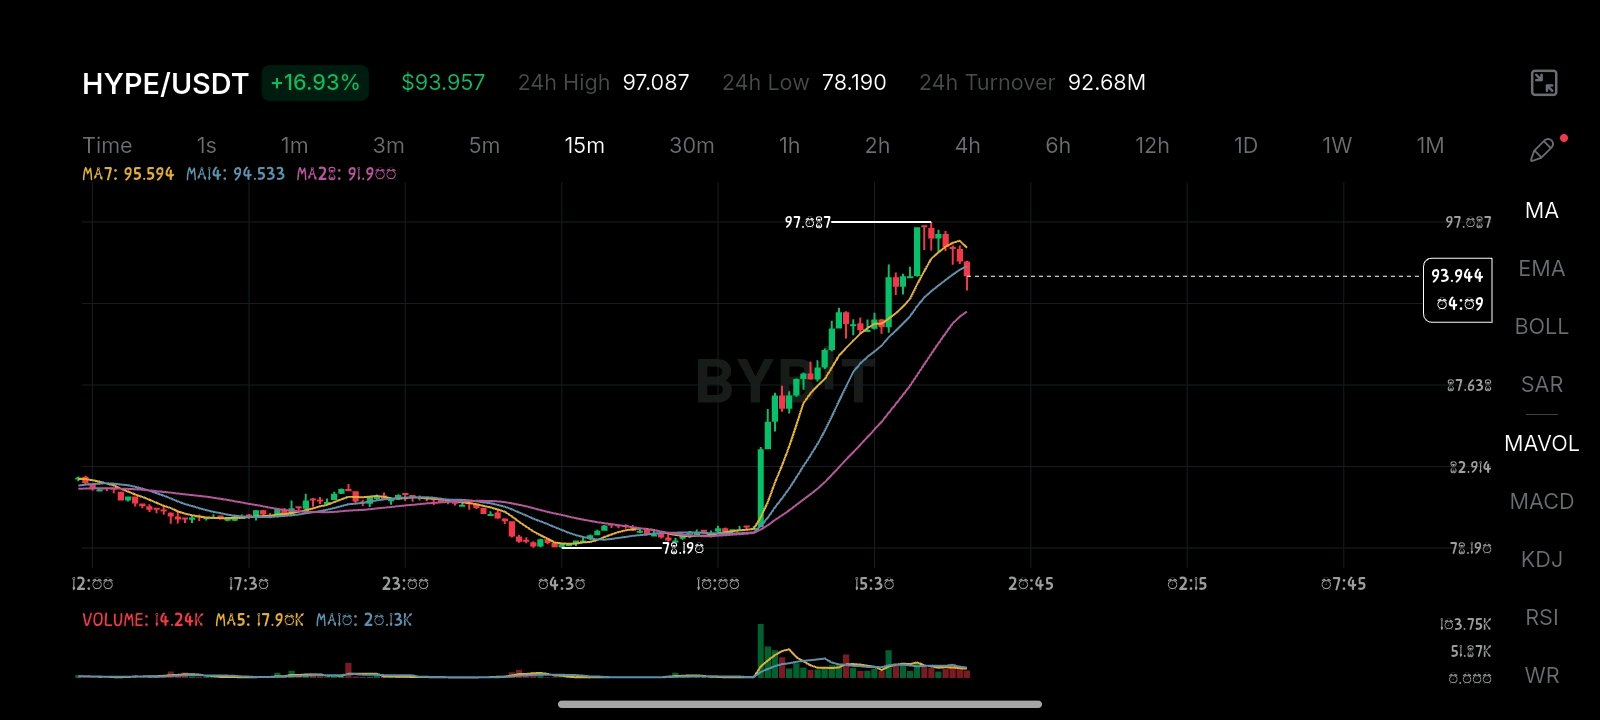
It's really not easy starting at the chart all day... $HYPEUSDT Trading at $94.04 +16.91% | Market Analysis HYPE has been running hard today, up nearly 17% in 24 hours with serious momentum behind it. Last Price $94.04 | Mark: ~$94.04 24H Change +16.91% | Volume $2.35B Whale Long/Short Ratio = 2.1:1 (whales positioned long) Fund Sentiment = Bullish Funding Rate = Near zero (balanced, not overcrowded) OI = $2.84B (stable, not overleveraged) 4H Support = $79.67 - $88.65 4H Resistance = $90.99 - $97.02 1D Resistance = $100.80 (psychological level) Trade Plan: Bias = Bullish Entry Range = $88.00 - $91.00 (pullback to 4H support zone) Stop Loss = $79.00 (below key 4H support) Target 1 = $97.00 (4H resistance) Target 2 = $100.80 (1D psychological level) Risk:Reward = 1:2 (at $91 entry) Worth watching for a healthy pullback before entry. Chasing at $94 after a 17% move is risky, wait for price to come to you. @BybitX #ByXIMPACT #IMPACTbyTrade #CryptoTrading
$BANDUSDT didn't go as planned Entered a long on BAND yesterday at $0.2118, and here's how it went. The setup looked decent at entry — Whale Long/Short Ratio = 2.9:1 Fund Sentiment = Bullish Buy/Sell Ratio = 2.2:1 4H Support = $0.203 | Target = $0.2270 Everything checked out on paper. Got in at $0.2118 with a SL at $0.1980. The price didn't even bounce. Instead, it went straight for the SL, hit $0.1980 and closed the position. Anyway, Loss taken, no sugarcoating it. The signals were there but the market had other plans. That's trading — not every setup plays out, even when the data backs it up. What I'd do differently is already circumvented. Given the tight capital, maybe waited for a confirmed bounce off support before entering rather than going straight to market. SL did its job though — protected from a deeper loss. That's the only silver lining here. Not every day is a win. You take the L, you learn, you move on 📉➡️📈 $BAND @BybitX #ByXIMPACT #IMPACTbyTrade #CryptoTrading
$BANDUSDT Trading at $0.2118 +1% | Live Trade Update Just entered a long on BAND and here's why I did so👇 Last Price $0.2118 | Mark: $0.2118 24H High $0.2181 / Low: $0.2082 | Volume $181K Price has been holding above the 4H support zone around $0.203, showing steady bullish structure with no signs of breakdown. Whale Long/Short Ratio = 2.9:1 (whales heavily positioned long) Fund Sentiment = Bullish Buy/Sell Ratio = 2.2:1 (buyers dominating) Funding Rate = Near zero (cheap to hold) 4H Support = $0.203 | 4H Resistance = $0.218-$0.227 Trade Plan: Bias = Bullish Entry = $0.2118 (market, above 4H support) Stop Loss = $0.1980 (below key support) Target = $0.2270 (4H resistance zone) Risk:Reward = 1:1.1 Leverage = 20x Stick to your SL and don't overleverage beyond your risk tolerance. Smart money is long here, so let's see if it plays out. Will BAND push to $0.2270 or reject at resistance? Drop your thoughts below 👇 @BybitX #ByXIMPACT #IMPACTbyTrade #CryptoTrading
And this is how I lost my trade😮💨 #ByXIMPACT #IMPACTbyTrade
$BANDUSDT Trading at $0.2118 +1% | Live Trade Update Just entered a long on BAND and here's why I did so👇 Last Price $0.2118 | Mark: $0.2118 24H High $0.2181 / Low: $0.2082 | Volume $181K Price has been holding above the 4H support zone around $0.203, showing steady bullish structure with no signs of breakdown. Whale Long/Short Ratio = 2.9:1 (whales heavily positioned long) Fund Sentiment = Bullish Buy/Sell Ratio = 2.2:1 (buyers dominating) Funding Rate = Near zero (cheap to hold) 4H Support = $0.203 | 4H Resistance = $0.218-$0.227 Trade Plan: Bias = Bullish Entry = $0.2118 (market, above 4H support) Stop Loss = $0.1980 (below key support) Target = $0.2270 (4H resistance zone) Risk:Reward = 1:1.1 Leverage = 20x Stick to your SL and don't overleverage beyond your risk tolerance. Smart money is long here, so let's see if it plays out. Will BAND push to $0.2270 or reject at resistance? Drop your thoughts below 👇 @BybitX #ByXIMPACT #IMPACTbyTrade #CryptoTrading
𝗪𝗵𝗮𝘁 𝗿𝗲𝗮𝗹𝗹𝘆 𝗮𝗳𝗳𝗲𝗰𝘁𝘀 𝘁𝗵𝗲 𝗺𝗮𝗿𝗸𝗲𝘁?🤔[𝗣𝗮𝗿𝘁 𝟯]
𝗦𝘂𝗽𝗽𝗼𝗿𝘁 & 𝗥𝗲𝘀𝗶𝘀𝘁𝗮𝗻𝗰𝗲, 𝗢𝗽𝗲𝗻 𝗜𝗻𝘁𝗲𝗿𝗲𝘀𝘁 & 𝗥𝗶𝘀𝗸/𝗥𝗲𝘄𝗮𝗿𝗱 𝗥𝗮𝘁𝗶𝗼 Final chapter fam 💪 Parts 1 & 2 covered smart money and crowd psychology. Now we're getting into the 𝘁𝗲𝗰𝗵𝗻𝗶𝗰𝗮𝗹 𝗮𝗻𝗱 𝗿𝗶𝘀𝗸 𝗺𝗮𝗻𝗮𝗴𝗲𝗺𝗲𝗻𝘁 side — where most traders fall short. Let's go 👇 📉📈 𝗦𝘂𝗽𝗽𝗼𝗿𝘁 & 𝗥𝗲𝘀𝗶𝘀𝘁𝗮𝗻𝗰𝗲 — 𝗧𝗵𝗲 𝗠𝗮𝗿𝗸𝗲𝘁'𝘀 𝗠𝗲𝗺𝗼𝗿𝘆 Here's something most beginners don't realise — 𝗽𝗿𝗶𝗰𝗲 𝗵𝗮𝘀 𝗺𝗲𝗺𝗼𝗿𝘆. Certain levels where price bounced or reversed in the past tend to matter again in the future. 𝗦𝘂𝗽𝗽𝗼𝗿𝘁 = a price level where buyers consistently step in. Think of it as a 𝗳𝗹𝗼𝗼𝗿. 𝗥𝗲𝘀𝗶𝘀𝘁𝗮𝗻𝗰𝗲 = a level where sellers consistently show up. Think of it as a 𝗰𝗲𝗶𝗹𝗶𝗻𝗴. 𝗪𝗵𝘆 𝗶𝘁 𝗺𝗮𝘁𝘁𝗲𝗿𝘀: Say 𝗧𝗿𝗮𝗱𝗲𝗿 𝗔 notices ONDO drops to $0.43 and bounces every time — that's support. Every time it hits $0.47, sellers appear and push it back — that's resistance. Trader A buys at $0.43, sets TP at $0.47, SL just below $0.42. 𝗧𝗶𝗴𝗵𝘁 𝗿𝗶𝘀𝗸, 𝗺𝗮𝘅 𝘂𝗽𝘀𝗶𝗱𝗲. That's literally what we did — twice — and both ONDO trades hit TP 🔥 We identify these levels using four methods — 𝗕𝗼𝗹𝗹𝗶𝗻𝗴𝗲𝗿 𝗕𝗮𝗻𝗱𝘀, 𝗙𝗶𝗯𝗼𝗻𝗮𝗰𝗰𝗶, 𝗩𝗪𝗔𝗣 and 𝗩𝗼𝗹𝘂𝗺𝗲 𝗣𝗿𝗼𝗳𝗶𝗹𝗲. When all four agree on the same level? That's called 𝗰𝗼𝗻𝗳𝗹𝘂𝗲𝗻𝗰𝗲 — the more methods agree, the stronger the level. 𝗥𝘂𝗹𝗲 𝗼𝗳 𝘁𝗵𝘂𝗺𝗯: - Always buy 𝗻𝗲𝗮𝗿 𝘀𝘂𝗽𝗽𝗼𝗿𝘁, not in the middle of nowhere ✅ - Always set TP 𝗻𝗲𝗮𝗿 𝗿𝗲𝘀𝗶𝘀𝘁𝗮𝗻𝗰𝗲, not a random number ✅ - More methods confirming = stronger level 💪 --- 📊 𝗢𝗽𝗲𝗻 𝗜𝗻𝘁𝗲𝗿𝗲𝘀𝘁 — 𝗛𝗼𝘄 𝗠𝘂𝗰𝗵 𝗠𝗼𝗻𝗲𝘆 𝗶𝘀 𝗔𝗰𝘁𝘂𝗮𝗹𝗹𝘆 𝗶𝗻 𝘁𝗵𝗲 𝗚𝗮𝗺𝗲? 𝗢𝗽𝗲𝗻 𝗜𝗻𝘁𝗲𝗿𝗲𝘀𝘁 (𝗢𝗜) is the total value of all currently open derivatives contracts on a coin. Think of it like the total number of active bets on a football match — High OI = lots of people have skin in the game. 𝗪𝗵𝘆 𝗶𝘁 𝗺𝗮𝘁𝘁𝗲𝗿𝘀: OI tells you the 𝘀𝘁𝗿𝗲𝗻𝗴𝘁𝗵 behind a price move. 𝗥𝗶𝘀𝗶𝗻𝗴 𝗽𝗿𝗶𝗰𝗲 + 𝗥𝗶𝘀𝗶𝗻𝗴 𝗢𝗜 = new money flowing in, fresh longs opening. 𝗛𝗲𝗮𝗹𝘁𝗵𝘆 𝘂𝗽𝘁𝗿𝗲𝗻𝗱 🟢 𝗥𝗶𝘀𝗶𝗻𝗴 𝗽𝗿𝗶𝗰𝗲 + 𝗙𝗮𝗹𝗹𝗶𝗻𝗴 𝗢𝗜 = shorts getting liquidated, not real buying. Called a 𝘀𝗵𝗼𝗿𝘁 𝘀𝗾𝘂𝗲𝗲𝘇𝗲 — sharp but ain't sustainable 🟡 𝗙𝗮𝗹𝗹𝗶𝗻𝗴 𝗽𝗿𝗶𝗰𝗲 + 𝗥𝗶𝘀𝗶𝗻𝗴 𝗢𝗜 = new shorts piling in aggressively. 𝗦𝘁𝗿𝗼𝗻𝗴 𝗱𝗼𝘄𝗻𝘁𝗿𝗲𝗻𝗱, avoid longs 🔴 𝗩𝗲𝗿𝘆 𝗵𝗶𝗴𝗵 𝗢𝗜 = trade overcrowded. One unexpected move = 𝗹𝗶𝗾𝘂𝗶𝗱𝗮𝘁𝗶𝗼𝗻 𝗰𝗮𝘀𝗰𝗮𝗱𝗲 ⚠️ Say 𝗧𝗿𝗮𝗱𝗲𝗿 𝗔 sees XRP with £500M in OI and a major news event drops. Everyone on the wrong side gets liquidated simultaneously — forced buying or selling moves price 10-15% in minutes. That's OI doing damage. ⚖️ 𝗥𝗶𝘀𝗸/𝗥𝗲𝘄𝗮𝗿𝗱 𝗥𝗮𝘁𝗶𝗼 — 𝗧𝗵𝗲 𝗠𝗼𝘀𝘁 𝗨𝗻𝗱𝗲𝗿𝗿𝗮𝘁𝗲𝗱 𝗖𝗼𝗻𝗰𝗲𝗽𝘁 𝗶𝗻 𝗧𝗿𝗮𝗱𝗶𝗻𝗴 Perfect analysis means nothing if your risk management is rubbish. 𝗥/𝗥 = how much you risk vs how much you stand to gain. A 𝟮:𝟭 R/R means for every $1 risked, you target $2 profit. 𝗪𝗵𝘆 𝗶𝘁 𝗺𝗮𝘁𝘁𝗲𝗿𝘀 — pure maths: 𝗧𝗿𝗮𝗱𝗲𝗿 𝗔 takes 10 trades at 𝟭:𝟭 R/R, wins 5, loses 5 → 𝗯𝗿𝗲𝗮𝗸𝘀 𝗲𝘃𝗲𝗻. Pointless. 𝗧𝗿𝗮𝗱𝗲𝗿 𝗕 takes the same 10 trades at 𝟮:𝟭 R/R, wins 5, loses 5 → wins $100, loses $50. 𝗡𝗲𝘁 𝗽𝗿𝗼𝗳𝗶𝘁 $𝟱𝟬. Same win rate, better outcome. Just from smarter R/R. Even if Trader B only wins 𝟰 𝗼𝘂𝘁 𝗼𝗳 𝟭𝟬 at 2:1 R/R — he still profits. That's why professionals can be 𝘄𝗿𝗼𝗻𝗴 𝗺𝗼𝗿𝗲 𝘁𝗵𝗮𝗻 𝗵𝗮𝗹𝗳 𝘁𝗵𝗲 𝘁𝗶𝗺𝗲 and still make money. 𝗥𝘂𝗹𝗲 𝗼𝗳 𝘁𝗵𝘂𝗺𝗯: - 𝗕𝗲𝗹𝗼𝘄 𝟭.𝟱:𝟭 = math ain't in your favour, skip it ❌ - 𝟮:𝟭 𝗮𝗻𝗱 𝗮𝗯𝗼𝘄𝗲 = ideal ✅ - 𝟯:𝟭 𝗮𝗻𝗱 𝗮𝗯𝗼𝘃𝗲 = elite, 33% win rate still keeps you profitable 🔥 - Always calculate R/R 𝗯𝗲𝗳𝗼𝗿𝗲 entering, never after 💪 That's the full series wrapped fam 🎉 Eight metrics, three parts, zero gatekeeping. Use them as a checklist — tick 5 or more before every trade and you're already operating like a pro. The market rewards 𝗽𝗿𝗲𝗽𝗮𝗿𝗮𝘁𝗶𝗼𝗻, not impulse. Stay disciplined, stay consistent 💪🔥 #ByXIMPACT #IMPACTbyTrade #TradingMetrics
𝗪𝗵𝗮𝘁 𝗿𝗲𝗮𝗹𝗹𝘆 𝗮𝗳𝗳𝗲𝗰𝘁𝘀 𝘁𝗵𝗲 𝗺𝗮𝗿𝗸𝗲𝘁?🤔 [𝗣𝗮𝗿𝘁 𝟮]
𝗕𝘂𝘆/𝗦𝗲𝗹𝗹 𝗥𝗮𝘁𝗶𝗼, 𝗠𝗮𝗿𝗸𝗲𝘁 𝗦𝗲𝗻𝘁𝗶𝗺𝗲𝗻𝘁 & 𝗙𝘂𝗻𝗱 𝗦𝗲𝗻𝘁𝗶𝗺𝗲𝗻𝘁 Missed Part 1? Go check it out — we broke down Whale L/S Ratio and Funding Rate. Today we're getting into the 𝗰𝗿𝗼𝘄𝗱 𝗽𝘀𝘆𝗰𝗵𝗼𝗹𝗼𝗴𝘆 side of trading. Because nah, trading ain't just charts — it's understanding 𝗽𝗲𝗼𝗽𝗹𝗲. Let's go 👇 📈 𝗕𝘂𝘆/𝗦𝗲𝗹𝗹 𝗥𝗮𝘁𝗶𝗼 — 𝗪𝗵𝗼'𝘀 𝗪𝗶𝗻𝗻𝗶𝗻𝗴 𝘁𝗵𝗲 𝗧𝘂𝗴 𝗼𝗳 𝗪𝗮𝗿? The 𝗕𝘂𝘆/𝗦𝗲𝗹𝗹 𝗥𝗮𝘁𝗶𝗼 measures how many buy orders are coming in versus sell orders. A ratio of 𝟰:𝟭 means 4 buyers for every 1 seller. Dead simple. 𝗪𝗵𝘆 𝗶𝘁 𝗺𝗮𝘁𝘁𝗲𝗿𝘀: Price movement is pure supply and demand. Say 𝗧𝗿𝗮𝗱𝗲𝗿 𝗔 wants to sell 100 XRP at $1.40 but there are 400 buyers all competing to buy at that price. Those buyers exhaust Trader A's order instantly and keep pushing price higher because there ain't enough sellers. That's a 𝗵𝗶𝗴𝗵 𝗯𝘂𝘆/𝘀𝗲𝗹𝗹 𝗿𝗮𝘁𝗶𝗼 doing its thing. Flip it — 𝗧𝗿𝗮𝗱𝗲𝗿 𝗕 wants to buy but 400 sellers are all trying to offload. Price keeps dropping because sellers are overwhelming buyers. Low ratio = bearish. 𝗥𝘂𝗹𝗲 𝗼𝗳 𝘁𝗵𝘂𝗺𝗯: - Above 𝟮:𝟭 = strong buying pressure ✅ - Above 𝟰:𝟭 = very aggressive buying, potential breakout 🚀 - Below 𝟭:𝟭 = sellers winning, be cautious ⚠️ - Below 𝟬.𝟱:𝟭 = heavy selling, avoid longs ❌ When we scouted XRP, the buy/sell ratio was 𝟯.𝟵:𝟭 — nearly 4 buyers per seller. That's why it caught our eye. --- 😨😏 𝗠𝗮𝗿𝗸𝗲𝘁 𝗦𝗲𝗻𝘁𝗶𝗺𝗲𝗻𝘁 — 𝗥𝗲𝗮𝗱𝗶𝗻𝗴 𝘁𝗵𝗲 𝗥𝗼𝗼𝗺 The 𝗙𝗲𝗮𝗿 & 𝗚𝗿𝗲𝗲𝗱 𝗜𝗻𝗱𝗲𝘅 is basically a mood meter for the entire crypto market, running from 0 to 100: - 𝟬-𝟮𝟱 = Extreme Fear 😨 - 𝟮𝟲-𝟰𝟱 = Fear 😟 - 𝟰𝟲-𝟱𝟱 = Neutral 😐 - 𝟱𝟲-𝟳𝟱 = Greed 😏 - 𝟳𝟲-𝟭𝟬𝟬 = Extreme Greed 🤑 𝗪𝗵𝘆 𝗶𝘁 𝗺𝗮𝘁𝘁𝗲𝗿𝘀: Markets are driven by 𝗲𝗺𝗼𝘁𝗶𝗼𝗻 more than logic — especially in crypto. Say the market crashes 20% in a week. Everyone's panicking, posting "crypto is dead." The index hits 12 — Extreme Fear. 𝗧𝗿𝗮𝗱𝗲𝗿 𝗔 panic sells at the bottom. 𝗧𝗿𝗮𝗱𝗲𝗿 𝗕 sees Extreme Fear as a buying opportunity and loads up cheap. Two weeks later the market recovers — Trader A is gutted, Trader B is counting gains. That's the Warren Buffett quote in action: 𝘉𝘦 𝘧𝘦𝘢𝘳𝘧𝘶𝘭 𝘸𝘩𝘦𝘯 𝘰𝘵𝘩𝘦𝘳𝘴 𝘢𝘳𝘦 𝘨𝘳𝘦𝘦𝘥𝘺, 𝘢𝘯𝘥 𝘨𝘳𝘦𝘦𝘥𝘺 𝘸𝘩𝘦𝘯 𝘰𝘵𝘩𝘦𝘳𝘴 𝘢𝘳𝘦 𝘧𝘦𝘢𝘳𝘧𝘶𝘍. When the index hits 85 — Extreme Greed — everyone's euphoric, telling their mums to buy Bitcoin. That's usually when smart money is 𝗾𝘂𝗶𝗲𝘁𝗹𝘆 𝘀𝗲𝗹𝗹𝗶𝗻𝗴 to all the FOMO buyers. Price peaks and dumps. 𝗥𝘂𝗹𝗲 𝗼𝗳 𝘁𝗵𝘂𝗺𝗯: - 𝗘𝘅𝘁𝗿𝗲𝗺𝗲 𝗙𝗲𝗮𝗿 (𝟬-𝟮𝟱) = potential buying opportunity 🟢 - 𝗚𝗿𝗲𝗲𝗱 (𝟱𝟲-𝟳𝟱) = sweet spot for longs, bullish but not overheated 🟡 - 𝗘𝘅𝘁𝗿𝗲𝗺𝗲 𝗚𝗿𝗲𝗲𝗱 (𝟳𝟲-𝟭𝟬𝟬) = correction likely incoming 🔴 Most of our trades were entered around 𝟱𝟯-𝟲𝟯 — neutral to greed. Not too hot, not too cold 😏 --- 🏦 𝗙𝘂𝗻𝗱 𝗦𝗲𝗻𝘁𝗶𝗺𝗲𝗻𝘁 — 𝗪𝗵𝗲𝗻 𝗜𝗻𝘀𝘁𝗶𝘁𝘂𝘁𝗶𝗼𝗻𝘀 𝗧𝗮𝗹𝗸, 𝗟𝗶𝘀𝘁𝗲𝗻 𝗙𝘂𝗻𝗱 𝗦𝗲𝗻𝘁𝗶𝗺𝗲𝗻𝘁 tracks the broader positioning of professional funds and institutions — are they bullish or bearish overall? Now you might think — ain't this the same as Whale L/S? Nah. Here's the difference: - 𝗪𝗵𝗮𝗹𝗲 𝗟/𝗦 = specifically derivatives positions - 𝗙𝘂𝗻𝗱 𝗦𝗲𝗻𝘁𝗶𝗺𝗲𝗻𝘁 = broader capital flow across spot, OTC, and portfolio allocations 𝗪𝗵𝘆 𝗶𝘁 𝗺𝗮𝘁𝘁𝗲𝗿𝘀: Say 𝗧𝗿𝗮𝗱𝗲𝗿 𝗔 manages a $500M fund and allocates just 5% into crypto — that's $25M hitting the market. Now imagine 20 funds doing the same simultaneously. That's 𝗵𝘂𝗻𝗱𝗿𝗲𝗱𝘀 𝗼𝗳 𝗺𝗶𝗹𝗹𝗶𝗼𝗻𝘀 pushing prices up before retail even notices. That's why bullish fund sentiment often comes 𝗯𝗲𝗳𝗼𝗿𝗲 major bull runs. On the flip side, when funds turn bearish and start pulling out, it creates 𝘀𝘂𝘀𝘁𝗮𝗶𝗻𝗲𝗱 𝗱𝗼𝘄𝗻𝘄𝗮𝗿𝗱 𝗽𝗿𝗲𝘀𝘀𝘂𝗿𝗲 that retail traders can't fight no matter how much they HODL. 𝗥𝘂𝗹𝗲 𝗼𝗳 𝘁𝗵𝘂𝗺𝗯: - 𝗕𝘂𝗹𝗹𝗶𝘀𝗵 = institutions buying, follow the money 🟢 - 𝗕𝗲𝗮𝗿𝗶𝘀𝗵 = smart money exiting, be very careful 🔴 - 𝗡𝗲𝘂𝘁𝗿𝗮𝗹 = wait for a clearer signal 🟡 --- That's Part 2 wrapped fam! 🔥 𝗕𝘂𝘆/𝗦𝗲𝗹𝗹 𝗥𝗮𝘁𝗶𝗼 shows the tug of war in real time. 𝗠𝗮𝗿𝗸𝗲𝘁 𝗦𝗲𝗻𝘁𝗶𝗺𝗲𝗻𝘁 reveals the crowd's emotion. 𝗙𝘂𝗻𝗱 𝗦𝗲𝗻𝘁𝗶𝗺𝗲𝗻𝘁 tells you what the biggest players are doing. Put all three together with Part 1 and you're already miles ahead of traders going purely on vibes 😏 Part 3 coming — Support & Resistance, Open Interest & Risk/Reward. Stay locked 👀 #ByXIMPACT #IMPACTbyTrade #TradingMetrics
𝗪𝗵𝗮𝘁 𝗿𝗲𝗮𝗹𝗹𝘆 𝗮𝗳𝗳𝗲𝗰𝘁𝘀 𝘁𝗵𝗲 𝗺𝗮𝗿𝗸𝗲𝘁?🤔 [𝗣𝗮𝗿𝘁 𝟮]
𝗕𝘂𝘆/𝗦𝗲𝗹𝗹 𝗥𝗮𝘁𝗶𝗼, 𝗠𝗮𝗿𝗸𝗲𝘁 𝗦𝗲𝗻𝘁𝗶𝗺𝗲𝗻𝘁 & 𝗙𝘂𝗻𝗱 𝗦𝗲𝗻𝘁𝗶𝗺𝗲𝗻𝘁 Missed Part 1? Go check it out — we broke down Whale L/S Ratio and Funding Rate. Today we're getting into the 𝗰𝗿𝗼𝘄𝗱 𝗽𝘀𝘆𝗰𝗵𝗼𝗹𝗼𝗴𝘆 side of trading. Because nah, trading ain't just charts — it's understanding 𝗽𝗲𝗼𝗽𝗹𝗲. Let's go 👇 📈 𝗕𝘂𝘆/𝗦𝗲𝗹𝗹 𝗥𝗮𝘁𝗶𝗼 — 𝗪𝗵𝗼'𝘀 𝗪𝗶𝗻𝗻𝗶𝗻𝗴 𝘁𝗵𝗲 𝗧𝘂𝗴 𝗼𝗳 𝗪𝗮𝗿? The 𝗕𝘂𝘆/𝗦𝗲𝗹𝗹 𝗥𝗮𝘁𝗶𝗼 measures how many buy orders are coming in versus sell orders. A ratio of 𝟰:𝟭 means 4 buyers for every 1 seller. Dead simple. 𝗪𝗵𝘆 𝗶𝘁 𝗺𝗮𝘁𝘁𝗲𝗿𝘀: Price movement is pure supply and demand. Say 𝗧𝗿𝗮𝗱𝗲𝗿 𝗔 wants to sell 100 XRP at $1.40 but there are 400 buyers all competing to buy at that price. Those buyers exhaust Trader A's order instantly and keep pushing price higher because there ain't enough sellers. That's a 𝗵𝗶𝗴𝗵 𝗯𝘂𝘆/𝘀𝗲𝗹𝗹 𝗿𝗮𝘁𝗶𝗼 doing its thing. Flip it — 𝗧𝗿𝗮𝗱𝗲𝗿 𝗕 wants to buy but 400 sellers are all trying to offload. Price keeps dropping because sellers are overwhelming buyers. Low ratio = bearish. 𝗥𝘂𝗹𝗲 𝗼𝗳 𝘁𝗵𝘂𝗺𝗯: - Above 𝟮:𝟭 = strong buying pressure ✅ - Above 𝟰:𝟭 = very aggressive buying, potential breakout 🚀 - Below 𝟭:𝟭 = sellers winning, be cautious ⚠️ - Below 𝟬.𝟱:𝟭 = heavy selling, avoid longs ❌ When we scouted XRP, the buy/sell ratio was 𝟯.𝟵:𝟭 — nearly 4 buyers per seller. That's why it caught our eye. --- 😨😏 𝗠𝗮𝗿𝗸𝗲𝘁 𝗦𝗲𝗻𝘁𝗶𝗺𝗲𝗻𝘁 — 𝗥𝗲𝗮𝗱𝗶𝗻𝗴 𝘁𝗵𝗲 𝗥𝗼𝗼𝗺 The 𝗙𝗲𝗮𝗿 & 𝗚𝗿𝗲𝗲𝗱 𝗜𝗻𝗱𝗲𝘅 is basically a mood meter for the entire crypto market, running from 0 to 100: - 𝟬-𝟮𝟱 = Extreme Fear 😨 - 𝟮𝟲-𝟰𝟱 = Fear 😟 - 𝟰𝟲-𝟱𝟱 = Neutral 😐 - 𝟱𝟲-𝟳𝟱 = Greed 😏 - 𝟳𝟲-𝟭𝟬𝟬 = Extreme Greed 🤑 𝗪𝗵𝘆 𝗶𝘁 𝗺𝗮𝘁𝘁𝗲𝗿𝘀: Markets are driven by 𝗲𝗺𝗼𝘁𝗶𝗼𝗻 more than logic — especially in crypto. Say the market crashes 20% in a week. Everyone's panicking, posting "crypto is dead." The index hits 12 — Extreme Fear. 𝗧𝗿𝗮𝗱𝗲𝗿 𝗔 panic sells at the bottom. 𝗧𝗿𝗮𝗱𝗲𝗿 𝗕 sees Extreme Fear as a buying opportunity and loads up cheap. Two weeks later the market recovers — Trader A is gutted, Trader B is counting gains. That's the Warren Buffett quote in action: 𝘉𝘦 𝘧𝘦𝘢𝘳𝘧𝘶𝘭 𝘸𝘩𝘦𝘯 𝘰𝘵𝘩𝘦𝘳𝘴 𝘢𝘳𝘦 𝘨𝘳𝘦𝘦𝘥𝘺, 𝘢𝘯𝘥 𝘨𝘳𝘦𝘦𝘥𝘺 𝘸𝘩𝘦𝘯 𝘰𝘵𝘩𝘦𝘳𝘴 𝘢𝘳𝘦 𝘧𝘦𝘢𝘳𝘧𝘶𝘍. When the index hits 85 — Extreme Greed — everyone's euphoric, telling their mums to buy Bitcoin. That's usually when smart money is 𝗾𝘂𝗶𝗲𝘁𝗹𝘆 𝘀𝗲𝗹𝗹𝗶𝗻𝗴 to all the FOMO buyers. Price peaks and dumps. 𝗥𝘂𝗹𝗲 𝗼𝗳 𝘁𝗵𝘂𝗺𝗯: - 𝗘𝘅𝘁𝗿𝗲𝗺𝗲 𝗙𝗲𝗮𝗿 (𝟬-𝟮𝟱) = potential buying opportunity 🟢 - 𝗚𝗿𝗲𝗲𝗱 (𝟱𝟲-𝟳𝟱) = sweet spot for longs, bullish but not overheated 🟡 - 𝗘𝘅𝘁𝗿𝗲𝗺𝗲 𝗚𝗿𝗲𝗲𝗱 (𝟳𝟲-𝟭𝟬𝟬) = correction likely incoming 🔴 Most of our trades were entered around 𝟱𝟯-𝟲𝟯 — neutral to greed. Not too hot, not too cold 😏 --- 🏦 𝗙𝘂𝗻𝗱 𝗦𝗲𝗻𝘁𝗶𝗺𝗲𝗻𝘁 — 𝗪𝗵𝗲𝗻 𝗜𝗻𝘀𝘁𝗶𝘁𝘂𝘁𝗶𝗼𝗻𝘀 𝗧𝗮𝗹𝗸, 𝗟𝗶𝘀𝘁𝗲𝗻 𝗙𝘂𝗻𝗱 𝗦𝗲𝗻𝘁𝗶𝗺𝗲𝗻𝘁 tracks the broader positioning of professional funds and institutions — are they bullish or bearish overall? Now you might think — ain't this the same as Whale L/S? Nah. Here's the difference: - 𝗪𝗵𝗮𝗹𝗲 𝗟/𝗦 = specifically derivatives positions - 𝗙𝘂𝗻𝗱 𝗦𝗲𝗻𝘁𝗶𝗺𝗲𝗻𝘁 = broader capital flow across spot, OTC, and portfolio allocations 𝗪𝗵𝘆 𝗶𝘁 𝗺𝗮𝘁𝘁𝗲𝗿𝘀: Say 𝗧𝗿𝗮𝗱𝗲𝗿 𝗔 manages a $500M fund and allocates just 5% into crypto — that's $25M hitting the market. Now imagine 20 funds doing the same simultaneously. That's 𝗵𝘂𝗻𝗱𝗿𝗲𝗱𝘀 𝗼𝗳 𝗺𝗶𝗹𝗹𝗶𝗼𝗻𝘀 pushing prices up before retail even notices. That's why bullish fund sentiment often comes 𝗯𝗲𝗳𝗼𝗿𝗲 major bull runs. On the flip side, when funds turn bearish and start pulling out, it creates 𝘀𝘂𝘀𝘁𝗮𝗶𝗻𝗲𝗱 𝗱𝗼𝘄𝗻𝘄𝗮𝗿𝗱 𝗽𝗿𝗲𝘀𝘀𝘂𝗿𝗲 that retail traders can't fight no matter how much they HODL. 𝗥𝘂𝗹𝗲 𝗼𝗳 𝘁𝗵𝘂𝗺𝗯: - 𝗕𝘂𝗹𝗹𝗶𝘀𝗵 = institutions buying, follow the money 🟢 - 𝗕𝗲𝗮𝗿𝗶𝘀𝗵 = smart money exiting, be very careful 🔴 - 𝗡𝗲𝘂𝘁𝗿𝗮𝗹 = wait for a clearer signal 🟡 --- That's Part 2 wrapped fam! 🔥 𝗕𝘂𝘆/𝗦𝗲𝗹𝗹 𝗥𝗮𝘁𝗶𝗼 shows the tug of war in real time. 𝗠𝗮𝗿𝗸𝗲𝘁 𝗦𝗲𝗻𝘁𝗶𝗺𝗲𝗻𝘁 reveals the crowd's emotion. 𝗙𝘂𝗻𝗱 𝗦𝗲𝗻𝘁𝗶𝗺𝗲𝗻𝘁 tells you what the biggest players are doing. Put all three together with Part 1 and you're already miles ahead of traders going purely on vibes 😏 Part 3 coming — Support & Resistance, Open Interest & Risk/Reward. Stay locked 👀 #ByXIMPACT #IMPACTbyTrade #TradingMetrics
𝗪𝗵𝗮𝘁 𝗿𝗲𝗮𝗹𝗹𝘆 𝗮𝗳𝗳𝗲𝗰𝘁𝘀 𝘁𝗵𝗲 𝗺𝗮𝗿𝗸𝗲𝘁?🤔 [𝗣𝗮𝗿𝘁 𝟭]
𝗪𝗵𝗮𝗹𝗲 𝗟𝗼𝗻𝗴/𝗦𝗵𝗼𝗿𝘁 𝗥𝗮𝘁𝗶𝗼 & 𝗙𝘂𝗻𝗱𝗶𝗻𝗴 𝗥𝗮𝘁𝗲 Aight, you've probably seen traders say "whales are accumulating" or "funding rate is negative" and thought — *what does that even mean?* Nah don't worry, we're breaking it down today. No finance degree needed 🚀 🐋 𝗪𝗵𝗮𝗹𝗲 𝗟𝗼𝗻𝗴/𝗦𝗵𝗼𝗿𝘁 𝗥𝗮𝘁𝗶𝗼 — 𝗙𝗼𝗹𝗹𝗼𝘄𝗶𝗻𝗴 𝘁𝗵𝗲 𝗕𝗶𝗴 𝗠𝗼𝗻𝗲𝘆 Whales are the 𝗯𝗶𝗴 𝗽𝗹𝗮𝘆𝗲𝗿𝘀 — hedge funds, institutions, people moving millions. The 𝗪𝗵𝗮𝗹𝗲 𝗟/𝗦 𝗥𝗮𝘁𝗶𝗼 tells you how they're positioned. A ratio of 𝟮.𝟯:𝟭 means for every $1 on shorts, they've got $2.30 on longs. Heavily bullish innit. 𝗪𝗵𝘆 𝗶𝘁 𝗺𝗮𝘁𝘁𝗲𝗿𝘀: Say 𝗧𝗿𝗮𝗱𝗲𝗿 𝗔 is a whale with $10M who's done deep research and gone long. 𝗧𝗿𝗮𝗱𝗲𝗿 𝗕 is retail with $200 guessing on Twitter. Who has better info? Exactly. When whales are heavily long, their buying 𝗶𝘁𝘀𝗲𝗹𝗳 pushes price up — it becomes a 𝘀𝗲𝗹𝗳-𝗳𝘂𝗹𝗳𝗶𝗹𝗹𝗶𝗻𝗴 𝗽𝗿𝗼𝗽𝗵𝗲𝗰𝘆. 𝗥𝘂𝗹𝗲 𝗼𝗳 𝘁𝗵𝘂𝗺𝗯: - Above 𝟭.𝟱:𝟭 = decent long signal ✅ - Around 𝟭:𝟭 = neutral, be careful ⚠️ - Below 𝟬.𝟳:𝟭 = whales shorting hard, avoid longs ❌ Our ONDO trade had a 𝟮.𝟯:𝟭 whale ratio. We followed the big money — and it paid off 💪 💸 𝗙𝘂𝗻𝗱𝗶𝗻𝗴 𝗥𝗮𝘁𝗲 — 𝗚𝗲𝘁𝘁𝗶𝗻𝗴 𝗣𝗮𝗶𝗱 𝘁𝗼 𝗧𝗿𝗮𝗱𝗲 In perpetual futures, there's no expiry. So exchanges use a 𝗳𝘂𝗻𝗱𝗶𝗻𝗴 𝗿𝗮𝘁𝗲 — a periodic fee paid between traders to keep futures price aligned with spot price. - 𝗣𝗼𝘀𝗶𝘁𝗶𝘃𝗲 𝗿𝗮𝘁𝗲 = longs pay shorts - 𝗡𝗲𝗴𝗮𝘁𝗶𝘃𝗲 𝗿𝗮𝘁𝗲 = shorts pay longs - 𝗡𝗲𝗮𝗿 𝘇𝗲𝗿𝗼 = balanced, cheap to hold 𝗪𝗵𝘆 𝗶𝘁 𝗺𝗮𝘁𝘁𝗲𝗿𝘀: A 𝗵𝗶𝗴𝗵 𝗽𝗼𝘀𝗶𝘁𝗶𝘃𝗲 𝗿𝗮𝘁𝗲 means longs are overcrowded — eventually too expensive to hold, so traders close = price dumps. A 𝗻𝗲𝗴𝗮𝘁𝗶𝘃𝗲 𝗿𝗮𝘁𝗲 means shorts are paying longs to stay open. They eventually can't afford it, close their positions (buy back) = price pumps. Say 𝗧𝗿𝗮𝗱𝗲𝗿 𝗔 opens a $500 long with a negative funding rate. Every 4 hours, he 𝗿𝗲𝗰𝗲𝗶𝘃𝗲𝘀 a payment from shorts. Over 2 days that's 12 payments collected — getting paid just to hold. Meanwhile shorts bleed fees and close → 𝗽𝗿𝗶𝗰𝗲 𝗽𝘂𝗺𝗽𝘀 𝗳𝘂𝗿𝘁𝗵𝗲𝗿. That's literally what happened on our ONDO trade 🔥 𝗥𝘂𝗹𝗲 𝗼𝗳 𝘁𝗵𝘂𝗺𝗯: - 𝗡𝗲𝗴𝗮𝘁𝗶𝘃𝗲 = bullish, longs get paid 🟢 - 𝗡𝗲𝗮𝗿 𝘇𝗲𝗿𝗼 = neutral, cheap to trade 🟡 - 𝗛𝗶𝗴𝗵 𝗽𝗼𝘀𝗶𝘁𝗶𝘃𝗲 = overcrowded, dump incoming 🔴 That's Part 1 done fam 🔥 𝗪𝗵𝗮𝗹𝗲 𝗿𝗮𝘁𝗶𝗼 shows you 𝘄𝗵𝗲𝗿𝗲 smart money sits. 𝗙𝘂𝗻𝗱𝗶𝗻𝗴 𝗿𝗮𝘁𝗲 shows you 𝗵𝗼𝘄 𝗰𝗿𝗼𝘄𝗱𝗲𝗱 the trade is. Two of the most powerful signals out there — use them together 💪 Part 2 dropping soon 👀 $ONDOUSDT #IMPACTbyTrade #TradingMetrics
𝗪𝗵𝗮𝘁 𝗿𝗲𝗮𝗹𝗹𝘆 𝗮𝗳𝗳𝗲𝗰𝘁𝘀 𝘁𝗵𝗲 𝗺𝗮𝗿𝗸𝗲𝘁?🤔 [𝗣𝗮𝗿𝘁 𝟭]
𝗪𝗵𝗮𝗹𝗲 𝗟𝗼𝗻𝗴/𝗦𝗵𝗼𝗿𝘁 𝗥𝗮𝘁𝗶𝗼 & 𝗙𝘂𝗻𝗱𝗶𝗻𝗴 𝗥𝗮𝘁𝗲 Aight, you've probably seen traders say "whales are accumulating" or "funding rate is negative" and thought — *what does that even mean?* Nah don't worry, we're breaking it down today. No finance degree needed 🚀 🐋 𝗪𝗵𝗮𝗹𝗲 𝗟𝗼𝗻𝗴/𝗦𝗵𝗼𝗿𝘁 𝗥𝗮𝘁𝗶𝗼 — 𝗙𝗼𝗹𝗹𝗼𝘄𝗶𝗻𝗴 𝘁𝗵𝗲 𝗕𝗶𝗴 𝗠𝗼𝗻𝗲𝘆 Whales are the 𝗯𝗶𝗴 𝗽𝗹𝗮𝘆𝗲𝗿𝘀 — hedge funds, institutions, people moving millions. The 𝗪𝗵𝗮𝗹𝗲 𝗟/𝗦 𝗥𝗮𝘁𝗶𝗼 tells you how they're positioned. A ratio of 𝟮.𝟯:𝟭 means for every $1 on shorts, they've got $2.30 on longs. Heavily bullish innit. 𝗪𝗵𝘆 𝗶𝘁 𝗺𝗮𝘁𝘁𝗲𝗿𝘀: Say 𝗧𝗿𝗮𝗱𝗲𝗿 𝗔 is a whale with $10M who's done deep research and gone long. 𝗧𝗿𝗮𝗱𝗲𝗿 𝗕 is retail with $200 guessing on Twitter. Who has better info? Exactly. When whales are heavily long, their buying 𝗶𝘁𝘀𝗲𝗹𝗳 pushes price up — it becomes a 𝘀𝗲𝗹𝗳-𝗳𝘂𝗹𝗳𝗶𝗹𝗹𝗶𝗻𝗴 𝗽𝗿𝗼𝗽𝗵𝗲𝗰𝘆. 𝗥𝘂𝗹𝗲 𝗼𝗳 𝘁𝗵𝘂𝗺𝗯: - Above 𝟭.𝟱:𝟭 = decent long signal ✅ - Around 𝟭:𝟭 = neutral, be careful ⚠️ - Below 𝟬.𝟳:𝟭 = whales shorting hard, avoid longs ❌ Our ONDO trade had a 𝟮.𝟯:𝟭 whale ratio. We followed the big money — and it paid off 💪 💸 𝗙𝘂𝗻𝗱𝗶𝗻𝗴 𝗥𝗮𝘁𝗲 — 𝗚𝗲𝘁𝘁𝗶𝗻𝗴 𝗣𝗮𝗶𝗱 𝘁𝗼 𝗧𝗿𝗮𝗱𝗲 In perpetual futures, there's no expiry. So exchanges use a 𝗳𝘂𝗻𝗱𝗶𝗻𝗴 𝗿𝗮𝘁𝗲 — a periodic fee paid between traders to keep futures price aligned with spot price. - 𝗣𝗼𝘀𝗶𝘁𝗶𝘃𝗲 𝗿𝗮𝘁𝗲 = longs pay shorts - 𝗡𝗲𝗴𝗮𝘁𝗶𝘃𝗲 𝗿𝗮𝘁𝗲 = shorts pay longs - 𝗡𝗲𝗮𝗿 𝘇𝗲𝗿𝗼 = balanced, cheap to hold 𝗪𝗵𝘆 𝗶𝘁 𝗺𝗮𝘁𝘁𝗲𝗿𝘀: A 𝗵𝗶𝗴𝗵 𝗽𝗼𝘀𝗶𝘁𝗶𝘃𝗲 𝗿𝗮𝘁𝗲 means longs are overcrowded — eventually too expensive to hold, so traders close = price dumps. A 𝗻𝗲𝗴𝗮𝘁𝗶𝘃𝗲 𝗿𝗮𝘁𝗲 means shorts are paying longs to stay open. They eventually can't afford it, close their positions (buy back) = price pumps. Say 𝗧𝗿𝗮𝗱𝗲𝗿 𝗔 opens a $500 long with a negative funding rate. Every 4 hours, he 𝗿𝗲𝗰𝗲𝗶𝘃𝗲𝘀 a payment from shorts. Over 2 days that's 12 payments collected — getting paid just to hold. Meanwhile shorts bleed fees and close → 𝗽𝗿𝗶𝗰𝗲 𝗽𝘂𝗺𝗽𝘀 𝗳𝘂𝗿𝘁𝗵𝗲𝗿. That's literally what happened on our ONDO trade 🔥 𝗥𝘂𝗹𝗲 𝗼𝗳 𝘁𝗵𝘂𝗺𝗯: - 𝗡𝗲𝗴𝗮𝘁𝗶𝘃𝗲 = bullish, longs get paid 🟢 - 𝗡𝗲𝗮𝗿 𝘇𝗲𝗿𝗼 = neutral, cheap to trade 🟡 - 𝗛𝗶𝗴𝗵 𝗽𝗼𝘀𝗶𝘁𝗶𝘃𝗲 = overcrowded, dump incoming 🔴 That's Part 1 done fam 🔥 𝗪𝗵𝗮𝗹𝗲 𝗿𝗮𝘁𝗶𝗼 shows you 𝘄𝗵𝗲𝗿𝗲 smart money sits. 𝗙𝘂𝗻𝗱𝗶𝗻𝗴 𝗿𝗮𝘁𝗲 shows you 𝗵𝗼𝘄 𝗰𝗿𝗼𝘄𝗱𝗲𝗱 the trade is. Two of the most powerful signals out there — use them together 💪 Part 2 dropping soon 👀 $ONDOUSDT #IMPACTbyTrade #TradingMetrics
I forgot to add $CGPTUSDT
📸 𝗪𝗵𝗲𝗻 𝘁𝗵𝗲 𝗔𝗻𝗮𝗹𝘆𝘀𝘁 𝗶𝗻 𝗬𝗼𝘂 𝗦𝗮𝘆𝘀 "𝗧𝗵𝗶𝘀 𝗶𝘀 𝗜𝘁" 𝗯𝘂𝘁 𝘁𝗵𝗲 𝗠𝗮𝗿𝗸𝗲𝘁 𝗦𝗮𝘆𝘀 "𝗡𝗮𝗵" 😭 So I did my homework this time. Like actually did it. Before pulling the trigger on $CGPT, I checked everything — ✅ Whale long/short ratio: 𝟮.𝟯:𝟭 (whales were buying!) ✅ Fund sentiment: 𝗕𝘂𝗹𝗹𝗶𝘀𝗵 ✅ Funding rate: Near zero (cheap to hold) ✅ Price sitting right at 𝟰𝗵 𝘀𝘂𝗽𝗽𝗼𝗿𝘁 ✅ Market Fear & Greed: 𝟲𝟯 — 𝗚𝗿𝗲𝗲𝗱 Everything screamed "BUY THE DIP." So I did. 344 CGPT at $0.02320, 10x leverage, clean TP at $0.02440 and SL at $0.02190. The market looked at all my analysis and said… 𝗮𝗯𝘀𝗼𝗹𝘂𝘁𝗲𝗹𝘆 𝗻𝗼𝘁. 💀 Price didn't bounce. It just kept going down slowly and painfully🥲 like it knew where my SL was and was walking towards it on purpose. I closed manually at $0.02243 before it got there — took a -$0.278 USDT loss and called it a day. Did the analysis fail? Well maybe🤷. Did the market care about my whale data? Clearly not today❌ 𝗕𝘂𝘁 𝘁𝗵𝗲 𝗹𝗲𝘀𝘀𝗼𝗻 𝗶𝘀 Not every setup plays out — even the ones that look perfect on paper. Analysis reduces risk, it doesn't eliminate it. Some days the market just has other plans, and that's okay. You take the loss, you learn, and you come back smarter. Not every day is a win, but giving up? That's never an option❌📈 $CGPT #RealTradingSpotlight
📸 𝗪𝗵𝗲𝗻 𝘁𝗵𝗲 𝗔𝗻𝗮𝗹𝘆𝘀𝘁 𝗶𝗻 𝗬𝗼𝘂 𝗦𝗮𝘆𝘀 "𝗧𝗵𝗶𝘀 𝗶𝘀 𝗜𝘁" 𝗯𝘂𝘁 𝘁𝗵𝗲 𝗠𝗮𝗿𝗸𝗲𝘁 𝗦𝗮𝘆𝘀 "𝗡𝗮𝗵" 😭 So I did my homework this time. Like actually did it. Before pulling the trigger on $CGPT, I checked everything — ✅ Whale long/short ratio: 𝟮.𝟯:𝟭 (whales were buying!) ✅ Fund sentiment: 𝗕𝘂𝗹𝗹𝗶𝘀𝗵 ✅ Funding rate: Near zero (cheap to hold) ✅ Price sitting right at 𝟰𝗵 𝘀𝘂𝗽𝗽𝗼𝗿𝘁 ✅ Market Fear & Greed: 𝟲𝟯 — 𝗚𝗿𝗲𝗲𝗱 Everything screamed "BUY THE DIP." So I did. 344 CGPT at $0.02320, 10x leverage, clean TP at $0.02440 and SL at $0.02190. The market looked at all my analysis and said… 𝗮𝗯𝘀𝗼𝗹𝘂𝘁𝗲𝗹𝘆 𝗻𝗼𝘁. 💀 Price didn't bounce. It just kept going down slowly and painfully. Like it knew where my SL was and was walking towards it on purpose. I closed manually at $0.02243 before it got there — took a -$0.278 USDT loss and called it a day. Did the analysis fail? Well maybe🤷. Did the market care about my whale data? Clearly not today❌ 𝗕𝘂𝘁 𝘁𝗵𝗲 𝗹𝗲𝘀𝘀𝗼𝗻 𝗶𝘀 Not every setup plays out — even the ones that look perfect on paper. Analysis reduces risk, it doesn't eliminate it. Some days the market just has other plans, and that's okay. You take the loss, you learn, and you come back smarter. Not every day is a win, but giving up? That's never an option❌📈 $CGPT #RealTradingSpotlight #Your Latest Trade #ByXIMPACT #ByXBEST
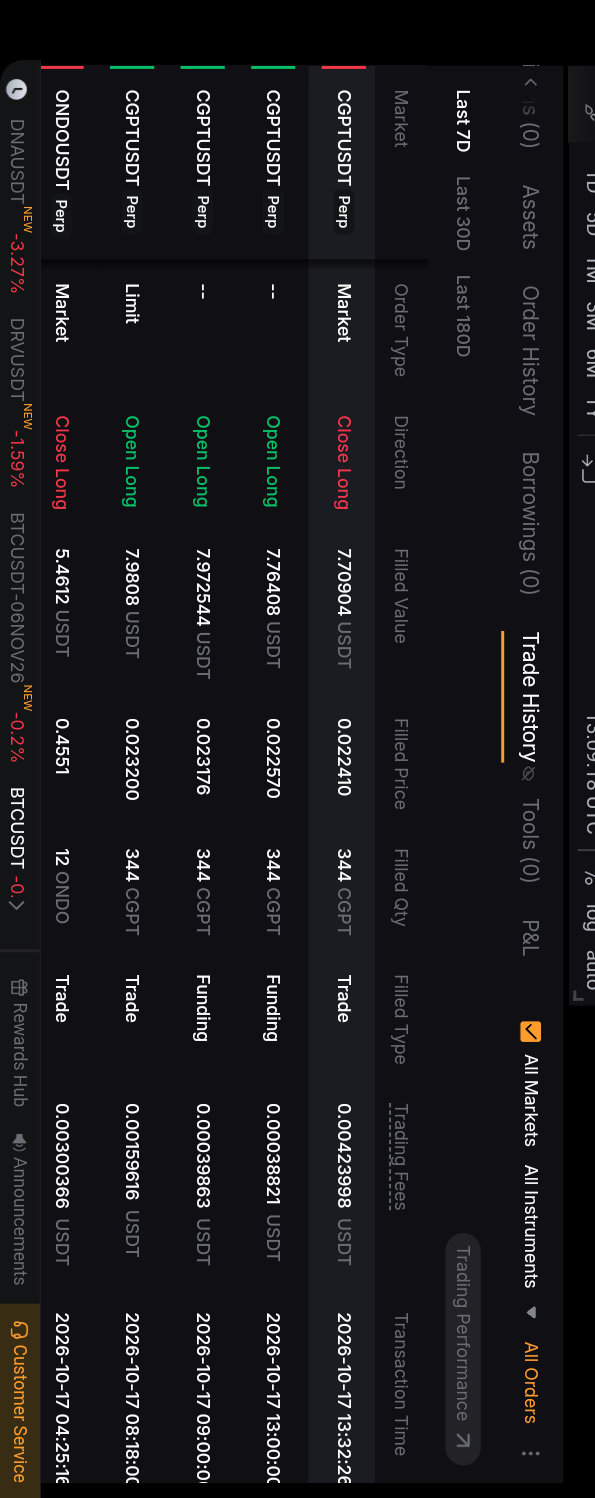
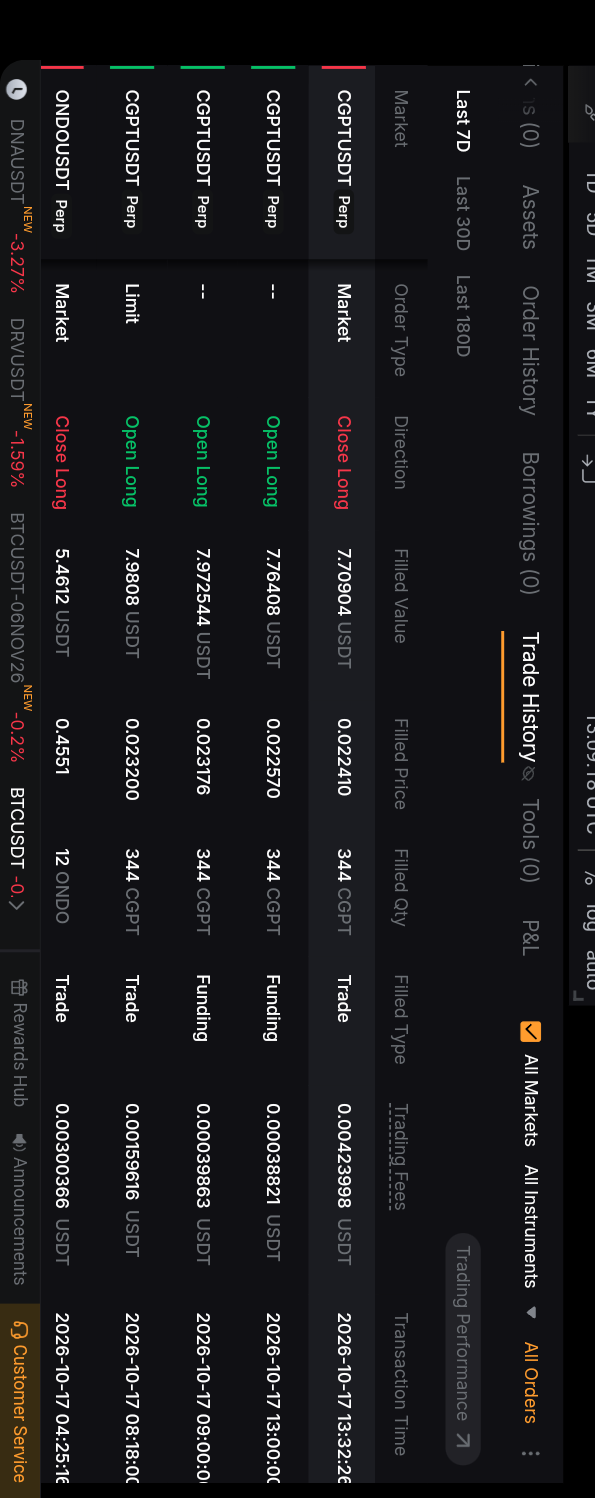
📸 𝗪𝗵𝗲𝗻 𝘁𝗵𝗲 𝗔𝗻𝗮𝗹𝘆𝘀𝘁 𝗶𝗻 𝗬𝗼𝘂 𝗦𝗮𝘆𝘀 "𝗧𝗵𝗶𝘀 𝗶𝘀 𝗜𝘁" 𝗯𝘂𝘁 𝘁𝗵𝗲 𝗠𝗮𝗿𝗸𝗲𝘁 𝗦𝗮𝘆𝘀 "𝗡𝗮𝗵" 😭 So I did my homework this time. Like actually did it. Before pulling the trigger on $CGPT, I checked everything — ✅ Whale long/short ratio: 𝟮.𝟯:𝟭 (whales were buying!) ✅ Fund sentiment: 𝗕𝘂𝗹𝗹𝗶𝘀𝗵 ✅ Funding rate: Near zero (cheap to hold) ✅ Price sitting right at 𝟰𝗵 𝘀𝘂𝗽𝗽𝗼𝗿𝘁 ✅ Market Fear & Greed: 𝟲𝟯 — 𝗚𝗿𝗲𝗲𝗱 Everything screamed "BUY THE DIP." So I did. 344 CGPT at $0.02320, 10x leverage, clean TP at $0.02440 and SL at $0.02190. The market looked at all my analysis and said… 𝗮𝗯𝘀𝗼𝗹𝘂𝘁𝗲𝗹𝘆 𝗻𝗼𝘁. 💀 Price didn't bounce. It just kept going down slowly and painfully🥲 like it knew where my SL was and was walking towards it on purpose. I closed manually at $0.02243 before it got there — took a -$0.278 USDT loss and called it a day. Did the analysis fail? Well maybe🤷. Did the market care about my whale data? Clearly not today❌ 𝗕𝘂𝘁 𝘁𝗵𝗲 𝗹𝗲𝘀𝘀𝗼𝗻 𝗶𝘀 Not every setup plays out — even the ones that look perfect on paper. Analysis reduces risk, it doesn't eliminate it. Some days the market just has other plans, and that's okay. You take the loss, you learn, and you come back smarter. Not every day is a win, but giving up? That's never an option❌📈 $CGPT #RealTradingSpotlight

⏰ Leaderboard is coming back soon.
We’re preparing the next ByX IMPACT Leaderboard with more emphasis on real trading context. In the meantime, post your market views with: - real trade screenshots - position / trade history context - Cashtag components Have suggestions for the next round? Leave them in the comments. Real trades. Real insight. More IMPACT soon.
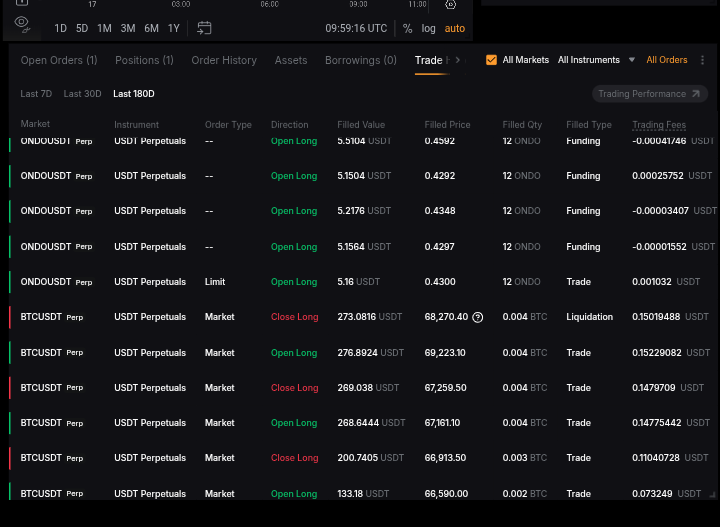
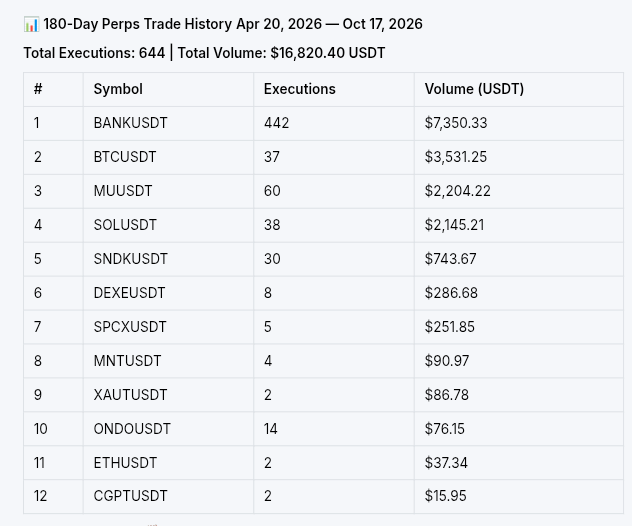
📸 𝗠𝘆 𝗕𝘆𝗯𝗶𝘁 𝗣𝗲𝗿𝗽𝘀 𝗧𝗿𝗮𝗱𝗲 𝗛𝗶𝘀𝘁𝗼𝗿𝘆 — 𝟭𝟴𝟬 𝗗𝗮𝘆𝘀 𝗥𝗲𝗰𝗮𝗽 644 executions. $16,820+ in volume. That's what 6 months of trading on Bybit looks like for me. The screenshot doesn't show every single order because that'd be a whole billboard 😅 but trust me, every trade is there in the history. I've literally traded across 12 pairs: $BANK $BTCUSDT $MU $SOLUSDT $SNDK $DEXE $SPCX $MNT $XAUT $ONDO $ETH $CGPT 𝗡𝗼𝘄, 𝘁𝗵𝗲 𝗴𝗼𝗼𝗱 𝗽𝗮𝗿𝘁 𝗶𝘀 🙂 BANK was my bread and butter — 442 executions alone. However, BTC and SOL kept things solid. My recent ONDO long was a clean setup — entered smart, moved my SL to break-even, and closed in profit. I also noticed that risk management actually works when you use it. 𝗠𝗼𝘃𝗶𝗻𝗴 𝗼𝗻 𝘁𝗼 𝘁𝗵𝗲 𝗯𝗮𝗱 𝗽𝗮𝗿𝘁 🤦 Overtrading is real. A chunk of that volume came from chasing moves instead of waiting for proper setups. Win rate wasn't pretty and the PnL shows it. So, this is how I found out that discipline was the missing piece for most of those 644 trades. 𝗪𝗵𝗮𝘁 𝗹𝗲𝘀𝘀𝗼𝗻 𝗰𝗮𝗻 𝘁𝗵𝗲𝗻 𝗯𝗲 𝗹𝗲𝗮𝗿𝗻𝘁 𝗳𝗿𝗼𝗺 𝗺𝘆 𝘁𝗿𝗮𝗱𝗲 👀 The truth is that volume actually means nothing without a plan. Entries matter, but SL management is what really saves your account. I'm learning that the hard way — and getting better at it tho🥲 Still building. Still learning. 📈
⏰ Leaderboard is coming back soon.
We’re preparing the next ByX IMPACT Leaderboard with more emphasis on real trading context. In the meantime, post your market views with: - real trade screenshots - position / trade history context - Cashtag components Have suggestions for the next round? Leave them in the comments. Real trades. Real insight. More IMPACT soon.
Please I'm looking for a guide about the 'Real Trading Spotlight'... Which hashtag should I use?
The worst experience is on web fr😩 #ByXIMPACT
Who's got talk about forex today? #ByXIMPACT