S T E P H E N
8909Like0Shares603Fans3Follow
I M crypto signal provider 100 parsent right signals lets go
I M crypto signal provider 100 parsent right signals lets go
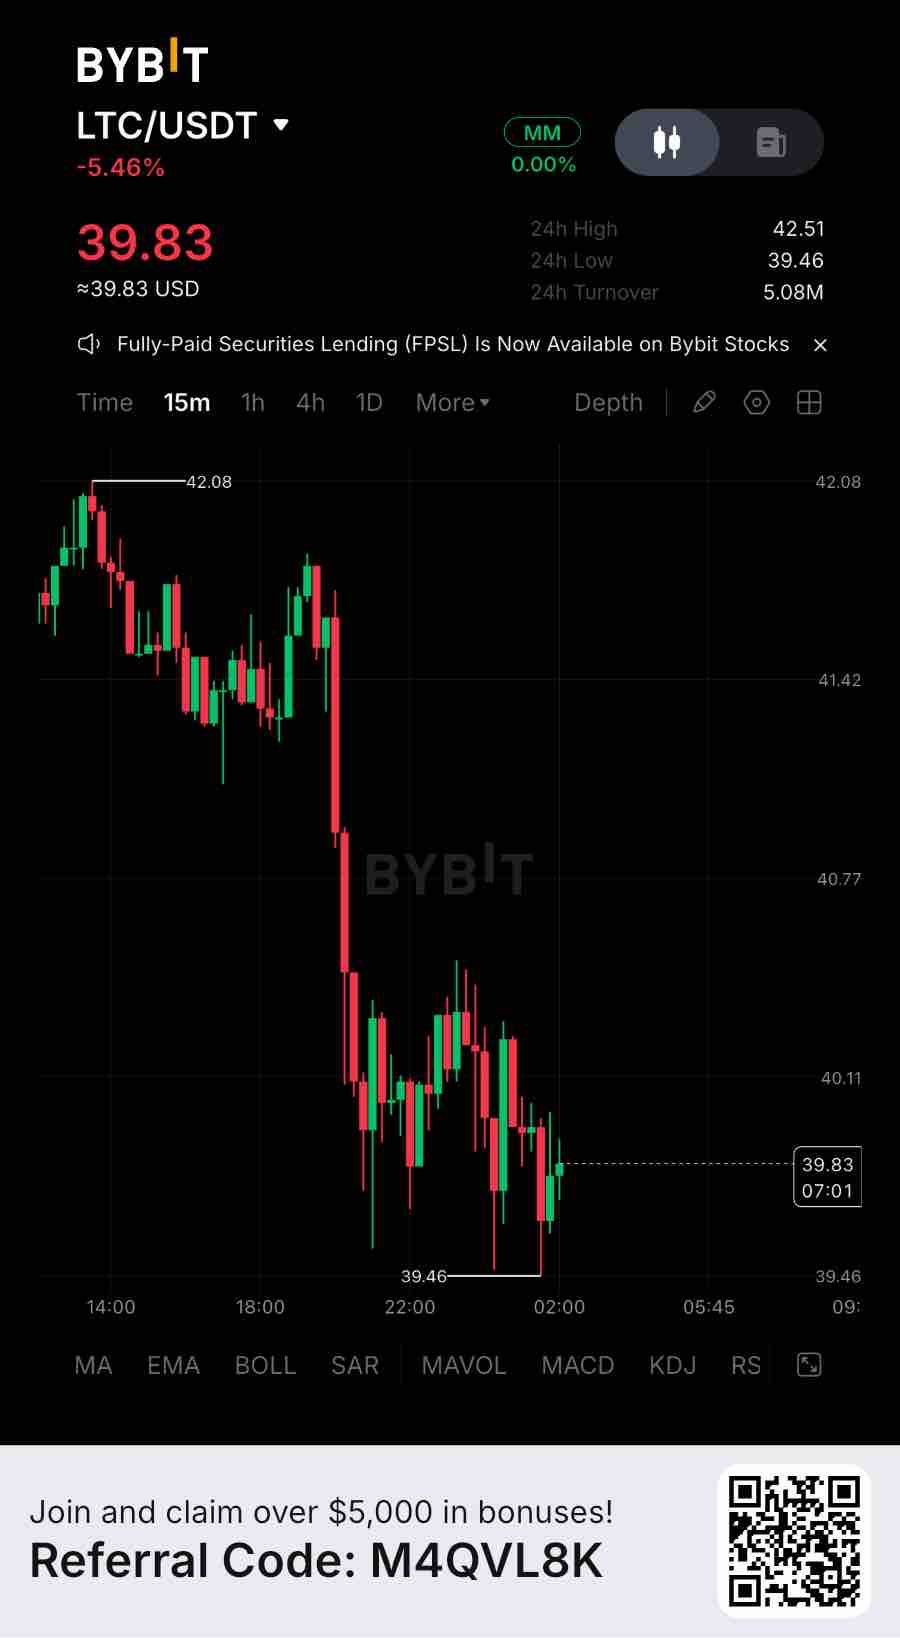
LTC: 148K Daily Transactions, ETF Outflows & the Battle Before the 2027 Halving Litecoin is showing a split between network usage and investment demand. Transactions remain high and optional privacy usage has expanded, yet ETF redemptions and leveraged selling are pressuring the market. Utility must translate into sustained LTC demand for investors. Trading around $40.22, LTC has a market capitalization near $3.13 billion. It has fallen 5.8% over 24 hours and 18.5% over seven days, leaving it more than 90% below its May 2021 all-time high of $412.96. Derivatives positioning reveals significant pressure. LTC futures open interest stands near $300.8 million, while 24-hour futures volume reached $325.1 million against $60.8 million in spot volume. That is more than five times as much activity in futures markets. Funding is negative near -0.0010%, while roughly $3.27 million in positions were liquidated over 24 hours. Long positions accounted for approximately 97% of liquidations. This points to a leveraged long unwind rather than a clean spot-led repricing. Open interest declined around 2%, suggesting positions are being closed as price falls. Negative funding shows shorts are paying longs, but does not prove a durable bottom. Institutional demand is another concern. The US spot Litecoin ETF recorded approximately 4,866 LTC in net outflows on November 19, worth about $206,000. Across the five latest completed sessions, outflows reached 4,901 LTC. The fund held approximately 216,281 LTC, just 0.28% of circulating supply. Its institutional footprint remains small. On-chain activity presents a more constructive picture. Litecoin processed roughly 148,750 transactions and recorded around 245,600 active addresses. Estimated hashrate remained near 2.64 PH/s, indicating continued mining participation. Privacy adoption is also developing. MimbleWimble Extension Blocks held approximately 519,700 LTC on November 20, around 49.5% higher than a year earlier, though below September’s record near 564,000 LTC. This represents optional confidential transactions, not proof that all Litecoin transfers are private. The deeper issue is economic security. Miners currently receive 6.25 LTC per block, while transaction fees contributed only about 0.2% of total block rewards in the latest 24-hour data. The next halving is estimated for July 2027, reducing issuance to 3.125 LTC per block. Scarcity will increase, but fee demand must strengthen to support miner economics. Technically, I am watching: * $39.80: Immediate support. * $37.90: Next downside support. * $43.05: First recovery resistance. * $44.25: Broader near-term resistance. My view is that Litecoin demonstrates meaningful payment and privacy usage, but institutional demand is limited and its fee market remains weak. Is LTC’s real-world utility enough to offset leveraged selling and a declining block subsidy, or does the network need stronger fee-generating activity before its next halving? #ByXIMPACT $LTCUSDT

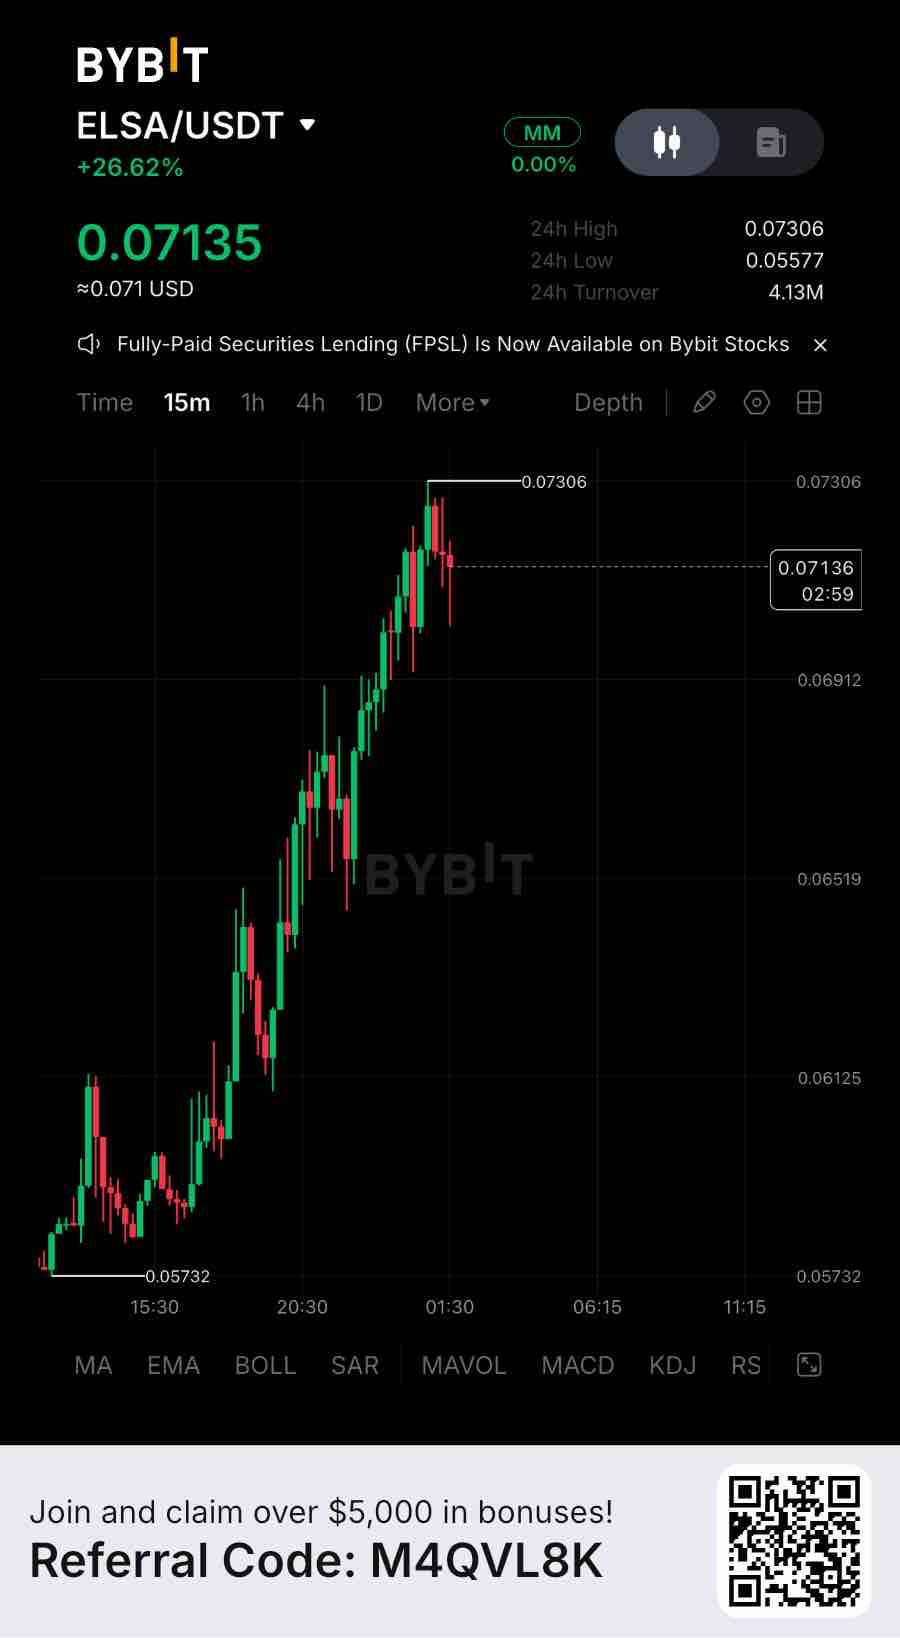
ELSA: $503M Platform Volume, 60% OI-to-Market-Cap & the AI Agent Monetization Test HeyElsa is moving beyond a conversational crypto assistant. Its thesis is to become an execution layer for AI agents, letting users research, swap, bridge and manage portfolios through simple instructions. The challenge is turning product activity into durable ELSA demand. The market is showing a rebound. ELSA trades near $0.0688, up 18.6% over 24 hours, with a market capitalization around $17.7 million and fully diluted valuation near $68.8 million. Spot volume reached $36 million, while futures volume stood near $32.4 million. The token remains 83.5% below its January 2026 all-time high of $0.4165. Derivatives positioning is expanding alongside price. Open interest climbed 41.6% to $10.7 million, around 60% of market capitalization. Funding is positive near 0.0046%, meaning leveraged longs pay shorts. About $21,400 in positions were liquidated over 24 hours, with longs accounting for 67%. This shows fresh leverage entering during the rebound. However, CoinGlass reports $12.5 million in spot net outflows. Price strength alongside negative spot flows and rising open interest raises a question: is the move supported by cash demand, or is positioning doing much of the work? Product metrics are more encouraging. HeyElsa reports 945,000-plus wallets, 18.9 million prompts processed and more than $503 million in cumulative volume. Its copilot supports activity across Ethereum, Base, Solana and other chains. The ecosystem is expanding into x402 pay-per-call DeFi APIs, Aegis for monetizing APIs to agents, and Infero, an inference gateway for open models. Token utility is designed to connect activity to ELSA. The token can pay for services and API calls, unlock fee discounts and higher usage tiers, and support governance. But the whitepaper states ELSA is a utility token, not equity, and gives holders no claim on company profits or dividends. Platform volume is not token-holder revenue. Supply remains a major variable. Maximum supply is 1 billion ELSA, while market trackers report 255.65 million circulating, or 25.6%. Allocations include 40% for community incentives, 34.49% for the foundation, 10.51% for investors and 7% for the team. Vesting continues through January 2030, leaving future releases relevant to valuation. Technically, I am watching: * $0.0553: Recent 24-hour low and immediate support. * $0.0600: Near-term recovery reference. * $0.0693–$0.0700: Current high and psychological resistance. * $0.0750: Whitepaper’s stated issue-price reference. My view is that HeyElsa has product traction and an agent-economy strategy, but the token thesis depends on repeat usage converting into ELSA-denominated fees and demand. Can its AI products turn $503M in reported platform volume into durable token utility, or will leverage and vesting dominate valuation? #IMPACTbyTrade $ELSAUSDT

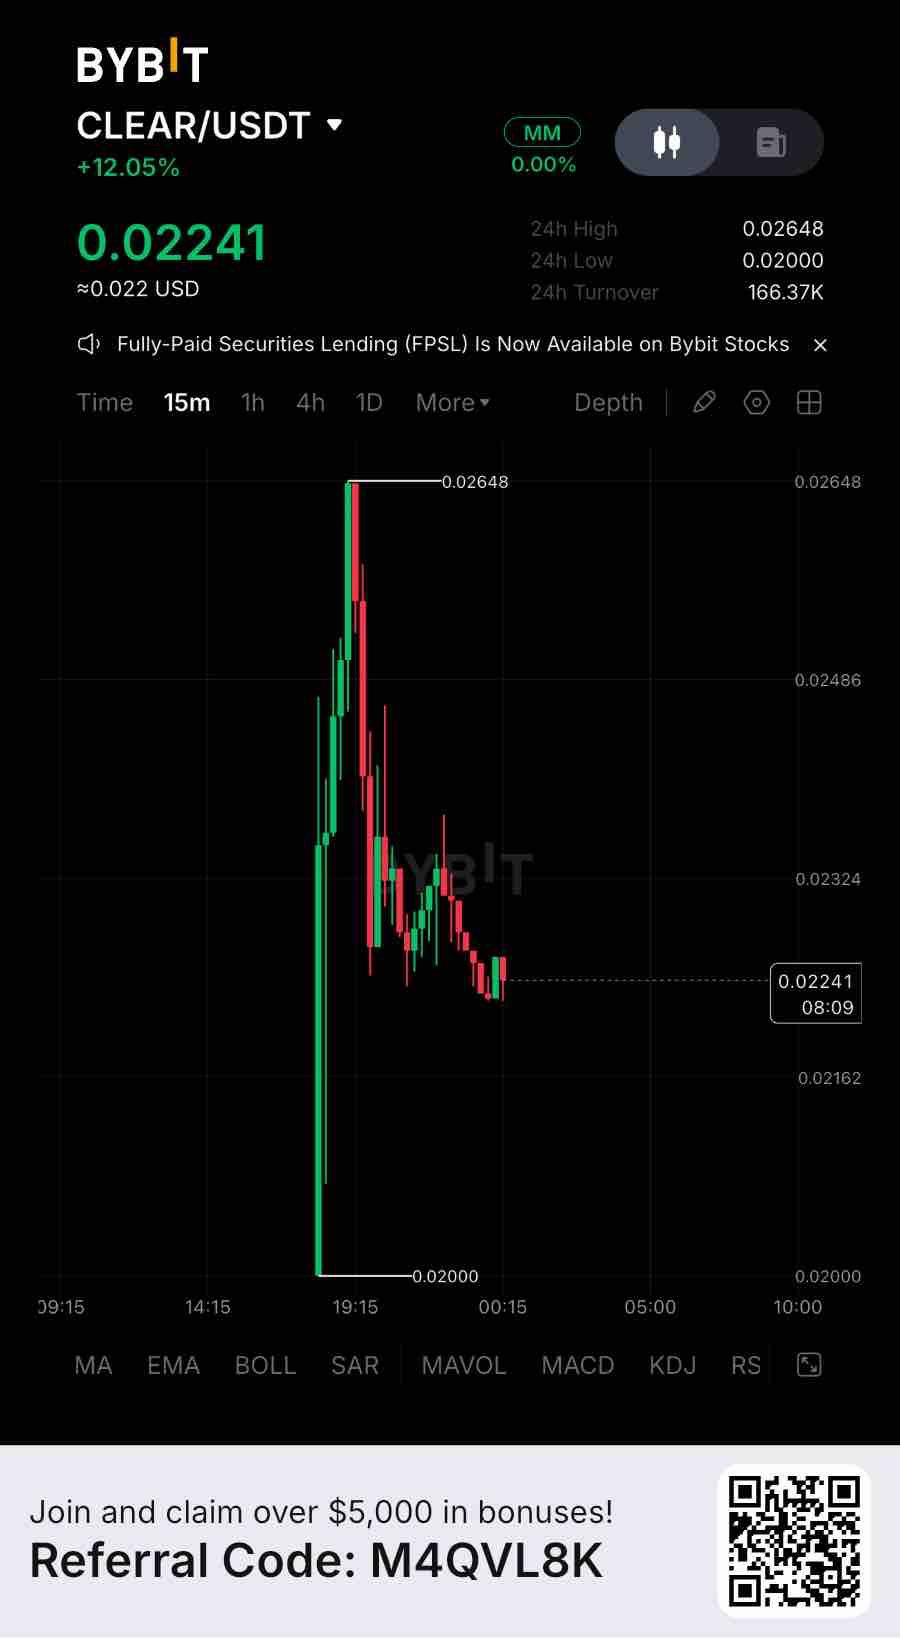
CLEAR: $965M in Institutional Loans, Ripple Partnership & the Cost of Expanding to XRPL Clearpool is entering a new phase. Its transition from CPOOL to CLEAR is more than a ticker change. The project is repositioning itself as institutional credit infrastructure, with expansion toward the XRP Ledger and tokenized real-world yield products. The opportunity is substantial, but the new tokenomics introduce a separate valuation challenge. CLEAR trades near $0.0238, with a market capitalization of approximately $26.7 million and a fully diluted valuation around $33.9 million. CoinGecko reports approximately 1.12 billion circulating tokens against a projected total supply of 1.424 billion. These figures reflect the new token structure rather than the previous CPOOL supply. The institutional lending business provides the strongest fundamental evidence. Clearpool’s official dashboard reports approximately $964.9 million in cumulative loans originated, $19.3 million in total value locked and $10.75 million in interest paid. Its Prime platform has facilitated approximately $328 million in institutional loans across 138 pools, with $10.3 million in active loans. This demonstrates that Clearpool has operated beyond a speculative DeFi narrative. Institutions have actually borrowed and repaid capital through its infrastructure. However, cumulative loan originations represent historical transaction volume, not current outstanding credit or protocol revenue. The XRP Ledger expansion introduces another catalyst. On August 20, Ripple, Cicada Partners and Clearpool announced an institutional credit initiative using RLUSD to provide working capital financing to fintech and payments companies. Clearpool supplies the lending infrastructure, Cicada handles borrower sourcing and credit underwriting, while Ripple participates as a limited partner in the fund. The architecture uses XRPL’s XLS-65 vaults and XLS-66 lending functionality. The product remains in development and Devnet testing rather than full mainnet deployment. Token economics deserve closer attention. The CPOOL-to-CLEAR migration operates at a 1:1 conversion ratio. However, the approved expansion structure introduces additional issuance. Existing holders receive 70% of the expanded allocation, while treasury and partnerships receive 15%, ecosystem incentives 10% and contributors 5%. The projected supply increases from 1 billion to approximately 1.125 billion at migration, eventually reaching around 1.429 billion over three years. The proposal also permits annual incentive issuance of 1–4%. There is a proposed offset: 50% of protocol fees will fund open-market CLEAR buybacks and permanent burns. The effectiveness of this mechanism depends entirely on actual fee generation. DeFiLlama currently tracks approximately $30,100 in 30-day protocol fees, but reports zero protocol and holder revenue in its accounting snapshot. That distinction matters. Technically, I am watching: * $0.0207: Recent trading-range support. * $0.0238: Current market reference. * $0.0261: Near-term recovery resistance. * $0.0279: Recent upper trading boundary. My assessment is that CLEAR has genuine institutional credit infrastructure and a potentially valuable XRPL opportunity. However, the expanded token supply means adoption must grow faster than dilution. Can Ripple-backed RLUSD lending create enough recurring economic activity to justify CLEAR’s expanding supply? #IMPACTbyTrade $CLEARUSDT

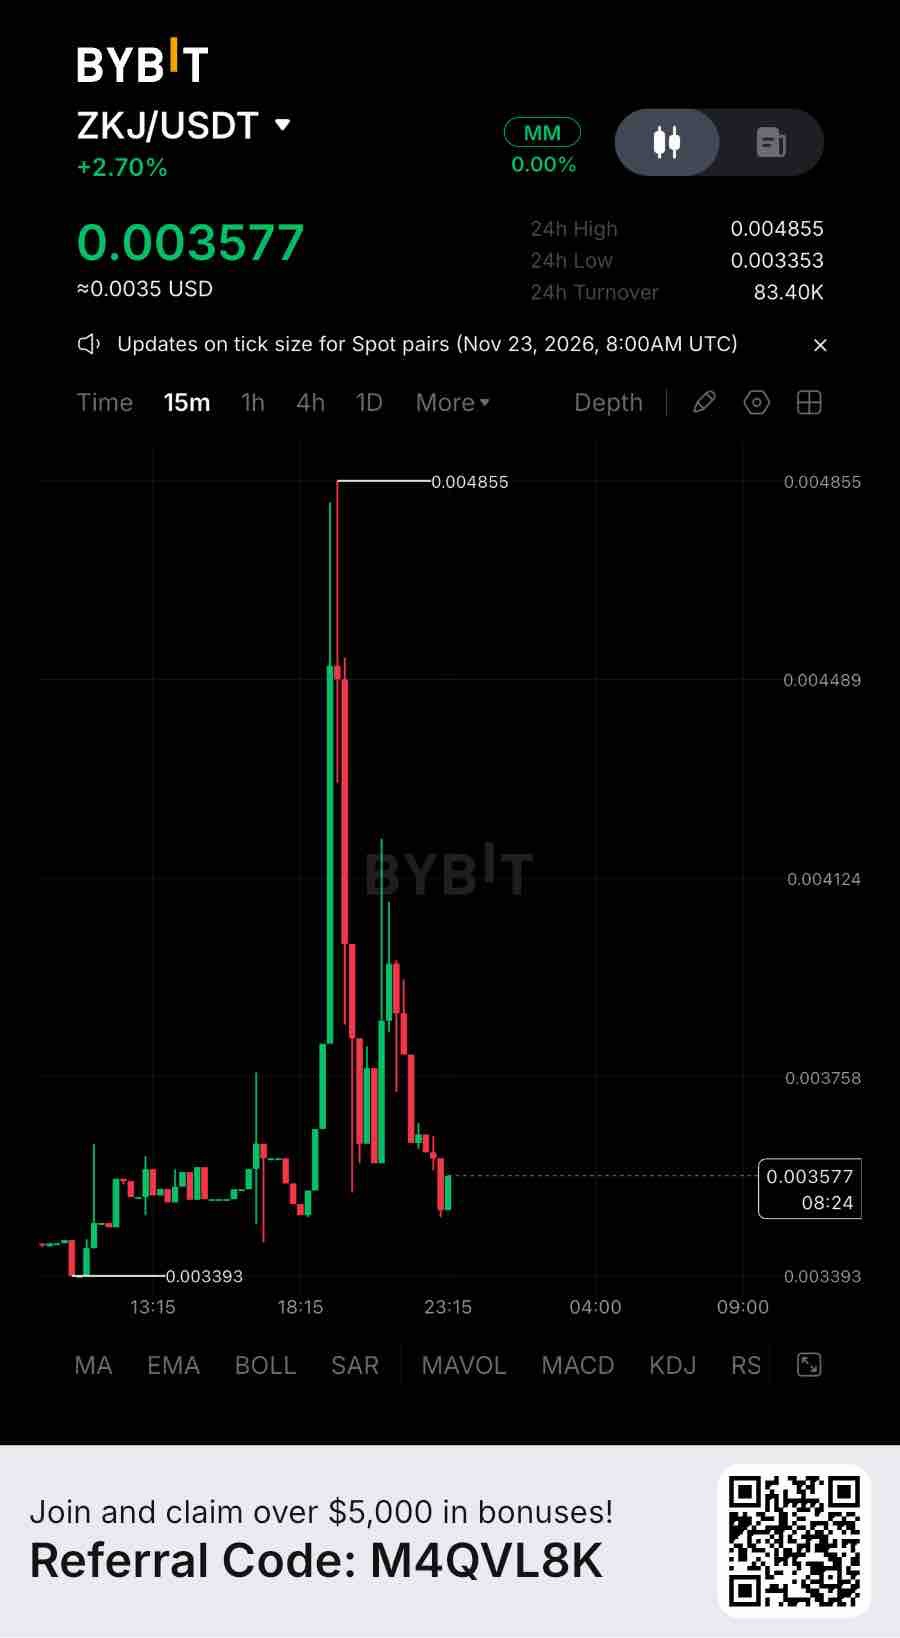
ZKJ: 40M ZK Proofs, $3.75M Open Interest & the December Supply Test Polyhedra Network is entering a crucial test: it has expanded from cross-chain infrastructure into AI verification, zero-knowledge systems and private settlement. The technology has clear use cases, but the token must prove that ecosystem growth creates sustained demand for ZKJ. Trading near $0.00366, ZKJ has a market capitalization around $2.55 million and reported 24-hour volume near $950,000. Approximately 697.5 million tokens circulate against a fixed maximum of 1 billion. The token remains roughly 99.9% below its reported $4.01 all-time high. The session range from $0.00336 to $0.00478 also shows how quickly this low-cap market reprices. Derivatives positioning is unusually important at this valuation. CoinGecko’s market snapshot shows futures open interest near $3.75 million, approximately 147% of market capitalization. Futures turnover is about 9.1 times spot volume, while the eight-hour funding rate is negative near -0.018%. This points to a market where leveraged positioning can outweigh cash demand. Negative funding means shorts are paying longs, but does not confirm that selling is exhausted. With open interest larger than circulating market value, position unwinds can produce outsized price swings. The fundamental story is broader than zkBridge. Polyhedra says zkBridge has powered tens of millions of cross-chain transactions and generated more than 40 million zero-knowledge proofs. Its technology is integrated with LayerZero’s interoperability stack, while EXPchain is designed for verifiable AI, zkML and cross-chain applications. The project’s website also lists Ocash Retail Mainnet Alpha, a privacy-preserving settlement product, as live. These milestones create potential demand channels, but proof counts are not recurring fee revenue. ZKJ is designed for EXPchain gas, zero-knowledge proof service fees, zkBridge transaction fees, staking and governance. The key question is how much activity requires users to acquire or lock ZKJ, and how much value ultimately returns to holders. Supply pressure remains relevant. Around 30% of maximum supply remains locked or scheduled for release, depending on circulating-supply methodology. The next reported unlock is December 19: approximately 27.6 million ZKJ, equal to 2.8% of total supply and roughly 4% of market capitalization. Recipients include private investors, community, foundation and insiders. Technically, I am watching: * $0.00336: Recent 24-hour low. * $0.00320: Reported all-time low. * $0.00478: Recent 24-hour high. * $0.00500: Psychological recovery level. My view is that Polyhedra has credible zero-knowledge infrastructure and a widening product ecosystem, but ZKJ depends on measurable usage, fee demand and supply absorption. Can EXPchain and Ocash turn technical progress into recurring token utility, or will leverage and unlocks dominate price discovery? #IMPACTbyTrade $ZKJUSDT

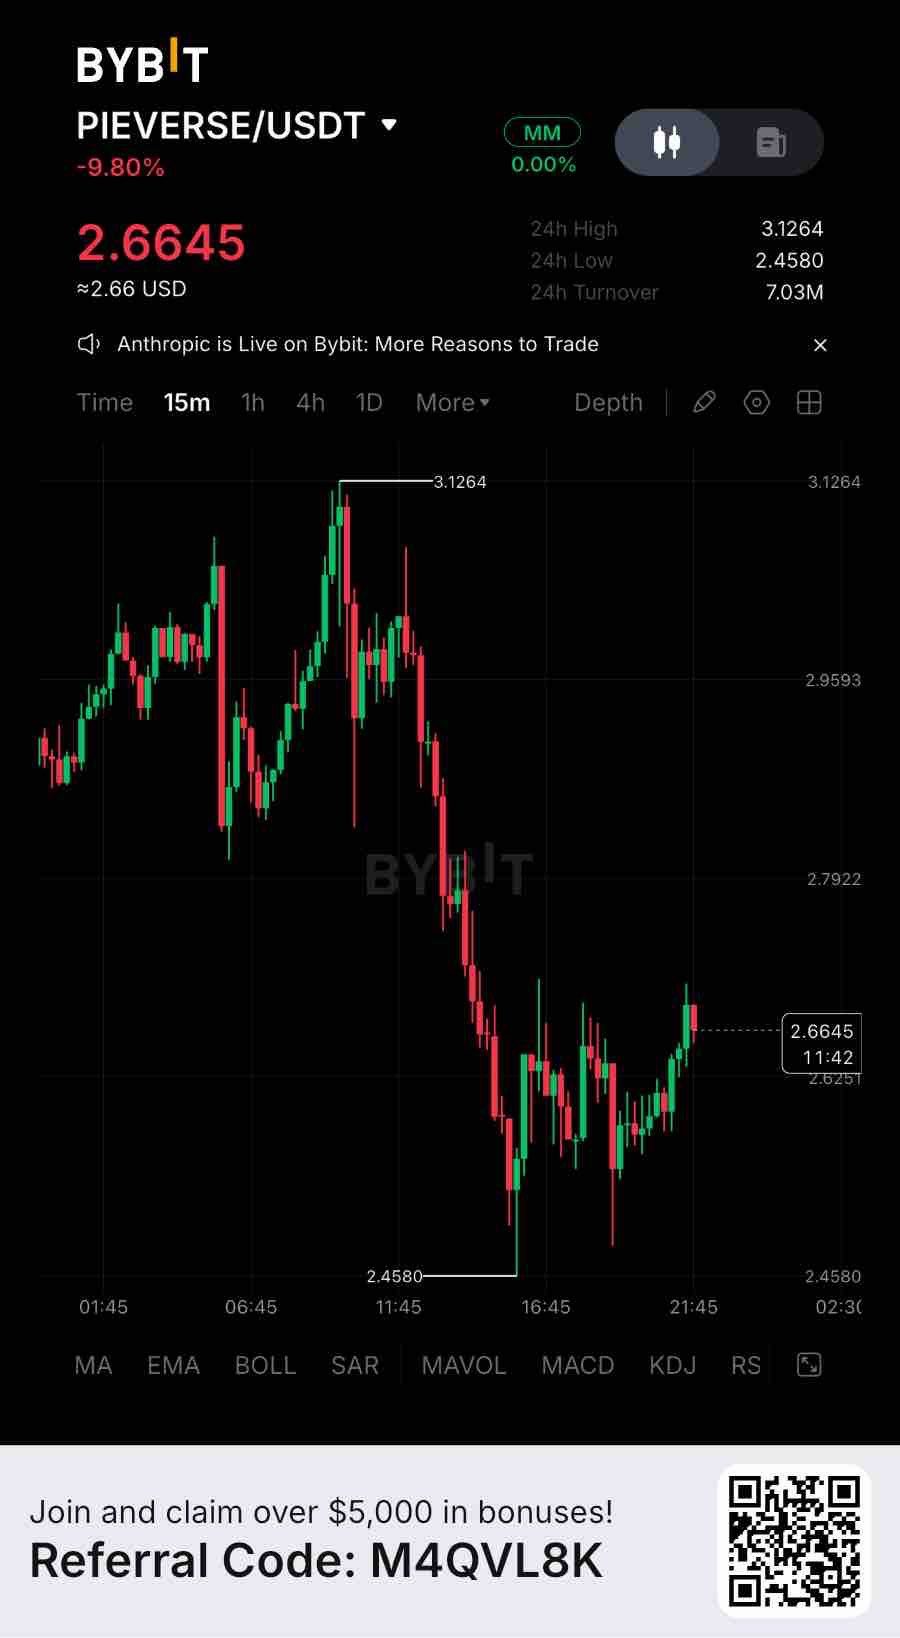
PIEVERSE: $428M Futures Volume, 35% Insider Allocation & the Agent-Payment Adoption Test Pieverse is building agent-economy payment infrastructure. Its x402b rails enable gasless stablecoin payments and timestamped, auditable receipts for people, apps and AI agents. Yet public usage data has not demonstrated recurring demand at the scale implied by its valuation. On November 20, PIEVERSE traded near $2.66, with a market capitalization around $805 million and fully diluted valuation near $2.66 billion. CoinMarketCap lists approximately 300.35 million tokens in circulation against a fixed supply of 1 billion. The token is about 26% below its November 18 all-time high of $3.59, despite remaining more than 60% higher over seven days. Derivatives positioning reveals significant pressure. Tracked futures volume reached approximately $427 million over 24 hours, compared with $53.9 million in spot volume. That is nearly eight times more activity in futures markets. Open interest stood near $144 million, funding was positive at 0.0328%, and liquidations reached about $505,000, split almost evenly between longs and shorts. Futures dominated spot turnover. Positive funding means leveraged longs pay shorts. Spot net flows showed $5.4 million in outflows, while futures recorded $11.2 million in inflows. This suggests derivatives-led positioning, not confirmed spot accumulation. The product thesis goes beyond an AI label. Pieverse’s x402b extends HTTP payments with gasless settlement through pieUSD, a wrapped USDT, while generating verifiable receipts stored through BNB Greenfield. Purr-Fect Claw connects AI agents to BNB Chain. Confidential Agents entered invite-only early access on November 16, using Intel TDX and Google Confidential Space to isolate agent environments and protect stored credentials. Token value capture remains the critical question. PIEVERSE supports governance, staking, rewards, platform payments and fee discounts, but the payment rail settles in pieUSD. More agent transactions therefore do not automatically create proportional demand for PIEVERSE. Staking, discounts and token-linked usage must become meaningful. Supply adds another risk. Team and advisor allocations account for 20%, while investors hold 15%. Their 12-month lockup ended November 14 and linear vesting has begun. A third-party tracker estimates another 33.4 million tokens, or 3.3% of total supply, for December 14, although the project has not disclosed the first insider release size. Technically, I am watching: * $2.46: Recent 24-hour low and immediate support. * $2.60–$2.70: Current trading area. * $3.13: Near-term recovery resistance. * $3.59: Recent all-time high. My view is that Pieverse has a credible agent-payment thesis, but valuation depends on verifiable payment activity, active agents and token-level value capture. Can real agent usage justify its fully diluted valuation while vesting expands available supply? #IMPACTbyTrade $PIEVERSEUSDT

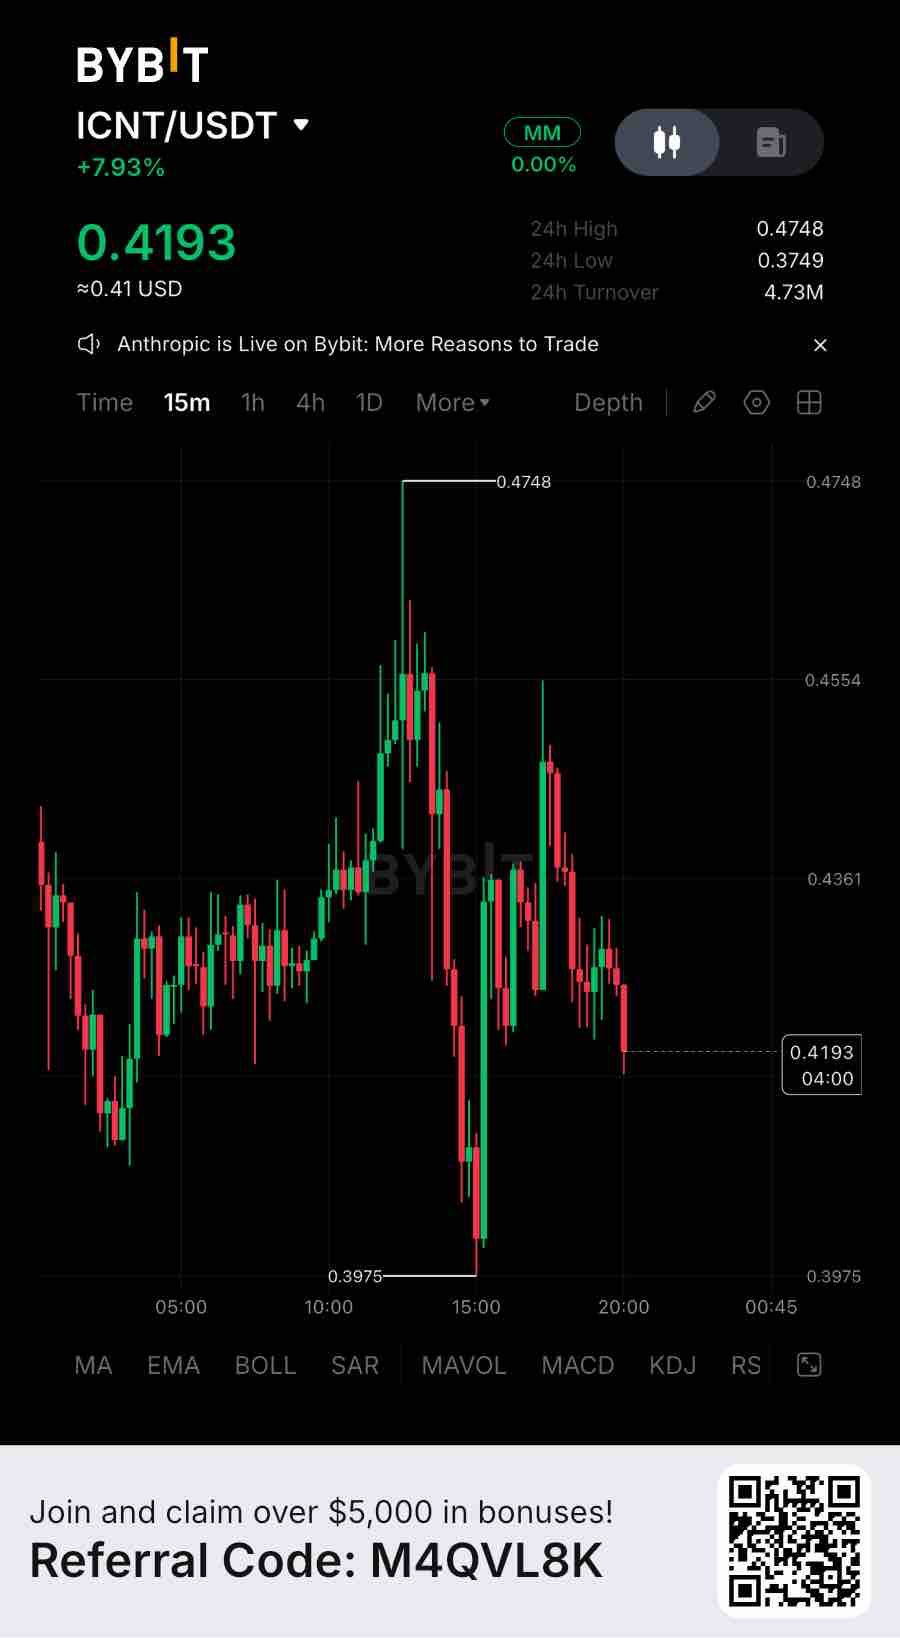
ICNT: $7M+ ARR, 42.7 PB Booked Capacity & the December Supply Test Impossible Cloud Network is connecting enterprise cloud demand with a tokenized storage and compute marketplace. The central question is whether commercial demand can translate into sustained ICNT demand, rather than simply expanding hardware capacity. On November 20, ICNT traded near $0.43, with a market capitalization around $109 million and fully diluted valuation near $298 million. Approximately 253 million tokens circulate against a fixed 700 million maximum supply. The token gained roughly 48% in seven days but remains about 27% below its reported all-time high near $0.59. Derivatives positioning reveals heavy speculative activity. CoinGlass records approximately $321 million in 24-hour futures volume against $21.36 million in spot volume. That is around 15 times more activity in futures. Open interest stands near $28.5 million, funding is positive at 0.0046%, and liquidations reached about $1.08 million, with shorts accounting for 63%. This points to leveraged participation and a short-squeeze component. However, futures turnover is not fresh spot accumulation. Spot net inflows were only around $412,000, making cash-market demand important confirmation. Operating data matters. Impossible Cloud’s network API reports 91,536 TB of active storage capacity and 42,672 TB booked, roughly 47% of available capacity. It also reports 127 active ScalerNodes, 21 HyperNodes, five hardware providers and approximately 3.7 million ICNT delegated as collateral. Booked capacity is an encouraging demand indicator, but is not independently verified utilization or realized protocol revenue. The company advertises more than $7 million in ecosystem annual recurring revenue and over 1,000 enterprise clients. These figures support the commercial thesis, but company-wide revenue does not automatically accrue to ICNT holders. Token utility is tied to network activity. Builders provide ICNT to reserve storage and compute, while hardware providers lock tokens as collateral that can be slashed for poor performance. ICNT also rewards providers and HyperNodes. Supply is fixed with no ongoing inflation, but scheduled releases still expand the tradable float. The next major supply event is December 3: approximately 19.7 million ICNT, or 2.8% of maximum supply, is scheduled to unlock. Investors and insiders receive most of this tranche. Technically, I am watching: * $0.37: Immediate support near the recent low. * $0.32–$0.35: Deeper demand zone. * $0.45–$0.475: Near-term resistance. * $0.59: Previous all-time high. My view is that ICNT has a tangible demand story, but the decisive metric is paid capacity converted into verifiable recurring protocol activity. Can enterprise demand absorb future unlocks and create durable token demand, or will leverage and expanding supply continue to dominate price discovery? #IMPACTbyTrade $ICNTUSDT

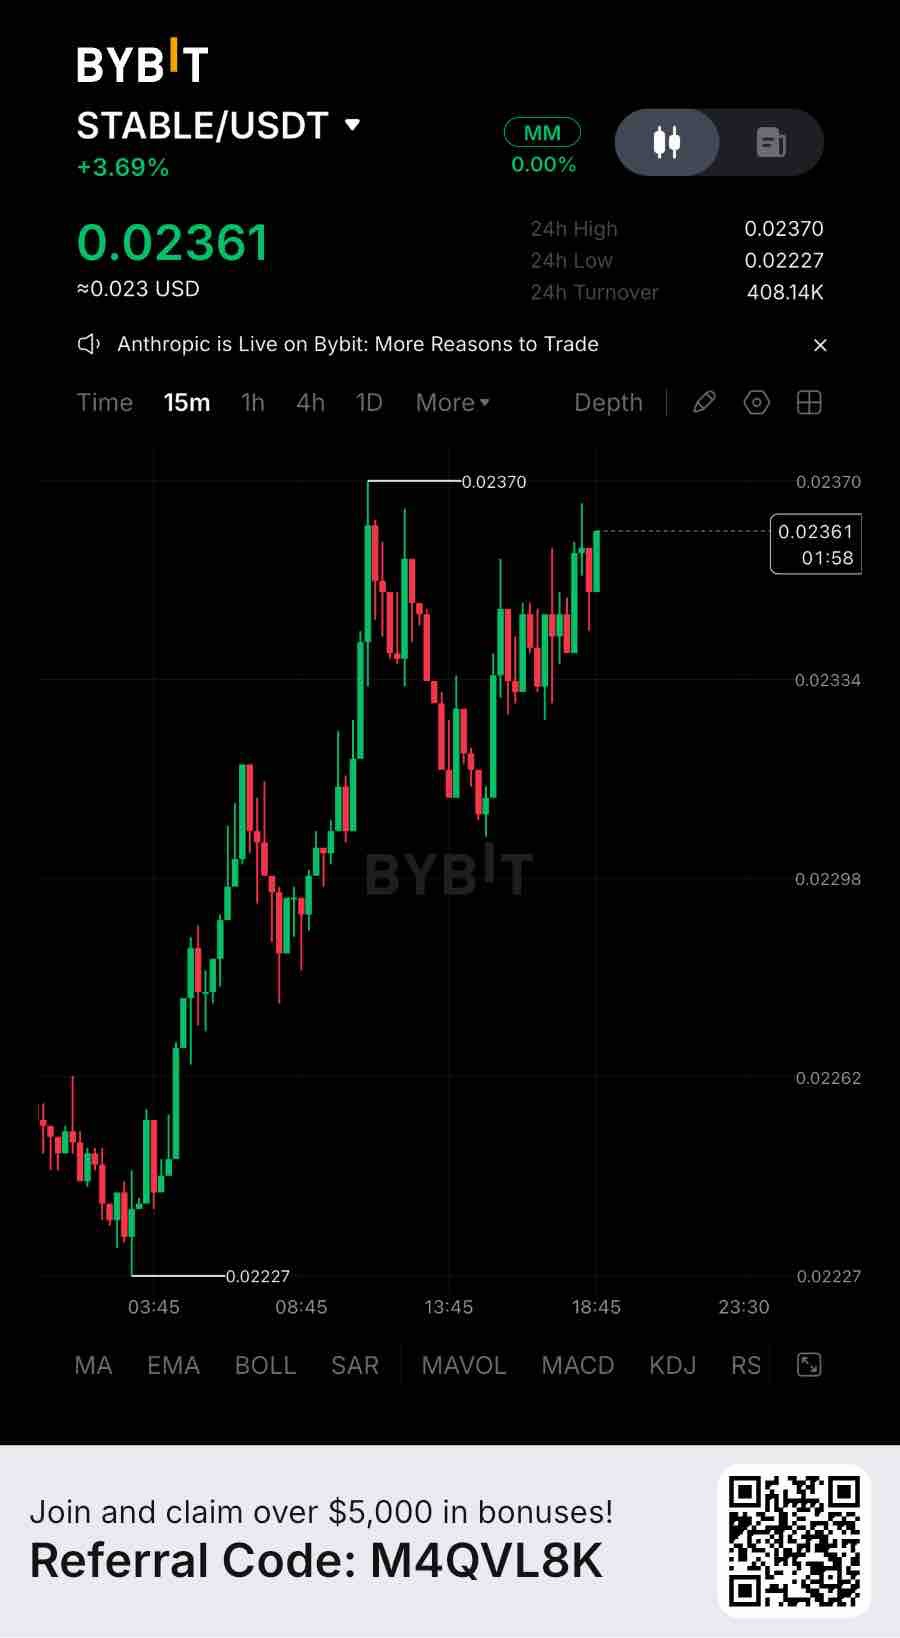
STABLE: $405M Market Cap, 18% Circulating Supply & the USDT-Gas Value-Capture Question Stable is built around a simple idea: use USDT as the native gas and settlement asset of a dedicated Layer 1. Users and institutions can move dollar liquidity without first acquiring a volatile gas token. This removes friction, but creates an important distinction between demand for the network and demand for STABLE itself. STABLE trades near $0.0225, with a market capitalization around $405 million and fully diluted valuation near $2.25 billion. It remains approximately 50% below its December 2025 all-time high of $0.04565. Only 18 billion of its fixed 100 billion supply is circulating, making dilution central to the valuation. Derivatives positioning adds another layer. Open interest stands near $10.3 million, while 24-hour futures volume is approximately $7.1 million against less than $1 million in spot volume. That is roughly 7.5 times more activity in futures than spot markets. Funding is positive near 0.01%, and around $22,000 in positions were liquidated over 24 hours, with shorts accounting for close to 89%. This suggests a short-squeeze component, but not necessarily sustained spot accumulation. Network data shows infrastructure usage, although the economic base remains small. Stable recorded approximately $71.9 million in DeFi TVL, $32.1 million in stablecoin supply, 2,610 active addresses and 130,608 transactions over 24 hours. Yet DEX volume was only around $749 in the same snapshot. That figure needs context: Stable is designed for payments and settlement, not primarily speculative trading. The stronger adoption signals will be growing stablecoin balances, payment throughput and recurring fees. Token utility is where the thesis becomes more complicated. STABLE secures the network through validator staking and supports governance, but transaction fees are paid in USDT, not STABLE. Validators may distribute USDT fees from the protocol fee vault to delegators, but this is not an automatic claim on all network revenue. Value capture depends on activity and actual fee distribution. Supply is another major overhang. With 82% of maximum supply not circulating, future vesting can materially change the float. DeFiLlama lists a December 8 unlock of approximately 1.389 billion STABLE, equivalent to about 7.7% of current circulating supply. Technically, I am watching: * $0.0222: Immediate support. * $0.0213: Next downside support. * $0.0233–$0.0240: First recovery resistance. * $0.0252: Next resistance area. My view is that Stable has a clear payments infrastructure thesis, but network adoption does not automatically translate into token value. The key test is whether settlement growth generates meaningful USDT fee distributions while absorbing an expanding supply. Can STABLE turn stablecoin network growth into durable token demand, or will dilution keep valuation ahead of actual value capture? #IMPACTbyTrade $STABLEUSDT

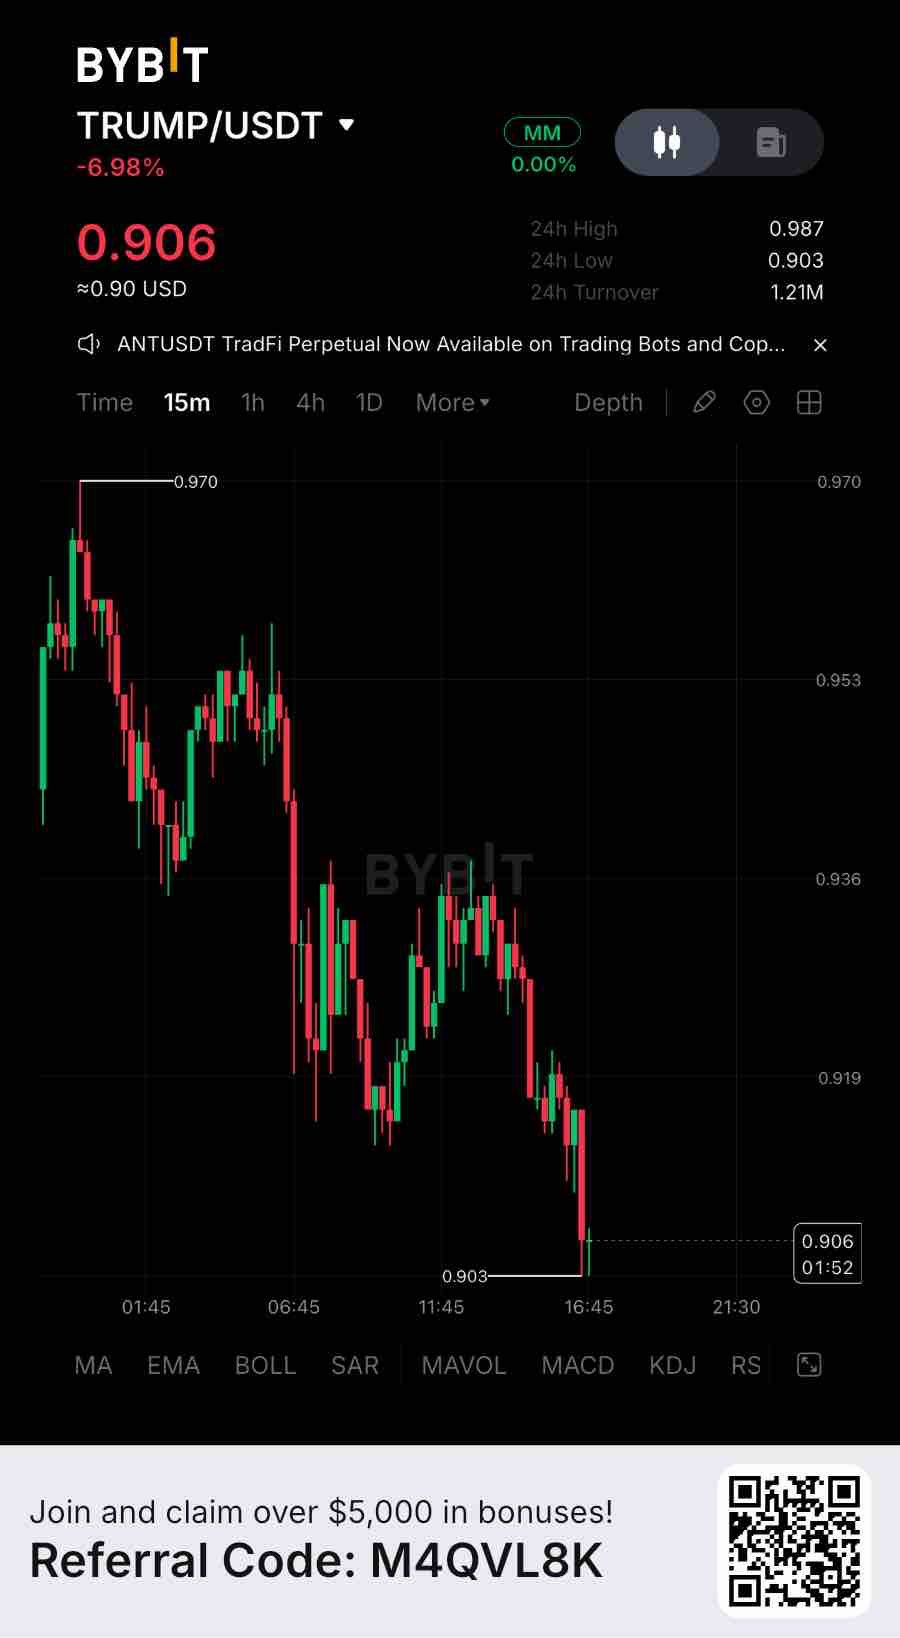
TRUMP: $100M Futures Open Interest, 80% Insider Allocation & the Next Supply Test Official TRUMP is facing a different challenge. Its valuation is driven by attention, access-based experiences and market positioning, while a large share of supply remains outside circulation. That makes sentiment and scheduled releases central to its market structure. On November 20, TRUMP traded around $0.90, with a market capitalization near $254 million and 24-hour volume around $331 million. The token remains approximately 98.8% below its January 2025 all-time high of $75.35. The longer-term drawdown shows how sharply demand has cooled since launch. Derivatives positioning reveals another source of volatility. Tracked futures open interest stands near $100 million, while 24-hour futures volume reached approximately $152 million against $14.8 million in spot volume. That is more than 10 times as much activity in futures markets. Funding was negative at approximately -0.0049%, while around $846,000 in positions were liquidated over 24 hours. Long positions accounted for roughly 78% of liquidations. This suggests leveraged bullish positioning is still being flushed out. Negative funding means shorts are paying longs, but it does not by itself confirm a durable bearish trend. What matters is how much price discovery is occurring through derivatives rather than spot demand. Token distribution creates a structural risk. TRUMP has a maximum supply of 1 billion tokens, but only about 281.9 million are circulating. The official allocation assigns 80% to Creators and CIC Digital, with 10% for liquidity and 10% for public distribution. The next scheduled release is December 18: approximately 28.7 million tokens, equal to 2.9% of total supply and about 10% of the current circulating float. The unlock is assigned entirely to insiders. The utility model also deserves scrutiny. The official TRUMP Coin Club uses time-weighted holding balances to rank participants for experiences, including a November 22 gala. However, its own terms state that holding does not guarantee any specific benefit, and the token has no payment functionality, commercial integration or redemption value. This is engagement-based utility, not a claim on revenue or cash flows. Technically, I am watching: * $0.896: Recent November low and immediate support. * $0.98–$1.00: Near-term recovery resistance. * $1.09–$1.10: Previous breakdown area. * $1.14: Broader recovery reference. My view is that TRUMP remains a sentiment-led asset with a visible supply overhang. A recovery needs sustained spot participation, not just leveraged turnover, while the December unlock adds another test for demand. Can the Coin Club narrative bring back lasting spot interest, or will insider supply and derivatives-led trading continue to dominate TRUMP’s valuation? #IMPACTbyTrade $TRUMPUSDT

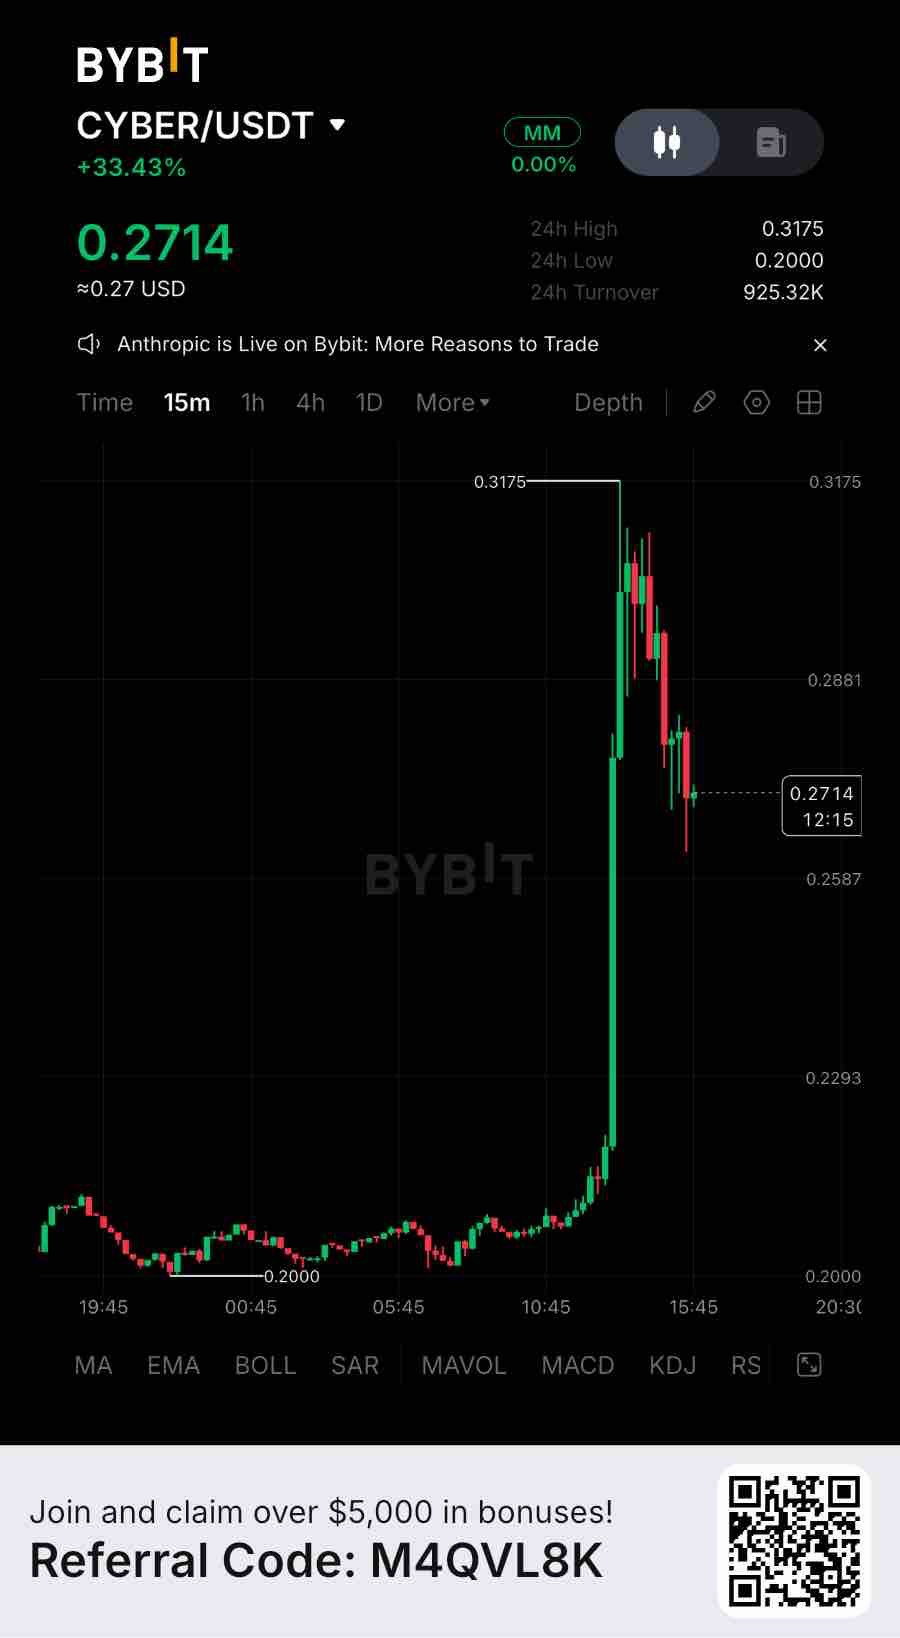
CYBER: $13M Buybacks, 94% Staking-TVL Decline & the Shift Toward Crypto AI CYBER is facing a different kind of test. The token has attracted attention after a major buyback announcement, but staking capital and measurable network activity remain weak. CYBER trades near $0.21, with a market capitalization around $17 million using CoinMarketCap’s 82.16 million circulating-supply estimate. Its 24-hour volume is near $7.7 million. It has rebounded from a fresh low near $0.20, but turnover alone does not confirm durable demand. Derivatives positioning reveals additional pressure. Futures volume recently reached approximately $11.51 million, compared with $2.09 million in spot volume. That is 5.5 times more activity in futures markets. Open interest stood near $7.56 million, while weighted funding was negative. Tracked liquidations reached about $30,700, including roughly $29,100 in long positions. This indicates leveraged positioning is influencing price discovery. Negative funding shows shorts are paying longs. In a small market, crowded trades can amplify volatility. On November 7, Cyber said it had repurchased approximately $13 million worth of CYBER over the previous year. That is substantial relative to its market capitalization. However, the team did not clarify how many tokens were burned, retained in treasury, or funded through recurring protocol revenue. A buyback is not automatically a supply reduction or evidence of sustainable value capture. On-chain data highlights the bigger weakness. DeFiLlama records stCYBER staking TVL at approximately $667,000 on November 20, down from nearly $11 million in August 2025. That is a decline of roughly 94%. Cyber L2 itself held about $2,042 in DeFi TVL and $338,700 in bridged assets on November 19. The project is also changing direction. Cyber discontinued CyberWallet and Passkey Wallet in August 2026, redirecting resources toward Cyber Network infrastructure and Surf, its crypto-focused AI copilot. This may open a new growth path, but AI adoption must translate into recurring activity, fees or token demand. Supply remains important. CYBER has a maximum supply of 100 million, although providers report different circulating-supply estimates. DeFiLlama lists a 150,000-CYBER unlock for December 14, around 0.25% of its reported float. Technically, I am watching: * $0.20: Recent low and immediate support. * $0.21–$0.22: Near-term recovery zone. * $0.24–$0.25: Previous trading area and overhead resistance. * $0.28: Broader recovery reference. My view is that the buyback is notable, but falling staking participation and thin network liquidity are harder to ignore. CYBER needs measurable user growth and verifiable service revenue before its AI pivot can support a stronger valuation. Is the $13M buyback an early sign of renewed conviction, or does CYBER still need to prove its AI strategy can generate real economic demand? #IMPACTbyTrade $CYBERUSDT

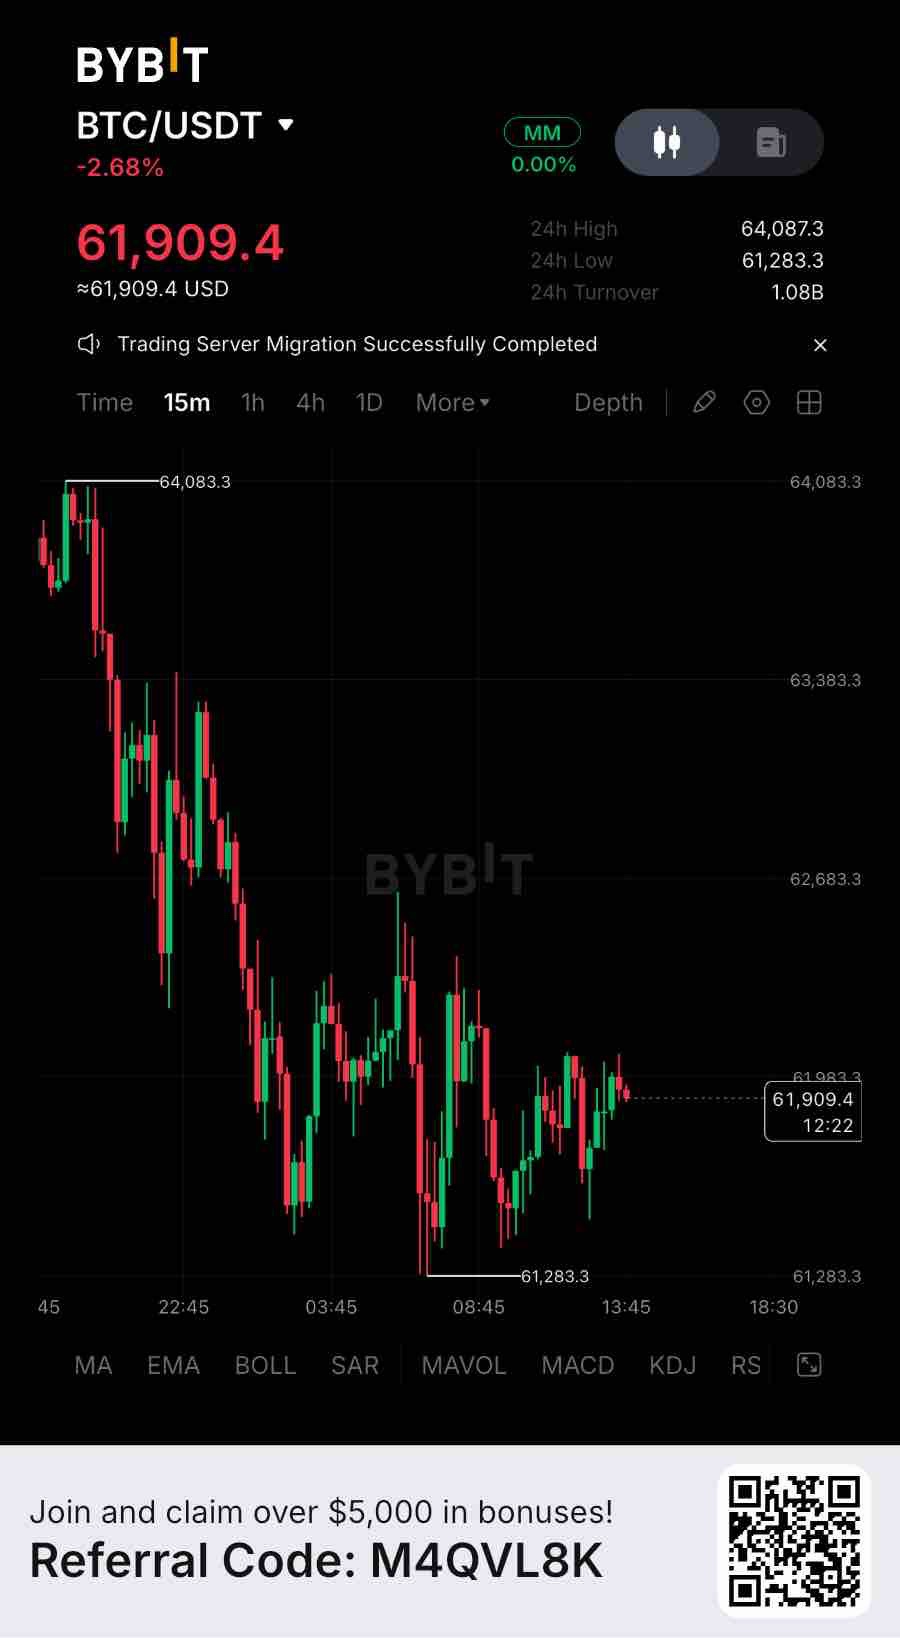
BTC: The $24B AI Mining Shift, Miner Economics & the Future of Bitcoin’s Network Security Bitcoin is facing a structural change that goes beyond its current price correction. The mining industry is increasingly competing with artificial intelligence infrastructure for capital, electricity and computing resources. This could have important consequences for Bitcoin’s long-term supply dynamics and network security. BTC is trading around $61,680, with a market capitalization near $1.24 trillion. The immediate market structure remains weak, but the developments inside the mining industry deserve closer attention. Mining profitability is becoming a serious concern. Bitcoin’s current hashprice has fallen to approximately $29 per PH/s per day, down roughly 22% over 30 days. Hashprice measures the expected daily mining revenue generated by computing power. Meanwhile, network hashrate remains around 1,006 EH/s, with mining difficulty at 134.82 trillion. The next difficulty adjustment is currently estimated at approximately +9.39%, although this estimate can change before the adjustment. This creates an interesting imbalance: mining revenue is declining while competition for block rewards remains substantial. Older mining equipment is facing increasing profitability pressure, while more efficient machines retain a competitive advantage. The AI infrastructure transition is becoming a major industry catalyst. An institutional mining-industry study published November 13 identified approximately $27 billion in capital raised by publicly listed Bitcoin miners between June 2024 and October 2026. Remarkably, approximately $24 billion was directed toward AI and high-performance computing infrastructure. Some mining companies are converting existing facilities into AI data centers rather than expanding Bitcoin mining capacity. This transition is not simply a business diversification strategy. It changes how mining companies allocate electricity, capital and computing resources. Miner selling creates another important supply dynamic. The ten largest publicly listed miners sold approximately 49,000 BTC during the first half of 2026, representing more than twice their combined mining production and approximately 60% of Bitcoin issued during that period. Some of these sales funded AI infrastructure development, debt repayment and corporate investment. This means miner distribution is increasingly influenced by capital allocation decisions outside the traditional mining business. Derivatives positioning adds another dimension. Bitcoin options open interest across major exchanges stands near $29.17 billion, with implied volatility around 46. The $70,000 zero-gamma level is particularly important because dealer hedging dynamics can change around this region. The largest options positioning is concentrated around $60,000 puts and $90,000 calls. This suggests traders are positioning for substantial price movement rather than pricing in a quiet recovery. My view is that Bitcoin’s biggest long-term challenge is not its fixed supply. It is how the mining industry adapts to changing economics while maintaining sufficient computing power to secure the network. I want to see mining profitability stabilize, miner treasury selling moderate and network security remain resilient before becoming more constructive. Can Bitcoin maintain its network security advantage while AI infrastructure attracts billions in mining-industry capital, or will this competition fundamentally reshape the economics of Bitcoin mining? #IMPACTbyTrade $BTCUSDT

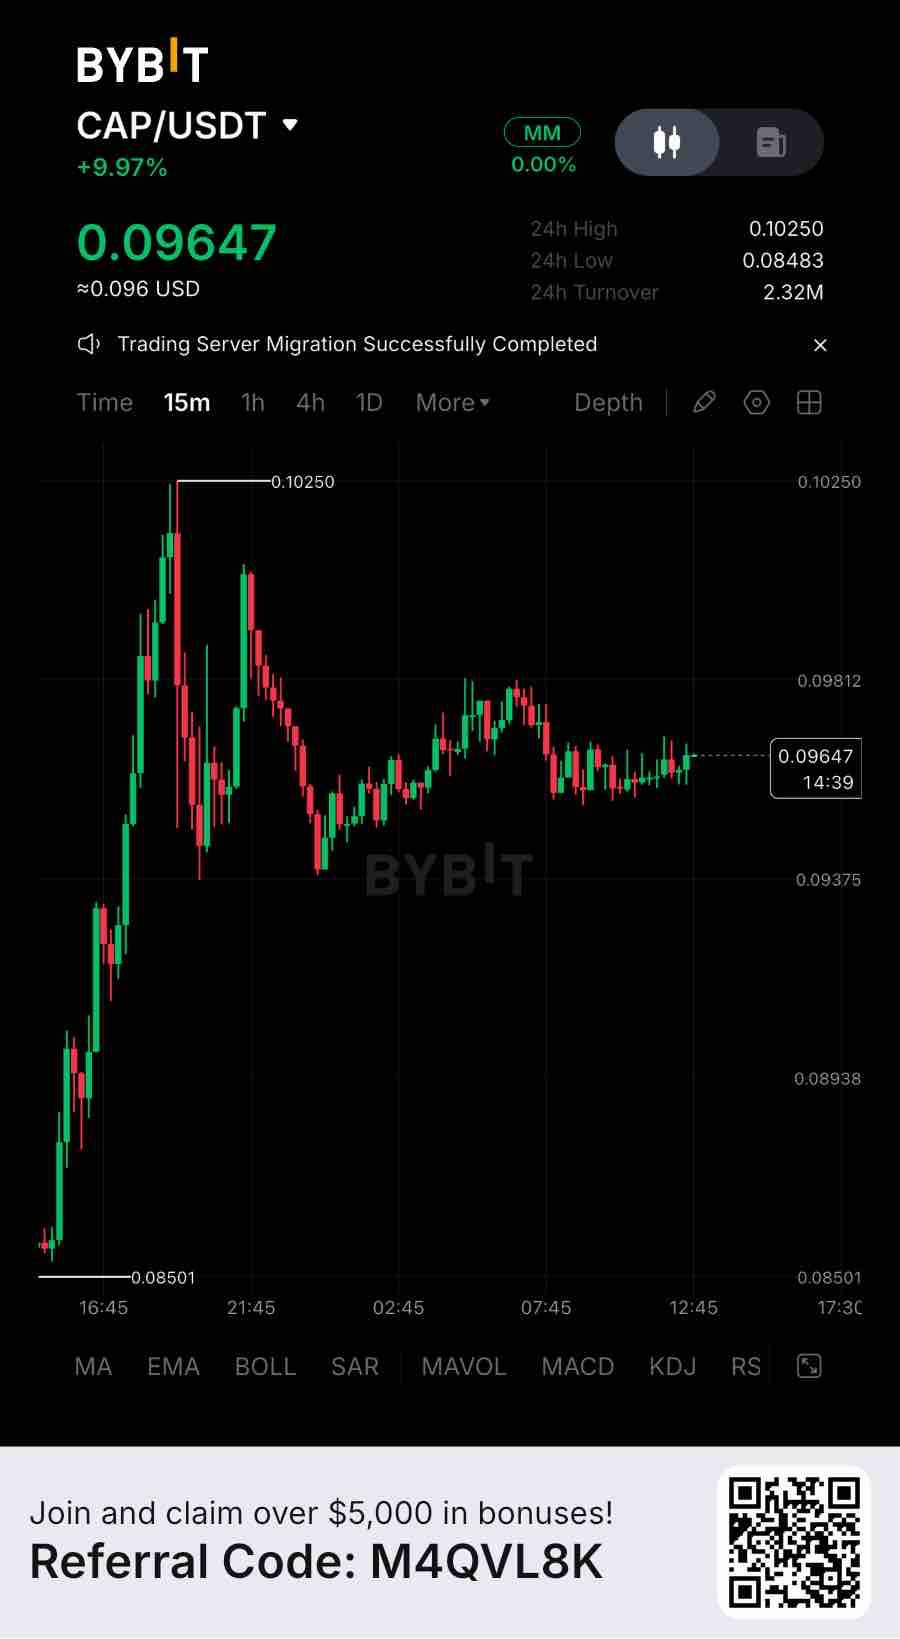
CAP: Institutional Credit Is Expanding, But Is the Token Capturing Its Economic Value? CAP is developing an interesting position in decentralized finance by connecting stablecoin liquidity with institutional credit markets. However, its growing financial infrastructure comes with an important valuation question: can protocol adoption translate into sustainable demand for CAP? CAP is trading around $0.0964, with a market capitalization near $151 million and 24-hour trading volume around $17 million. It has gained approximately 2.3% over 24 hours but remains down nearly 10% over seven days. The token recently reached an all-time high near $0.129 before correcting approximately 25%. Derivatives positioning shows substantial speculative participation. Futures open interest stands near $50 million, approximately 33% of its market capitalization. Funding is positive at around 0.0151%, meaning leveraged longs are paying shorts to maintain positions. This suggests meaningful leveraged exposure despite the recent correction. I want to see stronger spot accumulation before treating the rebound as a confirmed trend reversal. The fundamental model is considerably more interesting. Cap operates through two main products: * cUSD: A dollar-backed stablecoin supported by assets including USDC, USDT and tokenized money-market products. * stcUSD: A yield-bearing savings product that generates returns through institutional lending and reserve strategies. The underlying credit model is particularly interesting. Institutional borrowers access liquidity, while independent underwriters provide collateral guarantees against potential defaults. In July 2026, Cap reported reaching $500 million in peak TVL, onboarding 30 borrowers and 22 underwriters, alongside $5.6 billion in cumulative transfer volume. Another important development came in October when Cap removed cUSD minting fees for USDC deposits, introducing fee-free 1:1 minting and redemption. Its reported average stcUSD yield was 5.92% over the preceding 30 days. Current activity, however, deserves caution. TVL currently stands near $139.3 million, down approximately 39.9% over 30 days. Active institutional loans are around $50 million. The protocol generated approximately $448,800 in fees over 30 days, but tracked protocol revenue was almost zero during the same period. This highlights an important distinction: generating financial activity does not automatically create equivalent value for token holders. Tokenomics are the biggest concern. CAP has a maximum supply of 10 billion tokens, but only 1.56 billion are circulating. That means approximately 84.4% of maximum supply remains outside circulation. Fully diluted valuation is approximately $966 million, more than six times its current market capitalization. The next major estimated supply release is scheduled for June 2027, potentially introducing approximately 1.08 billion CAP tokens through team, investor and community allocations. This could create significant dilution pressure if demand does not expand alongside supply. Technically, I am watching: * $0.092–$0.093: Immediate support. * $0.0997: First resistance. * $0.1027: Breakout confirmation. * $0.0848: Important downside support. My view is that CAP has a compelling institutional credit model and a meaningful opportunity in stablecoin infrastructure. However, declining TVL, limited current token value capture and substantial future supply remain important risks. Can CAP transform institutional credit adoption into sustainable demand for its native token, or will dilution and weak value capture continue limiting its long-term valuation? #IMPACTbyTrade $CAPUSDT

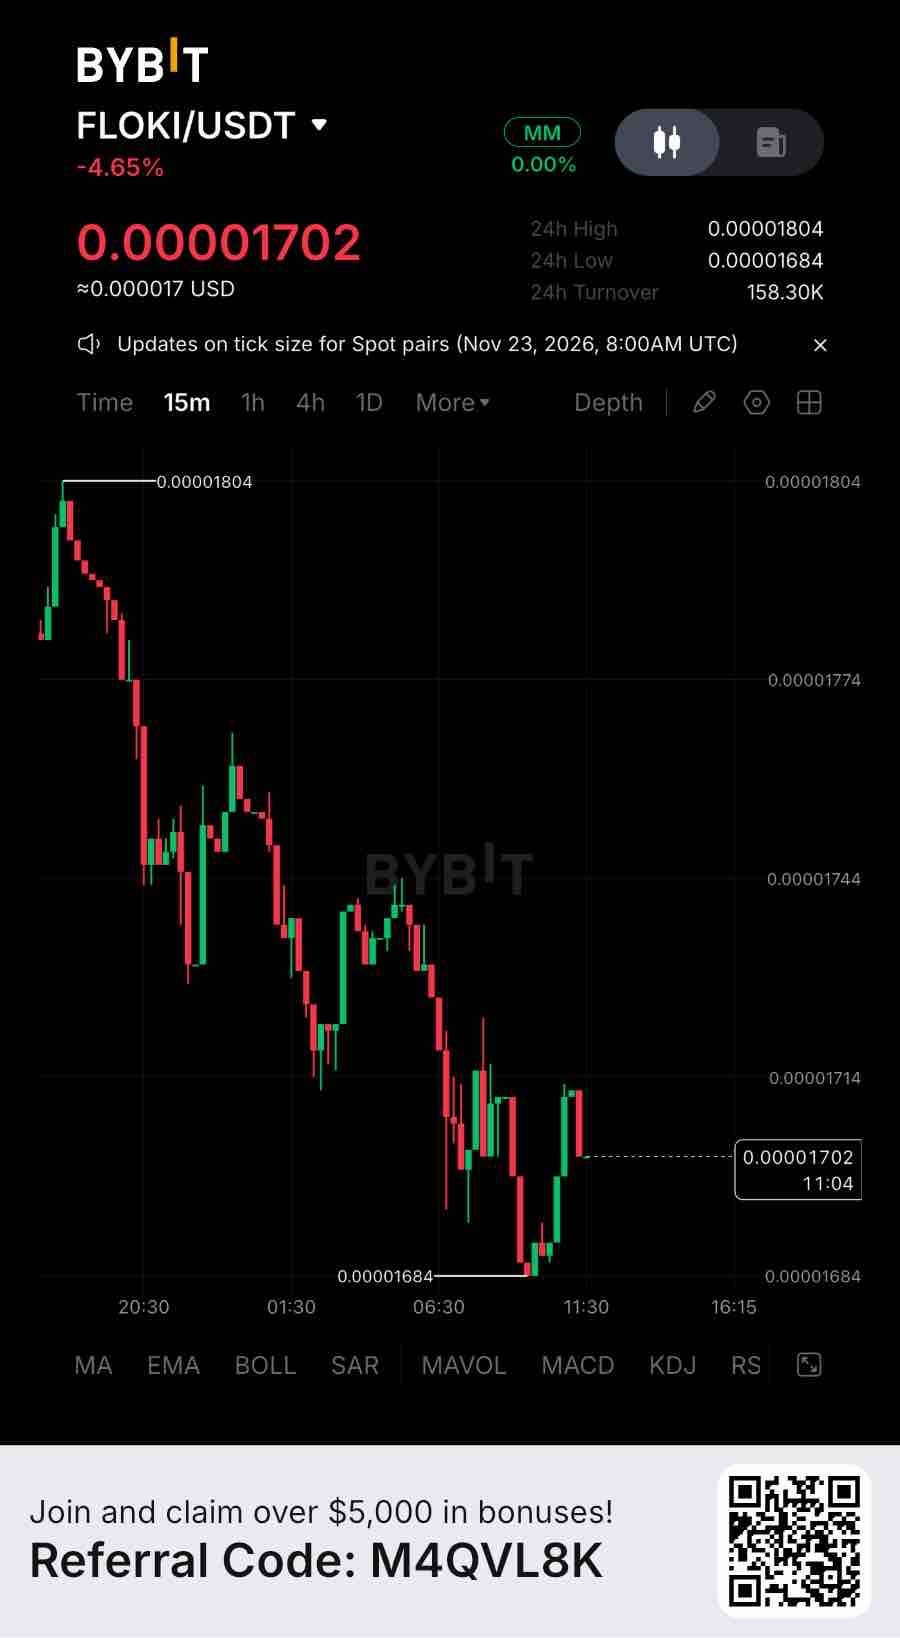
FLOKI: Valhalla Gaming, Token Burns & the Challenge of Creating Sustainable Demand FLOKI is trading around $0.0000171, with a market capitalization near $163 million. The token has declined approximately 3.5% over 24 hours and nearly 14% over seven days, remaining more than 95% below its June 2024 all-time high. The broader structure is still bearish, despite trading near oversold territory. Derivatives positioning reveals an important imbalance. Futures open interest stands near $9 million, while 24-hour futures volume is approximately $9.8 million against less than $1 million in spot volume. Funding remains close to neutral at around 0.002% per eight hours. Open interest has declined approximately 1.1%, while futures markets recorded nearly $4.9 million in net outflows. Spot recorded only modest positive inflows. This suggests leveraged positions are being reduced, but genuine spot accumulation remains limited. I would not interpret a short-term bounce as a confirmed reversal yet. The fundamental ecosystem deserves closer attention. Valhalla is FLOKI’s blockchain-based gaming project, designed around an interactive metaverse economy. Its expansion toward mobile availability could introduce the ecosystem to a significantly broader gaming audience. In its October community update, the team indicated that Valhalla’s mobile release was approaching. However, a confirmed launch date and measurable mobile-user adoption remain important milestones. FlokiFi Locker provides another source of measurable utility. Its TVL currently stands near $9.56 million across multiple networks. However, TVL has declined approximately 22% over 30 days, with nearly 87% concentrated on BNB Chain. This shows that product adoption exists, but capital participation is not consistently expanding. Tokenomics offer another potential catalyst. FLOKI’s original combined supply across Ethereum and BNB Chain was 20 trillion tokens. More than 10.3 trillion have reportedly been burned, leaving approximately 9.64 trillion in economic supply. Its ecosystem includes several additional burn mechanisms: * 25% of eligible FlokiFi service fees goes toward FLOKI buybacks and burns. * 1% of prepaid debit card top-up fees supports token burns. * Early staking withdrawals incur penalties that are burned. However, the current burn activity remains relatively small compared with FLOKI’s market capitalization. Deflationary mechanisms are useful, but their actual economic impact matters more than their existence. TokenFi also creates another expansion opportunity through tokenization and launch infrastructure, although meaningful adoption and recurring demand still need confirmation. Technically, I am watching: * $0.00001702: Immediate support. * $0.00001619: Next downside level. * $0.00001792: First resistance and recovery confirmation. * $0.00001901: Important upside target. My view is that FLOKI has developed beyond a simple meme-token narrative through gaming, DeFi infrastructure, tokenization and supply-reduction mechanisms. However, declining TVL, weak spot participation and limited burn impact show that ecosystem development has not yet translated into sufficiently strong token demand. Can FLOKI turn its gaming and DeFi ecosystem into a sustainable economic network, or will speculative sentiment continue to dominate its long-term valuation? #IMPACTbyTrade $FLOKIUSDT

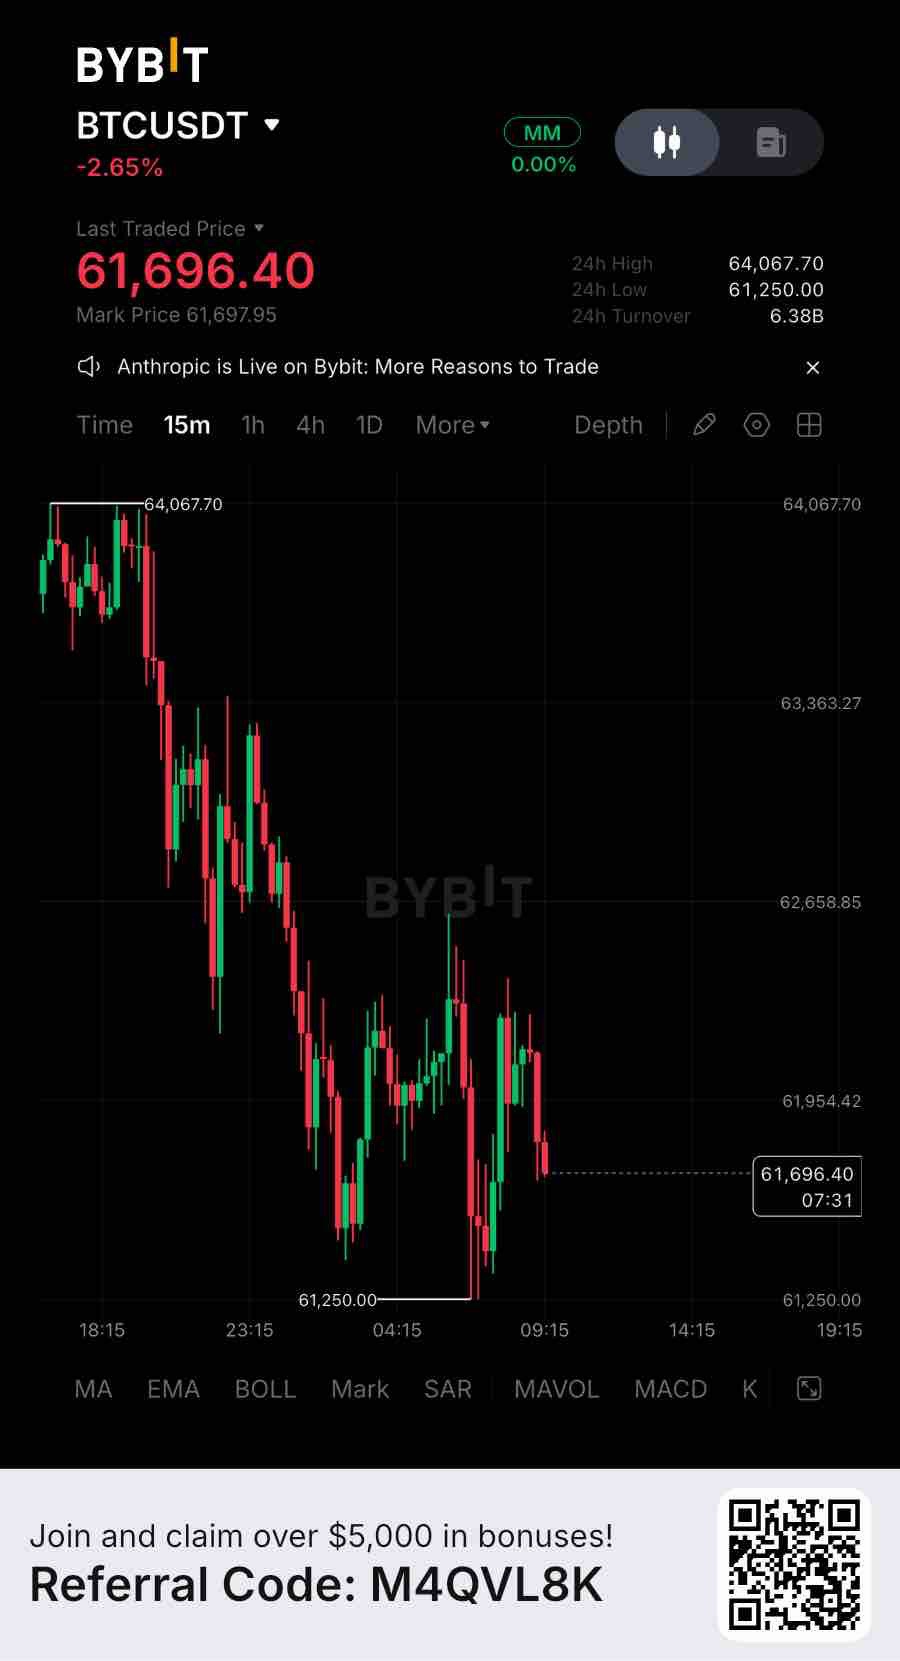
BTC: $3.2B ETF Outflows, Long-Term Holder Capitulation & the Critical $60K Support Zone Bitcoin is approaching an important market inflection point. Trading around $62,000, with a market capitalization near $1.25 trillion, BTC has fallen from the $71,000 area last week. It is now approximately 51% below its all-time high near $126,200. The immediate concern is not simply price weakness, but the combination of institutional selling, leveraged positioning and growing realized losses among long-term holders. Derivatives positioning reveals significant pressure. Bitcoin futures open interest stands near $41.5 billion, while 24-hour futures volume has reached approximately $82.2 billion against just $6.3 billion in spot volume. Funding remains slightly positive at 0.0018% per eight hours. This represents approximately 13 times more futures activity than spot volume. Around $201 million in positions were liquidated over 24 hours, with approximately 77% coming from longs. Open interest has also declined slightly, suggesting that some leveraged positions are being removed rather than replaced by fresh conviction. Institutional demand is becoming another major concern. US spot Bitcoin ETFs recorded approximately $306.5 million in net outflows on November 18, following another $239.9 million in outflows on November 17. November’s cumulative ETF outflows have approached $2.9 billion through November 18. This matters because institutional capital previously provided an important source of incremental spot demand. Sustained redemptions remove that support while the market is already experiencing selling pressure. On-chain data reveals an even more interesting development. On November 18, long-term Bitcoin holders realized approximately $279.8 million in losses. This metric has increased nearly 228% over seven days and sits around the 95th percentile of its four-year historical range. Total realized losses across holders reached approximately $818.7 million, with long-term holders contributing around 55%. This suggests that selling pressure is no longer limited to short-term traders. Older holders are also realizing significant losses, potentially indicating capitulation. However, capitulation can create accumulation opportunities, but it does not automatically establish a market bottom. Bitcoin’s long-term supply fundamentals remain intact. Approximately 20.11 million BTC have already been issued against the fixed maximum supply of 21 million. Mining rewards remain at 3.125 BTC per block following the April 2024 halving. The next halving is expected in 2028. Predictable issuance remains Bitcoin’s strongest structural characteristic, although scarcity alone cannot overcome weakening liquidity. Technically, I am watching: * $60,900: Immediate support. * $59,500: Next downside level. * $62,500: First recovery confirmation. * $64,900–$65,000: Stronger resistance. * $68,000: Important broader trend-recovery level. My view is that Bitcoin’s long-term monetary fundamentals remain unchanged, but short-term conditions are deteriorating. I want to see ETF inflows return, long-term holder selling pressure stabilize and spot demand strengthen before calling this a confirmed accumulation phase. Is Bitcoin approaching a genuine capitulation bottom, or does institutional selling still have enough momentum to push BTC toward the $58,000 region? #IMPACTbyTrade $BTCUSDT

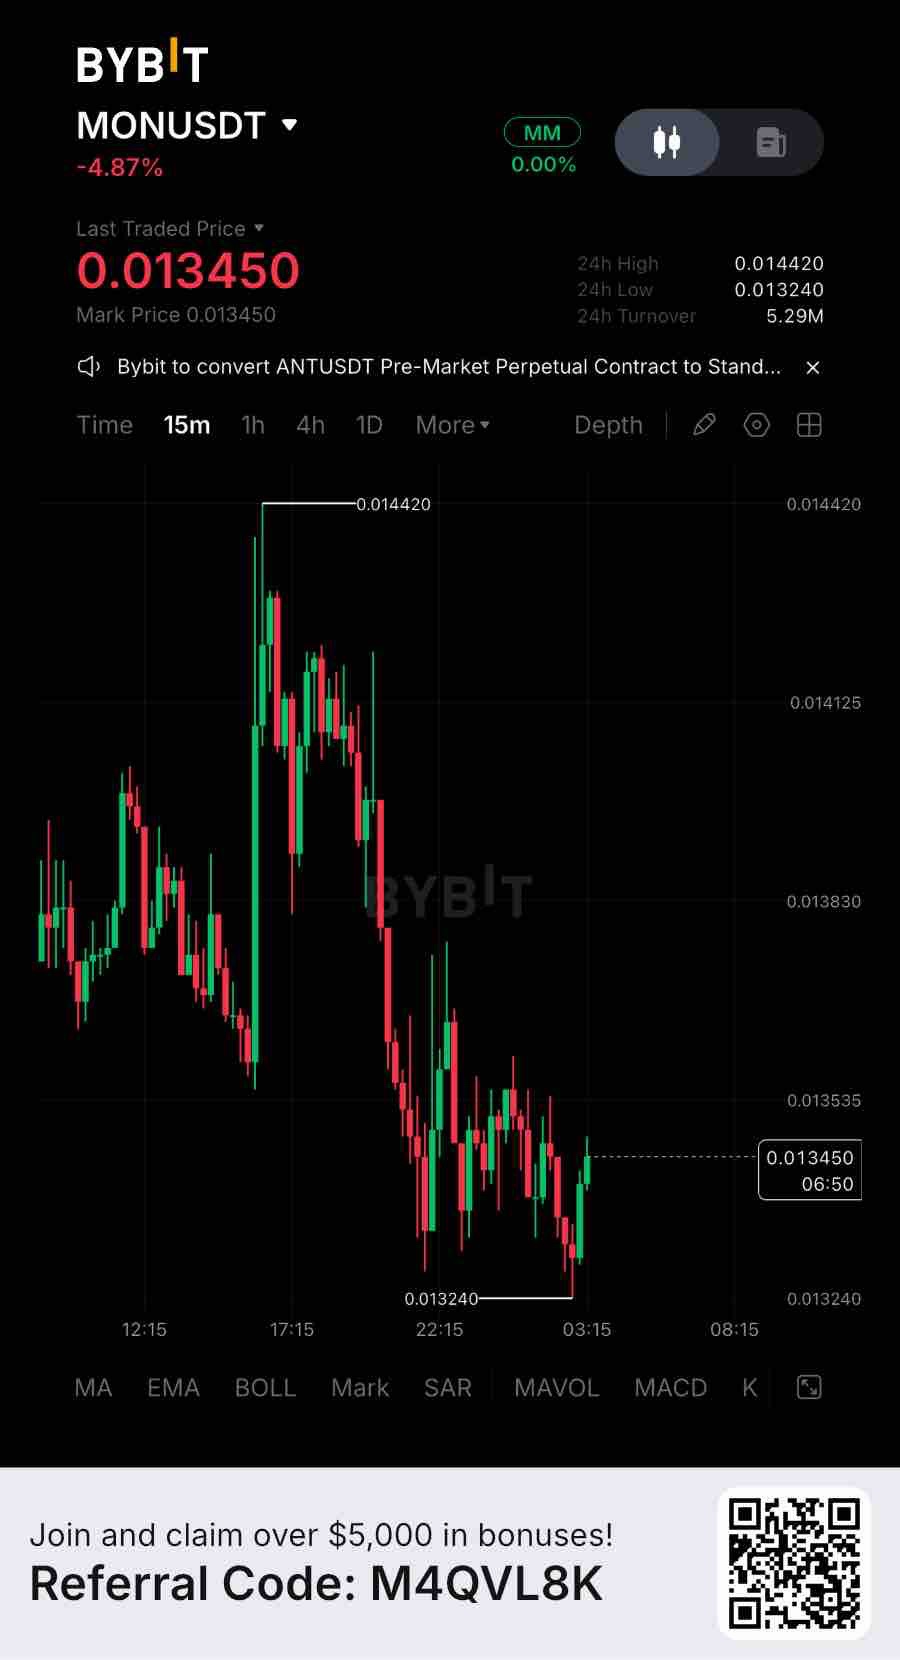
MON: Monad’s High-Performance Blockchain Is Ambitious, But Can Network Adoption Translate Into Real Token Demand? Monad is positioning itself as a high-performance Layer 1 designed to solve one of Ethereum’s biggest limitations: execution scalability without abandoning EVM compatibility. Its investment thesis is interesting, but the real question is whether technical performance can translate into sustainable economic activity and long-term demand for MON. The technology is the strongest part of the story. Monad uses parallel transaction execution, MonadBFT consensus and pipelined execution to improve network throughput while maintaining compatibility with Ethereum applications. Its architecture targets up to 10,000 transactions per second, approximately 400ms block times and 800ms finality. EVM compatibility is particularly important because developers can migrate existing Solidity applications without rebuilding their entire infrastructure. This creates an opportunity to attract Ethereum developers, DeFi protocols and liquidity without forcing users into an entirely unfamiliar ecosystem. However, theoretical performance targets and actual sustained mainnet performance are different things. Real adoption must demonstrate that the network can maintain speed, reliability and decentralization under substantial economic activity. The ecosystem growth is the next important test. Monad’s opportunity extends beyond transaction throughput. Its competitive position depends on attracting three categories of activity: * DeFi applications generating recurring transactions and fees. * Stablecoins bringing transferable dollar liquidity onto the network. * Developers building applications that attract users without depending entirely on token incentives. The quality of liquidity matters more than the number of deployed applications. Sustainable TVL, organic trading volume and recurring users will provide stronger evidence of adoption. Tokenomics deserve particular attention. MON has a maximum supply of 100 billion tokens. Its allocation includes approximately 38.5% for ecosystem and community development, 27% for the team, 19.7% for investors, 7.5% for the public sale, 4% for the treasury and 3.3% for the airdrop. MON serves as the network’s native gas and staking asset, connecting network usage with token utility. However, its substantial team and investor allocations make vesting schedules particularly important. Future supply entering circulation could create selling pressure even as ecosystem adoption improves. What I want to see next: 1. Organic DeFi liquidity growth rather than incentive-driven TVL. 2. Increasing stablecoin adoption and real transaction demand. 3. Sustainable validator participation and network fees. 4. Stronger spot accumulation relative to leveraged futures activity. 5. Transparent token unlocks and disciplined ecosystem emissions. My view is that Monad has a technically compelling foundation and a clear opportunity in the EVM-compatible Layer 1 market. But technology alone does not establish token value. The decisive factor will be whether developers, users and liquidity providers create an economy that generates recurring demand for MON. Can Monad become a serious Ethereum-compatible infrastructure competitor, or will its token supply and competition from established Layer 1 networks limit its long-term growth? #ByXIMPACT $MONUSDT

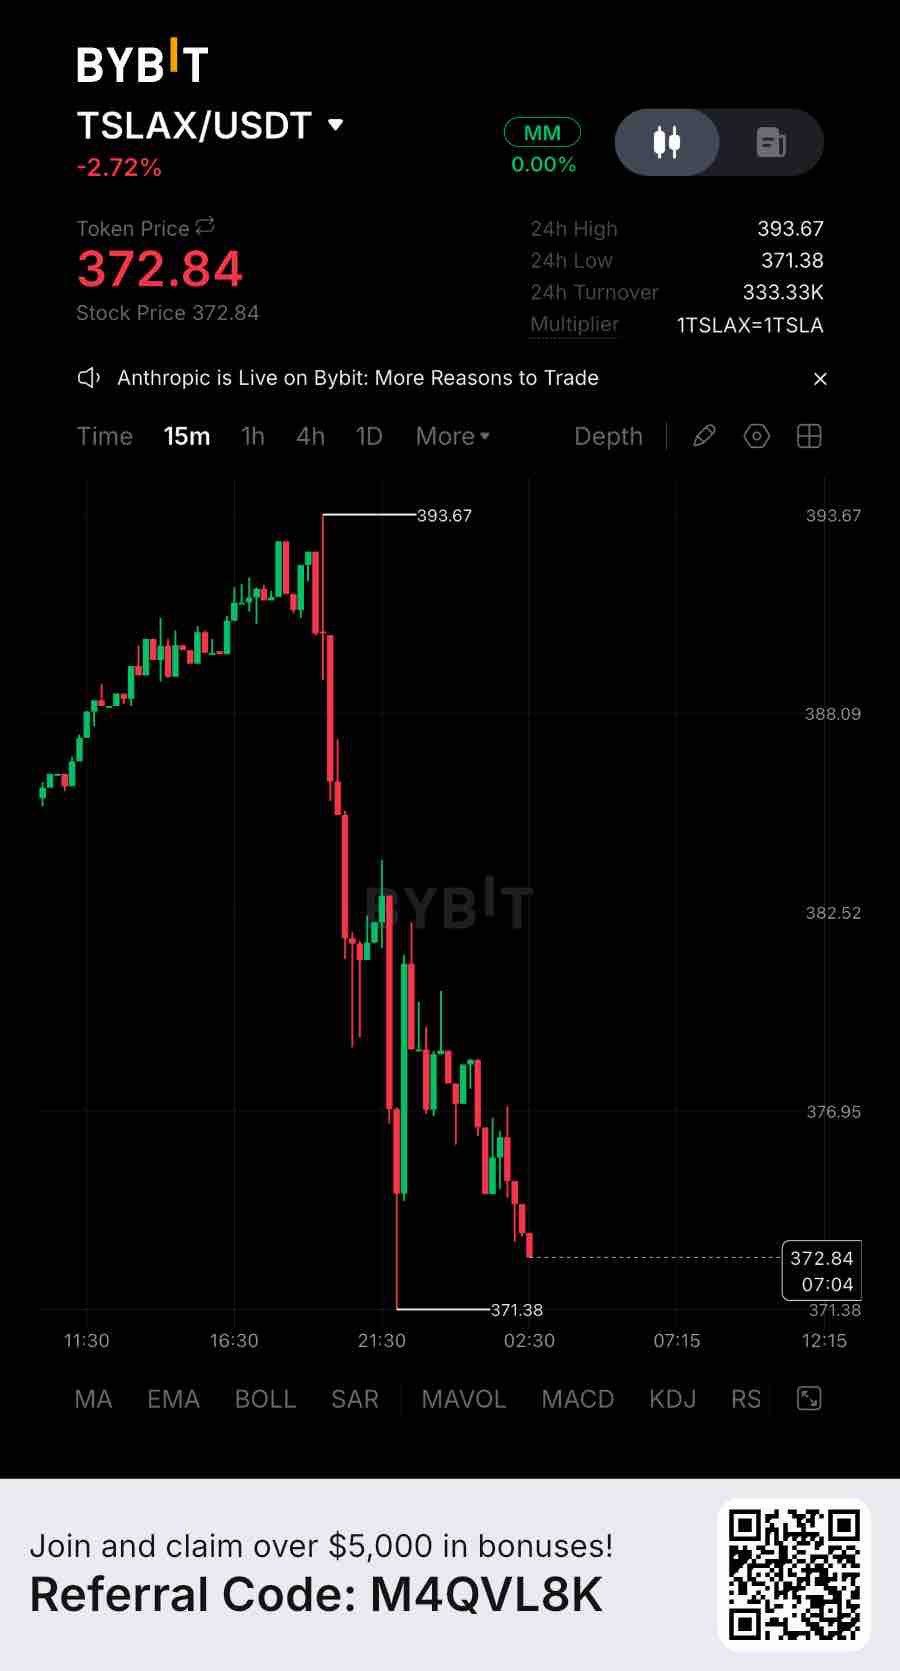
TSLAX: Tesla’s AI Expansion Is Accelerating, But Is Tokenized Equity Capturing Its Full Potential? TSLAX is trading around $393, with a market capitalization near $69.2 million. It has gained approximately 2.4% over 24 hours, while remaining nearly 21% below its previous all-time high of $497. The recovery is encouraging, but the broader structure still needs confirmation. Derivatives positioning presents an interesting picture. Futures open interest stands near $1.07 million, increasing approximately 11.8% over 24 hours. Futures volume is around $681,000 against $508,000 in spot volume. Funding is negative at approximately -0.0115%. This combination deserves attention. Rising open interest alongside price appreciation suggests new positioning is entering, while negative funding indicates short-side pressure. Spot net inflows are also positive, providing an early indication of genuine buying interest. However, sustained demand is still needed. The underlying company’s fundamentals are more important than short-term token activity. Tesla reported approximately $28.05 billion in Q3 2026 revenue, broadly unchanged year over year. However, GAAP net income declined 43% to $787 million, while operating margin contracted to 2.6%. Free cash flow reached $1.53 billion, down approximately 62% year over year. This creates an important distinction: Tesla’s future growth narrative is expanding, but its current profitability remains under pressure. There are three developments worth watching. First, Tesla delivered 486,532 vehicles during Q3 and deployed 13.7 GWh of energy storage products. Second, Cybercab entered the Austin Robotaxi fleet in September. Unsupervised Robotaxi miles increased eightfold sequentially, although commercial scalability and regulatory approvals remain important challenges. Third, Tesla’s Full Self-Driving adoption continued improving, with more than 75% of new deliveries in North America attaching FSD (Supervised). Tokenization introduces another investment dimension. TSLAX is a tracker certificate referencing Tesla shares, issued through a collateral-backed structure. It enables blockchain-based exposure without requiring investors to purchase traditional shares directly. However, token holders do not receive Tesla shareholder voting rights or direct dividend entitlements. Issuer credit risk, redemption conditions and secondary-market liquidity remain important considerations. Its circulating supply is approximately 176,500 tokens, compared with around 584,300 total tokens. This should not be interpreted like a conventional crypto unlock schedule because issuance is connected to the underlying collateral structure. Technically, I am watching: * $380–$382: Immediate support. * $393–$394: First resistance and breakout confirmation. * $400: Important psychological resistance. A breakdown below $380 could expose $371. My view is that TSLAX offers an interesting bridge between traditional equity markets and blockchain infrastructure. However, its investment thesis ultimately depends on Tesla’s business performance, not independent token utility. Can Tesla’s AI, Robotaxi and energy expansion make tokenized equity a major part of digital financial markets, or will profitability and liquidity limitations remain the bigger obstacles? #ByXIMPACT $TSLAXUSDT

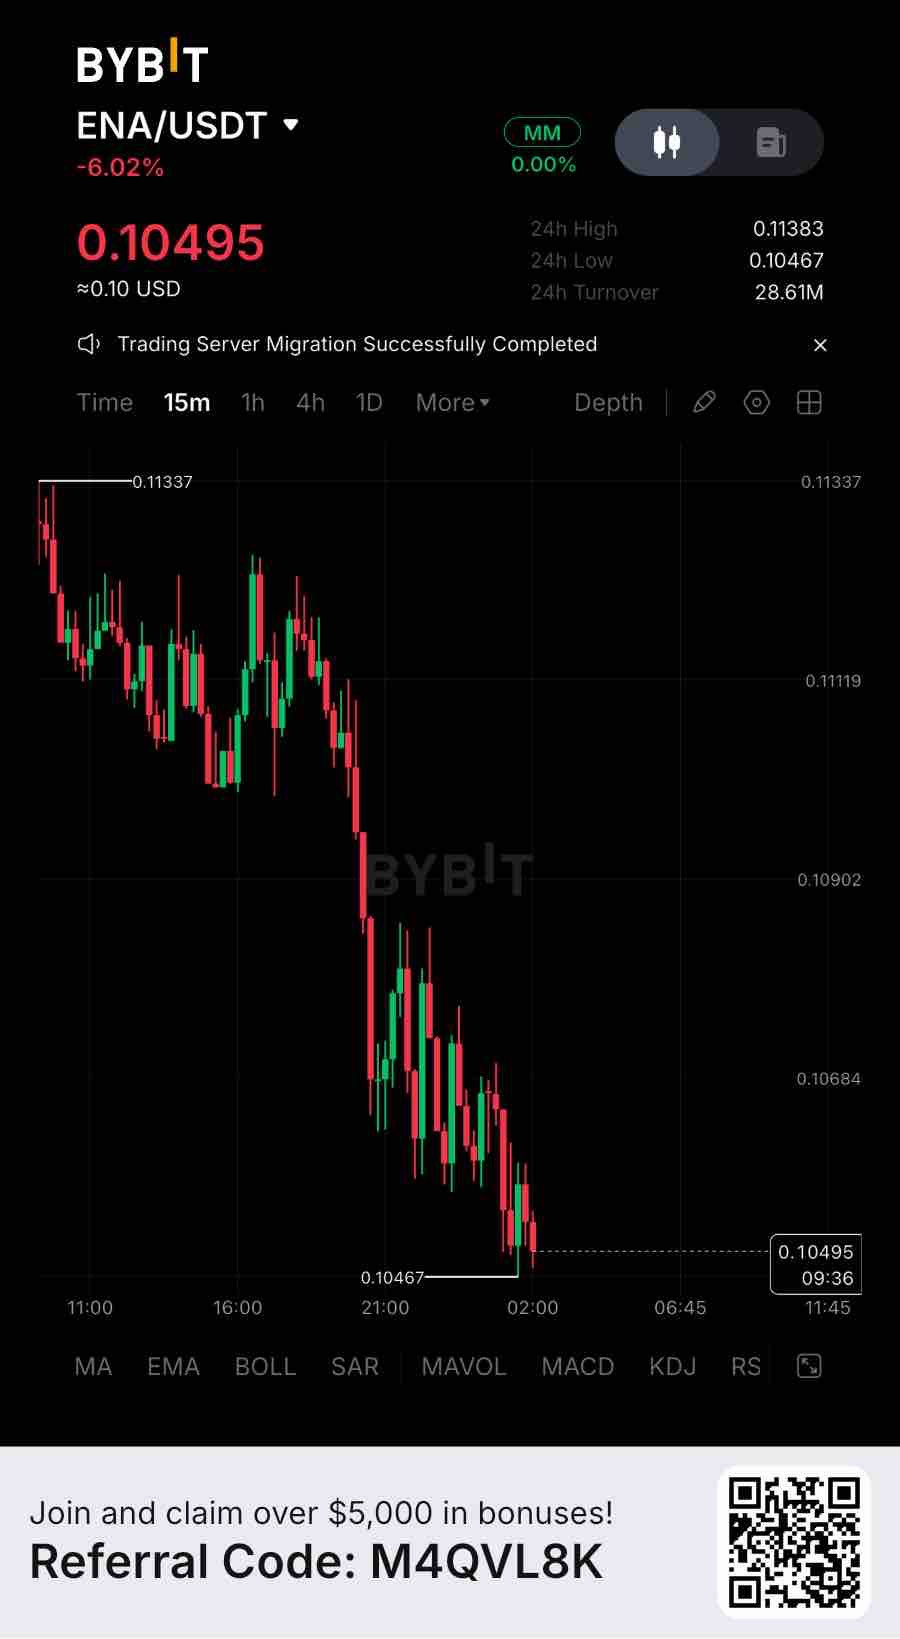
ENA: $4.88B USDe Supply, Institutional Expansion & the Next Phase of Token Value Capture Ethena is developing an increasingly important position in decentralized financial infrastructure. However, the key question is whether its expanding stablecoin economy can translate into sustainable demand for ENA. ENA is trading around $0.1103, with a market capitalization near $1.49 billion. It has declined approximately 2.5% over 24 hours, 21% over seven days and nearly 44% over 30 days. The broader market structure remains bearish, despite the token trading near its recent lows. Derivatives positioning reinforces this weakness. Futures open interest stands near $307 million, while 24-hour futures volume is approximately $410 million against $91 million in spot volume. Funding is slightly negative at -0.001%. Around 88% of recent liquidations involved long positions. Futures volume is approximately 4.5 times spot volume, suggesting leveraged participation remains dominant. Spot net flows are also negative, indicating that genuine buying demand needs to improve. The fundamental picture is considerably more interesting. Ethena’s USDe supply has recovered to approximately $4.88 billion across 31 blockchain networks. This represents a meaningful recovery from its October contraction. The protocol generated approximately $57 million in gross revenue during Q3 2026, while cumulative protocol revenue has exceeded $850 million. Monthly revenue increased from $17.6 million in July to $21.3 million in September. Another important development is the November 19 expansion of USDe and sUSDe onto Stellar. This opens another distribution channel through its DeFi applications, liquidity infrastructure and wallet ecosystem. Ethena has also introduced fixed-term USDe markets with Pendle, creating additional opportunities for structured dollar-denominated investments. Meanwhile, its partnership with Securitize introduced a $100 million liquidity facility supporting institutional access to BlackRock’s tokenized BUIDL fund. Token value capture is where ENA becomes particularly interesting. Governance has approved a programmatic buyback framework that directs an increasing share of protocol economics toward ENA purchases as USDe supply reaches specific milestones. The first milestone begins at $7.5 billion in USDe supply, followed by higher thresholds at $10 billion, $15 billion and $20 billion. With current supply around $4.88 billion, the first buyback trigger has not yet been reached. This distinction is important: the mechanism is approved, but systematic buybacks are not yet an active source of demand. ENA has a maximum supply of 15 billion tokens, with approximately 13.5 billion circulating. Additionally, a 3 billion ENA treasury held by StablecoinX became unlocked in October, representing an important supply concentration to monitor. Unlocked tokens do not automatically mean market selling. Technically, I am watching: * $0.105–$0.106: Immediate support. * $0.114–$0.115: First resistance. * $0.121–$0.122: Important recovery confirmation. A breakdown below $0.105 could expose $0.097. My view is that Ethena has a compelling combination of stablecoin adoption, institutional distribution and measurable protocol revenue. However, the real investment thesis depends on whether this growth eventually activates meaningful ENA buybacks while overcoming supply and counterparty risks. Can Ethena turn its expanding $4.88 billion stablecoin economy into sustainable demand for ENA, or is the token still waiting for its economic value capture mechanism to become meaningful? #IMPACTbyTrade $ENAUSDT

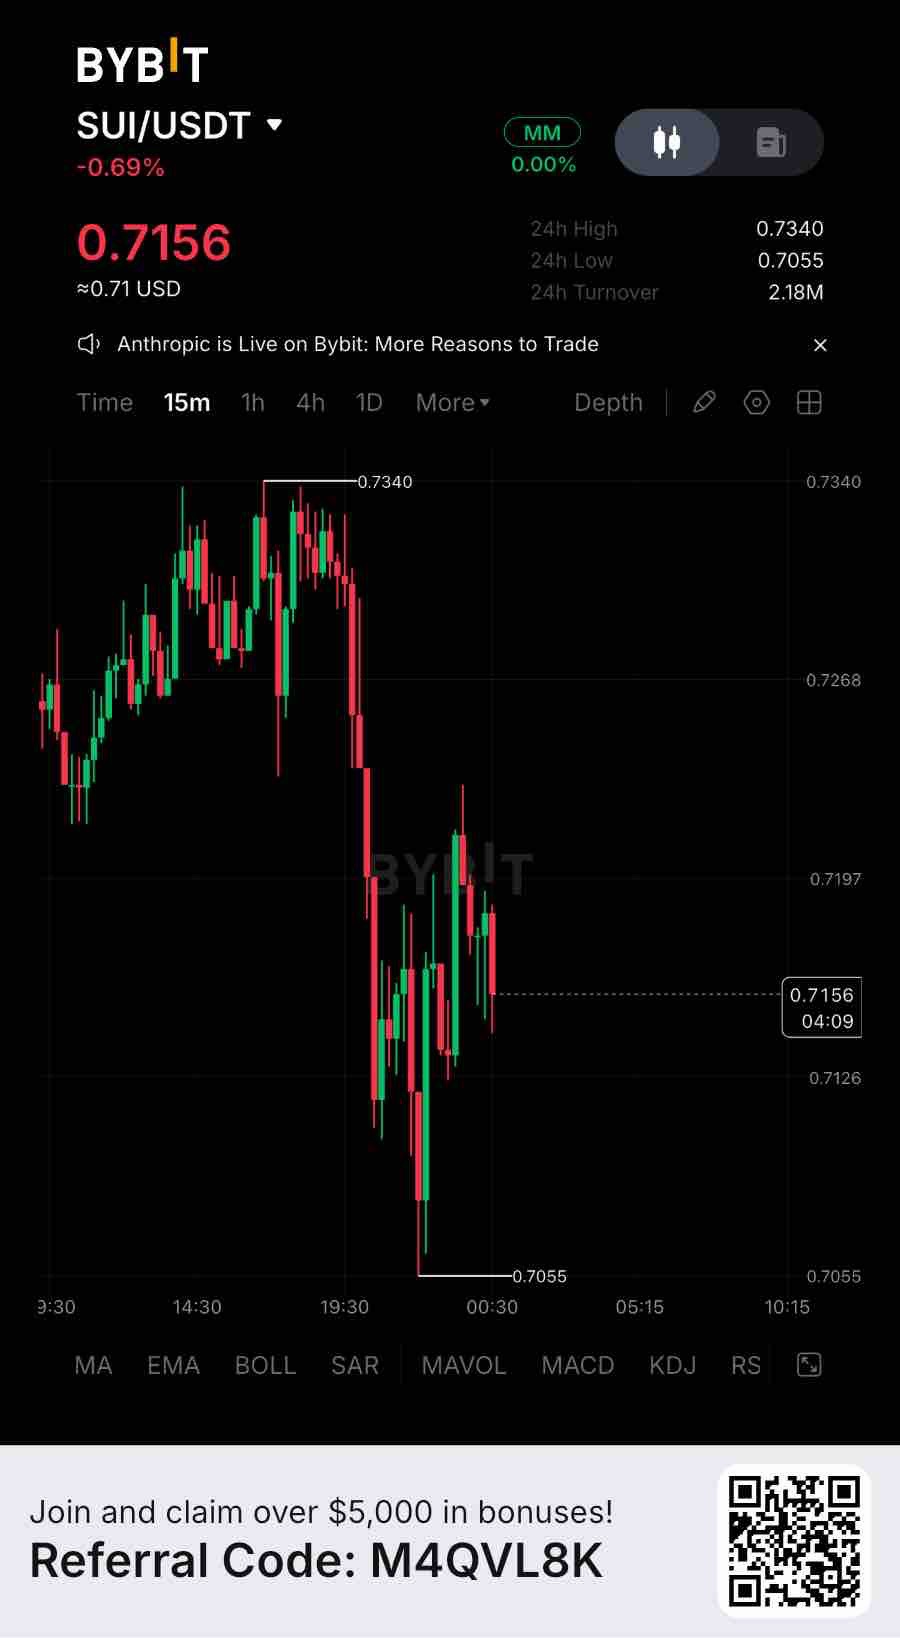
SUI Bitcoin Finance Expansion, Institutional Adoption & the Token Value Capture Challenge SUI is trading around $0.715, with a market capitalization near $2.97 billion. Despite a minor 24-hour recovery, it remains down approximately 11% over seven days and nearly 87% below its January 2025 all-time high. The broader market structure remains weak, and buyers have not yet demonstrated a convincing reversal. Derivatives positioning reinforces this caution. Futures open interest stands near $412 million, while 24-hour futures volume has reached approximately $362 million against $58.5 million in spot volume. Funding remains almost neutral at 0.0014%. Futures activity is more than six times spot volume, while open interest has declined approximately 0.8%. Around 90% of recent liquidations were long positions. This suggests that leveraged participation remains dominant, but speculative buyers are still being forced out. I want stronger spot accumulation before treating this recovery as sustainable. The fundamental developments are considerably more interesting. Sui’s latest ecosystem metrics show approximately $360 million in DeFi TVL and $590 million in stablecoin liquidity, with stablecoin supply increasing 8.5% over seven days. Daily DEX volume stands near $18.7 million, while weekly DEX volume has increased approximately 10%. The network also recorded around 139,000 active addresses over 24 hours. However, one development deserves particular attention. On November 19, Hashi officially launched on Sui mainnet, bringing more than 20 institutional, custody and DeFi participants into its Bitcoin finance ecosystem. Hashi introduces hBTC, a Bitcoin-backed asset issued at a 1:1 ratio against deposited BTC. This allows Bitcoin holders to use their holdings as collateral for lending and other DeFi strategies without selling their underlying Bitcoin. Fluid is introducing Bitcoin-backed stablecoin lending, while Anchorage Digital provides institutional custody access. Upshift and other partners are developing additional vault infrastructure. This is significant because Sui is attempting to attract Bitcoin liquidity rather than compete exclusively for existing altcoin capital. Tokenomics remain the biggest long-term consideration. SUI has a maximum supply of 10 billion tokens, with approximately 4.14 billion currently circulating. More than 58% of maximum supply remains outside circulation, with scheduled releases extending toward 2030. This creates ongoing dilution pressure. Another important distinction is network value capture. Despite substantial transaction activity, daily chain fees are approximately $2,211, while application fees are considerably higher. Growing ecosystem activity does not automatically translate into equivalent economic value for SUI holders. Technically, I am watching: * $0.702: Immediate support. * $0.734–$0.739: First resistance and recovery confirmation. * $0.757–$0.761: Important upside recovery zone. A breakdown below $0.684 could weaken the structure further. My view is that Sui has a compelling opportunity through Bitcoin finance, stablecoin liquidity and institutional DeFi infrastructure. However, sustained spot demand, actual capital deployment and better economic value capture must support its growing ecosystem. Can Sui turn its new Bitcoin finance infrastructure into a major source of sustainable network demand, or will token dilution continue to outpace ecosystem growth? #IMPACTbyTrade $SUIUSDT

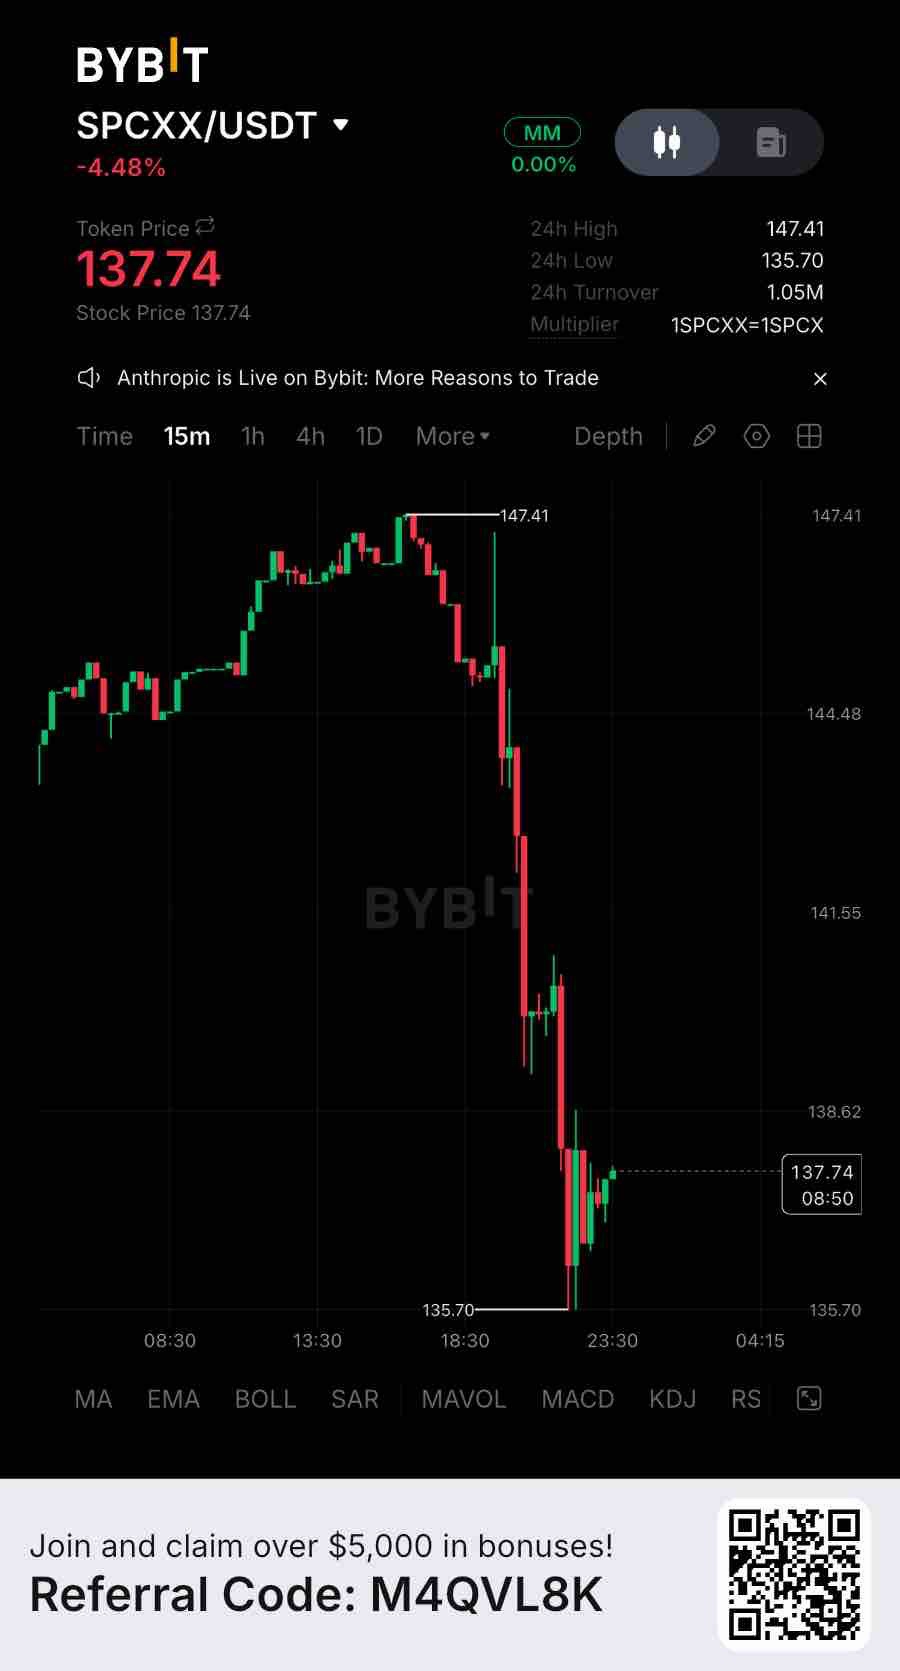
SPCXX: SpaceX’s $14.6B Revenue, AI Infrastructure Expansion & the Future of Tokenized Equity SPCXX is an interesting asset because it connects traditional equity exposure with blockchain-based trading infrastructure. Unlike conventional cryptocurrencies, its valuation is primarily linked to SpaceX’s underlying share performance. SPCXX is trading around $144.80, with a token market capitalization near $82 million and approximately $5.1 million in 24-hour trading volume. It has gained roughly 4.8% over seven days, although it remains approximately 35.7% below its all-time high of $225.31. The recovery is encouraging, but the distance from its previous high suggests that the broader price structure still needs improvement. The underlying company’s financial performance deserves attention. SpaceX reported approximately $14.58 billion in Q3 2026 revenue, representing 161% year-over-year growth. Net income reached $4.4 billion, while adjusted EBITDA increased to $8.8 billion. Two business segments are particularly important. First, Connectivity generated $5.25 billion in quarterly revenue, growing 69% year over year. Starlink consumer subscribers reached 13.6 million, while the segment generated $2.37 billion in operating income. Second, the Super Intelligence segment generated $7.56 billion in revenue, compared with just $813 million during the same quarter last year. This represents a substantial expansion into AI infrastructure and computing services. However, there is an important risk: Super Intelligence capital expenditure reached $16.44 billion during the quarter, exceeding its $7.56 billion revenue. Total company capital expenditure was approximately $19.59 billion, compared with $8.8 billion in adjusted EBITDA. The opportunity is substantial, but the expansion requires enormous capital investment. The tokenization model introduces another dimension. SPCXX represents tokenized economic exposure to SpaceX shares through a 1:1 collateral-backed structure. However, holding SPCXX does not make someone a direct SpaceX shareholder. Token holders do not receive voting rights, and their rights are governed by the issuing structure rather than ordinary share ownership. There is also no traditional crypto-style staking yield, mining reward or protocol revenue mechanism. Its supply can expand through additional issuance against corresponding underlying shares. Therefore, increasing token supply should not automatically be interpreted as inflationary dilution. Liquidity and technical structure matter. SPCXX trades across centralized and decentralized markets, but liquidity is fragmented. Displayed trading volume does not necessarily guarantee deep execution liquidity across every venue. I am watching these levels: * $141.40: Immediate support. * $139.20: Secondary support. * $149.30: First major resistance. * $152.40–$156.70: Next upside zone. A sustained break above $149.30 would improve momentum, while losing $139.20 would weaken the recovery. My view is that SPCXX offers an interesting combination of SpaceX’s business growth and blockchain-based accessibility. However, investors must evaluate the underlying company’s valuation, substantial AI infrastructure spending, token issuer risk and secondary-market liquidity together. Can tokenized equity become a major bridge between traditional financial markets and blockchain, with SPCXX emerging as a leading example of this transition? #IMPACTbyTrade $SPCXXUSDT

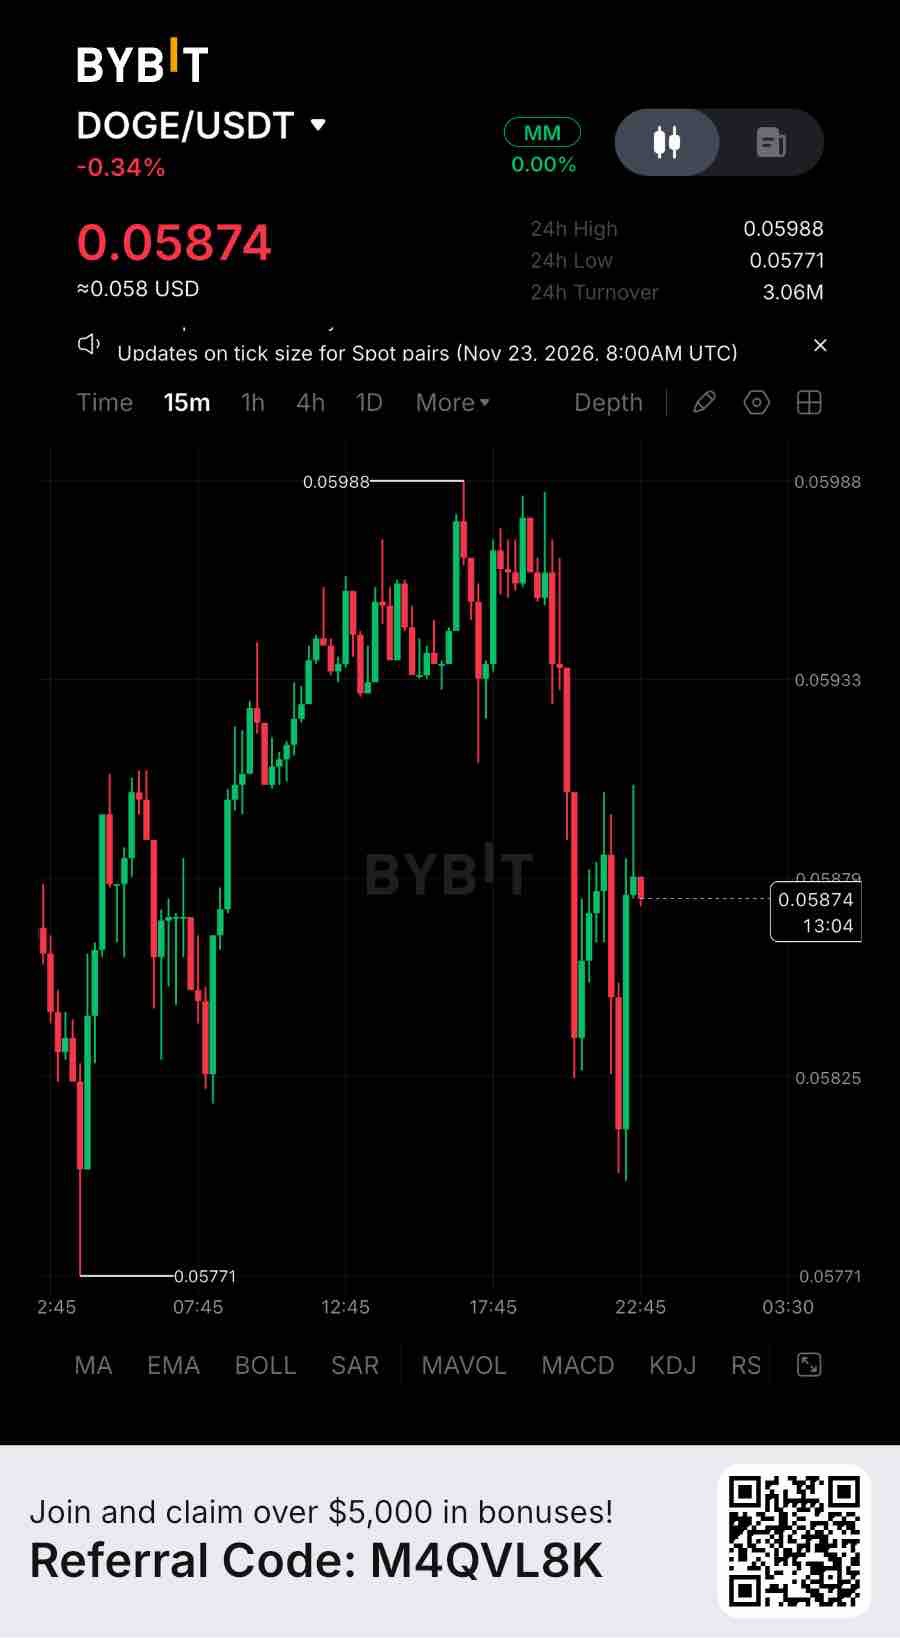
DOGE: Dogecoin Is Moving Beyond Memes, But Can Growing Utility Create Sustainable Demand? Dogecoin is trading around $0.0596, with a market capitalization near $9.34 billion. It has recovered approximately 1.17% over 24 hours, but remains around 44% below its September high near $0.106. The recent rebound is encouraging, although the broader market structure remains weak. Derivatives positioning reveals an important imbalance. Futures open interest stands near $799 million, up 1.78% over 24 hours. Futures volume has reached approximately $721 million, compared with just $84.5 million in spot volume. Funding remains slightly positive at 0.0048%. This means derivatives activity is approximately 8.5 times greater than spot volume. Additionally, futures recorded nearly $19.4 million in net buying, while spot markets experienced approximately $774,000 in net selling. My interpretation is that speculative positioning is increasing faster than genuine spot accumulation. This makes the current recovery vulnerable to another leveraged move. The fundamental developments deserve attention. Dogecoin is beginning to develop an ecosystem beyond payments and tipping. One important initiative is DogeOS, an EVM-compatible application layer designed to bring DeFi, gaming and decentralized applications to the Dogecoin ecosystem. Development and security audits for its first version are reportedly complete, with mainnet launch approaching. More than 100 builders are reportedly working on applications. Dogecoin Labs is another important development, bringing together MyDoge, DogeOS and merchant payment infrastructure. MyDoge has reported more than 500,000 users, while Such App supports merchant invoices and QR-based payments. However, developer activity and wallet registrations still need to translate into actual transactions and recurring economic demand. On-chain activity presents a mixed picture. During the week of November 12, Dogecoin recorded approximately 214,614 transactions, down 1.8% year over year. Daily active addresses averaged 39,286, representing a 21% annual decline. This is important because ecosystem expansion is happening while traditional network participation remains weaker. Tokenomics remain DOGE’s biggest structural challenge. Dogecoin has approximately 156.8 billion tokens in circulation and no maximum supply. Miners receive 10,000 DOGE per block, creating approximately 5.26 billion new DOGE annually. That represents roughly 3.35% annual supply inflation at current circulation levels. There is also no protocol-level burn mechanism. This continuous issuance means growing demand must absorb newly created supply before meaningful scarcity can develop. Technically, I am watching: * $0.0576–$0.0580: Immediate support. * $0.0600: Psychological resistance. * $0.0622: Next important upside level. A breakdown below $0.0576 could expose $0.0559. My view is that Dogecoin has an opportunity to evolve beyond its meme-coin identity through payments, developer infrastructure and upcoming application-layer expansion. However, declining active addresses and continuous issuance remain significant obstacles. I want to see stronger spot accumulation, increasing real network usage and successful DogeOS adoption before treating DOGE’s recovery as sustainable. Can Dogecoin transform its massive community into a genuine payment and application economy, or will continuous supply inflation keep limiting its long-term value? #IMPACTbyTrade $DOGEUSDT

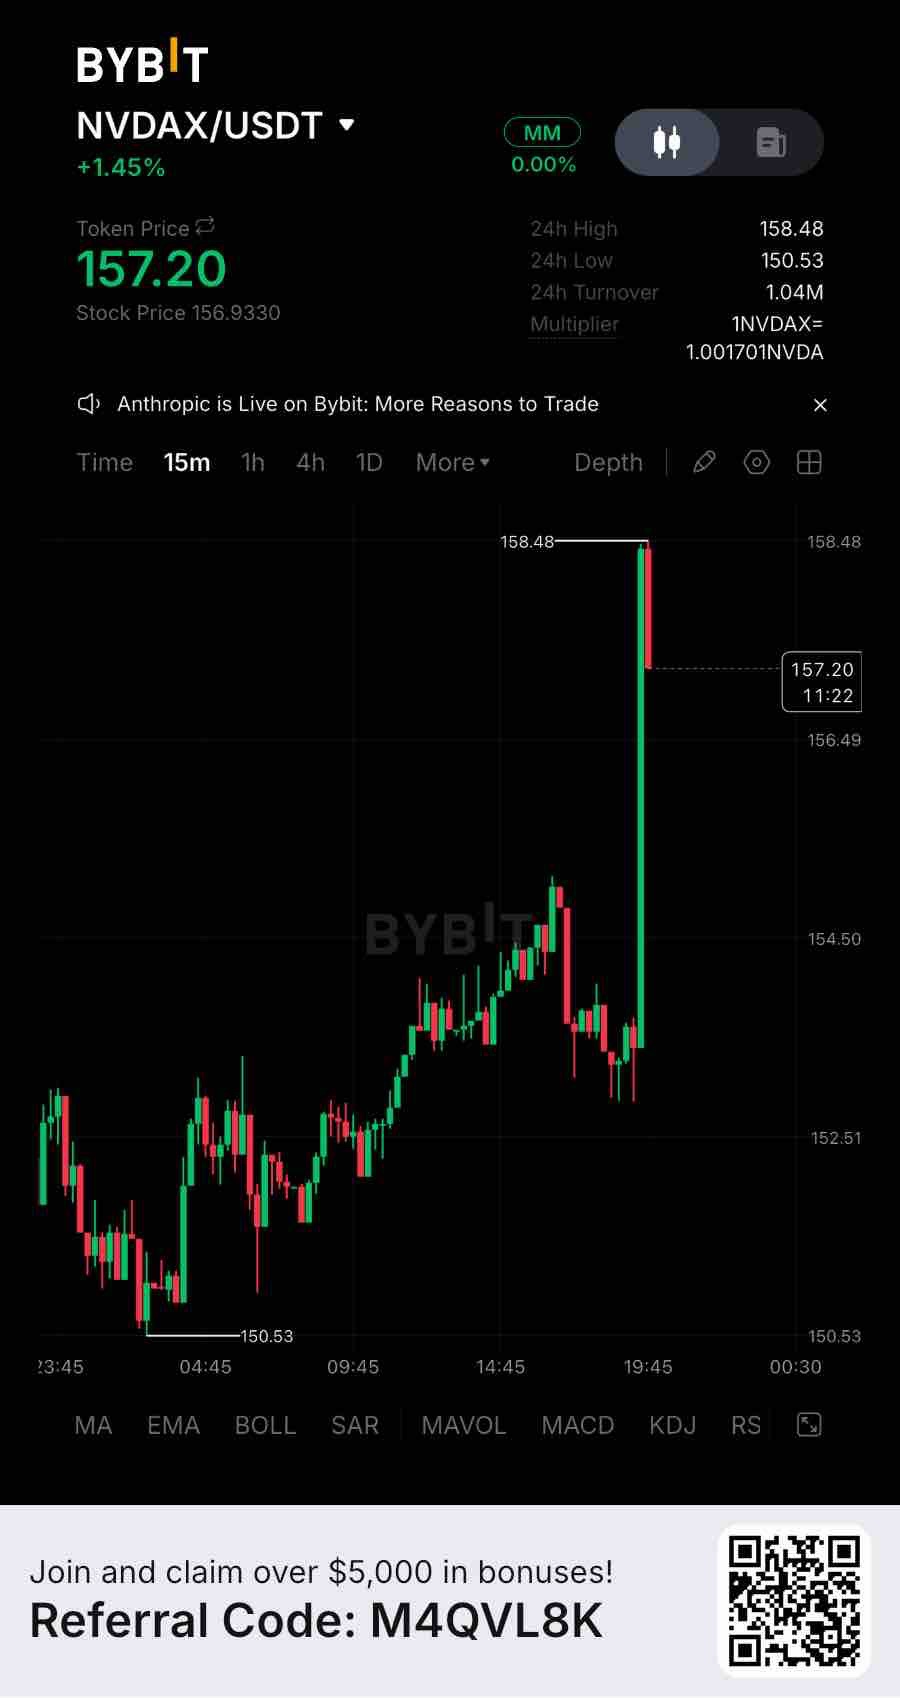
NVDAX NVIDIA’s AI Dominance Meets Tokenized Equity Is Institutional Demand Expanding? NVDAX is showing an interesting disconnect between NVIDIA’s fundamental performance and the recent price correction in its tokenized stock. NVDAX is trading around $153.39, with a market capitalization near $114 million. It has declined approximately 3.9% over 24 hours and 8.8% over seven days, remaining nearly 37% below its October all-time high of $242.89. Unlike conventional cryptocurrencies, NVDAX is designed to track NVIDIA’s underlying share price through a tokenized tracker certificate. This means its valuation depends primarily on NVIDIA’s financial performance, stock-market sentiment and the reliability of its underlying asset structure. Derivatives positioning deserves attention. Tracked futures open interest stands near $4.37 million, up approximately 3.1% over 24 hours. Futures volume has reached $8.95 million against approximately $1.31 million in spot volume. Funding is positive at around 0.0561%. Futures activity is nearly seven times spot volume. This suggests speculative positioning is significantly more active than direct spot trading. Positive funding also indicates that leveraged buyers are paying to maintain long positions. I would prefer stronger spot participation before treating this as a sustainable recovery. The fundamental picture is considerably stronger. NVIDIA reported Q3 fiscal 2027 revenue of $115.8 billion, representing 103% annual growth. Data Center revenue reached $107.6 billion, up 110% year over year, while gross margin remained strong at 74.8%. Net income reached $65.3 billion. More importantly, NVIDIA expects approximately $130 billion in Q4 revenue, demonstrating that demand for AI computing infrastructure continues expanding. Its Vera Rubin computing platform has also started shipping, adding another potential growth driver beyond its existing GPU infrastructure. However, strong financial results do not automatically mean the stock is attractively valued. Expectations, capital expenditure sustainability and competition remain important risks. Tokenization introduces another investment dimension. NVDAX is issued through a separate financial structure backed by NVIDIA shares. Its circulating supply is approximately 743,000 tokens, against roughly 1.67 million total tokens. Supply can expand or contract through issuance and redemption rather than conventional crypto emissions. An important distinction: NVDAX holders are not direct NVIDIA shareholders and do not receive voting rights. Underlying dividend payments are incorporated into the reference value net of applicable taxes rather than paid as direct shareholder distributions. Issuer risk, custody arrangements, redemption conditions and secondary-market liquidity therefore matter alongside NVIDIA’s performance. Technically, I am watching: * $150–$151: Immediate support. * $162: First resistance and recovery confirmation. * $171–$172: Stronger upside recovery zone. A sustained breakdown below $150 would weaken the current structure. My view is that NVDAX offers an interesting bridge between traditional equity exposure and blockchain-based ownership infrastructure. NVIDIA’s financial growth provides a strong underlying narrative, but tokenized accessibility does not eliminate equity valuation risk or issuer-related risks. Can tokenized NVIDIA exposure become a meaningful gateway for global digital investors, or will liquidity, custody and regulatory limitations restrict its long-term adoption? #IMPACTbyTrade $NVDAXUSDT