The Trading Chart is one of your most powerful tools on Bybit. Knowing how to navigate and use its features can help you build stronger trading strategies across all available products and monitor the market’s evolution.
You can find below a full breakdown of what's available and how to access it.
Spot Trading Chart Features
Futures & TradFi Perpetual Trading Chart Features
CFD Trading Chart Features
Spot Trading Chart Features
Please refer to the screenshot below to learn more about the location of each item in your Spot Trading Chart.
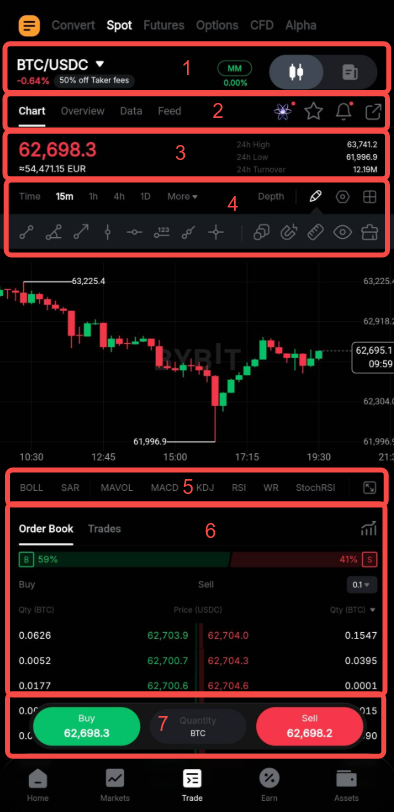
1. Trading Interface
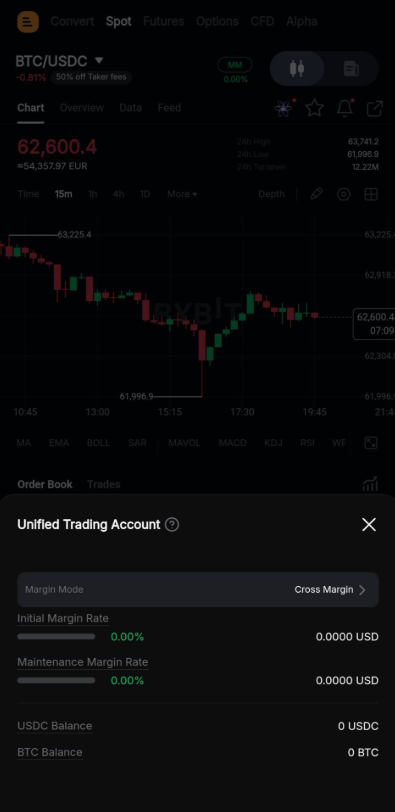
Easily move around the different trading products by tapping on the trading pair name to access the trading pair menu and easily switch between the Chart Page and the Order Page by using the toggle on the right side. The Maintenance Margin rate in between helps you easily check your current account performance and tapping on the information opens a small window with the relevant account balance and margin details.
2. Detailed Trading Pair Data and Easy Access to Key Features
Get specific trading pair information in the following tabs:
- Chart: This tab is shown by default and displays the trading chart.
- Overview: Learn more about the coin and its history in the different sub-tabs. Go to the sub-tab Network to have direct access to deposit and withdrawal status information for both coins.
- Data: Have a look at the historical trading data for the trading pair, including its trading volume, fund flow, and trends.
- Feed: Access all the latest news for this trading pair and other crypto information via this tab.
On the right side, find additional icons for easy access:
- TradeGPT icon: Tap on this icon to open your personal AI trading assistant.
- Favourites icon: Tap on the star icon to add the current trading pair to your favourites list.
- Strategy Alert icon: You can create a strategy alert for this trading pair by tapping on the bell icon. For more details on how to set up different price alerts and custom widgets, please follow these guides:
- How to Manage Your Trade Settings
- How to Add Bybit Widgets on Your Home Screen
- Share icon: Once you click on the Share icon, the system will take a screenshot of your current chart view that you can share as a poster to your friends via different means.
3. General Trading Pair Information
You can find the last traded price for the Spot Trading pair as well as data over the last 24 hours in this section.
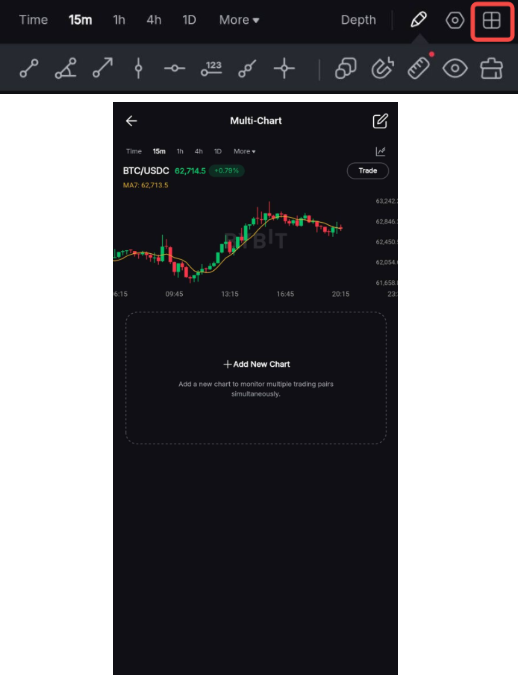
4. Chart Display Parameters
Add and manage an extensive list of technical indicators on the chart.



5. Chart Indicators
Scroll from left to right to see the list of available indicators to display on your chart and tap on the indicator you want to display/hide in the chart. Once visible, it will also be listed in the top right corner where you can manage its display and update its settings.
On the right side, use the Expand Chart icon to display the chart in full screen in landscape view. Tap on the Expand Chart icon again to reduce the chart display back to its original size.
6. Order Book
Please refer to this article for more details on the order book and how to understand its trading information. Next to the Order Book tab, the Trade tab will list down the most recent trades executed in this trading pair. You can also tap on the Trade Analysis icon on the right side to easily check your personal account data and performance metrics in Spot Trading.
7. Customized Order Panel
There are two possible interfaces for this order panel:
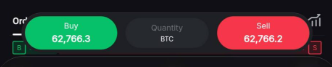

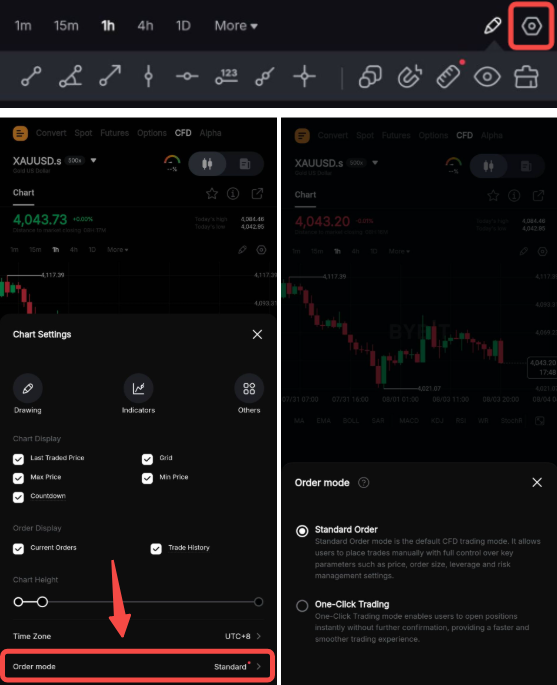
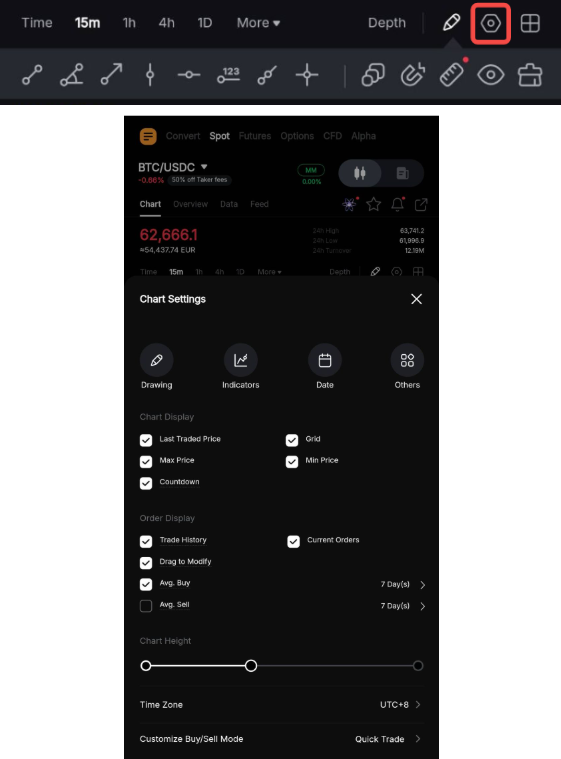
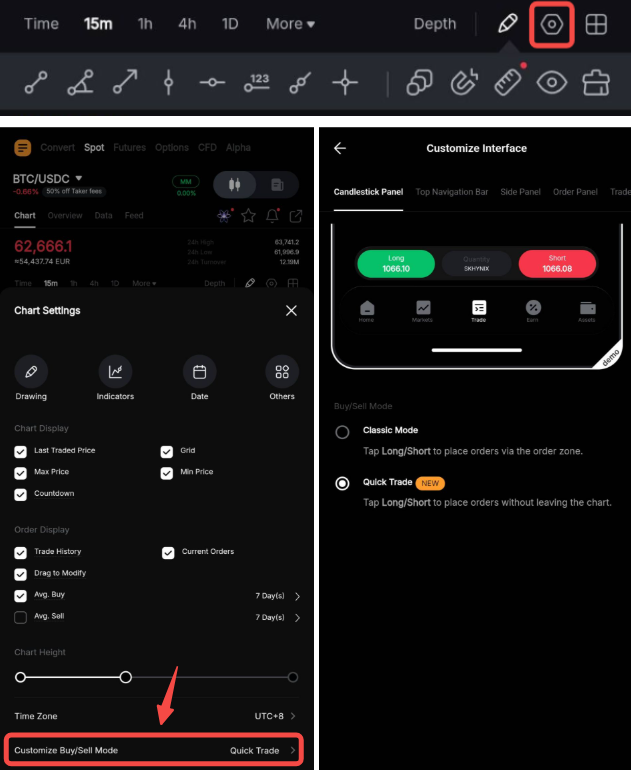
To customize the interface, open Chart Settings → Customize Buy/Sell Mode and choose your preferred Interface in the Candlestick Panel tab.
Futures & TradFi Perpetual Trading Chart Features
Please refer to the screenshot below to learn more about the location of each item in your Futures and TradFi Perpetual Trading Charts.
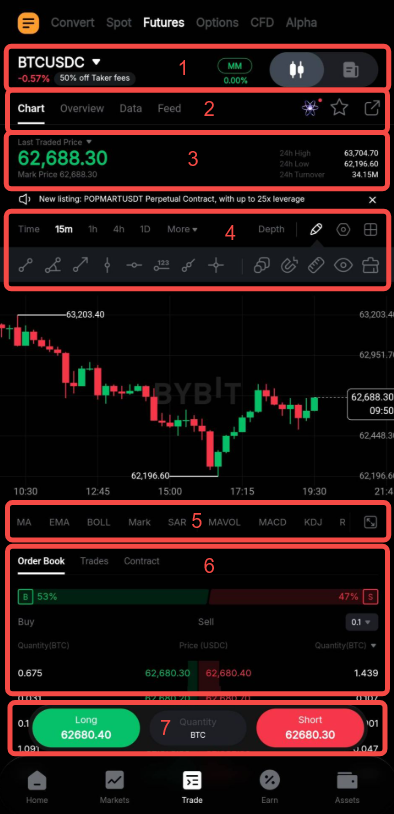
1. Trading Interface
Easily move around the different trading products by tapping on the trading pair name to access the trading pair menu and easily switch between the Chart Page and the Order Page by using the toggle on the right side. The Maintenance Margin rate in between helps you easily check your current account performance and tapping on the information opens a small window with the relevant account balance and margin details.
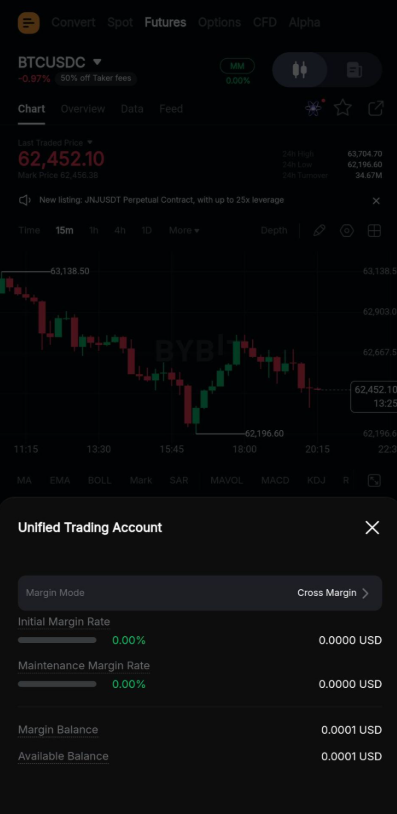
2. Detailed Trading Pair Data and Easy Access to Key Features
Get specific trading pair information in the following tabs:
- Chart: This tab is shown by default and displays the trading chart.
- Overview: Learn more about the coin and its history in the different sub-tabs.
- Data: Have a look at the historical trading data for the trading pair, including its trading volume, fund flow, and trends.
- Feed: Access all the latest news for this trading pair and other crypto information via this tab.
On the right side, find additional icons for easy access:
- TradeGPT icon: Tap on this icon to open your personal AI trading assistant.
- Favourites icon: Tap on the star icon to add the current trading pair to your favourites list.
- Share icon: Once you click on the Share icon, the system will take a screenshot of your current chart view that you can share as a poster to your friends via different means.
3. General Trading Pair Information
You can find the last traded price and mark price for the trading pair as well as data over the last 24 hours in this section. Tap on the Last Traded Price to display the price source where you can select to view the chart by Mark Price or Last Traded Price.
4. Chart Display Parameters
Add and manage an extensive list of technical indicators on the chart.
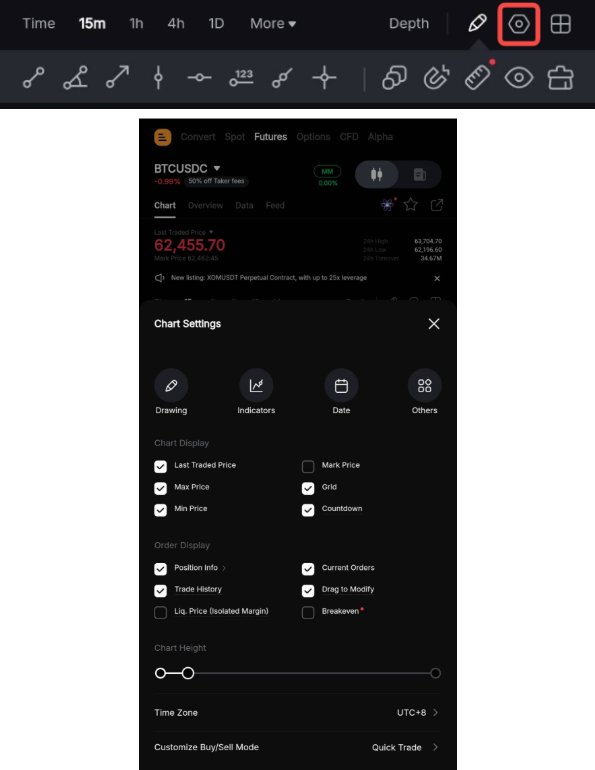
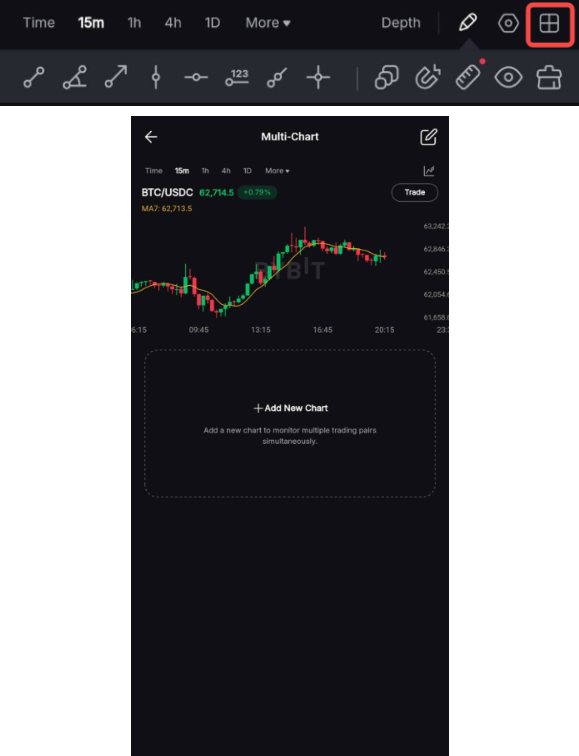
5. Chart Indicators
Scroll from left to right to see the list of available indicators to display on your chart and tap on the indicator you want to display/hide in the chart. Once visible, it will also be listed in the top right corner where you can manage its display and update its settings.
On the right side, use the Expand Chart icon to display the chart in full screen in landscape view. Tap on the Expand Chart icon again to reduce the chart display back to its original size.
6. Order Book
Please refer to this article for more details on the order book and how to understand its trading information. Next to the Order Book tab, the Trade tab will list down the most recent trades executed in this trading pair. You can also tap on the Contract tab to view the contract specification for this trading pair.
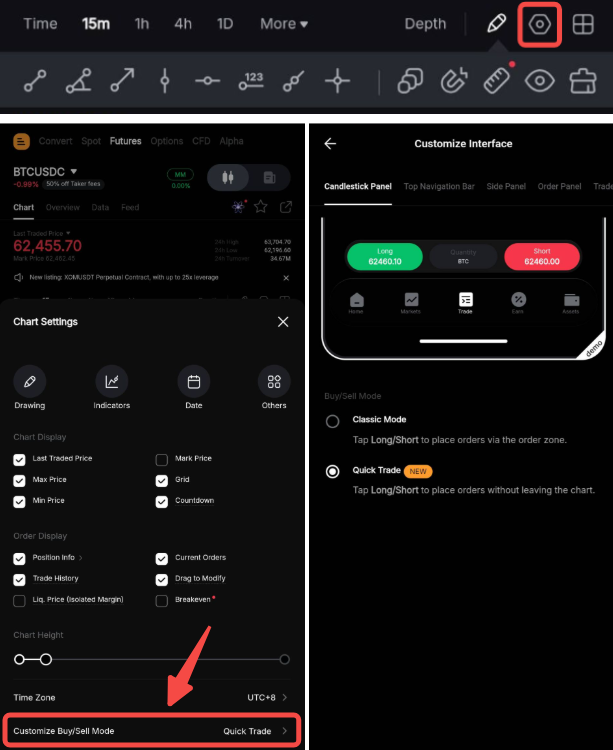
7. Customized Order Panel
There are two possible interfaces for this order panel:

To customize the interface, open Chart Settings → Customize Buy/Sell Mode and choose your preferred Interface in the Candlestick Panel tab.
CFD Trading Chart Features
Please refer to the screenshot below to learn more about the location of each item in your CFD Trading Chart.
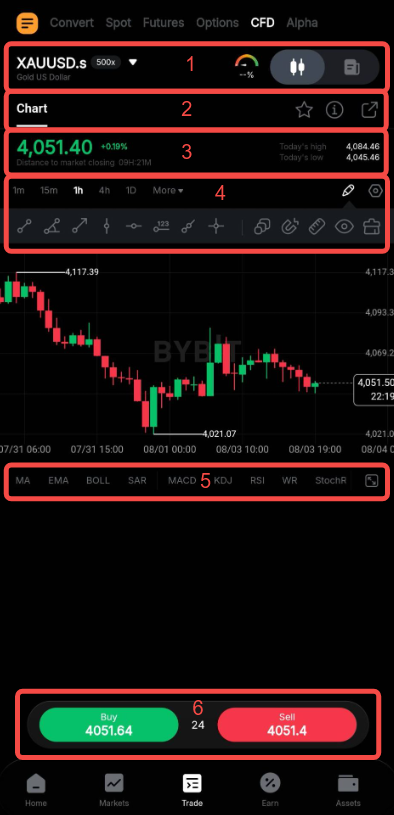
1. Trading Interface
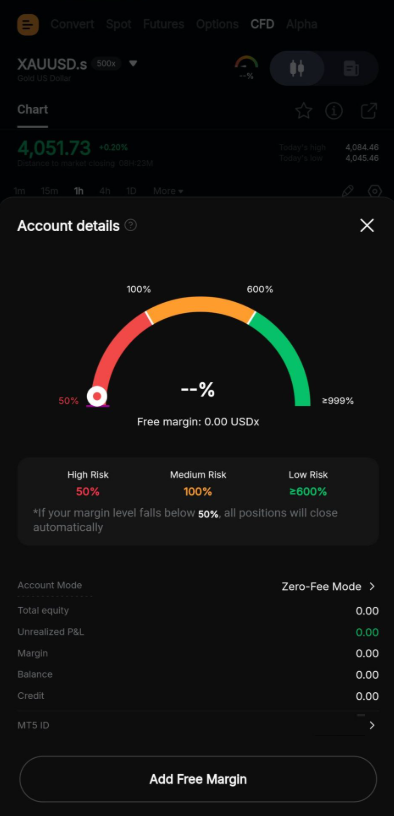
Easily move around the different trading products by tapping on the trading pair name to access the trading pair menu and easily switch between the Chart Page and the Order Page by using the toggle on the right side. The Account risk icon in between helps you easily check your risk status and tapping on the information opens a small window with the relevant MT5 CFD account balance, margin details and MT5 ID information.
2. Detailed Trading Pair Data and Easy Access to Key Features
The Chart tab displays the trading chart and on the right side, you can find additional icons for an easy access:
- Favourites icon: Tap on the star icon to add the current trading pair to your favourites list.
- Info icon: Learn more about the contract details, opening and closing times as well as margin requirements in this tab.
- Share icon: Once you click on the Share icon, the system will take a screenshot of your current chart view that you can share as a poster to your friends via different means.
3. General Trading Pair Information
You can find the last traded price for the trading pair as well as data over the last 24 hours in this section.
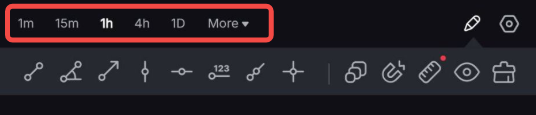
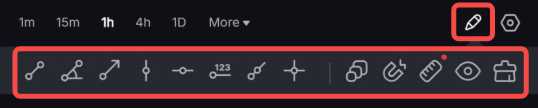
4. Chart Display Parameters
Add and manage an extensive list of technical indicators on the chart.
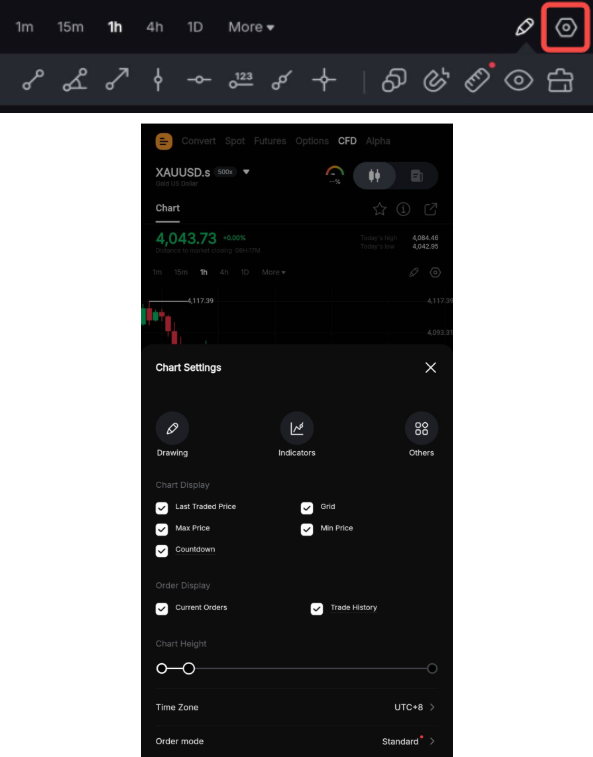
5. Chart Indicators
Scroll from left to right to see the list of available indicators to display on your chart and tap on the indicator you want to display/hide in the chart. Once visible, it will also be listed in the top right corner where you can manage its display and update its settings.
On the right side, use the Expand Chart icon to display the chart in full screen in landscape view. Tap on the Expand Chart icon again to reduce the chart display back to its original size.
6. Customized Order Panel
There are two possible interfaces for this order panel:
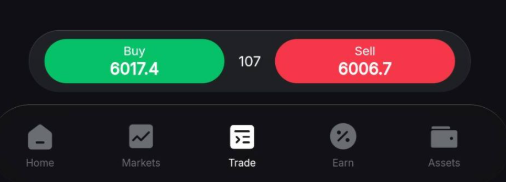
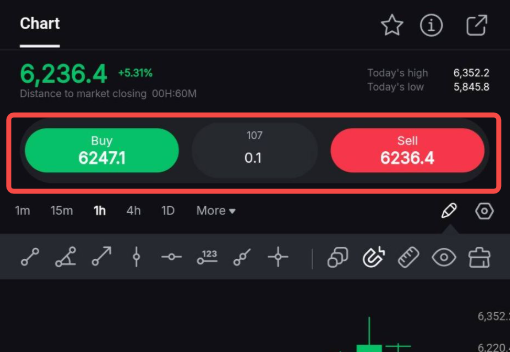
To customize the interface, open Chart Settings → Order Mode and choose your preferred Interface.