Naxeer
3544Like0Shares193Fans158Follow
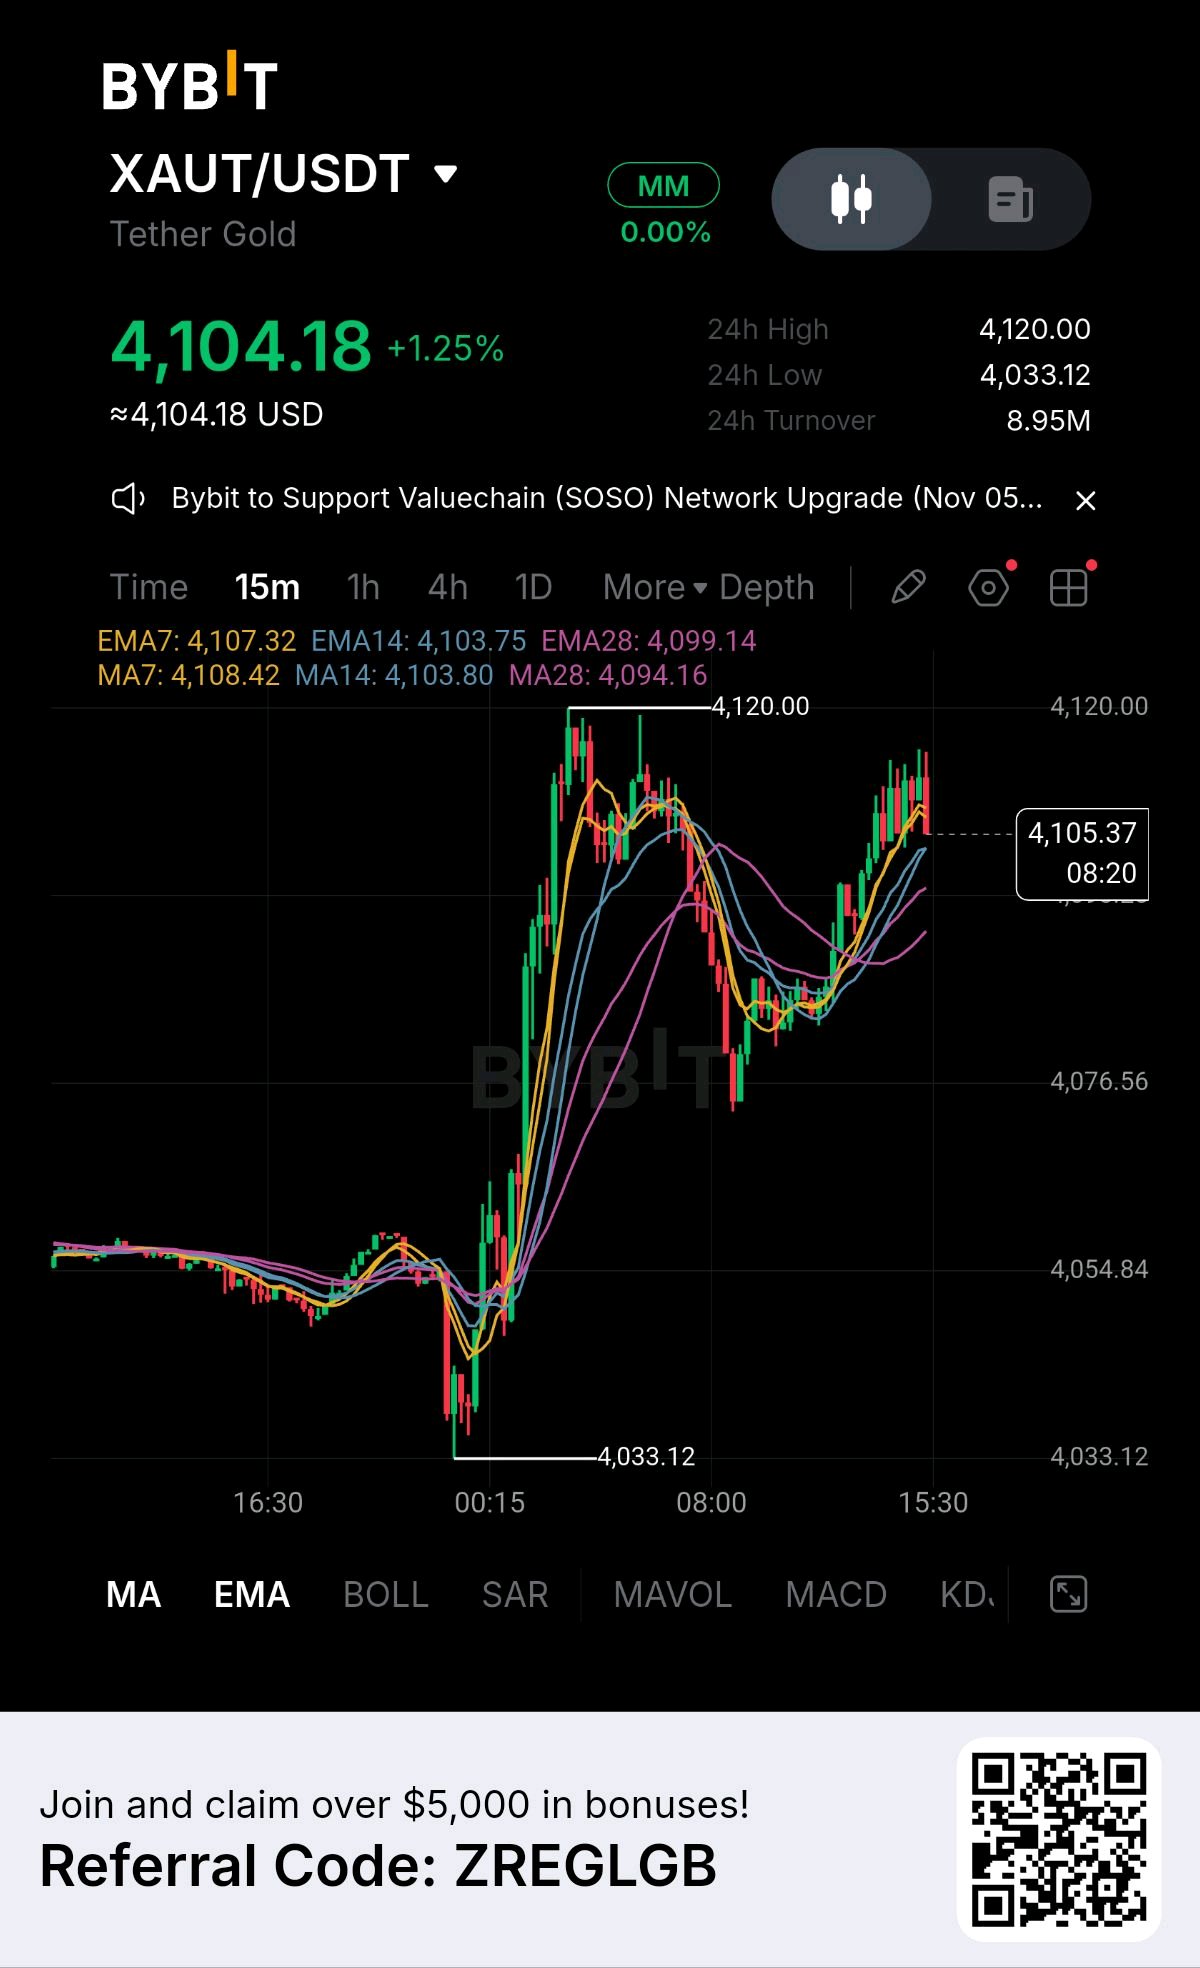
### XAUT/USDT $XAUTUSDT – 15M Market Analysis 🥇 Current price: $4,104.18 24H High: $4,120.00 24H Low: $4,033.12 ### 1\. Market Structure * Gold has made a strong bullish recovery from $4,033. * Buyers pushed price toward $4,120. * A correction followed, finding support around $4,076. * Buyers have regained momentum, but price is now facing resistance around $4,115–$4,120. ### 2\. EMA Analysis * EMA 7: 4,107.32 * EMA 14: 4,103.75 * EMA 28: 4,099.14 The EMA structure remains bullish overall. However, price is currently below EMA 7, suggesting short-term cooling. ### 3\. Important Price Levels | Level | Price | | -------------------- | ----- | | Major resistance | 4,120 | | Resistance | 4,115 | | Immediate resistance | 4,108 | | Current price | 4,104 | | Support | 4,099 | | Strong support | 4,076 | | Major support | 4,054 | ### 4\. Trading Scenarios Bullish scenario If price holds above $4,099 and breaks $4,115, buyers could target: * $4,120 * $4,130 * $4,140 Bearish scenario If price loses $4,099 with strong selling pressure, watch for: * $4,090 * $4,076 * $4,054 ### 5\. Trading Strategy * Long: Wait for confirmation above $4,115. * Short: Watch for rejection around $4,115–$4,120. * Avoid: Chasing entries in the middle of the range. My verdict: Gold remains bullish on the 15-minute structure, but $4,115–$4,120 is a critical resistance zone. Wait for a breakout or a confirmed rejection before entering. Analysis based on your uploaded chart, not live market data. Always use a stop-loss and manage position size carefully. #WSOT2026 #NovUSCPIWatch #USPayrollsAndRateDecisionsDriveMacroWeek #WSOTPicktoEarn10U #BybitAIEvolving @$BTCUSDT
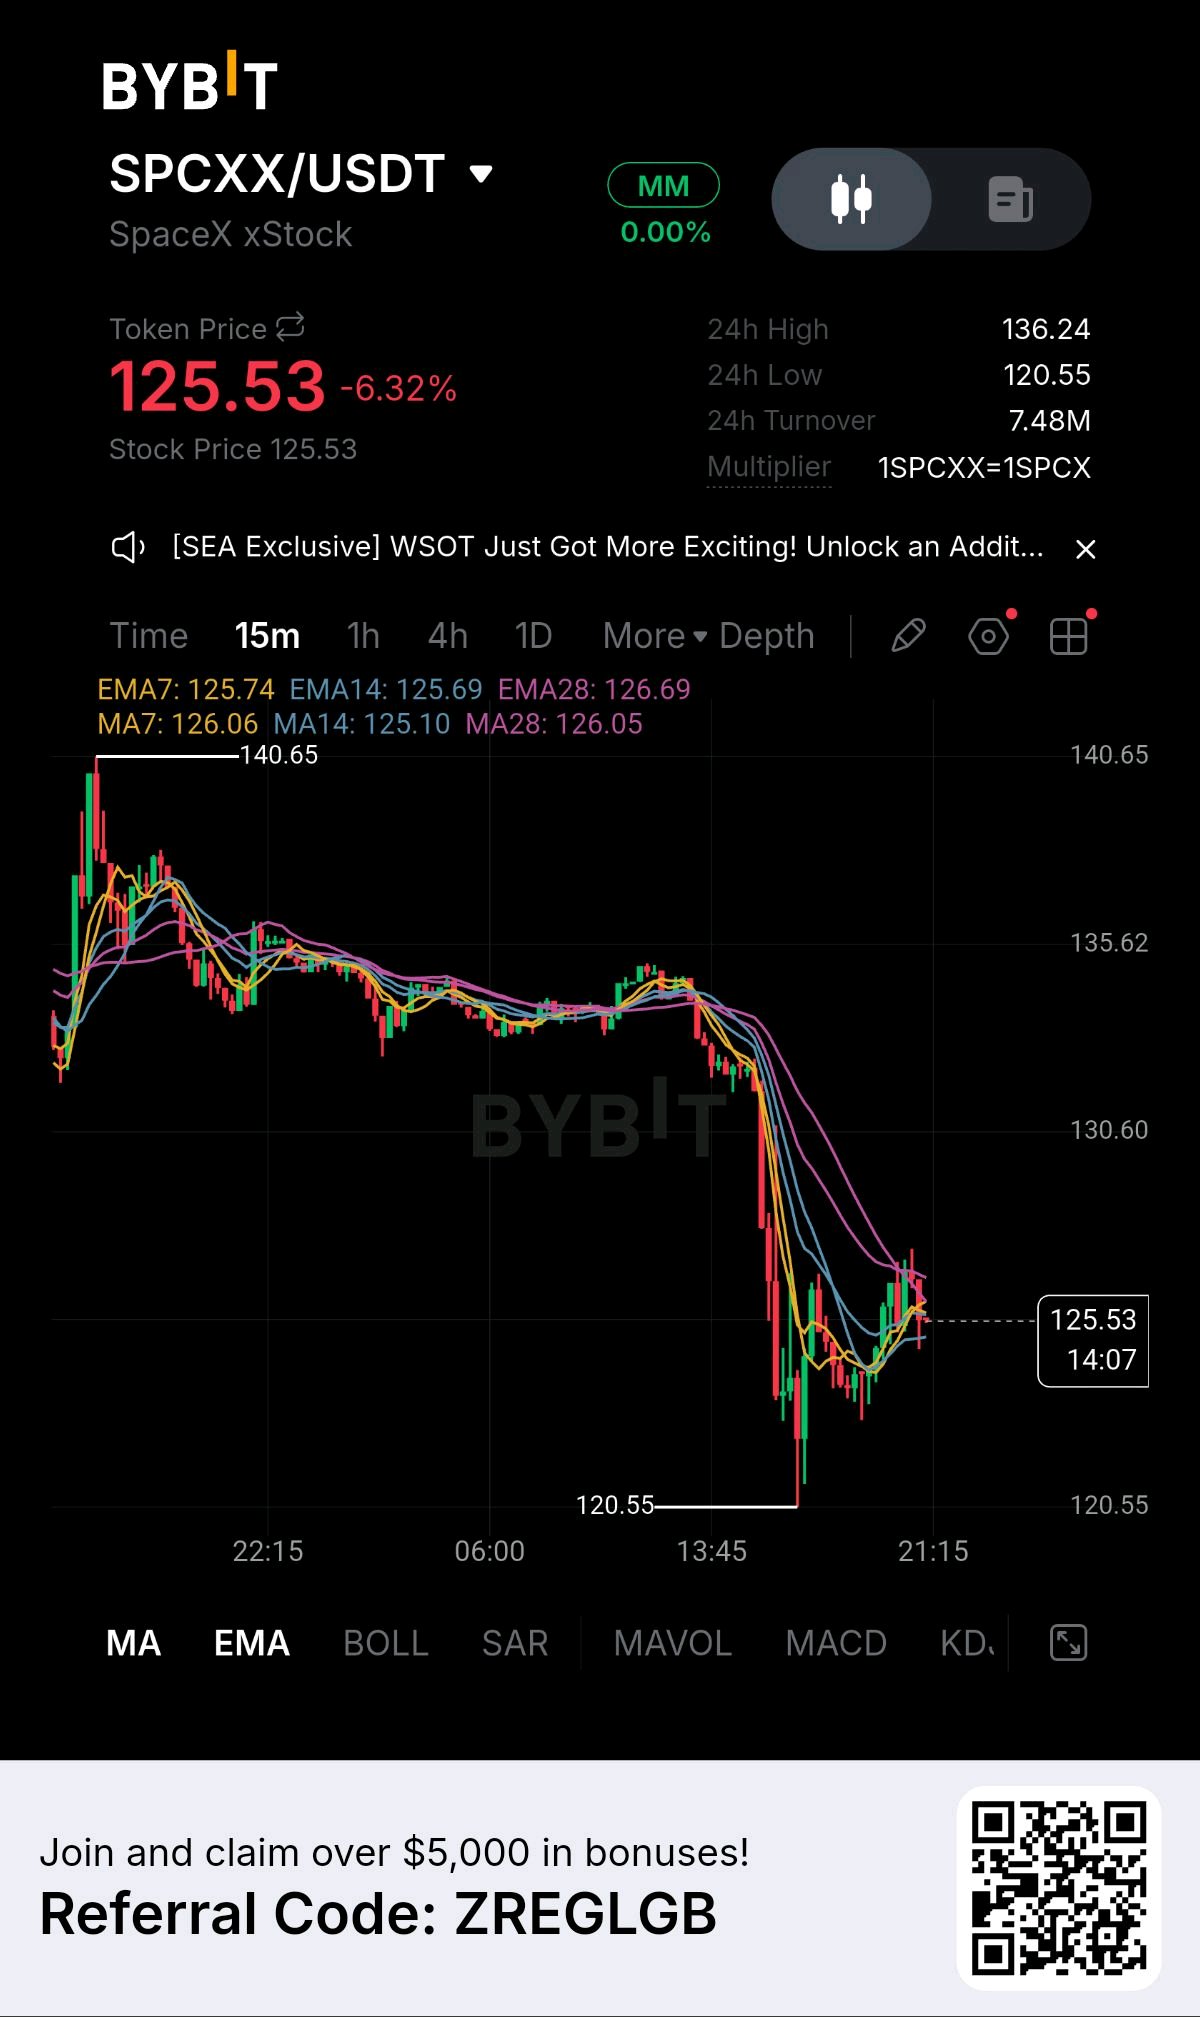
#ByXIMPACT ### SPCXX/USDT – 15-Minute Market Analysis ### $125.53 -6.32%Bearish trend Exchange: Bybit Trading pair: SPCXX/USDT (SpaceX xStock) Timeframe: 15 minutes ### 1\. Market Structure SPCXX is showing a strong bearish structure after falling from around $134 to a low of $120.55. Current observations: * Sellers remain in control of the broader short-term trend. * Price is trading below EMA28 ($126.69). * EMA7 ($125.74) and EMA14 ($125.69) are close to the current price. * The recent bounce looks like a recovery attempt, not yet a confirmed trend reversal. ### 2\. Important Support and Resistance | Level | Price | | ------------- | ------- | | Resistance 3 | $130.60 | | Resistance 2 | $128.00 | | Resistance 1 | $126.70 | | Current price | $125.53 | | Support 1 | $124.00 | | Support 2 | $122.00 | | Major support | $120.55 | ### 3\. Trading Scenarios SHORT scenario Bearish preference Consider a short only after rejection around $126.00–$126.70. * TP1: $124.00 * TP2: $122.00 * TP3: $120.55 LONG scenario Needs confirmation A 15-minute candle close above $126.70 followed by a successful retest could open a recovery opportunity. * TP1: $128.00 * TP2: $130.60 * TP3: $133.00 ### 4\. My Trading Verdict Bearish bias The overall trend is still bearish despite the recovery from $120.55. My preferred strategy: Wait for a bounce into $126–$126.70 and watch for rejection before considering a SHORT. Do not enter immediately at $125.53. Wait for confirmation. Risk management: Use a stop-loss and avoid excessive leverage. This analysis is based on your screenshot, not live market data. One question: Which setup do you want? * SHORT entry with stop-loss and take-profit. * LONG entry with stop-loss and take-profit. #WSOT2026 #WSOTPicktoEarn10U #USPayrollsAndRateDecisionsDriveMacroWeek #BybitAIEvolving $SPCXXUSDT $BTCUSDT
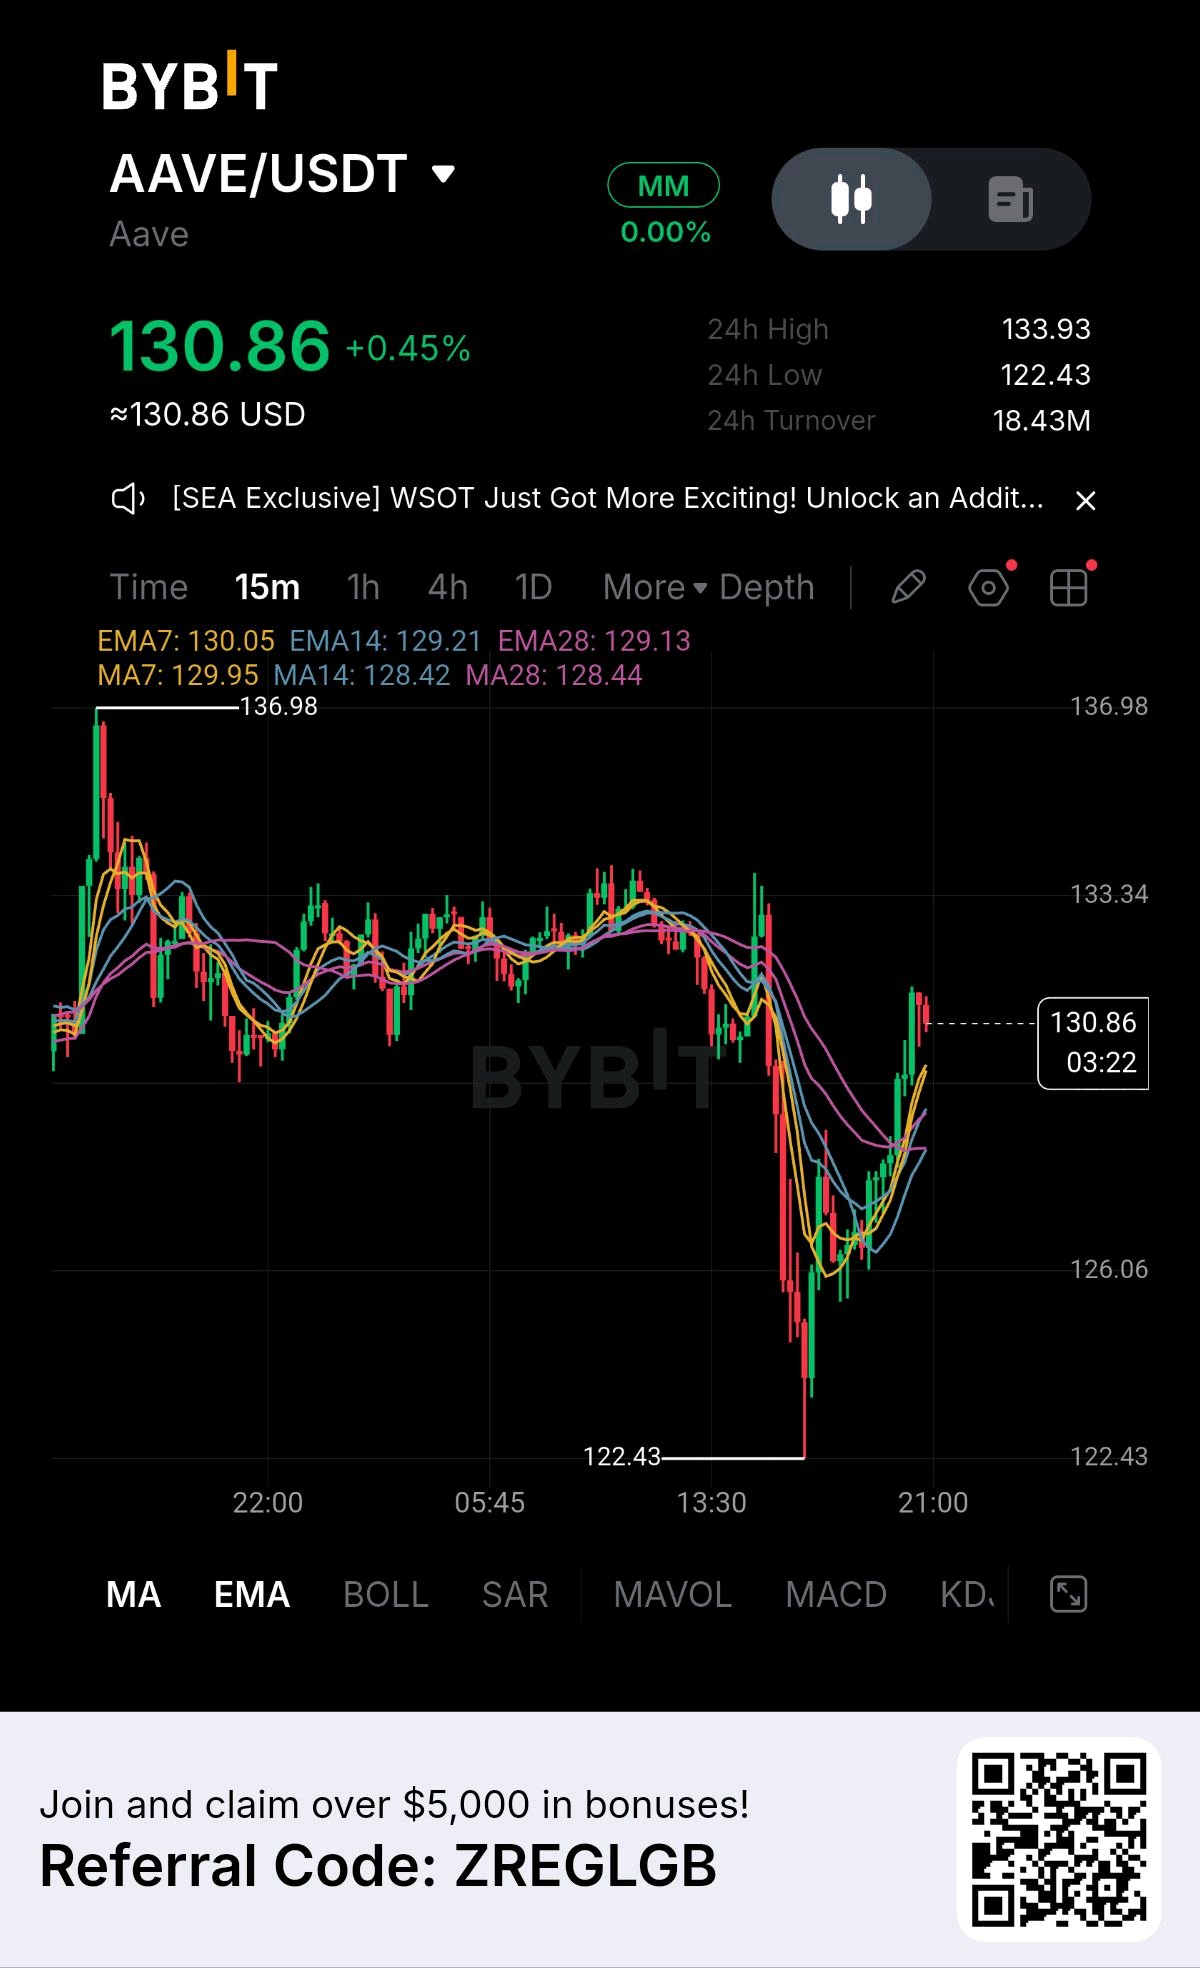
#ByXIMPACT ### AAVE/USDT$AAVEUSDT – 15-Minute Market Analysis ### $130.86 +0.45%Bullish recovery Timeframe: 15 minutes Market: Bybit AAVE/USDT ### 1\. Market Structure AAVE is showing a strong short-term recovery after dropping to $122.43. * Buyers have regained control in the short term. * Price has moved above EMA 7, EMA 14 and EMA 28. * Moving averages are turning upward. * The latest rally is approaching a potential resistance zone. ### 2\. Important Price Levels | Level | Price | Significance | | ------------- | ------- | -------------------- | | Resistance 3 | $133.34 | Major resistance | | Resistance 2 | $132.00 | Supply zone | | Resistance 1 | $131.50 | Immediate resistance | | Current price | $130.86 | Market price | | Support 1 | $130.00 | Immediate support | | Support 2 | $129.20 | EMA support | | Support 3 | $128.40 | Stronger support | | Major support | $126.06 | Breakdown level | ### 3\. Trading Scenarios Bullish scenario Preferred short-term If AAVE breaks and holds above $131.50, possible targets are: * TP1: $132.00 * TP2: $133.34 * TP3: $135.00 Bearish scenario Risk scenario If price gets rejected around $131.50 and falls below $130: * TP1: $129.20 * TP2: $128.40 * TP3: $126.06 ### 4\. My Trading View Short-term bullish bias AAVE buyers currently have the advantage, but the recent rally may experience a pullback. Avoid chasing the green candles. Best approach: Wait for a retest around $130–$129.20 and look for bullish confirmation before considering a LONG. Invalidation: A sustained move below $128.40 would weaken the bullish setup. This analysis is based on your screenshot, not live market data. Always manage risk and use a stop-loss. One important question: Are you looking for a SHORT or LONG entry? #WSOT2026 #WSOTPicktoEarn10U #USPayrollsAndRateDecisionsDriveMacroWeek #OilVolatilityTracksIranPeaceTalks $BTCUSDT
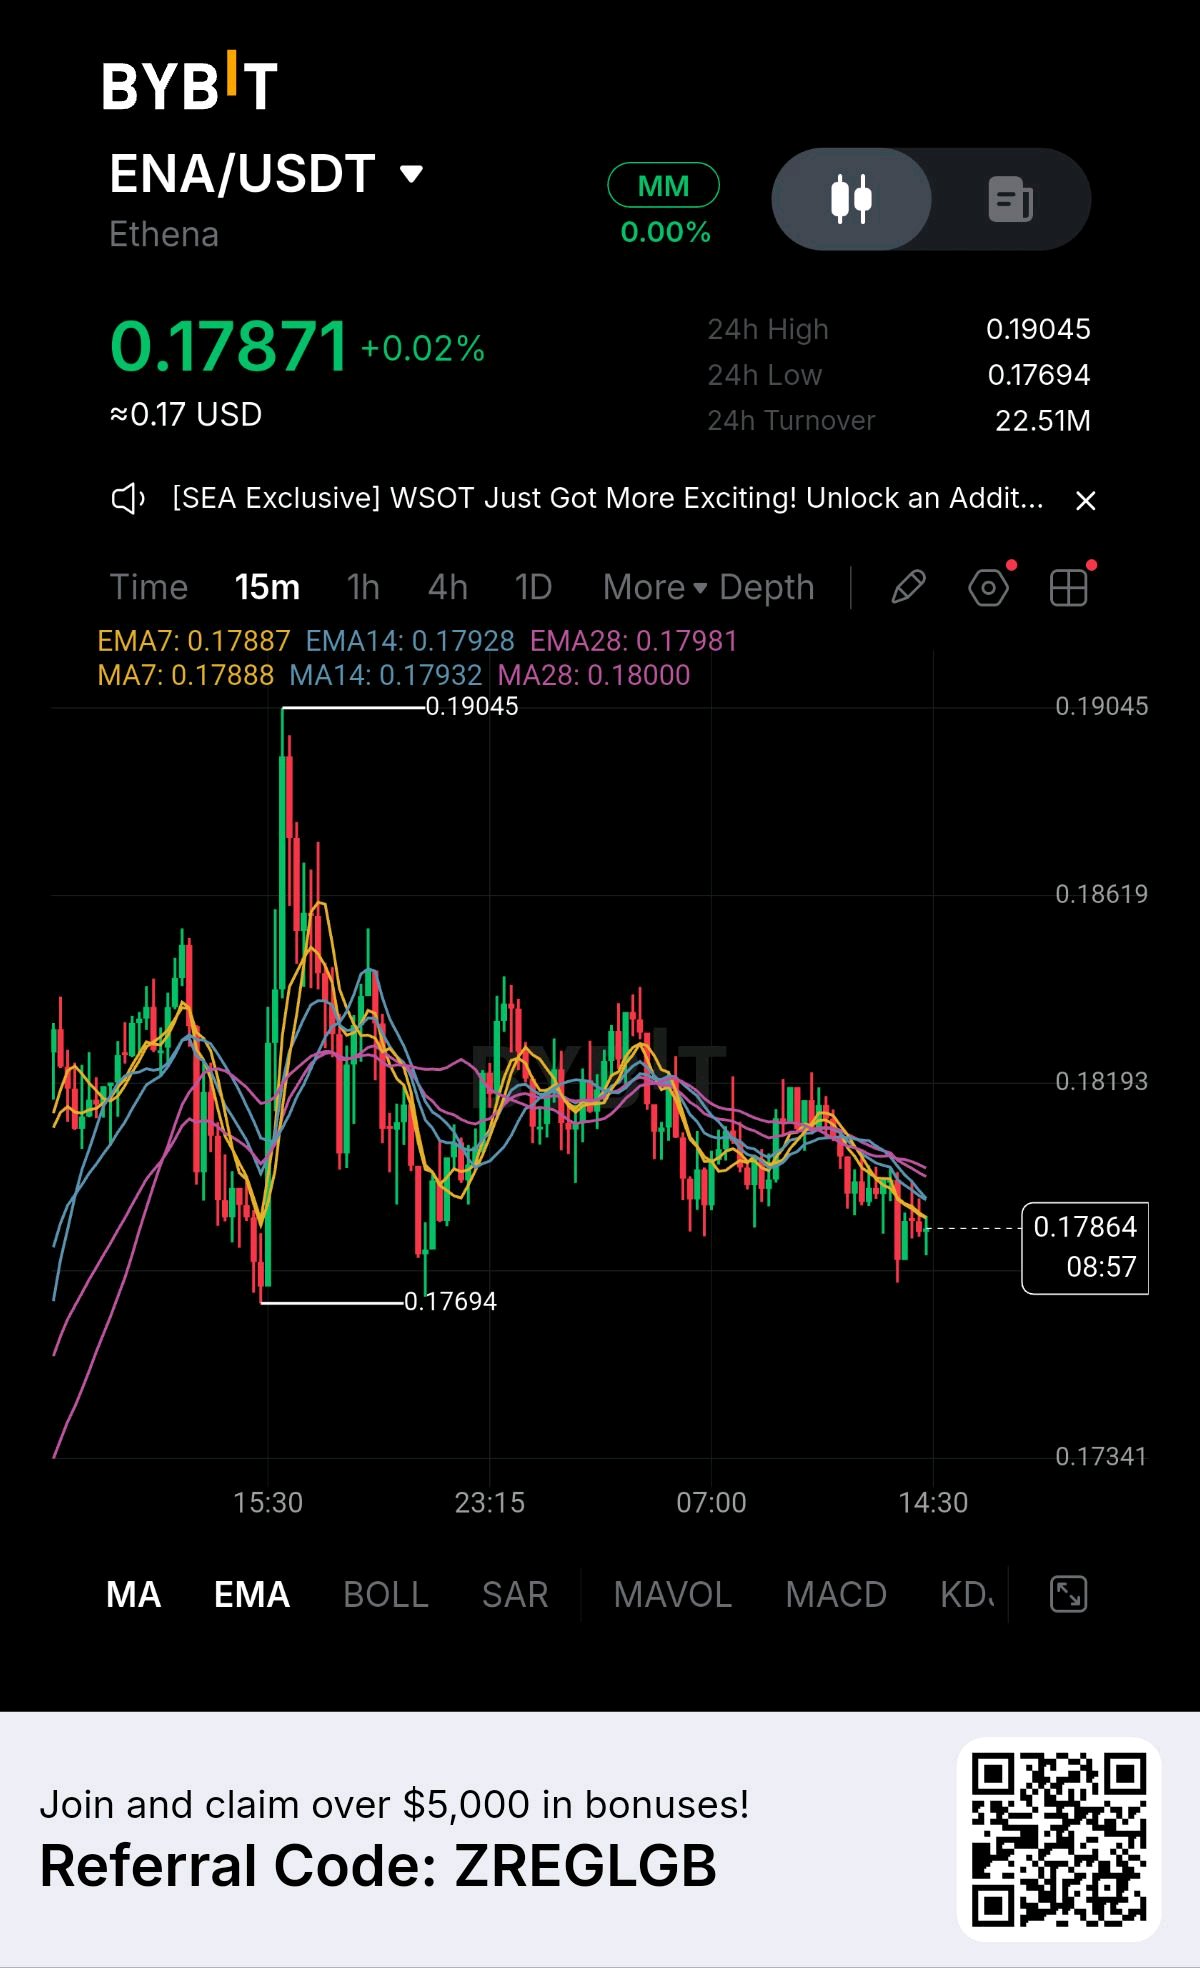
#ByXIMPACT ### ENA/USDT $ENAUSDT – Market Analysis CURRENT PRICE (FROM CHART) ### $0.17871 24h change: +0.02% | High: $0.19045 | Low: $0.17694 ### 1\. Market Structure ENA is showing short-term bearish momentum. * Price has been making lower highs. * Sellers are controlling the recent price action. * Price is trading below EMA7, EMA14 and EMA28. * The moving averages are aligned bearishly. * A small bounce is appearing near the recent lows, but bullish reversal is not confirmed. ### 2\. Important Price Levels | Level | Price | | ------------- | -------- | | Resistance 3 | $0.18193 | | Resistance 2 | $0.18000 | | Resistance 1 | $0.17930 | | Current price | $0.17871 | | Support 1 | $0.17800 | | Major support | $0.17694 | | Lower support | $0.17341 | ### 3\. Trading Setups SELL opportunity Preferred Entry: $0.17920–$0.18000 after bearish rejection. * TP1: $0.17800 * TP2: $0.17694 * TP3: $0.17500 * SL: $0.18080 BUY opportunity Only consider buying after a confirmed 15m breakout above $0.18000. * TP1: $0.18193 * TP2: $0.18300 * SL: Below $0.17850 ### 4\. What Happens Next? Bearish scenario Higher probability If ENA breaks $0.17694, sellers could push price toward $0.17500 and $0.17341. Bullish scenario Needs confirmation If buyers reclaim $0.18000 and hold above it, ENA could recover toward $0.18193. ### 5\. Final Verdict My bias: SELL on rallies until the chart shows a confirmed bullish reversal. Don't chase the market at current price. Wait for a retest and rejection around resistance. This analysis is based on your screenshot, not live market data. Always manage leverage and risk. #WSOT2026 #WSOTPicktoEarn10U #USPayrollsAndRateDecisionsDriveMacroWeek #OilVolatilityTracksIranPeaceTalks $BTCUSDT
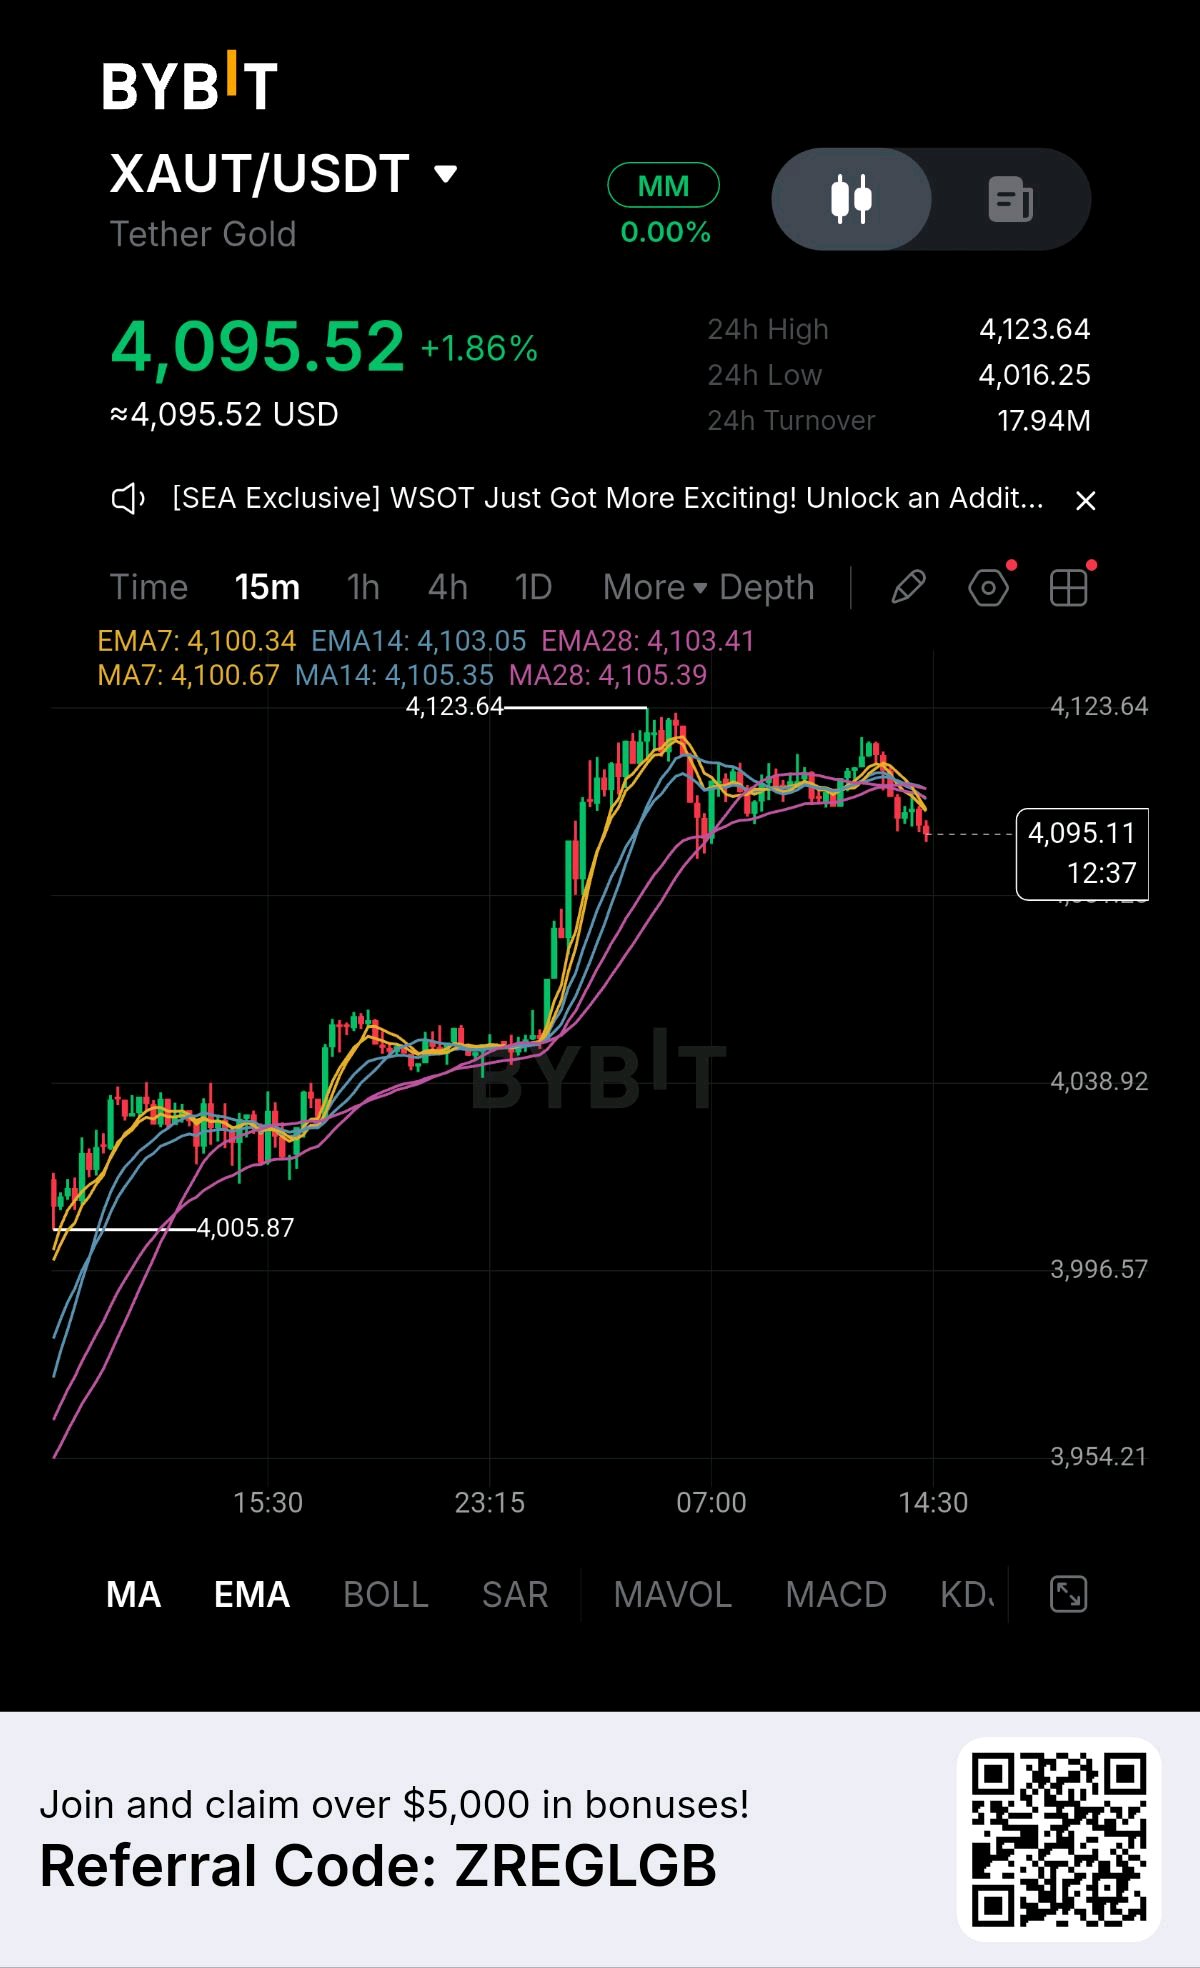
#ByXIMPACT ### XAUT/USDT $XAUTUSDT – Gold Market Analysis ### $4,095.52 +1.86% (24h) ### 1\. Market Structure * Gold experienced a strong bullish rally from around $4,005 to $4,123. * Price is now consolidating after the rally. * Recent candles show lower highs and bearish pressure. * Price is trading below the short-term moving averages. ### 2\. Key Technical Levels | Level | Price | | ---------------- | ------------ | | Major resistance | $4,123.64 | | Resistance 2 | $4,115 | | Resistance 1 | $4,103–4,105 | | Current price | $4,095.52 | | Support 1 | $4,085 | | Support 2 | $4,070 | | Major support | $4,039 | ### 3\. Trading Scenarios SELL setup Preferred short-term Entry: $4,100–4,105 after rejection. * TP1: $4,085 * TP2: $4,070 * SL: Above $4,115 BUY setup Conditional Entry: Only after a strong 15m candle closes above $4,105. * TP1: $4,115 * TP2: $4,123 * SL: Below $4,090 ### 4\. My Prediction My short-term bias is bearish because price has fallen below EMA7, EMA14 and EMA28. However, the larger intraday structure remains bullish following the strong upward move. Important confirmation: * Below $4,085: bearish continuation becomes more likely. * Above $4,105: bullish recovery becomes more likely. * Above $4,123: potential continuation of the rally. My advice: Avoid chasing entries. Wait for a clear breakout or rejection confirmation before entering. Use proper risk management. Analysis is based on your uploaded chart, not live market data. #WSOT2026 #WSOTPicktoEarn10U #USPayrollsAndRateDecisionsDriveMacroWeek #BybitAIEvolving $BTCUSDT
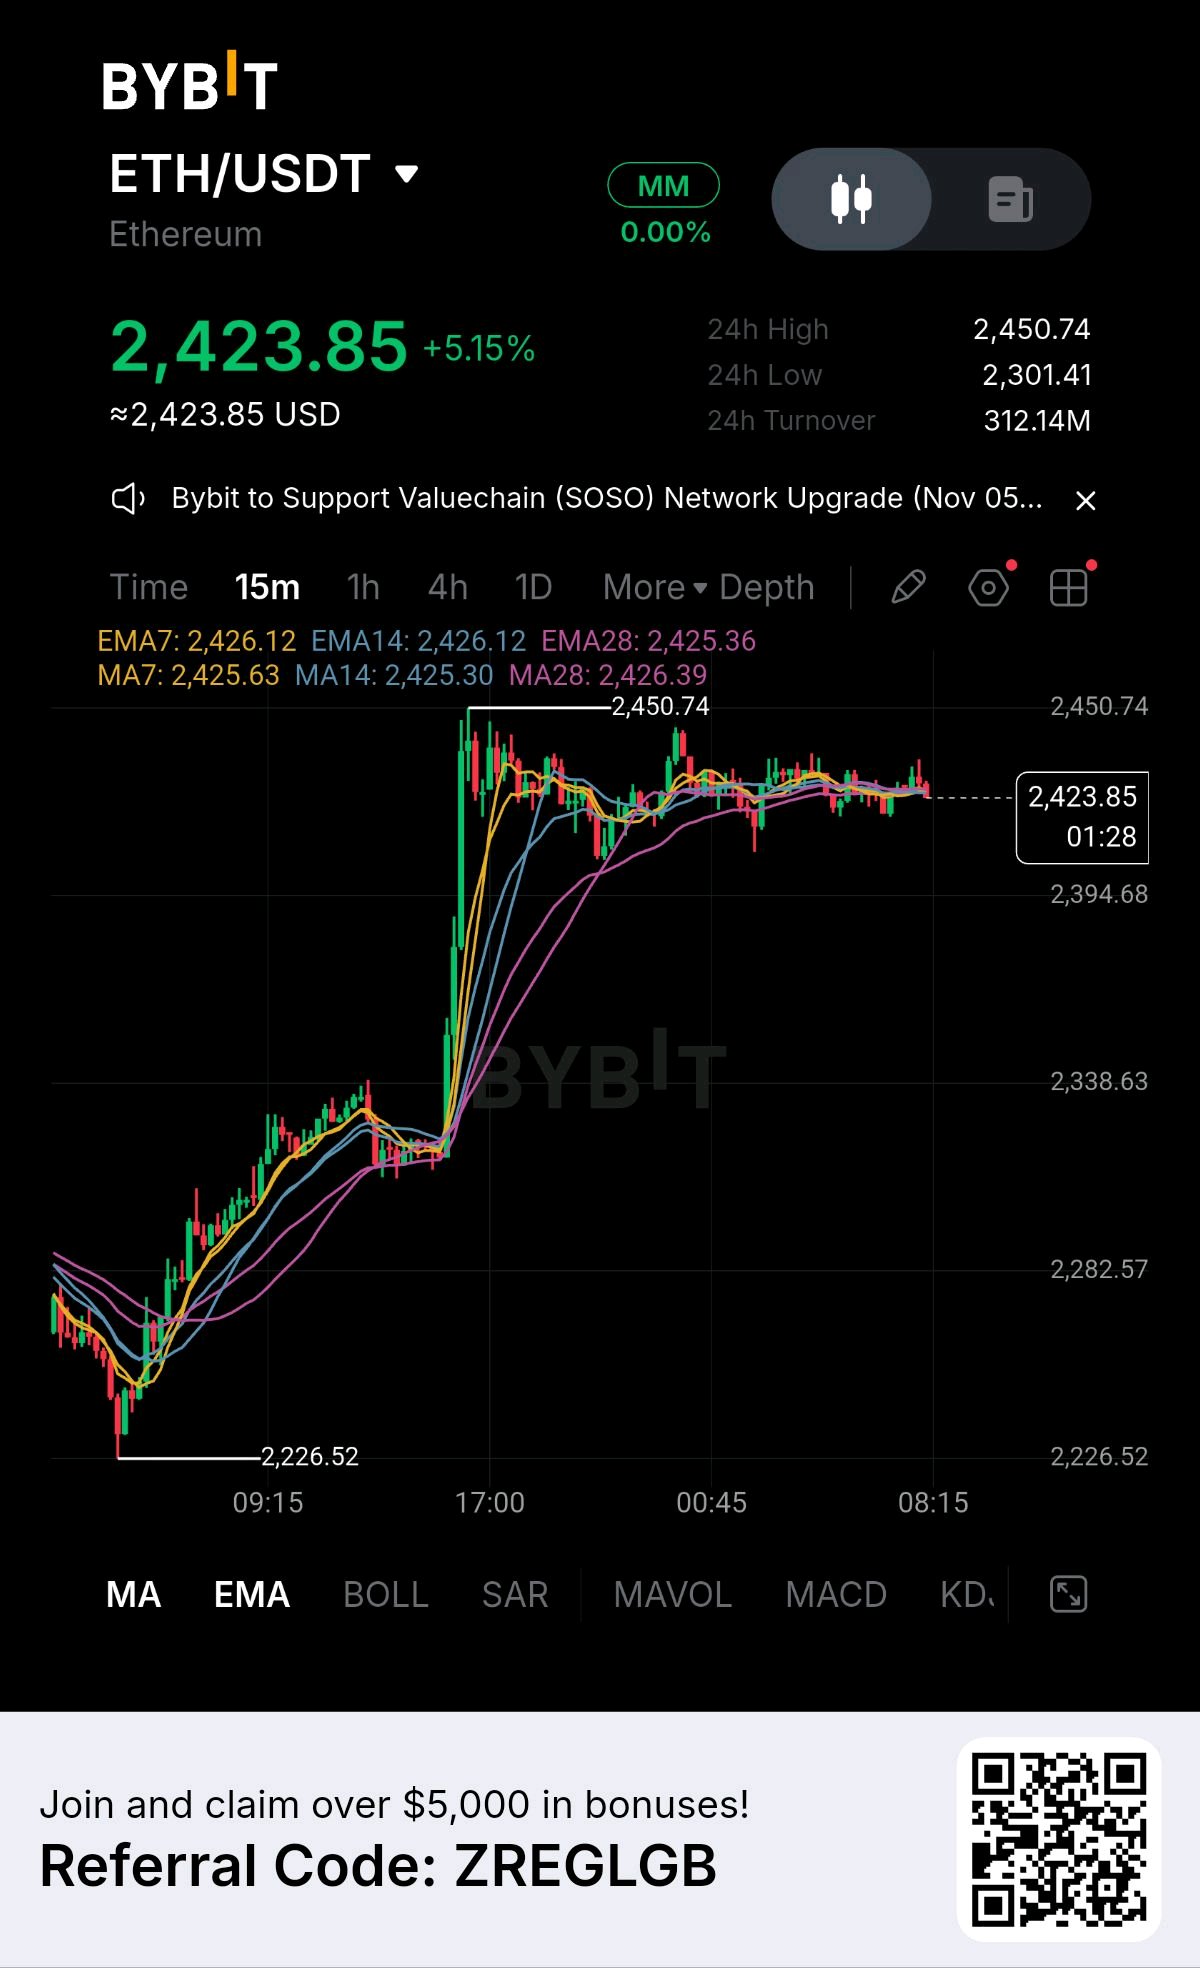
#ByXIMPACT ### ETH/USDT$ETHUSDT – 15-Minute Market Analysis Bullish trendSideways consolidation ### $2,423.85 +5.15% (24h) ### 1\. Market structure ETH has experienced a strong bullish rally from $2,226.52 to $2,450.74. Currently, price is consolidating around $2,424 after the sharp upward movement. Key observations: * Strong bullish impulse with significant buying pressure. * Price is hovering around the EMA 7, EMA 14 and EMA 28. * Moving averages are tightly clustered, indicating reduced momentum. * Resistance near $2,450.74 remains important. * Buyers are attempting to defend the $2,420 area. Interpretation: Bullish overall structure, but short-term momentum is neutral while consolidation continues. ### 2\. Important price levels | Level | Price | Significance | | ------------- | --------- | ----------------- | | Resistance 3 | $2,480 | Upside target | | Resistance 2 | $2,465 | Resistance | | Resistance 1 | $2,450.74 | Previous high | | Current price | $2,423.85 | Consolidation | | Support 1 | $2,415 | Immediate support | | Support 2 | $2,394.68 | Key support | | Support 3 | $2,370 | Deeper support | ### 3\. Trading scenarios Bullish scenario Buy confirmation: Break and hold above $2,435. * TP1: $2,450 * TP2: $2,465 * TP3: $2,480 Watch for strong volume on breakout. Bearish scenario Sell confirmation: Breakdown below $2,415. * TP1: $2,405 * TP2: $2,394 * TP3: $2,370 Watch for a failed recovery above $2,415. ### 4\. My trading strategy * Avoid chasing entries in the middle of the range. * Watch $2,415 for support confirmation. * A breakout above $2,435 could attract fresh buyers. * A rejection around $2,450 could create a pullback. * Always use a stop-loss and manage leverage carefully. ### 5\. Final market prediction ### Bullish continuation – cautiously optimistic ETH remains bullish on the broader intraday structure following its strong upward rally. However, the current sideways movement suggests buyers need fresh momentum before another major move. My most important level: $2,450.74. * Above $2,435: bullish momentum improves. * Above $2,450.74: potential continuation toward $2,465–$2,480. * Below $2,415: correction risk increases. Analysis based on your uploaded Bybit 15-minute chart. Price levels are estimates, not guaranteed outcomes. #WSOT2026 #MidtermsMarketWatch #USPayrollsAndRateDecisionsDriveMacroWeek #Oracle20BFundingPlanTestsTheAITrade $BTCUSDT
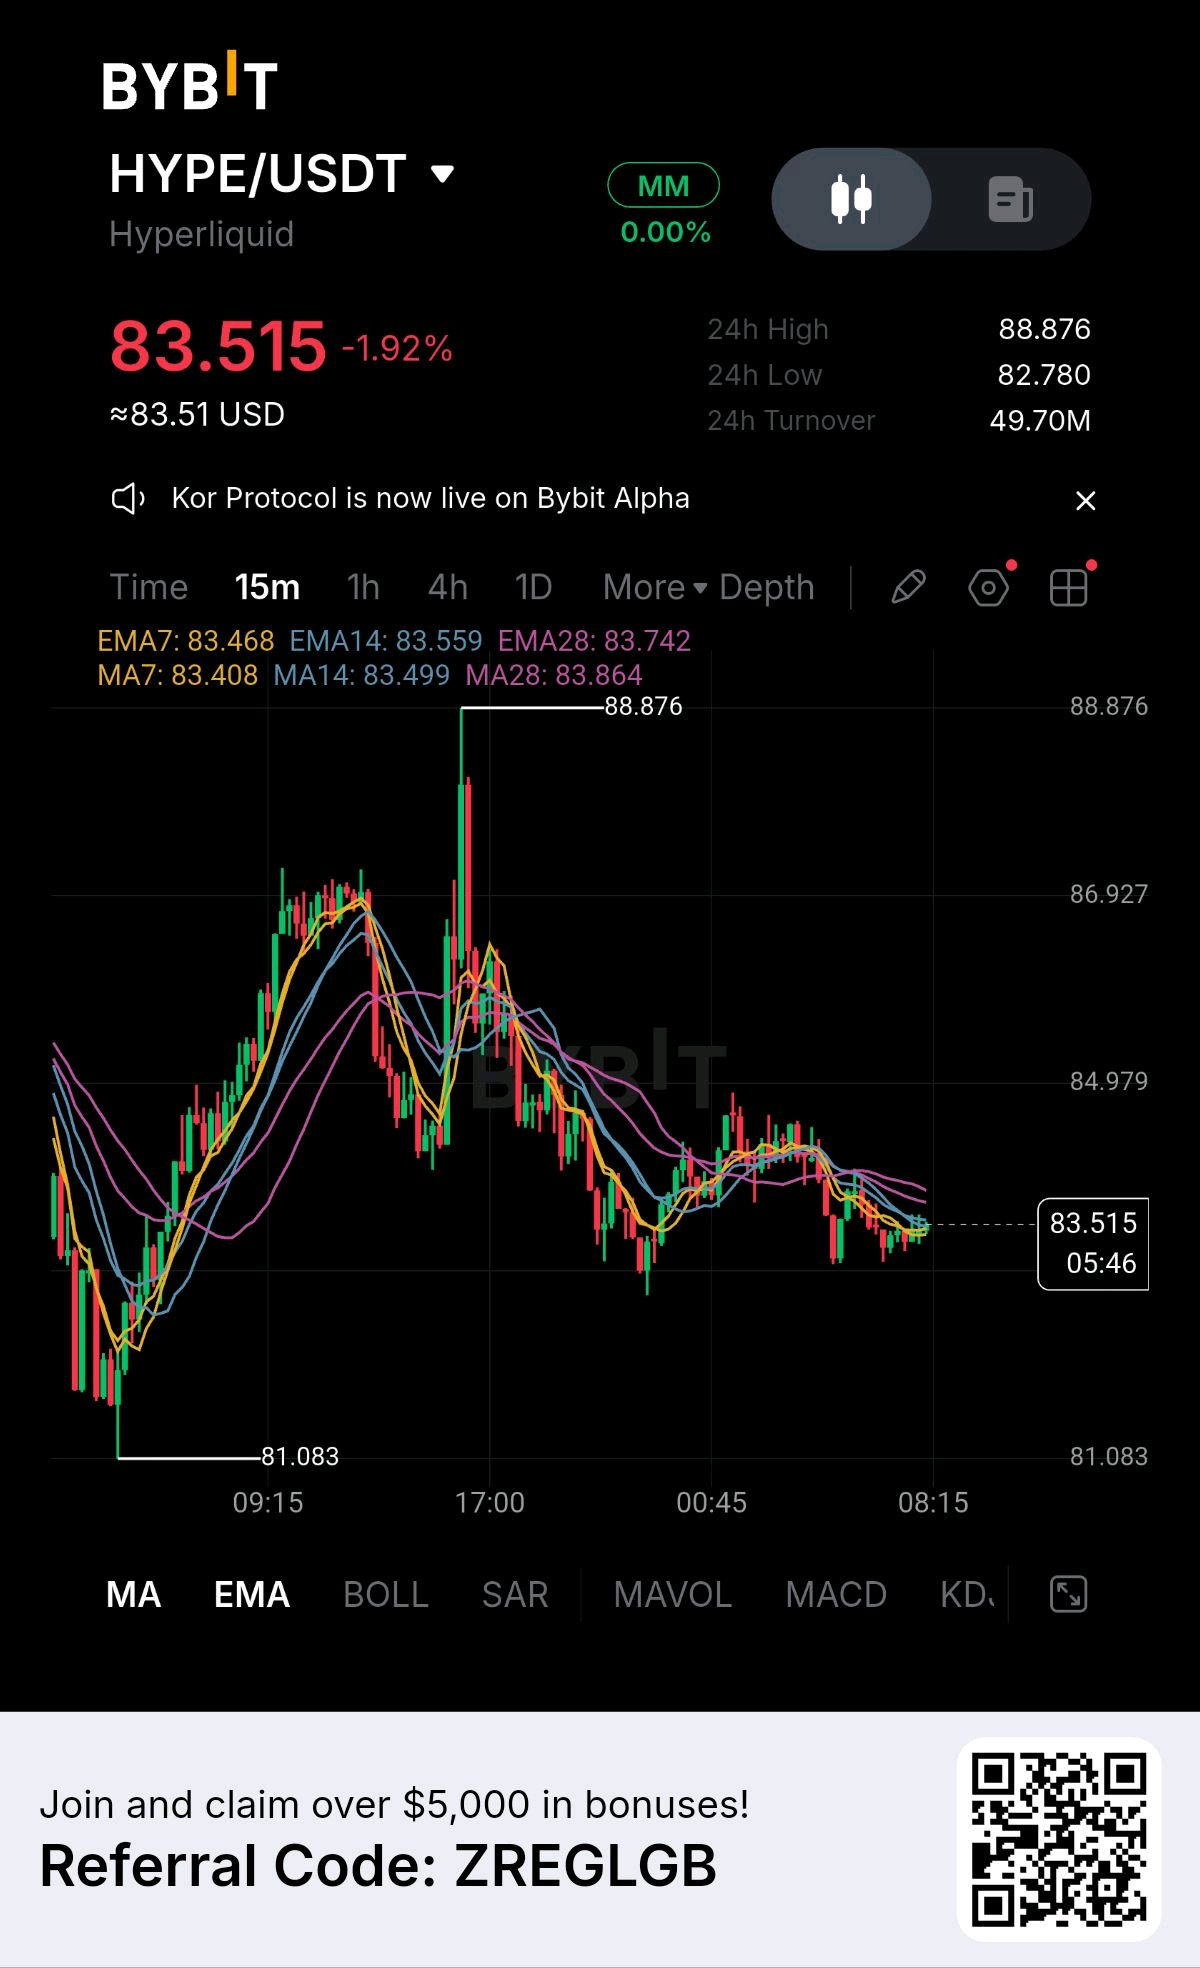
### HYPE/USDT $HYPEUSDT – 15-Minute Technical Analysis Short-term bearishConsolidation ### $83.515 -1.92% (24h) ### 1\. Market structure HYPE is currently showing short-term bearish pressure following rejection from the $88.876 high. From your 15-minute chart: * Lower highs are forming. * Price is trading below EMA 14 and EMA 28. * EMA 7 is slightly above EMA 14, showing a small short-term recovery attempt. * Buyers are defending the $83.00 area. * Overall momentum remains weak. Market interpretation: Sellers currently have a slight advantage, but buyers are attempting to establish support. ### 2\. Important price levels | Level | Price | Significance | | ------------ | ------- | -------------------- | | Resistance 3 | $85.00 | Major resistance | | Resistance 2 | $84.50 | Recovery zone | | Resistance 1 | $83.90 | Immediate resistance | | Current | $83.515 | Market price | | Support 1 | $83.00 | Immediate support | | Support 2 | $82.78 | 24h low | | Support 3 | $81.08 | Major support | ### 3\. Trading scenarios Bullish scenario Buy confirmation: 15m candle closes above $83.90 with strong volume. * TP1: $84.50 * TP2: $85.00 * TP3: $85.80 Invalidation: Loss of $83.00. Bearish scenario Sell confirmation: Breakdown below $83.00. * TP1: $82.78 * TP2: $82.00 * TP3: $81.08 Invalidation: Reclaim and hold above $83.90. ### 4\. My trading strategy * Avoid chasing a long position under $83.90. * Watch $83.00 for a possible support reaction. * A confirmed breakdown could create another short opportunity. * Wait for volume confirmation before entering. * Keep leverage and position size conservative. ### 5\. Final market prediction ### Bearish bias – possible further downside My expectation is that HYPE may continue consolidating between $83.00 and $83.90 before choosing its next direction. Critical level: $83.00. * Hold above $83.90 → bullish recovery. * Break below $83.00 → bearish continuation. Analysis based on your uploaded Bybit 15-minute chart. Levels are technical estimates, not guaranteed targets. I can also help track HYPE's next breakout and identify a higher-confidence entry setup. #WSOT2026 #MidtermsMarketWatch #USPayrollsAndRateDecisionsDriveMacroWeek #USNonfarmPayrolls #AnthropicIPOTestsTheAIBoom $BTCUSDT
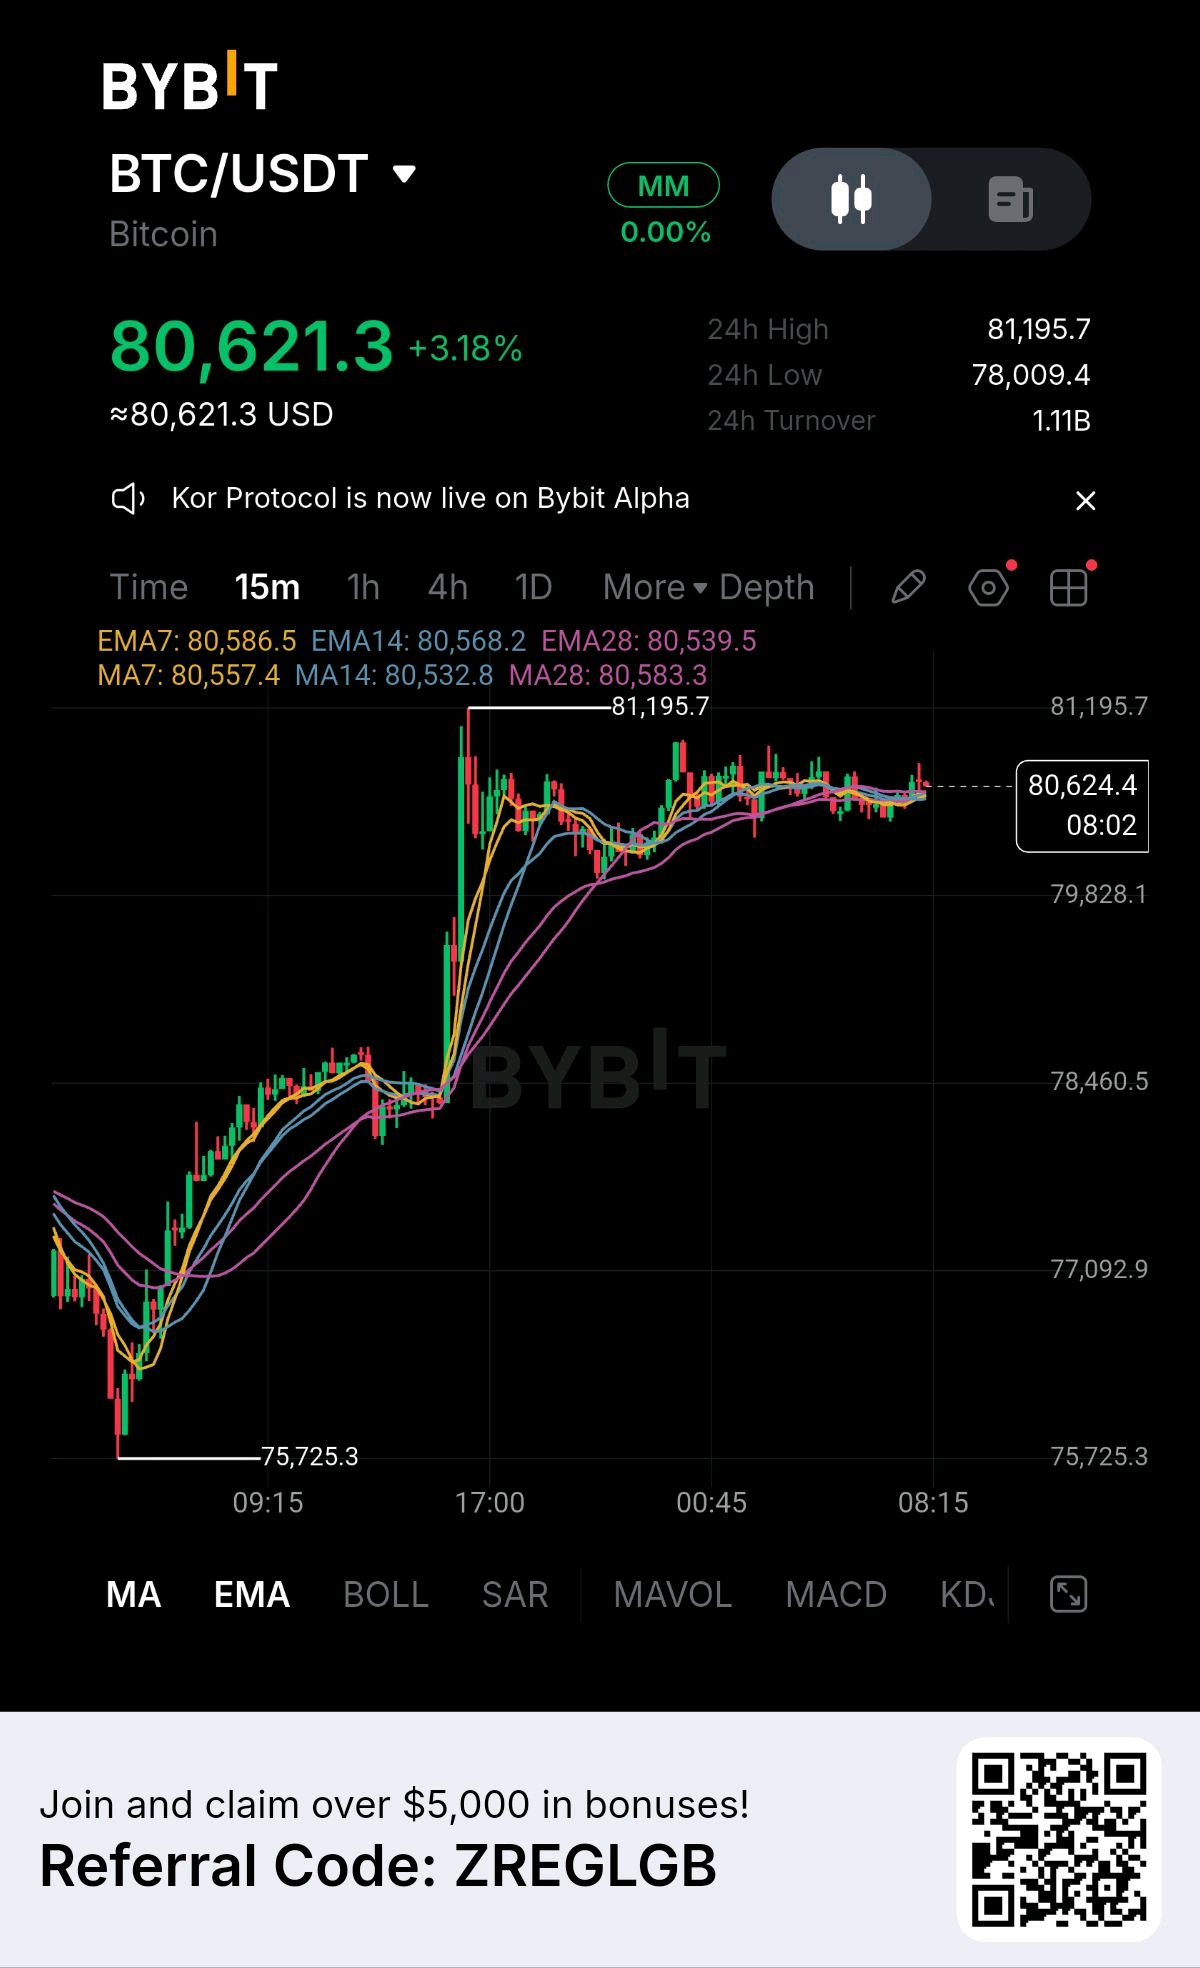
### BTC/USDT – 15-Minute Market Analysis Bullish biasConsolidation ### $80,621.3 +3.18% (24h) ### 1\. Market structure BTC has experienced a strong bullish rally from approximately $75,725 to $81,195. Currently, price is consolidating around $80,600 after the sharp upward move. * Price remains above EMA 7, EMA 14 and EMA 28. * Moving averages are tightly clustered. * Buyers still have a short-term advantage. * Momentum is cooling as the market moves sideways. Interpretation: Bullish consolidation rather than confirmed bearish reversal. ### 2\. Important price levels | Level | Price | Significance | | ---------------- | ------- | ------------------ | | Major resistance | $81,195 | Previous high | | Resistance | $80,900 | Breakout trigger | | Current price | $80,621 | Consolidation | | Support 1 | $80,500 | EMA support zone | | Support 2 | $79,828 | Key downside level | | Support 3 | $78,460 | Major support | ### 3\. Trading scenarios Bullish scenario Preferred If BTC holds $80,500 and breaks above $80,900 with strong volume: * Target 1: $81,195 * Target 2: $81,500 * Target 3: $82,000 Bearish scenario Alternative If BTC loses $80,500 convincingly: * Target 1: $80,000 * Target 2: $79,828 * Target 3: $78,460 ### 4\. Trading strategy * Long: Wait for a confirmed breakout above $80,900 or a successful retest of $80,500. * Short: Consider only after a confirmed breakdown below $80,500. * Avoid: Chasing trades in the current sideways consolidation. * Risk management: Use a stop-loss and avoid excessive leverage. ### 5\. My market prediction ### Bullish continuation – cautiously optimistic BTC buyers remain in control of the short-term structure, but the market needs a decisive breakout above $81,195 to confirm another upward leg. My key level to watch: $81,195. A rejection there could trigger another pullback before the next attempt. Analysis is based on your uploaded 15-minute chart, not live market data. These are scenarios, not guaranteed price targets. #BitcoinSlidesBelow$80K #WSOTPicktoEarn10U #WSOT2026 #MidtermsMarketWatch #USPayrollsAndRateDecisionsDriveMacroWeek $BTCUSDT
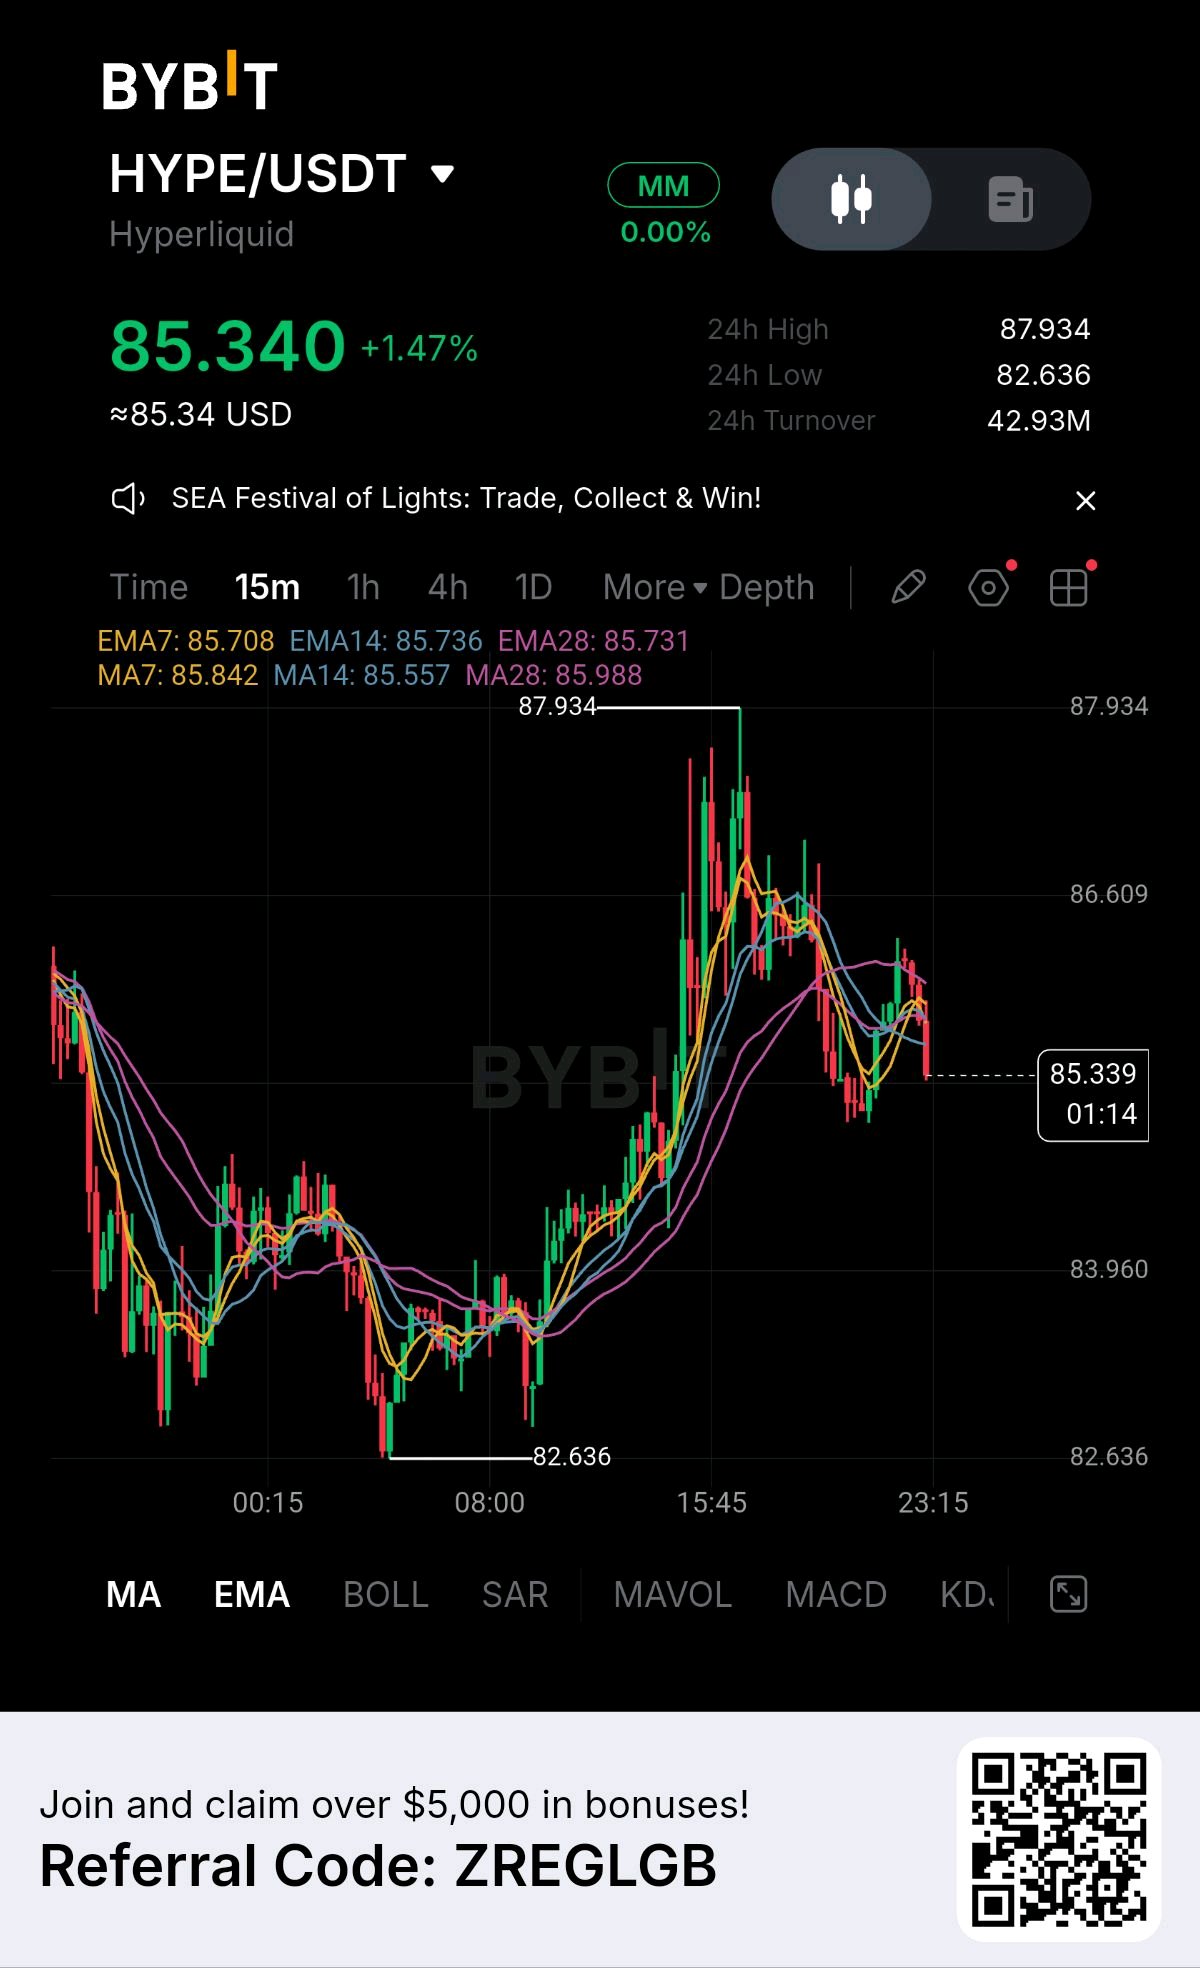
### HYPE/USDT $HYPEUSDT – 15-Minute Market Analysis Short-term bearishBroader recovery structure ### 85.340 USDT +1.47% (24h) HYPE is showing short-term selling pressure after a strong rally toward 87.934. The latest price action suggests buyers are losing momentum, with sellers defending the 85.70–86.00 region. ### 1\. Technical indicators | Indicator | Value | Signal | | --------- | ------ | ------- | | EMA 7 | 85.708 | Bearish | | EMA 14 | 85.736 | Bearish | | EMA 28 | 85.731 | Bearish | | MA 7 | 85.842 | Bearish | | MA 14 | 85.557 | Bearish | | MA 28 | 85.988 | Bearish | Price is below all six moving averages, indicating short-term bearish momentum. ### 2\. Important price levels Resistance zone 86.00 – 86.60 A breakout and hold above this area would improve bullish momentum. Current price ### 85.340 Support zone 85.00 – 84.80 First area where buyers could attempt to defend price. Lower support 83.96 – 83.50 Potential downside target if selling accelerates. ### 3\. Possible trading scenarios Bullish scenario * Price holds above 85.00. * Reclaims 85.75. * Breaks 86.00 with strong volume. * Potential targets: 86.60 → 87.00 → 87.93. Bearish scenario * Price loses 85.00. * Selling pressure increases below 84.80. * Potential targets: 84.30 → 83.96. ### 4\. Trading strategy Wait for confirmation * Avoid chasing longs while price remains below the EMAs. * Watch for a bullish reversal around 85.00–84.80. * Consider shorts only after a confirmed breakdown or rejection near resistance. * Use a stop-loss and manage leverage carefully. ### 5\. My market outlook ### Neutral to bearish HYPE has experienced a strong upward move, but the 15-minute chart is currently showing a corrective phase. The key battle is 85.00 support versus 85.75 resistance. A reclaim of 86.00 could restore bullish momentum. A breakdown below 85.00 would increase the likelihood of another downward move. Analysis based on your uploaded Bybit chart, not live market data. These levels are approximate and not guaranteed.by #WSOT2026 #MidtermsMarketWatch #USPayrollsAndRateDecisionsDriveMacroWeek #AnthropicIPOTestsTheAIBoom #Oracle20BFundingPlanTestsTheAITrade $BTCUSDT
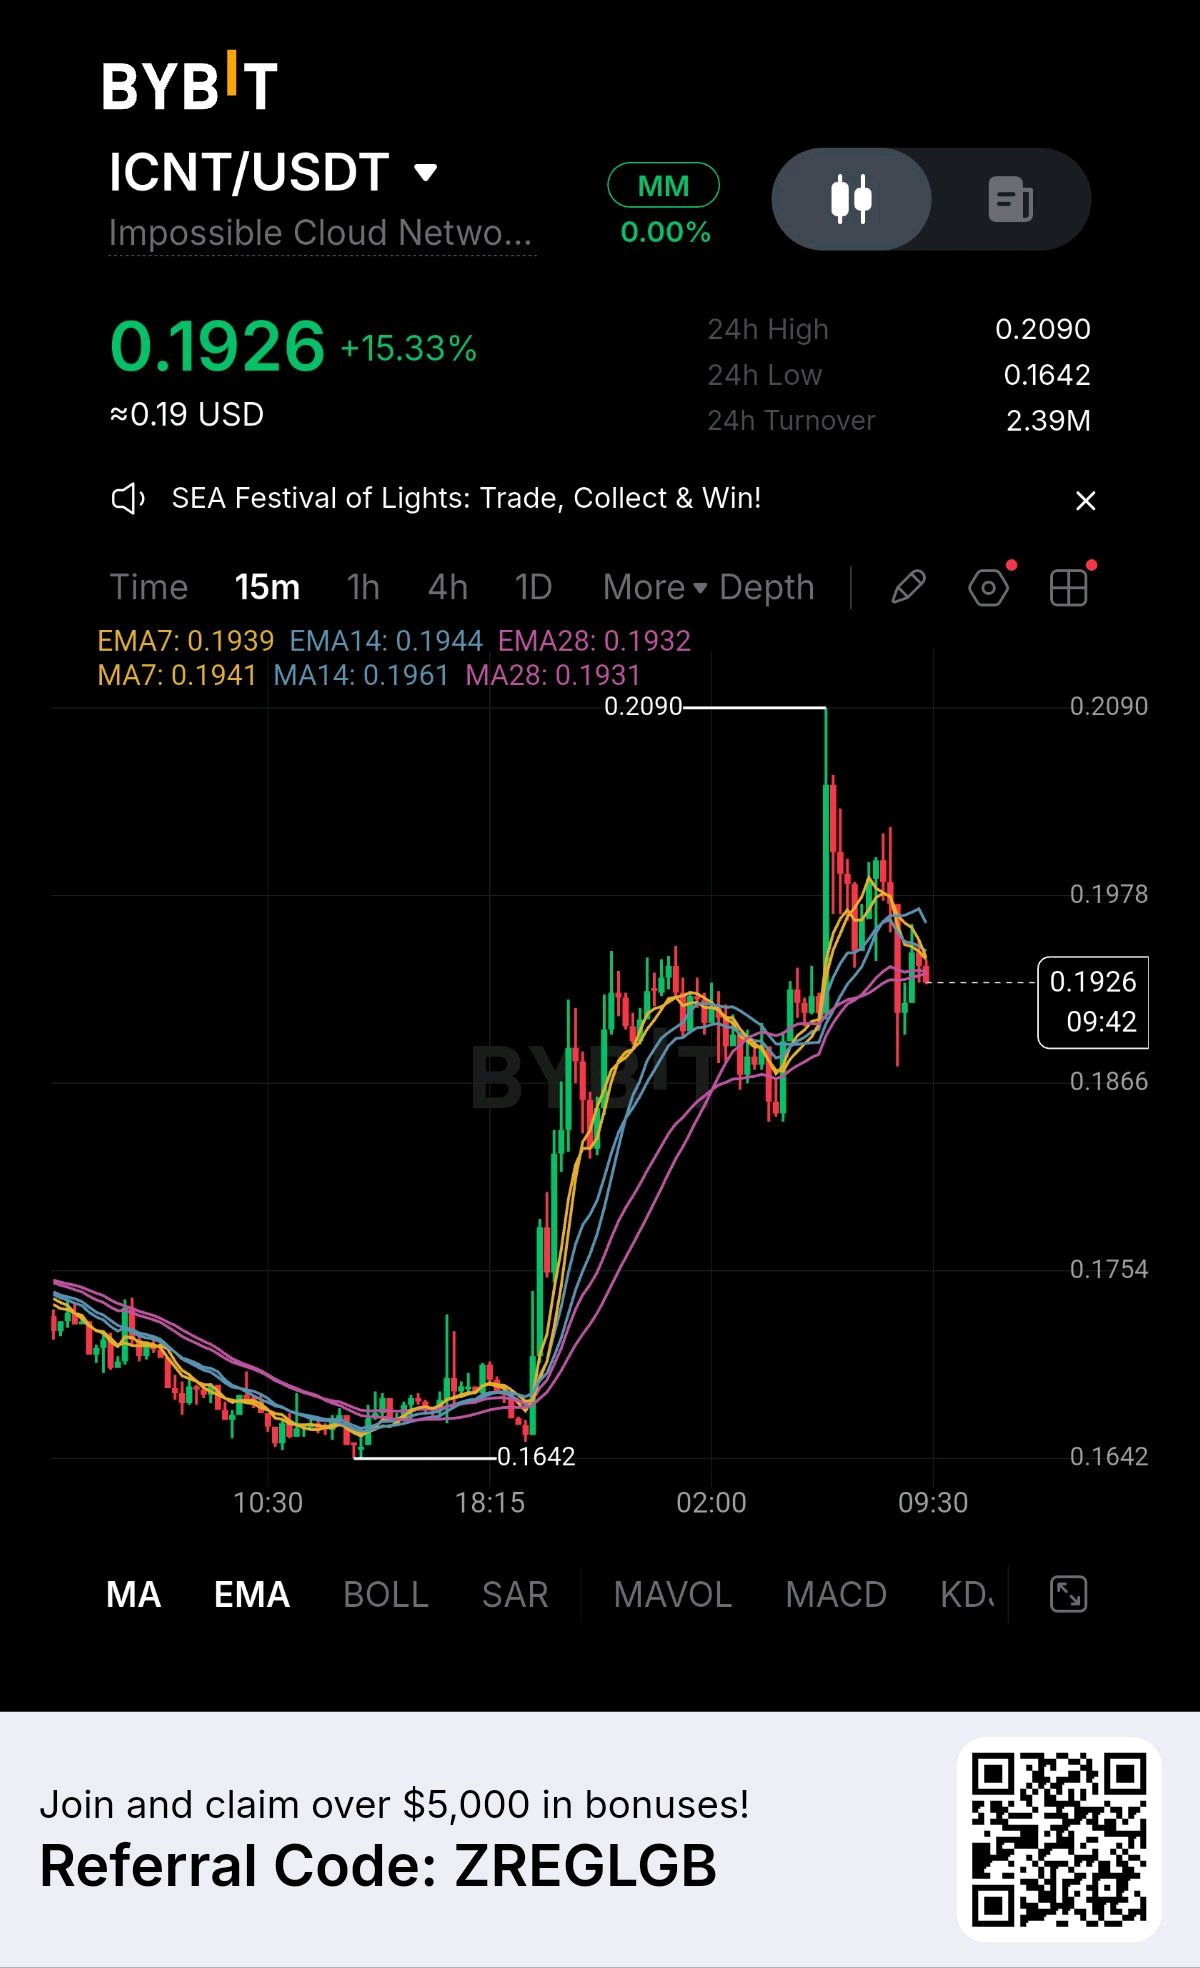
### ICNT/USDT$ICNTUSDT Market Analysis – 15M Bullish overallShort-term pullback ### $0.1926 +15.33% (24H) ICNT has experienced a strong bullish breakout from $0.1642 to $0.2090. However, the latest candles show selling pressure as price consolidates below its recent high. ### 1\. Technical outlook * EMA 7: 0.1939 * EMA 14: 0.1944 * EMA 28: 0.1932 * MA 7: 0.1941 * MA 14: 0.1961 * MA 28: 0.1931 The current price ($0.1926) is below all these moving averages. This indicates weakening short-term momentum and a possible continuation of the correction. ### 2\. Key price levels | Level | Price | Significance | | ---------------- | -------------- | --------------------- | | Major resistance | $0.2090 | Previous high | | Resistance 2 | $0.1978 | Recovery target | | Resistance 1 | $0.1940–0.1961 | EMA/MA resistance | | Current price | $0.1926 | Market price | | Support 1 | $0.1900 | Psychological support | | Support 2 | $0.1866 | Important support | | Major support | $0.1642 | Previous low | ### 3\. Trading scenarios Bullish scenario Recovery If ICNT reclaims $0.1945–$0.1961 and holds above this zone, potential upside targets are: * $0.1978 * $0.2020 * $0.2090 Bearish scenario Correction If price loses $0.1900, watch for: * $0.1866 * $0.1830 * $0.1800 ### 4\. Trading strategy * Potential entry: Wait for a confirmed reclaim of $0.1945–$0.1961. * Aggressive entry: Watch for a bullish reversal around $0.1866–$0.1900. * Take profit: $0.1978, $0.2020 and $0.2090. * Risk management: A sustained break below $0.1866 weakens the bullish setup. ### 5\. Final market verdict Cautiously bullish ICNT remains strongly positive on the broader intraday move, but the 15-minute chart shows a cooling momentum phase. My observation: Avoid chasing the pump at current levels. Wait for either a confirmed breakout above $0.1961 or a convincing bullish reaction at support. The next important battle is between buyers defending $0.1900 and sellers defending $0.1945–$0.1961. This is a technical interpretation of your screenshot, not a live market feed or guaranteed prediction. #WSOT2026 #IMPACTbyTrade #BybitStocks #NewFinancialPlatform #MidtermsMarketWatch $BTCUSDT
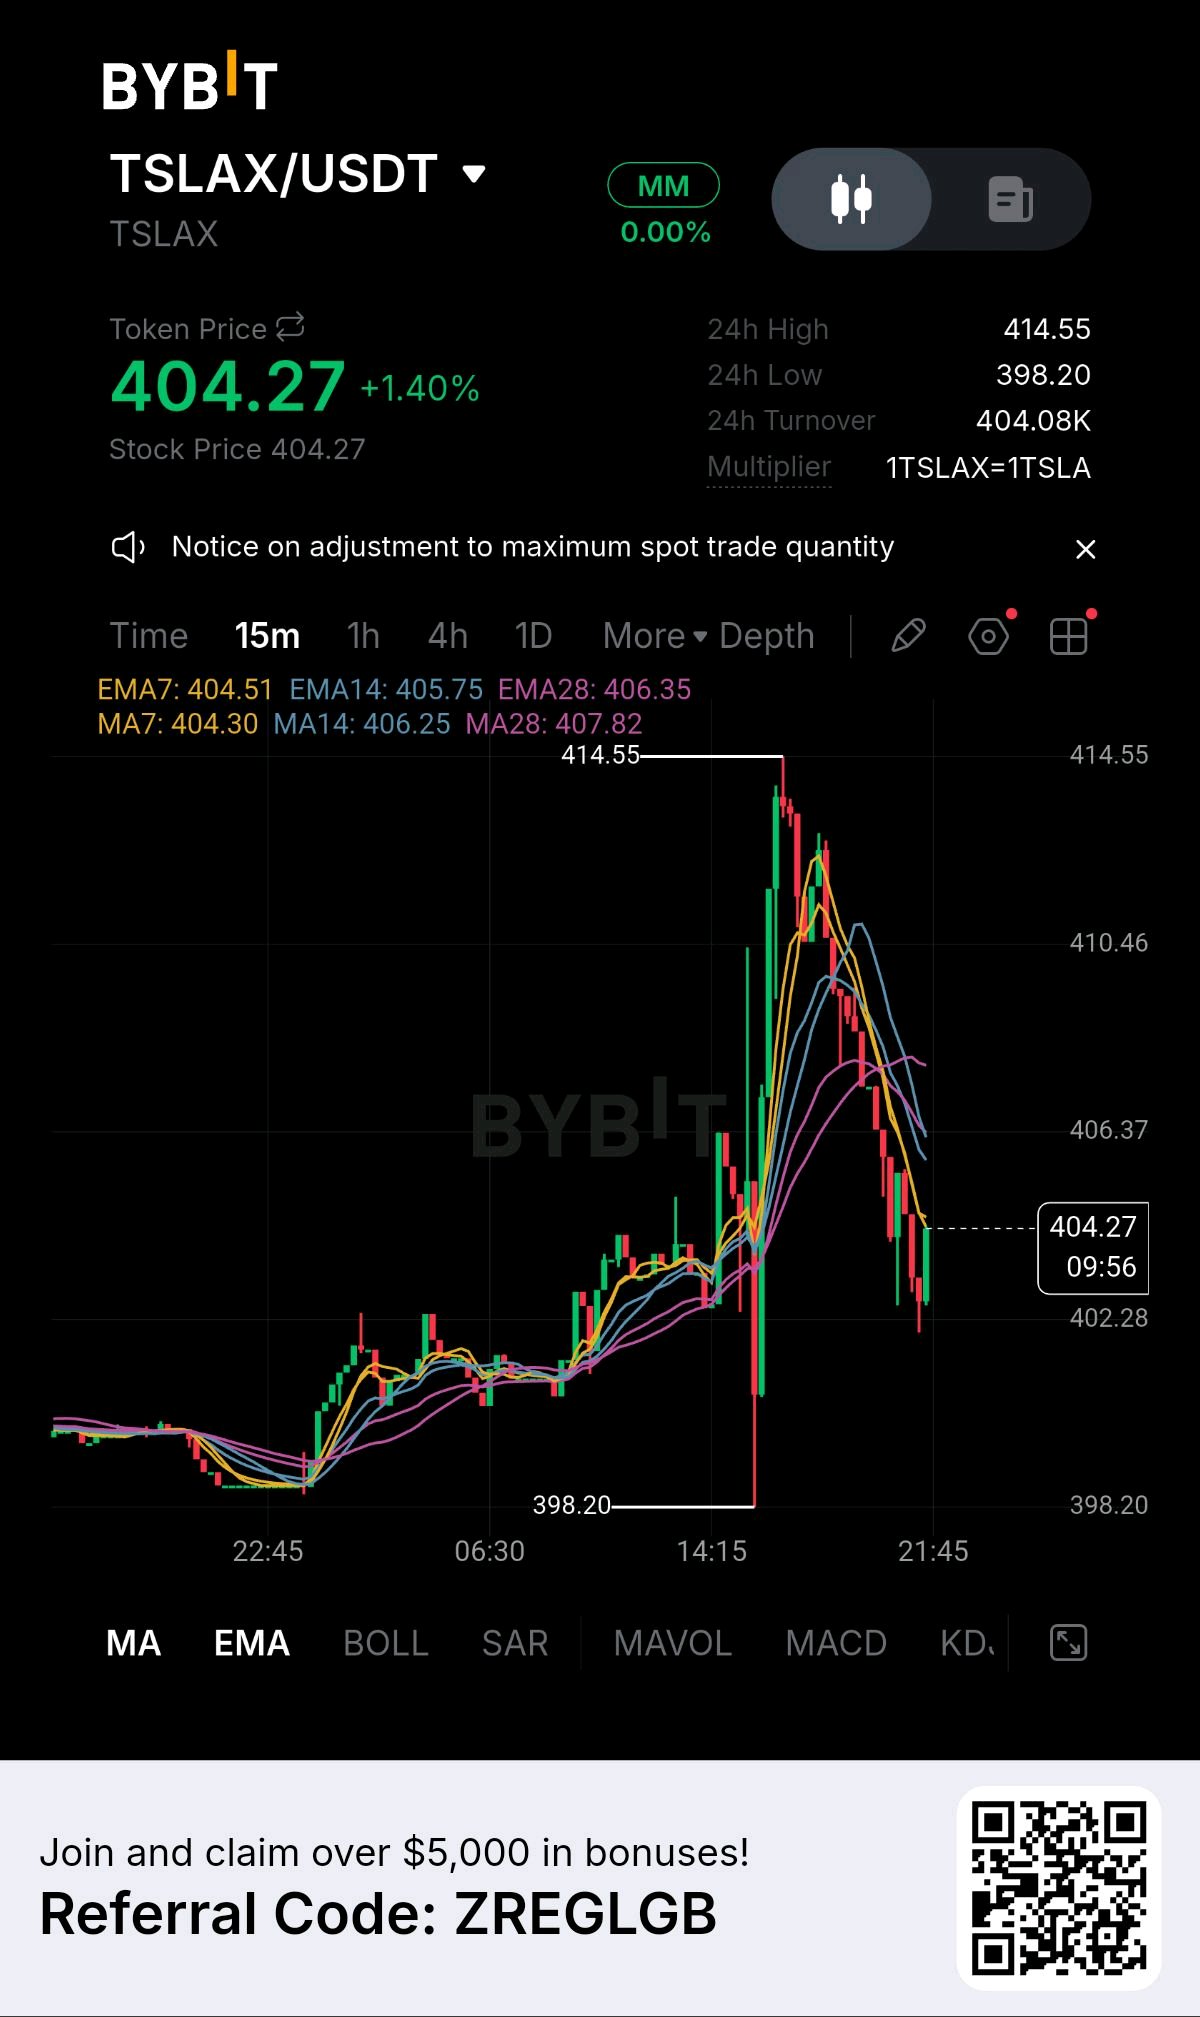
### TSLAx/USDT $TSLAXUSDT – 15-Minute Market Analysis ### 404.27 +1.40%Short-term bearish Current timeframe: 15 minutes 24H High: 414.55 24H Low: 398.20 ### 1\. Market structure TSLAx experienced a strong upward spike toward 414.55, followed by significant selling pressure. Currently: * Price has fallen below EMA 7 (404.51). * EMA 14 is at 405.75. * EMA 28 is at 406.35. * The moving averages are showing bearish short-term alignment. * Price is attempting a small recovery around 404.27. Interpretation: Sellers currently have the advantage, although a short-term relief bounce is possible. ### 2\. Important price levels | Level | Price | Significance | | ---------------- | ------------- | ------------------- | | Major resistance | 414.55 | Previous high | | Resistance | 410.46 | Recovery target | | Resistance | 407.82 | MA28 | | Resistance | 405.75–406.35 | EMA resistance zone | | Current price | 404.27 | Decision zone | | Support | 402.28 | Immediate support | | Major support | 398.20 | 24H low | ### 3\. Trading scenarios Bullish scenario Conditional If price reclaims 405.75–406.35 and holds above it: * First target: 407.82 * Second target: 410.46 * Extended target: 414.55 Bearish scenario Current bias If price rejects 404.50–406.35 and breaks 402.28: * First target: 400.00 * Second target: 398.20 A break below 398.20 could signal further downside. ### 4\. Trading strategy * Long entry: Wait for a confirmed 15m close above 406.35 and a successful retest. * Short entry: Watch for rejection around 405.75–406.35 or a confirmed breakdown below 402.28. * Risk management: Use a stop-loss beyond the invalidation level and avoid entering during sudden volatility. ### 5\. Overall market outlook Bearish until recovery confirmation TSLAx is undergoing a correction after its sharp rally to 414.55. The immediate battle is around 402.28–406.35. My preference is to wait for confirmation rather than chase the current bounce. Key level to watch: 406.35. A sustained move above it could change the short-term outlook. This is a technical interpretation of your screenshot, not a live market feed or guaranteed prediction. #IMPACTbyTrade #BybitStocks #WSOT2026 #BlockchainSecurity #WSOTPicktoEarn10U $BTCUSDT
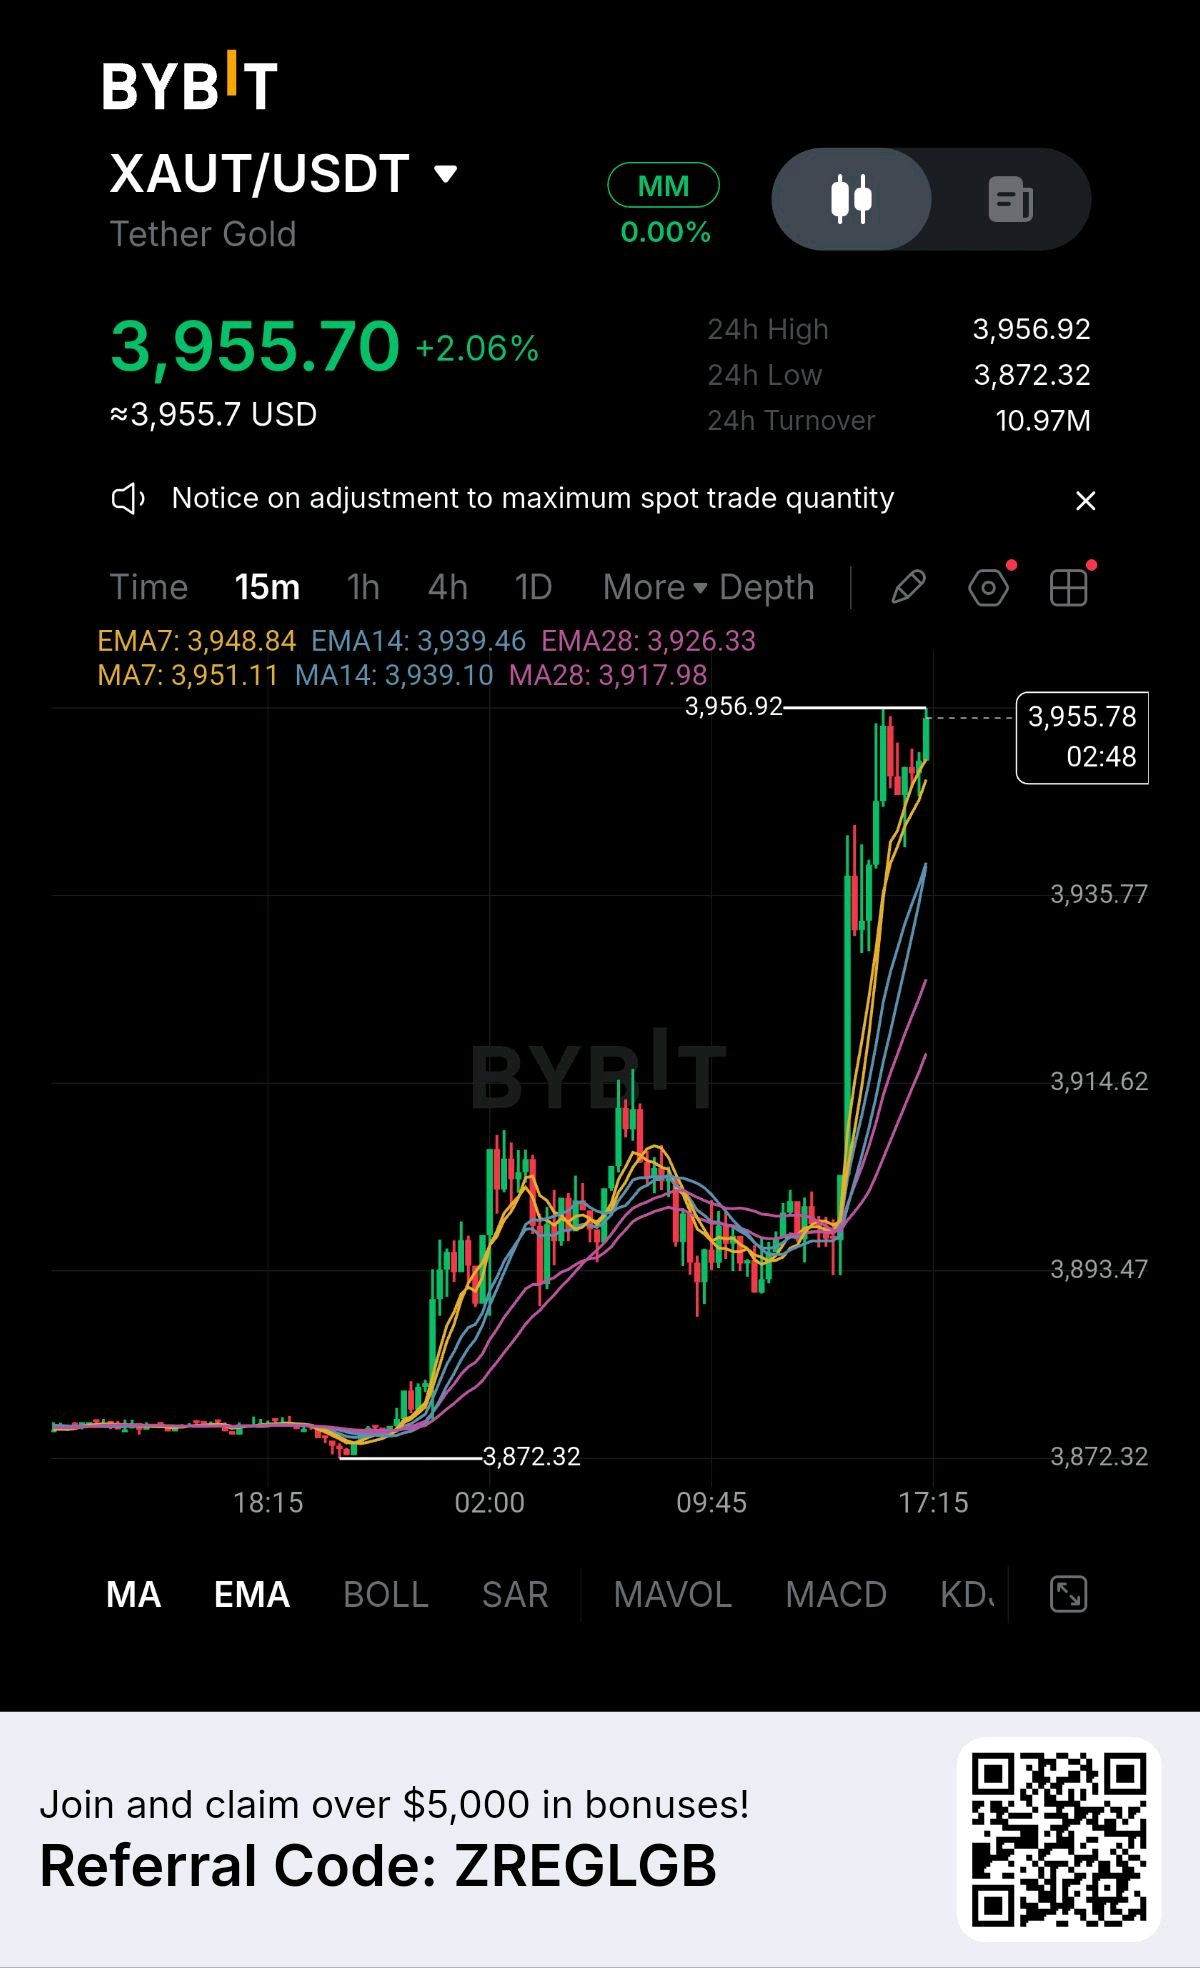
### XAUT/USDT$XAUTUSDT (Tether Gold) – 15-Minute Market Analysis BULLISH TRENDResistance Test ### 3,955.70 USDT +2.06% (24H) XAUT is showing strong bullish momentum on the 15-minute chart. Buyers have taken control following a powerful breakout from the 3,893 consolidation area. ### 1\. Technical indicators | Indicator | Value | Signal | | --------- | -------- | ------- | | EMA 7 | 3,948.84 | Bullish | | EMA 14 | 3,939.46 | Bullish | | EMA 28 | 3,926.33 | Bullish | | MA 7 | 3,951.11 | Bullish | | MA 14 | 3,939.10 | Bullish | | MA 28 | 3,917.98 | Bullish | Interpretation: Price is above all major moving averages, with bullish alignment. This supports continuation, although a short-term pullback is possible. ### 2\. Important price levels RESISTANCE 2 3,970 – 3,980 IMMEDIATE RESISTANCE ### 3,956.92 Current 24-hour high CURRENT PRICE 3,955.70 SUPPORT 1 3,948 – 3,940 SUPPORT 2 3,926 – 3,917 MAJOR SUPPORT 3,893 ### 3\. Trading scenarios Scenario A – Bullish continuation * A 15-minute candle closes above 3,957. * Price successfully retests 3,950–3,957. * Potential upside targets: * TP1: 3,965 * TP2: 3,975 * TP3: 3,985 Scenario B – Bearish correction * Price fails to break 3,956.92. * Sellers push price below 3,948. * Possible downside targets: * 3,940 * 3,926 * 3,917 ### 4\. Market strategist verdict Bullish bias – 15M XAUT has strong upward momentum, but buying directly into the 3,956 resistance carries breakout risk. My preferred approach is to wait for either a confirmed breakout and retest or a pullback toward EMA support before considering a long position. Avoid chasing the current candle. Watch the 3,948–3,940 zone closely. This analysis is based on your uploaded chart, not live market confirmation. Targets are conditional, not guaranteed. Next step: I can also prepare a precise XAUT entry, stop-loss and take-profit strategy for both LONG and SHORT setups. #IMPACTbyTrade #BybitStocks #MidtermsMarketWatch #WSOT2026 #BlockchainSecurity $BTCUSDT
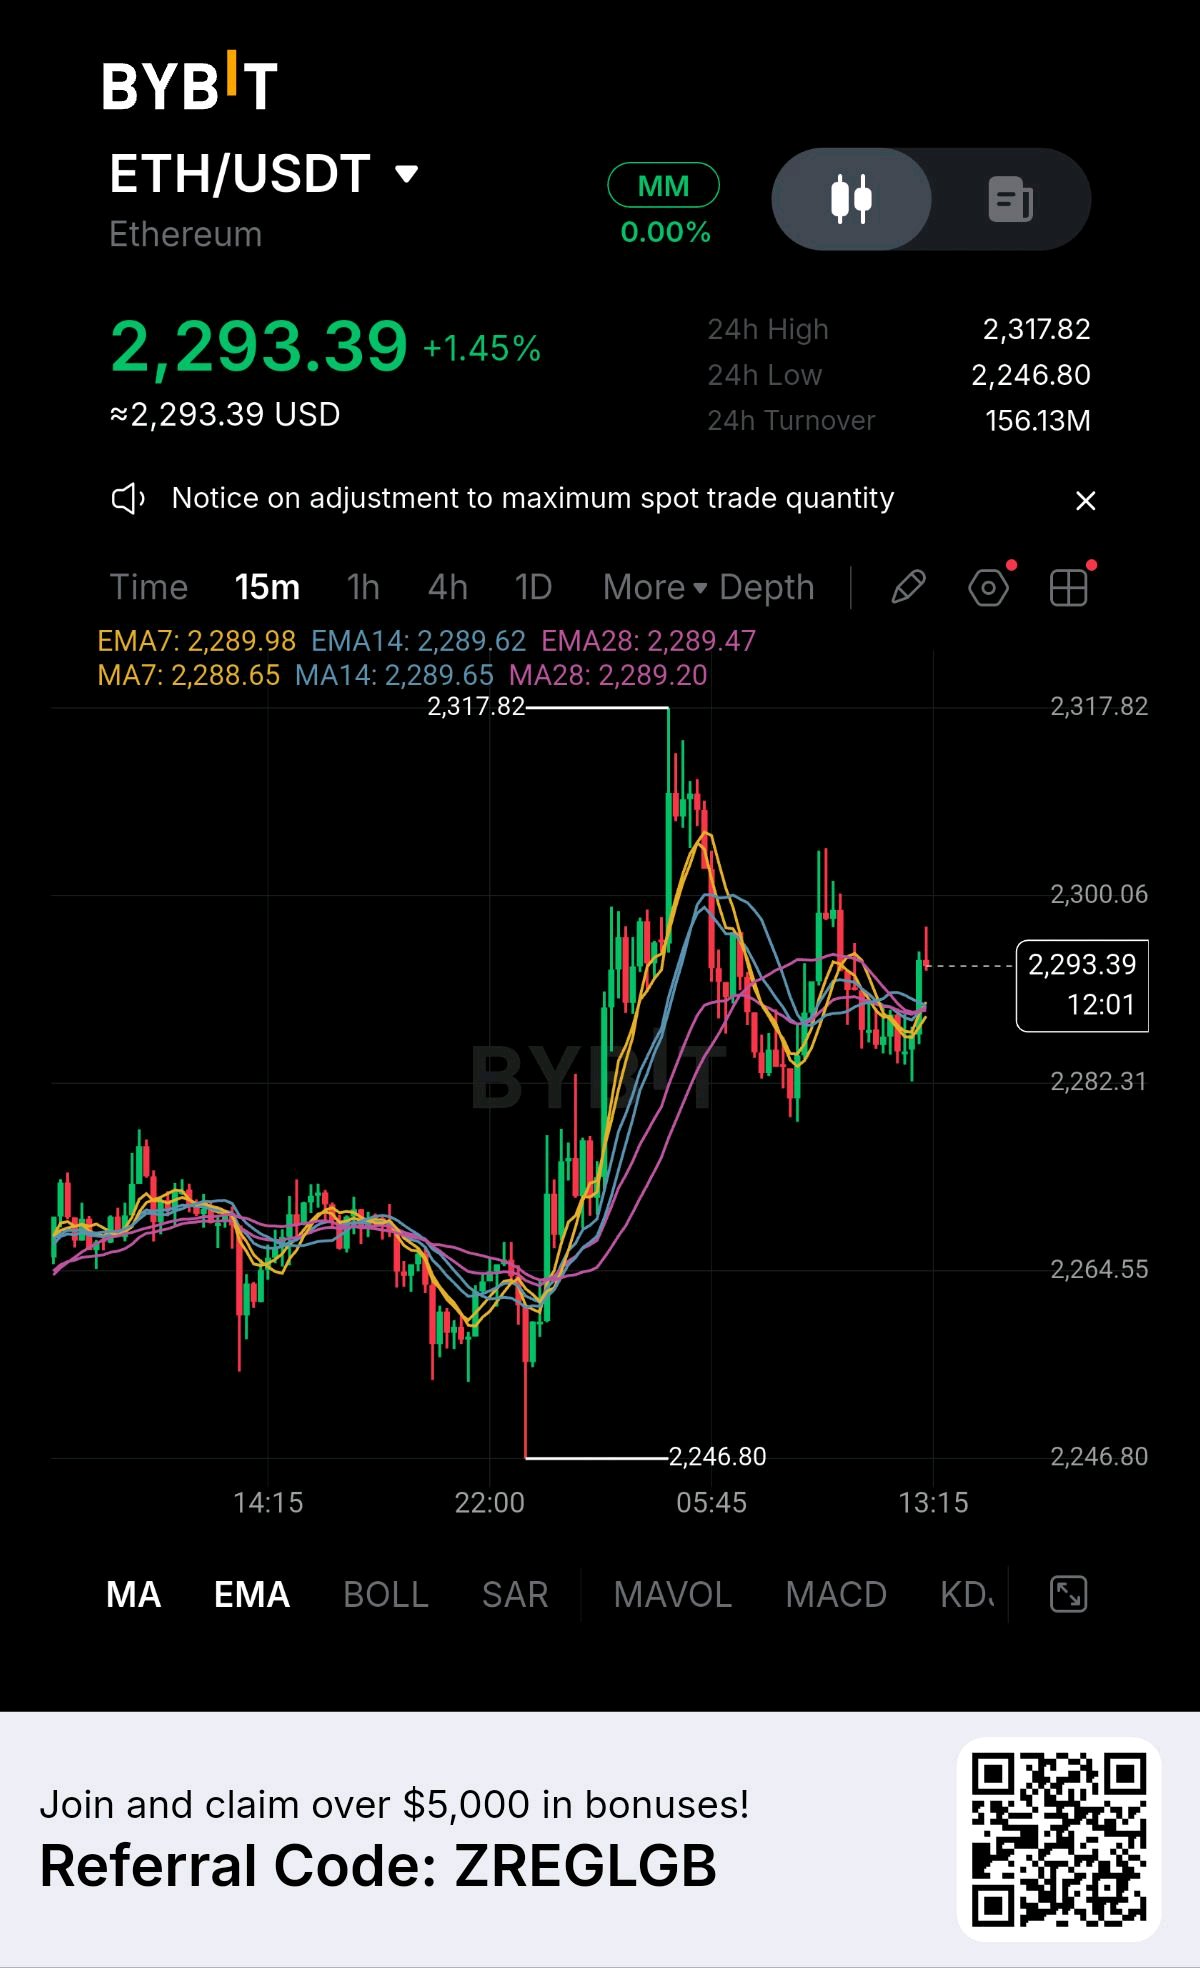
$ETHUSDT ## ETH/USDT – 15-Minute Market Update ### $2,297.67 +0.87% session change Market snapshot: 2 November 2026. Prices may have moved since the data update. ### 1\. Technical analysis * 15m trend: Bullish. * RSI (14): 59.1 – positive momentum, not overbought. * MACD: Positive histogram. * EMA 20: $2,290.50 * EMA 50: $2,285.58 * EMA 200: $2,269.18 ETH is showing short-term buying pressure, although the broader daily trend remains bearish. MakeEA +1 ### 2\. Key support and resistance | Level | Price | | ------------ | ------ | | Resistance 3 | $2,322 | | Resistance 2 | $2,313 | | Resistance 1 | $2,300 | | Support 1 | $2,290 | | Support 2 | $2,285 | | Support 3 | $2,278 | MakeEA +2 ### 3\. Trading scenarios Bullish scenario BUY setup * Break and close above $2,300. * Confirmation above $2,313. * Potential targets: $2,322–$2,333. Bearish scenario SELL setup * Rejection around $2,300–$2,313. * Break below $2,285. * Potential targets: $2,278 and $2,270. ### 4\. My market outlook Bullish with caution ETH buyers currently have the short-term advantage, but confirmation above $2,300 is important. * Above $2,300: bullish continuation becomes more likely. * Below $2,285: bearish pressure increases. * Between $2,285 and $2,300: possible consolidation. Trading strategy: Avoid chasing green candles. Wait for a 15-minute candle close and retest confirmation before entering. This is a technical scenario, not a guaranteed prediction or financial advice. #IMPACTbyTrade #WSOT2026 #PiecesOf8 #BlockchainSecurity #BitcoinSlidesBelow$80K $BTCUSDT
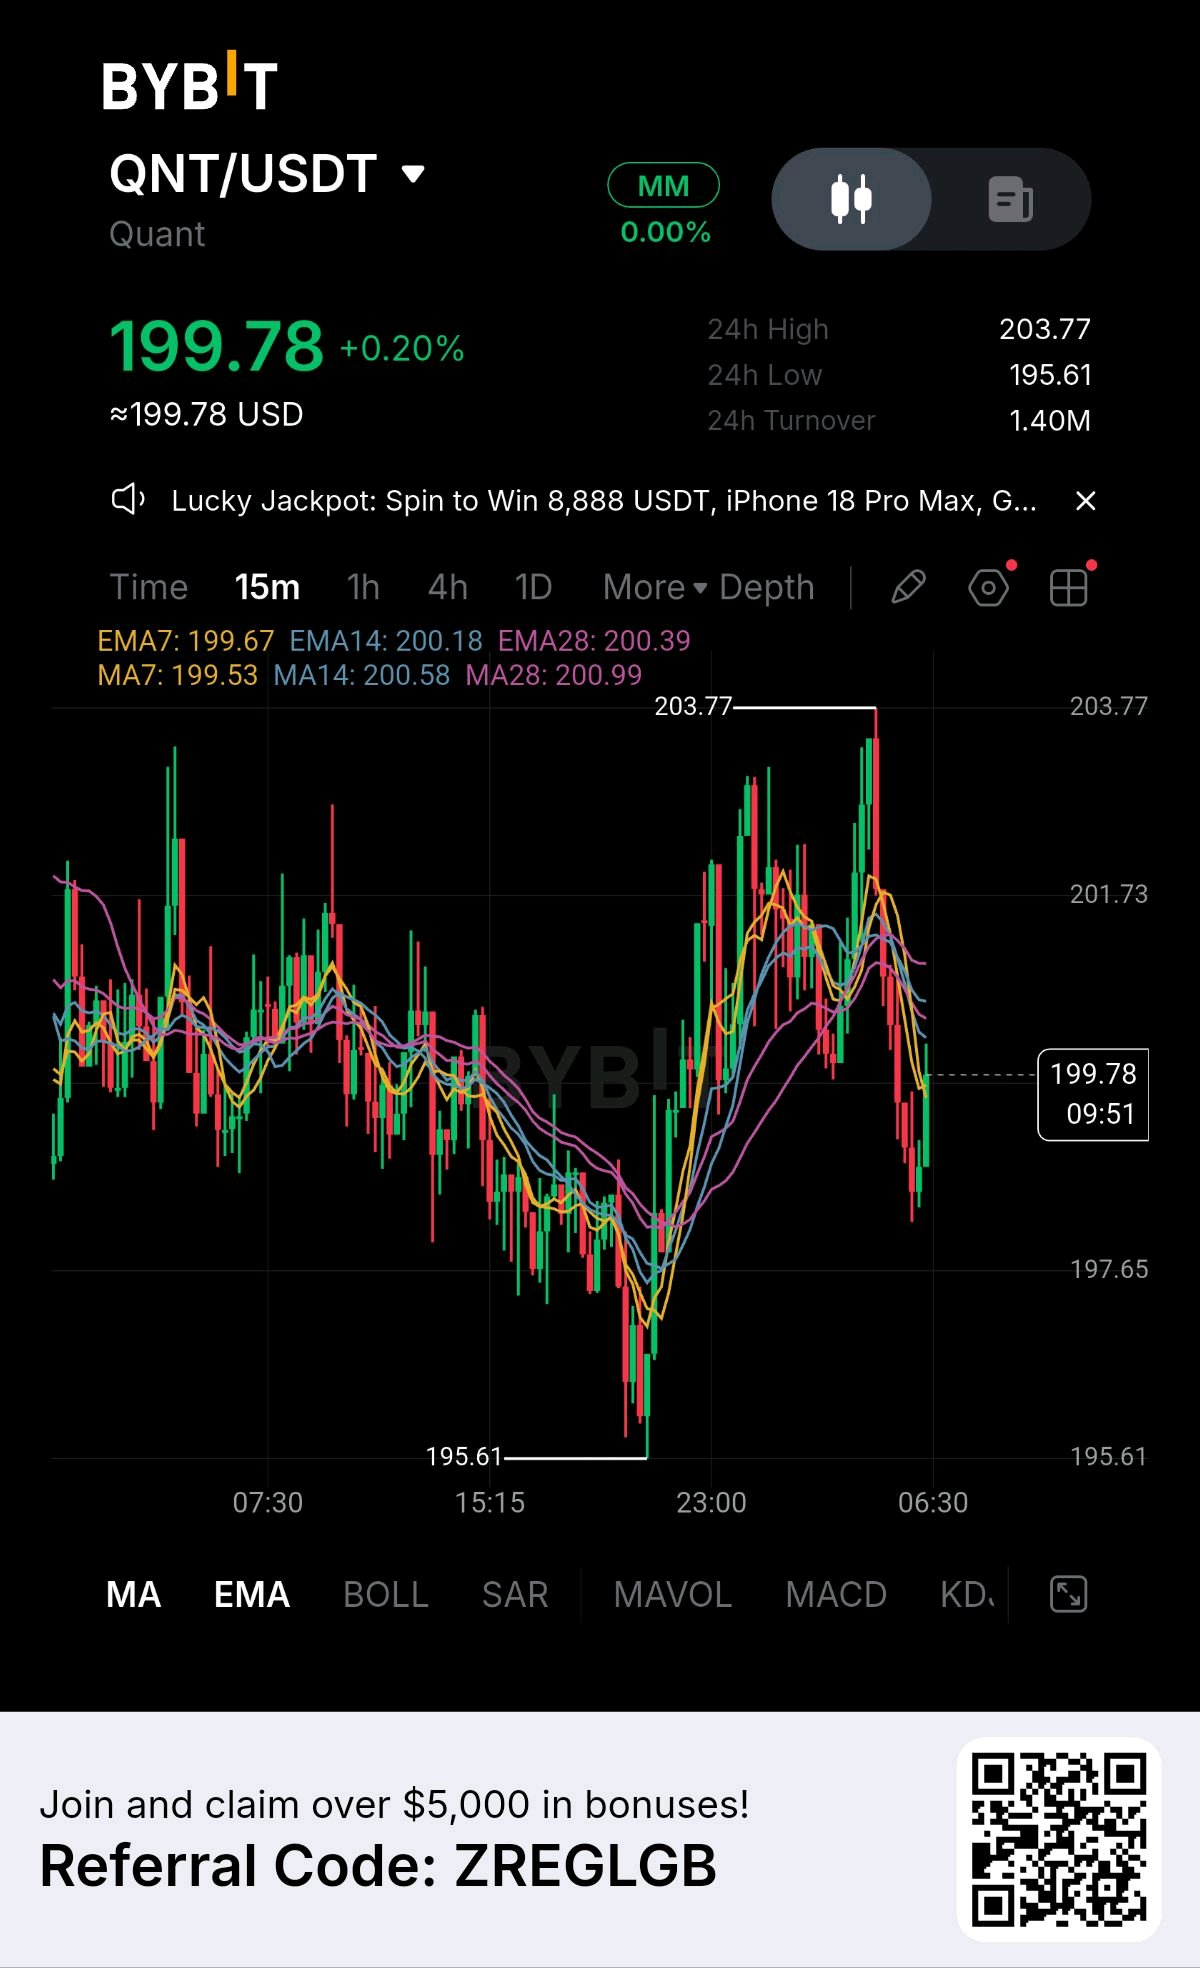
### QNT/USDT$QNTUSDT Market Analysis – November 2, 2026 Bearish short-term momentumPotential rebound ### $199.78 +0.20% (24h) Exchange: Bybit Timeframe: 15 Minutes (15m) Asset: Quant (QNT) ### 1\. Market Structure QNT recently rallied from the $195.61 low toward $203.77 before facing strong selling pressure. The latest candles show: * Strong rejection around $203.77. * Sellers pushing price below several moving averages. * A sharp pullback toward $198. * Buyers attempting a recovery around $199.78. Interpretation: The market is experiencing a short-term bearish correction after a strong upward move. ### 2\. Moving Average Analysis | Indicator | Value | Signal | | --------- | ------- | ---------- | | EMA 7 | $199.67 | Near price | | EMA 14 | $200.18 | Resistance | | EMA 28 | $200.39 | Resistance | | MA 7 | $199.53 | Near price | | MA 14 | $200.58 | Resistance | | MA 28 | $200.99 | Resistance | Most moving averages are above the current price, suggesting sellers still have short-term control. ### 3\. Important Support & Resistance | Level | Price | | ---------------- | --------------- | | Major resistance | $203.77 | | Resistance 3 | $201.73 | | Resistance 2 | $200.99 | | Resistance 1 | $200.18–$200.58 | | Current price | $199.78 | | Support 1 | $199.00 | | Support 2 | $197.65 | | Major support | $195.61 | ### 4\. Trading Scenarios Bullish scenario BUY If QNT holds $199 and breaks above $200.50: * TP1: $201.73 * TP2: $202.50 * TP3: $203.77 Stop-loss consideration: Below confirmed support. Bearish scenario SELL If QNT loses $199 with strong selling pressure: * TP1: $197.65 * TP2: $196.50 * TP3: $195.61 Stop-loss consideration: Above the reclaimed resistance. ### 5\. My Trading Strategy * Avoid chasing a BUY at the current price. * Watch the $199 support zone for bullish rejection. * A break above $200.50 could confirm recovery momentum. * A breakdown below $199 could expose lower support levels. * Wait for a 15-minute candle close before entering. ### 6\. Final Market Verdict Slightly bearish – waiting for confirmation QNT is showing weakness after rejection at $203.77. However, the latest rebound suggests buyers are still defending the lower price region. My key levels to watch: * Bullish confirmation: $200.50 * Bearish confirmation: $199.00 * Major downside target: $195.61 * Major upside target: $203.77 This analysis uses only the supplied 15-minute chart. Levels are conditional scenarios, not guaranteed predictions. Always manage risk with a stop-loss. #IMPACTbyTrade #BybitStocks #WSOT2026 #PiecesOf8 #WSOTPicktoEarn10U $BTCUSDT
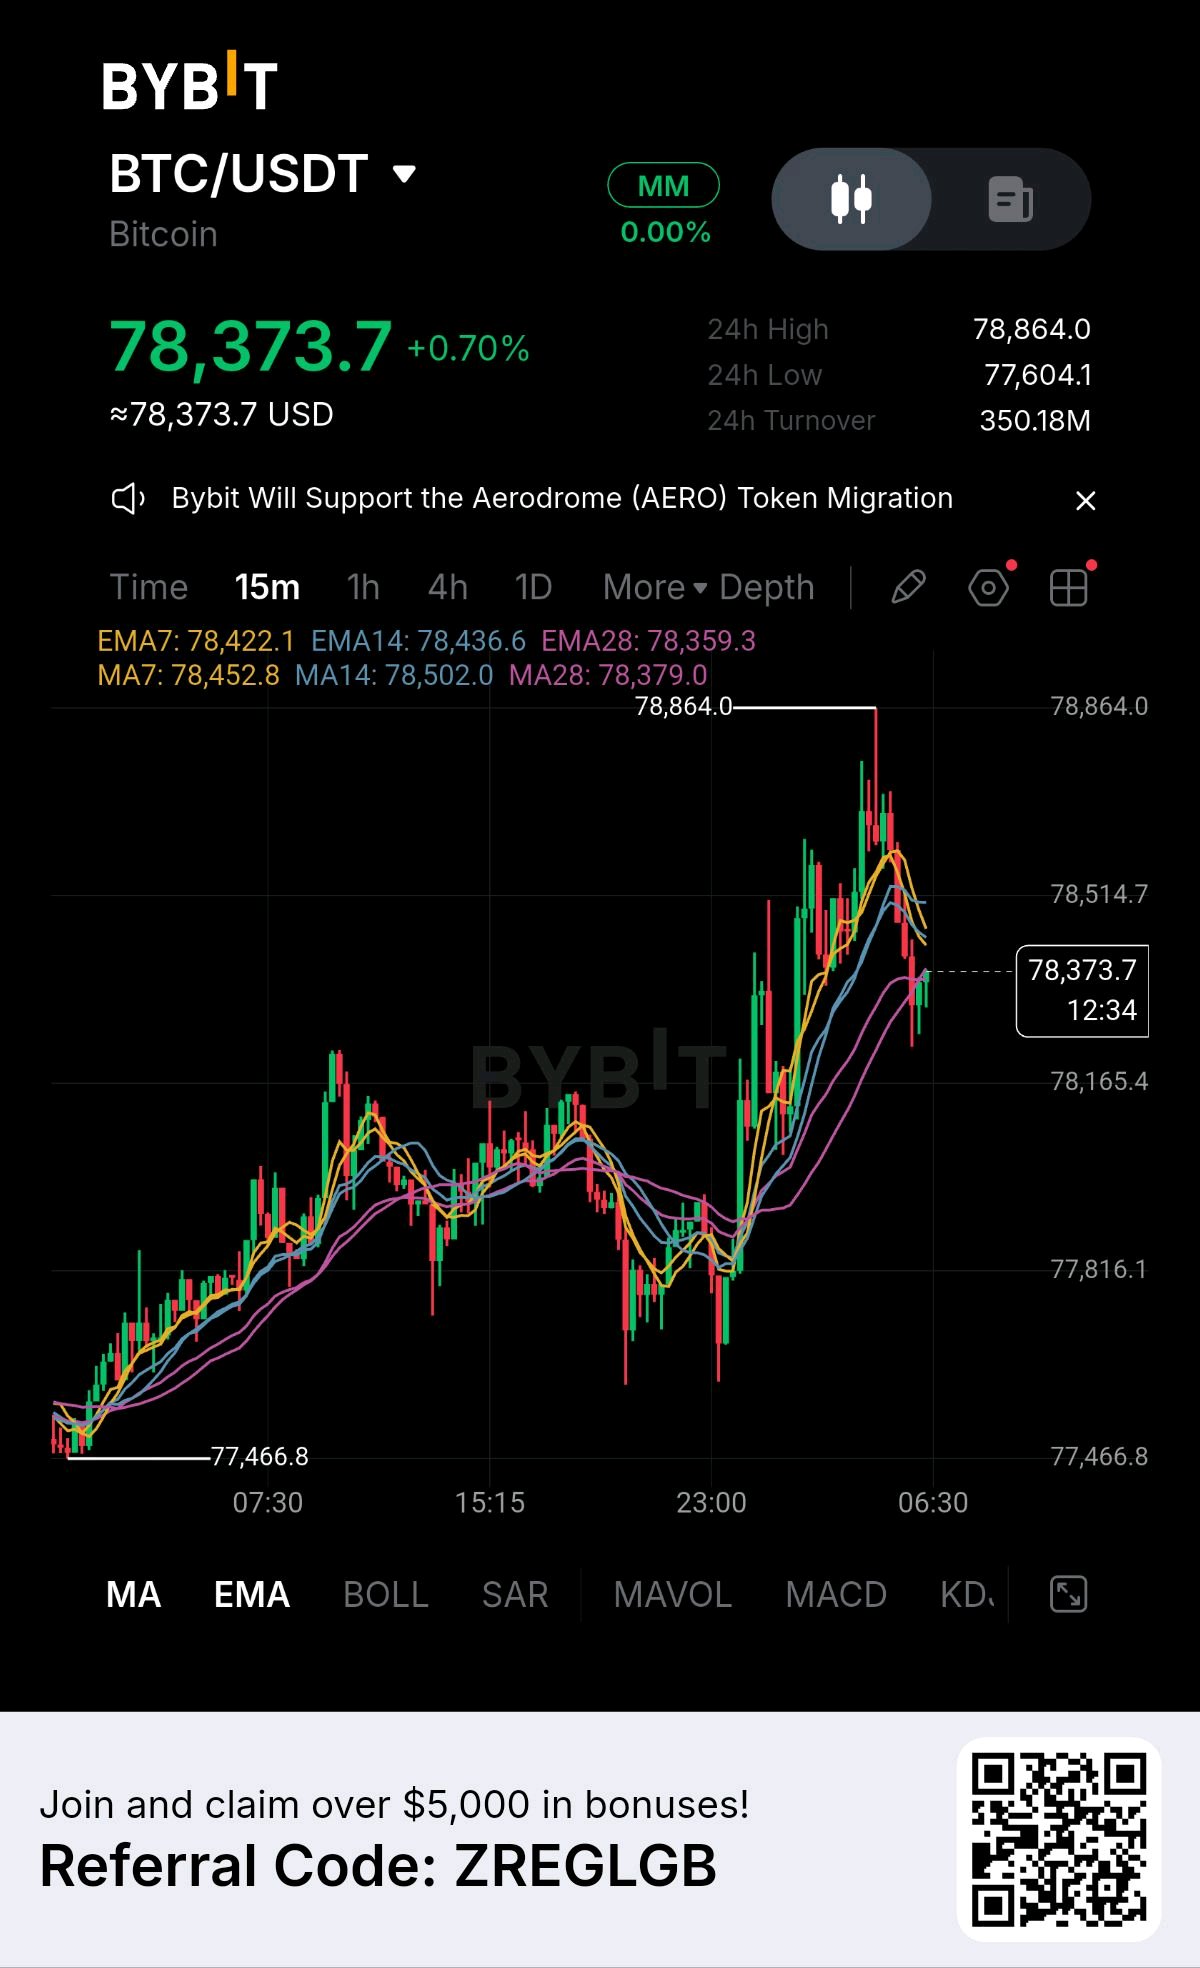
### BTC/USDT Market Analysis – November 2, 2026 Short-term bullish structurePullback in progress ### $78,373.7 +0.70% (24h) Timeframe: 15 Minutes (15m) ### 1\. Market Structure BTC recently made a strong upward move from around $77,800 toward $78,864 before experiencing selling pressure. Current price action shows: * Strong bullish momentum earlier. * Sellers rejecting the $78,800–$78,864 region. * Price pulling back below the short-term moving averages. * Buyers attempting to defend the $78,350 area. Interpretation: The broader intraday structure remains bullish, but short-term momentum is weakening. ### 2\. Moving Average Analysis | Indicator | Value | Signal | | --------- | ------ | ---------- | | EMA 7 | 78,422 | Bearish | | EMA 14 | 78,436 | Bearish | | EMA 28 | 78,359 | Support | | MA 7 | 78,452 | Bearish | | MA 14 | 78,502 | Bearish | | MA 28 | 78,379 | Near price | BTC is trading below most short-term averages. A recovery above $78,450–$78,500 would improve bullish momentum. ### 3\. Important Price Levels | Level | Price | Importance | | ---------------- | ------- | ------------------ | | Major resistance | $78,864 | Previous high | | Resistance 2 | $78,515 | Recovery target | | Resistance 1 | $78,450 | Short-term barrier | | Current price | $78,373 | Market price | | Support 1 | $78,350 | EMA support zone | | Support 2 | $78,165 | Key support | | Support 3 | $77,816 | Deeper support | ### 4\. Trading Scenarios Bullish scenario BUY setup If BTC holds $78,350 and reclaims $78,450–$78,500: * Target 1: $78,515 * Target 2: $78,700 * Target 3: $78,864 Bearish scenario SELL setup If BTC breaks below $78,350 with strong selling pressure: * Target 1: $78,165 * Target 2: $77,950 * Target 3: $77,816 ### 5\. Market Outlook Neutral to slightly bearish short-term BTC is currently experiencing a correction after a strong upward rally. Buyers need to reclaim $78,500 to restore immediate bullish momentum. My trading strategy: * Avoid chasing BUY positions at the current price. * Watch for a bullish rejection around $78,350. * Consider SELL only after a confirmed breakdown below $78,350. * Wait for a 15-minute candle close to confirm either direction. Final verdict: BTC remains bullish on the broader intraday structure, but bears currently have an opportunity to push price toward $78,165. Analysis is based on your supplied chart, not live order-book data. These are conditional scenarios, not guaranteed predictions. Use appropriate stop-loss protection. #IMPACTbyTrade #BybitStocks #WSOT2026 #WSOTPicktoEarn10U #BitcoinSlidesBelow$80K $BTCUSDT
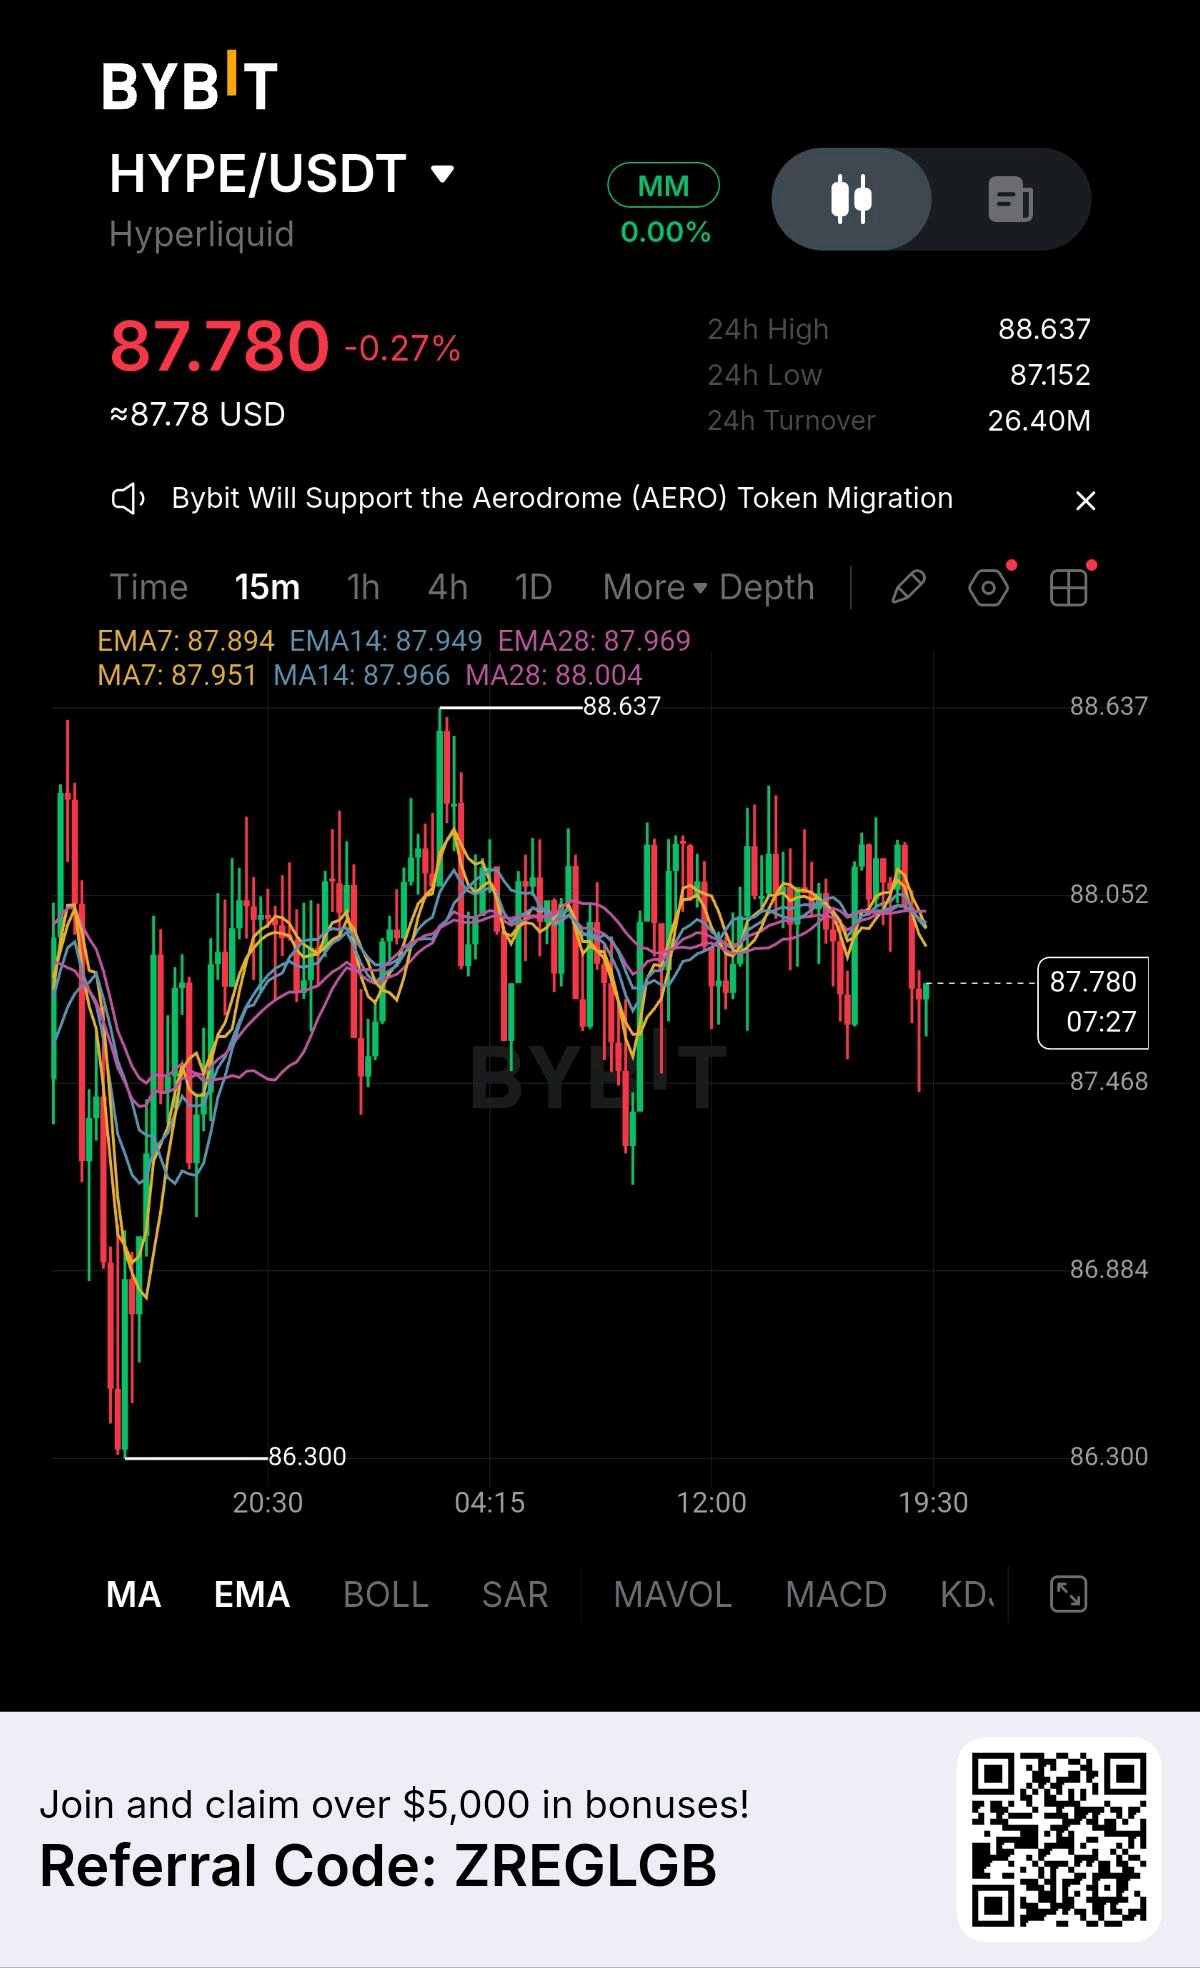
### HYPE/USDT $HYPEUSDT Market Analysis – Bybit ### $87.780 -0.27% | Sellers have a slight advantage ### 1\. Technical analysis HYPE is currently trading below all six moving averages: | Indicator | Value | | --------- | ------ | | EMA 7 | 87.894 | | EMA 14 | 87.949 | | EMA 28 | 87.969 | | MA 7 | 87.951 | | MA 14 | 87.966 | | MA 28 | 88.004 | Interpretation: * Price is below all moving averages, suggesting short-term bearish momentum. * The moving averages are tightly clustered, indicating consolidation. * Repeated rejection around $88.05 suggests resistance. * Buyers are still defending the $87.45–$87.50 region. ### 2\. Important price levels | Level | Price | Significance | | ---------------- | -------------- | -------------------- | | Major resistance | $88.637 | Previous high | | Resistance 2 | $88.050 | Immediate resistance | | Resistance 1 | $87.950–88.000 | MA/EMA cluster | | Current price | $87.780 | Market price | | Support 1 | $87.468 | Immediate support | | Support 2 | $87.152 | 24h low | | Major support | $86.300 | Previous swing low | ### 3\. Trading scenarios Bullish scenario Potential BUY * Break above $88.00. * 15m candle closes above $88.05. * Possible targets: $88.20 → $88.40 → $88.637. * Stop-loss idea: below $87.75 after confirmation. Bearish scenario Potential SELL * Rejection around $87.95–$88.05. * Break below $87.468. * Possible targets: $87.30 → $87.152 → $86.884. * Stop-loss idea: above $88.05. ### 4\. Market outlook Neutral to bearish HYPE is moving sideways, but sellers currently have a slight advantage because price remains below the moving averages. The most important level to watch is $88.00. * Above $88.05: bullish momentum could strengthen. * Below $87.468: bearish momentum could accelerate. * Between these levels: consolidation is likely. ### 5\. My trading strategy I would avoid chasing an entry in the middle of this range. Wait for a confirmed breakout or breakdown, preferably with increased volume. Overall prediction: HYPE may continue consolidating with a slight bearish bias until buyers reclaim $88.00–$88.05. This is a technical interpretation of your screenshot, not a live market feed or guaranteed prediction. Use risk management and confirm entries before trading. #IMPACTbyTrade #BybitStocks #MidtermsMarketWatch #WSOT2026 #BlockchainSecurity $BTCUSDT
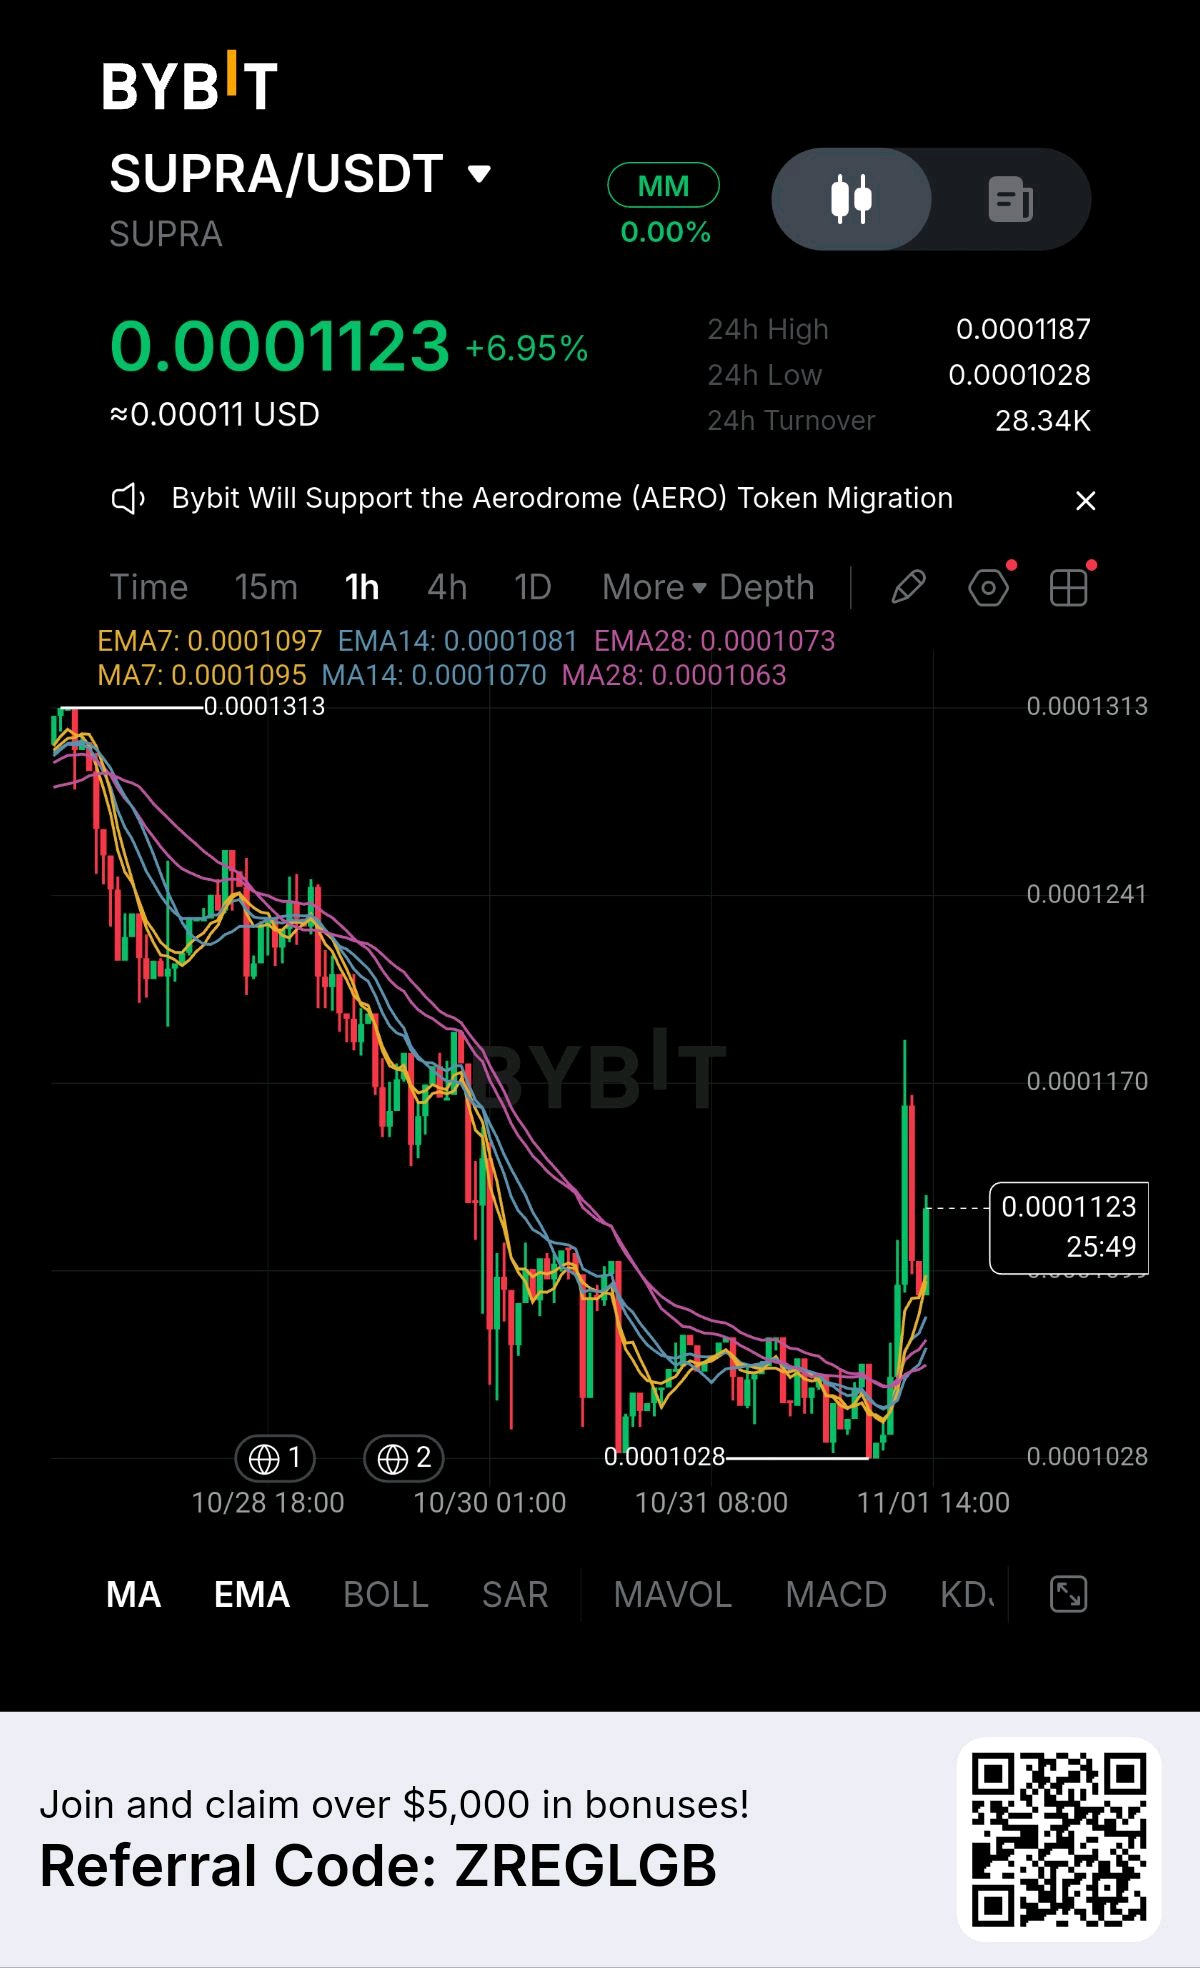
### SUPRA/USDT$SUPRAUSDT Market Analysis – Bybit Current price: $0.0001123 24H Change: +6.95% 24H High: $0.0001187 24H Low: $0.0001028 Timeframe: 1 Hour (1H) ### 1\. Market Structure SUPRA has experienced a prolonged downward trend, falling from approximately $0.0001313 to $0.0001028. However, the chart now shows: * A strong bullish breakout from the support zone. * Increased buying pressure. * Price moving above EMA7, EMA14 and EMA28. * A short-term recovery after a major bearish trend. This suggests buyers are beginning to regain control. ### 2\. Important Price Levels | Level | Price | Significance | | ------------ | ---------- | -------------------- | | Resistance 3 | $0.0001241 | Major resistance | | Resistance 2 | $0.0001187 | 24H high | | Resistance 1 | $0.0001170 | Immediate resistance | | Current | $0.0001123 | Market price | | Support 1 | $0.0001095 | EMA support | | Support 2 | $0.0001070 | Stronger support | | Support 3 | $0.0001028 | Major bottom | ### 3\. Potential Scenarios Bullish Scenario If SUPRA maintains support above $0.0001095 and breaks $0.0001170, possible upside targets are: * $0.0001187 * $0.0001210 * $0.0001241 A strong 1H candle close above $0.0001187 would strengthen the bullish outlook. Bearish Scenario If buyers lose momentum: * First downside target: $0.0001095. * Second downside target: $0.0001070. * Major support: $0.0001028. A break below $0.0001028 could indicate continuation of the previous downtrend. ### 4\. Trading Strategy | Strategy | Entry / Level | | ------------------- | ----------------------------------------- | | Aggressive buy | $0.0001095–0.0001105 | | Safer buy | After confirmed breakout above $0.0001187 | | Take Profit 1 | $0.0001170 | | Take Profit 2 | $0.0001210 | | Take Profit 3 | $0.0001241 | | Stop-loss reference | Below $0.0001070 | These are technical reference levels, not guaranteed outcomes. ### 5\. Final Market Verdict ### Bullish Recovery SUPRA is showing signs of a short-term bullish reversal after an extended decline. My assessment: * Short-term: Bullish. * Medium-term: Still recovering. * Momentum: Positive. * Key breakout: $0.0001187. * Key support: $0.0001095. Important: Avoid chasing the sudden pump. Watch for a successful retest of support or a confirmed breakout before entering. My advice: SUPRA is showing promising recovery momentum, but it needs to break $0.0001187 convincingly before a stronger bullish continuation can be confirmed. #IMPACTbyTrade #MidtermsMarketWatch #BybitStocks #WSOT2026 #BlockchainSecurity $BTCUSDT
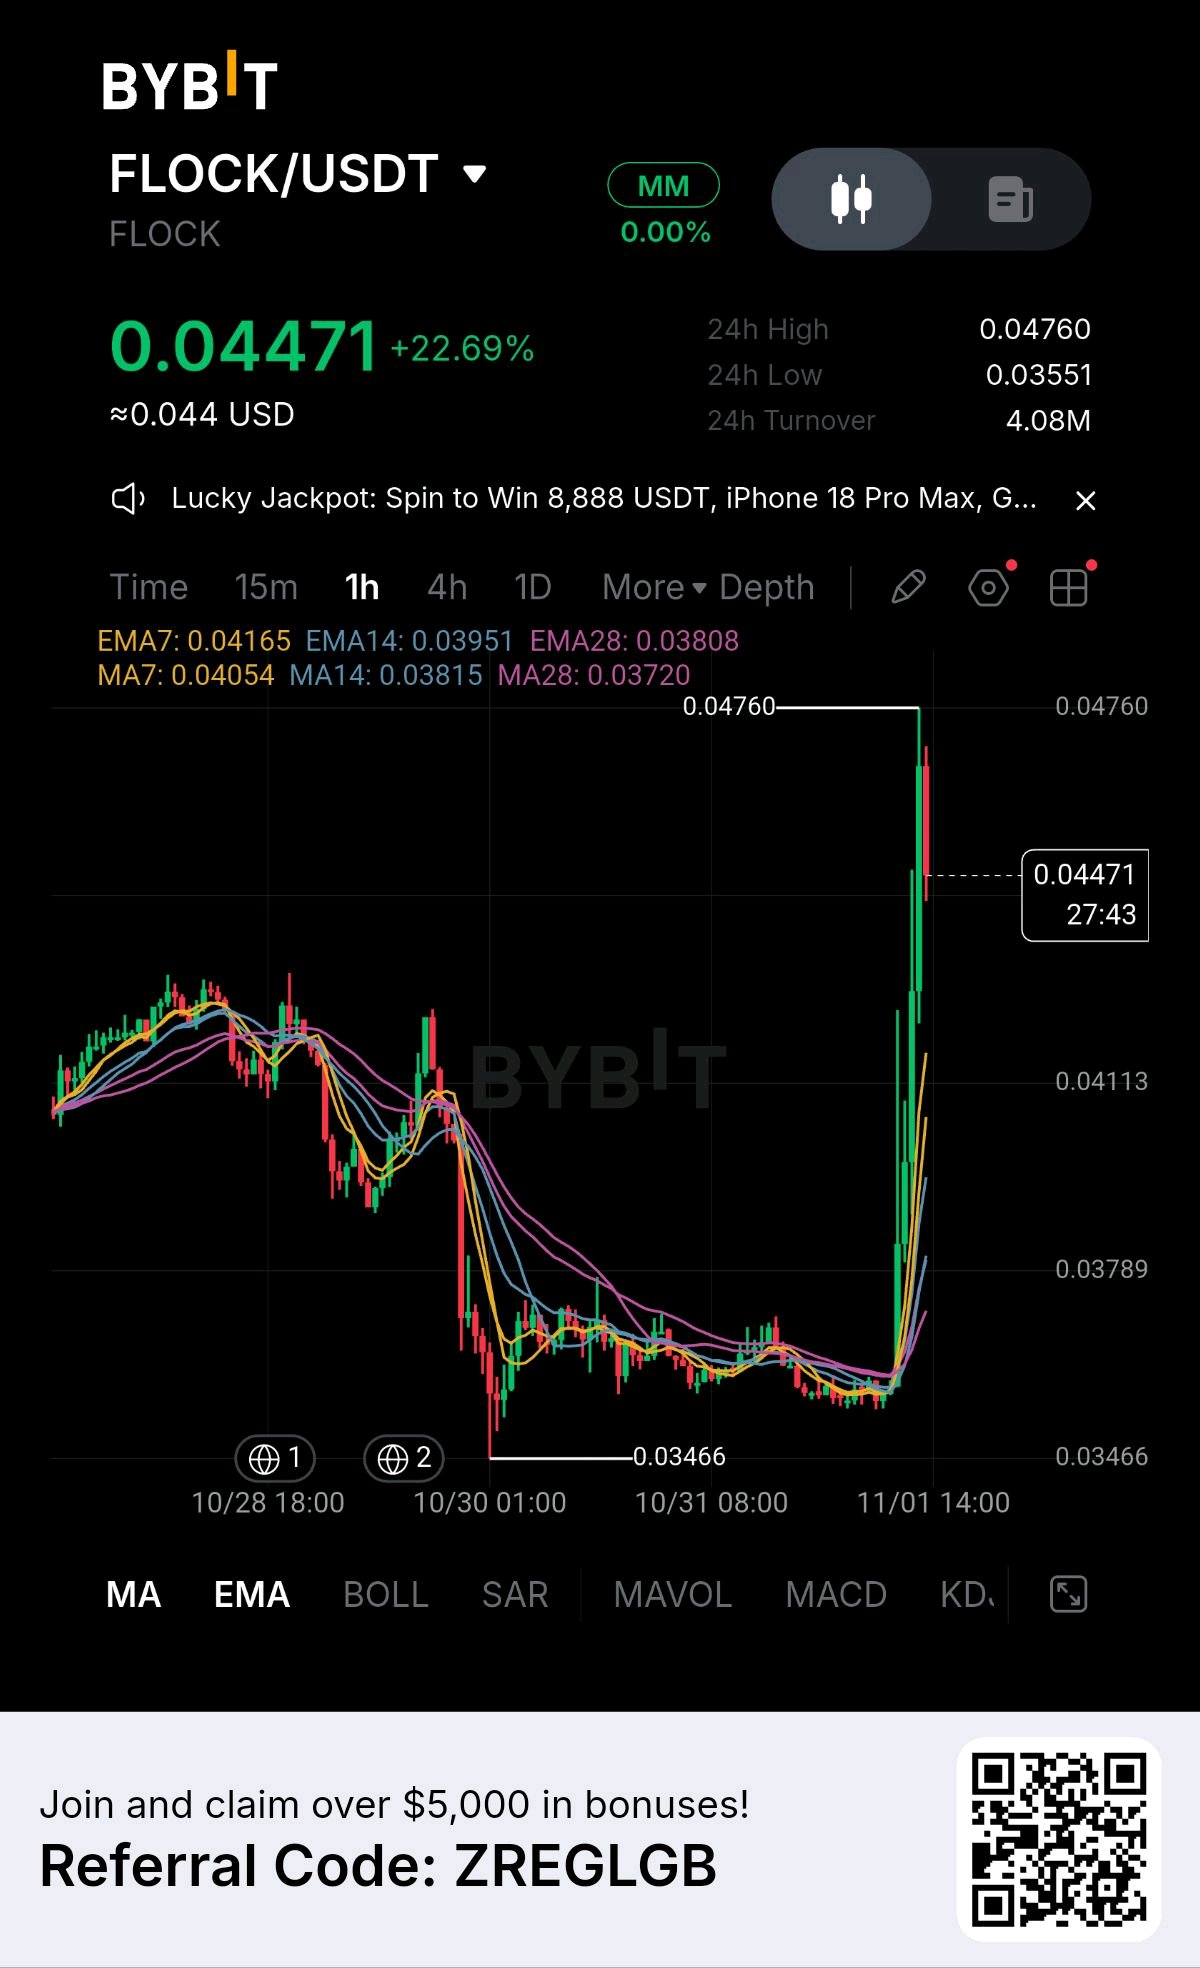
### FLOCK/USDT $FLOCKUSDT – Market Analysis Based on your Bybit 1-hour chart (November 1, 2026), FLOCK is showing a strong bullish breakout after a prolonged period of consolidation. ### 1\. Market overview FLOCK/USDT +22.69% ### 0.04471 USDT 24h High 0.04760 24h Low 0.03551 24h Turnover 4.08M Current trend Bullish ### 2\. Technical indicators The moving averages are aligned bullishly: | Indicator | Value | | --------- | ------- | | EMA 7 | 0.04165 | | EMA 14 | 0.03951 | | EMA 28 | 0.03808 | | MA 7 | 0.04054 | | MA 14 | 0.03815 | | MA 28 | 0.03720 | Interpretation: * Price is trading above all major moving averages. * EMA 7 is above EMA 14 and EMA 28. * Buyers currently have strong short-term control. * The sharp upward movement suggests a breakout from consolidation. However, the rejection from 0.04760 shows that sellers are active near the recent high. ### 3\. Important price levels | Level | Price | Significance | | ------------- | ------- | -------------------- | | Resistance 2 | 0.05000 | Psychological target | | Resistance 1 | 0.04760 | Recent high | | Current price | 0.04471 | Market price | | Support 1 | 0.04165 | EMA 7 | | Support 2 | 0.03951 | EMA 14 | | Support 3 | 0.03808 | EMA 28 | ### 4\. Possible market scenarios Bullish scenario Positive If FLOCK breaks above 0.04760 and holds, the next potential targets are: * 0.04850 * 0.05000 * 0.05200 Bearish scenario Risk If price loses 0.04165, a deeper retracement could follow toward: * 0.03951 * 0.03808 * 0.03720 ### 5\. Trading strategy * Entry: Consider waiting for a pullback toward 0.04165–0.04050 and bullish confirmation. * Breakout entry: Watch for a confirmed 1-hour candle close above 0.04760. * Take profit: 0.04850, 0.05000 and 0.05200. * Risk management: Consider invalidation below the relevant support, depending on your entry. Avoid chasing the current pump without confirmation. The chart does not provide enough information to confirm volume strength or RSI conditions. ### 6\. Final market prediction ### Bullish bias – 1H timeframe FLOCK has strong upward momentum, but it is approaching an important resistance zone at 0.04760. A successful breakout could open the way toward 0.05000. Failure to break resistance may trigger profit-taking and a short-term correction. My view: Bullish while price holds above 0.04165, but watch for a healthy retest before entering. This is technical analysis, not a guaranteed price prediction or financial advice. #IMPACTbyTrade #BybitStocks #MidtermsMarketWatch #BitcoinSlidesBelow$80K #WSOTPicktoEarn10U $BTCUSDT
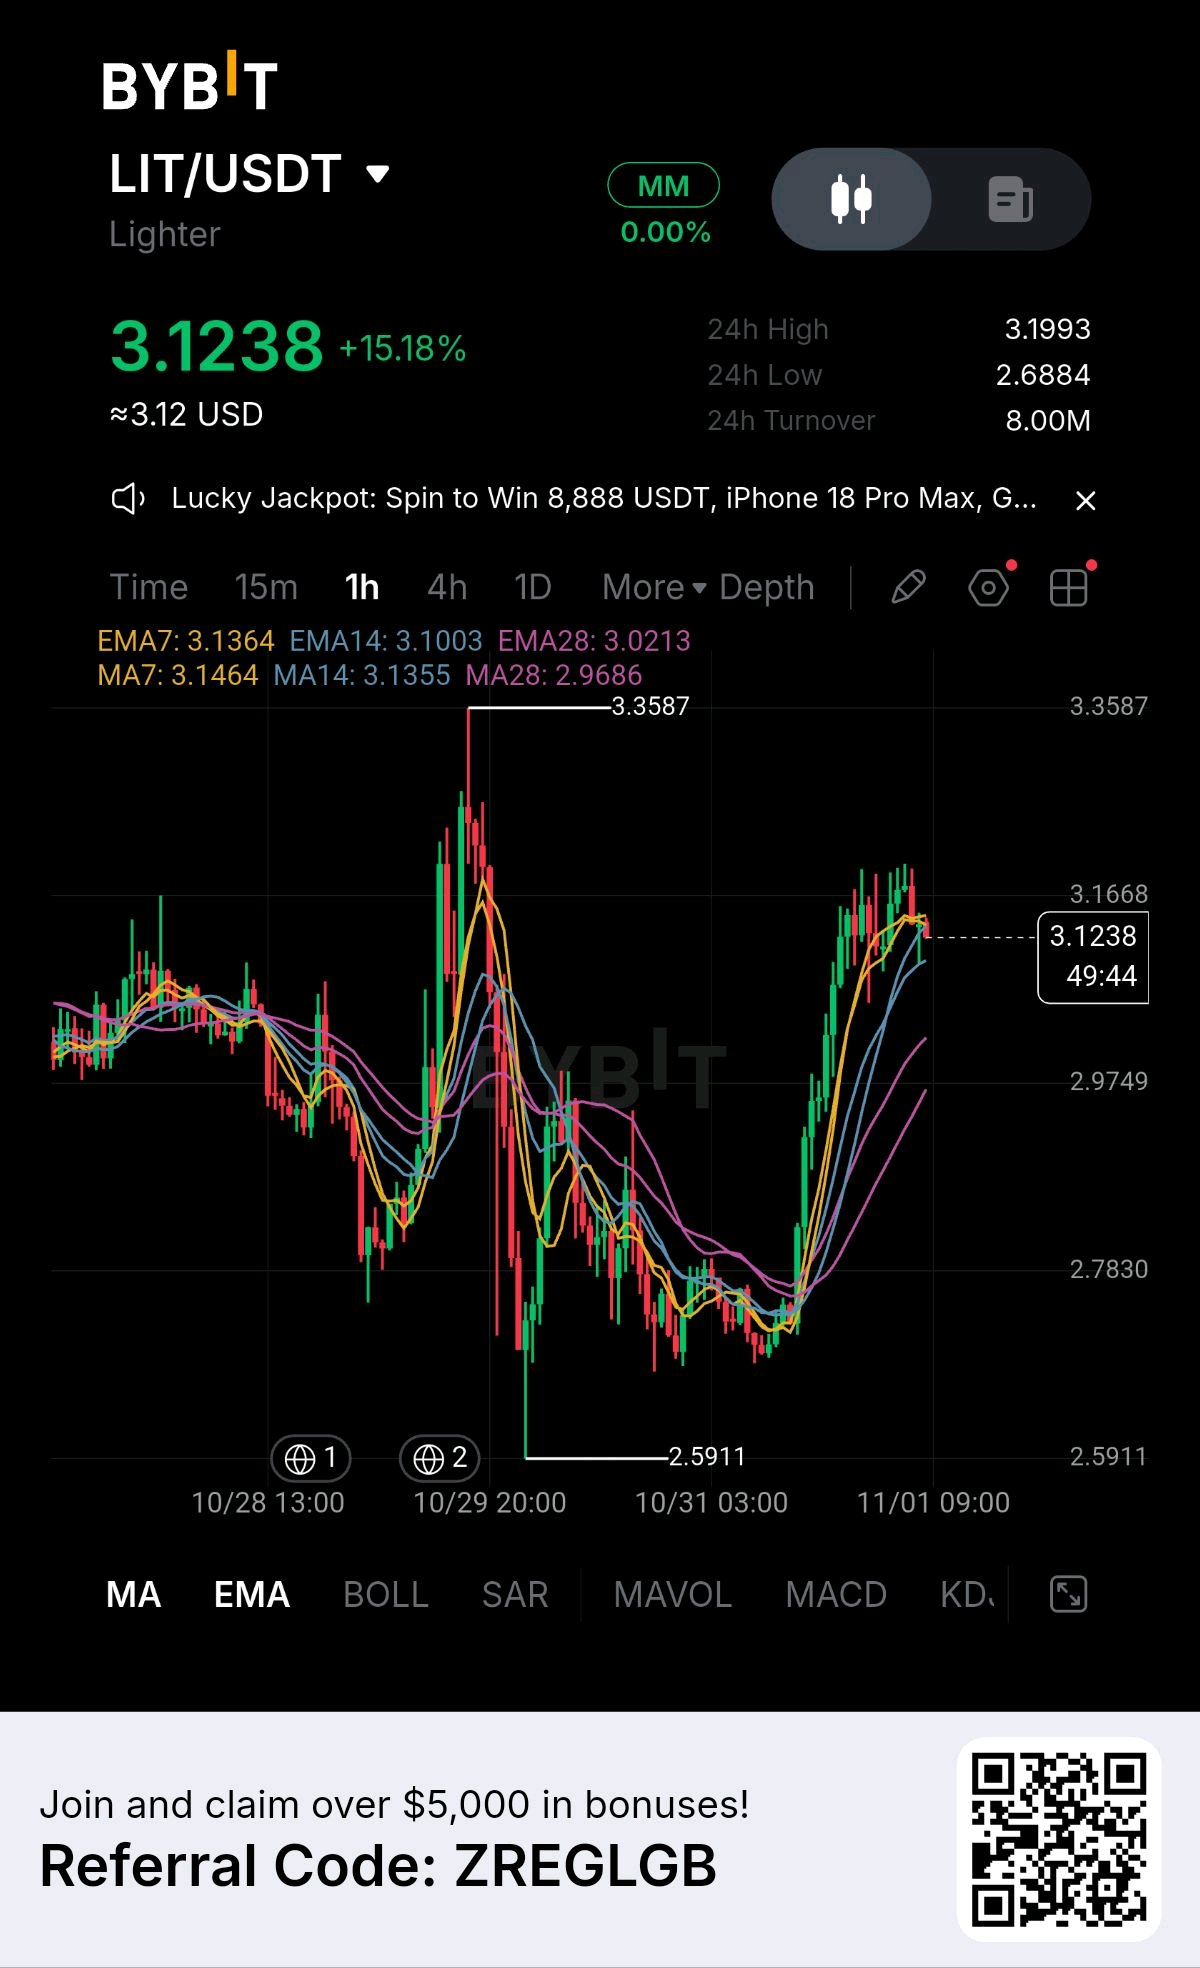
### LIT/USDT $LITUSDT Market Analysis – November 1, 2026 Bullish TrendShort-term Consolidation Current price (screenshot) ### $3.1238 +15.18% 24h performance 24h High $3.1993 24h Low $2.6884 24h Turnover 8.00M Timeframe 1 Hour ### 1\. Technical Analysis LIT has experienced a strong bullish recovery from the $2.59–$2.78 region, climbing above $3.10. * Price is holding above EMA14 and EMA28. * EMA7 is slightly above the current price, suggesting short-term cooling. * The moving averages indicate that the broader short-term structure remains bullish. * Recent candles show consolidation after a strong upward move. ### 2\. Important Price Levels | Level | Price | Significance | | ------------- | ------- | -------------------- | | Resistance 3 | $3.3587 | Major resistance | | Resistance 2 | $3.1993 | 24h high | | Resistance 1 | $3.1668 | Immediate resistance | | Current price | $3.1238 | Market price | | Support 1 | $3.1000 | EMA14 area | | Support 2 | $3.0213 | EMA28 area | | Support 3 | $2.9749 | Key support | | Major support | $2.7830 | Previous base | ### 3\. Possible Market Scenarios Bullish scenario Positive If LIT breaks above $3.1668 and successfully reclaims $3.1993, the next potential targets are: * $3.25 * $3.30 * $3.3587 Bearish scenario Risk If LIT loses $3.10, selling pressure could push the price toward: * $3.0213 * $2.9749 * $2.7830 ### 4\. Trading Strategy * Long entry: Look for a confirmed bounce around $3.10–$3.02. * Breakout entry: Watch for a strong 1H candle close above $3.1993. * Take profit: $3.25, $3.30 and $3.3587. * Risk management: Consider invalidation below the relevant support, depending on entry. Avoid chasing the price after its 15% rally without confirmation. ### 5\. Final Market Prediction Bullish bias LIT/USDT remains technically bullish on the 1-hour chart, but momentum is cooling after its sharp rally. My outlook: A successful hold above $3.10 could support another attempt at $3.20. A confirmed breakout above $3.20 would strengthen the bullish continuation case. Key level to watch: $3.1993. This is a technical assessment of the supplied screenshot, not a live market feed or guaranteed prediction. #IMPACTbyTrade #WSOT2026 #WSOTPicktoEarn10U #BitcoinSlidesBelow$80K #PiecesOf8 $BTCUSDT
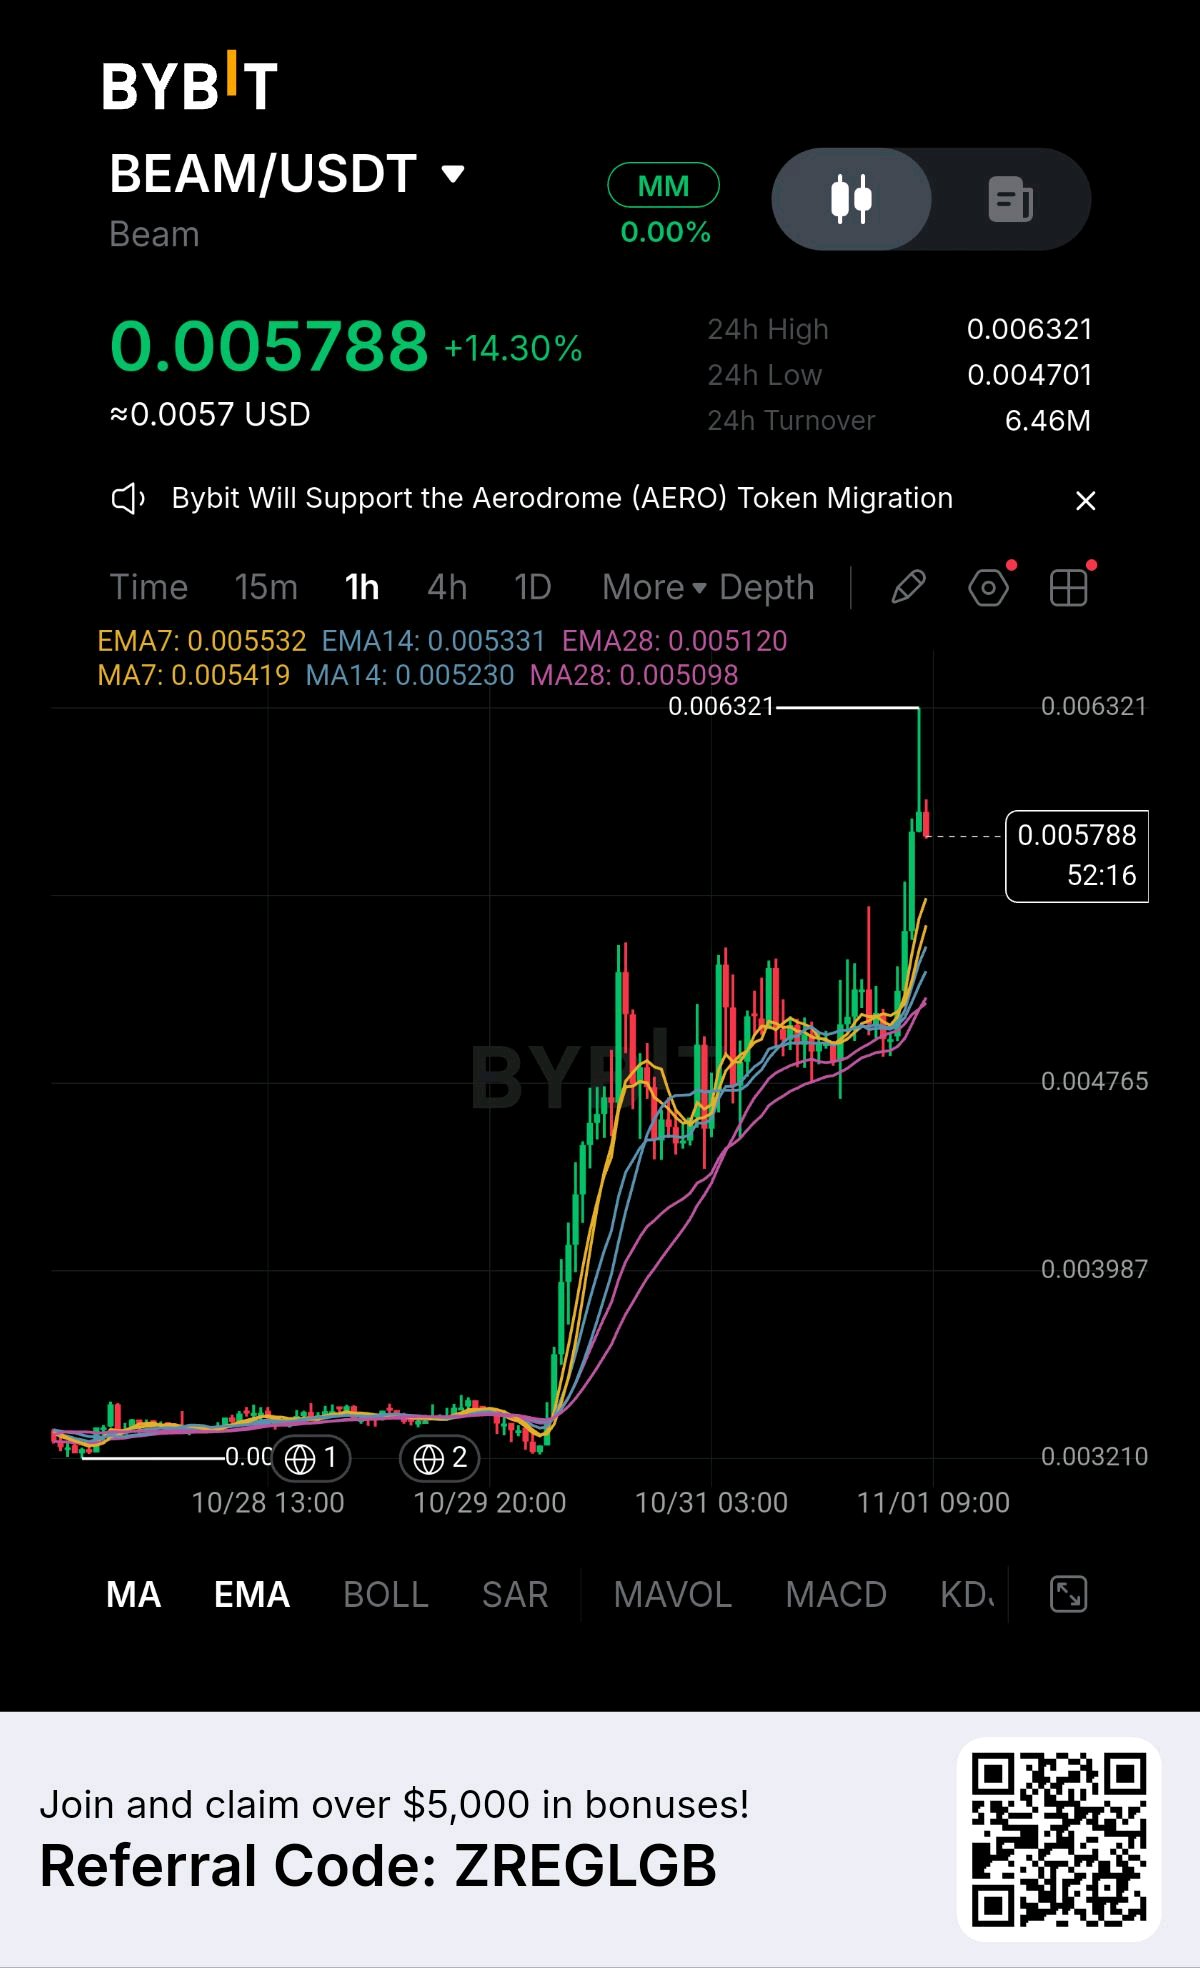
### BEAM/USDT $BEAMUSDT – Market Update & Technical Analysis ### $0.005788 +14.30% 24H change $0.006321 24H high $0.004701 24H low ### 1\. Market Structure BEAM is showing strong bullish momentum on the 1-hour timeframe. * Price has broken out of its previous consolidation zone. * Strong green candles indicate increased buying pressure. * Price is trading above EMA 7, EMA 14 and EMA 28. * The EMA alignment suggests buyers currently control the short-term trend. * A small rejection from $0.006321 indicates some profit-taking. ### 2\. Key Technical Levels | Level | Price | Importance | | ---------------- | --------- | ---------------------- | | Major resistance | $0.006321 | Previous high | | Resistance 2 | $0.006000 | Psychological level | | Current price | $0.005788 | Market price | | Support 1 | $0.005532 | EMA 7 | | Support 2 | $0.005331 | EMA 14 | | Support 3 | $0.005120 | EMA 28 | | Major support | $0.004765 | Previous consolidation | ### 3\. Possible Market Scenarios Bullish scenario Positive If BEAM maintains support around $0.00553 and breaks above $0.00600, another attempt toward $0.006321 is possible. A confirmed breakout above $0.006321 could open the way toward $0.00660–$0.00680. Bearish scenario Risk If buyers lose $0.00553, price could retrace toward $0.00533 and $0.00512. Losing $0.00512 would weaken the current bullish structure. ### 4\. Trading Strategy * Potential entry: $0.00550–$0.00560 after a bullish confirmation. * Breakout entry: Above $0.00600 after a successful retest. * Take profit 1: $0.00600 * Take profit 2: $0.00632 * Take profit 3: $0.00660–$0.00680 * Invalidation: Sustained move below $0.00512. These are conditional levels, not guaranteed outcomes. Avoid chasing the price after a 14.3% rally. ### 5\. Final Market Outlook BULLISH – WATCH FOR RETEST BEAM is showing a strong breakout structure, with buyers maintaining control above the major moving averages. However, the recent sharp rally increases the possibility of short-term consolidation or a pullback before another upward move. My strategy: Wait for a healthy retest around $0.00553–$0.00560 or a confirmed breakout above $0.00600 rather than chasing the current candle. Analysis based on your uploaded 1-hour Bybit chart, not live market confirmation. #WSOT2026 #IMPACTbyTrade #BybitStocks #AnthropicS1Filing #NewFinancialPlatform $BTCUSDT