moveon0
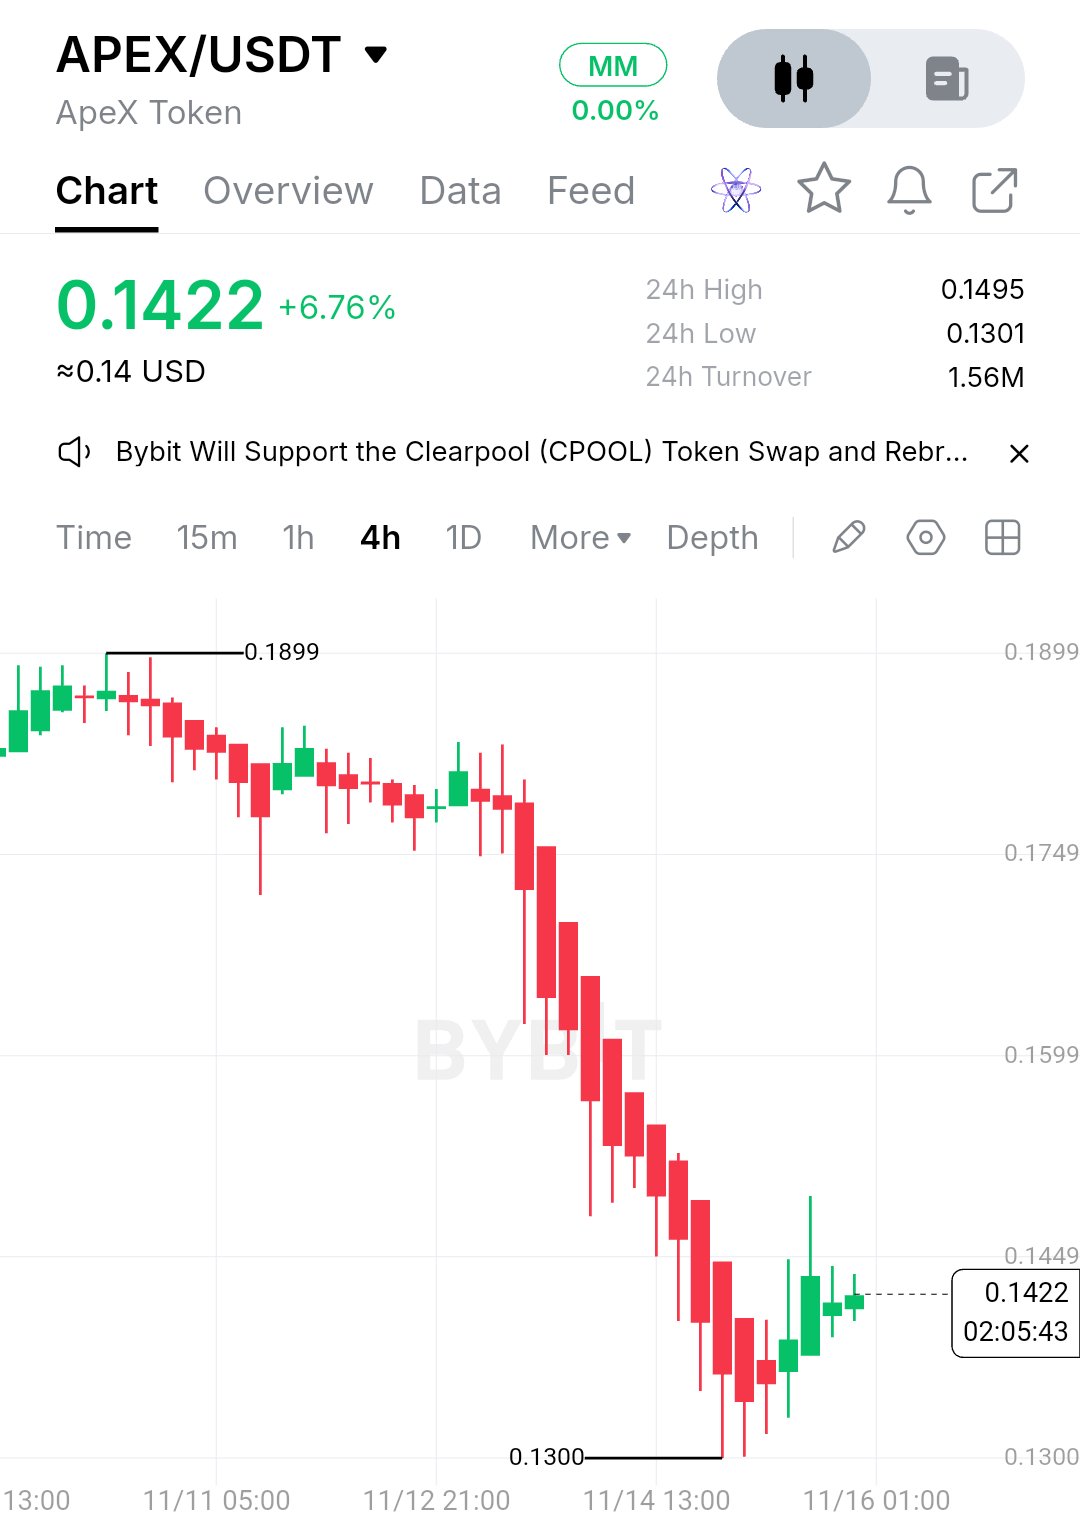
$APEXUSDT is an Ethereum-based token, not a standalone blockchain, and that distinction matters when looking at its economics. There is no native APEX network transaction count, median transaction size, miner fee revenue or hashrate figure to compare against block rewards. So the payments usage is not the right way to measure this asset. APEX is tied to ApeX Protocol, a decentralized derivatives trading ecosystem. APEX has staking, governance and protocol incentive utility, and that is the point. Token holders can earn APEX rewards, but current validator revenue, staking yield and fee-to-reward ratios are not independently established by the available data. There is no APEX mining halving or native block reward reduction to price in. I don't think that's a design flaw. When someone quotes the transaction count, the number that matters for this token is different: actual protocol activity, fee generation and whether that activity creates sustainable demand for APEX. The latest available market data shows APEX around $0.1422, up roughly 6.8% in 24 hours but still down 22.6% over seven days. The 4H chart shows a sharp selloff from the $0.18 area toward $0.1300, followed by a recovery. Underneath is ApeX Omni's expansion into perpetual markets, including crypto, US stocks and prediction markets. ApeX was also reported to have recorded $11.661 billion in 30-day trading volume in the October 22 DEX market comparison. That explains the attention, not a guaranteed token-price catalyst. No directional call from the middle of a box after a move this size. Levels instead: Above $0.1495: a daily close over it turns the recent ceiling into a support test. The next major resistance area is around $0.1599–$0.1749. Below $0.1300: a daily close under it says the recovery is failing. The next downside area needs fresh price discovery. $0.1300–$0.1495: the immediate range, roughly 15% wide. Window: the next several daily closes. APEX needs sustained protocol activity and stronger buying pressure to support a recovery. The breakout case is invalid on acceptance below $0.1300. #IMPACTbyTrade
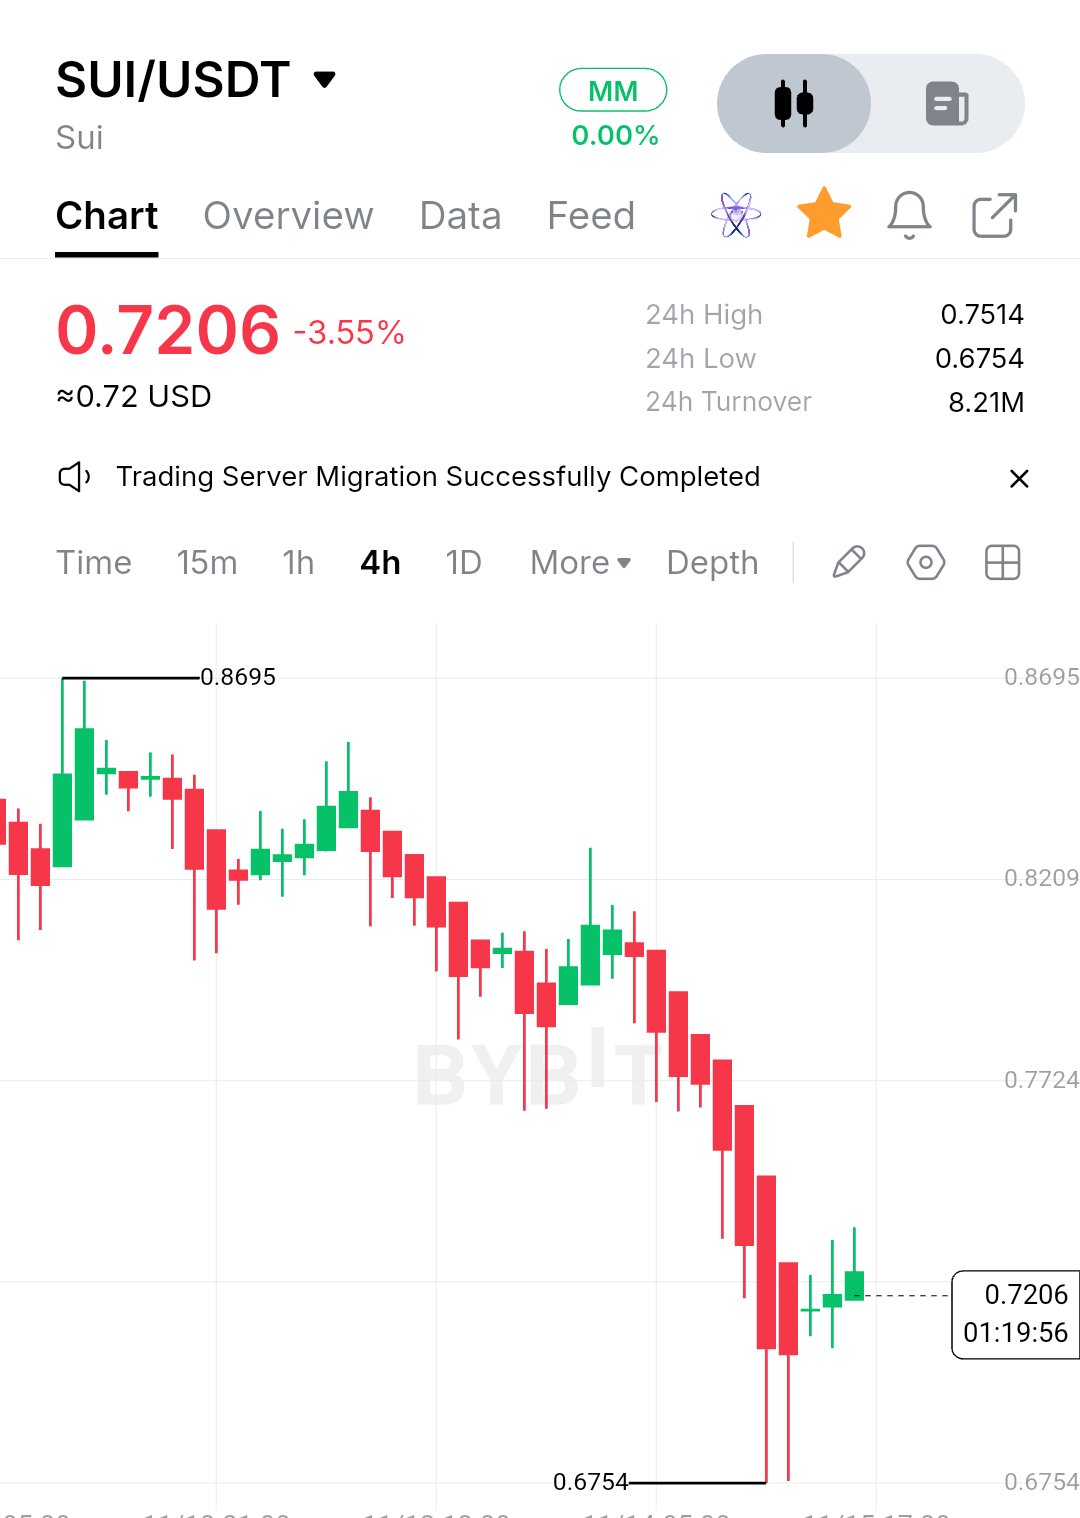
$SUIUSDT — Buyers are attempting a recovery, but the 4H downtrend is still in control. SUI is trading around $0.7206, down approximately 3.55%, after an extended bearish move from the $0.8695 swing high. The chart shows a clear sequence of lower highs and lower lows, suggesting sellers have maintained control over the broader structure. The important development is the recent reaction around $0.6754. Price experienced a sharp selloff into this area, printed long lower wicks and started producing consecutive green 4H candles. That tells me buyers are finally responding, but a reaction from support is not the same as a confirmed reversal. For a stronger recovery, SUI needs to establish a base above $0.70 and reclaim the $0.7514 area. A sustained 4H close above that level would be the first meaningful sign that selling pressure is weakening. Upside checkpoints: • $0.7514 — First resistance and immediate recovery test. • $0.7724 — Important structural resistance. Reclaiming this level would improve the short-term outlook. • $0.8209 — Broader recovery objective if buyers regain momentum. • $0.8695 — Previous swing high and major upside reference if the larger structure eventually turns bullish. From the current price, a move toward $0.7514 represents approximately 4.3% upside, while $0.7724 would represent around 7.2%. But there is another side to this chart. If buyers fail to defend the current recovery and price loses $0.70, another test of $0.6754 becomes possible. A clean 4H breakdown and acceptance below $0.6754 would invalidate the immediate bullish recovery thesis and expose SUI to further downside. My read: SUI is attempting to form a short-term base after a heavy selloff, but the higher-timeframe structure remains bearish until important resistance levels are reclaimed. I would rather see buyers prove themselves above resistance than assume every bounce from support is the beginning of a new uptrend. There is a difference between believing in an asset and respecting what its chart is actually telling you. #IMPACTbyTrade
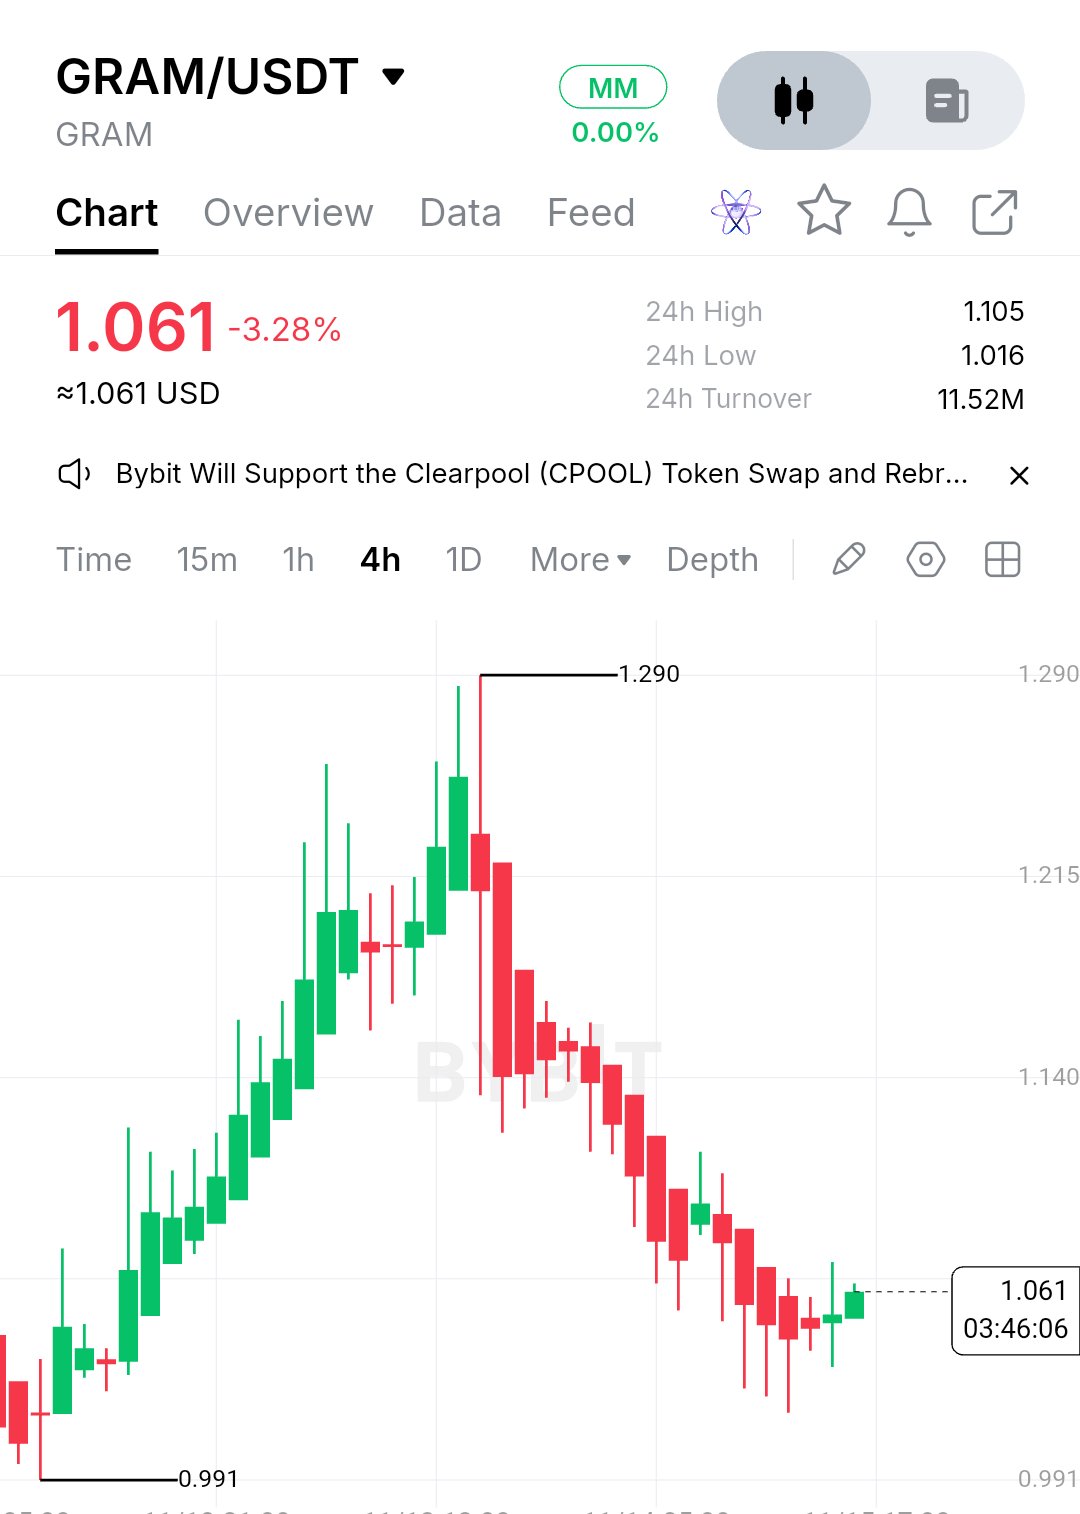
$GRAMUSDT is trading around $1.061, down roughly 3.28% over 24 hours. The chart shows a recovery from $0.991 toward $1.290 before sellers took control. The exact 24-hour transaction count, median transaction size and validator fee-versus-reward breakdown are not independently verified here, so I wouldn't put invented numbers behind the network activity. So the payments usage is real, but transaction activity and the revenue securing a network are two different measurements. GRAM runs on TON, a Proof-of-Stake network. Validators secure the chain through staking rather than mining, so hashrate is not the relevant metric. Transaction fees are paid in GRAM, while validator rewards also come through the network's staking and issuance economics. A verified current fee-to-validator-revenue percentage is unavailable. The date I keep circling is not a halving date. TON does not have a scheduled Bitcoin-style halving that cuts block rewards from one fixed amount to another. Its supply and validator economics follow a different model, with ongoing issuance. That means the question is whether network usage and fee generation can support the economics of securing the chain over time. I don’t think that’s a design flaw. When someone quotes the transaction count, the number that pays for security is a different one. GRAMUSDT has been under pressure over the past month, but the recent recovery from $0.991 toward $1.290 has stalled inside a wide box. Underneath is Telegram adoption. Pavel Durov reported more than one million self-custodial GRAM wallet activations within 48 hours and described GRAM as significantly undervalued, even predicting it could become one of the world's three largest cryptocurrencies. That's a meaningful adoption headline, but wallet activation doesn't automatically mean sustained buying demand. No directional call from the middle of a box after a move this size. Levels instead: Above $1.290: a daily close over it turns the old ceiling into a support test. Prior supply sits around $1.340–$1.460. Below $0.991: a daily close under it says the recovery is failing. Former support around $1.060–$1.000 is the next area. $0.991–$1.290: chop, roughly 30.2% wide. Window: the next several daily closes. GRAM tends to amplify broader crypto-market moves, so a BTC range break can reset this read early. The breakout case is invalid on acceptance below $0.991. #IMPACTbyTrade
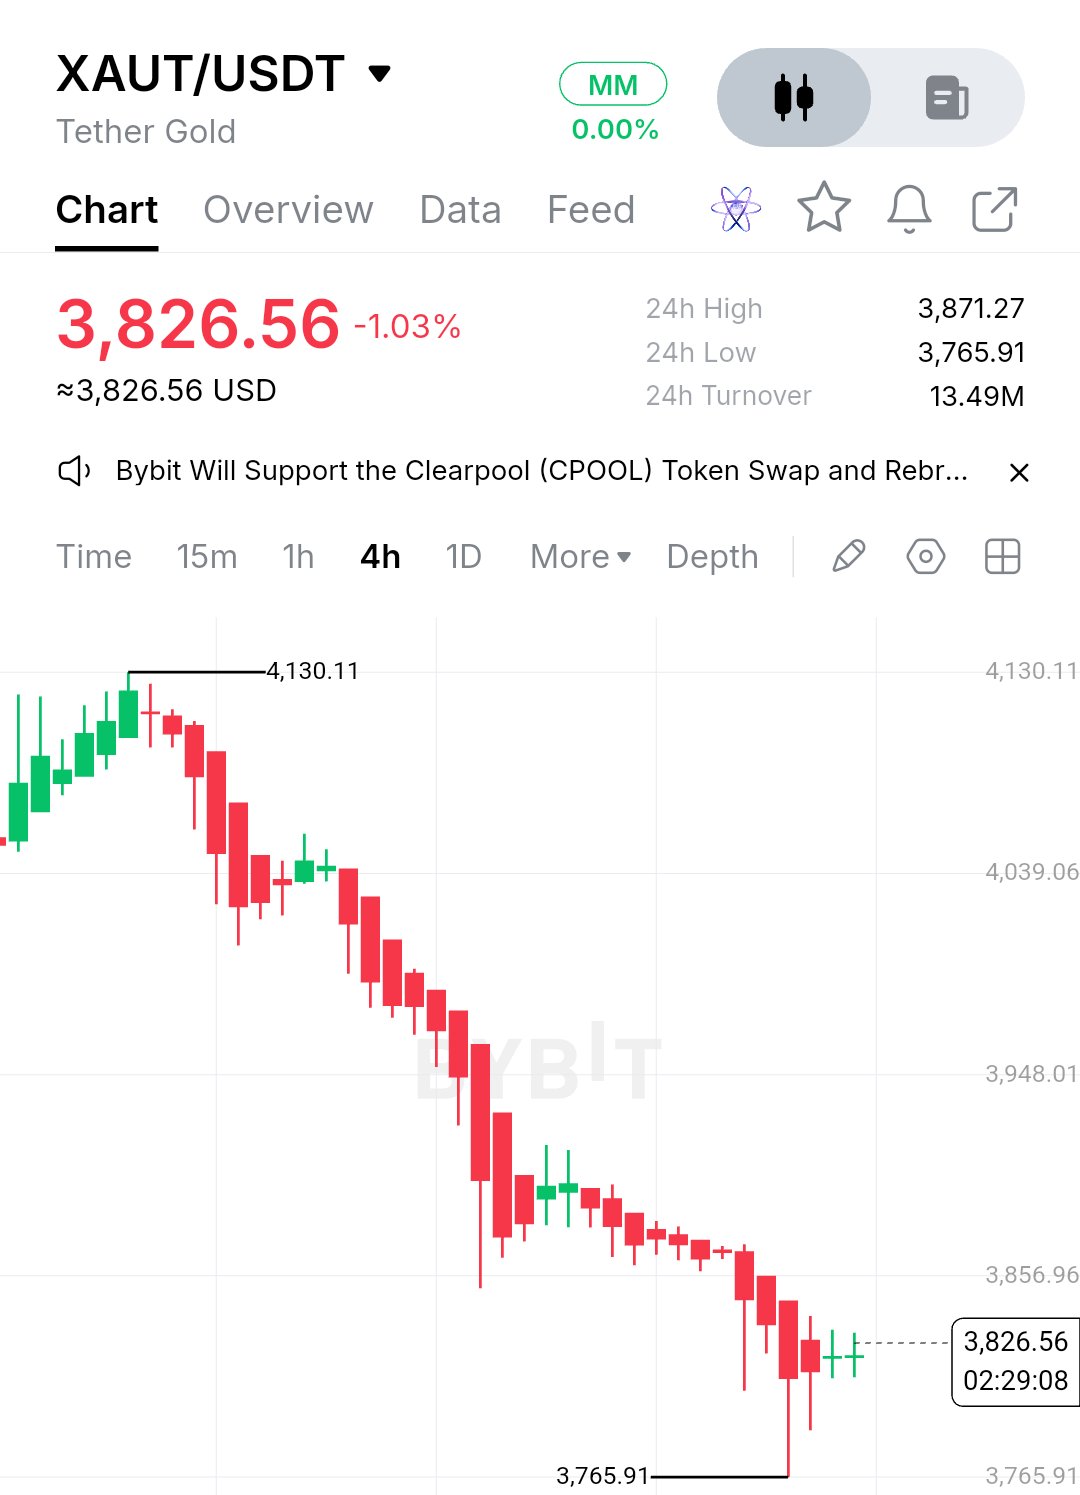
$XAUTUSDT — Sellers remain in control as gold loses its previous support structure. Is the $3,765 demand zone strong enough to trigger a recovery? Tether Gold is showing a clear bearish structure on the 4H chart. Price has fallen from the $4,130 region, printing consecutive lower highs and lower lows. Previous buying areas around $4,039 and $3,948 failed to provide meaningful support, allowing sellers to push the market toward $3,765.91. Currently, XAUT is trading around $3,826, with the chart showing a small reaction from the recent low. However, a few green candles do not confirm a reversal. The broader momentum remains weak. The latest market data also shows approximately 1% daily downside and 5.63% weekly downside. RSI readings are approaching oversold territory, suggesting selling pressure has become extended, but oversold conditions alone are not a buy signal. What needs to happen next? Buyers need to defend the $3,765–$3,780 demand region and establish a higher low on the 4H timeframe. The first important challenge is reclaiming $3,857. A sustained move above this level, followed by a successful retest, could signal that short-term momentum is shifting. Upside checkpoints if buyers regain control: • $3,857 — First resistance and recovery confirmation area. • $3,927 — Next structural resistance. • $3,976 — Important Fibonacci resistance and potential recovery checkpoint. • $4,025 — Broader recovery objective if bullish momentum strengthens. From the current $3,826 area, a move toward $3,976 would represent approximately 3.9% upside, but this remains conditional on reclaiming intermediate resistance levels. Risk management and invalidation: The $3,765 region is the critical level to watch. A decisive 4H candle close below $3,765, followed by a failed retest, would weaken the recovery thesis and expose XAUT to further downside. Until buyers reclaim $3,857, rallies should be treated cautiously. The existing bearish structure has not been broken. My view: Gold can remain a valuable asset while its short-term chart remains bearish. There is a difference between believing in an asset and choosing the right moment to trade it. Structure first, confirmation second, execution last. #IMPACTbyTrade
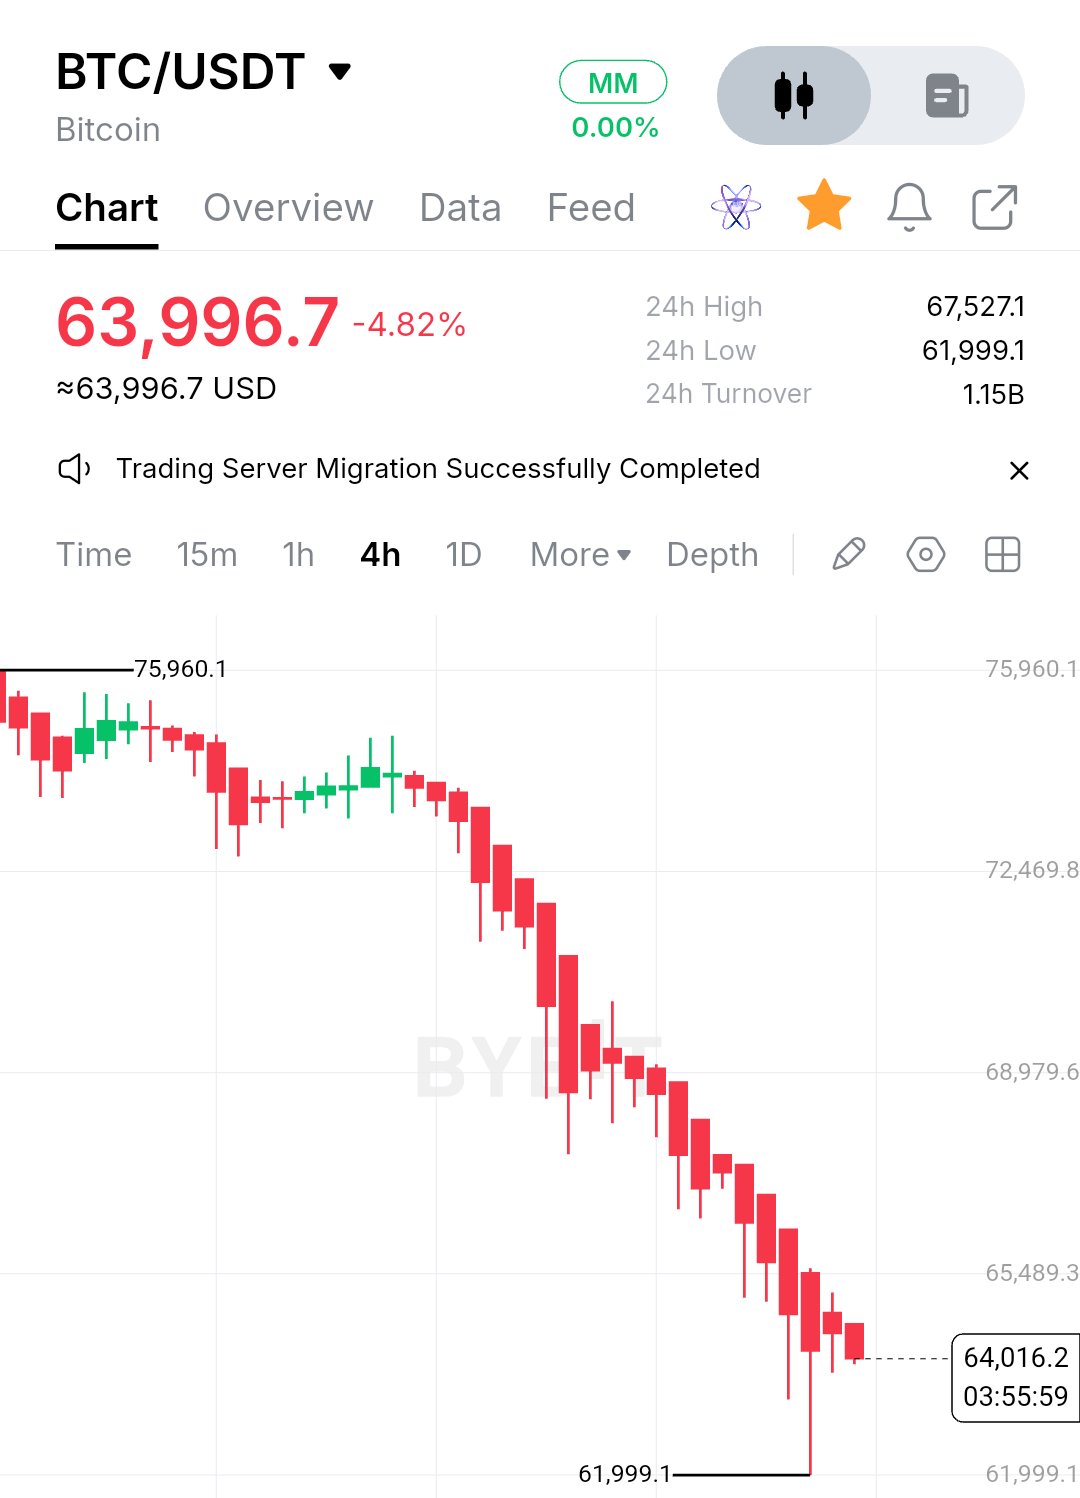
$BTCUSDT — The 4H structure remains bearish, and the current bounce has not yet changed the market direction. Bitcoin is trading around $63,996 after an aggressive sell-off from the $75,900 region. What initially looked like a corrective pullback has developed into a clear sequence of lower highs and lower lows. Several previous price areas failed to attract enough buying pressure to stop the decline. Sellers continued defending lower resistance zones, pushing BTC through the $72,469 and $68,979 regions before price eventually reached the $61,999 low. That last level is particularly important. BTC has shown some reaction from $61,999, recovering toward $64,000, but a bounce alone is not evidence of a structural reversal. On the 4H chart, bearish momentum remains dominant, and buyers still have significant work to do. What needs to happen next? For a meaningful recovery, buyers need to defend the $62,000 demand area and establish a higher low. After that, reclaiming $65,489 would be the first meaningful sign that selling pressure is weakening. A sustained move above this level could open the way toward: • $65,489 — First recovery checkpoint, approximately 2.3% upside. • $68,979 — Major structural resistance, approximately 7.8% upside. • $72,469 — Broader recovery objective, approximately 13.2% upside. These are conditional recovery levels, not guaranteed destinations. Each reclaim needs confirmation through price acceptance and a successful retest. Where is the risk? If BTC fails to hold the $62,000 region and establishes a sustained breakdown below the recent low, the bullish recovery scenario becomes invalid. That would indicate sellers are still controlling the market and another downside expansion could follow. For now, I would rather see BTC build a proper base than chase the first green candles after such a heavy decline. The bigger picture matters, but so does execution. Believing in Bitcoin long-term does not mean every price level is a good long entry. Let the structure confirm the trade before committing capital. #IMPACTbyTrade
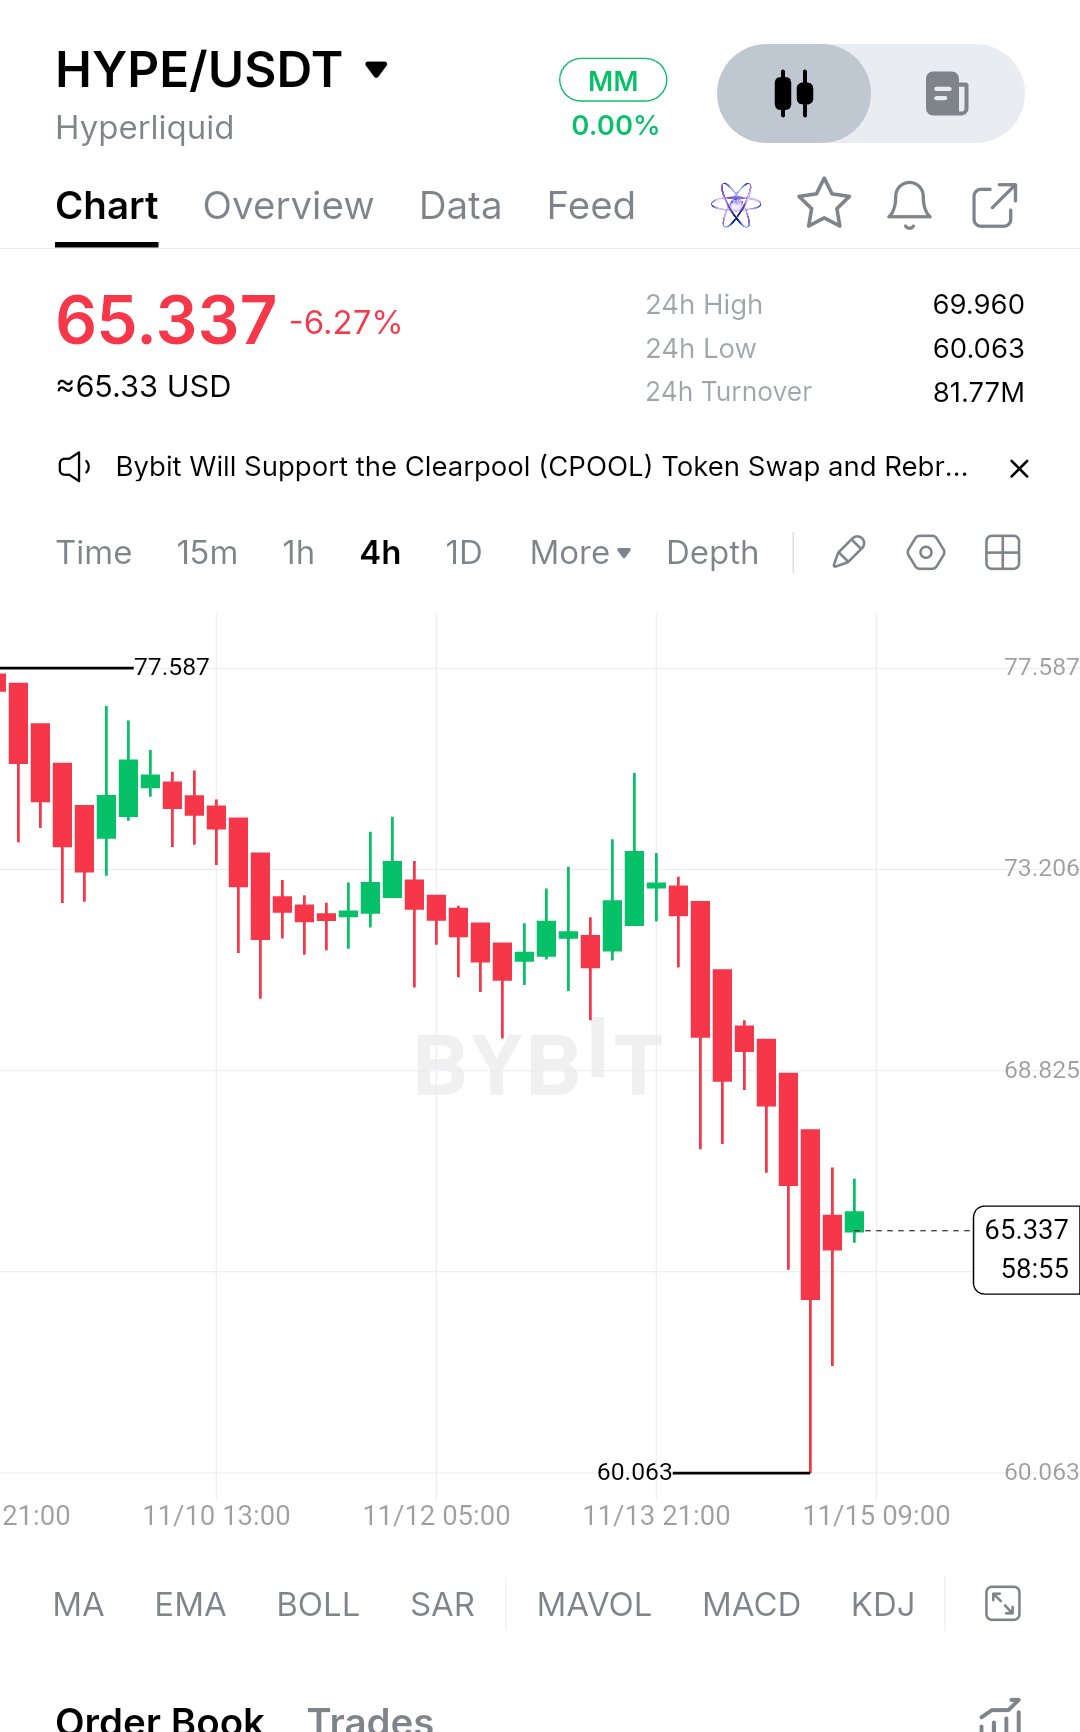
$HYPEUSDT has real economic activity behind it. Hyperliquid generated roughly $3.91 million in revenue over the last 24 hours, while perpetual futures volume reached about $71.57 billion over seven days. A reliable 24-hour transaction count and median transaction value aren't available in the data I could verify. So the network usage is real, and it barely tells us how much of the security budget comes from fees. HYPE is different from a mining-based network. Its security comes from the validator and staking system, with HYPE staking and protocol economics playing a role. But I couldn't verify a current validator reward figure against total network fees, so putting a percentage on validator revenue would be guessing. The date I keep circling is the next major token supply event. HYPE has a capped maximum supply of roughly 999 million tokens, but it doesn't follow a Bitcoin-style fixed halving schedule. Future emissions, community distributions and contributor unlocks matter more here. At current fee levels, the important question is how much organic network activity can support the ecosystem as token emissions and unlocks continue. I don't think that's a design flaw. When someone quotes the transaction count, the number that pays for security is a different one. HYPEUSDT is down roughly 15% in a week and has stalled inside a wide box: swing low near $60.06, high near $77.59. Underneath is strong Hyperliquid activity, with $3.91 million in reported 24-hour revenue and $71.57 billion in weekly perpetual futures volume. But the other side is aggressive selling. HYPE recorded approximately $60.3 million in liquidations over 24 hours, with 99.7% coming from long positions. It explains the attention, not a confirmed reversal. No directional call from the middle of a box after a move this size. Levels instead: Above $77.59: a daily close over it turns the old ceiling into a support test. Prior supply sits around $80–$83. Below $60.06: a daily close under it says the breakout is failing. Former support around $55–$58 is the next area. $60.06–$77.59: chop, roughly 29% wide. Window: the next several daily closes. HYPE tends to amplify BTC, so a BTC range break can reset this read early. The breakout case is invalid on acceptance below $60.06. $BTCUSDT #IMPACTbyTrade
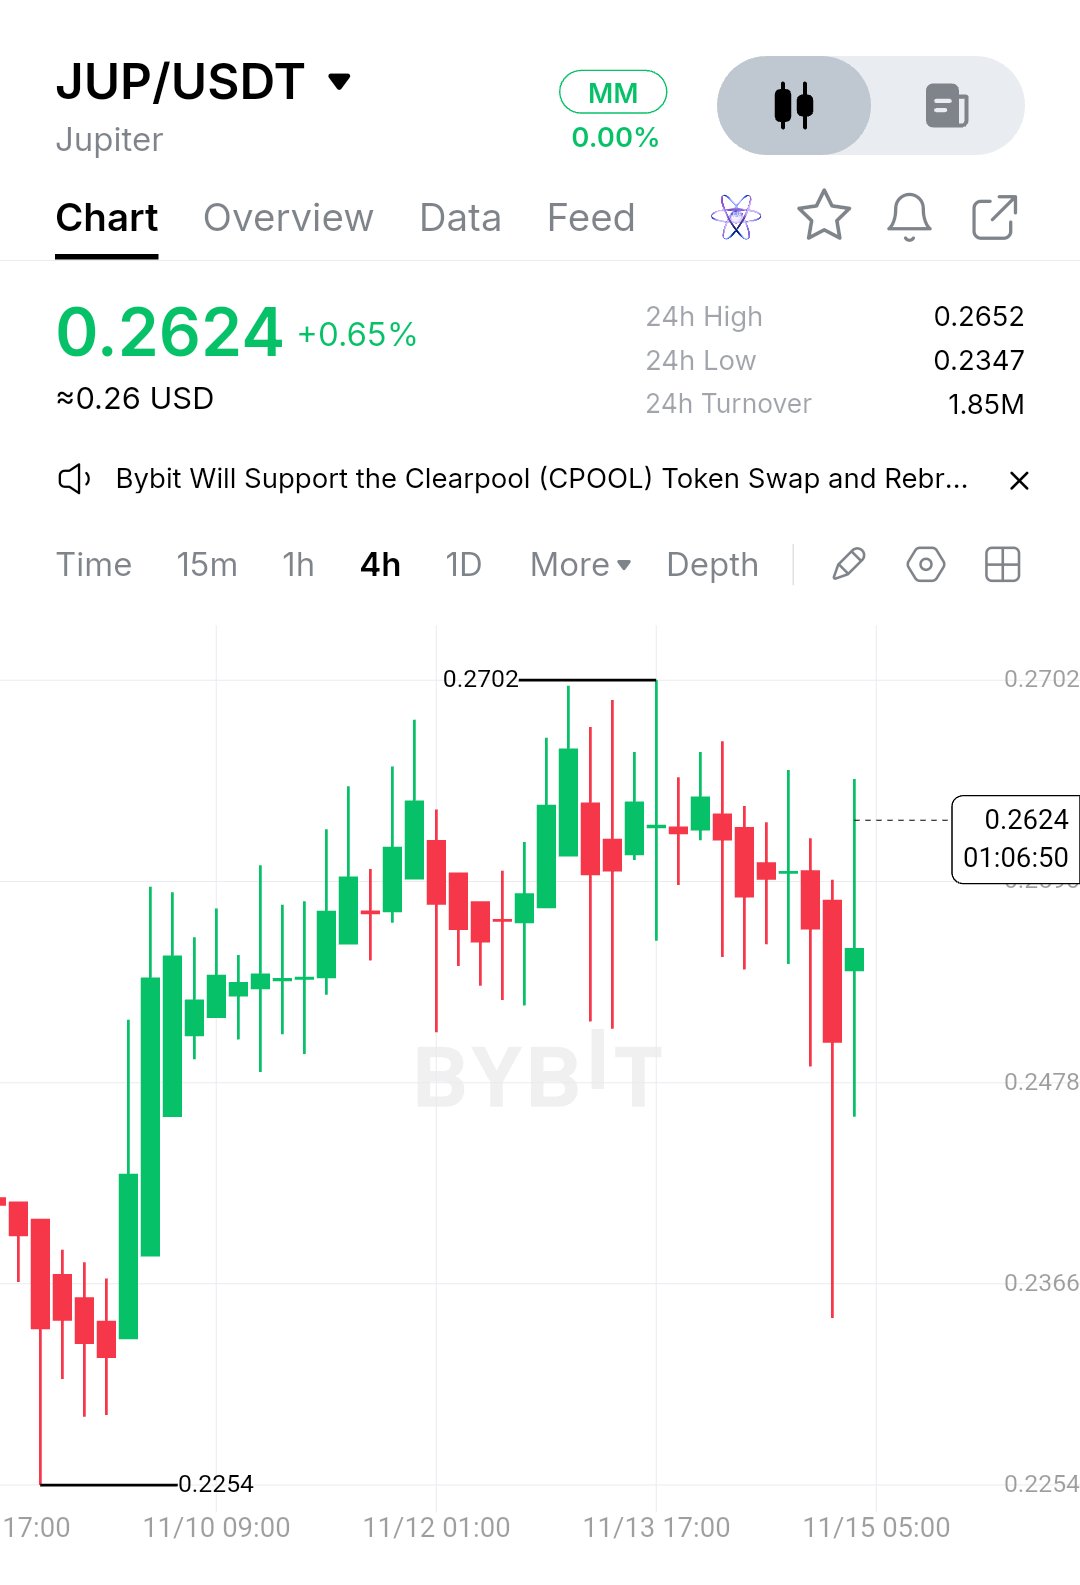
$JUPUSDT Jupiter (JUP) is a Solana ecosystem token, not a standalone blockchain. That distinction matters because JUP does not have its own miners, block rewards or independent hashrate. A verified 24-hour JUP transaction count, median transfer size and token-specific fee revenue are not available in the data checked. So the payments usage is real at the protocol level, but it cannot be translated directly into a JUP security budget. Jupiter is currently trading around $0.2623, with approximately 3.32B JUP circulating against a total supply of 6.86B. That leaves a substantial portion of supply outside circulation. But it also means token supply and distribution matter more than mining economics. The next confirmed dated supply reduction and its exact token amounts are not established in the available data. I don’t think that’s a design flaw. When someone quotes Jupiter's trading activity, the number that supports the underlying network is a different one. JUPUSDT is up roughly 9.7% in seven days and has stalled inside a box: swing low near $0.2254, high near $0.2702. Underneath is Jupiter's four-product expansion announced November 10, covering Portfolio V3, Vaults, Baskets and Pulse. Jupiter also added Elysium to its Bridge on November 12, expanding transfers between Solana and Elysium. It explains the attention, not a confirmed dated token-price trigger. No directional call from the middle of a box after a move this size. Levels instead: Above $0.2702: a daily close over it turns the old ceiling into a support test. Prior supply sits around $0.280–$0.300. Below $0.2254: a daily close under it says the breakout is failing. Former support around $0.240–$0.245 is the next area to watch on a breakdown. $0.2254–$0.2702: chop, roughly 20% wide. Window: the next several daily closes. JUP tends to amplify BTC's direction during broad market moves, so a BTC range break can reset this read early. The breakout case is invalid on acceptance below $0.2254. $BTCUSDT #ByXIMPACT
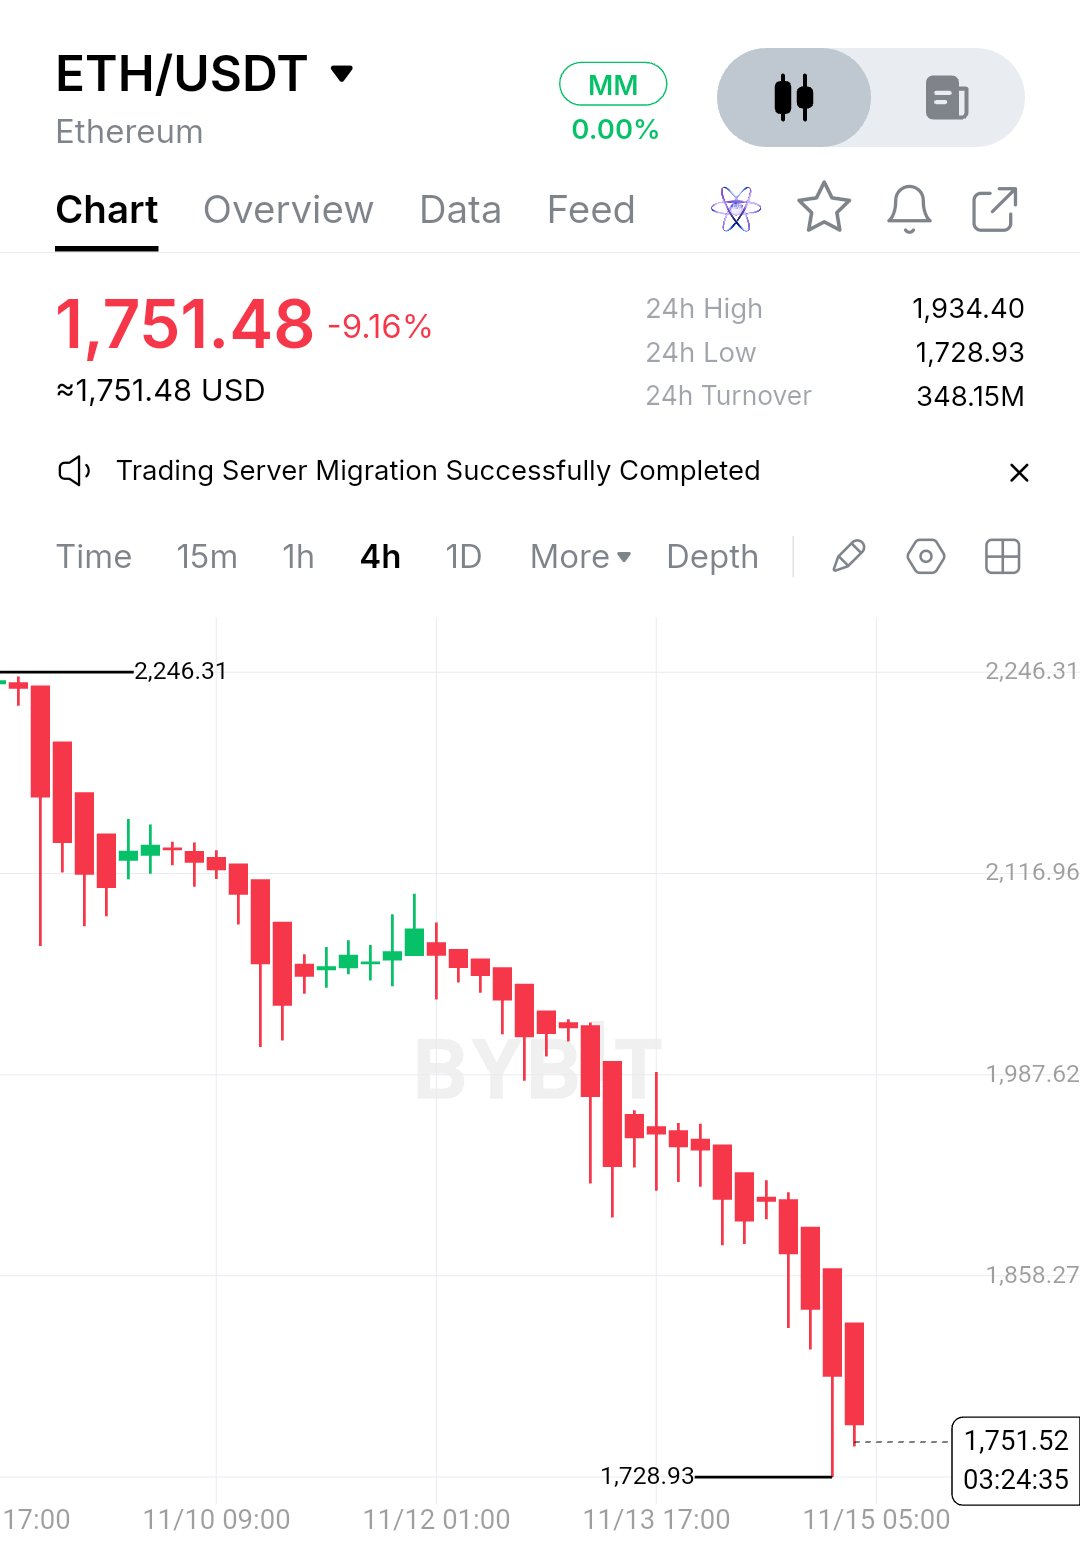
$ETHUSDT Ethereum moved roughly 9.1% lower in the last 24 hours, with ETH trading around $1,751. The 7-day decline is now approximately 21.6%. The screenshot shows a 4H breakdown, with price testing the $1,728.93 low. On-chain transaction count, median transaction value, and validator revenue versus issuance could not be independently verified, so I’m not going to manufacture those numbers. So the network's usage and the network's security budget are two different things. ETH is Proof-of-Stake, so hashrate and miner block rewards are no longer the right measurements. Validator rewards come primarily from issuance and transaction-related incentives, while EIP-1559 burns part of transaction fees. That is the point. Ethereum has no scheduled Bitcoin-style halving or fixed upcoming reward reduction. Its issuance changes dynamically with staking participation, while fee burns depend on network demand. I don’t think that’s a design flaw. When someone quotes the transaction count, the number that pays for security is a different one. ETHUSDT is down roughly 21.6% in a week and is testing the lower end of its recent trading range: $1,728.93 on the downside and $1,934.40 on the upside. Underneath is a broader market liquidity shock. More than $1.5 billion flowed out of US spot crypto ETFs during November 9–13, including approximately $398.9 million from Ethereum products. Heavy long liquidations have added further selling pressure. These explain the attention, not a dated Ethereum protocol trigger. No directional call from the middle of a breakdown after a move this size. Levels instead: Above $1,934: a daily close over it starts turning the immediate selling structure into a recovery attempt. Prior resistance sits around $1,987–$2,050. Below $1,728.93: a daily close under it says the breakdown is continuing. The next support area needs fresh historical price confirmation. $1,728.93–$1,934.40: the immediate range, roughly 11.9% wide. Window: the next several daily closes. ETH tends to amplify BTC, so a BTC range break can reset this read early. The breakout case is invalid on acceptance below $1,728.93. #IMPACTbyTrade
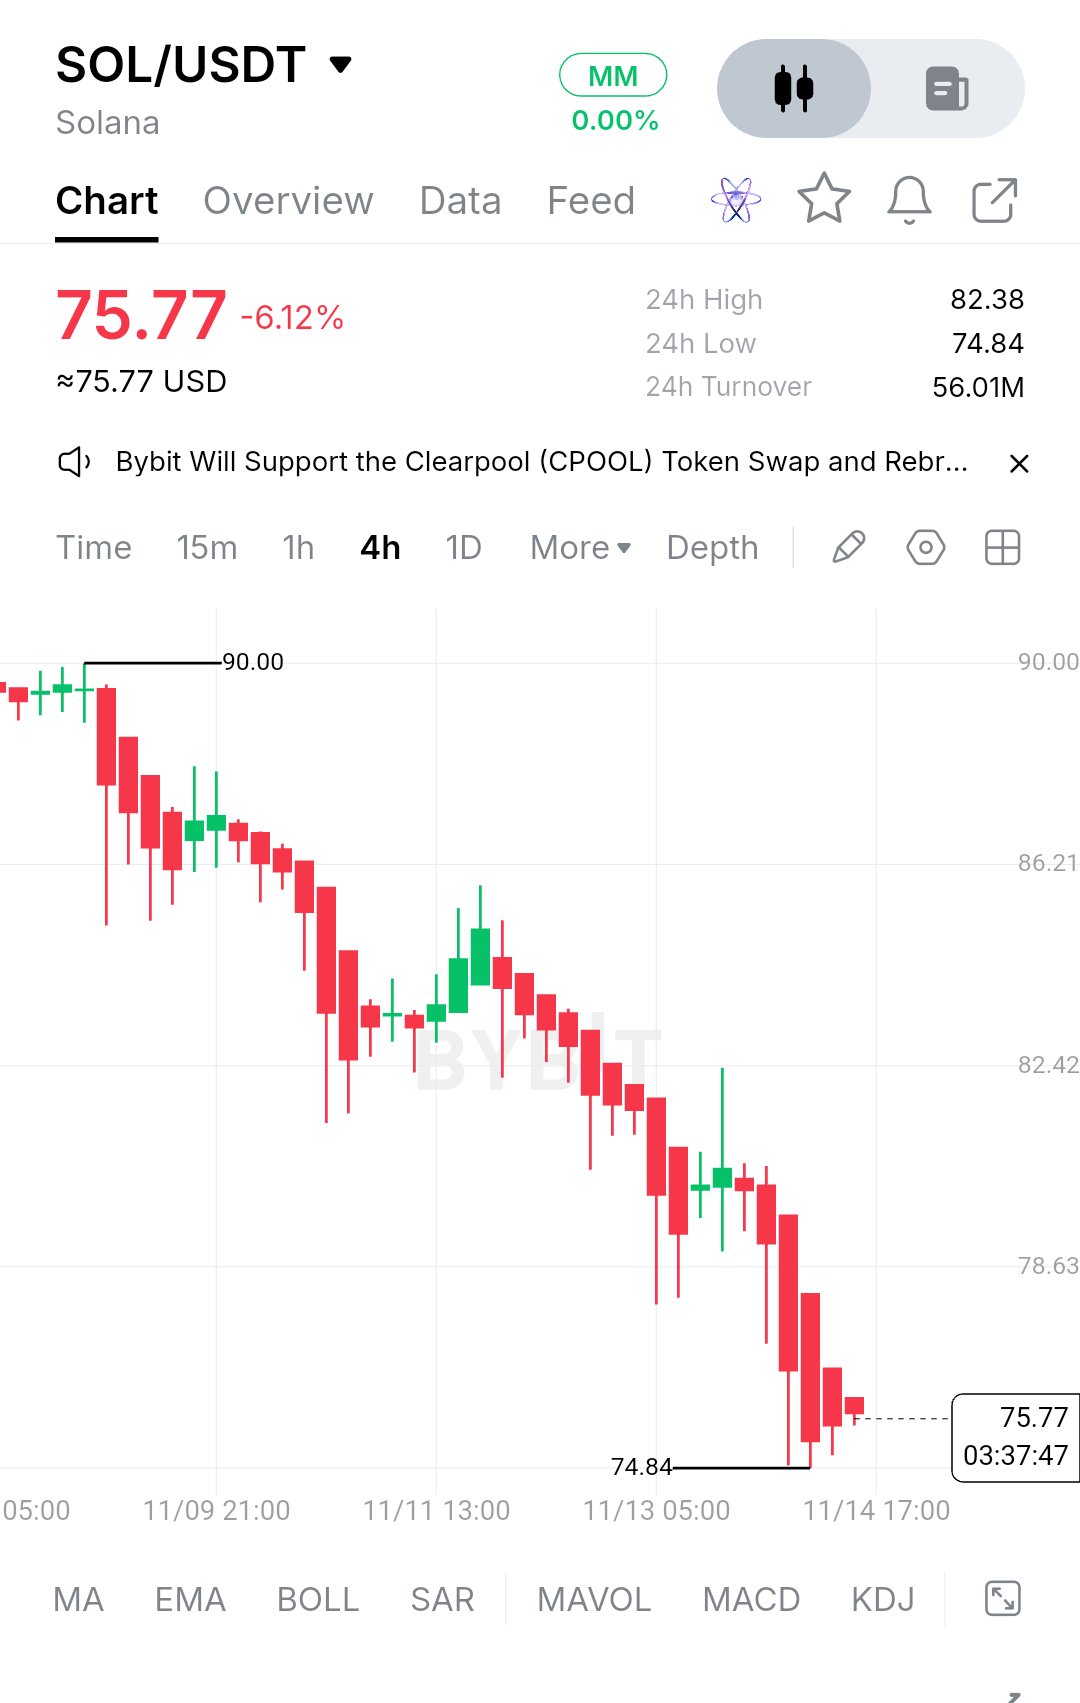
$SOLUSDT Solana generated roughly $9.14M in network fees over the last 24 hours, with protocol revenue near $3.29M. That activity shows real demand for blockspace, but fees alone do not tell us how much of validator compensation comes from issuance. So the payments usage is real, and it barely tells us what is funding network security. SOL is cheap to use, and that is the point. But it also means transaction fees are only one part of validator economics. Solana relies on staking rewards and inflation to compensate validators, rather than mining rewards. Its current inflation schedule started at 8%, declines by 15% annually, and eventually approaches a 1.5% long-term rate. The date I keep circling is different here: Solana has no fixed halving date. Its supply reduction happens gradually through the inflation schedule, rather than one sudden reward cut. At current fee levels, transaction fees alone cannot be assumed to replace staking issuance. Price, fees or staking economics have to. I don’t think that’s a design flaw. When someone quotes the transaction count, the number that pays for security is a different one. SOLUSDT is down roughly 15.74% in a week and has approached the lower end of its visible range: swing low near $74.84, high near $90.00. Underneath is continued institutional interest, but the latest ETF numbers are not encouraging. Solana investment products recorded roughly $28.40M in five-session outflows, with the latest settled session showing another $3.10M outflow. It explains the attention, not a dated catalyst for recovery. No directional call from the middle of a box after a move this size. Levels instead: Above $90.00: a daily close over it turns the old ceiling into a support test. Prior supply sits around $90–$94. Below $74.84: a daily close under it says the breakdown is extending. Former support around $70–$72 is the next area. $74.84–$90.00: chop, roughly 20.2% wide. Window: the next several daily closes. SOL tends to amplify BTC, so a BTC range break can reset this read early. The breakout case is invalid on acceptance below $74.84. #ByXIMPACT
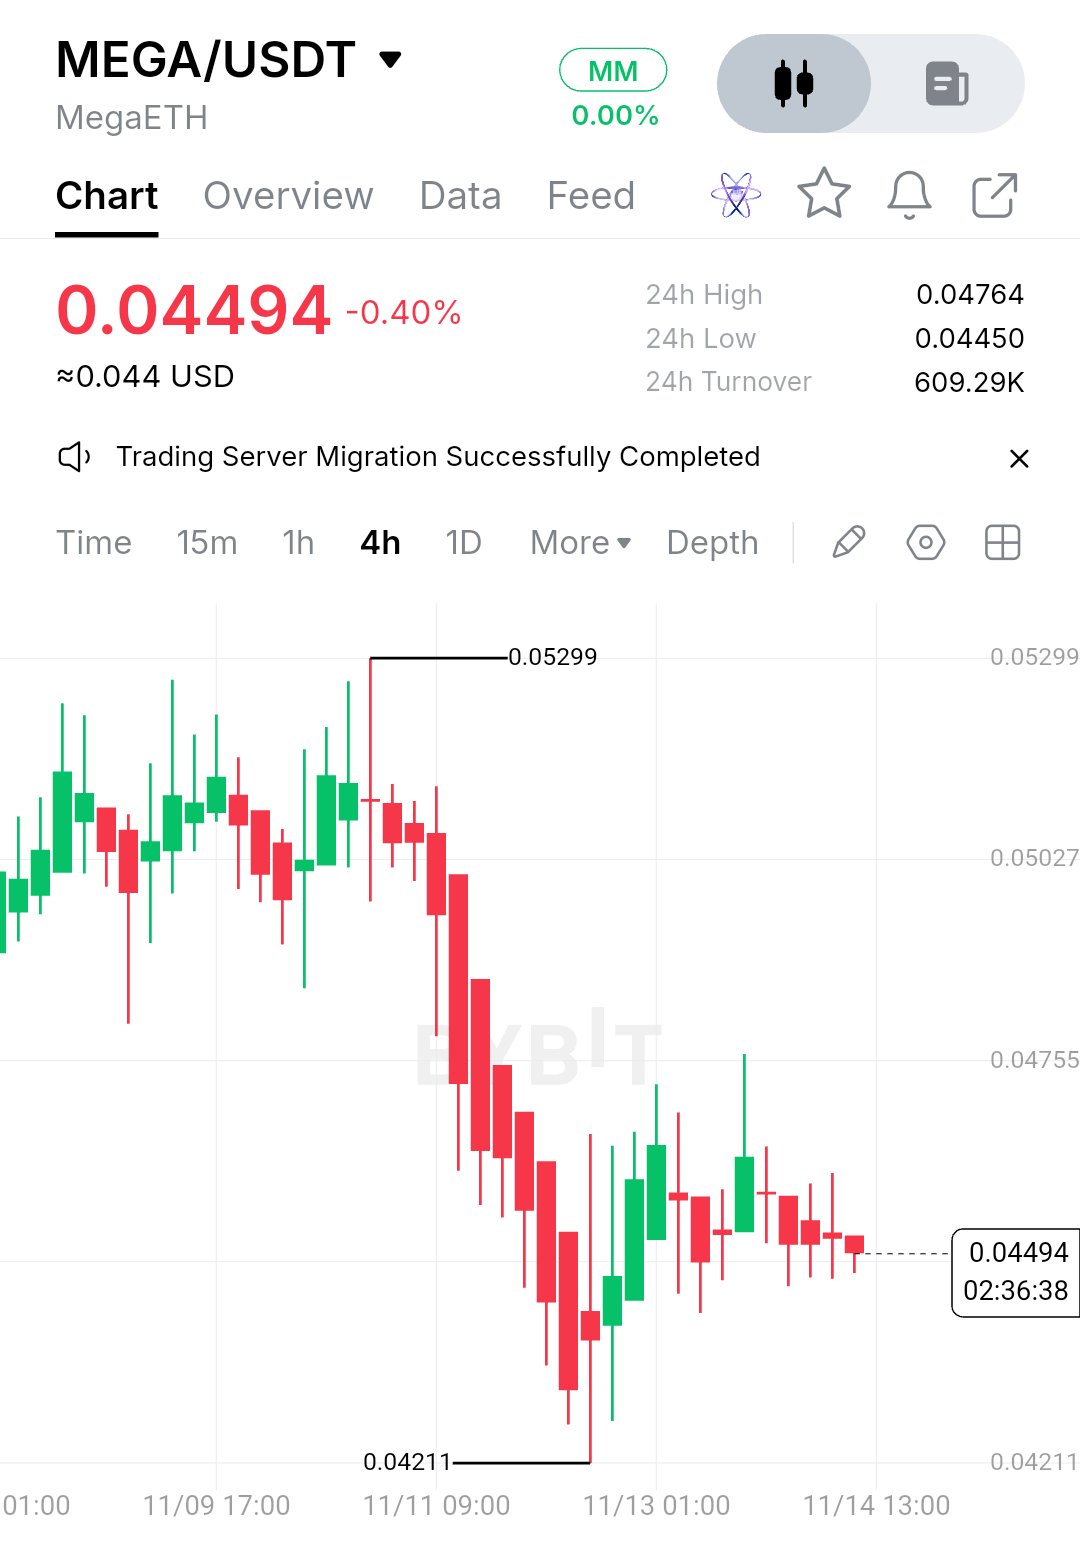
$MEGAUSDT is trading around $0.04494, but the interesting part is what sits underneath the chart. Publicly verifiable 24-hour transaction counts, median transaction size, network fees and sequencer revenue are not available in the data I could confirm. So the payments usage is real, but its contribution to the security budget cannot be measured honestly from the available figures. MEGA is built around MegaETH, an Ethereum-secured Layer 2 designed for real-time execution, with a stated target of up to 100,000 TPS and 10ms latency. Ethereum provides the underlying security, rather than a conventional mining system. That distinction matters. But it also means the network's actual fee contribution needs to be separated from the token's market activity. The date I keep circling is not a halving. MEGA has a fixed maximum supply of 10 billion tokens, with 53.3% allocated to performance-based staking rewards linked to ecosystem milestones. No confirmed date for a scheduled reward cut is established in the available information. At current fee levels, there is no verified basis to claim that network fees can replace future token incentives. I don’t think that’s a design flaw. When someone quotes the transaction count, the number that pays for security is a different one. MEGAUSDT is down roughly 7% in seven days and has stalled inside a box: swing low near $0.04211, high near $0.04755. Underneath is a major strategic shift. MEGA recently rebranded from the MegaETH Foundation, committed $30 million to new products and announced plans for an AI inference marketplace in December. The organization also confirmed a 20% workforce reduction. It still needs to deliver the planned product and demonstrate real adoption, so it explains the attention, not a dated price trigger. No directional call from the middle of a box after a move this size. Levels instead: Above $0.04755: a daily close over it turns the old ceiling into a support test. Prior supply sits around $0.05027–$0.05299. Below $0.04211: a daily close under it says the breakout is failing. Former support around $0.04000–$0.04100 becomes the next area to watch. $0.04211–$0.04755: chop, roughly 12.9% wide. Window: the next several daily closes. MEGA tends to amplify broader market moves, so an ETH or BTC range break can reset this read early. The breakout case is invalid on acceptance below $0.04211.$BTCUSDT #ByXIMPACT
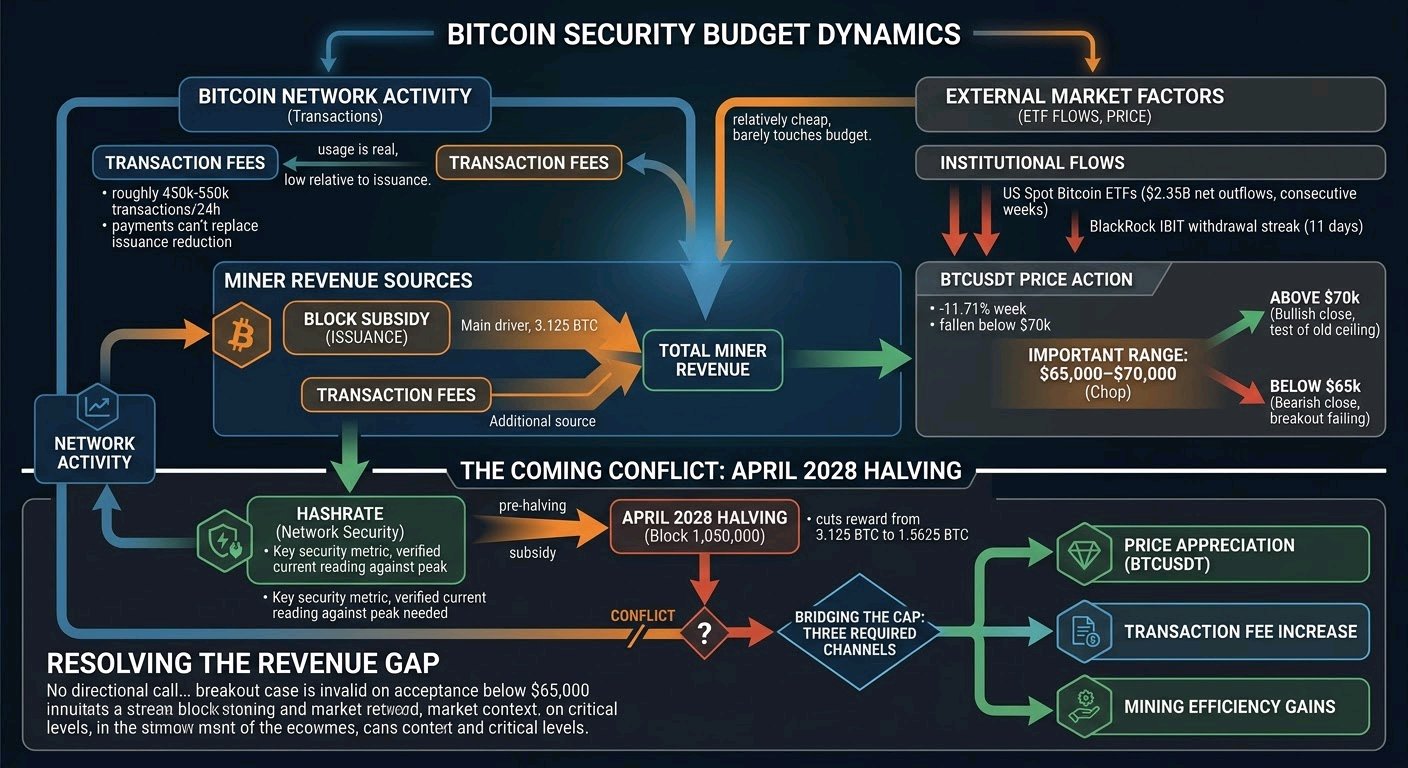
$BTCUSDT Bitcoin processed roughly 450,000–550,000 transactions in the last 24 hours, but the exact median transaction size and miner-fee totals need a verified on-chain snapshot. The next block subsidy remains 3.125 BTC, with fees providing an additional source of miner revenue. So the payments usage is real, and it barely touches the security budget. Bitcoin is relatively cheap to use compared with traditional settlement systems, and that is the point. But it also means the people running the network are paid almost entirely by issuance. Hashrate remains the key security metric, although I don't have a verified current reading against its all-time peak. The date I keep circling is the next Bitcoin halving. The estimated window is around April 2028, at block 1,050,000, cutting the reward from 3.125 BTC to 1.5625 BTC. At current fee levels, payments can't replace that reduction. Price, fees or mining efficiency has to. I don't think that's a design flaw. When someone quotes the transaction count, the number that pays for security is a different one. BTCUSDT is down roughly 11.71% in a week and has fallen below $70,000, with the $65,000–$70,000 area becoming an important range to watch. Underneath is continued pressure from institutional flows. US spot Bitcoin ETFs recorded approximately $2.35 billion in net outflows over two consecutive weeks, while BlackRock's IBIT extended its withdrawal streak to 11 sessions. It explains the attention, not a dated trigger. No directional call from the middle of a box after a move this size. Levels instead: Above $70,000: a daily close over it turns the old ceiling into a support test. Prior supply sits around $72,000–$75,000. Below $65,000: a daily close under it says the breakout is failing. Former resistance at $60,000–$62,000 is the next area. $65,000–$70,000: chop, roughly 7.7% wide. Window: the next several daily closes. Bitcoin tends to amplify broader market liquidity moves, so a macro-driven risk reversal can reset this read early. The breakout case is invalid on acceptance below $65,000.$HYPEUSDT #ByXIMPACT
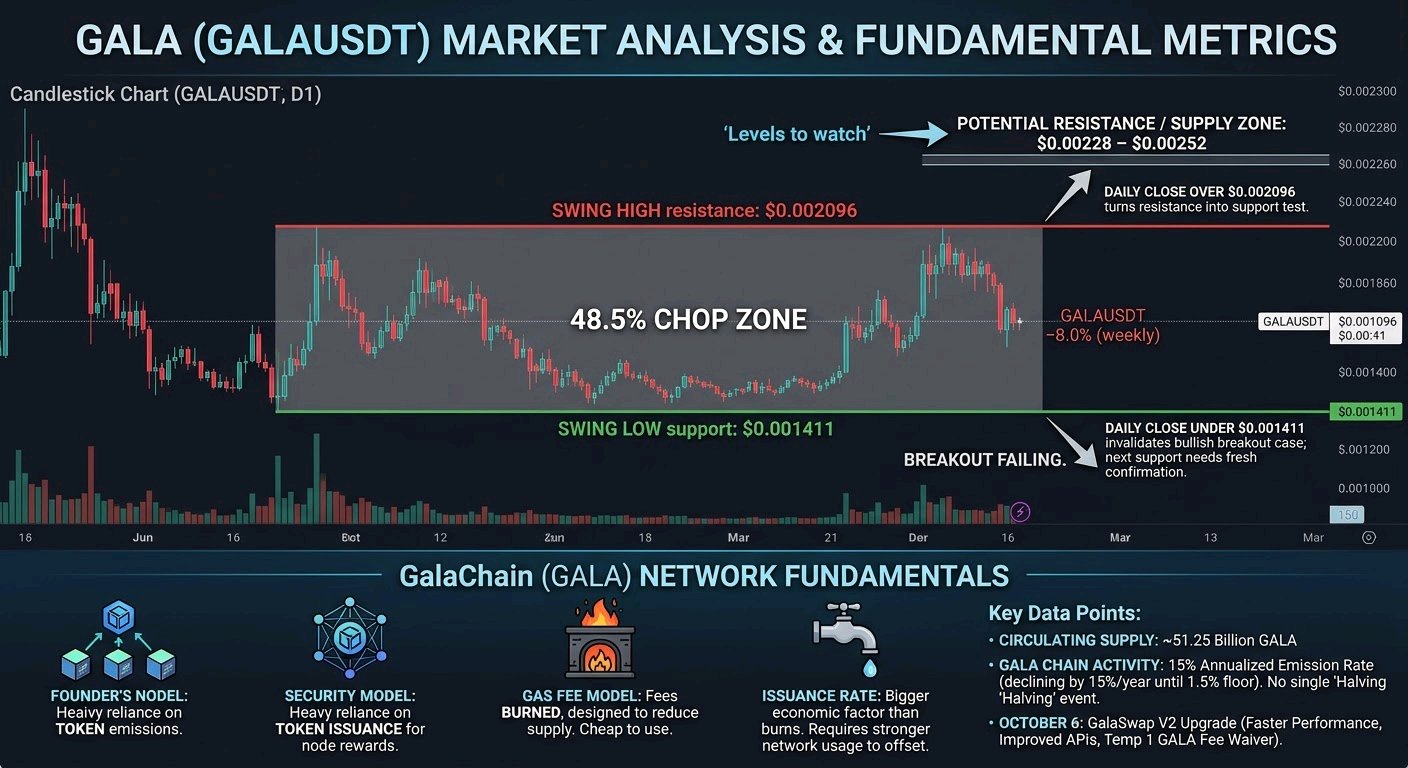
$GALAUSDT moved transactions across GalaChain, but a verified 24-hour transaction count and median transaction size in USD are not available in the latest accessible network data. Founder’s Node operators receive newly issued GALA for supporting the network, while gas fees are burned. The exact daily fee revenue against node rewards is not independently verified. Fees were designed to contribute to the supply balance, but issuance remains the bigger economic factor. GALA is cheap to use, with gas fees designed to be burned rather than distributed as miner revenue, and that is the point. But it also means the people running the network depend heavily on token issuance for rewards. Founder’s Node emissions are the relevant security metric here, not Ethereum hashrate. The current circulating supply reported by CoinMarketCap is around 51.25 billion GALA. The date I keep circling is the next emission adjustment. Gala's April 2026 tokenomics proposal introduced a 15% annualized emission rate, declining by 15% each year until reaching a 1.5% floor. This replaces the previous 50 billion hard-cap model. There is no confirmed fixed date or single reward reduction comparable to a traditional Bitcoin halving. At current fee levels, burns need stronger network usage to offset ongoing issuance. I don’t think that’s a design flaw. When someone quotes the transaction count, the number that pays for security is a different one. GALAUSDT is down roughly 8% in a week and remains inside a wide trading box: swing low near $0.001411, high near $0.002096. Underneath is the October 6 GalaSwap V2 upgrade, bringing faster performance, improved developer APIs and updated pool software to GalaChain. The upgrade explains the attention, not a dated price trigger. Its temporary 1 GALA transaction-fee waiver also has no announced end date. No directional call from the middle of a box after a move this size. Levels instead: Above $0.002096: a daily close over it turns the old ceiling into a support test. Prior supply sits around $0.00228–$0.00252. Below $0.001411: a daily close under it says the breakout is failing. The next support area needs fresh confirmation. $0.001411–$0.002096: chop, roughly 48.5% wide. Window: the next several daily closes. GALA tends to amplify BTC, so a BTC range break can reset this read early. The breakout case is invalid on acceptance below $0.001411. $BTCUSDT #ByXIMPACT
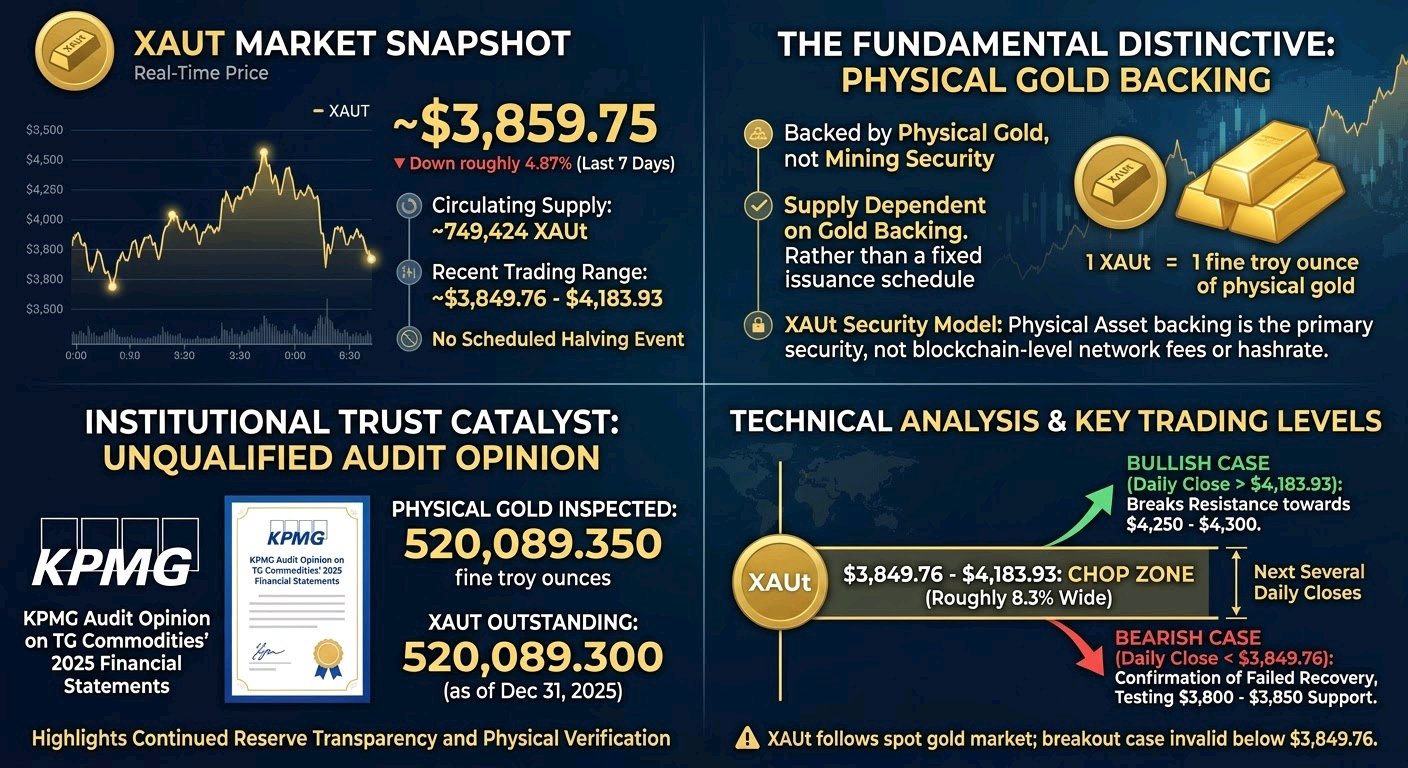
$XAUTUSDT Tether Gold (XAUt) is trading around $3,859.75, down roughly 4.87% over the last seven days. CoinMarketCap does not provide a verified 24-hour XAUt transfer count, median transaction size, or token-specific fee breakdown. That distinction matters because XAUt is backed by physical gold, not secured by mining. So the gold backing is real, but the security model is different. XAUt is cheap to transfer on supported blockchains, with network fees paid to the underlying chain's validators, not to XAUt miners. There is no XAUt hashrate, mining reward or protocol-level security budget to measure against those fees. Each token represents ownership of one fine troy ounce of physical gold. The date I keep circling is not a halving. XAUt has no scheduled block-reward reduction or fixed supply-cut event. Its supply depends on gold backing and token issuance or redemption. CoinMarketCap currently reports roughly 749,424 XAUt in circulating supply. More tokens require more allocated gold, not a mining schedule. I don't think that's a design flaw. When someone quotes the transaction count, the number that matters for XAUt is a different one: how much physical gold actually backs the outstanding tokens. XAUt is down roughly 4.87% in a week and is sitting near the bottom of its recent trading range: swing low near $3,849.76, high near $4,183.93. Underneath is a significant institutional catalyst. KPMG issued an unqualified audit opinion on TG Commodities' 2025 financial statements after physically inspecting the gold bars. The report showed 520,089.350 fine troy ounces against 520,089.300 XAUt outstanding as of December 31, 2025. It still needs continued reserve transparency and market adoption, so it explains the attention, not a dated price trigger. No directional call from the middle of a box after a move this size. Levels instead: Above $4,183.93: a daily close over it turns the old ceiling into a support test. Prior supply sits around $4,250–$4,300. Below $3,849.76: a daily close under it says the recovery is failing. Former support around $3,800–$3,850 is the next area. $3,849.76–$4,183.93: chop, roughly 8.3% wide. Window: the next several daily closes. XAUt follows the underlying gold market, so a sharp move in spot gold can reset this read early. The breakout case is invalid on acceptance below $3,849.76. #ByXIMPACT
I've noticed that finding a trading opportunity is one thing, but understanding why it might work is a completely different challenge. That's where Bybit AI can be useful. Instead of making decisions based only on market hype, AI can help traders explore market conditions, assess potential opportunities, and think through different trading strategies. What matters most to me is not blindly following an AI suggestion, but using it as a tool to: • Understand market trends and possible opportunities. • Explore different trading strategies. • Think about entry points and risk management. • Make more informed trading decisions. AI doesn't remove market risk or guarantee profits. Your own research and risk management still matter. The real edge comes from combining useful technology with your own judgment. #WSOTShowYourAITradeToEarn10USDT
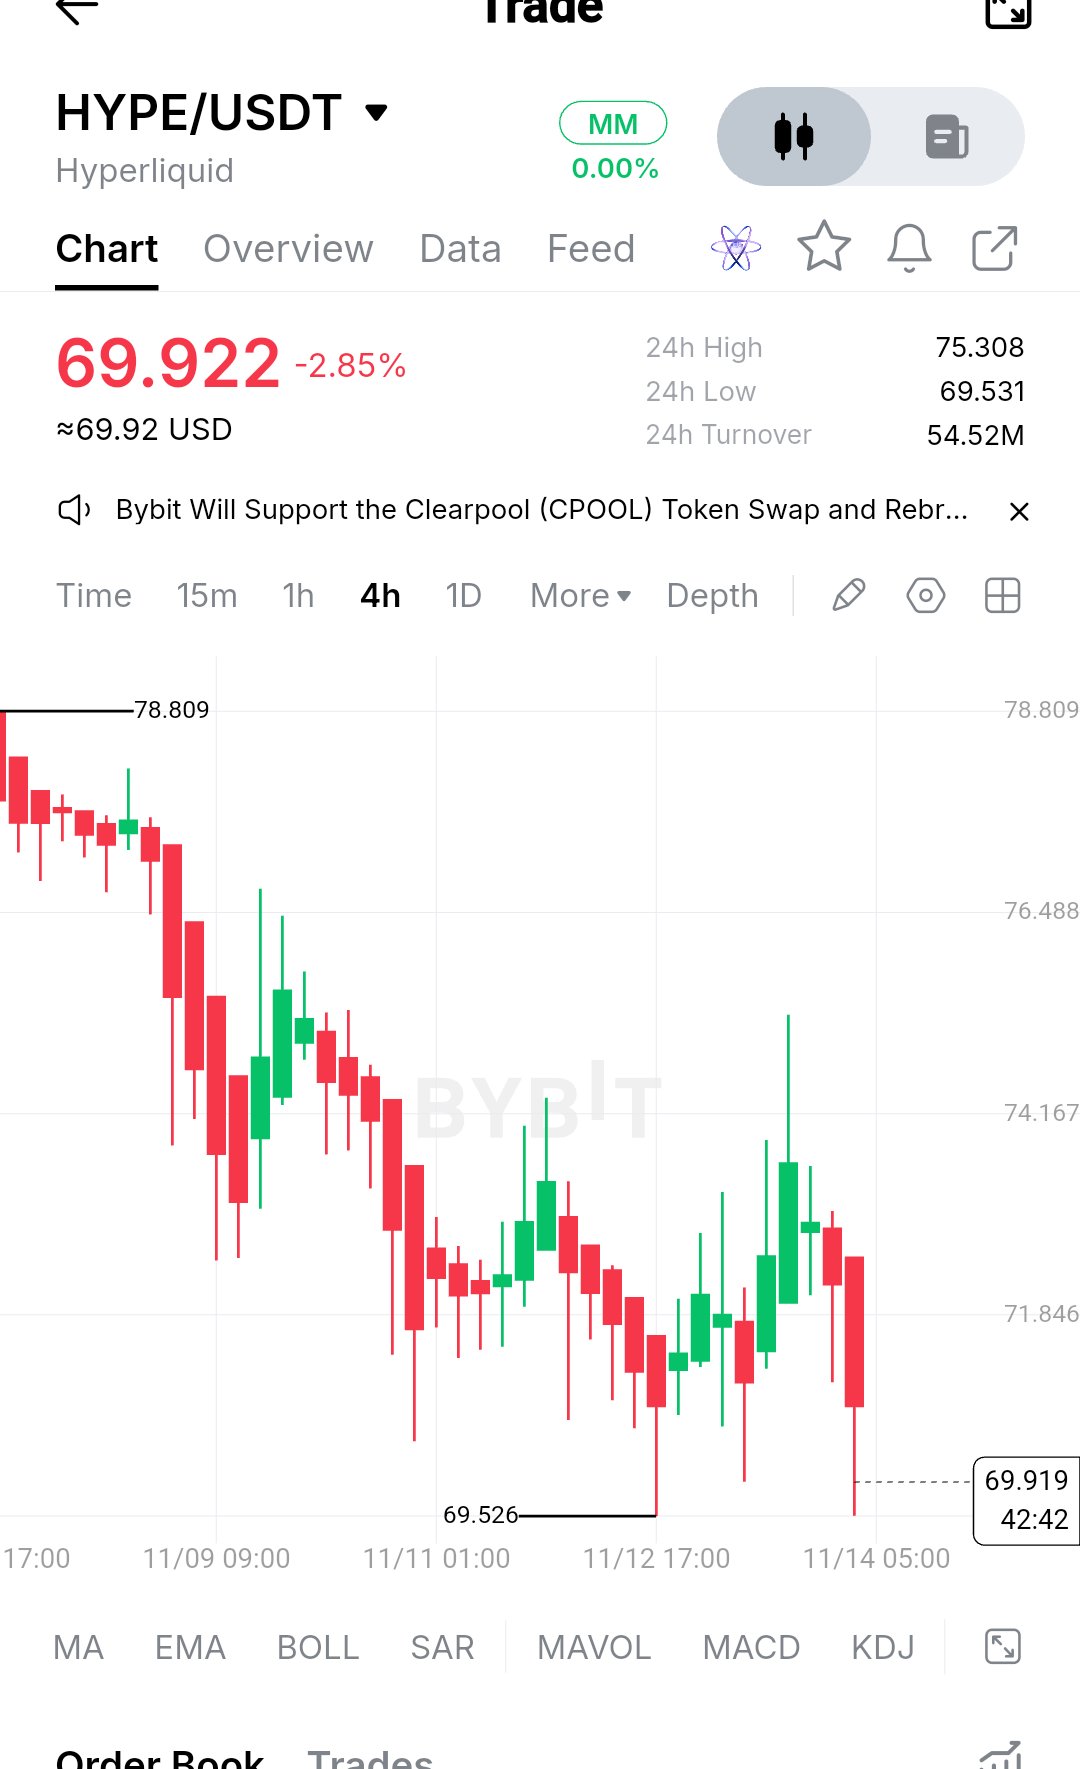
$HYPEUSDT moved through a busy period of on-chain trading, with Hyperliquid recording roughly $2.78M in fees over the last 24 hours and about $2.03M in protocol revenue. A reliable 24-hour transaction count and median transaction size in USD were not available in the published dashboard data. Validator rewards in HYPE also aren't reported on a directly comparable daily basis, so a fee-to-validator-revenue percentage would be misleading. So the network usage is real, and the fee generation is substantial. HYPE is secured through delegated proof-of-stake, with staking rewards coming from a future emissions reserve rather than being funded entirely by transaction fees. That is the point. HyperCore order execution also does not charge conventional gas per trade. Staking rewards depend on the amount of HYPE delegated across the network, while the current total-staked versus historical-peak comparison isn't available in a consistent live dataset. The date I keep circling is November 29, 2026. Tokenomics.com lists an estimated unlock of approximately 14.18M HYPE, around 1.4% of maximum supply. This is a scheduled vesting event, not a Bitcoin-style halving. Hyperliquid has a maximum supply of 1 billion HYPE, with staking emissions coming from its future emissions allocation. I don't think that's a design flaw. When someone quotes the transaction count, the number that pays for security is a different one. HYPEUSDT is down roughly 11.8% in a week and is trading inside a visible range: swing low near $69.526, high near $78.809. Underneath is Hyperliquid's growing derivatives business. Its Q3 report showed approximately $16.8B in open interest, while quarterly protocol revenue reached $190.9M. HIP-3 also generated $153.8B in equity-linked perpetual volume. These numbers explain the attention, not a dated price trigger. No directional call from the middle of a box after a move this size. Levels instead: Above $78.809: A daily close over it turns the old ceiling into a support test. Prior supply sits around $80–$82. Below $69.526: A daily close under it says the breakout is failing. Former support around $67–$68 is the next area. $69.526–$78.809: Chop, roughly 13.3% wide. Window: the next several daily closes. HYPE tends to amplify BTC, so a BTC range break can reset this read early. The breakout case is invalid on acceptance below $69.526. #ByXIMPACT
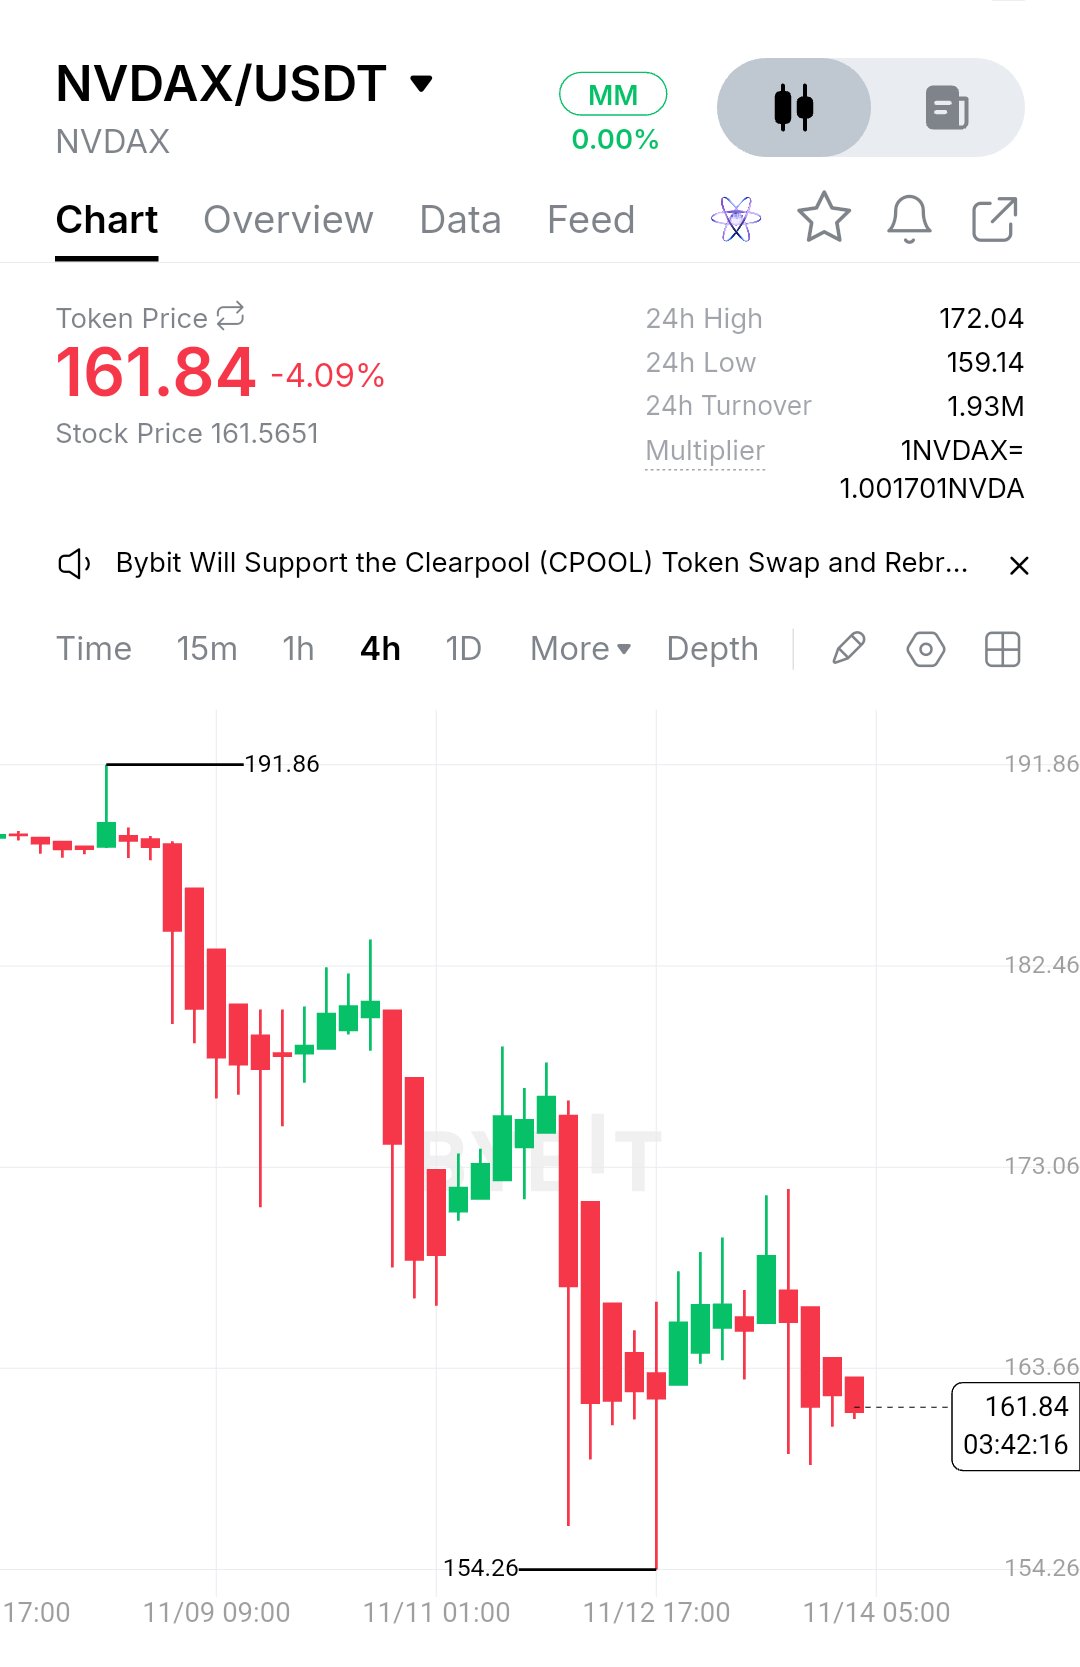
$NVDAXUSDT is not a conventional crypto network. It is a tokenized NVIDIA stock tracker, issued as Solana SPL and ERC-20 tokens, designed to follow NVIDIA's underlying share price. So the market activity is real, but transaction counts and token transfers are not the same as economic demand for the underlying company. NVDAX is currently trading around $161.84 in the supplied 4H chart, down roughly 4.09% on the day. The latest market snapshot puts its seven-day performance near -14.26%. There are no miners collecting block rewards or a native staking-security budget here. That is the point. Its valuation is primarily tied to NVIDIA shares, while its tokenized structure adds another layer of market and issuer risk. The date I keep circling is November 17. NVIDIA has a confirmed earnings report and earnings call scheduled for that day. Investors will be watching whether AI demand continues supporting the company's growth. There is no token halving or scheduled supply reduction for NVDAX, so the earnings event matters more than a crypto supply narrative. I don't think that's a design flaw. When someone quotes the transaction count, the number that matters for NVDAX is a different one: how NVIDIA performs and whether the token continues tracking its underlying stock. NVDAX is down roughly 14.26% in a week and has stalled inside a box: the visible swing low is near $154.26, with the upper boundary around $172.04. Underneath is NVIDIA's November 17 earnings report. It is a confirmed event, so it explains the attention, not the direction of the next move. No directional call from the middle of a box after a move this size. Levels instead: Above $172.04: a daily close over it turns the old ceiling into a support test. Prior supply sits around $182.46–$191.86. Below $154.26: a daily close under it says the recovery is failing. The next support area needs fresh price confirmation. $154.26–$172.04: chop, roughly 11.5% wide. Window: the next several daily closes. NVDAX tends to follow NVIDIA's underlying share price, so an earnings surprise or a sharp move in the underlying stock can reset this read early. The breakout case is invalid on acceptance below $154.26. #IMPACTbyTrade
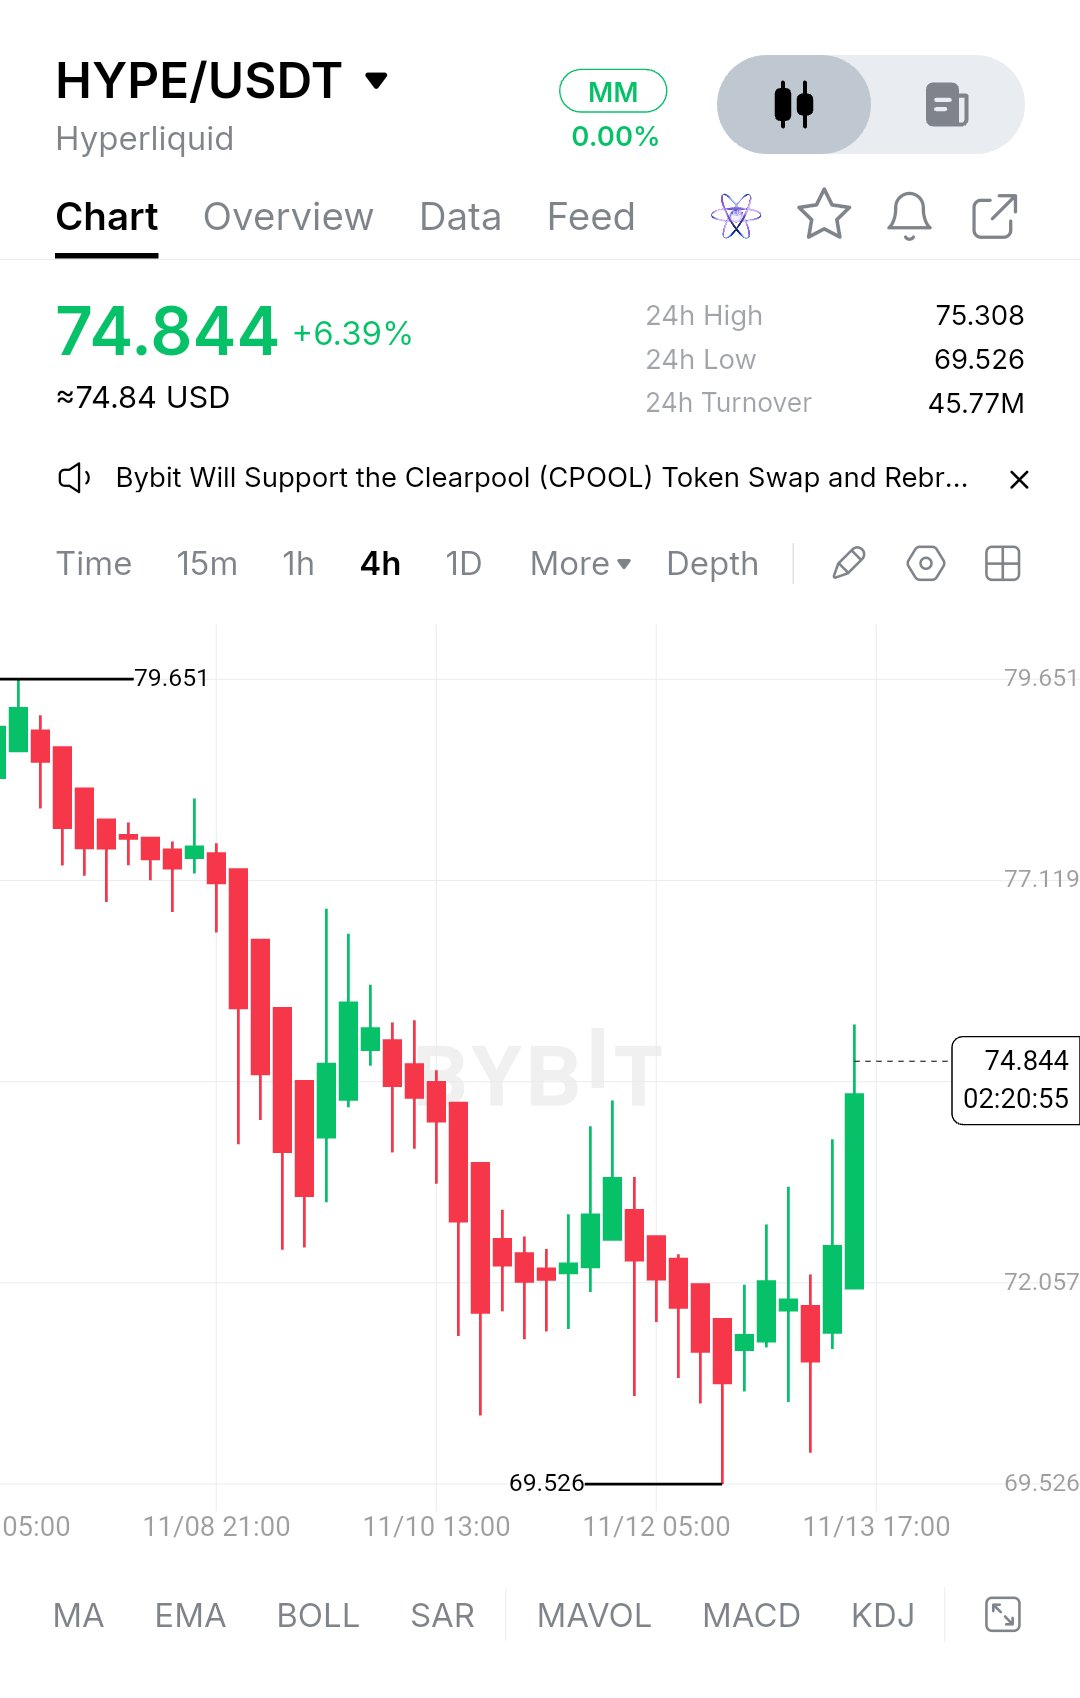
HYPE/USDT is trading around $74.84, up approximately 6.39% in 24 hours in your screenshot. The visible 4-hour chart shows a recovery from $69.526, with immediate resistance around $75.308 and an earlier swing high near $79.651. $HYPEUSDT L1 processed roughly 356,000 transactions in the last 24 hours. A reliable median transaction size in USD is not separately reported. Network fees were around $25,700, while Hyperliquid's broader protocol revenue reached approximately $2.19 million. Validator rewards are funded through token emissions, not trading fees. So the network usage is real, and it barely tells the whole story of the security budget. HYPE is a delegated Proof-of-Stake asset, with staking yields around 2.2–2.4% annually. At roughly 442 million HYPE staked, that implies close to 10 million HYPE in annual validator rewards. Trading fees follow a different route: 99% of eligible perpetual trading fees go to the Assistance Fund to purchase and burn HYPE. That is the point. Network security and token buybacks are two separate economic mechanisms. The date I keep circling is December 6, 2026. Current unlock calendars project around 9.92 million HYPE for core contributors, against a maximum supply of 1 billion. Actual distributions have historically been much smaller because the Foundation controls the release amounts. There is no fixed halving event. At current fee levels, buybacks can offset some supply pressure, but they cannot automatically replace staking emissions. Demand, burns or staking economics have to do the work. I don’t think that’s a design flaw. When someone quotes the transaction count, the number that pays for security is a different one. HYPEUSDT is down roughly 4.6% in a week and has stalled inside a box: swing low near $69.526, high near $79.651. Underneath is growing institutional access and regulatory interest. Hyperliquid Strategies has pursued a U.S. futures commission merchant registration, while integrations such as Bitso's access to Hyperliquid perpetual markets are expanding distribution. It still needs regulatory approval, so it explains the attention, not a dated trigger. No directional call from the middle of a box after a move this size. Levels instead: Above $79.651: a daily close over it turns the old ceiling into a support test. Prior supply sits around $80–$85. Below $69.526: a daily close under it says the breakout is failing. Former support around $67–$68 is the next area. $69.526–$79.651: chop, roughly 14.6% wide. Window: the next several daily closes. HYPE tends to amplify BTC, so a BTC range break can reset this read early. The breakout case is invalid on acceptance below $69.526. #ByXIMPACT
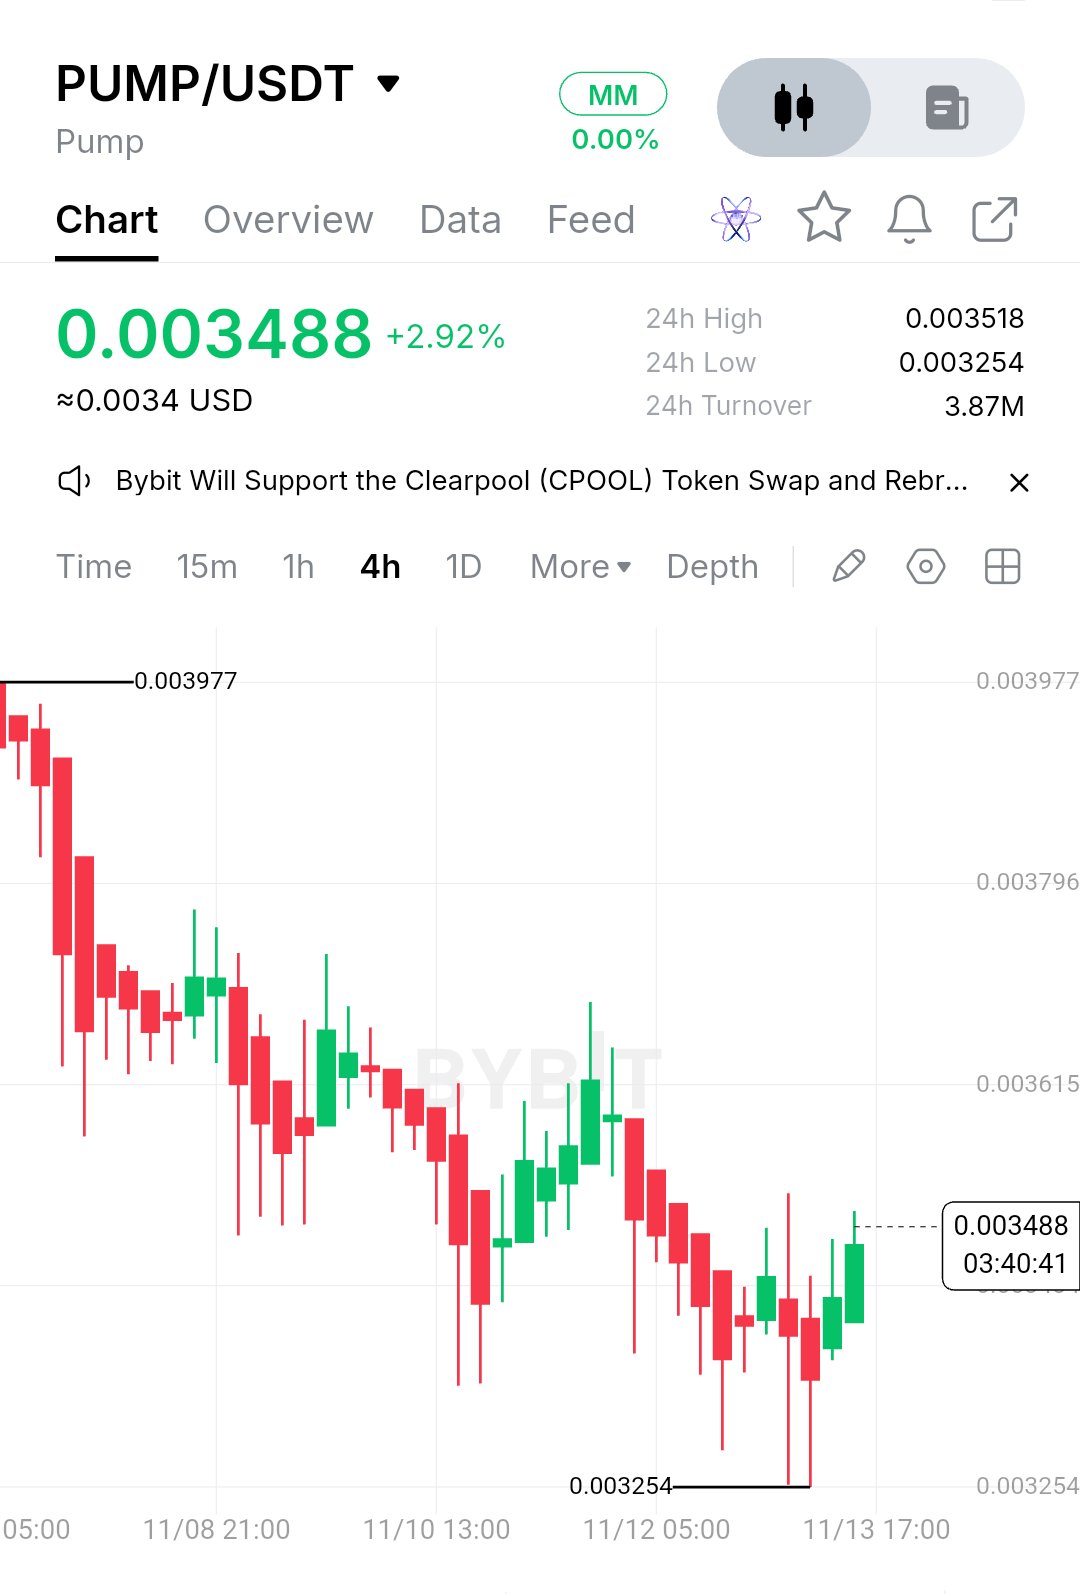
$PUMPUSDT .fun generated roughly $1.12M in protocol fees over the last 24 hours, with project revenue near $770K. The platform has real trading activity, but those fees are not automatically paid to PUMP holders. Pump.fun directs 50% of net revenue toward PUMP buybacks and burns. So the platform usage is real, and it creates a measurable value-return mechanism. But PUMP is an SPL token on Solana, not the network's native security asset. It has no miners, validator reward schedule or independent security budget. Solana validators are paid through SOL issuance and transaction-related rewards. PUMP is cheap to transfer, but that is not the point. The more important question is how much of the platform's revenue actually returns to the token. The 50% buyback allocation creates demand when revenue is strong, but it also means token support depends on continued platform activity. The date I keep circling is the next scheduled supply release. DeFiLlama's unlock tracker currently points to December 11, 2026, with approximately 6.875 billion PUMP unlocking for team members and existing investors. That's a vesting event, not a halving. There is no fixed block reward being cut in half. Buybacks have to compete with new supply entering circulation. I don't think that's a design flaw. When someone quotes Pump.fun's launch count or trading volume, the number that matters for PUMP is how much revenue translates into completed buybacks and burns. PUMPUSDT is down roughly 13% in seven days and has stalled inside a box: swing low near $0.003254, high near $0.003977. Underneath is Pump.fun's expansion beyond Solana. The platform recently added support for Optimism and Sei, allowing users to access more ecosystems without manually bridging assets. It explains the attention, not a guaranteed increase in PUMP demand. No directional call from the middle of a box after a move this size. Levels instead: Above $0.003977: a daily close over it turns the old ceiling into a support test. Prior supply needs to be watched around $0.00410–$0.00430. Below $0.003254: a daily close under it says the recovery is failing. Former support around $0.00310–$0.00320 is the next area. $0.003254–$0.003977: chop, roughly 22.2% wide. Window: the next several daily closes. PUMP tends to amplify Solana ecosystem sentiment, so a SOL range break can reset this read early. The breakout case is invalid on acceptance below $0.003254. #ByXIMPACT
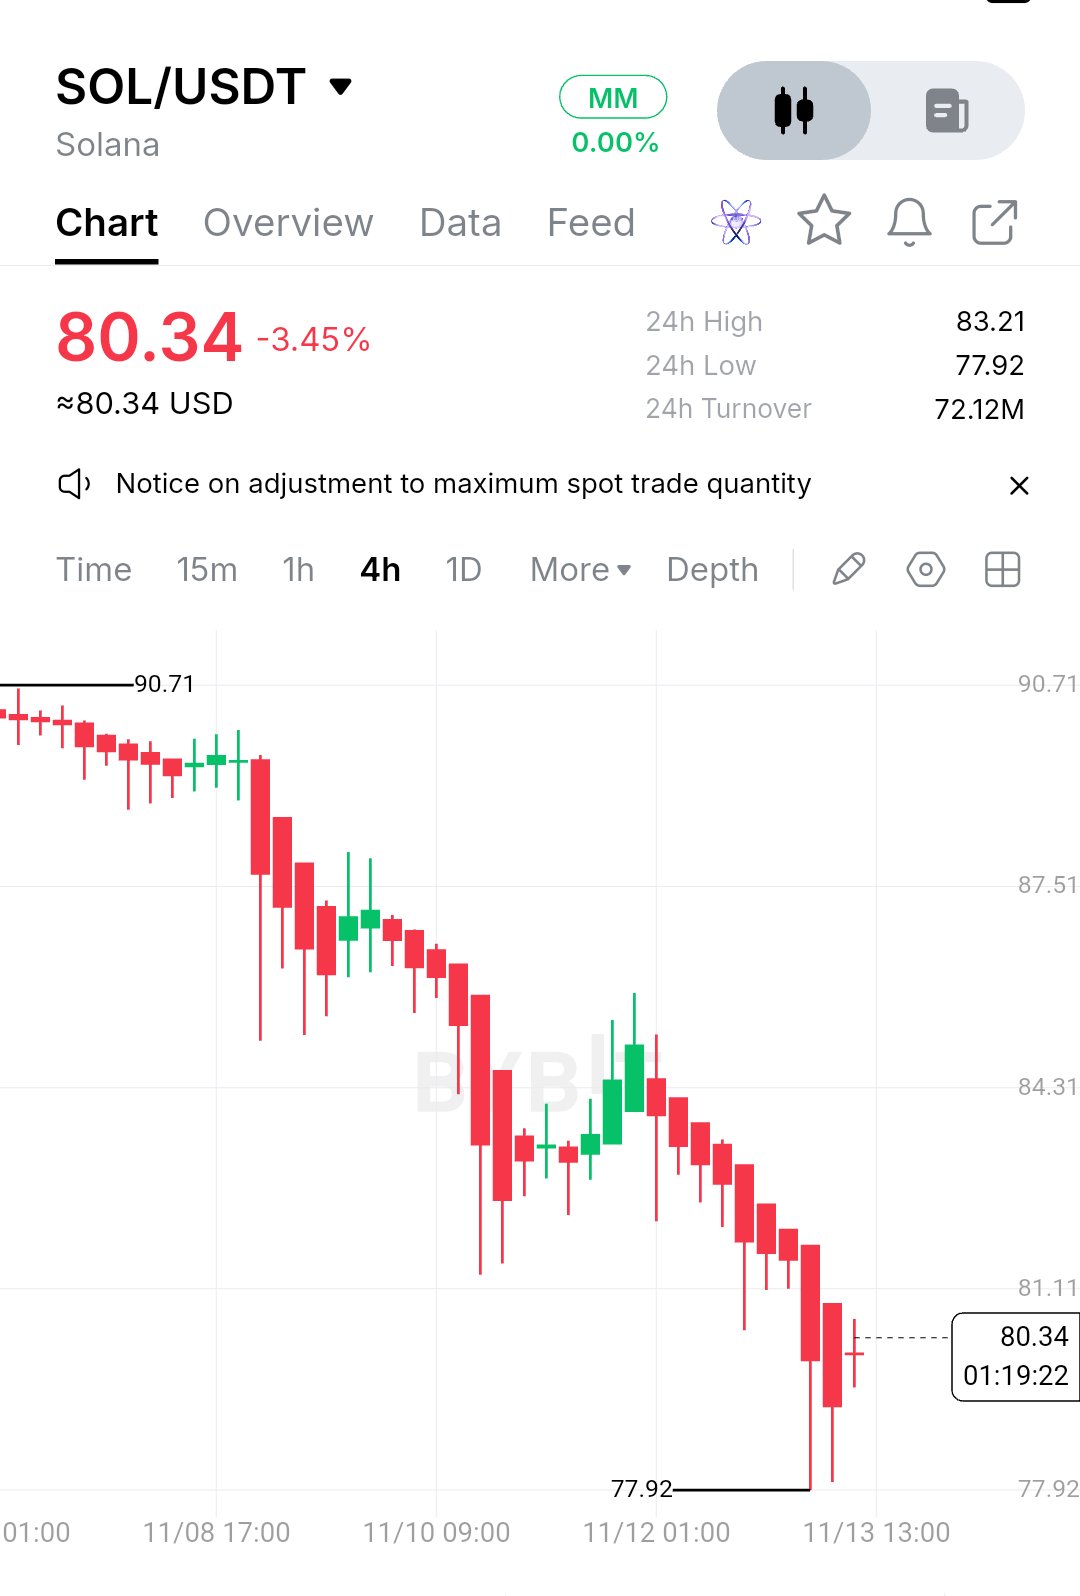
$SOLUSDT Solana generated roughly 4,653.868 SOL in network fees over the last 24 hours, alongside 665.201 SOL in Jito tips. The average non-vote transaction fee was around 0.000068634 SOL, or roughly $0.0055 at current prices. Validators and stakers receive compensation through fees, tips and newly issued SOL. The network's current fee structure shows that issuance still plays the bigger role in funding security. So the payments usage is real, and it barely covers the security budget. SOL is cheap to use, with an average user fee around $0.0055, and that is the point. But it also means the people securing the network still depend heavily on issuance. Solana's staking security currently has an inflation rate around 3.6%, with approximately 433 million SOL staked. The long-term inflation target is 1.5%. The date I keep circling is the next major change to that inflation schedule. The SGP-0002 governance decision accelerated annual disinflation from 15% to 30%, targeting the 1.5% terminal rate around H1 2029 instead of H1 2032. There is no Bitcoin-style halving or fixed reward cut here. At current fee levels, transaction revenue cannot replace the reduction in staking issuance. SOL price, fees or validator economics have to adjust. I don't think that's a design flaw. When someone quotes the transaction count, the number that pays for security is a different one. SOLUSDT is down roughly 10.8% in a week and has stalled inside a box: swing low near $77.92, high near $83.21. Underneath is a difficult combination of institutional outflows and weaker network economics. Solana recorded around $49.50M in five-session ETF outflows, while network TVL fell 17.69% over 30 days to $4.94B. The accelerated disinflation schedule also changes the longer-term staking economics. These factors explain the attention, not a single dated price trigger. No directional call from the middle of a box after a move this size. Levels instead: Above $83.21: a daily close over it turns the old ceiling into a support test. Prior supply sits around $84.31–$87.51. Below $77.92: a daily close under it says the recovery is failing. The next important test is whether buyers can reclaim the $77.92–$80.34 area. $77.92–$83.21: chop, roughly 6.8% wide. Window: the next several daily closes. SOL tends to amplify BTC, so a BTC range break can reset this read early. The breakout case is invalid on acceptance below $77.92. #IMPACTbyTrade
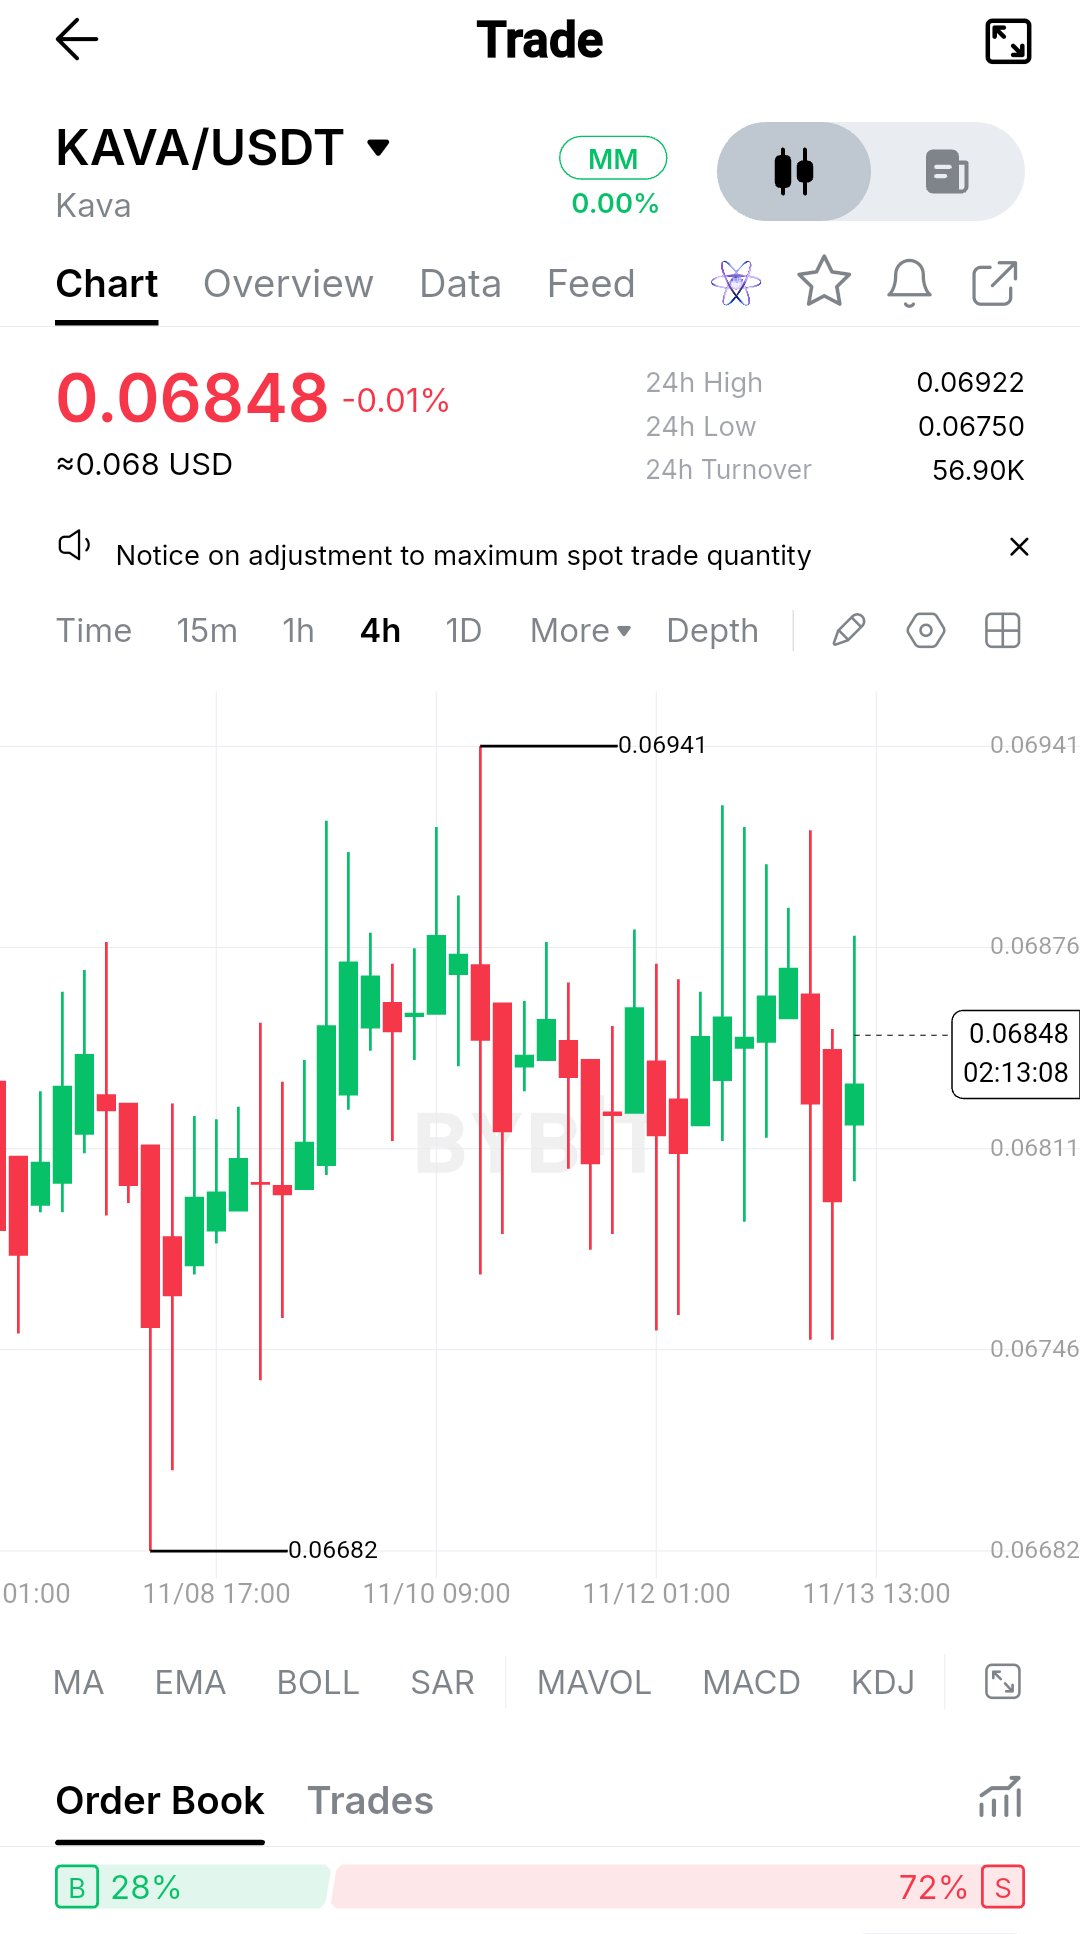
$KAVAUSDT is a Proof-of-Stake network, so transaction activity and validator economics matter more than raw mining numbers. Kava's official dashboard reports an average transaction fee near $0.0001, while its network statistics show roughly 120M KAVA staked across 100 active validators. A verified 24-hour transaction count, median transaction size and fee-versus-validator reward breakdown are not available in the published figures. So the payments usage is real, and it barely touches the security budget. KAVA is cheap to use, with an average fee around $0.0001, and that is the point. But it also means validators cannot rely on transaction fees alone. Kava moved to zero inflation on January 1, 2024, with staking rewards shifted away from newly minted tokens toward community-pool funding and network activity. Around 120M KAVA is currently reported as staked, against 100 active validators. The date I keep circling is actually the absence of another supply cut. Kava permanently moved to zero inflation, with its maximum supply fixed at approximately 1.08 billion KAVA. There is no scheduled halving, and no new KAVA can be minted under the current model. At current fee levels, transaction activity still has to support the economics of the network. I don’t think that’s a design flaw. When someone quotes the transaction count, the number that pays for security is a different one. KAVAUSDT is up roughly 0.16% in a week and remains inside a box: swing low near $0.06682, high near $0.06941. Underneath is Kava's 2026 roadmap, focused on expanding native USDT liquidity, tokenized real-world assets and decentralized AI infrastructure. Its Q4 plans include distribution through partner wallets, fiat onramps and additional dApps. It still needs actual integrations and adoption, so it explains the attention, not a dated trigger. No directional call from the middle of a box after a move this size. Levels instead: Above $0.06941: a daily close over it turns the old ceiling into a support test. The next area to watch is around $0.0710–$0.0730. Below $0.06682: a daily close under it says the breakout is failing. Former support around $0.0650–$0.0660 is the next area. $0.06682–$0.06941: chop, roughly 3.9% wide. Window: the next several daily closes. KAVA tends to amplify BTC, so a BTC range break can reset this read early. The breakout case is invalid on acceptance below $0.06682. $BTCUSDT #IMPACTbyTrade