CryptoCobain
8718Like0Shares334Fans466Follow
Squre Lover LFG
Squre Lover LFG
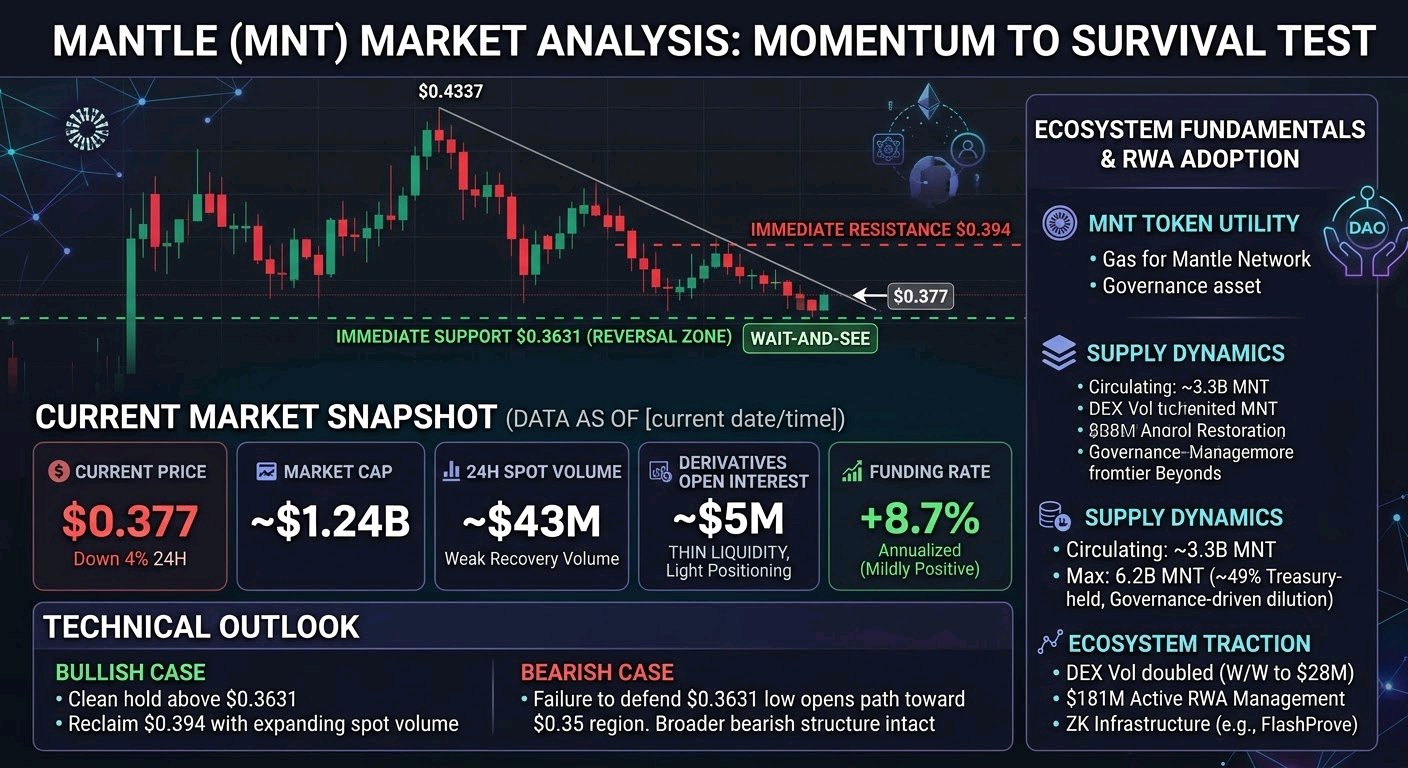
Mantle’s sharp rejection from the $0.43 region has shifted the narrative from momentum to survival, with price now testing a demand zone that previously sparked reversals. The current setup is less about chasing upside and more about watching whether this support holds under thinning liquidity. MNT is trading near $0.377, down roughly 4% in 24 hours, with the intraday range compressed between a low of $0.3631 and a high near $0.394. The past week has been decisively bearish, with the chart showing a staircase of lower highs since the $0.4337 peak. Immediate support sits at the recent swing low of $0.3631, while resistance is now reinforced at $0.394. Momentum remains weak, and the recovery candle from the low lacks volume confirmation. Mantle’s fundamental thesis extends beyond price action. The ecosystem is positioning itself as a DAO-led Web3 hub, with ZK infrastructure gaining recognition from Anthropic’s FlashProve research and real-world asset adoption climbing, including $181M in active RWA management and tokenized equities trading via Fluxion. DEX volume nearly doubled week-over-week to $28M, though daily averages remain modest at roughly $3M. MNT functions as the gas token for Mantle Network and the governance asset for treasury decisions. Circulating supply is approximately 3.3B, with a maximum of 6.2B and roughly 49% still held by the treasury. No scheduled cliff unlocks are pending, meaning dilution risk is governance-driven rather than calendar-based. Derivatives positioning is notably light. Open interest sits near $5M across venues, with funding at +8.7% annualized—a mildly positive but not overheated signal. The low OI suggests traders are not aggressively leaning short into support, but it also means any spot-led bounce could accelerate quickly due to thin order books. Key figures: Current Price $0.377; Immediate Support $0.3631; Immediate Resistance $0.394; Market Cap ~$1.24B; 24H Spot Volume ~$43M; Open Interest ~$5M; Funding +8.7% annualized; Circulating Supply 3.3B. For bulls to regain control, MNT needs a clean hold above $0.3631 and a reclaim of $0.394 with expanding spot volume. A failure to defend the recent low would open the door toward the $0.35 region, with the broader bearish structure remaining intact until a higher low forms. This is a wait-and-see zone, not a conviction entry. $MNTUSDT #ByXIMPACT
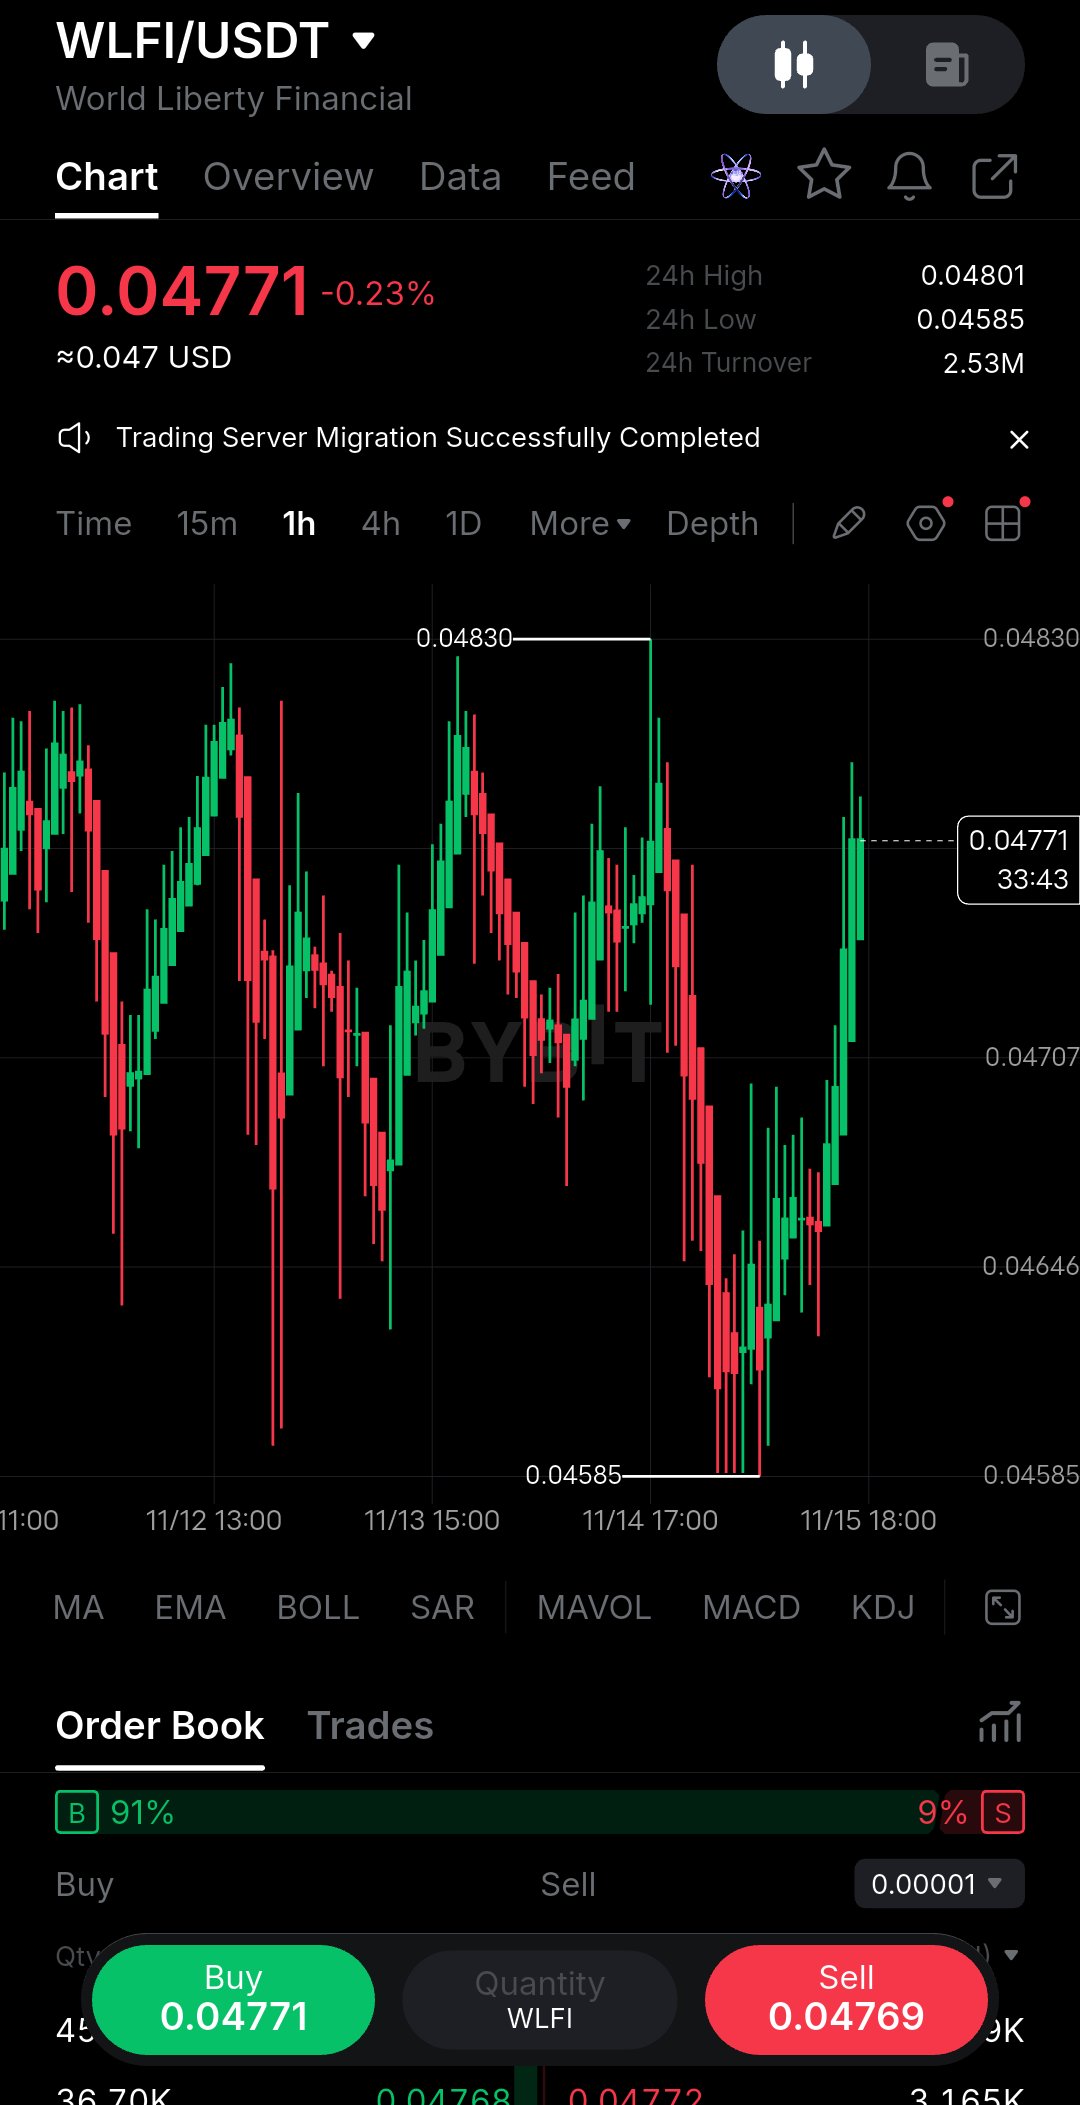
The most consequential number for WLFI holders is not the price. It is 46.1 billion. That single address controls 47.66% of the total supply, according to Etherscan holder data . The next four wallets combined hold another 29.4%. This is not distribution. It is a supply map that should force a re-read of every governance headline. The mechanism is the Lockbox: tokens sit in escrow, releasing on schedules set by a proposal that passed with 99.9% approval . Early supporters accepted a two-year cliff and two-year linear vest. Founders and partners agreed to burn roughly 4.5 billion tokens and vest the rest over five years . On paper, this is disciplined. But the float tells a different story. Roughly 32 billion WLFI circulate against a 100 billion total supply . The top five wallets alone hold more than the entire circulating float. When unlocks begin in earnest, the marginal seller is not a dispersed retail base. It is a handful of entities whose cost basis is unknown and whose governance influence is absolute. The recent $1 million buyback, executed in under 72 hours, is a signal . But $1 million against a market cap above $1.5 billion is a rounding error. It does not absorb the structural overhang. It buys time. The thesis breaks only if those concentrated wallets are contractually restricted from selling beyond the published vesting schedule. No such restriction is verifiable on-chain. Until then, the float is a promise, not a fact. $WLFIUSDT $BTCUSDT #ByXIMPACT
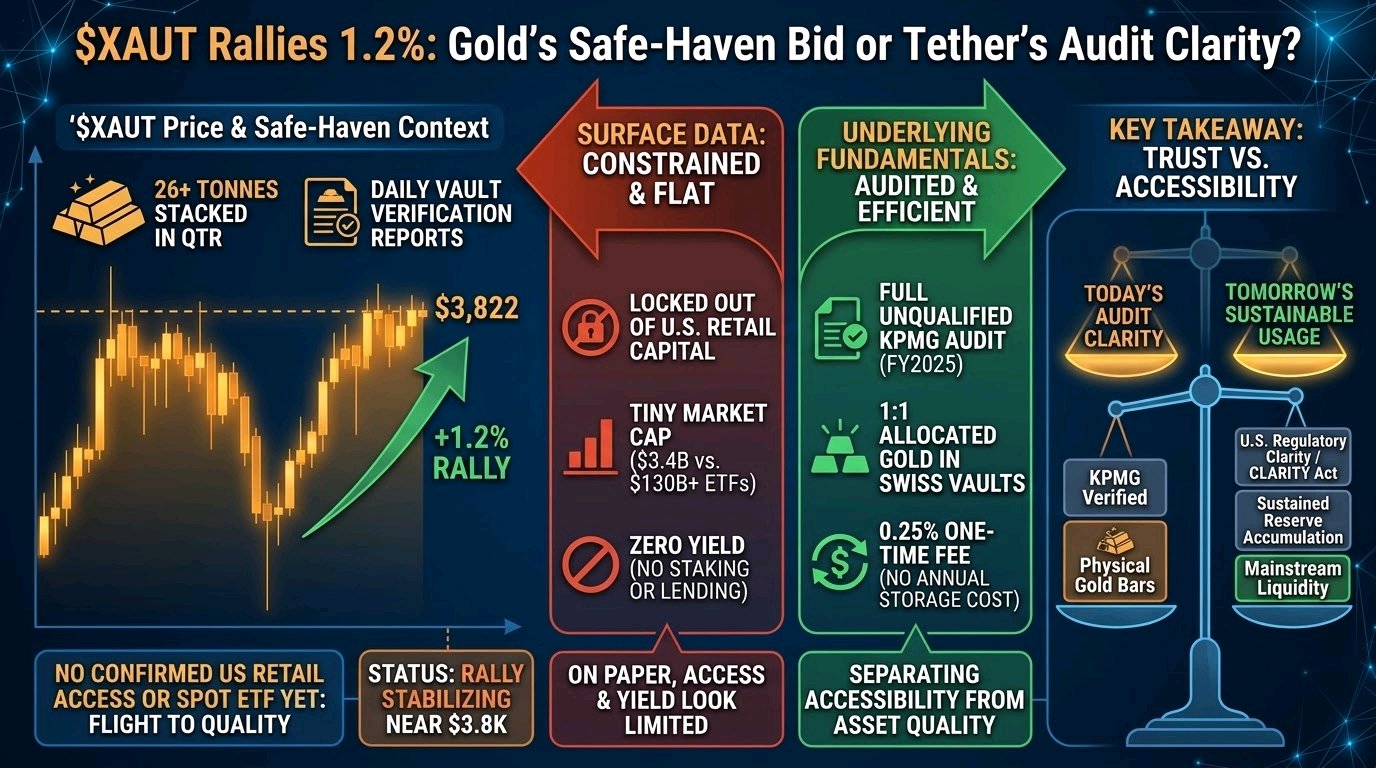
$XAUT Rallies 1.2%: Gold’s Safe-Haven Bid or Tether’s Audit Clarity? Let’s talk about something traders often overlook: a coin can rally even when its recent fundamental metrics look weak or flat. The real driver is what investors expect in the future, not just what the project delivered last month. Event Context Tether Gold is sitting near $3,822 right now, holding up reasonably well while the broader crypto market chops around. The immediate catalyst seems to be a flight to quality. Tether has been aggressively stacking physical gold—over 26 tonnes in a single quarter—making it one of the largest non-sovereign holders of the metal. That kind of buying gets attention. But to be clear, any chatter about a spot ETF approval or broader U.S. retail access is still speculation, not confirmed reality. Surface-Level Negative / Flat Data On paper, the case for $XAUT looks a bit constrained. First, the token remains largely inaccessible to the biggest capital pool on earth—U.S. retail investors are generally locked out, with access limited to institutions and high-net-worth folks. Second, the total supply of tokenized gold, while growing, is still tiny compared to traditional gold ETFs. $XAUT’s market cap sits around $3.4 billion, while something like SPDR Gold Shares holds north of $130 billion. And finally, from a pure yield perspective, $XAUT pays you nothing. No staking rewards, no lending yield—you’re forfeiting the risk-free rate entirely. The Other Side (Positive Counter Data) But look a little deeper and the structural picture improves. The most important signal is the recent completion of a full, unqualified audit by KPMG for fiscal year 2025. They physically verified that every single token in circulation is backed 1:1 by allocated gold bars sitting in Swiss vaults. That moves $XAUT from an "attestation-based" trust model to an "audited" standard—a meaningful upgrade. And the economics are actually favorable for long-term holders. Traditional ETFs charge annual management fees, often around 0.40%. $XAUT charges a one-time 0.25% fee on purchase or redemption with no ongoing storage costs eating into your position. Mechanism Explanation Here’s the teaching moment. You have to separate operational accessibility from asset quality. Traditional gold ETFs measure success by daily inflows and management fees. $XAUT measures success by the integrity of its backing and the utility of the token itself. Yes, the ETF is easier to buy. But it represents a claim on a trust that charges you every single year. $XAUT is harder to access for U.S. retail, but it represents direct, audited ownership of a specific serial-numbered gold bar that you can theoretically redeem. When macro uncertainty rises, institutional and non-U.S. investors are willing to overlook the friction of buying $XAUT in exchange for the assurance that their gold is physically verified and sitting in a vault—not just a line item on a balance sheet. Soft Caution One strong audit doesn’t guarantee permanent liquidity or price appreciation. Gold itself is subject to central bank policy and geopolitical tensions. And $XAUT will always trade at a slight premium or discount to spot gold depending on market depth. Don’t assume a clean audit means smooth sailing forever. What Matters Next So what matters next? 1. Regulatory Clarity in the U.S.: Watch for any shifts in legislation—like the CLARITY Act—that could eventually allow U.S. retail investors to easily purchase $XAUT. That would open a massive new demand funnel. 2. Sustained Reserve Accumulation: Keep an eye on Tether’s quarterly attestations. If they keep converting USDT profits into physical gold and expanding the $XAUT supply, it signals long-term confidence in the tokenized gold thesis. Final Takeaway My takeaway: don’t confuse a promising future with proven financial performance. The real test is whether $XAUT can convert today’s audit-backed trust into tomorrow’s sustainable liquidity, mainstream accessibility, and genuine usage beyond just a hedge against crypto volatility. $XAUTUSDT $BTCUSDT #ByXIMPACT
SUI Down 6.69%: Temporary Market Pressure or a Bigger Shift in Investor Expectations? Let’s discuss something traders often miss: a coin can recover even when its recent fundamental metrics are weak. The key is understanding what investors expect in the future, not just what the project delivered last month. SUI is trading around $0.7244, down 6.69% over 24 hours, according to the chart. Price has dropped from approximately $0.8541 to a recent low of $0.6754, followed by a modest recovery. This creates an important question: are investors simply reacting to current market pressure, or are they reassessing SUI's longer-term growth potential? The fundamental picture is mixed. On the weaker side, Sui's DeFi TVL was approximately $362.61 million, while daily chain fees stood near $4,511. These figures suggest that capital and direct network monetization remain areas worth monitoring. DefiLlama +1 However, there are some encouraging signals beneath the surface. Sui's stablecoin market capitalization was approximately $548 million, up around 2.51% over seven days in one reported snapshot. Its decentralized exchange volume also reached approximately $33.42 million in 24 hours. This suggests that ecosystem activity has not disappeared despite the pressure on price. DefiLlama This is where investors need to understand an important distinction. TVL measures how much capital is deposited in DeFi protocols, while DEX volume measures how much trading activity passes through those markets. A decline in locked capital does not automatically mean that users have stopped interacting with the network. Likewise, token price reflects market expectations, while network fees provide a more direct indication of monetized activity. The difference matters because investors may price in future adoption before that growth becomes visible in current financial metrics. Still, one encouraging metric does not prove that a lasting recovery is underway. SUI needs sustained capital inflows, stronger ecosystem monetization, and consistent user activity to support a healthier long-term picture. So what matters next? * Whether SUI can reclaim important price levels after its decline and establish a more stable market structure. * Whether stablecoin growth, DEX activity, and network fees translate into sustained ecosystem expansion. My takeaway: don't confuse a promising future with proven financial performance. SUI may have room to recover as investor expectations improve, but the real test is whether it can convert those expectations into sustainable revenue, real usage, and stronger network economics. $SUIUSDT $BTCUSDT #ByXIMPACT
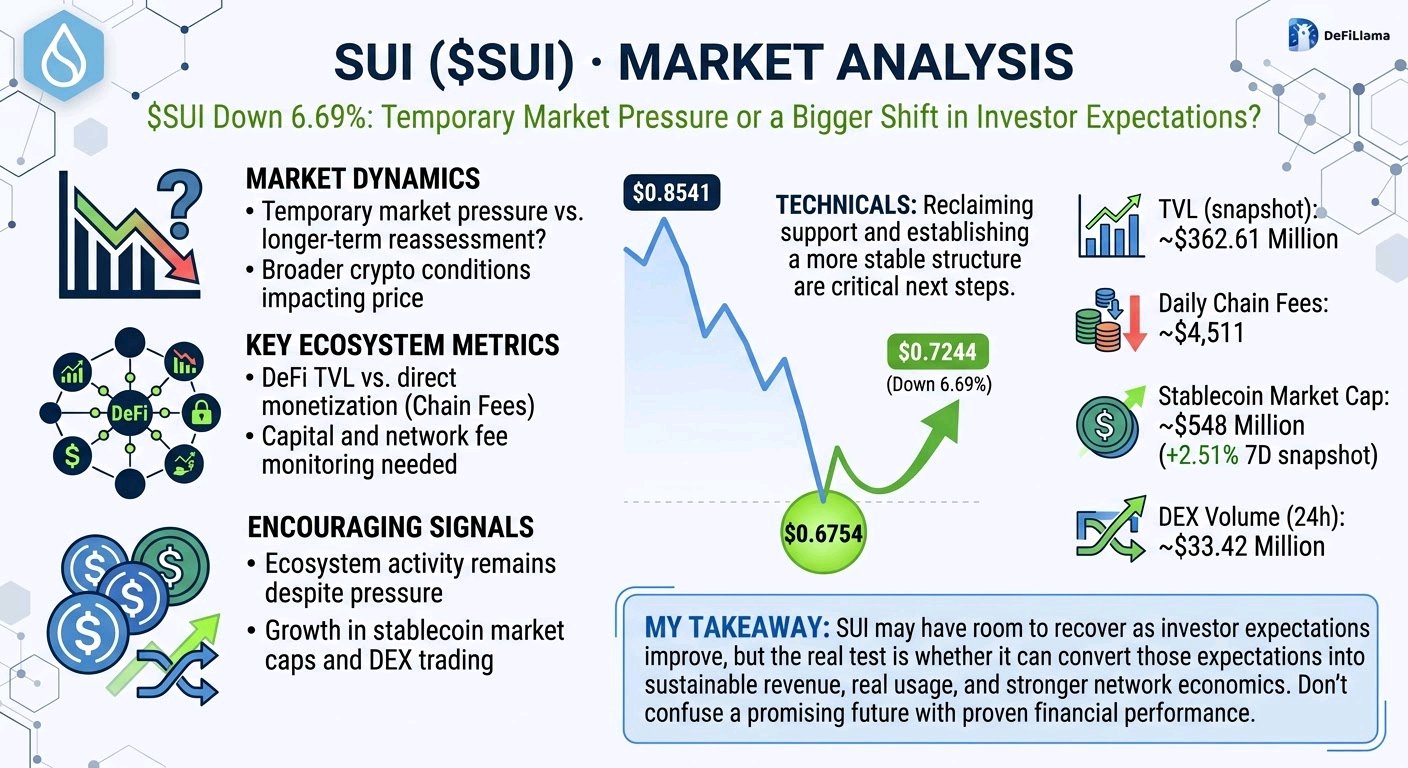
HYPERLIQUID ($HYPE) · MARKET ANALYSIS
HYPE Rebounds From $60: Recovery or Expectations of Future Growth? HYPE is showing an interesting market structure. The price has recovered from its sharp decline toward $60.06, but the broader chart still reflects significant selling pressure. Let’s discuss something traders often miss: a token can recover even when its recent fundamental metrics are weak or flat. The key is understanding what investors expect in the future, not just what the project delivered last month or quarter. The immediate catalyst is the market's continued interest in Hyperliquid's expansion beyond traditional crypto perpetual trading. Its HIP-3 ecosystem is particularly important because it allows permissionless markets for assets beyond the usual crypto pairs. However, expectations of further adoption should not be treated as confirmed future demand. The surface-level numbers still deserve attention. According to DeFiLlama, Hyperliquid's TVL declined approximately 13% over the past 30 days, while HYPE remained around 16.8% lower over seven days and 21.7% lower over 30 days. These figures suggest that capital conditions and token performance have weakened. DefiLlama But there is another side to the story. Hyperliquid generated approximately $86.06 million in fees and $65.86 million in protocol revenue over 30 days. More importantly, Bitwise's Q3 2026 research reported that protocol revenue increased 24.8% quarter-over-quarter to $228.1 million, while average open interest climbed 46.4% to $12.7 billion. DefiLlama +1 Why does this difference matter? TVL measures the capital deposited into a protocol, while fees and revenue measure the economic activity generated by its users. A decline in TVL does not automatically mean that a trading platform is losing its ability to generate revenue. Hyperliquid can maintain substantial trading activity even while deposited capital declines. Its HIP-3 expansion adds another potential growth driver. In Q3, these markets accounted for $261.5 billion in trading volume, representing 36.5% of total perpetuals volume. This suggests that Hyperliquid's opportunity may extend beyond its original crypto-trading market. Amazon Web Services, Inc. However, one strong quarter does not guarantee lasting improvement. Trading activity can fluctuate, revenue can contract, and expectations can already be reflected in a token's valuation. On the technical side, the supplied chart shows HYPE falling from approximately $75.30 to $60.06 before recovering toward $65.26. The recovery is worth watching, but the broader downward structure has not yet been convincingly reversed. So what matters next? 1\. Sustainable protocol activity: Watch whether fees, revenue and open interest remain strong as market conditions change. 2\. Expansion beyond crypto: Monitor HIP-3 adoption and whether new markets generate consistent trading volume rather than temporary speculative activity. My takeaway: HYPE's long-term opportunity may be larger than its recent price performance suggests. But don't confuse a promising future with proven performance. The real test is whether Hyperliquid can convert today's expectations into tomorrow's sustainable revenue, usage and cash flow. $HYPEUSDT $BTCUSDT #ByXIMPACT
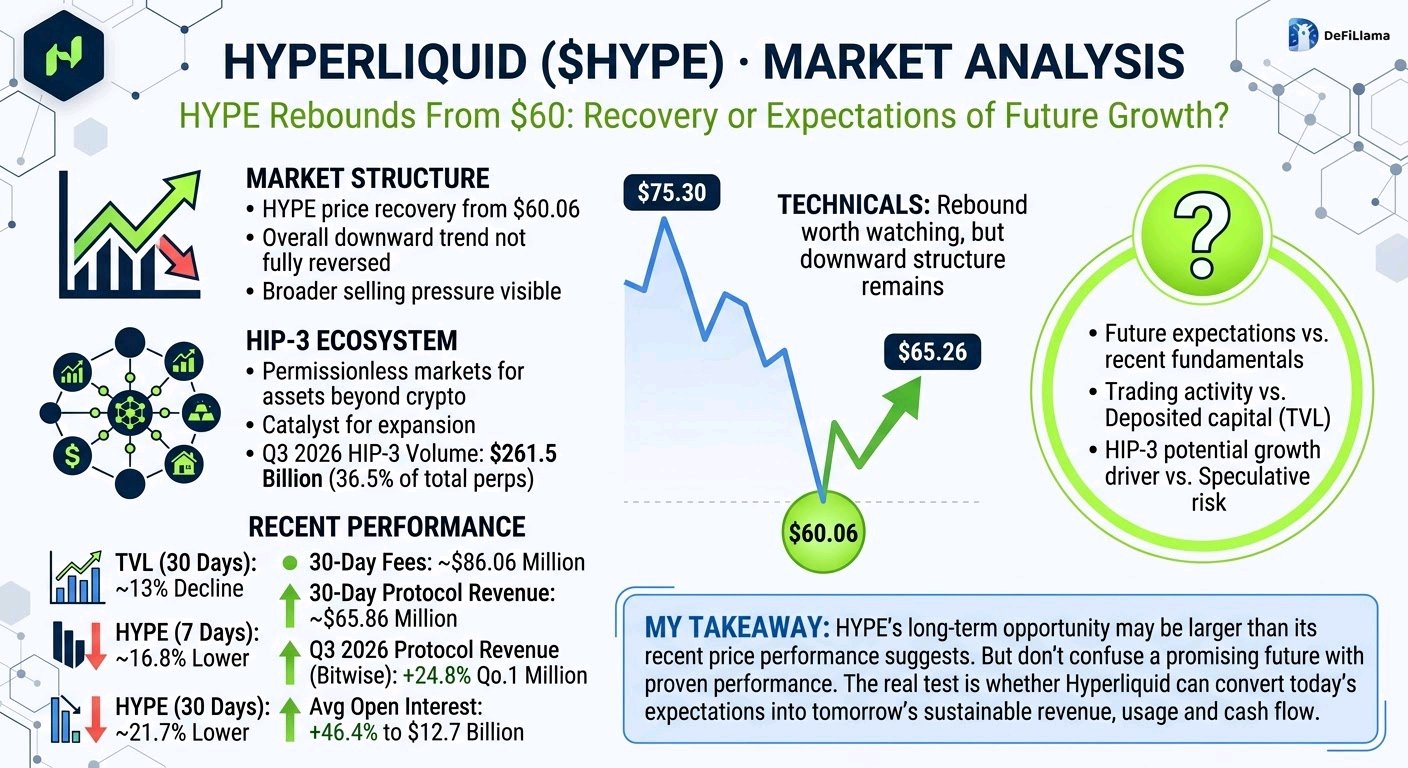
The most important risk in RESOLV is not visible in its token contract. It sits in the infrastructure that authorizes the protocol to create assets. On March 22, 2026, Resolv suffered an exploit involving compromised AWS Key Management Service (KMS) infrastructure. The attacker gained access to a privileged SERVICE_ROLE and minted approximately 80 million unbacked USR against only $100,000–$200,000 in USDC deposits. CertiK +1 The mechanism matters more than the headline loss. Resolv uses an off-chain verification layer to authorize on-chain minting. A compromised signing environment could therefore authorize transactions that the smart contracts themselves accepted as legitimate. This exposes a structural distinction: smart contract security and issuance infrastructure security are not the same thing. Resolv had undergone multiple security reviews, including seven reports by Pashov Audit Group, with the latest dated July 27, 2025. Yet those audit records do not establish that the cloud infrastructure and signing permissions were covered. Trustblock +1 For RESOLV holders, the implication is indirect but important. Governance and ecosystem participation depend on confidence in the underlying protocol, not simply the token's supply mechanics. The real test is whether Resolv can demonstrate that its operational controls have changed, not merely that its contracts have been reviewed again. A protocol can decentralize its assets while retaining concentrated authority over the infrastructure that creates them. That distinction deserves more attention than its market capitalization. $RESOLVUSDT $BTCUSDT #ByXIMPACT
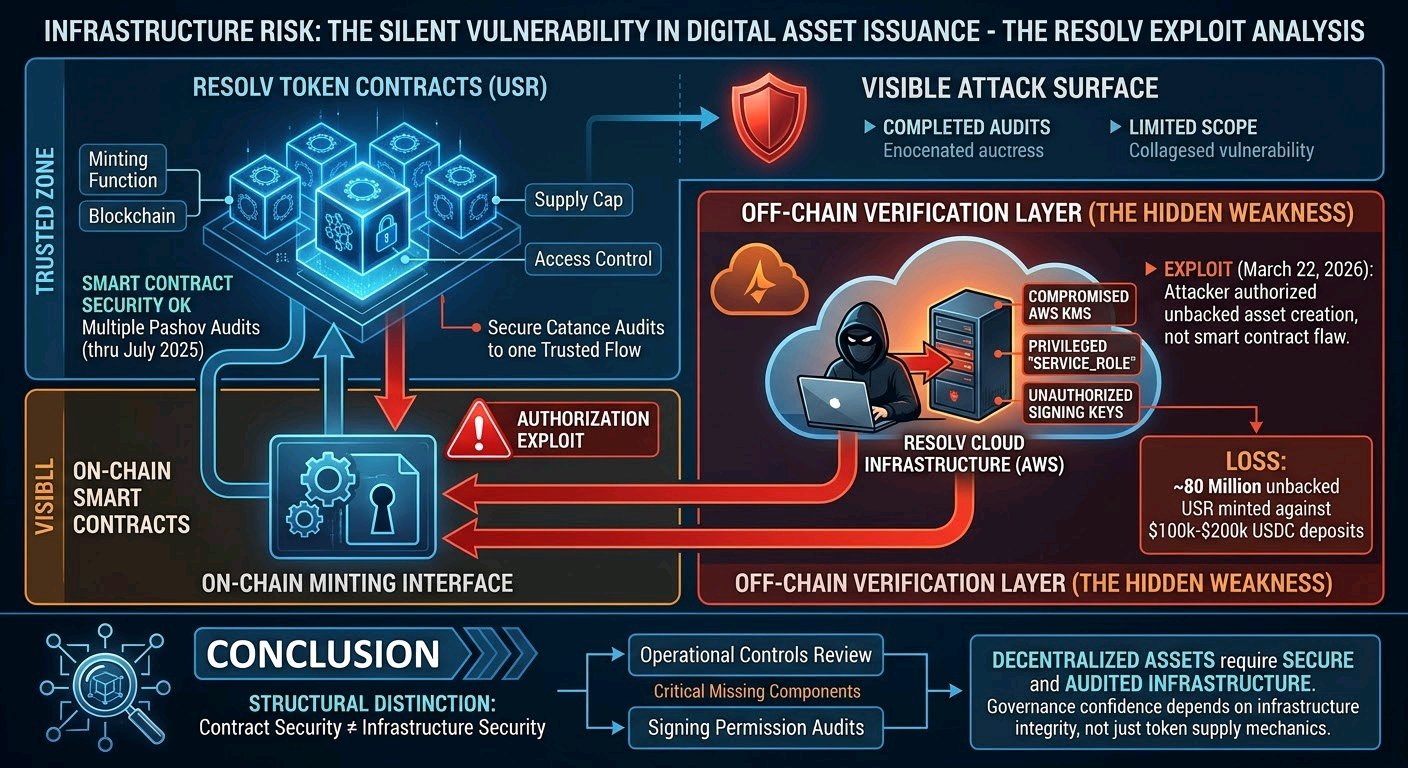
$SOL Drops 6.54%: Weak Network Activity or Future Expectations? Solana is facing significant selling pressure, but the bigger question is whether the market is pricing in weaker fundamentals or simply adjusting expectations for the future. Let’s discuss something traders often miss: a coin's price can move independently of its recent network revenue and activity. The key is understanding what investors expect in the future, not just what the project delivered last quarter. The 1-hour chart shows SOL trading around $71.17, down 6.54%, after falling from the $85.82 area. Price also tested a recent low near $67.41, making that level important for the next market reaction. The decline comes despite several important developments across the Solana ecosystem. In October, the network activated the Alpenglow upgrade, targeting approximately 150-millisecond transaction finality. Institutional developments also continued, including J.P. Morgan Asset Management bringing tokenized money market funds to Solana and Samsung announcing USDC transfers through Samsung Wallet. Solana Media But the short-term numbers are not particularly encouraging. According to DeFiLlama's November 14 data: * Solana DeFi TVL stood near $4.75 billion, down approximately 4.95% over 24 hours. * DEX trading volume was around $1.39 billion, with weekly volume down 19.11%. * Perpetuals trading volume showed even more weakness, falling approximately 48.36% over seven days. DefiLlama At first glance, these figures suggest cooling market activity. However, there is another side to the story. Solana's real-world asset ecosystem reached a record $5 billion in value. Its October ecosystem report also highlighted 14 million stablecoin-holding addresses, alongside expanding institutional payment and tokenization infrastructure. Solana Media The network has also made meaningful technical progress. Alpenglow targets approximately 150-millisecond finality, while reduced slot times target 200 milliseconds. These improvements could make Solana more attractive for applications requiring faster settlement. Solana Media This is where the distinction matters. Trading volume measures current market activity, while real-world asset adoption reflects the potential development of longer-term financial infrastructure. A temporary decline in trading activity does not automatically mean the ecosystem is losing its long-term potential. Equally, growing tokenized asset value does not automatically translate into higher SOL token revenue or sustainable demand. Both sides need to be evaluated independently. Still, one strong development cycle does not prove lasting improvement. Institutional announcements must eventually translate into consistent usage, meaningful economic activity, and measurable value for the network. So what matters next? 1\. Network activity: Watch whether DEX volume, DeFi TVL, and application revenue recover after the recent slowdown. 2\. Institutional adoption: Monitor whether the new payment integrations, tokenized funds, and Alpenglow upgrade generate sustained usage rather than just positive headlines. From a price perspective, $67.41 is the immediate chart support visible in the screenshot, while $76.33 is the displayed 24-hour high. The market's reaction around these levels will help reveal whether selling pressure is stabilizing. My takeaway: Don't confuse a promising future with proven financial performance. Solana has meaningful developments ahead, but the real test is whether it can convert today's expectations into tomorrow's sustainable revenue, usage, and economic value. $SOLUSDT $BTCUSDT #ByXIMPACT
🚀 AI IS CHANGING THE WAY I APPROACH CRYPTO TRADING! Trading is not just about predicting whether price goes up or down. It's about understanding market conditions, identifying opportunities, and managing risk before making a move. Here's how I approach trading with Bybit AI: 🔍 Market Analysis: I use AI to help evaluate market trends, price action, momentum, and potential trading opportunities. 📊 Strategy Development: Instead of blindly following signals, I focus on key support and resistance levels, confirmation, and market structure. 🎯 Entry Planning: I look for a clear setup before considering an entry rather than chasing sudden price movements. 🛡️ Risk Management: Every trade needs a defined invalidation level, controlled exposure, and a disciplined approach. 💡 My Biggest Takeaway: AI can make market research more efficient, but successful trading still requires independent judgment, patience, and proper risk management. The real edge isn't blindly trusting AI. It's learning how to use it as a tool to make more informed decisions. Let's explore the future of AI-powered trading together! 🚀 $BTCUSDT $XRPUSDT #WSOTShowYourAITradeToEarn10USDT

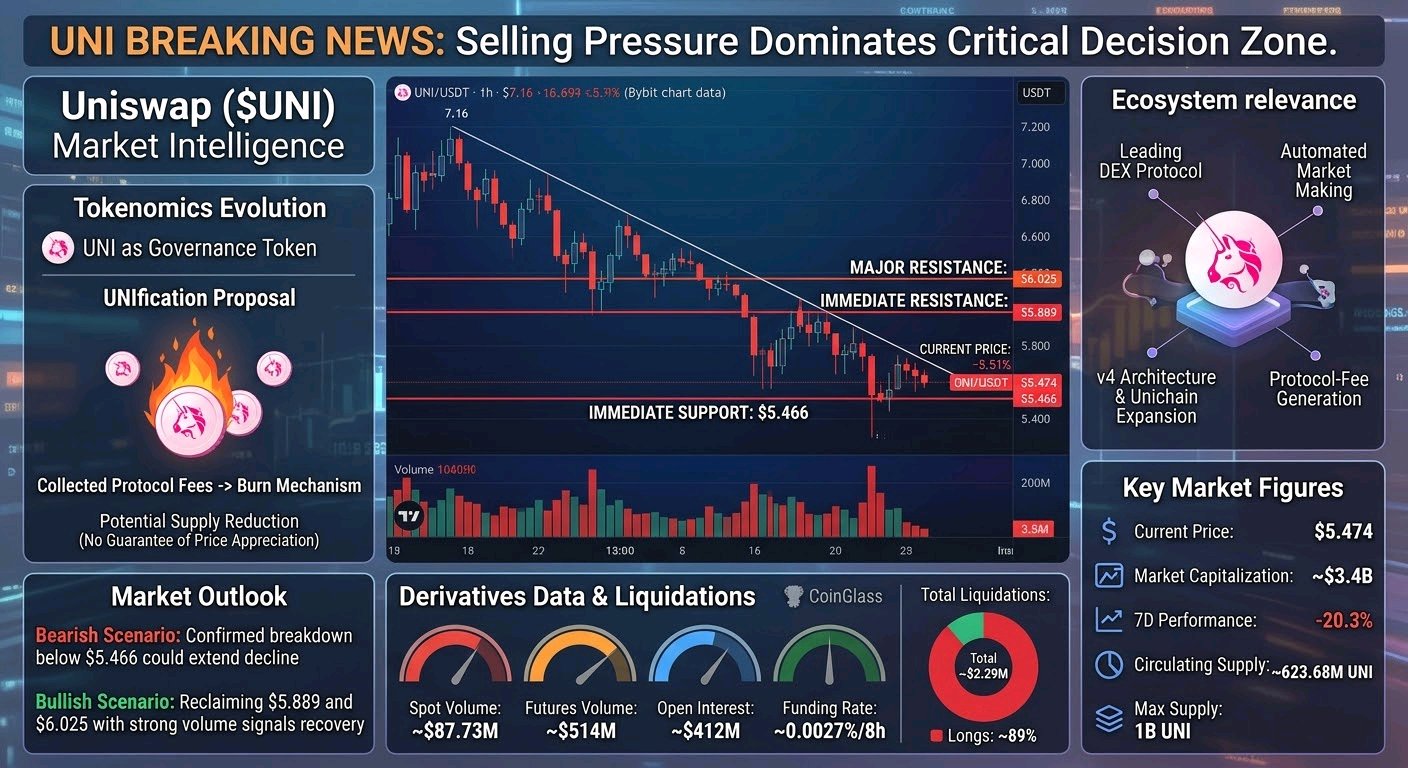
$UNI is approaching a critical decision zone, but the chart is showing something buyers cannot ignore: selling pressure is still dominating. Uniswap is trading around $5.474, down 5.51% over 24 hours, according to the provided Bybit chart. Price has declined consistently from the $7.16 region, forming lower highs and lower lows on the 1-hour timeframe. The immediate support is around $5.466, where price is currently testing demand. A sustained breakdown could expose UNI to further downside. On the recovery side, $5.89 is the first important resistance, followed by $6.02–$6.03. The broader trend remains bearish until buyers reclaim these levels. The broader market data confirms that this weakness is not limited to a single trading session. UNI has lost approximately 20.3% over seven days, indicating that sellers have maintained control beyond the short-term chart. However, Uniswap's underlying ecosystem remains relevant. It is one of DeFi's leading decentralized exchange protocols, built around automated market making and permissionless token swaps. Its v4 architecture, Unichain expansion and aggregator hooks are extending its trading infrastructure. Recent aggregator integrations also create additional opportunities for protocol-fee generation. The tokenomics picture has also evolved. UNI is primarily a governance token, allowing holders to participate in protocol decisions. Importantly, the December 2025 UNIfication proposal introduced a mechanism through which collected protocol fees can be used to burn UNI. This creates a potential supply-reduction mechanism, although it does not guarantee price appreciation. Its original supply was 1 billion UNI, with approximately 623.68 million circulating in the latest market-data snapshot. No specific upcoming unlock is confirmed here. Derivatives positioning remains concerning. CoinGlass reports approximately $87.73M in spot volume, $514M in futures volume and $412M in open interest. Funding remains slightly positive near 0.0027% per eight hours, while approximately $2.29M in positions were liquidated, with longs accounting for roughly 89%. This suggests considerable leveraged exposure alongside persistent selling pressure. Key Market Figures Current Price: $5.474 (provided chart) Immediate Support: $5.466 Immediate Resistance: $5.889 Major Resistance: $6.025 Market Capitalization: ~$3.4B 7D Performance: -20.3% Circulating Supply: ~623.68M UNI Maximum Supply: 1B UNI Bullish Scenario: Holding $5.466, reclaiming $5.889 and breaking $6.025 with strong volume could signal a meaningful recovery. Bearish Scenario:A confirmed breakdown below $5.466 could extend the decline as leveraged traders face further pressure. Ultimately, UNI has meaningful ecosystem developments and a new fee-burning mechanism, but fundamentals alone cannot reverse a bearish market. Buyers must demonstrate genuine demand and reclaim resistance before a sustainable recovery becomes convincing. CoinGlass +5 $UNIUSDT $PUMPUSDT #ByXIMPACT
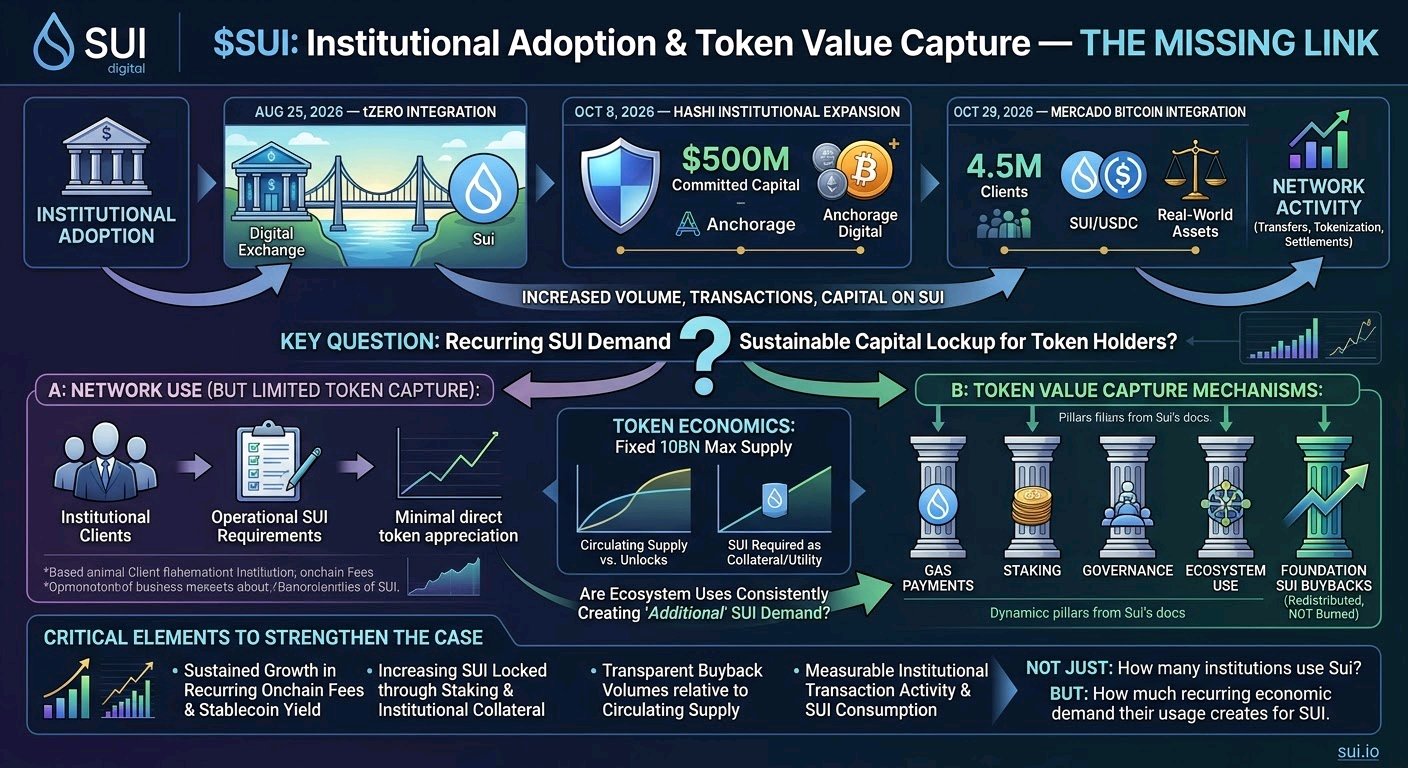
$SUI: Institutional Adoption Has One Missing Link — Token Value Capture Sui is building a stronger position in institutional finance, but network adoption and token appreciation are two different economic outcomes. A blockchain can attract regulated financial institutions, tokenized assets, and substantial capital without automatically creating proportional value for its native token. For SUI, the important question is whether institutional activity generates recurring demand, sustainable capital lockup, and measurable economic benefits for token holders. Three developments deserve attention. 1\. August 25, 2026 — tZERO integration. Sui announced that tZERO would expand its regulated digital securities infrastructure to Sui, covering issuance, custody, transfer agency, trading, and settlement. This is meaningful institutional infrastructure because it connects Sui with established regulated-market capabilities. However, an integration announcement does not establish the volume of securities actually issued or the recurring revenue generated. More importantly, institutional clients using this infrastructure do not necessarily need to hold substantial SUI beyond operational requirements. sui.io 2\. October 8, 2026 — Hashi institutional expansion. Sui announced Hashi's phased mainnet rollout with more than $500 million in committed capital and Anchorage Digital joining its launch coalition. The initiative targets Bitcoin-backed financial products, including lending, borrowing, and institutional liquidity. This creates a potentially significant new economic environment for Sui. Nevertheless, committed capital is not equivalent to deployed capital, completed transactions, or recurring protocol revenue. The next step is demonstrating measurable utilization and the amount of SUI required to support that activity. sui.io 3\. October 29, 2026 — Mercado Bitcoin integration. Mercado Bitcoin announced plans to integrate SUI, USDC, and USDsui, while exploring Hashi integration and bringing tokenized real-world assets onto Sui. Its platform serves approximately 4.5 million clients. This expands Sui's institutional and distribution reach, but the announcement still needs to translate into actual transaction activity and recurring economic demand. sui.io The token economics are where the analysis becomes interesting. According to Sui's official documentation, SUI has four primary functions: gas payments, staking, governance, and use within the ecosystem. It is not equity ownership or a contractual claim on company profits. Its maximum supply is 10 billion tokens. Sui Documentation There is also a stronger value-capture mechanism emerging: Sui Foundation uses stablecoin yield to purchase SUI on the open market. However, purchased tokens are redistributed to ecosystem participants rather than burned. Therefore, buybacks create purchasing demand but do not automatically establish permanent supply reduction or direct shareholder-style distributions. sui.io A fixed supply and expanding utility provide a credible bullish argument. But scarcity alone cannot guarantee appreciation, particularly when token unlocks, circulating supply, and actual consumption remain important variables. What would strengthen SUI's economic case? * Sustained growth in recurring onchain fees and stablecoin yield. * Increasing SUI locked through staking and institutional collateral requirements. * Transparent buyback volumes relative to circulating supply. * Measurable institutional transaction activity. * Evidence that ecosystem expansion consistently creates additional demand for SUI itself. Ultimately, Sui's infrastructure is developing, and its institutional relationships are becoming more substantial. The economic question is whether these developments create durable token-level demand rather than simply increasing network activity. The real question is not how many institutions use Sui. It is how much measurable, recurring economic demand their usage creates for SUI. $SUIUSDT $ETHUSDT #WSOT2026 #ByXIMPACT
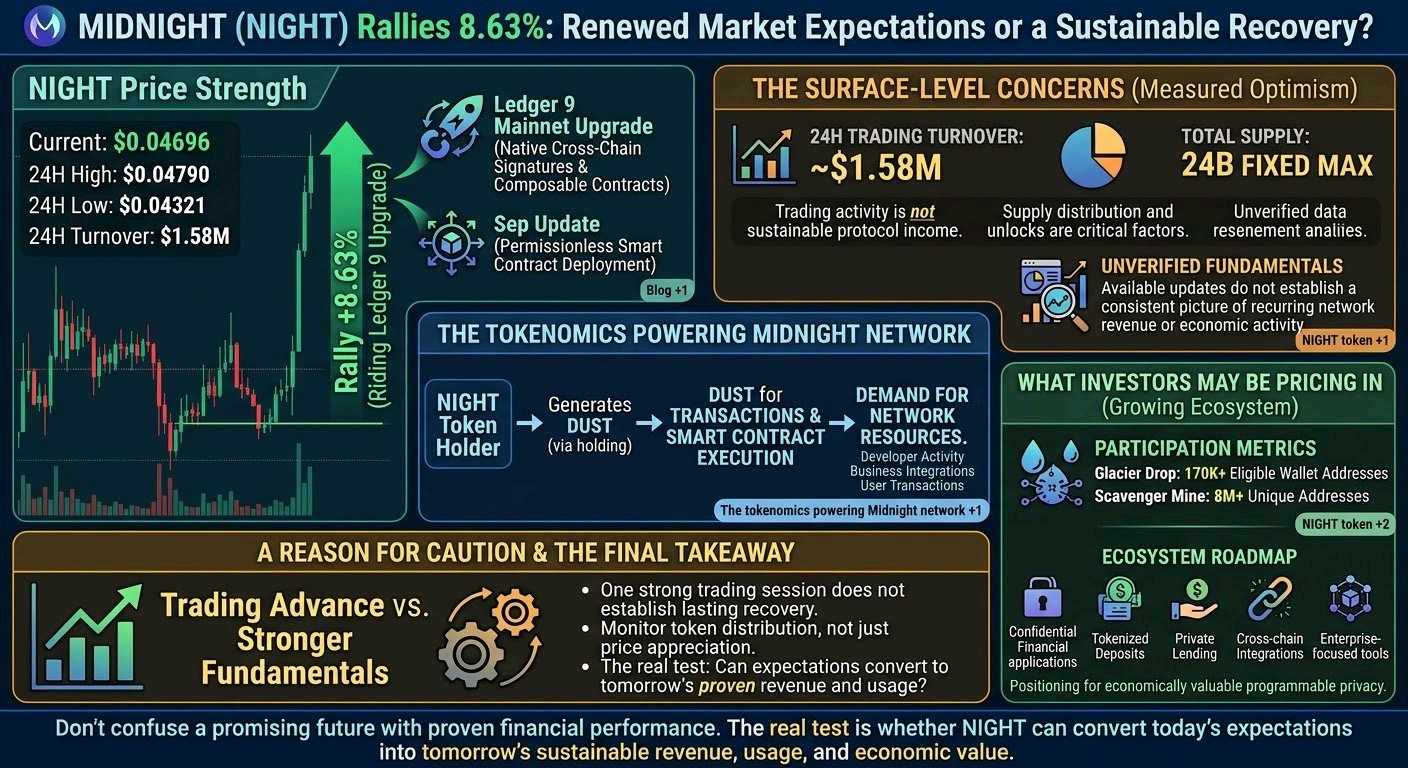
MIDNIGHT (NIGHT) Rallies 8.63%: Renewed Market Expectations or a Sustainable Recovery? Let’s discuss something traders often miss: a coin can rally even when its recent fundamental performance is not yet fully established. The key is understanding what investors expect in the future, not just what the project has delivered so far. NIGHT is showing renewed price strength, but the bigger question is whether this move reflects growing confidence in Midnight's long-term ecosystem or simply short-term trading demand. Event Context The chart shows NIGHT trading around $0.04696, up 8.63%, with a 24-hour high of $0.04790 and a low of $0.04321. The move follows several important developments across the Midnight ecosystem. On November 6, Midnight announced its Ledger 9 mainnet upgrade, introducing native cross-chain signature support and composable contracts. Earlier, its September update confirmed permissionless smart contract deployment on mainnet. These developments could be strengthening expectations around the network's future utility. Blog +1 The Surface-Level Concerns However, there are reasons to remain measured. * Midnight's 24-hour trading turnover in the chart is approximately $1.58 million. Trading activity is not the same as sustainable protocol income. * NIGHT has a fixed maximum supply of 24 billion tokens, meaning supply distribution remains an important consideration. * The available official updates do not yet establish a consistent, independently verified picture of recurring network revenue, transaction fees, or economic activity. NIGHT token +1 The Other Side: What Investors May Be Pricing In There are also meaningful developments worth watching. Midnight's Scavenger Mine distribution attracted more than 8 million unique addresses, while its Glacier Drop recorded participation from over 170,000 eligible wallet addresses. More importantly, Midnight is expanding its infrastructure beyond basic blockchain transactions. Its ecosystem roadmap includes confidential financial applications, tokenized deposits, private lending, cross-chain integrations, and enterprise-focused tools. These developments suggest the project is positioning itself for applications where programmable privacy could become economically valuable. NIGHT token +2 Why the Difference Matters Here is the important distinction. Trading volume measures how actively a token changes hands. Protocol revenue measures the economic value generated by actual network activity. Similarly, ecosystem participation does not automatically translate into recurring demand for NIGHT. Midnight uses NIGHT to generate DUST, the network resource required for transactions and smart contract execution. This creates a potential connection between network adoption and token utility. If more developers build applications, businesses integrate the technology, and users conduct transactions, demand for network resources could increase. But that economic connection still needs to demonstrate itself through measurable adoption and sustainable usage. The tokenomics powering Midnight network +1 A Reason for Caution One strong trading session does not establish a lasting recovery. The current 8.63% advance is encouraging from a price-action perspective, but it does not independently confirm stronger fundamentals. Investors should also monitor token distribution and future supply changes rather than focusing exclusively on price appreciation. So what matters next? Two important things deserve attention: 1\. Real ecosystem adoption: Watch whether Midnight converts its mainnet upgrades, partnerships, and developer activity into measurable transactions, applications, and recurring network usage. 2\. Token utility and demand: Monitor whether increasing network activity creates meaningful demand for NIGHT and whether its token economics support sustainable long-term value. My Final Takeaway Midnight has an interesting technological direction, particularly around programmable privacy, institutional applications, and cross-chain infrastructure. The market may already be anticipating what this ecosystem could become. But expectations and proven results are two different things. My takeaway: don't confuse a promising future with proven financial performance. The real test is whether NIGHT can convert today's expectations into tomorrow's sustainable revenue, usage, and economic value. $NIGHTUSDT $BTCUSDT #WSOT2026 #ByXIMPACT
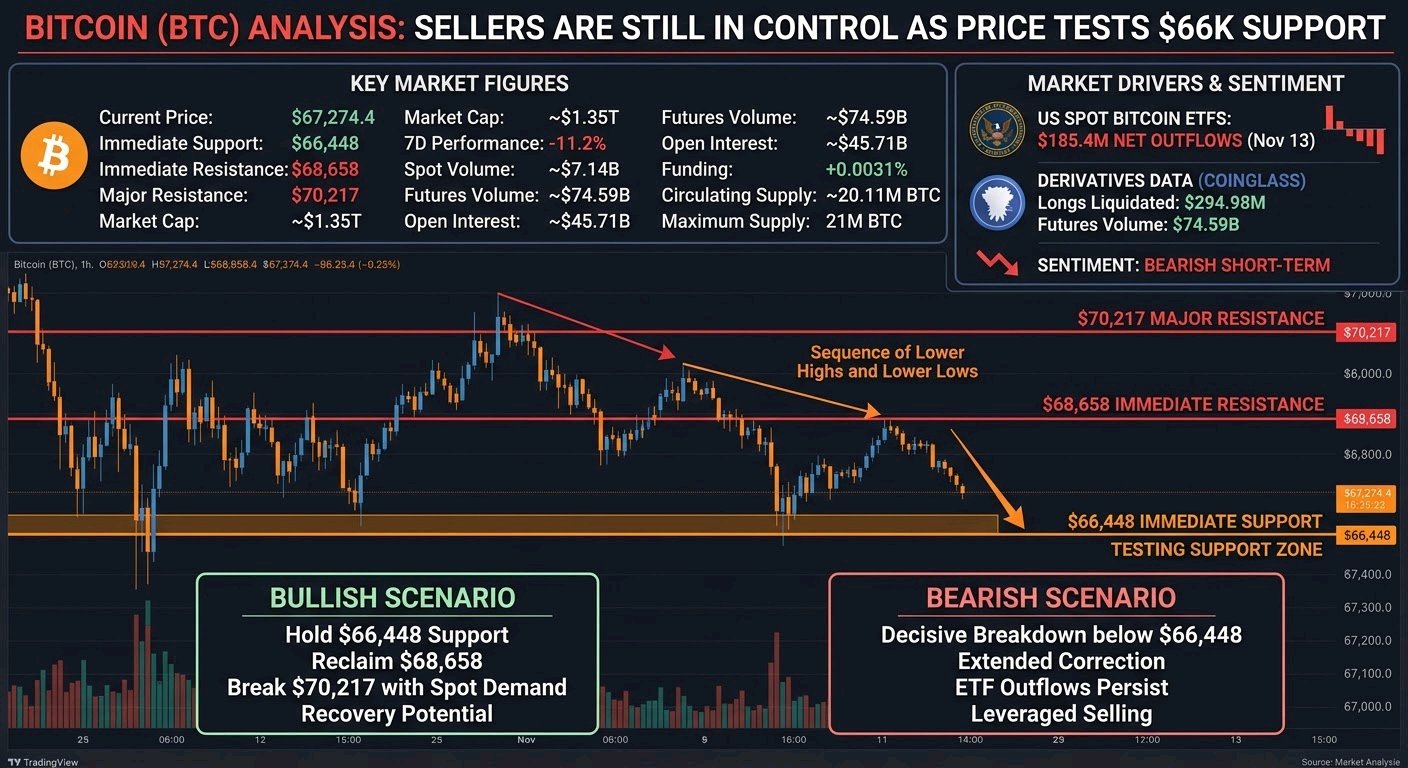
BITCOIN (BTC) ANALYSIS: SELLERS ARE STILL IN CONTROL AS PRICE TESTS $66K SUPPORT Bitcoin is showing clear downside pressure, and the latest 1-hour chart suggests buyers have not yet regained control. The important question now is whether the $66,448 support area can prevent another leg lower. BTC is trading at $67,274.4, down 2.11% over 24 hours. The displayed 24-hour high is $70,217.2, while the low stands at $66,448.6. The chart shows a persistent sequence of lower highs and lower lows, confirming a bearish short-term structure. The first important resistance is around $68,658, followed by $70,868–$70,217. A sustained recovery above these areas would improve market structure. On the downside, losing $66,448 could expose Bitcoin to further selling pressure. Bitcoin's fundamentals remain structurally relevant. Its decentralized proof-of-work network provides censorship-resistant value transfer and settlement, while its fixed monetary policy continues to differentiate it from assets with flexible supply. However, strong long-term fundamentals do not guarantee short-term price recovery. Recent institutional flows also deserve attention, with US spot Bitcoin ETFs recording approximately $185.4 million in net outflows on November 13. What is Bitcoin? +1 Bitcoin has no staking mechanism or conventional governance token. Its utility comes from monetary settlement, network security and value transfer. Approximately 20.11 million BTC are circulating against a 21 million maximum supply. There are no scheduled token unlocks; new supply enters through mining rewards, with the next halving expected in 2028. SEC +1 Derivatives positioning reinforces the caution. Futures volume reached approximately $74.59B against $7.14B in spot volume. Open interest declined to $45.71B, while roughly $294.98M in positions were liquidated, predominantly longs. Funding remained slightly positive at 0.0031%. This suggests substantial long-side unwinding rather than convincing fresh buying demand. CoinGlass +1 KEY MARKET FIGURES * Current Price: $67,274.4 * Immediate Support: $66,448 * Immediate Resistance: $68,658 * Major Resistance: $70,217 * Market Cap: ~$1.35T * 7D Performance: -11.2% * Spot Volume: ~$7.14B * Futures Volume: ~$74.59B * Open Interest: ~$45.71B * Funding: +0.0031% * Circulating Supply: ~20.11M BTC * Maximum Supply: 21M BTC Bullish scenario: Holding $66,448, reclaiming $68,658 and breaking $70,217 with stronger spot demand could initiate a recovery. Bearish scenario: A decisive breakdown below $66,448 could extend the correction, particularly if ETF outflows and leveraged selling persist. Final outlook: Bitcoin's scarcity and established network remain long-term strengths, but current market positioning favors caution. Buyers must demonstrate genuine spot demand and reclaim resistance before a sustainable recovery becomes convincing. $BTCUSDT $ETHUSDT #ByXIMPACT
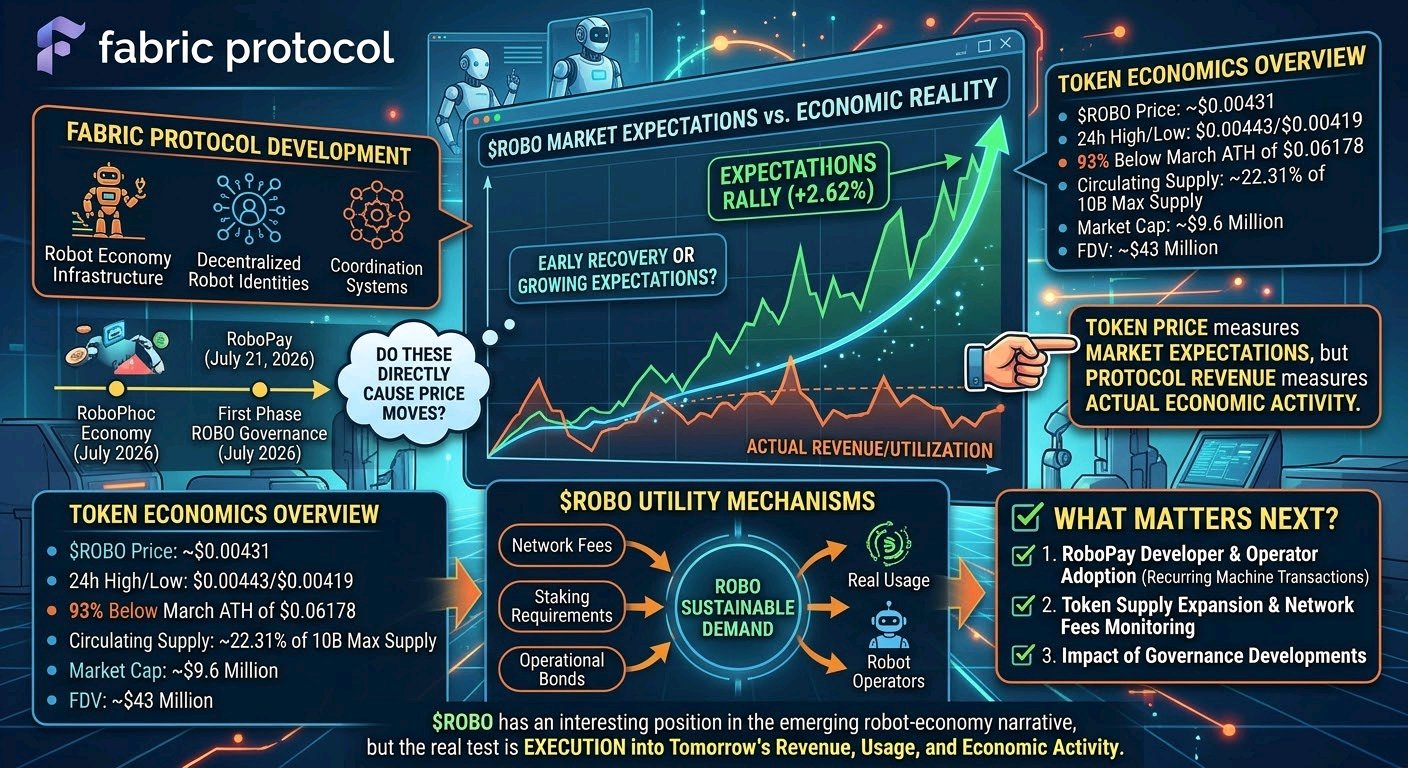
$ROBO Rallies 2.62%: Early Recovery or Growing Expectations Around Fabric Protocol? Let’s discuss something traders often miss: a token can rally even when its recent fundamental metrics are weak. The key is understanding what investors expect in the future, not just what the project delivered last month. $ROBO is currently trading around $0.00431, with a 24-hour high of $0.00443 and a low of $0.00419. The price action shows a modest recovery, but the bigger question is whether expectations are improving. The important context is Fabric Protocol's development of infrastructure for the robot economy. Its recent milestones include RoboPay, introduced on July 21, 2026, and the first phase of ROBO governance launched in July. However, there is no confirmed evidence that these announcements directly caused today's price move. fabric.foundation +1 At first glance, the numbers still deserve caution. ROBO remains approximately 93% below its March all-time high of $0.06178, while only 22.31% of its 10 billion maximum supply is circulating. Its market capitalization is around $9.6 million against an FDV of approximately $43 million. CoinMarketCap +1 But there is another side to the story. Fabric is developing machine-payment infrastructure, decentralized robot identities, and coordination systems. RoboPay could give the ecosystem a more practical economic use case beyond simply trading its token. fabric.foundation +1 This is where the difference becomes important. Token price measures market expectations, while protocol revenue measures actual economic activity. ROBO is designed to capture utility through network fees, staking requirements, and operational bonds, but those mechanisms need real adoption to create sustainable demand. fabric.foundation +1 Still, one recovery does not prove a lasting trend. The recent 2.62% move is relatively modest, and the available information does not establish that network revenue or real-world robot activity has increased alongside the price. So what matters next? First, watch whether RoboPay attracts actual developers, robot operators, and recurring machine-payment transactions. Real usage would provide stronger evidence than announcements alone. Second, monitor token supply expansion, network fees, and governance developments. These will help determine whether Fabric's growing ecosystem can translate into meaningful long-term utility for ROBO. My takeaway: $ROBO has an interesting position in the emerging robot-economy narrative, but expectations and execution are two different things. Don't confuse a promising future with proven performance. The real test is whether ROBO can convert today's expectations into tomorrow's sustainable revenue, usage, and economic activity. $ROBOUSDT $BTCUSDT #ByXIMPACT
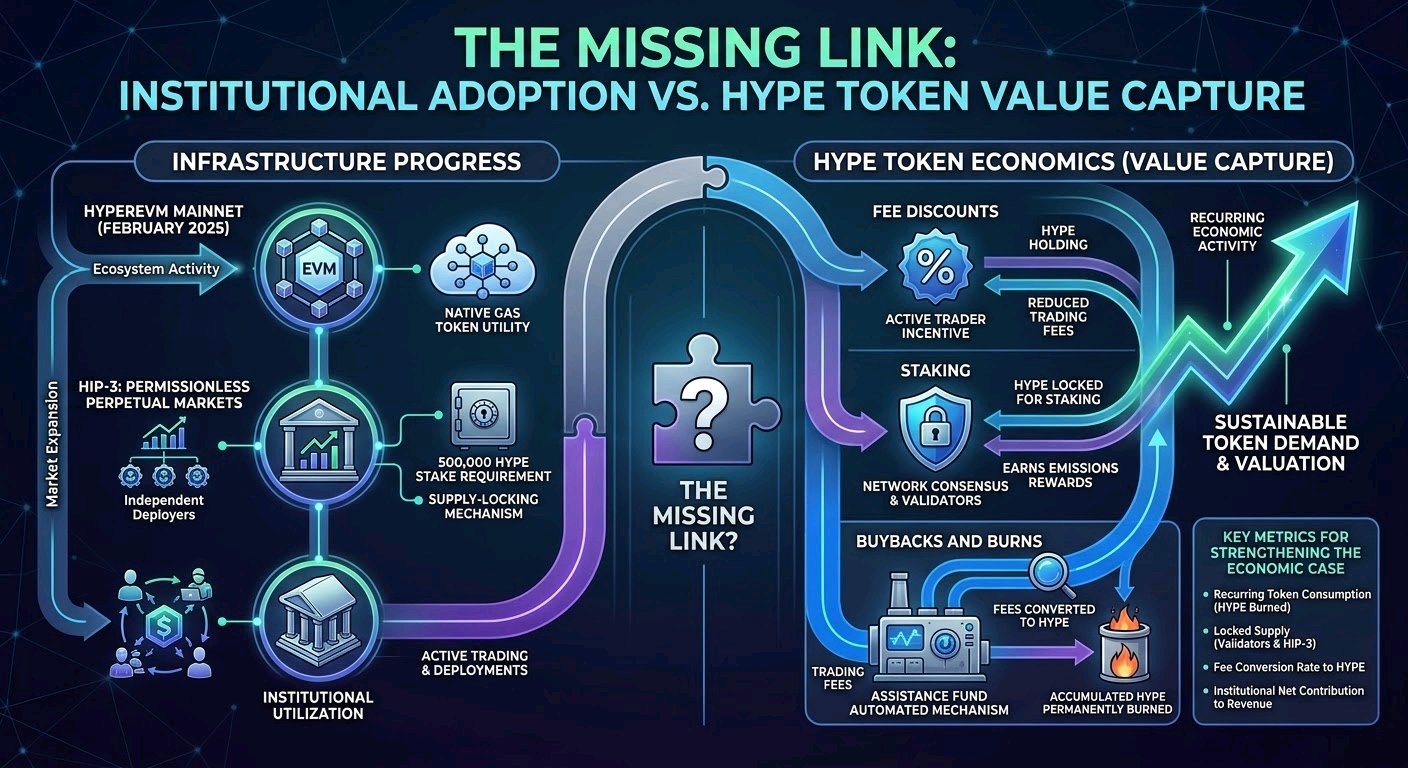
HYPE: The Institutional Expansion Has One Missing Link — Sustainable Token Value Capture Hyperliquid is developing into a broader on-chain financial marketplace, but infrastructure growth and token appreciation are not automatically the same thing. The important distinction is whether increased institutional participation creates recurring economic demand for HYPE itself. Unlike many ecosystem tokens, HYPE already has a functioning fee-to-buyback-and-burn mechanism. However, its long-term effectiveness depends on whether actual protocol activity can consistently outpace supply expansion. Three developments deserve attention. 1\. August 29, 2026 HIP-4 expanded beyond its initial deployment. HIP-4 introduced fully collateralized event and outcome markets, initially launching on mainnet on May 2, 2026. Following testnet development, an August 29 network upgrade enabled permissionless third-party deployment. This expands Hyperliquid's addressable market beyond conventional perpetual trading. However, the September 8 SEC filing reported approximately $445.8 million in aggregate daily HIP-4 volume, with substantial activity supported by deployer-funded incentives. Deployment is confirmed; sustainable organic demand remains a separate question. SEC +1 2\. September 8, 2026 HIP-3 demonstrated measurable adoption. HIP-3 markets represented approximately 30% of Hyperliquid's trailing 30-day trading volume, generating more than $548.1 billion in cumulative volume since launch. More importantly, deploying these markets requires 500,000 HYPE to be staked under the documented framework. This creates a direct supply-locking mechanism tied to ecosystem expansion. SEC +1 3\. September 8, 2026 The Assistance Fund established measurable token value capture. According to the SEC-filed prospectus, 99% of protocol fees are allocated to the Assistance Fund, which purchases HYPE from the market. Approximately 47.1 million HYPE had been permanently removed from circulation by that date. This is an actual economic mechanism, not simply a proposed utility. SEC +1 What does HYPE actually represent? HYPE provides governance, staking, fee-related utility and collateral functionality. It does not represent conventional equity ownership or an enforceable contractual entitlement to company profits or dividends. Its economic proposition instead comes from network-level fee purchases, burning and staking demand. The bullish argument is therefore credible: capped maximum supply, expanding utility, staking requirements and automated buybacks create multiple demand channels. But scarcity alone is insufficient. The maximum supply is 1 billion, with 38.9% reserved for future community emissions and 23.8% allocated to core contributors under vesting arrangements. Supply absorption must be evaluated against continuing emissions. SEC +1 The decisive metrics to monitor: Net HYPE purchased and burned relative to new emissions. Actual HYPE locked through HIP-3 deployments and staking. Recurring protocol fees generated by organic trading activity. Institutional trading volume translating into sustained fee generation. Growth in token demand relative to circulating supply. The real question is not how many institutions use Hyperliquid. It is how much measurable, recurring economic demand their activity creates for HYPE. $HYPEUSDT $BTCUSDT #WSOT2026 #ByXIMPACT
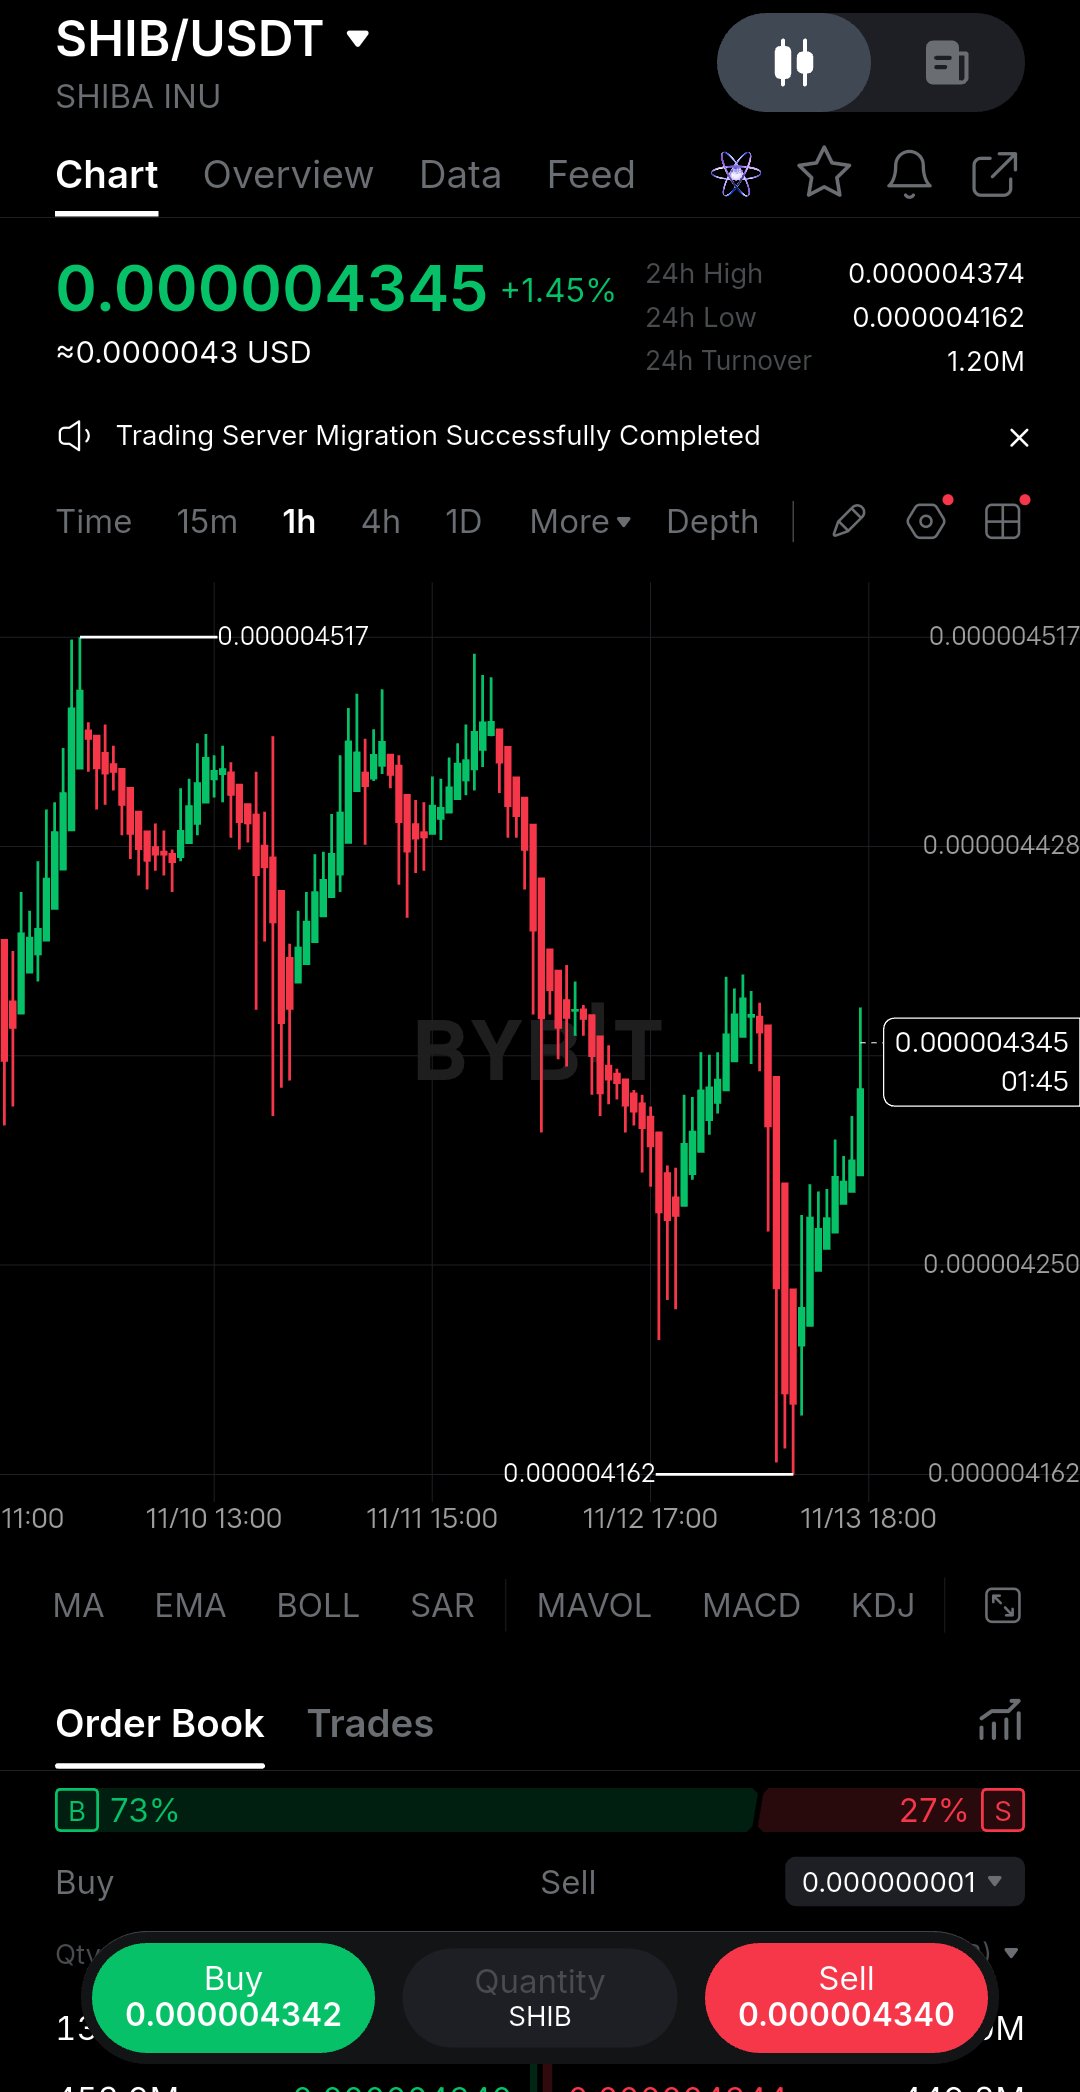
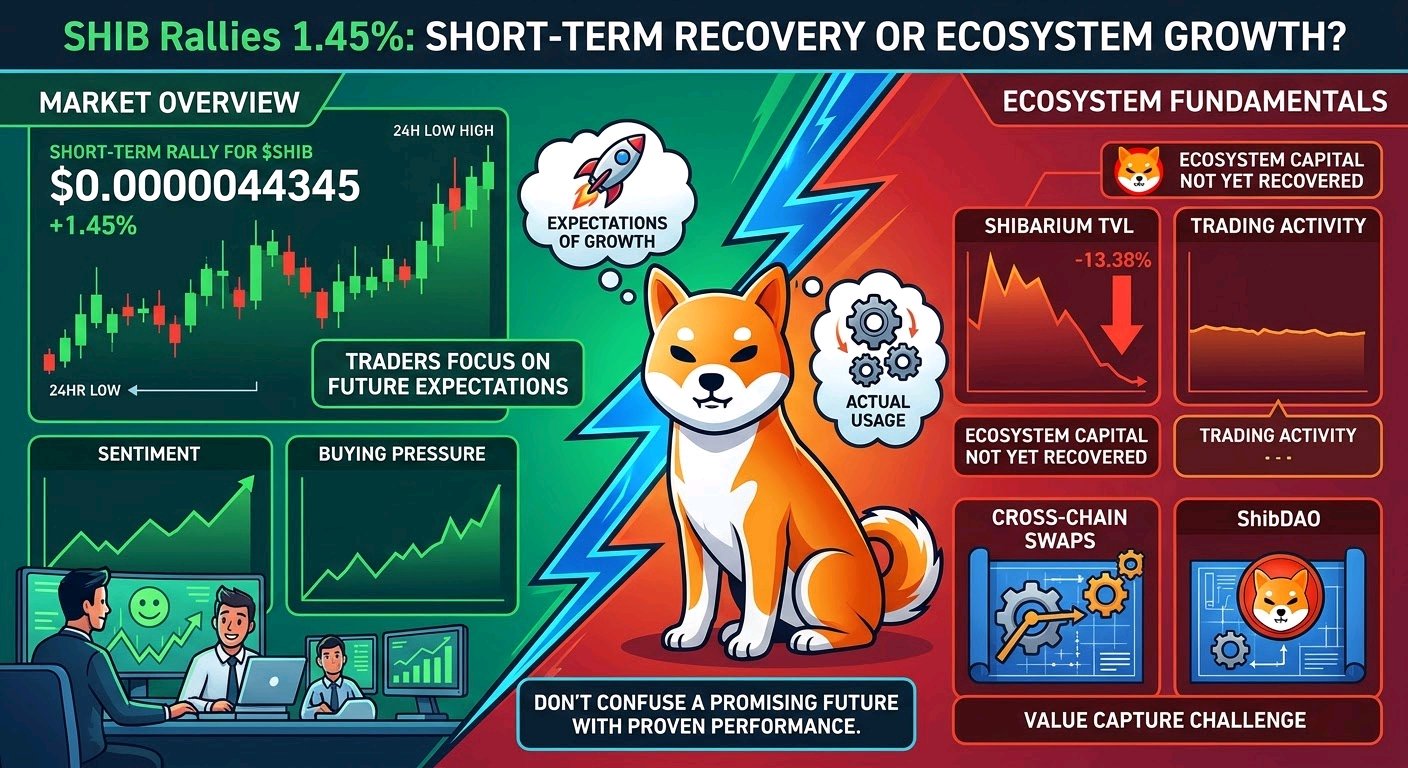
$SHIB Rallies 1.45%: A Short-Term Recovery or Expectations of Stronger Ecosystem Growth? Let’s discuss something traders often miss: a coin can rally even when its underlying ecosystem metrics are still weak. The key is understanding what investors expect in the future, not just what the project delivered last month. SHIB is an interesting example because its price action is beginning to show some recovery, while its broader ecosystem still has important challenges to overcome. Looking at the chart, SHIB is trading around **$0.000004345**, gaining approximately **1.45%**, with a 24-hour high of $0.000004374 and a low of $0.000004162. This recovery comes after a noticeable decline on the hourly timeframe, suggesting that buyers are attempting to regain control. However, there is no confirmed major announcement directly responsible for this particular price move, so attributing the rally to a specific partnership or development would be premature. At first glance, some fundamental numbers remain disappointing. Shibarium's total value locked was reported at approximately **$41,104 on October 30, 2026**, representing a decline of roughly 99.4% from its December 2024 peak. Recent market coverage has also highlighted relatively limited trading activity compared with competing meme-token ecosystems. These figures suggest that ecosystem capital and market participation have not yet demonstrated a convincing recovery. But there is another side to the story. Shiba Inu's official ecosystem website highlights that **Shibarium has surpassed 1 billion transactions**, alongside continued development of cross-chain swaps supporting more than 12 chains, ShibDAO governance, and additional ecosystem infrastructure. The project has also presented a partnership with the UAE Ministry of Energy and Infrastructure focused on Web3, AI, and green technology. These developments provide a longer-term adoption narrative, even though their actual economic impact still needs to be demonstrated. This is where the difference between network activity and token value becomes important. Transaction growth measures how frequently a blockchain is being used, while TVL measures how much capital users have deposited into its DeFi ecosystem. Neither metric automatically translates into sustainable demand for SHIB. For the token to benefit meaningfully, ecosystem development must eventually create measurable demand, stronger liquidity, and economic activity that supports its value. In other words, having a growing technology ecosystem is encouraging, but capturing value from that ecosystem is a separate challenge. One short-term recovery does not prove that the broader trend has changed. SHIB still needs consistent buying interest and stronger market participation to establish a more sustainable recovery. Traders should avoid treating a green hourly candle as confirmation of a fundamental turnaround, particularly when the underlying ecosystem metrics remain mixed. So what matters next? First, watch whether SHIB can maintain its recovery above the recent $0.000004162 low and establish stronger price structure rather than simply experiencing a temporary bounce. Second, monitor Shibarium's TVL, genuine transaction activity, ecosystem liquidity, and whether new developments translate into measurable demand rather than just announcements. My takeaway: SHIB may be attracting attention because of what its expanding ecosystem could become, even while some of its current fundamentals remain weak. But expectations and actual performance are two different things. Don't confuse a promising future with proven performance. The real test is whether Shiba Inu can convert today's expectations into tomorrow's sustainable usage, liquidity, and genuine token demand. $SHIBUSDT $SOLUSDT #ByXIMPACT
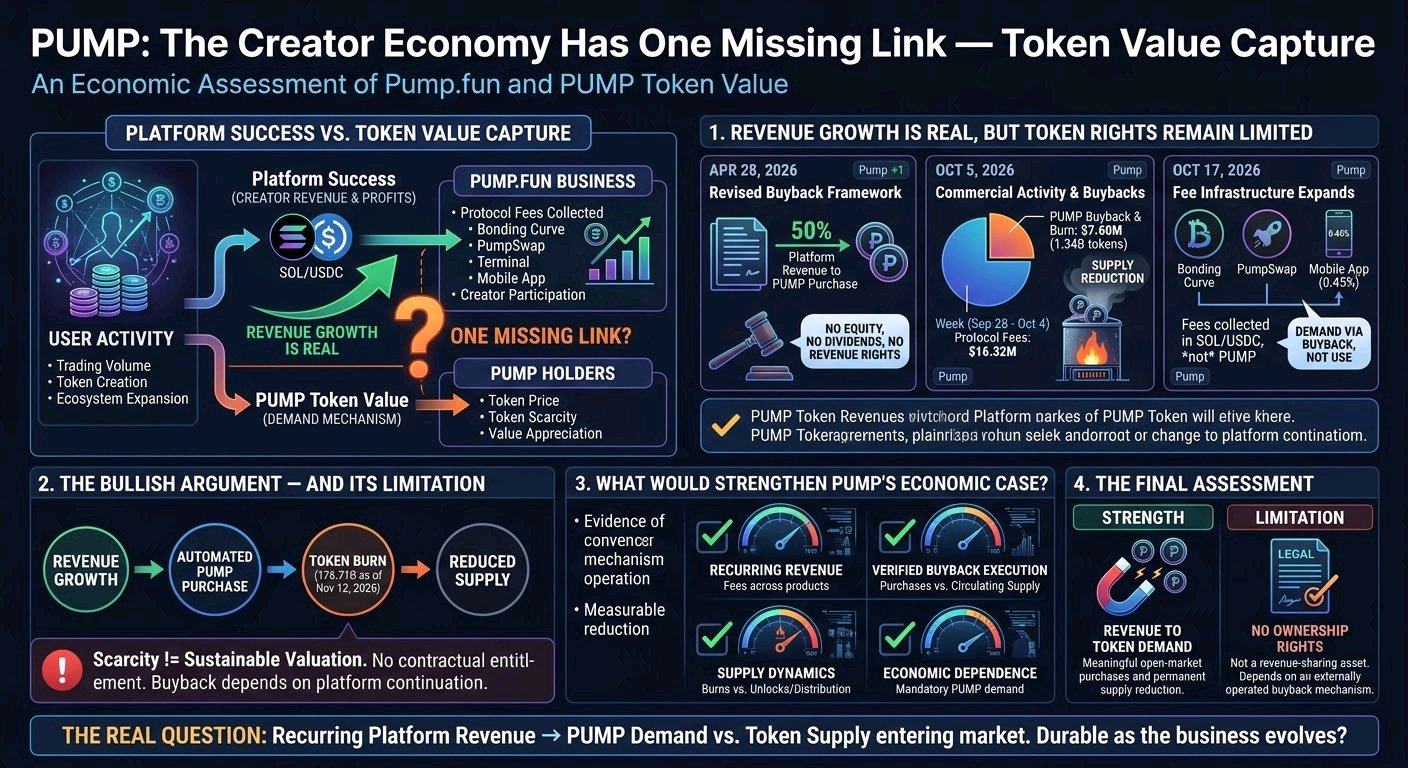
Pump.fun has established itself as a significant launchpad in the Solana ecosystem, with a business model built around token creation, trading activity, and creator participation. However, platform success and token appreciation are two different economic outcomes. Growing trading volumes, user activity, and platform revenue do not automatically translate into proportional value for PUMP holders. The critical question is whether the platform's commercial success creates recurring, enforceable demand for the token itself. 1\. Revenue Growth Is Real, but Token Rights Remain Limited Three developments are particularly relevant: April 28, 2026 Revised buyback framework Pump.fun published an updated announcement outlining its buyback mechanism. The framework directs approximately 50% of platform revenue toward purchasing PUMP, with purchases executed through automated infrastructure. This creates a direct connection between platform revenue and token demand. However, the announcement explicitly states that PUMP does not represent equity, dividends, revenue rights, or claims on platform cash flows. Holders cannot legally demand a share of business earnings. Pump +1 October 5, 2026 — Commercial activity translates into measurable buybacks Pump.fun's official Newsletter #14 reported $16.32 million in protocol fees across its Bonding Curve, PumpSwap, and Terminal products during the week of September 28 to October 4. During the same period, $7.60 million worth of PUMP was purchased and burned, equivalent to approximately 1.34 billion tokens. This is more meaningful than a partnership announcement because it demonstrates actual market purchases and supply reduction. Pump October 17, 2026 — Fee infrastructure expands Pump.fun updated its official fee documentation, detailing charges across bonding curves, PumpSwap, custom pairs, and its mobile application. The platform now has additional monetization channels, including a 0.45% application trading fee for wallets without referral codes. Importantly, these fees are collected in the relevant transaction assets, such as SOL or USDC, rather than PUMP. The economic connection to PUMP therefore comes through the buyback mechanism, not mandatory token consumption by platform users. Pump 2\. The Bullish Argument—and Its Limitation The bullish case is relatively straightforward: increasing trading activity generates revenue, a portion of that revenue purchases PUMP, and permanently burning purchased tokens reduces supply. Pump.fun's official token dashboard provides evidence of this mechanism operating. As of November 12, 2026, it reported approximately $506 million in cumulative buybacks and 176.71 billion PUMP burned. This is measurable supply reduction, not simply a proposed utility. Pump However, scarcity alone does not establish sustainable valuation. PUMP holders have no contractual entitlement to platform revenue, and the buyback allocation is not equivalent to shareholder ownership or guaranteed distributions. Furthermore, buyback activity depends on continued platform revenue, trading demand, and the maintenance of the mechanism. 3\. What Would Strengthen PUMP's Economic Case? Four metrics deserve particular attention: Recurring revenue: Sustainable fee generation across PumpSwap, Terminal, and the launchpad. Verified buyback execution: Actual PUMP purchases and burns relative to circulating supply. Supply dynamics: Whether permanent burns consistently outweigh new token unlocks and distribution. Economic dependence: Whether ecosystem expansion creates additional mandatory demand for PUMP beyond discretionary buybacks. The distinction is important: Pump.fun already demonstrates meaningful revenue-to-token demand. What remains unproven is whether that mechanism will remain durable as the business evolves. 4\. The Final Assessment PUMP has a stronger value-capture mechanism than a typical ecosystem token because platform revenue is being converted into open-market purchases and permanent supply reduction. But it is still not a revenue-sharing asset. Its economic case depends on the continuation of an externally operated buyback mechanism rather than enforceable ownership rights. The real question is not how many traders use Pump.fun. It is how much recurring platform revenue is permanently converted into PUMP demand, and whether that demand can consistently outpace supply entering the market. $PUMPUSDT #ByXIMPACT $BTCUSDT
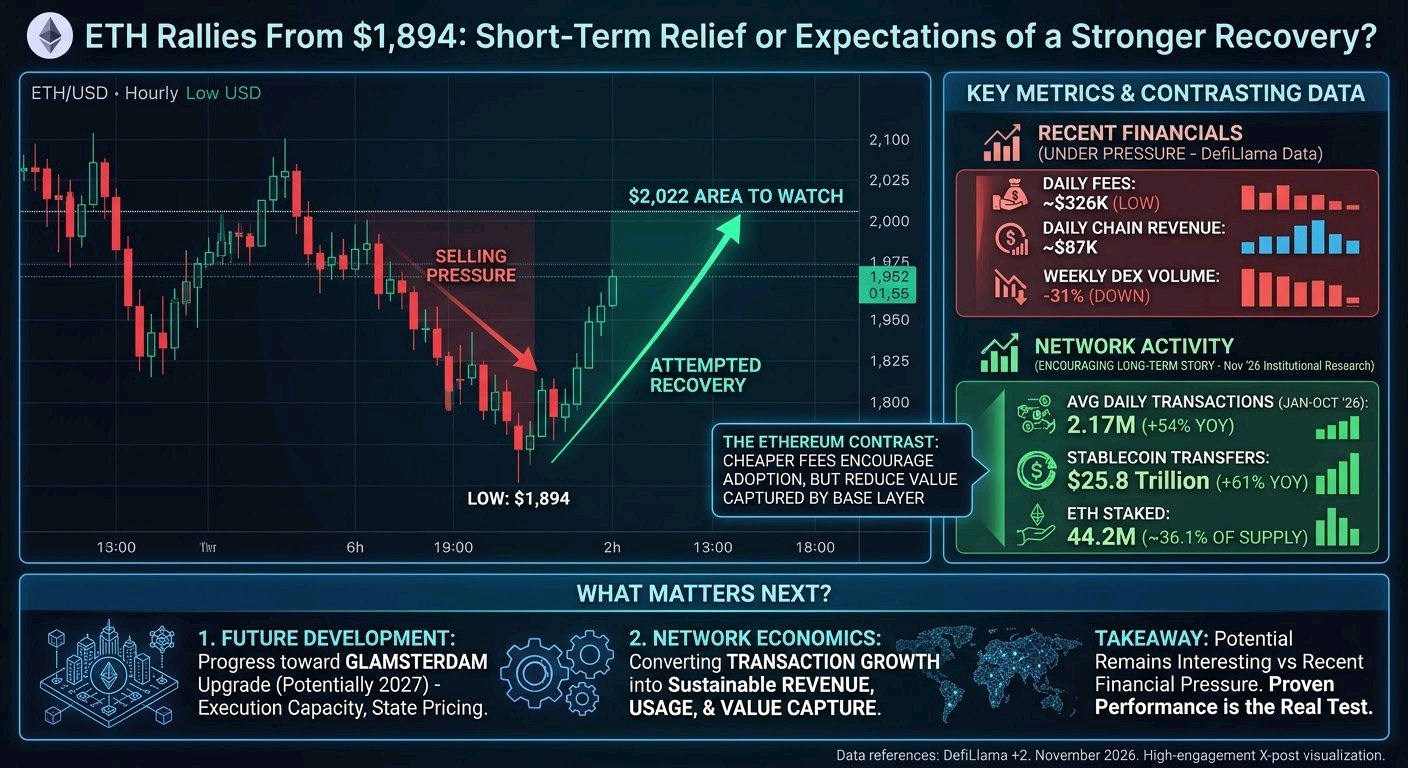
$ETH Rallies From $1,894: Short-Term Relief or Expectations of a Stronger Ethereum Recovery? Let’s discuss something traders often miss: Ethereum can recover in price even when its recent network activity and fee generation remain under pressure. The key is understanding what investors expect in the future, not just what the network delivered last month. ETH is currently trading around $1,952, down approximately 4.47% over the 24-hour period shown in the chart. It recently touched $1,894 before attempting a recovery, while the broader hourly structure still shows considerable selling pressure. There is no single confirmed announcement in the available data that explains this price movement. However, expectations around Ethereum's next development phase may be influencing how investors value the network's longer-term potential. The upcoming Glamsterdam upgrade, potentially arriving in early 2027, is designed to improve execution capacity and change how state creation is priced. Its activation date has not been confirmed. At first glance, Ethereum's recent financial metrics do not look particularly strong. According to current DeFiLlama data: * Daily network fees are approximately $326K. * Daily chain revenue is around $87K. * Weekly DEX volume is down approximately 31%. These numbers suggest that Ethereum's immediate fee-generation environment is under pressure. But there is another side to the story. Ethereum's underlying network activity tells a more encouraging longer-term story. According to Ethereum Institutional's November 5 research: * Mainnet averaged 2.17 million daily transactions between January and October 2026, up 54% year over year. * Stablecoin transfers reached $25.8 trillion, increasing 61% compared with the same period in 2025. * Approximately 44.2 million ETH was staked by October 31, representing 36.1% of circulating supply. This difference is important. Network fees measure how much users pay to use Ethereum, while transaction activity measures how frequently the network is being used. As Ethereum becomes cheaper to use, fees can decline even while transaction volumes increase. Lower costs can encourage adoption, but they can also reduce the amount of value captured directly by the base layer. That is why declining fees alone do not necessarily mean the Ethereum ecosystem is losing relevance. However, one strong set of adoption metrics does not guarantee better token economics. More activity must eventually translate into sustainable value capture for ETH holders. So what matters next? 1\. Network economics: Watch whether transaction growth continues alongside improvements in fee generation and ETH value capture. 2\. Future development: Monitor progress toward Glamsterdam and whether Ethereum's scaling improvements attract more institutional activity, stablecoin flows, and real-world asset adoption. From a technical perspective, ETH is attempting to recover after touching $1,894. The $2,022 area is an important nearby level to watch, while $1,894 remains the recent downside reference. A sustained recovery would provide stronger evidence than a short-lived bounce. My takeaway: Ethereum's future potential remains interesting, even while its recent financial metrics show pressure. But don't confuse a promising future with proven performance. The real test is whether Ethereum can convert today's expectations into tomorrow's sustainable revenue, usage, and value capture. DefiLlama +2 $ETHUSDT #WSOT2026 #ByXIMPACT
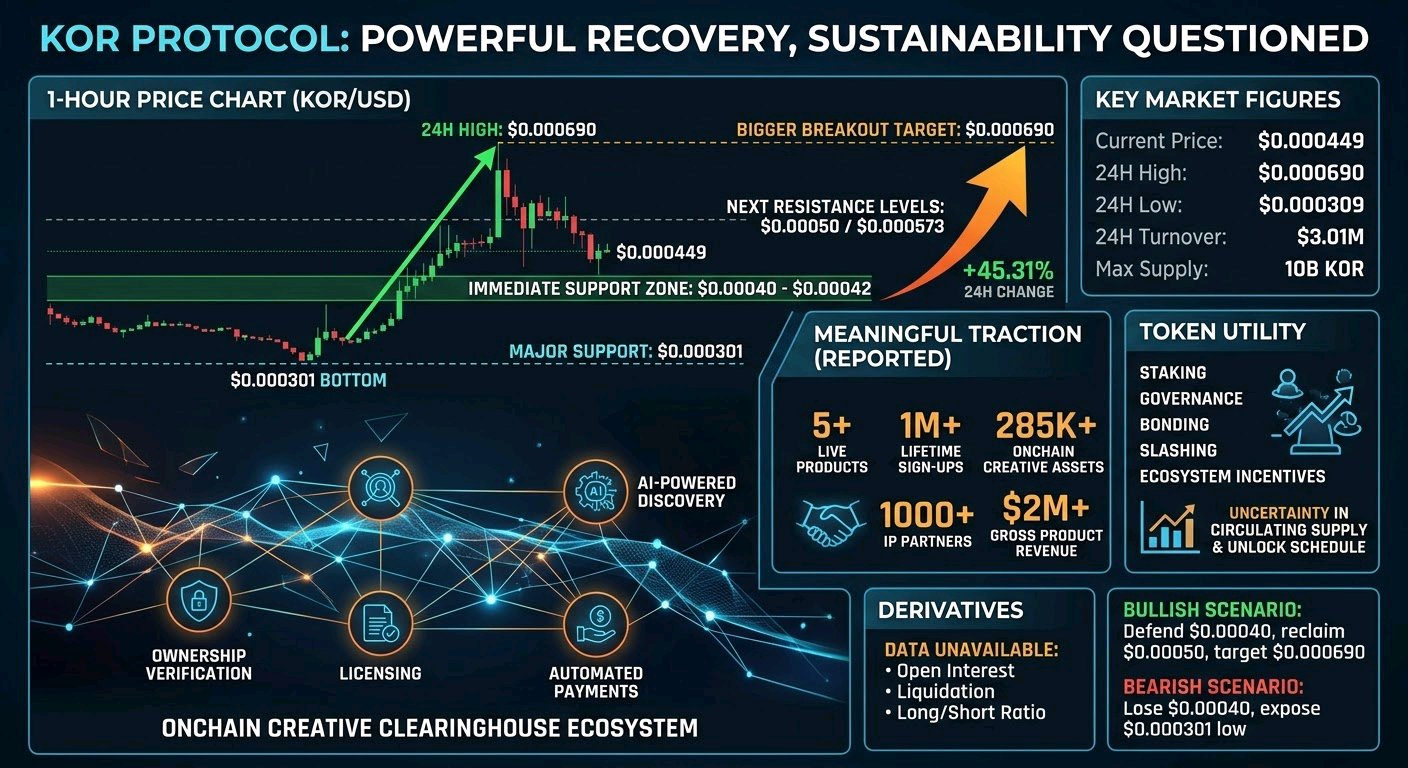
KOR Protocol is showing a powerful recovery, but the bigger question is whether this sudden buying pressure can turn into a sustainable reversal. KOR is trading around **$0.000449, up 45.31% in 24 hours**, with a reported 24-hour high of $0.000690 and low of $0.000309. The 1-hour chart shows a sharp rebound from the $0.000301 bottom, followed by a pullback as buyers attempt to stabilize the price. However, the broader chart still reflects a significant downtrend. The $0.00040–$0.00042 area is an important near-term support zone, while $0.00050 and $0.000573 are the next resistance levels. The $0.000690 high remains the bigger breakout target. Seven-day performance is not independently confirmed. Fundamentally, KOR is building something beyond another speculative crypto token. It aims to become an onchain clearinghouse for creative assets, connecting ownership verification, licensing, AI-powered discovery and automated payments. Its ecosystem already reports five live products, over 1 million lifetime sign-ups, 285,000 onchain creative assets, 1,000+ IP partners and more than $2 million in gross product revenue. That's meaningful traction worth watching. Token utility is another important part of the picture.KOR supports staking, governance, bonding, slashing and ecosystem incentives. Its maximum supply is fixed at **10 billion tokens**, with no additional issuance. However, circulating supply and the detailed unlock schedule remain unconfirmed in the available official documentation. Derivatives positioning also deserves attention. Reliable synchronized open interest, liquidation and long/short data are unavailable, so this rally cannot yet be confirmed as spot-led or leverage-driven. **Key Market Figures:** - Current Price: $0.000449 - 24H Change: +45.31% - Support: $0.00040–$0.00042 - Major Support: $0.000301 - Resistance: $0.00050 / $0.000573 - 24H Turnover: $3.01M - Maximum Supply: 10B KOR *Bullish Scenario:** Holding above $0.00040 and reclaiming $0.00050 with strong volume could open the way toward $0.000573 and eventually $0.000690. *Bearish Scenario:** Losing $0.00040 could weaken the recovery and expose the previous $0.000301 low. Ultimately, KOR has an interesting real-world use case, but its long-term valuation will depend on actual protocol adoption, token demand and sustainable liquidity. The next breakout needs confirmation, not just excitement. $KORUSDT $BTCUSDT #ByXIMPACT
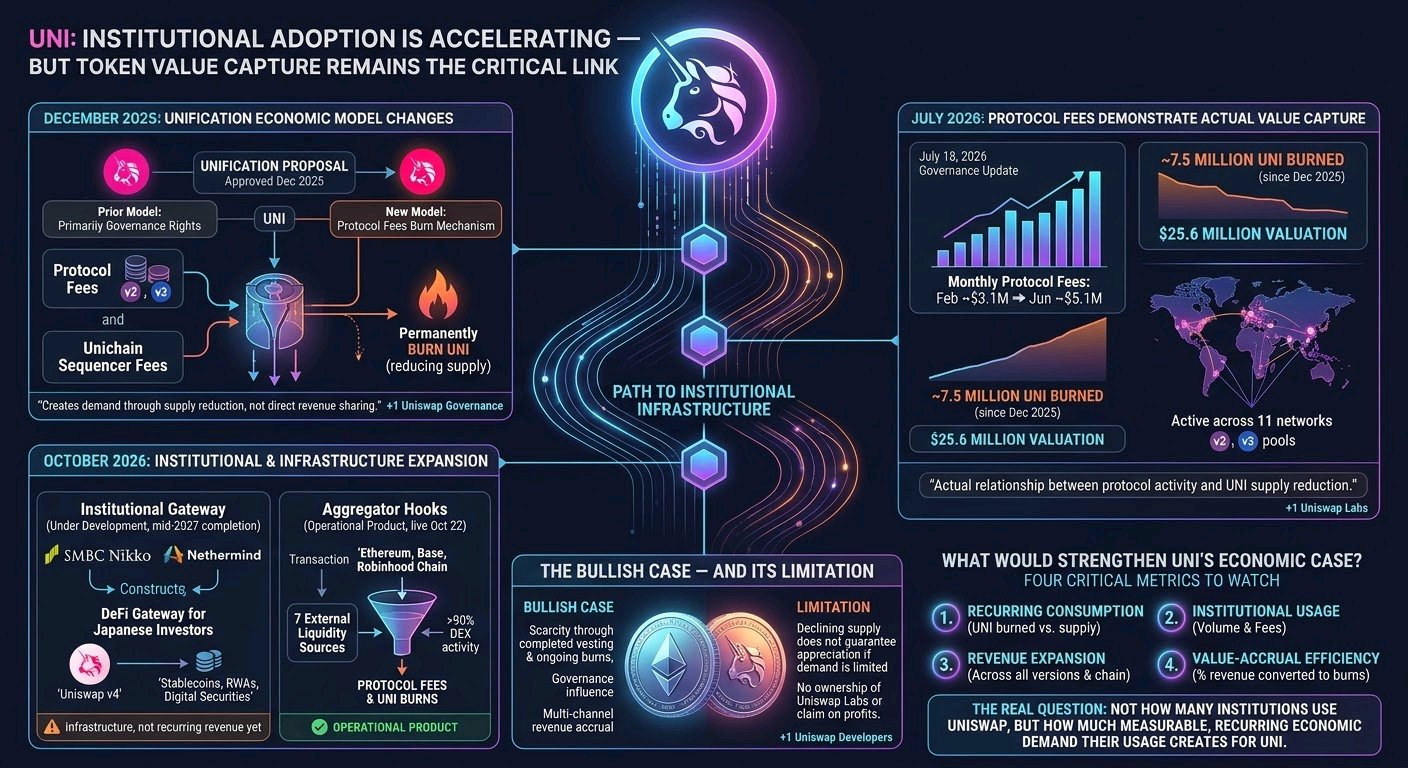
UNI: Institutional Adoption Is Accelerating — But Token Value Capture Remains the Critical Link Uniswap is increasingly positioning itself as institutional-grade financial infrastructure. Its expansion into tokenized assets, cross-chain liquidity, institutional trading and automated market infrastructure strengthens the long-term business case for the protocol. However, successful infrastructure adoption does not automatically translate into proportional economic value for UNI holders. The important distinction is whether institutional activity generates measurable demand for the token itself. 1\. December 2025 — UNIfication Changes UNI's Economic Model One of the most important developments for UNI was the UNIfication governance proposal introduced on November 10, 2025, and subsequently approved in December. The proposal activated protocol fees and established a mechanism through which collected fees are used to acquire and permanently burn UNI. It also directed Unichain sequencer fees toward the same mechanism. This was a meaningful change. Previously, UNI primarily represented governance rights without a direct economic connection to protocol revenue. However, the mechanism is not equivalent to revenue sharing. UNI holders do not receive dividends or proportional distributions. Instead, protocol revenue creates demand for UNI through the burn process. Uniswap Governance +1 2\. July 2026 — Protocol Fees Demonstrate Actual Value Capture The fee mechanism has moved beyond theoretical tokenomics. In its July 18, 2026 governance update, Uniswap Labs reported approximately 7.5 million UNI burned since December, representing roughly $25.6 million at the reported valuation. Monthly protocol fees reportedly increased from approximately $3.1 million in February to $5.1 million in June. Protocol fees were also active across v2 and v3 pools on 11 networks. This is important because it demonstrates an actual relationship between protocol activity and UNI supply reduction. Nevertheless, the sustainability of this mechanism depends on trading volume, fee parameters, liquidity retention and the proportion of activity subject to protocol fees. Uniswap Governance +1 3\. October 2026 — Institutional and Infrastructure Expansion Two developments deserve attention. On October 2, Uniswap announced that SMBC Nikko and Nethermind were building a DeFi Gateway for Japanese investors using Uniswap v4. The initiative targets stablecoins, real-world assets and digital securities, with completion targeted for mid-2027. This is institutional infrastructure development, not yet evidence of completed deployment or recurring revenue. On October 22, Aggregator Hooks went live across Ethereum, Base and Robinhood Chain. Seven external liquidity sources were available at launch, covering more than 90% of DEX activity across those chains. Transactions routed through these integrations contribute to protocol fees and UNI burns. The distinction matters: the institutional gateway remains under development, while aggregator integration represents an operational product. Uniswap Labs +1 The Bullish Case — And Its Limitation UNI now has several potential value-accrual channels: governance influence, protocol-fee-funded burns, expanding network coverage and additional institutional transaction activity. Its original one-billion-token supply has also benefited from completed team and investor vesting, while the burn mechanism introduces ongoing supply reduction. But scarcity alone cannot establish sustainable valuation. A declining supply does not guarantee meaningful appreciation if recurring economic demand remains limited. Furthermore, UNI does not provide holders with ownership of Uniswap Labs or an automatic contractual claim on protocol profits. Uniswap Developers +1 What Would Strengthen UNI's Economic Case? Four metrics deserve continued attention: Recurring consumption: Actual UNI burned relative to circulating supply over multiple quarters. Institutional usage: Transaction volume and protocol fees generated by institutional integrations. Revenue expansion: Growth in collectible protocol fees across v2, v3, v4 and Unichain. Value-accrual efficiency: The proportion of total ecosystem revenue converted into permanent UNI supply reduction. The strongest evidence would be sustained growth in these metrics, rather than announcements, partnerships or integrations alone. Ultimately, Uniswap's infrastructure can become increasingly important to global digital finance without UNI necessarily capturing the same proportion of that growth. The real question is not how many institutions use Uniswap. It is how much measurable, recurring economic demand their usage creates for UNI. $UNIUSDT #ByXIMPACT
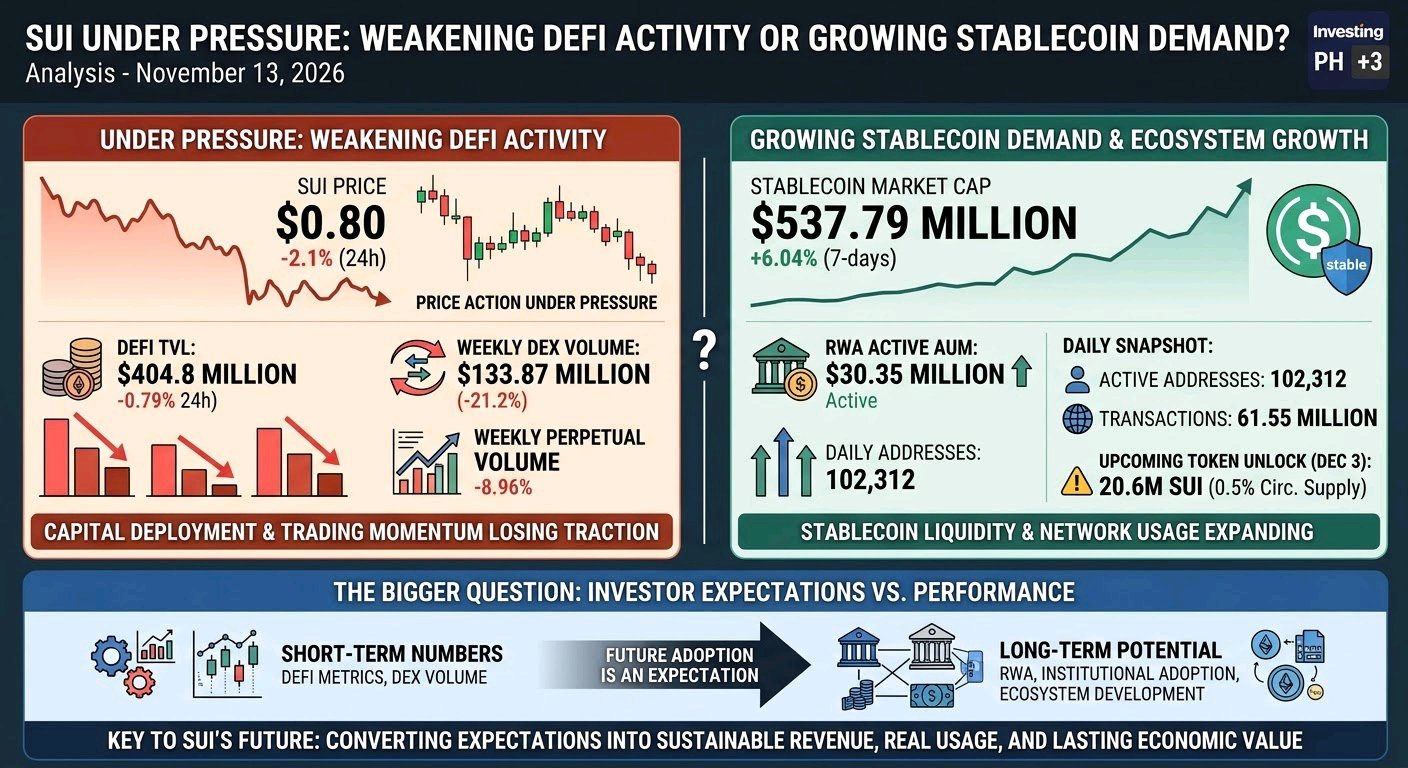
Okay So Guys SUI Under Pressure: Weakening DeFi Activity or Growing Stablecoin Demand? Let's discuss something traders often miss: a coin can attract market interest even when its recent fundamental metrics are weakening. The key is understanding what investors expect in the future, not just what the project delivered last month. As of November 13, SUI is trading around $0.80, down approximately 2.1% over the past 24 hours. The price action remains under pressure, but there are some interesting developments happening beneath the surface. The bigger question is whether declining DeFi activity is telling the complete story or whether investors are looking beyond short-term numbers and focusing on Sui's longer-term ecosystem potential. Looking at the recent numbers, some metrics deserve attention. Sui's DeFi TVL stands near $404.8 million, down approximately 0.79% over 24 hours. Weekly DEX trading volume has also declined 21.2% to around $133.87 million, while perpetual trading volume is down approximately 8.96% over the week. At first glance, these figures suggest that capital deployment and trading activity are losing momentum. That is something investors should not ignore, especially when the token itself is struggling to maintain its price. However, the other side of the picture is more interesting. Sui's stablecoin market capitalization is approximately $537.79 million, showing a 6.04% increase over seven days. Its real-world asset active AUM stands around $30.35 million, while the network recorded approximately 102,312 active addresses and 61.55 million transactions in the latest available daily snapshot. This difference matters because weaker trading activity does not necessarily mean that the entire blockchain ecosystem is losing relevance. Here is an important distinction: TVL measures the value of assets deposited in DeFi protocols, while stablecoin market capitalization measures the amount of stablecoin liquidity available across the network. Both are useful indicators, but they describe different types of economic activity. Investors may be reducing their exposure to DeFi trading while stablecoin liquidity continues growing. That liquidity could eventually support payments, decentralized applications, and other financial services if adoption continues. This is where SUI's longer-term potential comes into the discussion. Developments around institutional finance, tokenized real-world assets, and blockchain infrastructure could create additional demand over time. However, future adoption is still an expectation, not guaranteed financial performance. There is another factor worth watching: token supply. Around 20.6 million SUI tokens are scheduled to unlock on December 3, representing approximately 0.5% of the current circulating supply. Unlocks do not automatically create selling pressure, but they can influence market liquidity and investor positioning. One improving metric does not prove that the entire ecosystem is recovering. Similarly, declining DEX volume over one week does not automatically mean that Sui's long-term development is failing. The important thing is whether positive developments continue translating into measurable economic activity. So what matters next? First, watch whether stablecoin liquidity and real network usage continue expanding. A sustained increase would provide stronger evidence that Sui is attracting meaningful ecosystem activity rather than relying only on short-term speculation. Second, monitor DeFi TVL, application revenue, trading volume, and the upcoming token unlock. If these metrics stabilize and improve together, the market could begin reassessing SUI's longer-term value. My takeaway: don't confuse a promising future with proven financial performance. SUI has an interesting ecosystem opportunity, but the real test is whether it can convert today's expectations into tomorrow's sustainable revenue, real usage, and lasting economic value. Investing.com PH +3 $SUIUSDT #ByXIMPACT #WSOT2026 #USInflationRunsHotAndRateHikeBetsRise #SanDiskAnnounces8For1StockSplit #AnthropicIPOTestsTheAIBoom