Mdleganttop1
40766Like10Shares861Fans6Follow
💹 Bybit Square | Trade Smart, Earn Big 🚀 Crypto Moves | Bybit Square Hustler 💎 Trade 💰 Learn 📚 Grow 🌱 | Bybit Square 📈 Market Insights & Smart Trading | Bybit S
💹 Bybit Square | Trade Smart, Earn Big 🚀 Crypto Moves | Bybit Square Hustler 💎 Trade 💰 Learn 📚 Grow 🌱 | Bybit Square 📈 Market Insights & Smart Trading | Bybit S
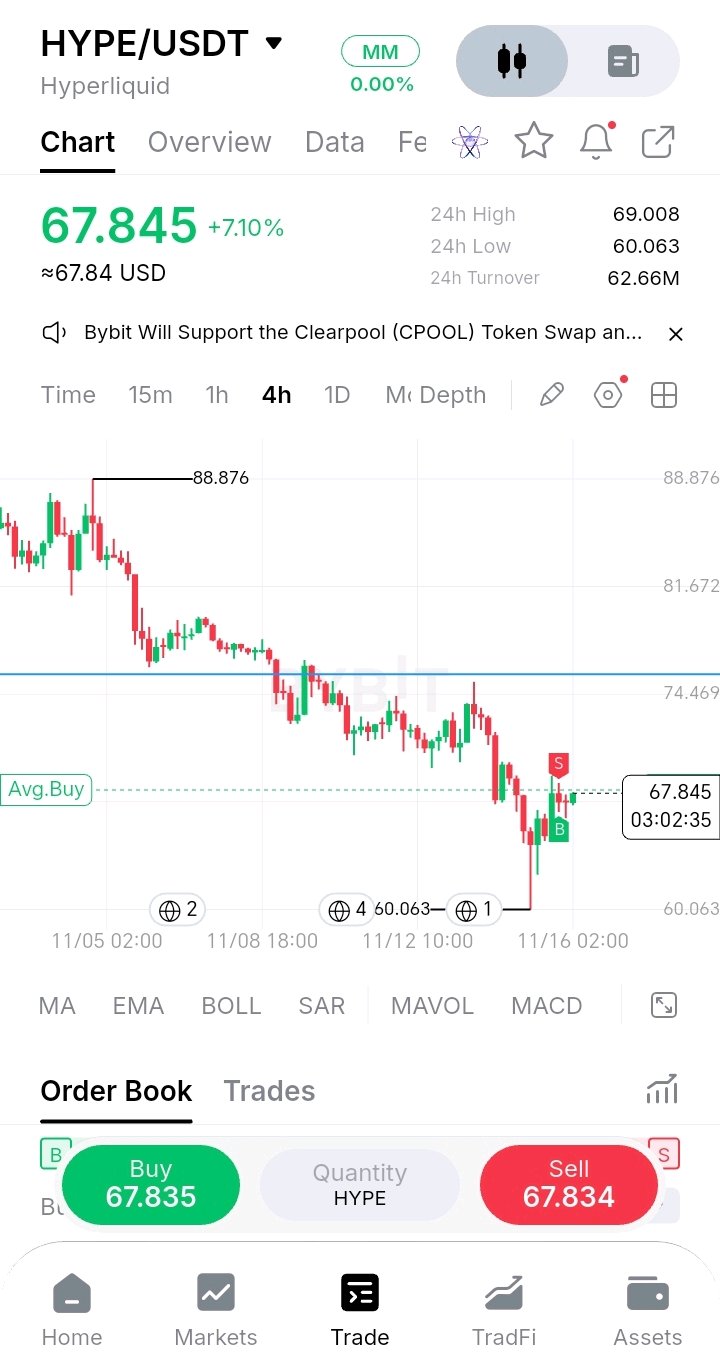
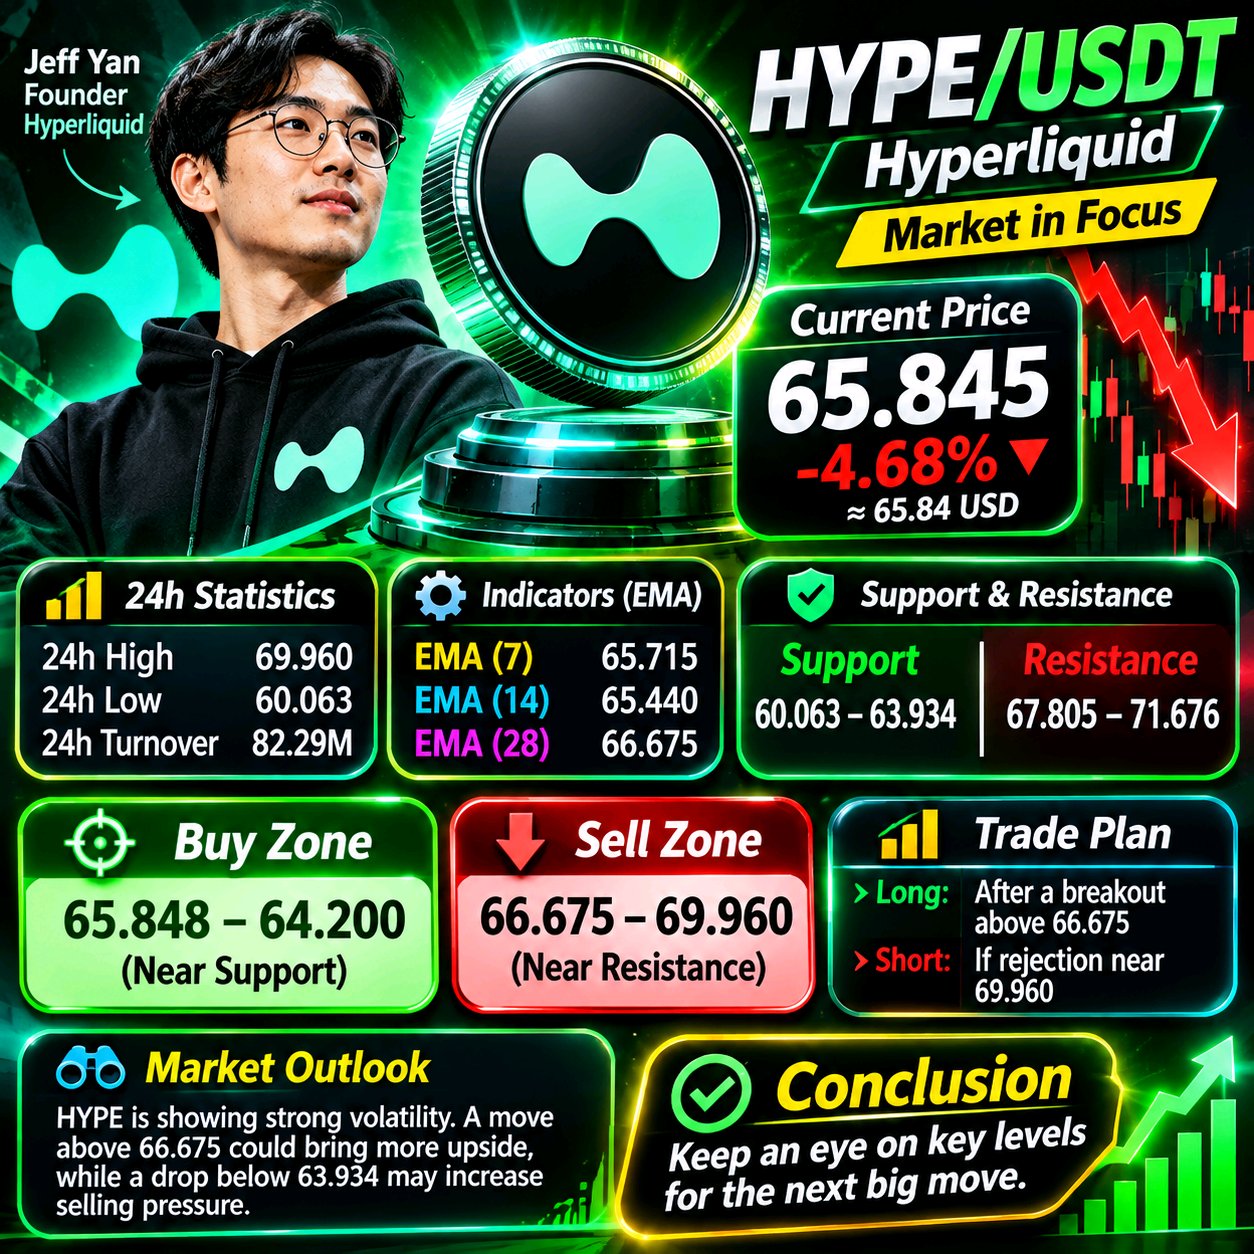
HYPE REBOUNDS 7.1% — A TURNING POINT AHEAD? Hyperliquid is showing a strong recovery attempt after a prolonged decline. HYPE has climbed to $67.845, gaining 7.10% in 24 hours, following a sharp rejection near $60.063. The latest green candles suggest buyers are returning, but one strong bounce does not automatically confirm a complete trend reversal. THE MARKET STRUCTURE The 4H chart still reflects a broader bearish structure, with price previously falling from $88.876. However, the latest rebound indicates that demand has emerged near the recent low. Immediate support: $65.00–$63.00 Major support: $60.063 Immediate resistance: $69.008 Major resistance: $74.469 BULLISH ROADMAP A sustained move above $69.008 could give buyers an opportunity to challenge $72.00 and the $74.469 resistance region. A successful breakout and retest would strengthen the recovery scenario. WHEN THE RECOVERY FAILS If HYPE loses the $65 area and selling pressure increases, the rebound could weaken. A deeper correction may bring the $63 region and eventually $60.063 back into focus. MY MARKET PERSPECTIVE The interesting part is not simply the 7% gain; it is how HYPE reacted after reaching its recent low. Buyers have made their first move, but they still need to overcome overhead resistance. I would favor confirmation over chasing momentum and keep risk controlled. Will HYPE recover toward $74, or will sellers interrupt this bounce? #HYPE #Hyperliquid #CryptoMarket #WSOT2026 #WSOTShowYourAITradeToEarn10USDT #JensenHuangExitTestsNvidiasAILeadership #USPPITestsTheHigherForLongerTrade #USInflationRunsHotAndRateHikeBetsRise $HYPEUSDT $BTCUSDT

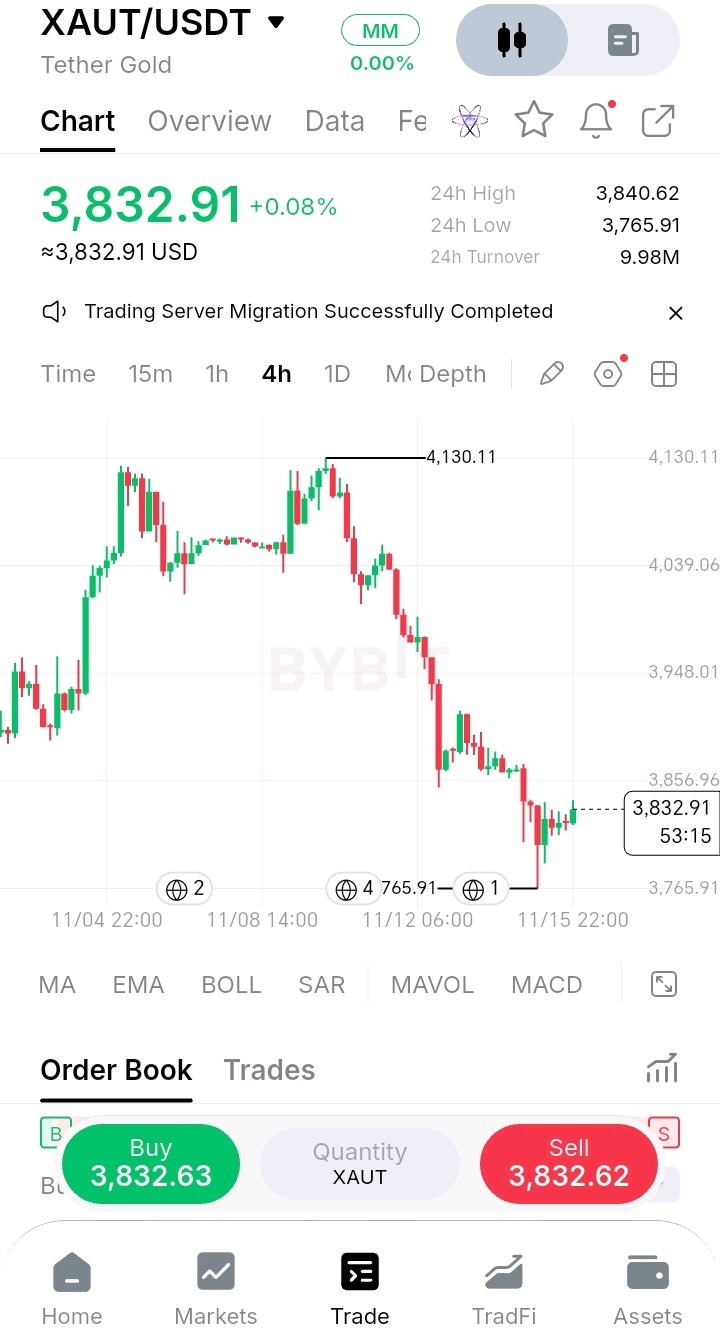
🏔️ The double top worked, and then it kept going. I don't want to call a bottom on $XAUT just because the first bounce looks tidy. I want to see a 4H close above 3,872.51, because that's the old base that is now acting as resistance. Here's what the 4H chart shows: 🔹 The double top: Gold peaked near 4,125, dipped to about 4,005, then came back and topped again at 4,130.11. Two highs at the same level with a dip between them is a classic double top. 🔹 The break: When price fell under the 4,005 neckline, the pattern was confirmed. The usual measured target from a pattern this size is roughly 3,880. 🔹 The overshoot: Gold went well past that, to a low of 3,765.91, about 8.8% under the 4,130 high. The move ran further than the textbook target. 🔹 The bounce: From the low, price has recovered about 1.8% to 3,832.91. The first bounce reached the 3,910 area, then 3,870, and the latest ones are smaller and tighter. 🔹 The old base: The 3,872.51 level from earlier is now above price. Broken support often turns into resistance on the first retest. 🔹 The range: 24H high 3,840.62 and low 3,765.91, with turnover at 9.98M. The market has calmed compared to the sell-off. 🟢 Bullish: a 4H close above 3,872.51, then 3,948. That would show buyers reclaiming the area the breakdown started from. 🔴 Bearish: a 4H close under 3,765.91, with no marked support below it on this chart. Patterns give targets, not guarantees. Once price overshoots one, the next level to read is the one it just lost. Are you watching $XAUT or another coin? #XAUT #Gold #Crypto #BinanceSquare #WSOT2026 #WSOTShowYourAITradeToEarn10USDT #JensenHuangExitTestsNvidiasAILeadership #USPPITestsTheHigherForLongerTrade #USInflationRunsHotAndRateHikeBetsRise $XAUTUSDT $BTCUSDT

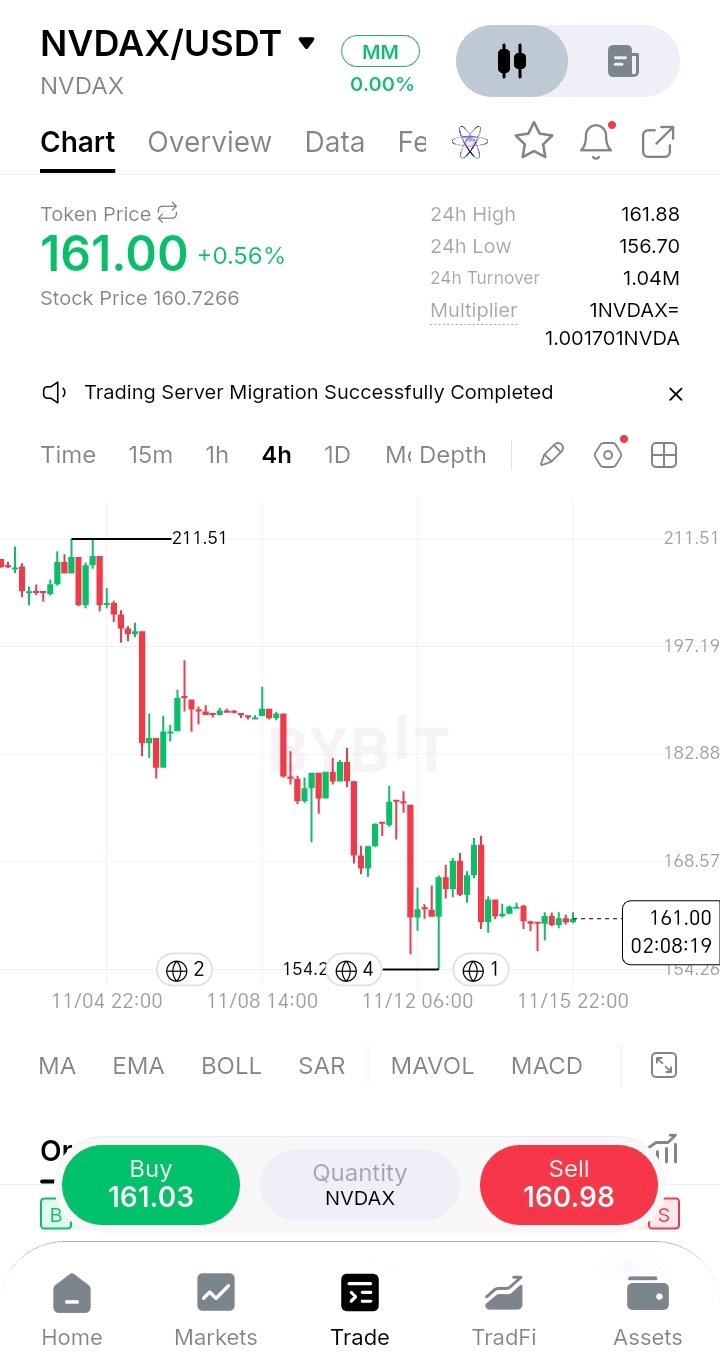
🧘 After a 27% slide, $NVDAX has gone almost silent. I don't want to call a bottom on $NVDAX just because candles got small. I want to see a 4H close above 168.57, because that's the first marked level that would break the sequence of lower highs. Here's what the 4H chart shows: 🔹 The slide: From the 211.51 high, price dropped to a low of about 154.2, roughly 27%, in a staircase of lower highs and lower lows. That's also well below the 186.64 close from the last NVDA chart. 🔹 The bounce: After the low, price recovered to the low 170s, was rejected, and has since pulled back to 161.00. 🔹 The silence: The last several candles are tiny and tightly packed. The 24H range is only 156.70 to 161.88, about 3.3%, so the market is waiting. 🔹 The token vs the stock: The token price is 161.00 and the underlying stock price is 160.7266, a gap of about 0.17%. The multiplier is 1 NVDAX = 1.0017 NVDA, so the token tracks the stock closely. 🔹 The market: $NVDAX trades around the clock, so it can move on weekends and overnight when the regular stock market is closed. 24H turnover is 1.04M. 🟢 Bullish: a 4H close above 168.57, then the low 170s where the last bounce failed. That would break the pattern of lower highs. 🔴 Bearish: a 4H close under 156.70 puts the 154.2 low back in play, with no marked support below it on this chart. Quiet charts after a big drop are decisions waiting to happen. The first close outside the range usually picks the side. Are you watching $NVDAX or another stock? #NVDAX #NVIDIA #Crypto #BinanceSquare #WSOT2026 #WSOTShowYourAITradeToEarn10USDT #JensenHuangExitTestsNvidiasAILeadership #USPPITestsTheHigherForLongerTrade #USInflationRunsHotAndRateHikeBetsRise $NVDAXUSDT $HYPEUSDT

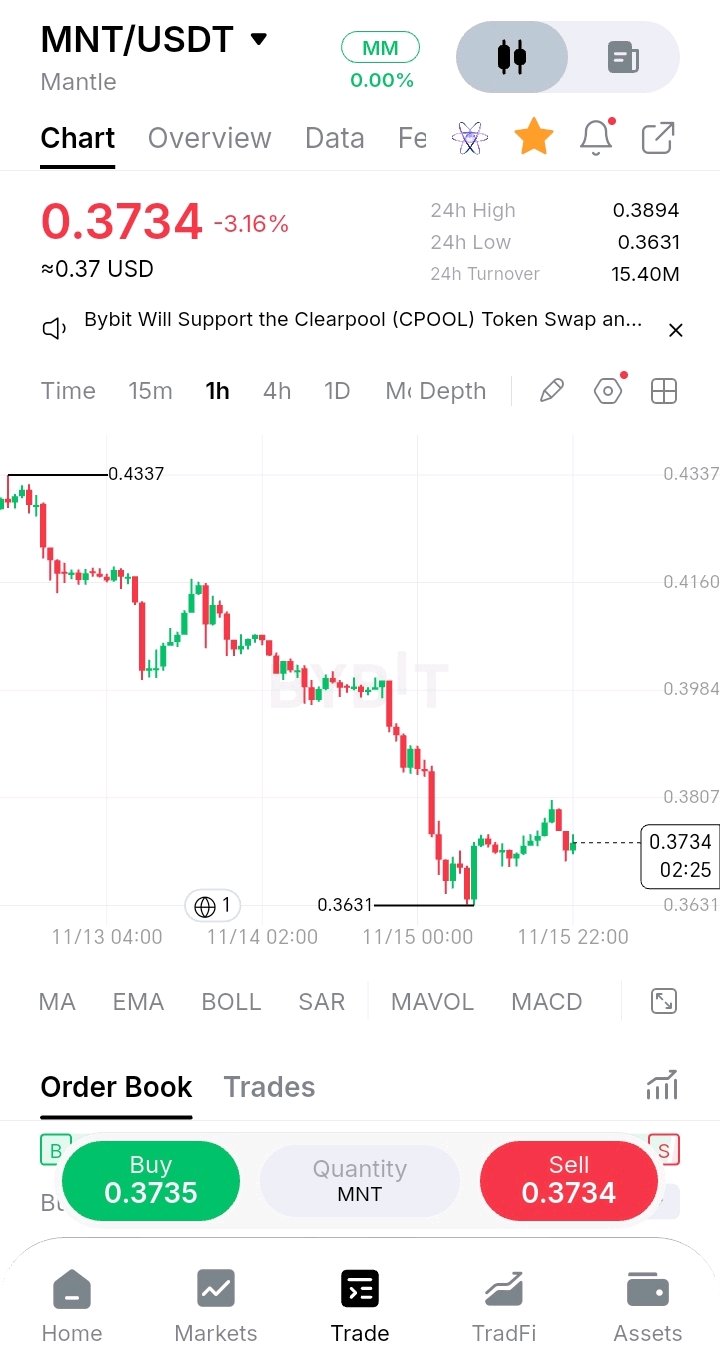
🪜 Every bounce on $MNT is getting smaller than the last. I don't want to buy $MNT just because it's down 16% and looks cheap. I want to see a 1H close above 0.3807, because that's the level that capped the latest bounce. Here's what the 1H chart shows: 🔹 The slide: From the 0.4337 high, $MNT has dropped to a low of 0.3631, about 16%, in a steady staircase of lower highs and lower lows. 🔹 The shrinking bounces: The first bounce reached about 0.4160, the next about 0.4075, then 0.3984, and the latest only reached 0.3807. Each recovery is shorter than the one before it. 🔹 The latest low: A sharp drop printed the 0.3631 low, followed by a V-shaped bounce of nearly 5%. Since then price has pulled back to 0.3734. 🔹 The range: 24H high 0.3894 and low 0.3631, with 24H turnover at 15.40M. The market is active, not quiet. 🔹 The support: 0.3631 is the lowest point on this chart. There is no marked support below it, so a break would be in open space. 🟢 Bullish: a 1H close above 0.3807, then 0.3984. Breaking the pattern of lower highs would be the first real sign of a change. 🔴 Bearish: a 1H close under 0.3631 extends the staircase with no marked floor nearby. Shrinking bounces show buyers losing strength. The first bounce that breaks the pattern is the one to watch. Are you watching $MNT or another coin? #MNT #Mantle #Crypto #BinanceSquare #WSOT2026 #WSOTShowYourAITradeToEarn10USDT #JensenHuangExitTestsNvidiasAILeadership #USPPITestsTheHigherForLongerTrade #USInflationRunsHotAndRateHikeBetsRise $MNTUSDT $BTCUSDT

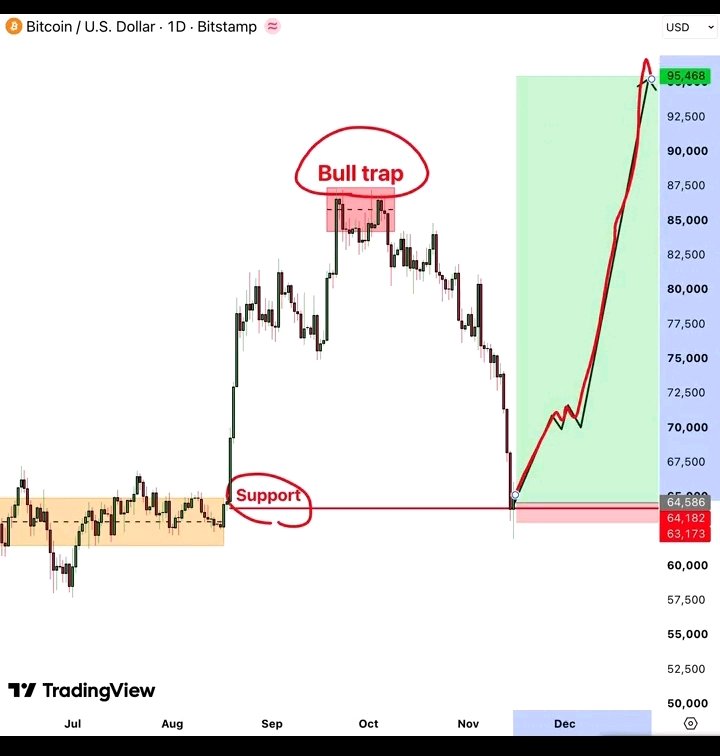
BITCOIN: THE $64K REACTION COULD CHANGE EVERYTHING Bitcoin's latest price action presents an interesting possibility: a major support region that previously acted as a launchpad may be preparing to play that role again. But this time, the market has something important to prove. The chart highlights a potential recovery structure around $64,586, a region that previously supported an extended period of consolidation before Bitcoin accelerated toward the $85K–$87K area. The recent decline back into this zone makes it particularly important for the next directional move. THE BULL TRAP LESSON The earlier rally toward $85K–$87K failed to establish sustainable strength. That rejection was followed by a prolonged decline, showing why a breakout alone is not enough. Buyers need follow-through, not just a temporary price spike. WHY $64,586 MATTERS This is the central support reference in the presented setup. If Bitcoin maintains acceptance above this region and starts building higher lows, the recovery scenario becomes more constructive. The nearby $63,173–$64,182 area represents the downside risk zone marked on the chart. THE POTENTIAL RECOVERY ROUTE The illustrated projection suggests several possible stages: - $70K–$72.5K: Initial recovery and momentum test. - $75K–$77.5K: Intermediate resistance region. - $82.5K–$85K: Stronger recovery challenge. - $95,468: Extended upside projection shown in the setup. These are projected reference areas, not confirmed targets. TRADE PERSPECTIVE A bullish position would require evidence that $64,586 is holding, followed by a convincing recovery and sustained buying pressure. A daily close below $63,173 would seriously weaken the illustrated bullish scenario. MY VIEW The most interesting part of this setup is not the projected move toward $95K. It is the possibility that an old consolidation region could become the foundation for a new recovery. Bitcoin must first demonstrate that buyers can defend this area. If that happens, the market may begin developing a very different structure from the one that produced the recent decline. Patience and confirmation matter here. A strong recovery needs a foundation before it can become a trend. #WSOTShowYourAITradeToEarn10USDT #JensenHuangExitTestsNvidiasAILeadership #USPPITestsTheHigherForLongerTrade #USInflationRunsHotAndRateHikeBetsRise #SanDiskAnnounces8For1StockSplit $BTCUSDT $HYPEUSDT
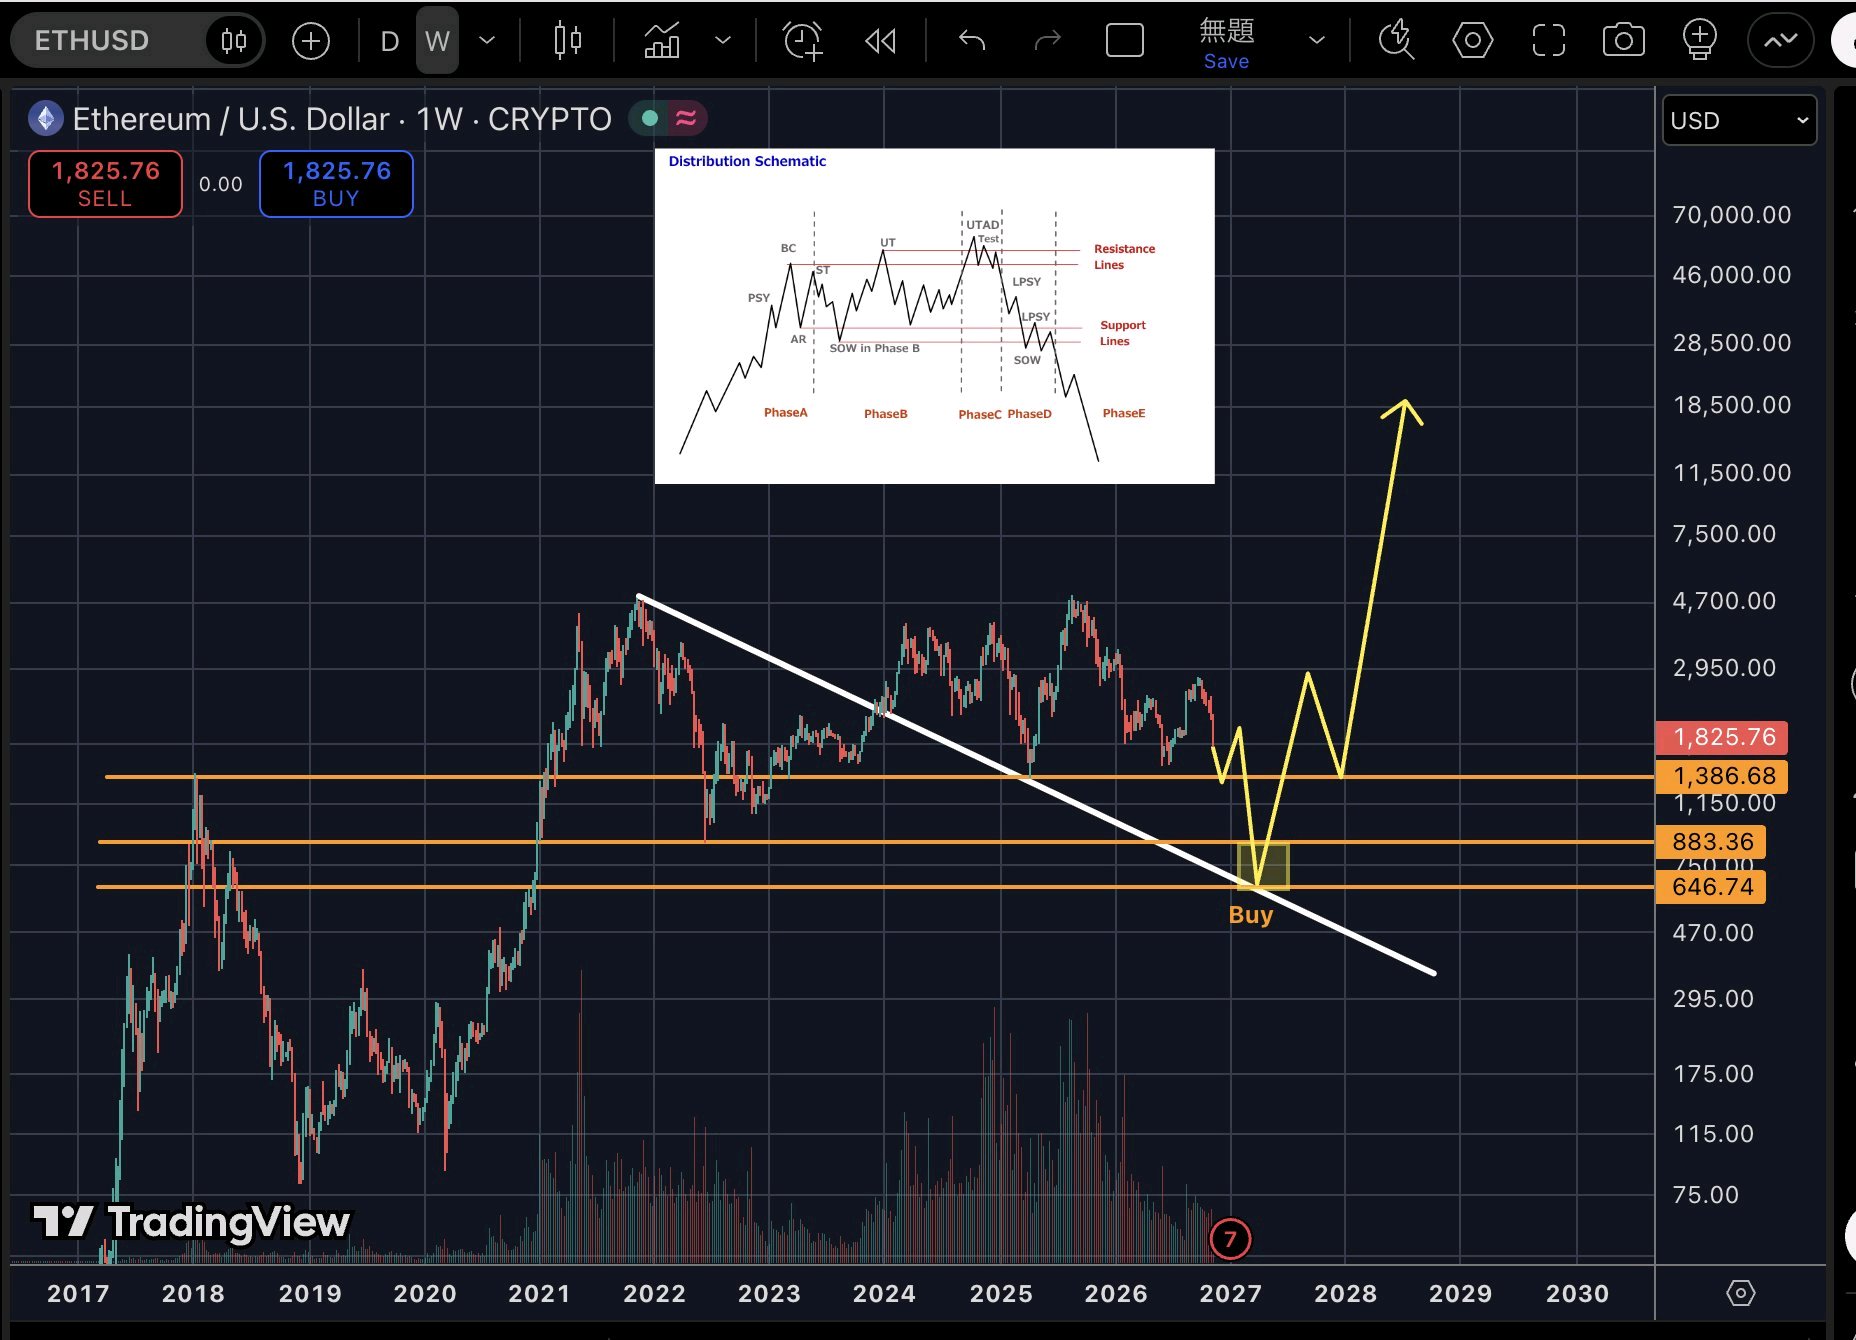
🗺️ Here's one map for $ETH, and it comes with a big "if". I don't want to assume ETH's bottom is already in. I want to see how it behaves at 1,386.68 on the weekly chart, because that's the first level that decides which map applies. Here's what this weekly chart shows: 🔹 The big picture: $ETH is at 1,825.76, about 60% below its peak near 4,800. The chart has been making lower highs since the 2025 top. 🔹 The ladder of levels: Three horizontal supports are marked below price, 1,386.68, 883.36 and 646.74. They sit about 24%, 52% and 65% under the current price. 🔹 The trendline: A falling line drawn from the 2021 peak has been touched several times and is projected to meet the lower levels in 2027. 🔹 The pattern: The chart overlays a Wyckoff distribution schematic. In that model, a long distribution is followed by a markdown phase before a new base forms. 🔹 The scenario: The plan marks a buy zone where the trendline meets the 646 to 883 area, followed by a recovery. That's a scenario, not a forecast, and it requires a very deep drop first. 🟢 Bullish: weekly closes that hold above 1,386.68 would mean the deeper scenario isn't playing out, with the current structure intact. 🔴 Bearish: a weekly close under 1,386.68 would open the path toward 883.36, and then the 646.74 zone. Long-term maps are useful for context, not for timing. The weekly closes at each level tell you what's actually happening. Are you watching $ETH or another coin? #ETH #Ethereum #Crypto #BinanceSquare #WSOT2026 #WSOTShowYourAITradeToEarn10USDT #JensenHuangExitTestsNvidiasAILeadership #USPPITestsTheHigherForLongerTrade #USInflationRunsHotAndRateHikeBetsRise $ETHUSDT $HYPEUSDT

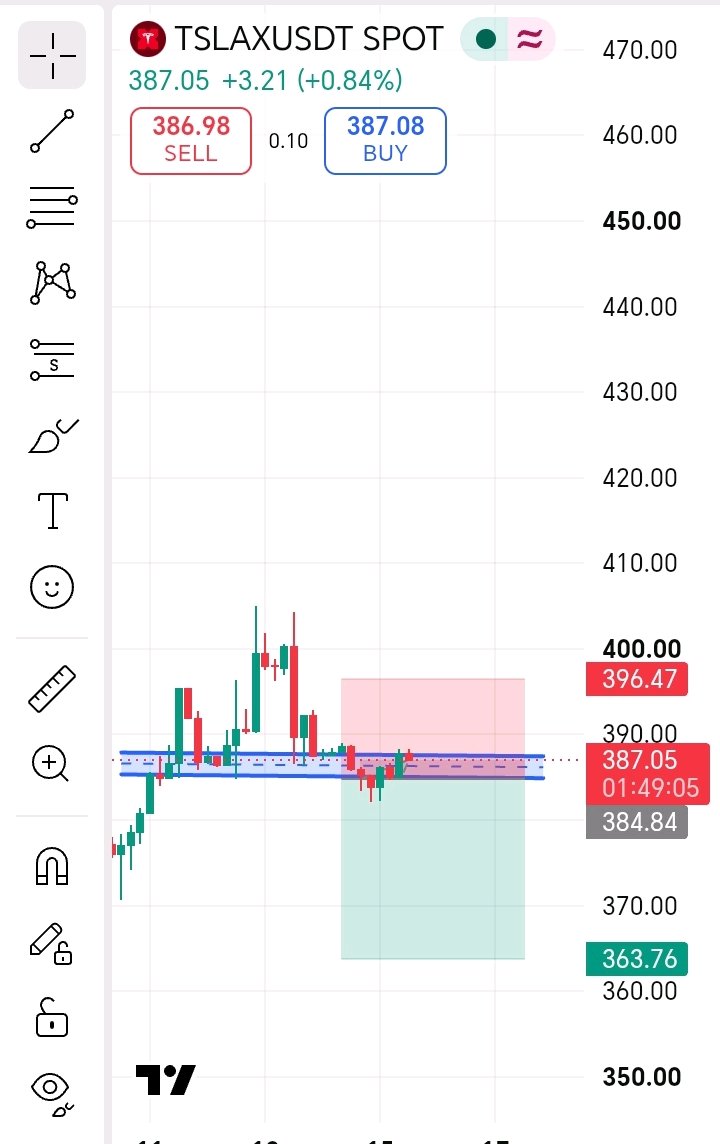
🎯 Price is back at the zone it couldn't hold, and this is where a short idea gets tested. I don't want to short $TSLAX just because price is sitting at resistance. I want to see a rejection that closes back under 384.84, because that's the level that would confirm sellers are defending the zone. Here's what this chart shows: 🔹 The zone: A tight band around 385 to 388 has been acting as a pivot. Price dipped under it to the low 380s, bounced, and is now back inside it at 387.05. 🔹 The context: Price recovered strongly from the lows, then peaked near 405 and has since been chopping sideways. The momentum from the rebound has slowed down. 🔹 The short idea: Entry near 384.84, stop at 396.47 above the recent range, target at 363.76. That's about 3% of risk for 5.5% of reward, or roughly 1:1.8. 🔹 The catch: The bounce back into the zone is still green, and price can easily push through. A stop 3% away only works if the position size matches it. 🔹 The market: $TSLAX is a tokenized stock that trades around the clock, so gaps and weekend moves can differ from regular market hours. 🔴 Bearish: a close under 384.84 with the zone rejected opens the move toward 363.76. 🟢 Bullish: a close above 396.47 invalidates the short idea, with the 405 high as the next reference. A zone only matters if price reacts to it. The next close tells us which way. Are you watching $TSLAX or another stock? #TSLAX #Tesla #Crypto #BinanceSquare #WSOT2026 #WSOTShowYourAITradeToEarn10USDT #JensenHuangExitTestsNvidiasAILeadership #USPPITestsTheHigherForLongerTrade #USInflationRunsHotAndRateHikeBetsRise $TSLAXUSDT $BTCUSDT

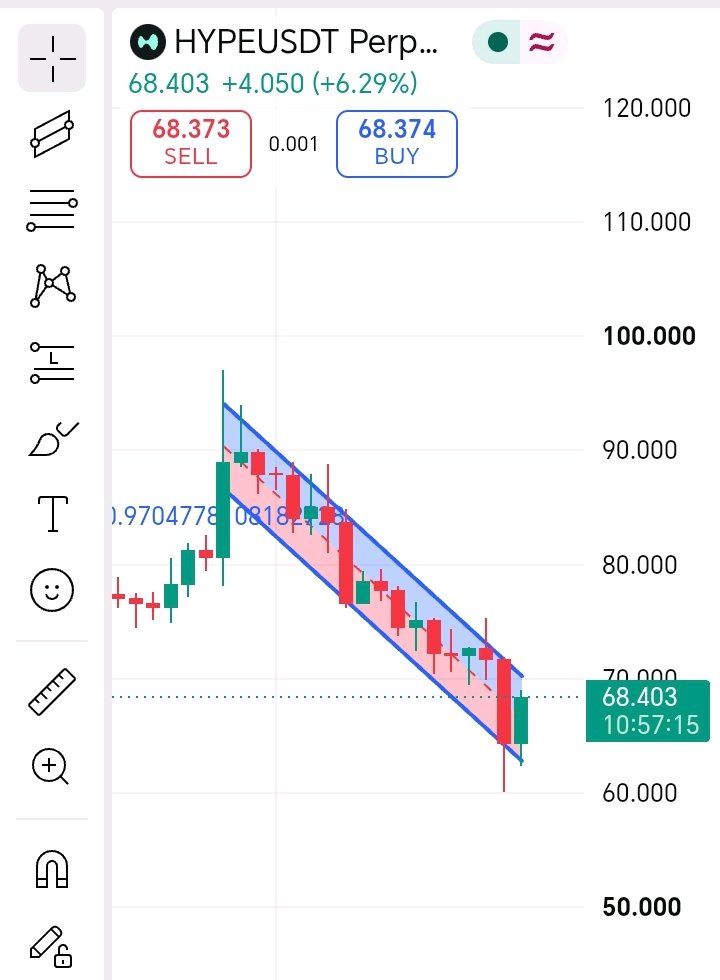
🪝 Price dipped below the channel, then got pulled right back in. I don't want to call a trend change on $HYPE just because of one big green candle. I want to see a close above the upper channel line near 70 to 71, because that's what would actually break the downtrend. Here's what this chart shows: 🔹 The channel: Since the peak near 97, $HYPE has moved inside a clean falling channel, with lower highs and lower lows, each bounce capped by the upper line. 🔹 The dip below: The previous candle pushed below the lower channel line and wicked all the way down to about 60. That's a drop of roughly 38% from the peak, and it came with a sharp flush. 🔹 The snap-back: The latest candle is green, up 6.29%, and closed back inside the channel at 68.40. A move below a channel that immediately reverses is often called a false breakdown. 🔹 The position: Price is now in the upper part of the channel, about 3% under the upper line. That's the first real test. 🔹 The bounce size: From the 60 wick low, price has recovered about 14%. That's a strong reaction, but it's still a bounce inside a downtrend until the channel breaks. 🟢 Bullish: a close above 70 to 71, the upper channel line. That would end the pattern of lower highs and turn the false breakdown into a real reversal signal. 🔴 Bearish: a close back under the lower line near 62 to 63, and especially under 60. That would confirm the wick was only a pause. A false breakdown can start a reversal, but the channel only breaks when the upper line does. Are you watching $HYPE or another coin? #HYPE #Hyperliquid #Crypto #BinanceSquare #WSOT2026 #WSOTShowYourAITradeToEarn10USDT #JensenHuangExitTestsNvidiasAILeadership #USPPITestsTheHigherForLongerTrade #USInflationRunsHotAndRateHikeBetsRise $HYPEUSDT $BTCUSDT

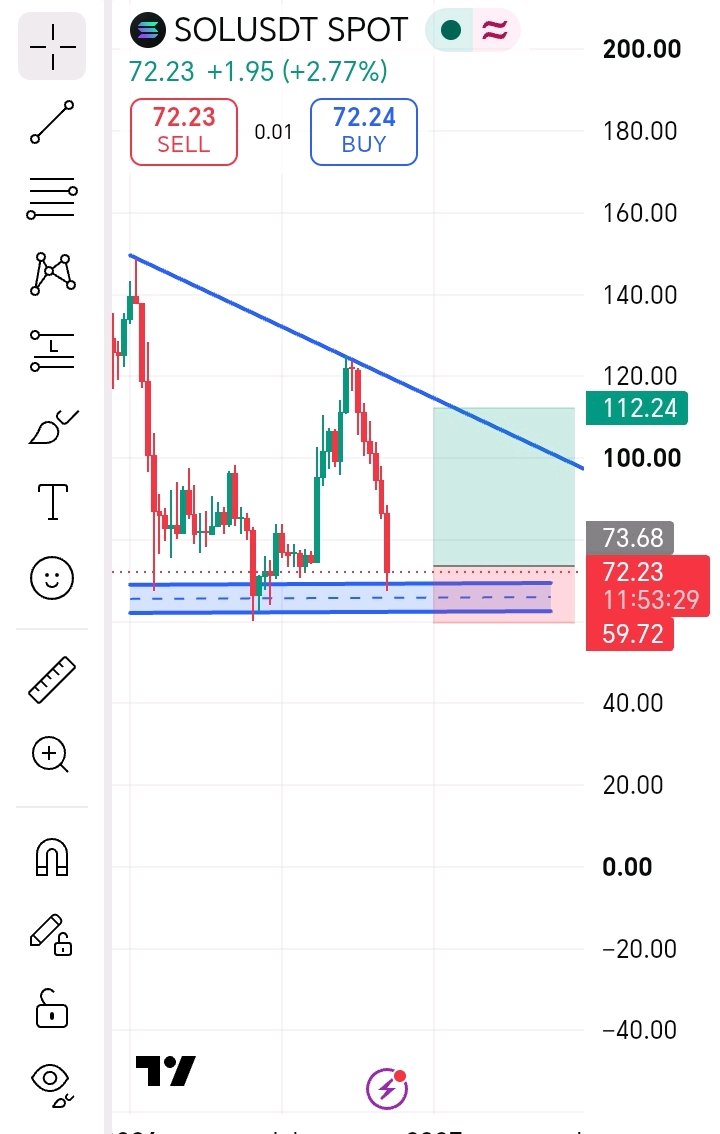
⚖️ A flat floor and a falling ceiling: $SOL is squeezing into a descending triangle. I don't want to buy the floor just because it has held before. I want to see $SOL reclaim 73.68 and hold it, because that's what would show buyers are defending the zone again. Here's what this chart shows: 🔹 The floor: A flat support zone around 62 to 69 has been tested several times. Each time, price bounced, but the bounces have gotten weaker. 🔹 The ceiling: A falling trendline connects the lower highs from the early peak near 150, through the rejection near 125, and down toward the 100 area. Sellers keep showing up at lower prices. 🔹 The pattern: That's a descending triangle, a flat bottom with falling highs. It's often a bearish pattern because the floor gets tested more and more, but it can also resolve up if buyers defend it. 🔹 The price now: $SOL is at 72.23, up 2.77% on the day, sitting just above the zone. 🔹 The trade math: A long from 73.68 with a stop at 59.72 and a target at 112.24 works out to about 1:2.8. The stop is about 19% away, so position size matters. 🟢 Bullish: a close back above 73.68, then the 90s, and the falling trendline near 100 to 112 as the bigger target. 🔴 Bearish: a close under the zone near 62, and especially under 59.72. A breakdown from a descending triangle often targets a move similar to the pattern's height. The floor has held so far. The question is whether it holds a fourth time. Are you watching $SOL or another coin? #SOL #Solana #Crypto #BinanceSquare #WSOT2026 #byx #WSOTShowYourAITradeToEarn10USDT #JensenHuangExitTestsNvidiasAILeadership #USPPITestsTheHigherForLongerTrade #USInflationRunsHotAndRateHikeBetsRise

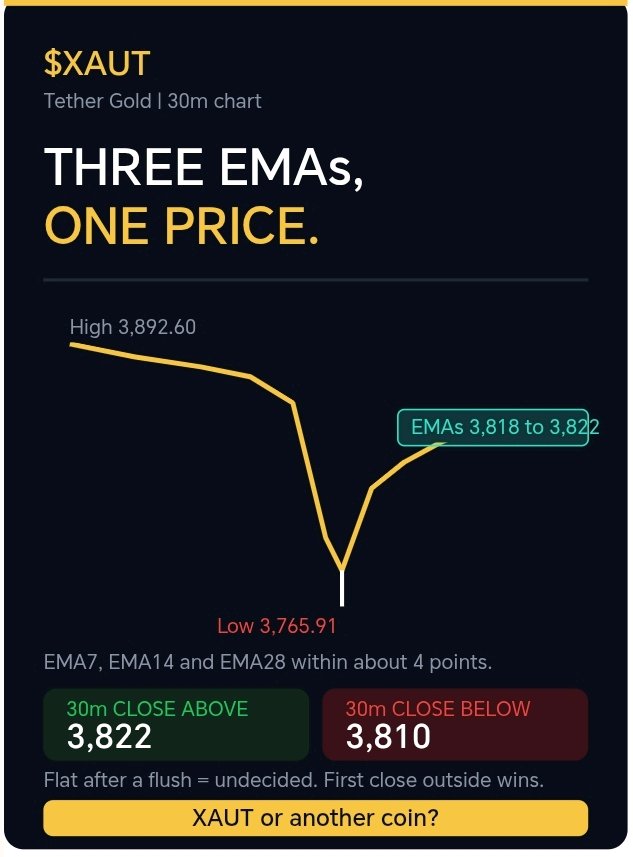
🧲 Three EMAs, one price, and nothing between them. I don't want to guess the direction of $XAUT when the 30m chart has gone this flat. I want to see a 30m close outside the 3,810 to 3,822 cluster, because that's where the next real move starts. Here's what the 30m chart shows: 🔹 The flush: Gold dropped from the 3,892.60 area and printed a low of 3,765.91 with a long wick. That's below the 3,872.51 base from last week and about 9% under the 4,128 range high. 🔹 The rebound: Price recovered about 1.4% to the 3,834 area, then stalled and has been drifting flat. 🔹 The cluster: EMA7 is 3,818.70, EMA14 3,818.17 and EMA28 3,822.07. All three sit within about 4 points of each other, and price is right on top of them at 3,817.01. That's an unusually tight squeeze. 🔹 The bands: Upper 3,839.25 | Mid 3,810.32 | Lower 3,781.39. They're narrowing after the volatility spike, which fits the flat price. 🔹 The range: 24H high 3,871.27 and low 3,765.91, with turnover at 13.33M. The big move already happened. Now the market is deciding what to do with it. 🟢 Bullish: a 30m close above 3,822, then the upper band at 3,839 and the 3,870 level. That would turn the flat stretch into a recovery. 🔴 Bearish: a 30m close under 3,810 puts the lower band at 3,781 and the 3,765.91 low in play. Flat averages after a big flush mean the market is undecided. The first close outside the cluster usually picks the direction. Are you watching $XAUT or another coin? #XAUT #Gold #Crypto #BinanceSquare #WSOTShowYourAITradeToEarn10USDT #WSOT2026 #JensenHuangExitTestsNvidiasAILeadership #USPPITestsTheHigherForLongerTrade #USInflationRunsHotAndRateHikeBetsRise $XAUTUSDT $BTCUSDT

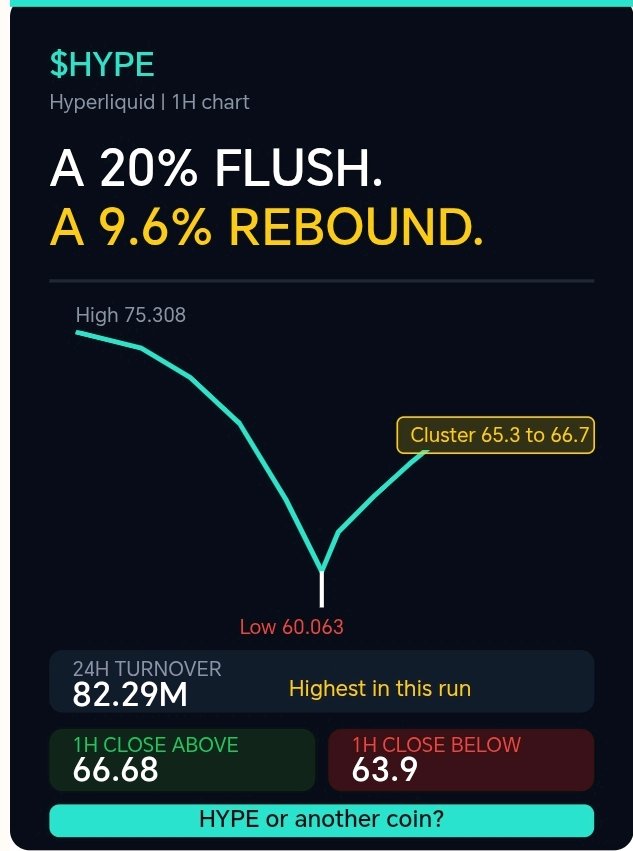
🌊 A 20% flush, a 9.6% rebound, and the biggest volume in a while. I don't want to call the low on $HYPE just because the wick was dramatic. I want to see a 1H close above 66.68, because that's where the rebound has to break through to mean something. Here's what the 1H chart shows: 🔹 The flush: From the 75.308 high, $HYPE dropped to 60.063, about 20%, with the final leg ending in a long red wick that looks like a forced selloff. 🔹 The rebound: Buyers stepped in at the low and price recovered to around 66.6, a gain of nearly 10% off the bottom. It has since pulled back slightly to 65.85. 🔹 The volume: 24H turnover is 82.29M, the highest in this run and well above the 25M to 53M range of the last few sessions. Big flushes tend to come with big volume. 🔹 The cluster: EMA7 65.28, EMA14 65.44, the Bollinger mid 65.72 and EMA28 66.68 are all bunched within about 2% of price. The rebound has run straight into them. 🔹 The bands: Upper 69.76 | Lower 61.68. Volatility is high, so moves in either direction can be sharp. 🔹 The context: Even after the bounce, price is still about 12% below the 75.3 high, and the broader trend has been down. 🟢 Bullish: a 1H close above 66.68, then 67.8 and the upper band near 69.8. That would turn the flush into a trap for sellers. 🔴 Bearish: a 1H close under 63.9 puts the 60.063 low back in play, and a break there extends the slide. Flushes can mark exhaustion, or just a pause. The next few 1H closes after the rebound will tell us which one this is. Are you watching $HYPE or another coin? #HYPE #Crypto #BinanceSquare #WSOT2026 #WSOTShowYourAITradeToEarn10USDT #JensenHuangExitTestsNvidiasAILeadership #USPPITestsTheHigherForLongerTrade #USInflationRunsHotAndRateHikeBetsRise $HYPEUSDT $BTCUSDT
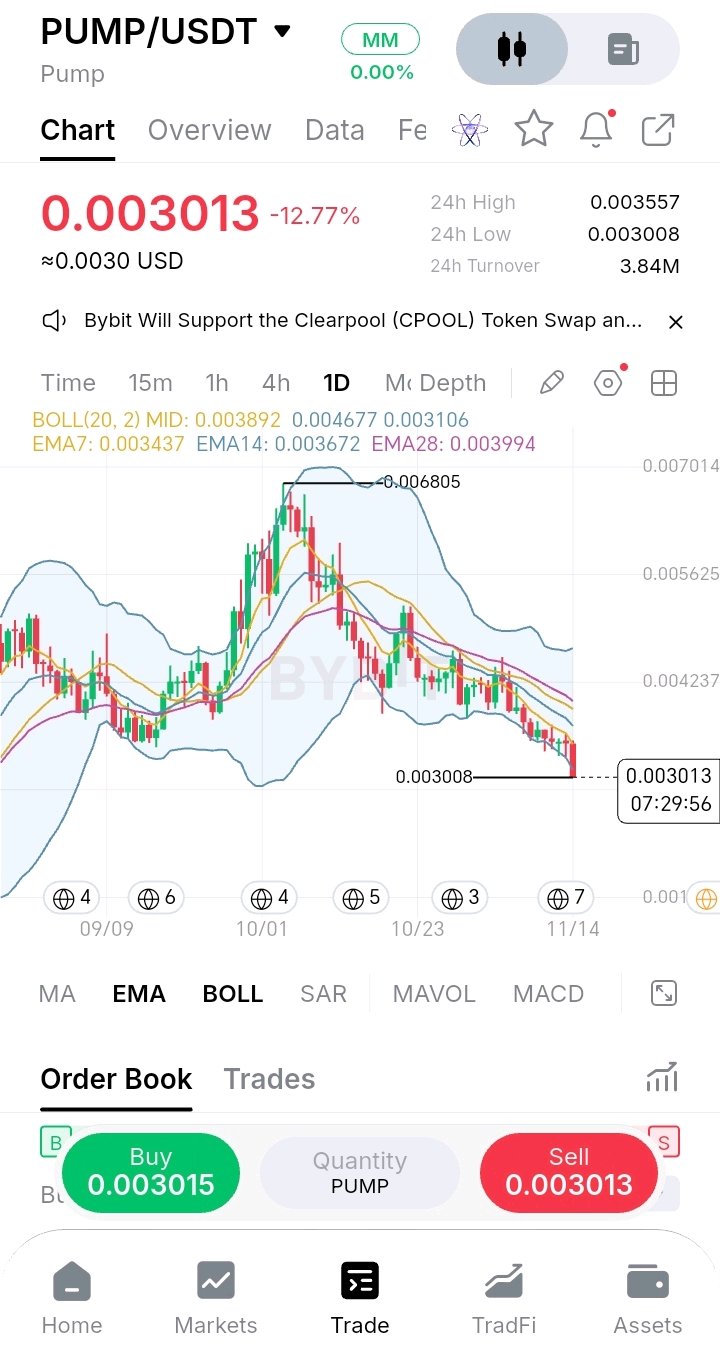
🧨 One 12.8% red candle just punched through the lower Bollinger Band. I don't want to buy $PUMP just because it's down more than half from its high. I want to see a daily close back above 0.003106, because that would put price back inside the bands and show this move was stretched. Here's what the daily chart shows: 🔹 The big candle: Today's daily candle is down 12.77% and is trading at 0.003013, just above the 0.003008 low of the day. 🔹 The band break: The lower Bollinger Band is at 0.003106 and price has dropped below it. That's an extended move, and extended moves can snap back or keep running. 🔹 The slide: From the 0.006805 high, $PUMP is down about 56%, with lower highs and lower lows all the way. Today's low is the lowest level visible on this chart. 🔹 The averages: EMA7 0.003437, EMA14 0.003672 and EMA28 0.003994, with the Bollinger mid at 0.003892. All slope down and sit above price. The nearest one is about 14% away. 🔹 The activity: 24H turnover is 3.84M, with a range of 0.003008 to 0.003557. The move came with real participation. 🔹 The support: There isn't much marked support below 0.0030 on this chart, so a break gives price very little to lean on. 🟢 Bullish: a daily close back above 0.003106, then 0.003437 (EMA7). Reclaiming EMA7 would show sellers are losing control. 🔴 Bearish: a daily close under 0.003008 keeps the downtrend intact with no marked floor nearby. The daily candle is still open, so the close matters more than the swing. Are you watching $PUMP or another coin? #PUMP #Crypto #BinanceSquare #WSOTShowYourAITradeToEarn10USDT #WSOT2026 #JensenHuangExitTestsNvidiasAILeadership #USPPITestsTheHigherForLongerTrade #USInflationRunsHotAndRateHikeBetsRise $PUMPUSDT $TRUMPUSDT

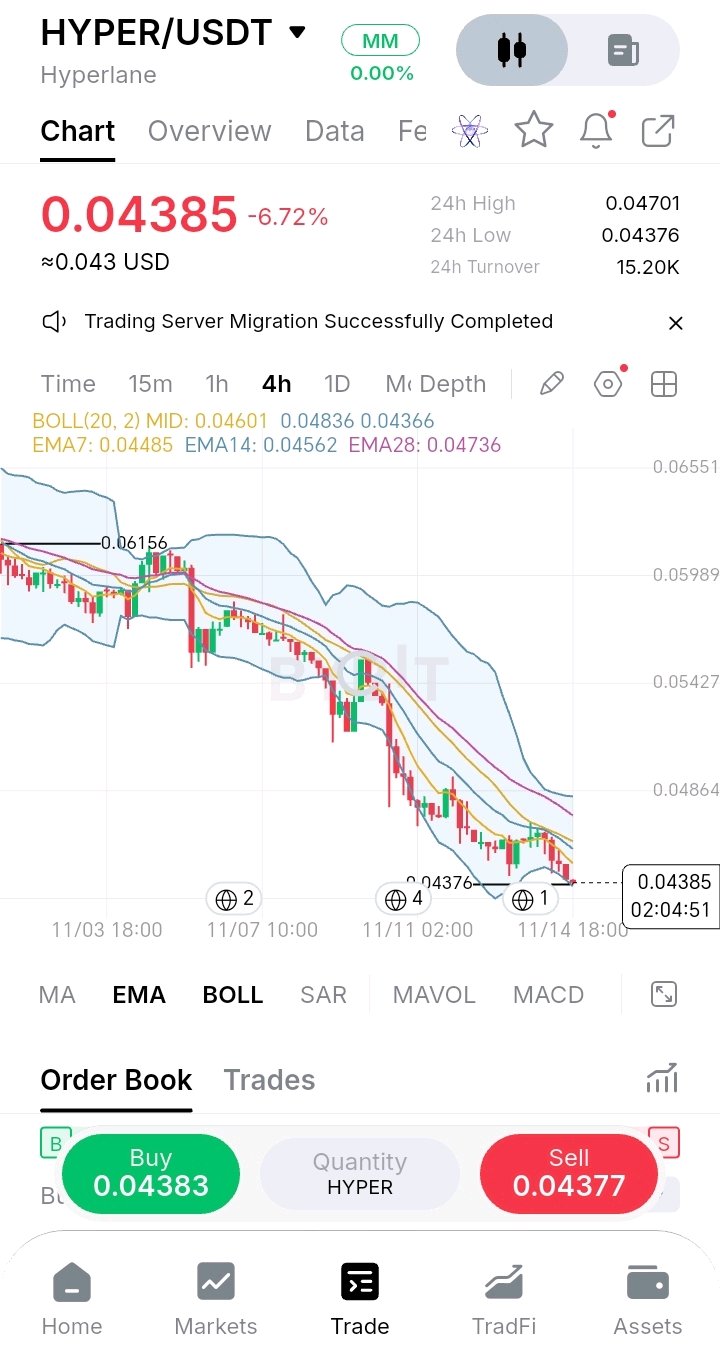
🥀 The green shoot didn't survive. I don't want to buy $HYPER just because it's down another 6.7% and looks cheap. I want to see a 4H close above 0.04485 (EMA7), because that's the first sign the bounce attempt is back. Here's what the 4H chart shows: 🔹 The failed bounce: Price recovered to the 0.047 area, right under the Bollinger mid-band, and got rejected. It then gave back the whole move. 🔹 The new low: The 0.04420 low from before has broken. The latest low is 0.04376, and price is trading at 0.04385, sitting on the lower band at 0.04366. 🔹 The slide: From the 0.06156 high on this chart, price is down about 29%, still making lower highs and lower lows. 🔹 The averages: EMA7 0.04485, EMA14 0.04562 and EMA28 0.04736, all above price and sloping down. The Bollinger mid at 0.04601 is the next ceiling. 🔹 The liquidity: 24H turnover is only 15.20K, thinner than before. A market this small can gap and slip, in both directions. 🔹 The range: 24H high 0.04701 and low 0.04376, a swing of about 7%. 🟢 Bullish: a 4H close above 0.04485, then 0.04562 and 0.04601. Reclaiming the mid-band would turn this into a failed breakdown. 🔴 Bearish: a 4H close under 0.04366 and there is very little marked support below on this chart. One rejected bounce doesn't end a downtrend, but it shows who is in control. On a market this thin, size small and keep a stop. Are you watching $HYPER or another coin? #HYPER #Hyperlane #Crypto #BinanceSquare #WSOTShowYourAITradeToEarn10USDT #JensenHuangExitTestsNvidiasAILeadership #USPPITestsTheHigherForLongerTrade #USInflationRunsHotAndRateHikeBetsRise #WSOT2026 $HYPERUSDT $BTCUSDT

The Bybit Stockholm Open, on and off court 🎾 Our VIPs got their turn on court, fans picked up exclusive merch at the booth, and one winner had €1,000 to celebrate. An unforgettable event filled with thrilling matches, amazing energy, and unforgettable moments for everyone involved! 🏆✨ #WSOTShowYourAITradeToEarn10USDT #JensenHuangExitTestsNvidiasAILeadership #USPPITestsTheHigherForLongerTrade #USInflationRunsHotAndRateHikeBetsRise #SanDiskAnnounces8For1StockSplit $HYPEUSDT $BTCUSDT

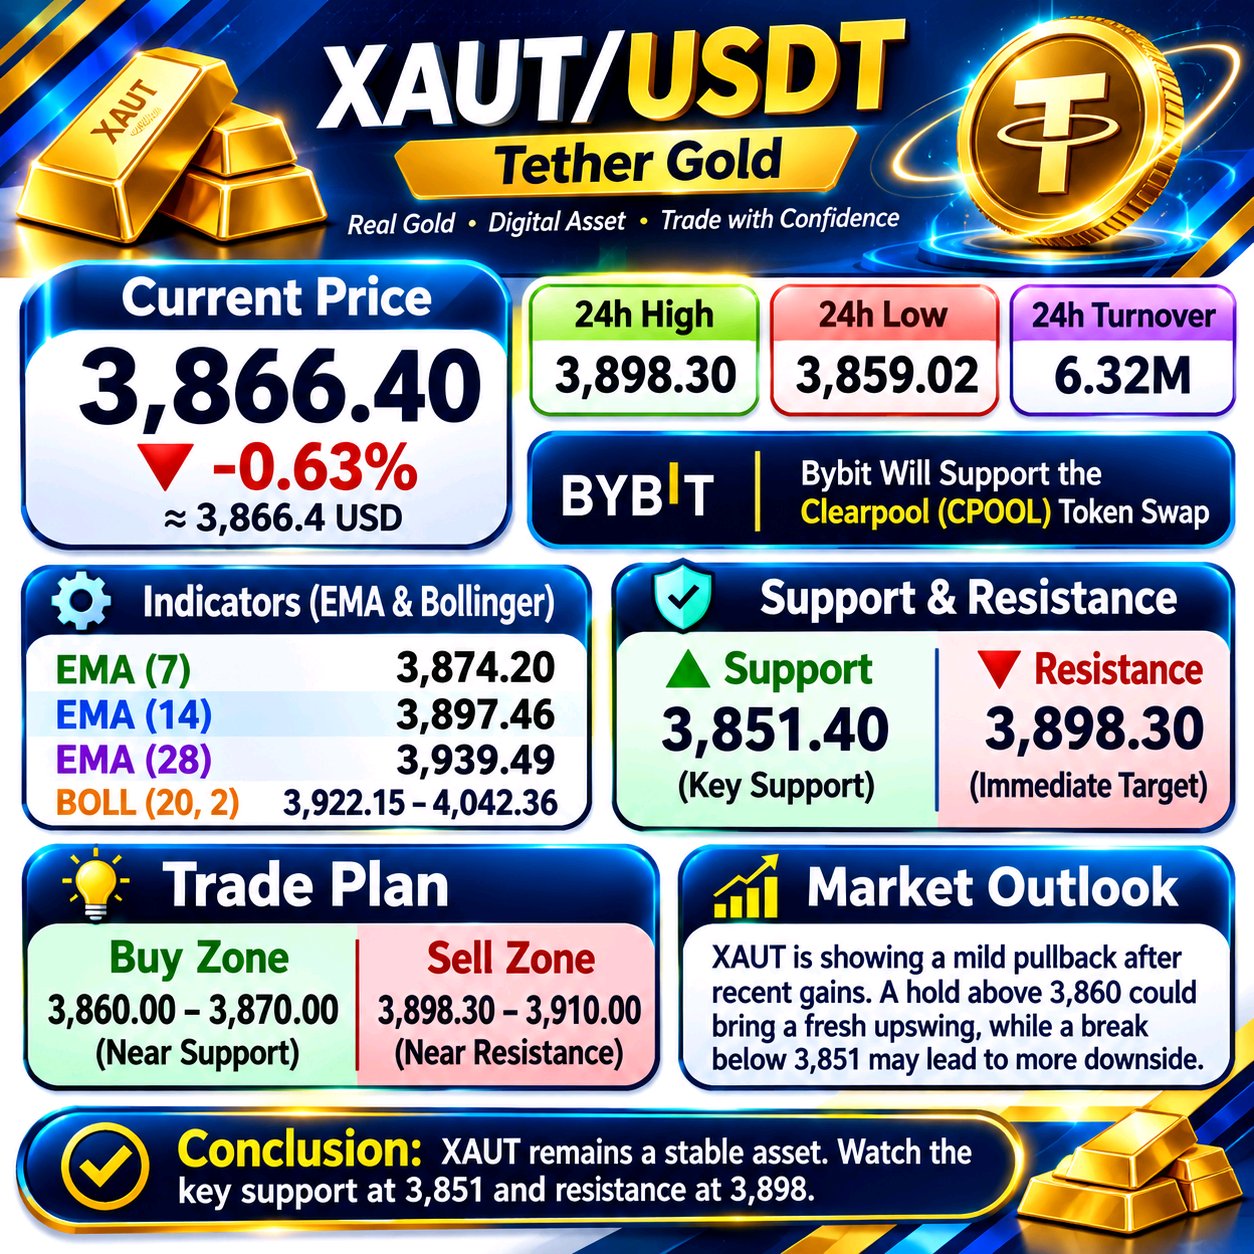
XAUT: GOLD IS TESTING BUYER CONFIDENCE Gold-backed crypto assets can experience short-term selling pressure even when their underlying value proposition remains attractive. XAUT is currently showing that difference between long-term asset exposure and short-term market momentum. At $3,866.40, XAUT is down 0.63% over 24 hours. The latest 4-hour structure shows a considerable decline from the previous high near $4,130.11. After reaching the $3,851.40 low, price attempted to stabilize, but the recovery has not yet developed enough strength to change the broader direction. THE TECHNICAL PICTURE Three moving averages are currently positioned above price: EMA 7 at $3,874.20, EMA 14 at $3,897.46 and EMA 28 at $3,939.49. This arrangement indicates that sellers still have the advantage in the short-term structure. The Bollinger middle line at $3,922.15 also represents an important recovery threshold. IMPORTANT PRICE BOUNDARIES The $3,859–$3,851 region is the immediate support area. If buyers defend this zone and reclaim $3,874, the market could attempt a recovery toward $3,897–$3,898. A stronger move above that region may bring $3,922 into focus. However, a sustained break below $3,851.40 could expose the lower Bollinger region around $3,801.94. That would suggest the current consolidation has failed to attract sufficient buying demand. TRADE STRATEGY A long position would become more interesting after a confirmed recovery above $3,898, with $3,922 and $3,939 as potential upside reference levels. For a short setup, a rejection around $3,897–$3,922 or a confirmed breakdown below $3,851.40 would provide a more convincing bearish scenario. MARKET SENTIMENT One notable detail is the displayed order-book imbalance: 96% sell-side against 4% buy-side. This indicates substantial selling interest in that snapshot, although order-book percentages can change rapidly and do not guarantee the next price movement. The reported 24-hour turnover is approximately $6.32M. FINAL PERSPECTIVE XAUT is at a point where defending the recent low matters more than producing a temporary bounce. The asset still offers exposure to gold through a digital format, but its trading price can fluctuate. I would look for stronger buyer participation and a recovery above the moving averages before treating this decline as finished. Patience and confirmation are especially important in the current conditions. #WSOTShowYourAITradeToEarn10USDT #JensenHuangExitTestsNvidiasAILeadership #USPPITestsTheHigherForLongerTrade #USInflationRunsHotAndRateHikeBetsRise #SanDiskAnnounces8For1StockSplit $XAUTUSDT $BTCUSDT
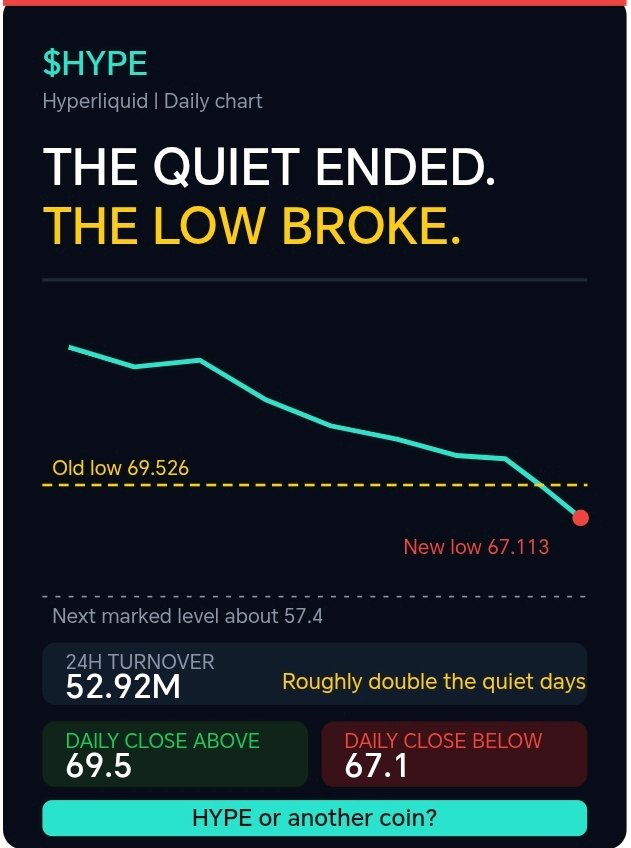
🔔 The quiet just ended, and the 69.5 low went with it. I don't want to call this drop capitulation on $HYPE. I want to see a daily close back above 69.5, because that would turn this break into a trap instead of a trend. Here's what the daily chart shows: 🔹 The break: For days, the 69.526 low was the line everyone watched. Today's candle dropped to 67.113, below it, and is still trading under it at around 69.05. 🔹 The swing: The 24H range is 67.113 to 75.308, about 11%. After a few calm sessions, the volatility is back. 🔹 The volume: 24H turnover is 52.92M, roughly double the recent quiet days. That means the move came with real participation, not a drift. 🔹 The averages: EMA7 is 72.82, EMA14 75.62 and EMA28 78.44, with the Bollinger mid at 79.44. All of them slope down and sit above price. 🔹 The band: Lower Bollinger is 66.83, just under today's low. Price is stretched near it. 🔹 The order book: Asks are about 60% vs 40% bids, a modest sell lean. 🔹 The gap below: On this chart, the next marked level is around 57.4, about 17% under here. 🟢 Bullish: a daily close back above 69.5, then 72.8. That would make today's low a failed breakdown. 🔴 Bearish: a daily close under 67.1 and the lower band near 66.8 opens the way toward the 57.4 area. The daily candle is still open, so the close matters more than any single swing. Are you watching $HYPE or another coin? #HYPE #Crypto #BinanceSquare #WSOTShowYourAITradeToEarn10USDT #JensenHuangExitTestsNvidiasAILeadership #USPPITestsTheHigherForLongerTrade #USInflationRunsHotAndRateHikeBetsRise #SanDiskAnnounces8For1StockSplit $HYPEUSDT $BTCUSDT

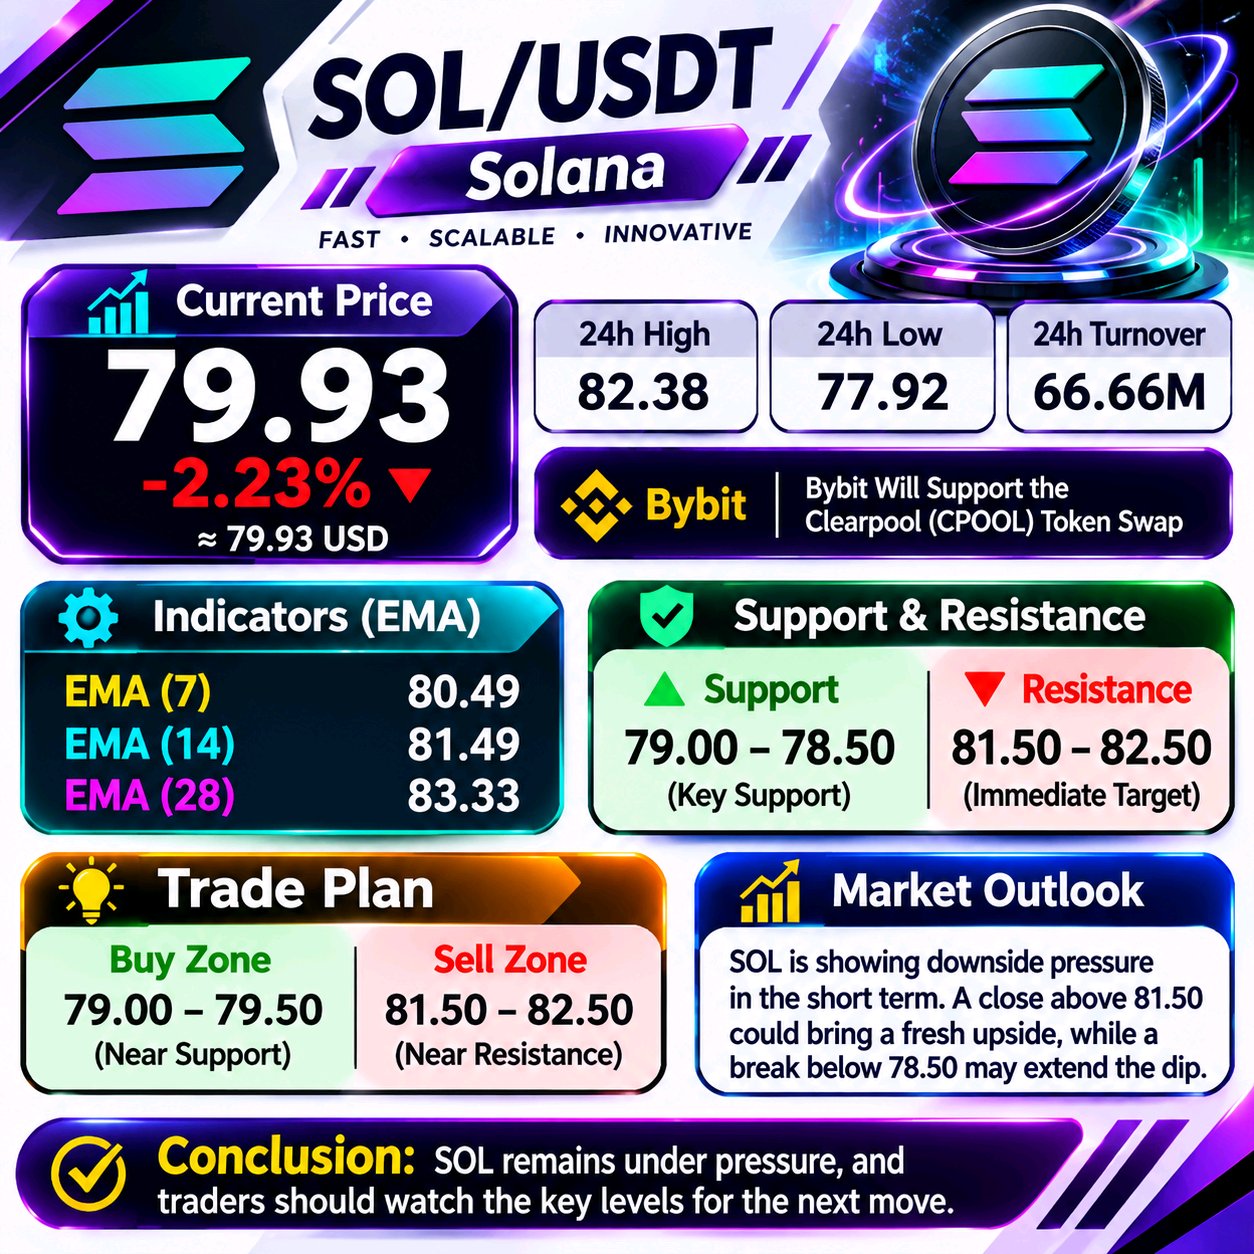
SOLANA IS FACING A TOUGH MARKET TEST Solana is going through a period where sellers are controlling the broader price structure. At $79.93, SOL is down 2.23% over 24 hours, and the gap between its current price and the higher moving averages shows that buyers still have work to do before a meaningful trend recovery can develop. UNDERSTANDING THE CURRENT STRUCTURE The 4-hour indicators show EMA 7 at $80.49, EMA 14 at $81.49 and EMA 28 at $83.33. All three are above the current price, creating multiple resistance points. The Bollinger middle line at $82.24 also reinforces the overhead pressure. However, the recent low of $77.92 has attracted some buying interest. This suggests that sellers have not yet achieved a decisive breakdown. WHERE THE NEXT MOVE COULD DEVELOP The $77.92–$78.50 region is the first important support area. If buyers defend this zone and price moves back above $80.50, a recovery toward $81.49 and $82.24 becomes possible. On the other hand, a confirmed breakdown below $77.92 could expose SOL to additional downside pressure. For a stronger bullish recovery, buyers would need to reclaim $83.33 and sustain their momentum beyond it. TRADING APPROACH A cautious long setup would require a confirmed recovery above $80.50, with $81.49 and $82.24 as potential objectives. For a short setup, a failed rebound near $81.49–$83.33 or a confirmed support breakdown would provide a more convincing bearish scenario. MARKET PARTICIPATION The 24-hour turnover stands at approximately $66.66M. The order-book snapshot also shows 81% sell-side versus 19% buy-side, indicating heavier displayed selling interest at that moment. Order-book figures can change quickly and should not be treated as a guarantee of future direction. FINAL VIEW SOL needs to overcome several layers of resistance before its recovery can be trusted. Until that happens, protecting capital and waiting for price confirmation may be more effective than entering trades based on short-term excitement. The reaction around $77.92 and $80.50 will be particularly important for understanding the next phase. #WSOTShowYourAITradeToEarn10USDT #JensenHuangExitTestsNvidiasAILeadership #USPPITestsTheHigherForLongerTrade #USInflationRunsHotAndRateHikeBetsRise #SanDiskAnnounces8For1StockSplit $SOLUSDT $BTCUSDT

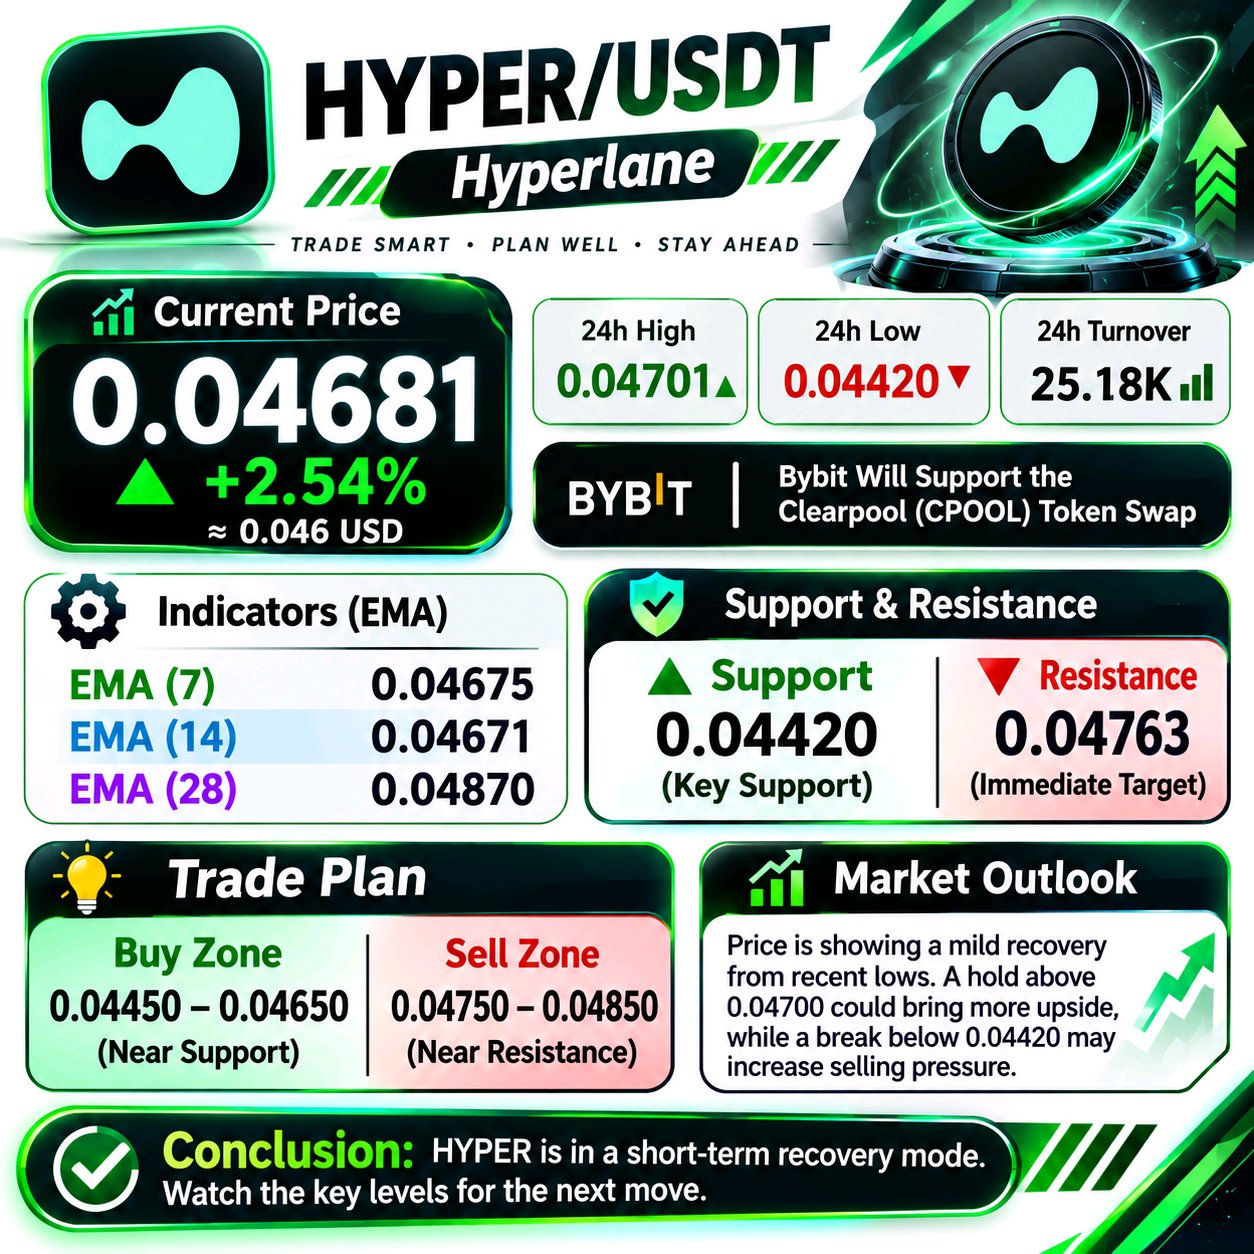
🌱 First green shoot after a 36% slide, but it's a very small one. I don't want to chase a +2.5% candle on $HYPER without more proof. I want to see a 4H close above 0.04704 (mid-band), because that would turn a bounce into a real attempt at a recovery. Here's what the 4H chart shows: 🔹 The slide: $HYPER fell from 0.06904 to a low of 0.04420, about 36%, in a steady staircase of lower highs and lower lows. 🔹 The bounce: Price touched the lower Bollinger Band area, printed the 0.04420 low, and has recovered about 6% to 0.04681. The latest candle closed back above EMA7 (0.04619) and right at EMA14 (0.04680). 🔹 The ceiling: The Bollinger mid at 0.04704 and EMA28 at 0.04870 sit just above. Both slope down and are the first real tests. 🔹 The bands: Upper 0.04961 | Mid 0.04704 | Lower 0.04447. The channel has narrowed since the selloff, which fits a pause after a long fall. 🔹 The order book: Asks are about 67% vs 33% bids. Sellers are still leaning on it, so the bounce hasn't convinced the book yet. 🔹 The liquidity: 24H turnover is only 25.18K. That's extremely thin. Price can jump or drop quickly on small orders, and slippage can be large. 🟢 Bullish: a 4H close above 0.04704, then 0.04870 and 0.04961. That would show the downtrend is losing control. 🔴 Bearish: a close under 0.04619, then the lower band at 0.04447 and the 0.04420 low. A break there continues the slide. One green candle in a downtrend is a spark, not a fire. On a market this thin, size small and respect your stop. Are you watching $HYPER or another coin? #HYPER #Hyperlane #Crypto #BinanceSquare #WSOT2026 #WSOTShowYourAITradeToEarn10USDT #JensenHuangExitTestsNvidiasAILeadership #USPPITestsTheHigherForLongerTrade #USInflationRunsHotAndRateHikeBetsRise $HYPERUSDT $HYPEUSDT

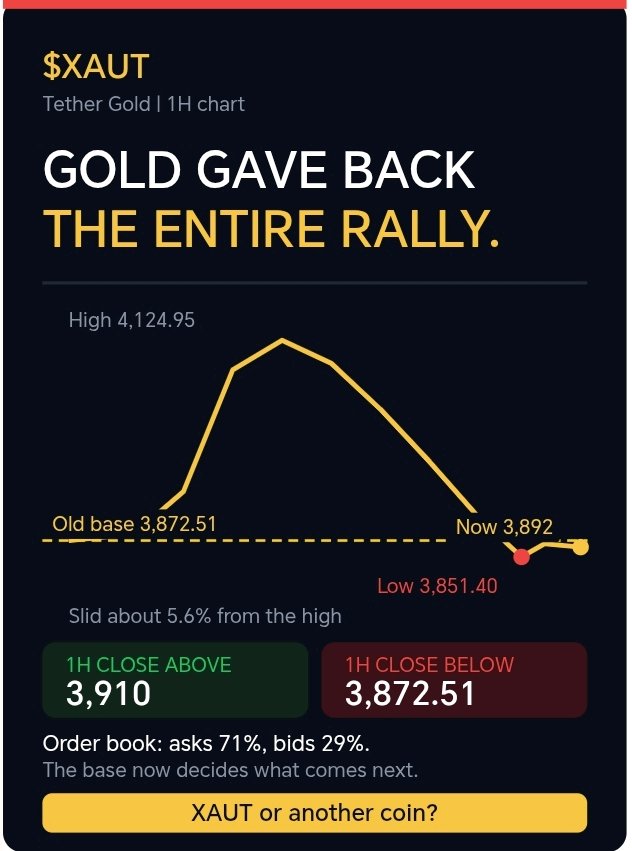
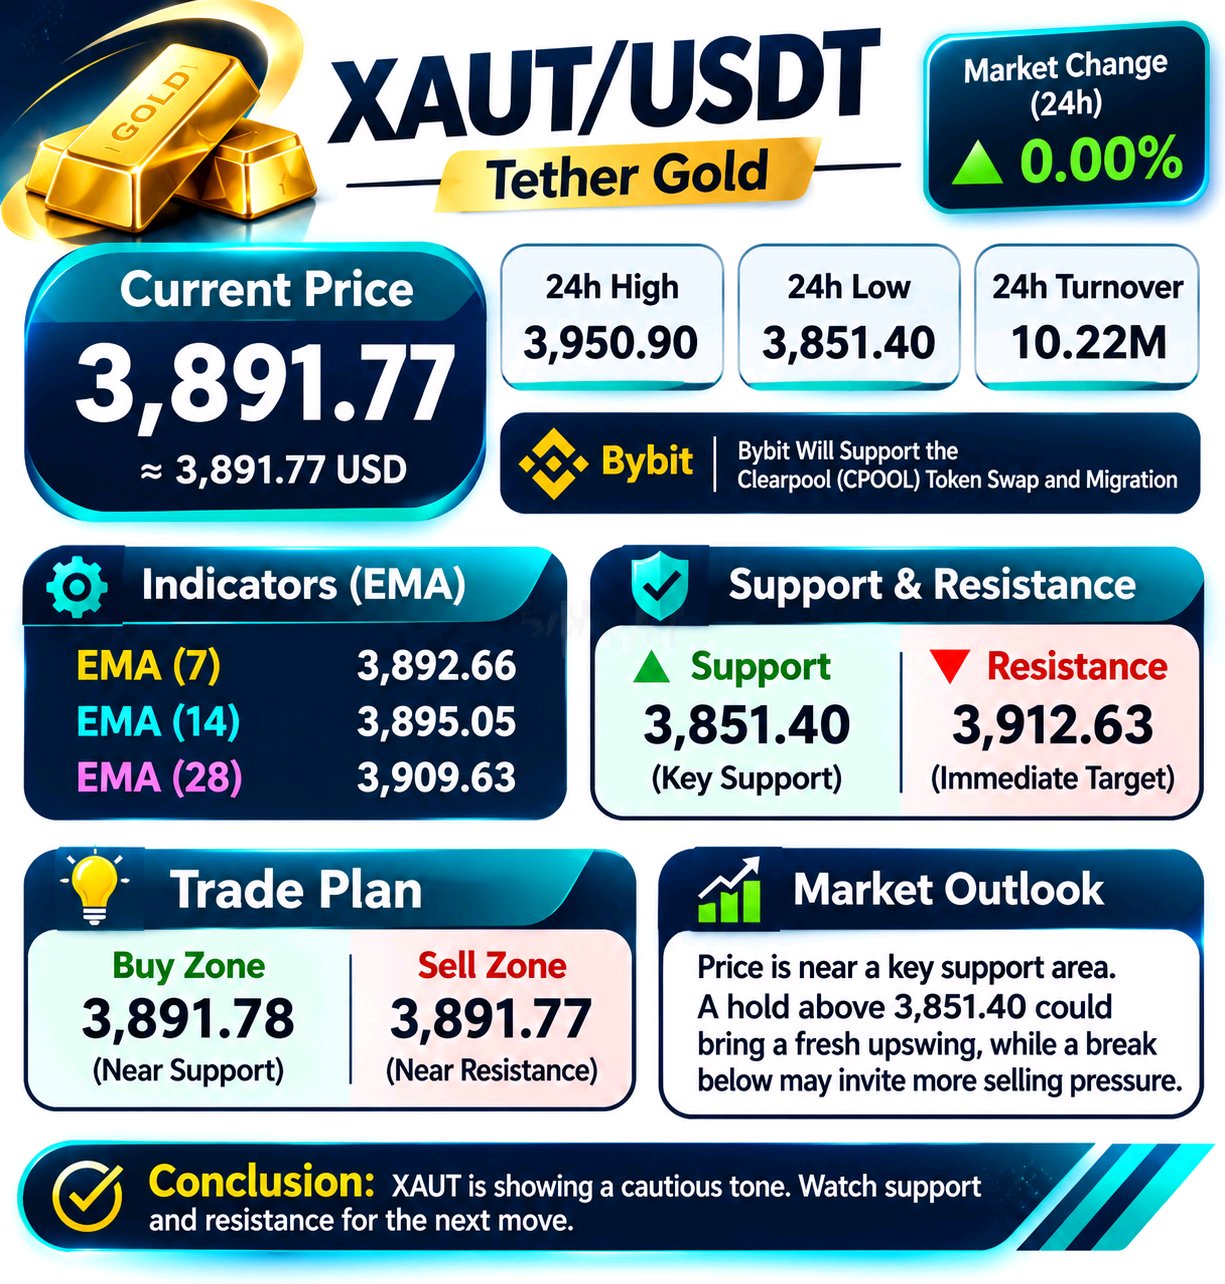
🔄 Gold just gave back the entire rally. I don't want to call a bottom on $XAUT while sellers still lean on the book. I want to see price hold above the old 3,872.51 base and then close above 3,910 on the 1H chart. Here's what the 1H chart shows: 🔹 The round trip: Gold launched from 3,872.51 last week and ran to the 4,128 area. Since then it has fallen all the way back, with a low of 3,851.40, just under the original base. 🔹 The drop: From the 4,124.95 high, price slid about 5.6% in a steady staircase of lower highs and lower lows. 🔹 The wick: The 3,851.40 low pierced the old base briefly, then price bounced and is back above it at around 3,892. That's a possible failed breakdown, but it hasn't been confirmed yet. 🔹 The averages: Price is sitting right on EMA7 (3,892.66) and EMA14 (3,895.05), with the Bollinger mid at 3,886.56. EMA28 at 3,909.63 is the first ceiling. 🔹 The bands: Upper 3,913.02 | Lower 3,860.09. They're narrowing, which fits the sideways drift of the last few hours. 🔹 The order book: Asks are about 71% vs 29% bids. Sellers are leaning on it, which matches the failed attempts to push higher. 🔹 The range: 24H high 3,950.90 and low 3,851.40, with 10.22M turnover. 🟢 Bullish: a 1H close above 3,910, then 3,950.90. Holding above 3,872.51 means the dip under the base was a trap. 🔴 Bearish: a 1H close under 3,872.51 and then 3,860 sends price back toward the 3,851.40 low. There is little marked support below it. A full round trip erases the whole rally. The base is now the line that decides what comes next. Are you watching $XAUT or another coin? #XAUT #Gold #Crypto #BinanceSquare #WSOT2026 #USInflationRunsHotAndRateHikeBetsRise #SanDiskAnnounces8For1StockSplit #AnthropicIPOTestsTheAIBoom #BitcoinHitsTwoMonthLowAfterUSMidterms $XAUTUSDT $BTCUSDT
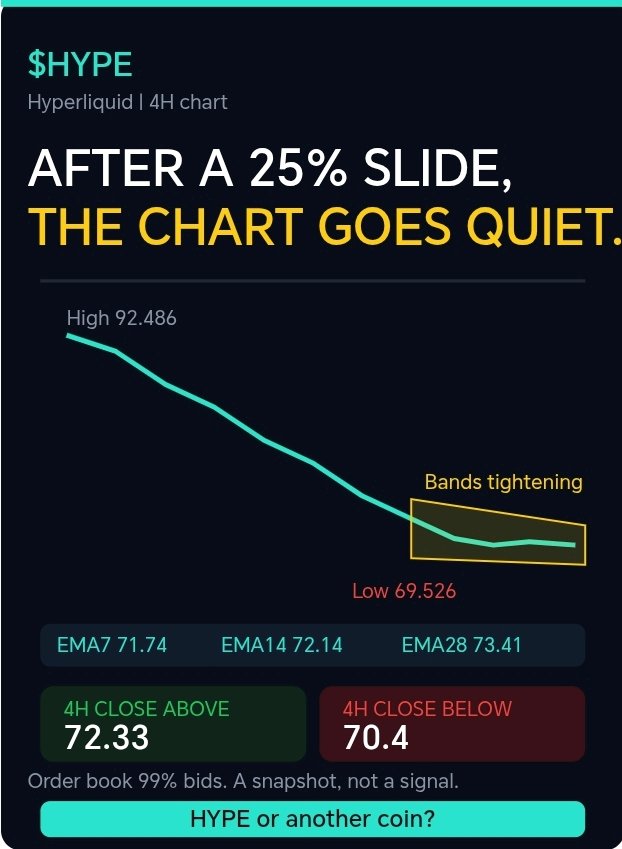
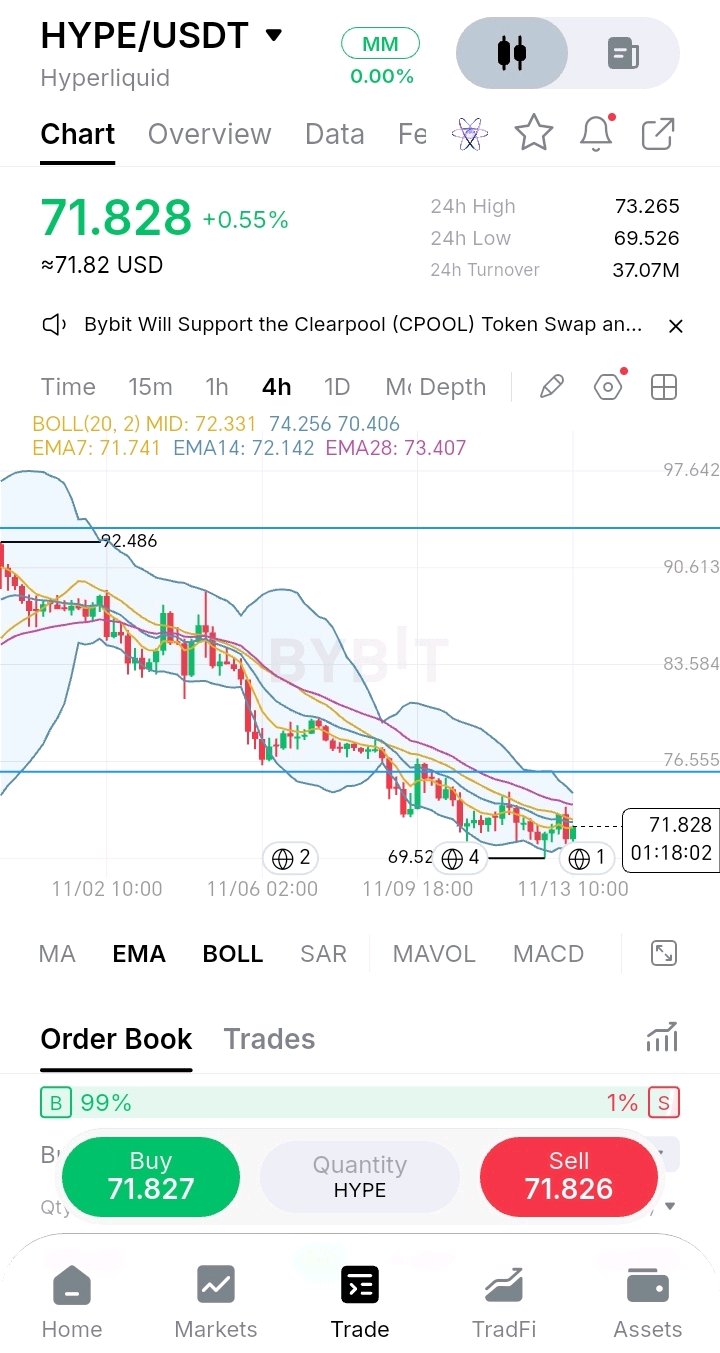
🧘 After a 25% slide in under two weeks, the 4H chart is finally going quiet. I don't want to call this calm a reversal on $HYPE. I want to see a 4H close above 72.33 (mid-band), because that's what would turn a pause into a recovery. Here's what the 4H chart shows: 🔹 The slide: From the 92.486 high, $HYPE dropped to 69.526, about 25%, in a steady staircase of lower highs and lower lows. 🔹 The calm: For the last couple of days, candles have shrunk and price has been oscillating around the same spot instead of making new lows. The 69.526 low has held since it was printed. 🔹 The averages: EMA7 is 71.74, EMA14 72.14 and EMA28 73.41. The two short ones are within 0.6% of each other and price is right on top of them. They're flattening instead of dropping. 🔹 The bands: Bollinger is tightening. Upper 74.26 | Mid 72.33 | Lower 70.41. That's a narrower channel than during the selloff. 🔹 The order book: Bids are about 99% vs 1% asks. That's extreme, but it hasn't stopped earlier dips when bids were 90% or more. It's a snapshot, not a signal. 🔹 The range: 24H high 73.265 and low 69.526, with turnover at 37.07M. 🟢 Bullish: a 4H close above 72.33, then 73.4 and 74.3. A move toward the 75.8 line would be the first real recovery. 🔴 Bearish: a 4H close under 70.4 puts the 69.526 low back in play, and a break there restarts the slide. A flat chart after a fall is a pause. What comes after the pause is what matters. Are you watching $HYPE or another coin? #HYPE #Crypto #BinanceSquare #USInflationRunsHotAndRateHikeBetsRise #SanDiskAnnounces8For1StockSplit #AnthropicIPOTestsTheAIBoom #BitcoinHitsTwoMonthLowAfterUSMidterms #AITechSelloffErases2Point5TrillionFromNasdaq100 $HYPEUSDT $BTCUSDT