AlphaWhaleX
2452Like0Shares24Fans29Follow
🐋 The mindset of a whale... and the vision of a pro! 📈 I read market movements and seek out exceptional opportunities. 🎯 Well-thought-out deals... ambitious goa
🐋 The mindset of a whale... and the vision of a pro! 📈 I read market movements and seek out exceptional opportunities. 🎯 Well-thought-out deals... ambitious goa
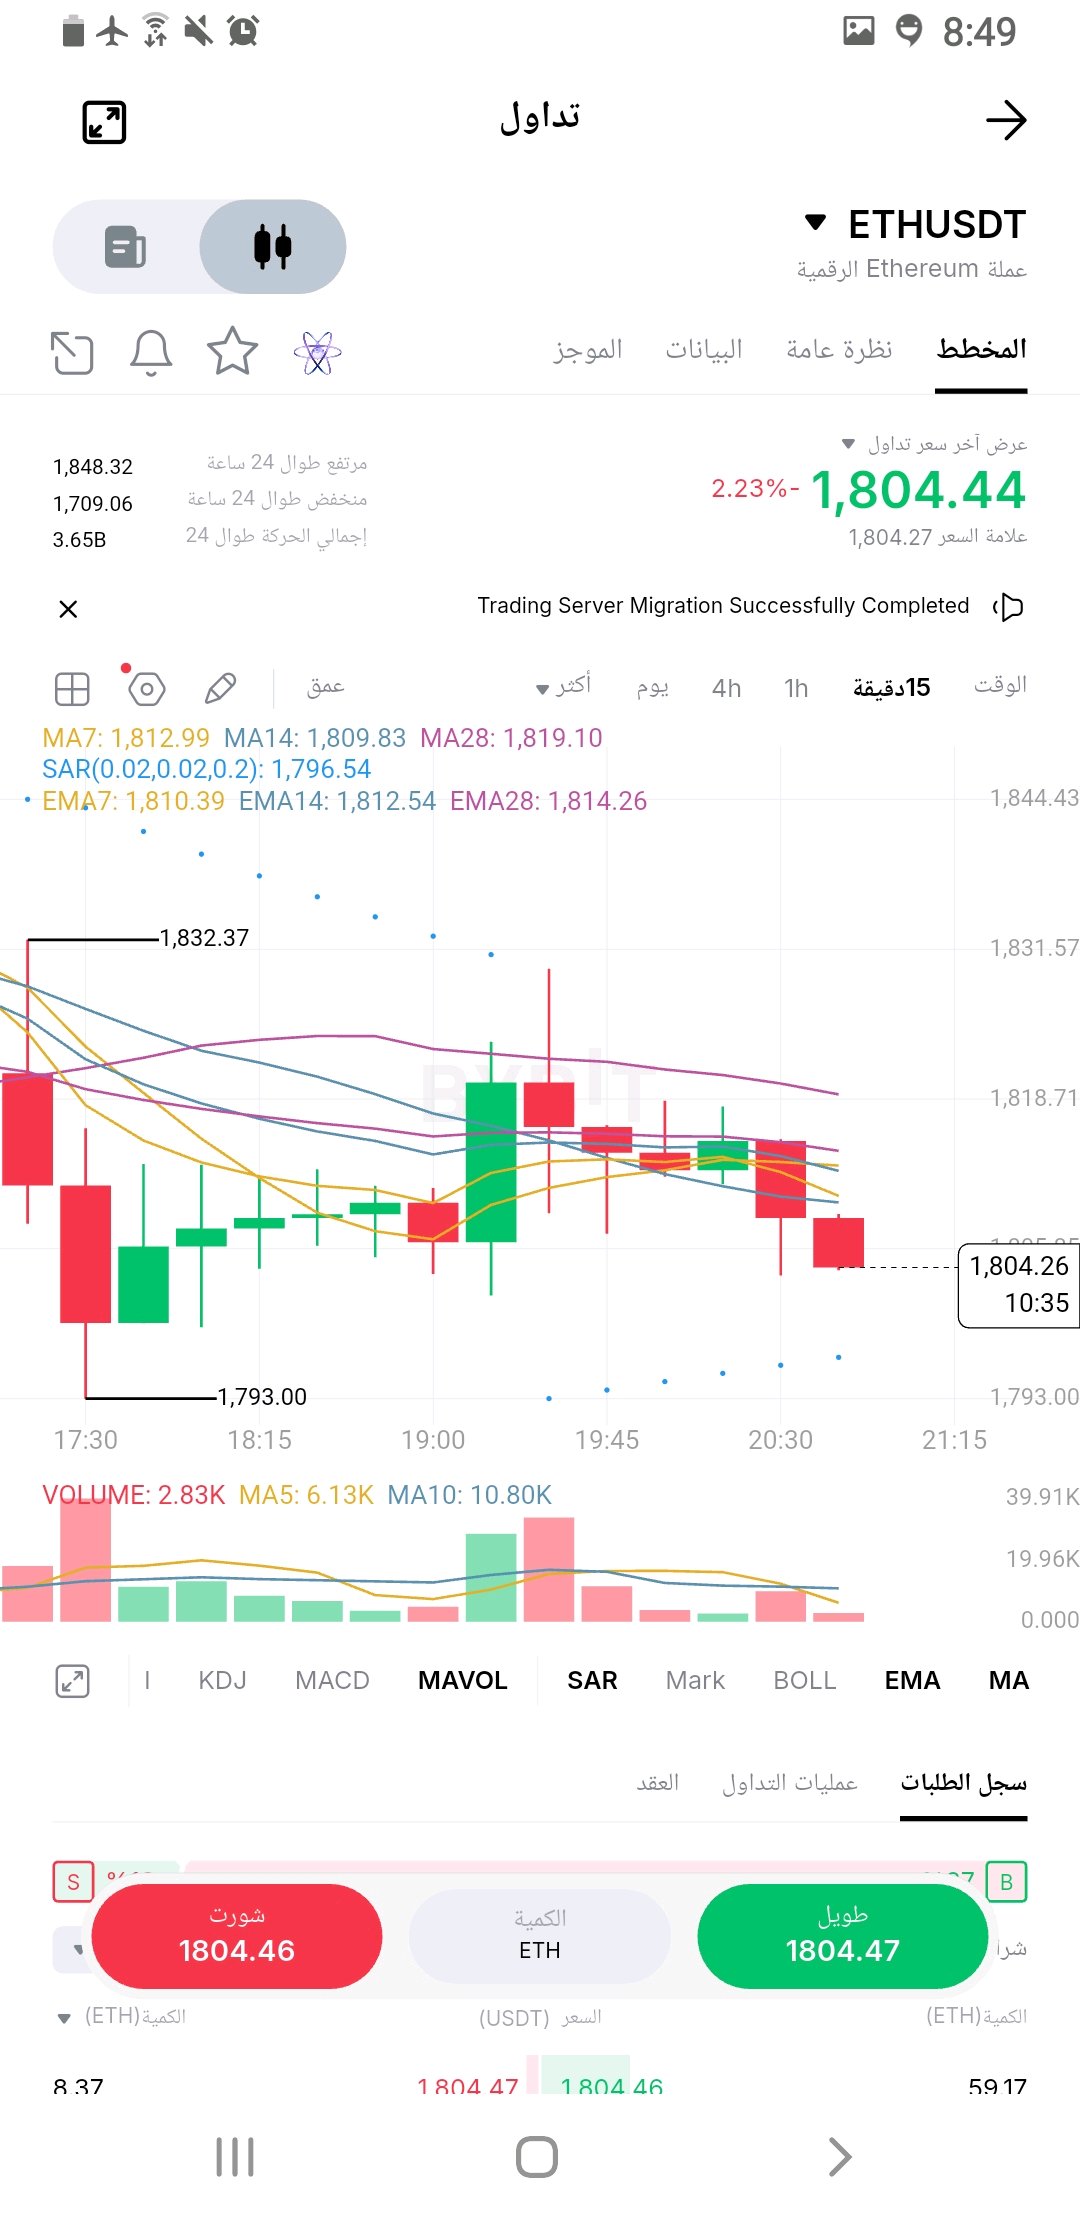
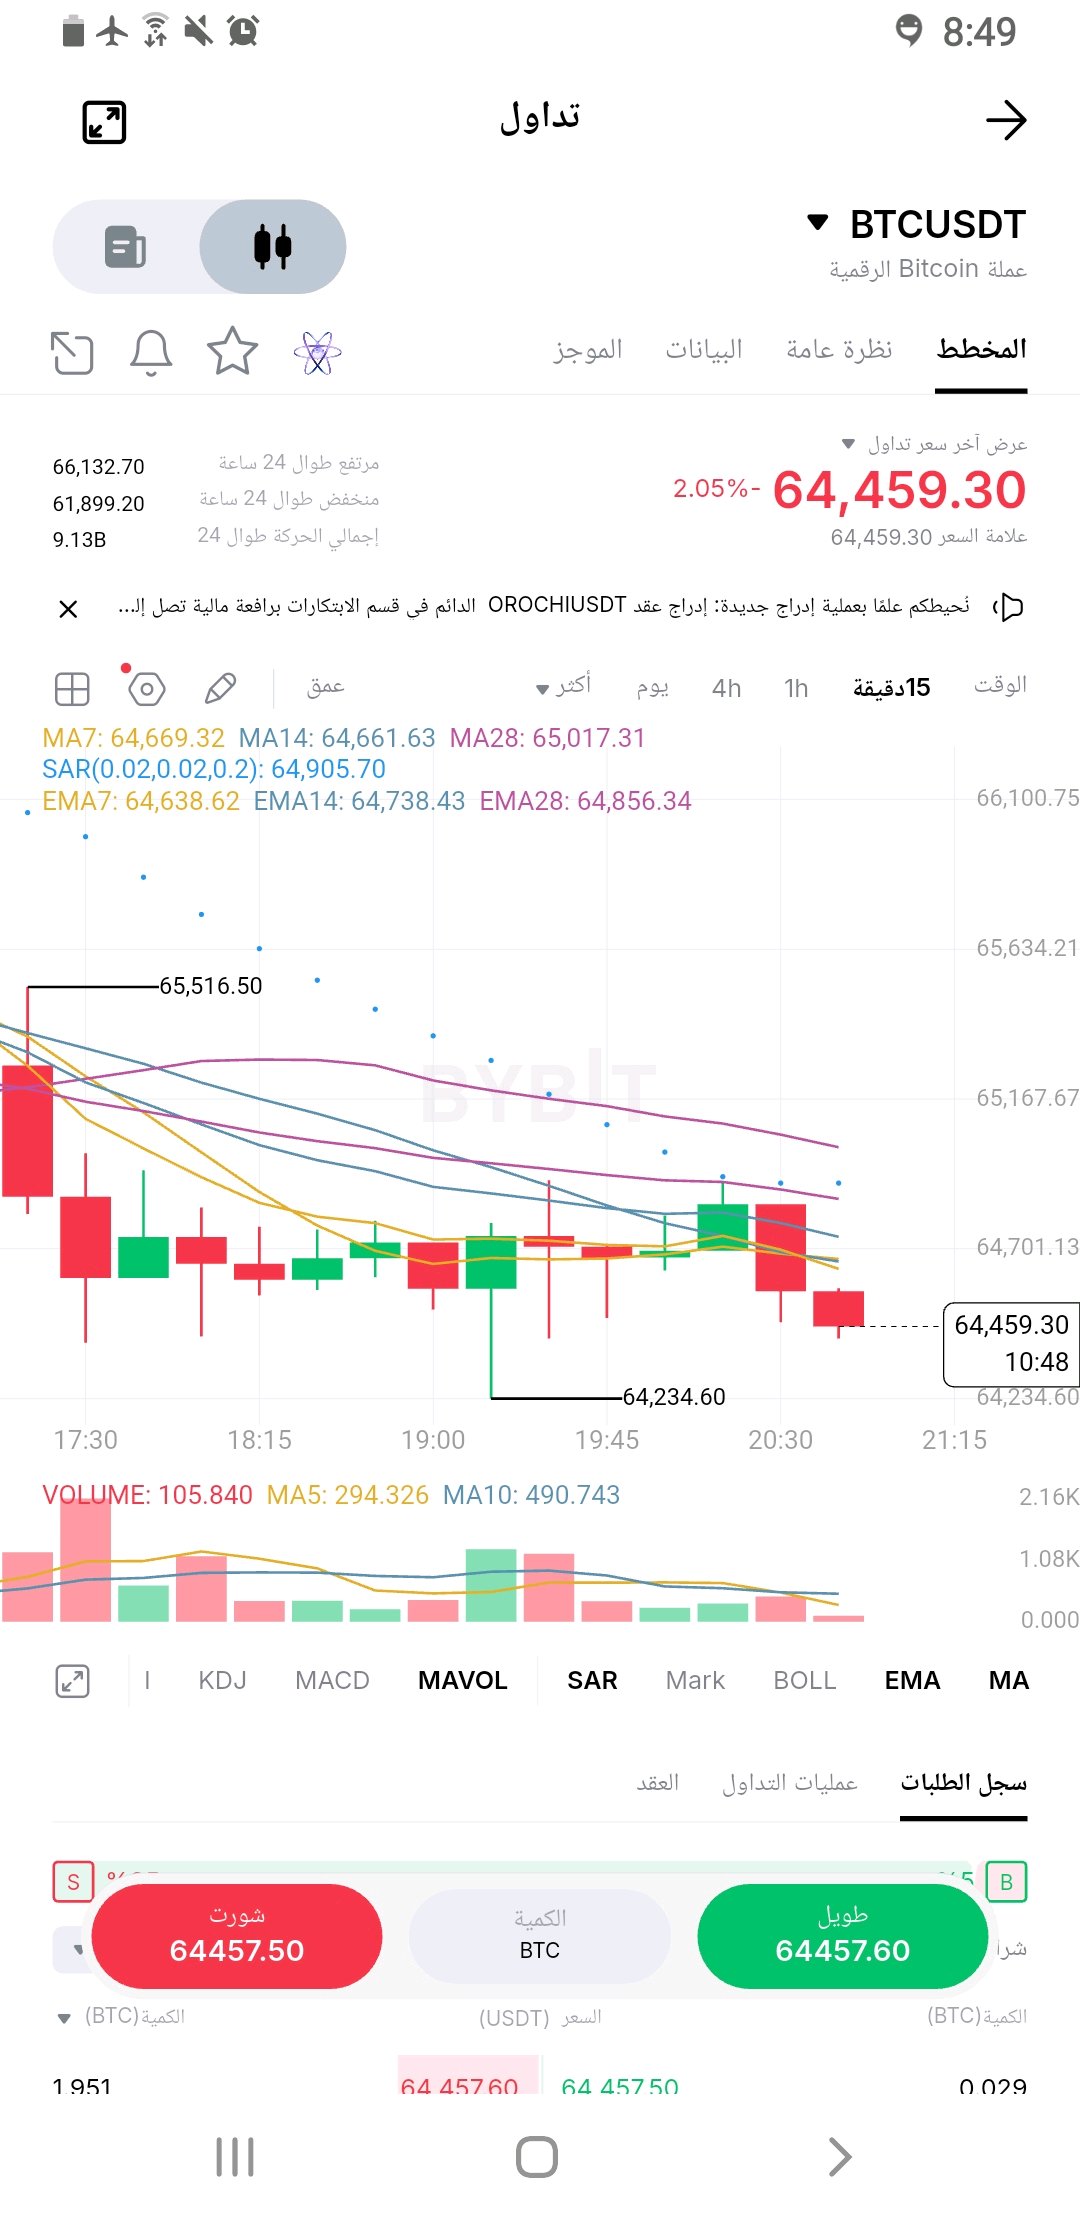
#ByXIMPACT 🚨 Quick Analysis: Will We See a Rebound or Continued Downward Movement? (BTC & ETH) Content: I'm closely monitoring the market on the 15-minute timeframe. Here's what I see right now on the #BTC and #ETH charts: 📉 Bitcoin ($BTC): The price is trading at 64,459, below all short-term moving averages. The SAR (dots) indicator is above the price, increasing the selling pressure. The recent low at 64,234 is the first line of defense. A break below this level would target 64,000, while a return above 64,856 (EMA28) would give a positive signal. 📉 Ethereum ($ETH): The situation is similar. The price is at 1,804, with strong support concentrated at 1,793. The first resistance is the EMA28 at 1,814. If the selling continues, I will be watching 1,793 very closely for a quick buying opportunity. 🎯 My Plan (Risk Management): · I won't enter any trades now until I see confirmation (15-minute candle close). · If BTC breaks the 64,234 level, I will open a short position with a target of 64,000 and a stop loss at 64,400. · If ETH bounces off 1,793, I will buy with a target of 1,814. 💼 My Real Data: (I've attached a screenshot of any real positions you open here, or delete this line if you haven't entered a trade yet). 👉 If you want to follow these trades yourself, you can click on the Trading component below. $BTCUSDT $ETHUSDT #WSOT2026 #USPPITestsTheHigherForLongerTrade
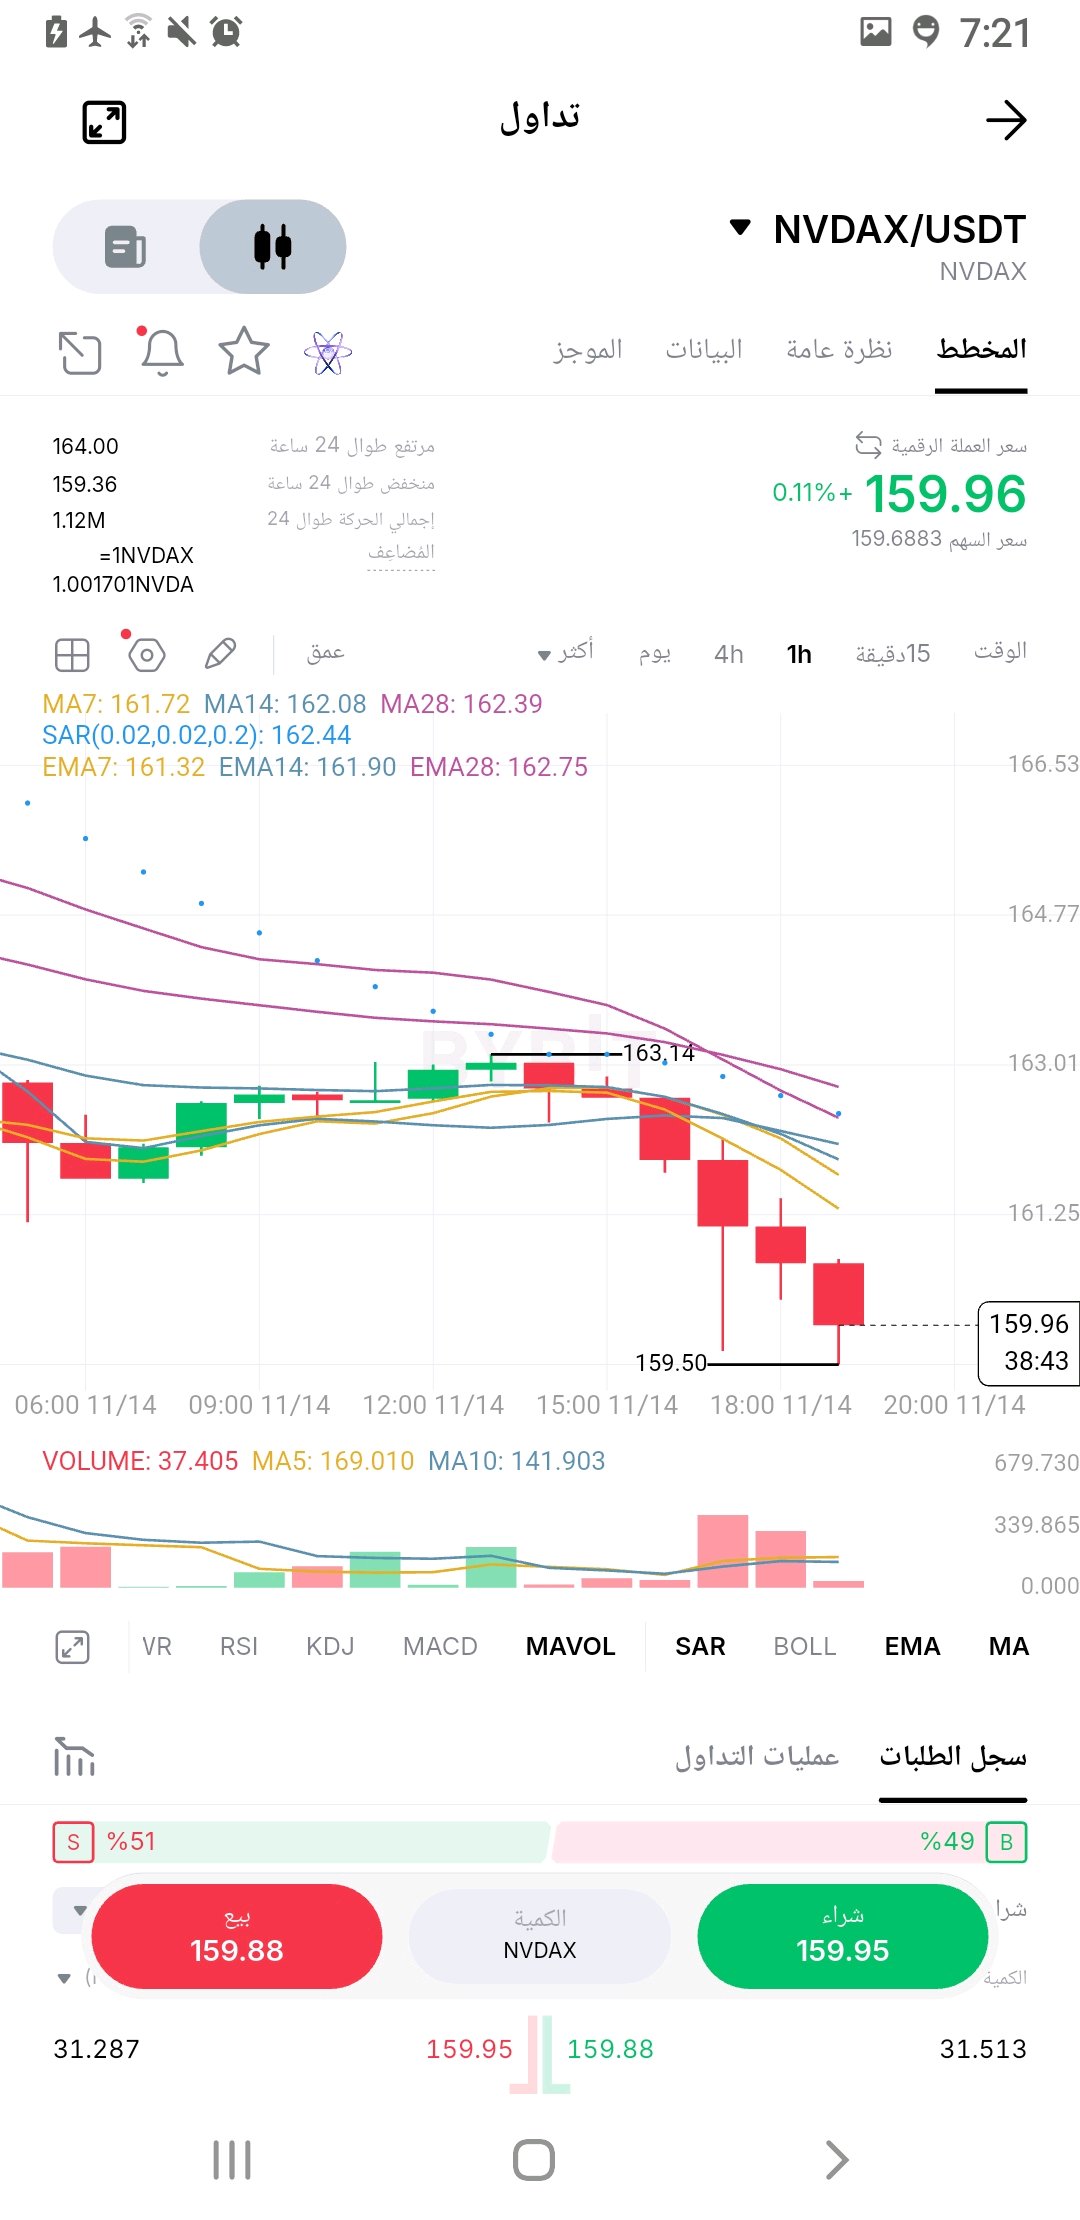
ByXIMPACT *NVDAX**: # NVDAX Analysis: Rare convergence of Nvidia repricing, leadership shock, and high-stakes earnings 🚨📉 NVDAX is facing a rare combination of circumstances: a sharp repricing of NVIDIA shares, a leadership shock, and a major earnings event just days away. This is no longer just momentum trading in the artificial intelligence sector. Trading near **$162**, NVDAX has fallen roughly 3.2% over 24 hours and 13.9% over seven days. The stock is down about 33% from its October high of $242.89. The recent daily range spans between $158.67 and $171.80. Buyers are defending the floor, but a recovery remains uncertain as long as the price stays below $171.80. The biggest catalyst is NVIDIA's official announcement on November 12: Jensen Huang's resignation as CEO and the appointment of Chief Financial Officer Colette Kress as interim CEO. This marks a critical leadership shift at the heart of the artificial intelligence industry. NVIDIA states that its operations, customer commitments, and product roadmap are expected to continue without interruption, but investors still need proof of execution stability. The next major test will arrive on **November 17**, when NVIDIA reports its financial results for the third quarter of fiscal 2027. Revenue growth, data center demand, future guidance, and management commentary will matter far more than headline earnings alone. Strong results could restore confidence, but any weakness in guidance could reinforce the ongoing repricing process. There is also an important distinction regarding NVDAX itself. It is a tokenized tracking certificate designed to provide economic exposure to NVIDIA shares, backed 1:1 by the underlying securities according to the issuer. It does not grant standard shareholder voting rights. Furthermore, it trades around the clock, whereas the underlying US stock market is subject to specific trading hours, creating potential price gaps and liquidity differences outside those hours. Derivatives show elevated positioning: futures open interest stands at approximately $3.89 million, with funding hovering near **+0.1608%**. Futures trading volume is roughly 2.5 times larger than spot volume. This unusually positive funding indicates that leveraged long positions are paying heavily to maintain their positions, leaving the market vulnerable if the underlying stock weakens further. ### Key Figures * **Price:** ~$162 * **Market Capitalization:** ~$94 million * **24-Hour Change:** -3.2% * **7-Day Change:** -13.9% * **24-Hour Range:** $158.67 - $171.80 * **Distance from All-Time High (ATH):** ~33% * **Futures Open Interest:** ~$3.89 million * **Funding Rate:** +0.1608% * **Next NVIDIA Earnings:** November 17 ### Bullish Confirmation: Reclaiming the **$171.80** level and holding above it will serve as the first meaningful recovery signal. Strong earnings, resilient data center guidance, and the stabilization of NVIDIA shares could support a move toward the **$180** level. ### Bearish Confirmation: A decisive breakdown below **$158.67** will expose the risk of another downward wave. Weak earnings guidance or persistent leadership uncertainty could keep sellers firmly in control. NVDAX ultimately tracks the underlying business of NVIDIA, rather than an independent crypto narrative. The November 17 results are the primary upcoming catalyst. Until then, a bounce without confirmation from the underlying stock is not enough. NVDAXUSDT ByXIMPACT$NVDAXUSDT $NEARUSDT WSOT2026 WSOTShowYourAITradeToEarn10USDT USPPITestsTheHigherForLongerTrade SanDiskAnnounces8For1StockSplit
Strong selling pressure
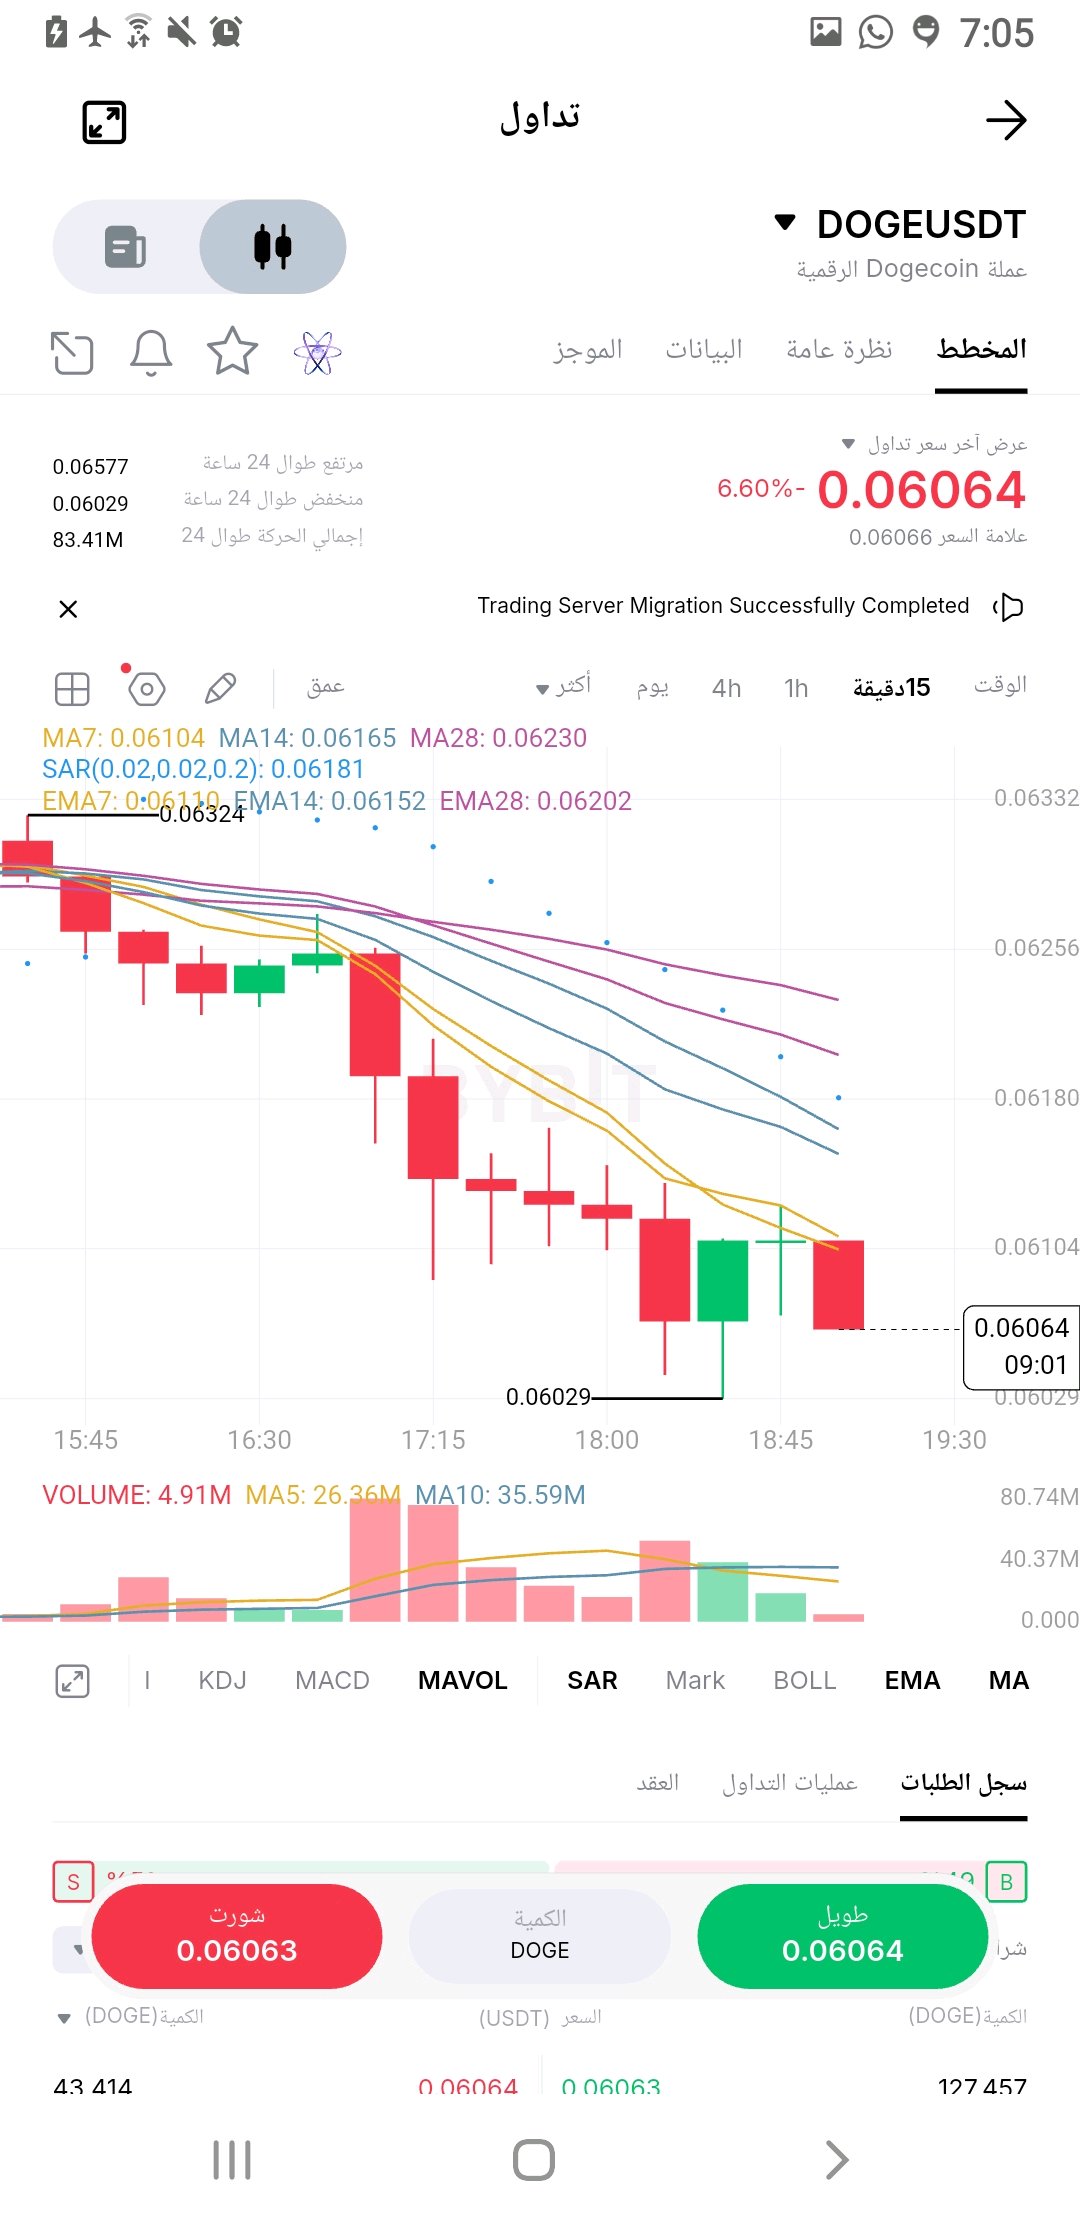
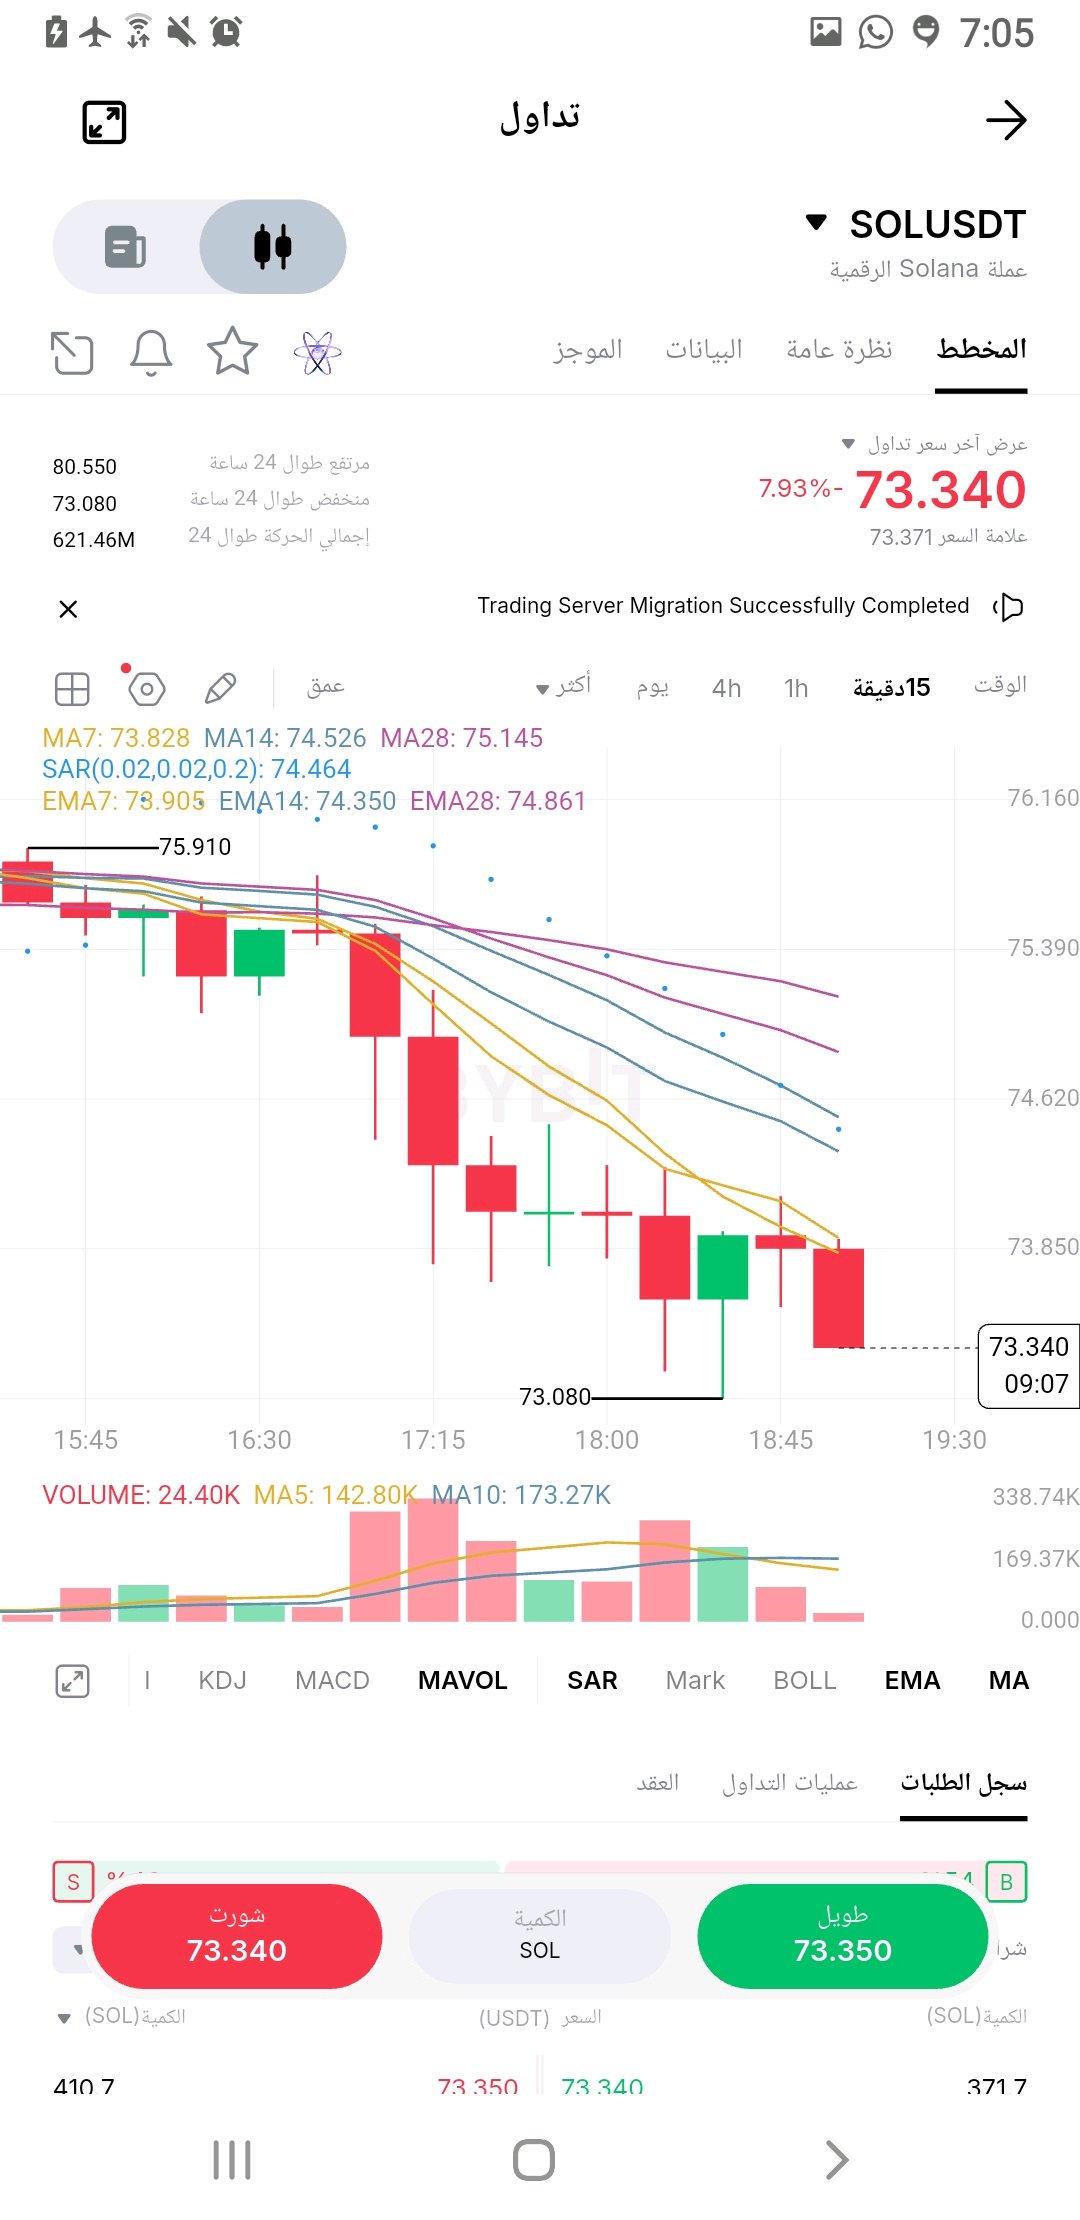
#ByXIMPACT 🚨 Clear collapse in DOGE and SOL... Will the bleeding continue or is a rebound imminent? 🔥 Two cryptocurrencies are under strong selling pressure on the 15-minute timeframe, and moving averages indicate a continuation of the downtrend. 🔴 $DOGE/USDT 💰 Price: $0.06064 📉 Trend: Down. 📍 Key support: $0.06029 🎯 First resistance: $0.06104 🎯 Next resistance: $0.06165 – $0.06230 A break below support could open the door for a further downward wave, while a recapture of $0.06165 could strengthen the chances of a rebound. 🔴 $SOL/USDT 💰 Price: $73.34 📉 Trend: Strongly bearish. 📍 Crucial Support: $73.08 🎯 First Resistance: $73.85 🎯 Next Resistance: $74.52 – $75.14 The price is trading below all major moving averages, and any bounce needs confirmation before the trend can be considered reversed. ⚠️ Message to traders: Don't chase bounces and don't rush to buy during a dip. Watch support and volume and wait for a clear signal. 🐻 Are we seeing new lows or is a bounce imminent? #DOGE #SOL #Crypto #Trading #Bybit #Altcoins DYOR | Risk Management First. ::: #WSOT2026 #WSOTShowYourAITradeToEarn10USDT #USPPITestsTheHigherForLongerTrade #AITechSelloffErases2Point5TrillionFromNasdaq100 $SOLUSDT $DOGEUSDT
Downward trend with an attempted rebound
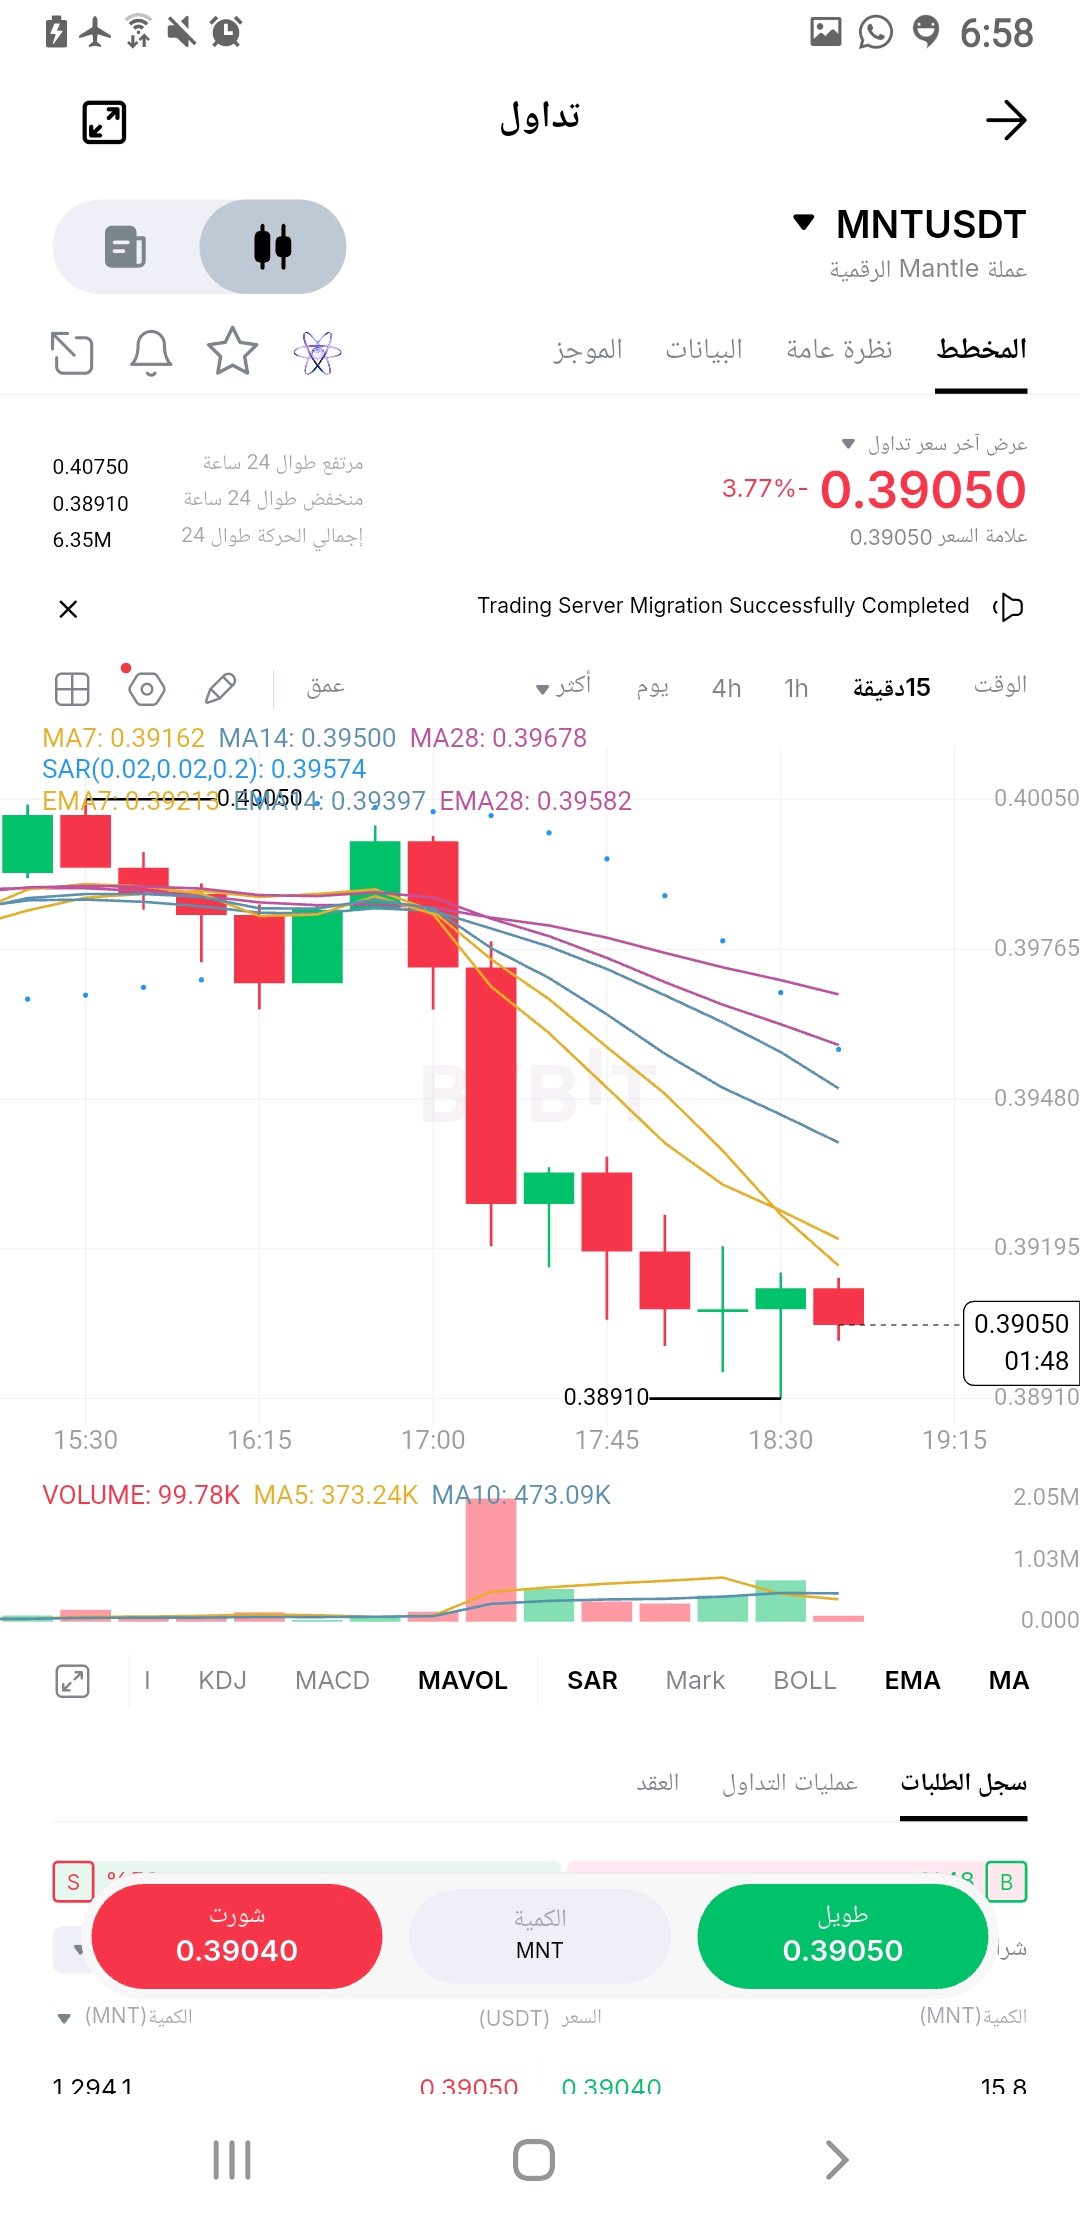
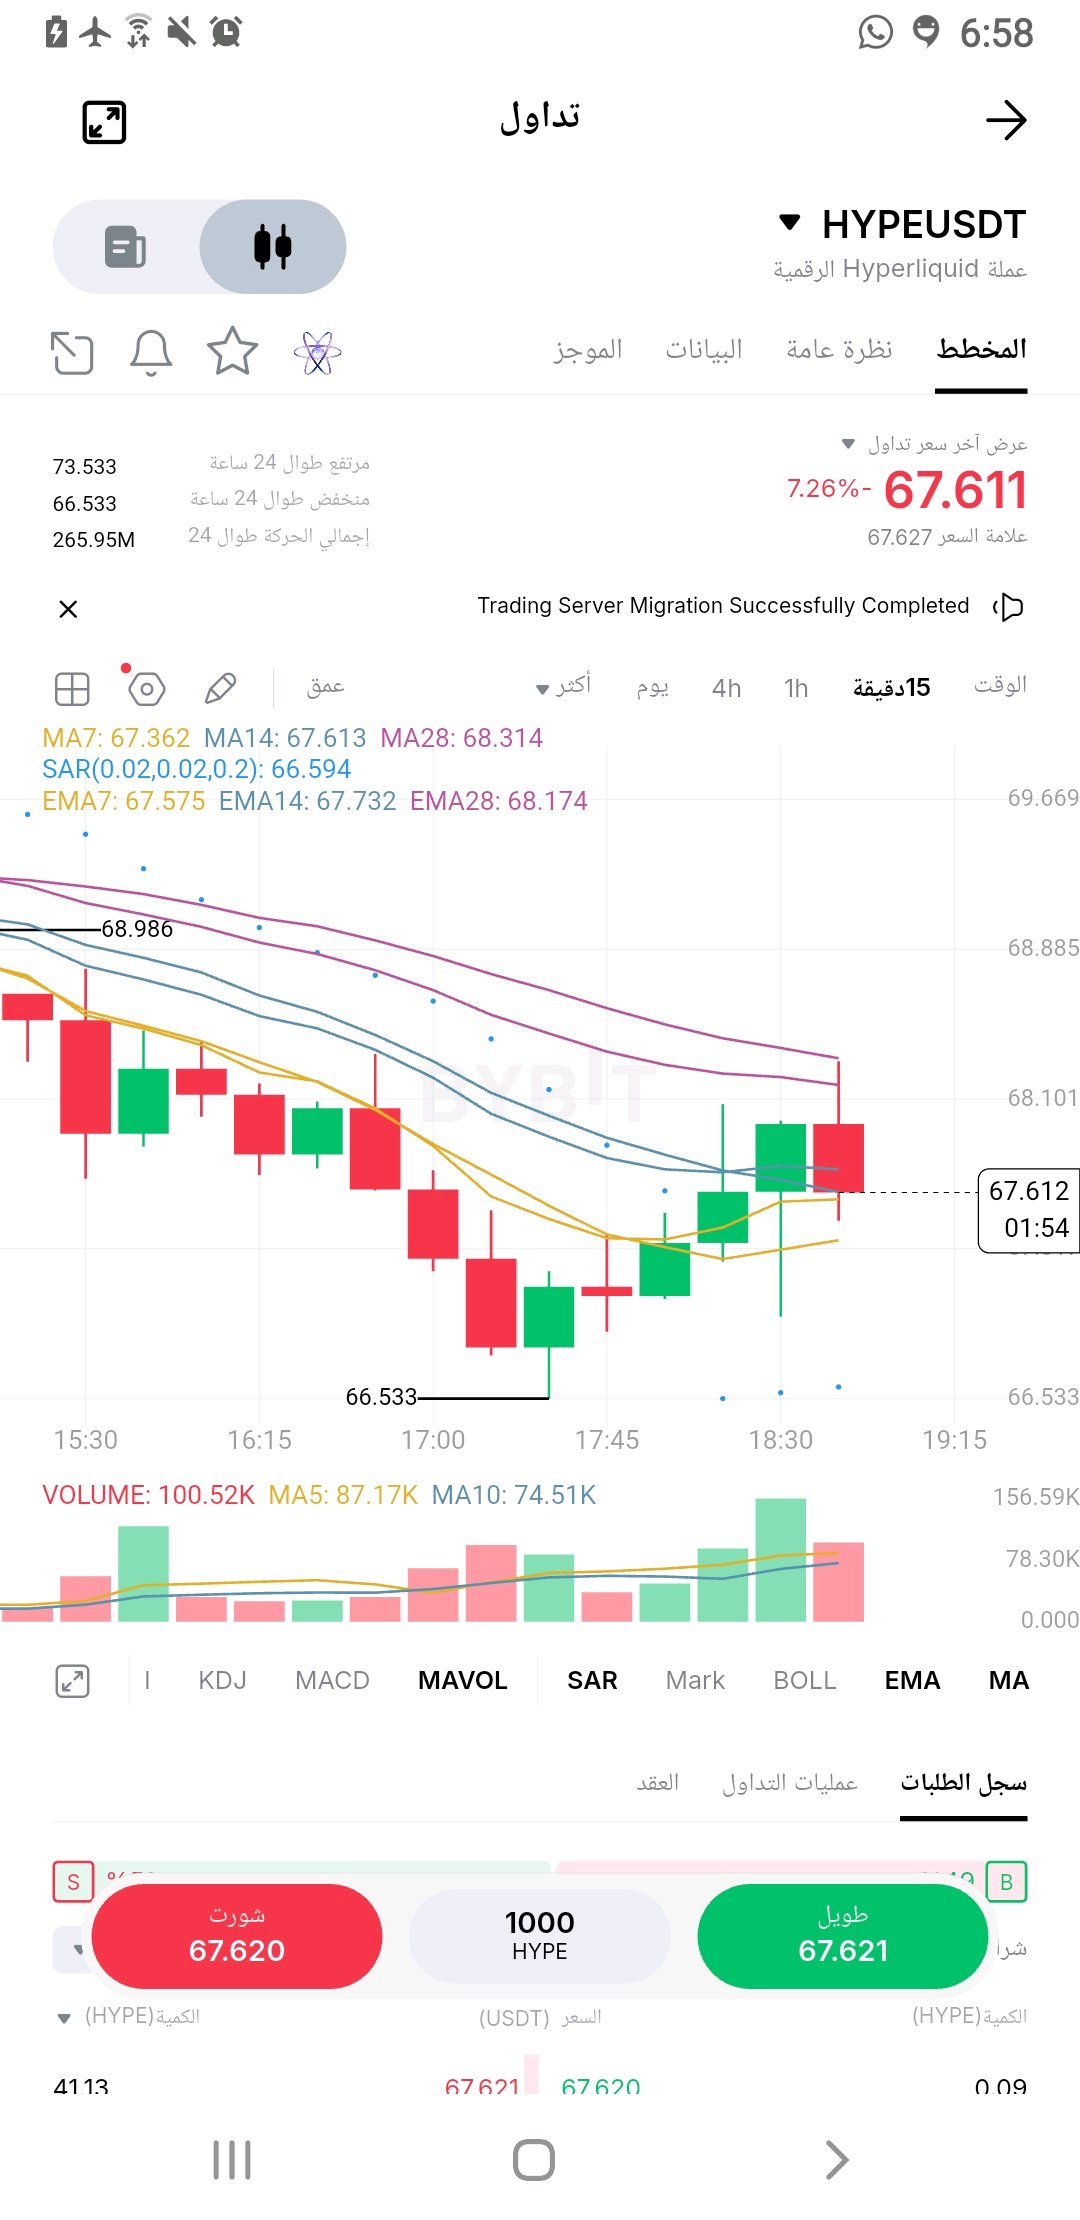
#ByXIMPACT 🚨 Two currencies under selling pressure... Will we witness a new decline or a sudden rebound? 🔥 🔴 $HYPE/USDT 💰 Price: $67.61 📉 Trend: Downward with an attempted rebound. 📍 Support: $66.53 🎯 Resistance: $67.73 – $68.17 A break above resistance and a sustained move above it could strengthen the chances of a recovery, while a break below support opens the door for further declines. 🔴 $MNT/USDT 💰 Price: $0.39050 📉 Trend: Clearly negative. 📍 Support: $0.38910 🎯 Resistance: $0.39200 – $0.39500 The price is below the moving averages, and the rebound remains weak without reclaiming the resistance levels. ⚠️ Conclusion: Don't rush into buying amidst the volatility. Wait for confirmation of the breakout or support breakdown, and monitor trading volume. What's your prediction? A bounce or a new downward wave? 👀 #HYPE #MNT #Crypto #Trading #Bybit DYOR – Not investment advice. #WSOT2026 #WSOTShowYourAITradeToEarn10USDT #USPPITestsTheHigherForLongerTrade #SanDiskAnnounces8For1StockSplit $HYPEUSDT $MNTUSDT
Bitcoin and Ethereum are under selling pressure
#ByXIMPACT 🚨🔥 A crash is putting pressure on Bitcoin and Ethereum! Is a bounce candle approaching, or is the downtrend not over yet? The market is entering a sensitive phase... and all eyes are on the key support and resistance levels! 👀 🟠 $BTC/USDT – Bitcoin | 15-minute timeframe 💰 Price: $65,648.10 📉 Decline: 3.64% Sellers continue to exert pressure, and the price is trading below the moving averages, with a limited bounce from the $65,035 area. 📍 First support: $65,035 🎯 First resistance: $65,753 🎯 Second resistance: $66,266 🎯 Third resistance: $66,739 🐂 A recap of $66,266 could support a recovery attempt towards $66,739. 🐻 A break below $65,035 could open the door for further selling pressure. ━━━━━━━━━━━━━━ 🔵 $ETH/USDT – Ethereum | 15-minute timeframe 💰 Price: $1,835.96 📉 Decline: 5.50% Ethereum is showing clear weakness, continuing to trade below the moving averages and approaching its low of $1,823. 📍 Pivot support: $1,823 🎯 First resistance: $1,845 🎯 Second resistance: $1,868 🎯 Third resistance: $1,887 🐂 A break above $1,868 could give buyers a chance to regain momentum. 🐻 A break below $1,823 could increase the likelihood of further declines. ━━━━━━━━━━━━━━ 🔥 In summary: Bitcoin and Ethereum are under simultaneous selling pressure, and the current rebound has not yet confirmed a trend reversal. 🚨 The most important question: Will we witness a strong rebound that revives the market, or is a new downward wave awaiting traders? 🐂 A bounce from support? 🐻 Or a collapse to lower levels? 💬 Share your predictions! ⚠️ Technical analysis, not a guarantee of profit. Wait for confirmation, and manage risk first. #BTC #ETH #Bitcoin #Ethereum #Crypto #Trading #Bybit ::: $BTCUSDT $ETHUSDT #WSOT2026 #WSOTShowYourAITradeToEarn10USDT #USPPITestsTheHigherForLongerTrade @
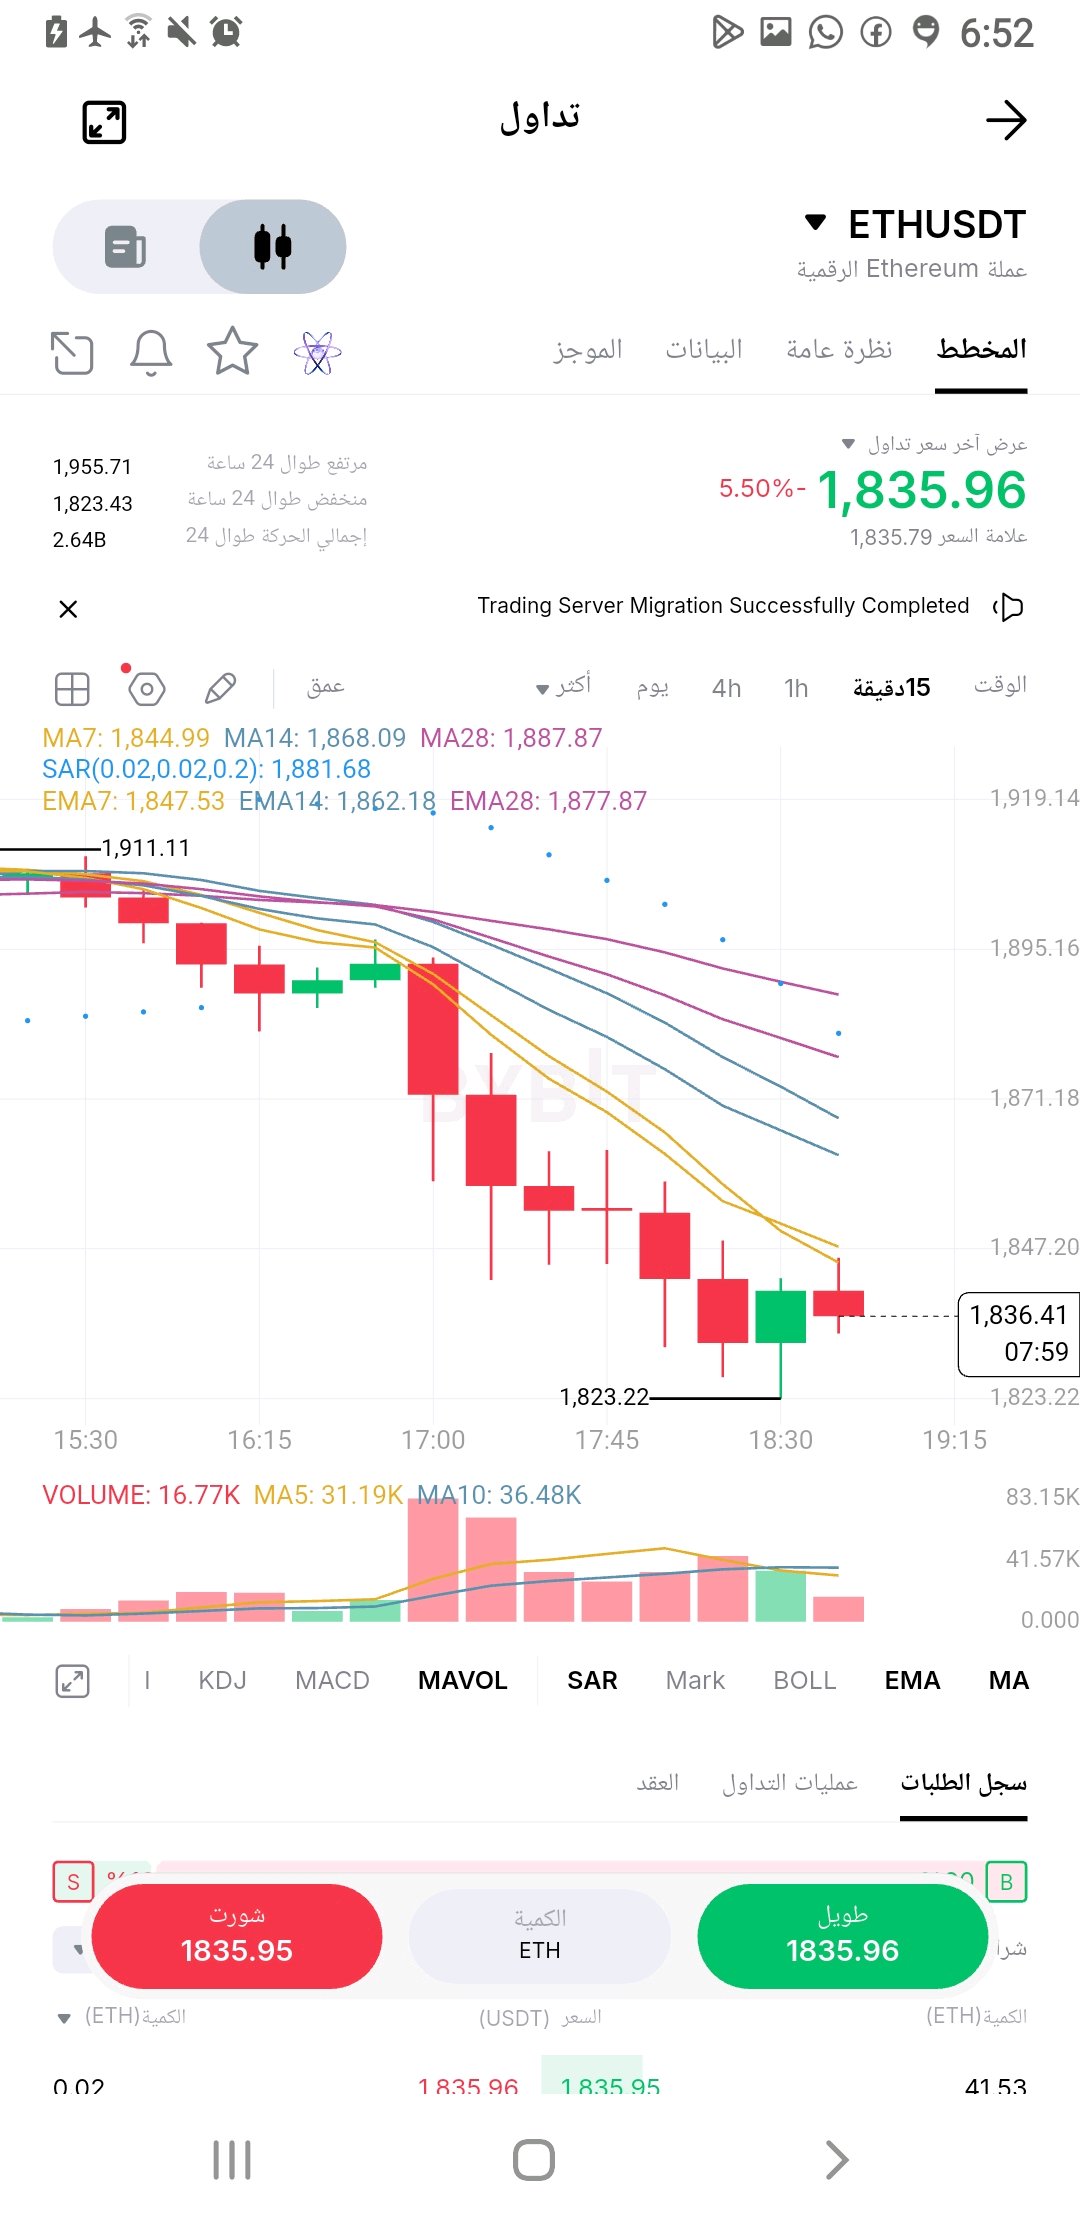
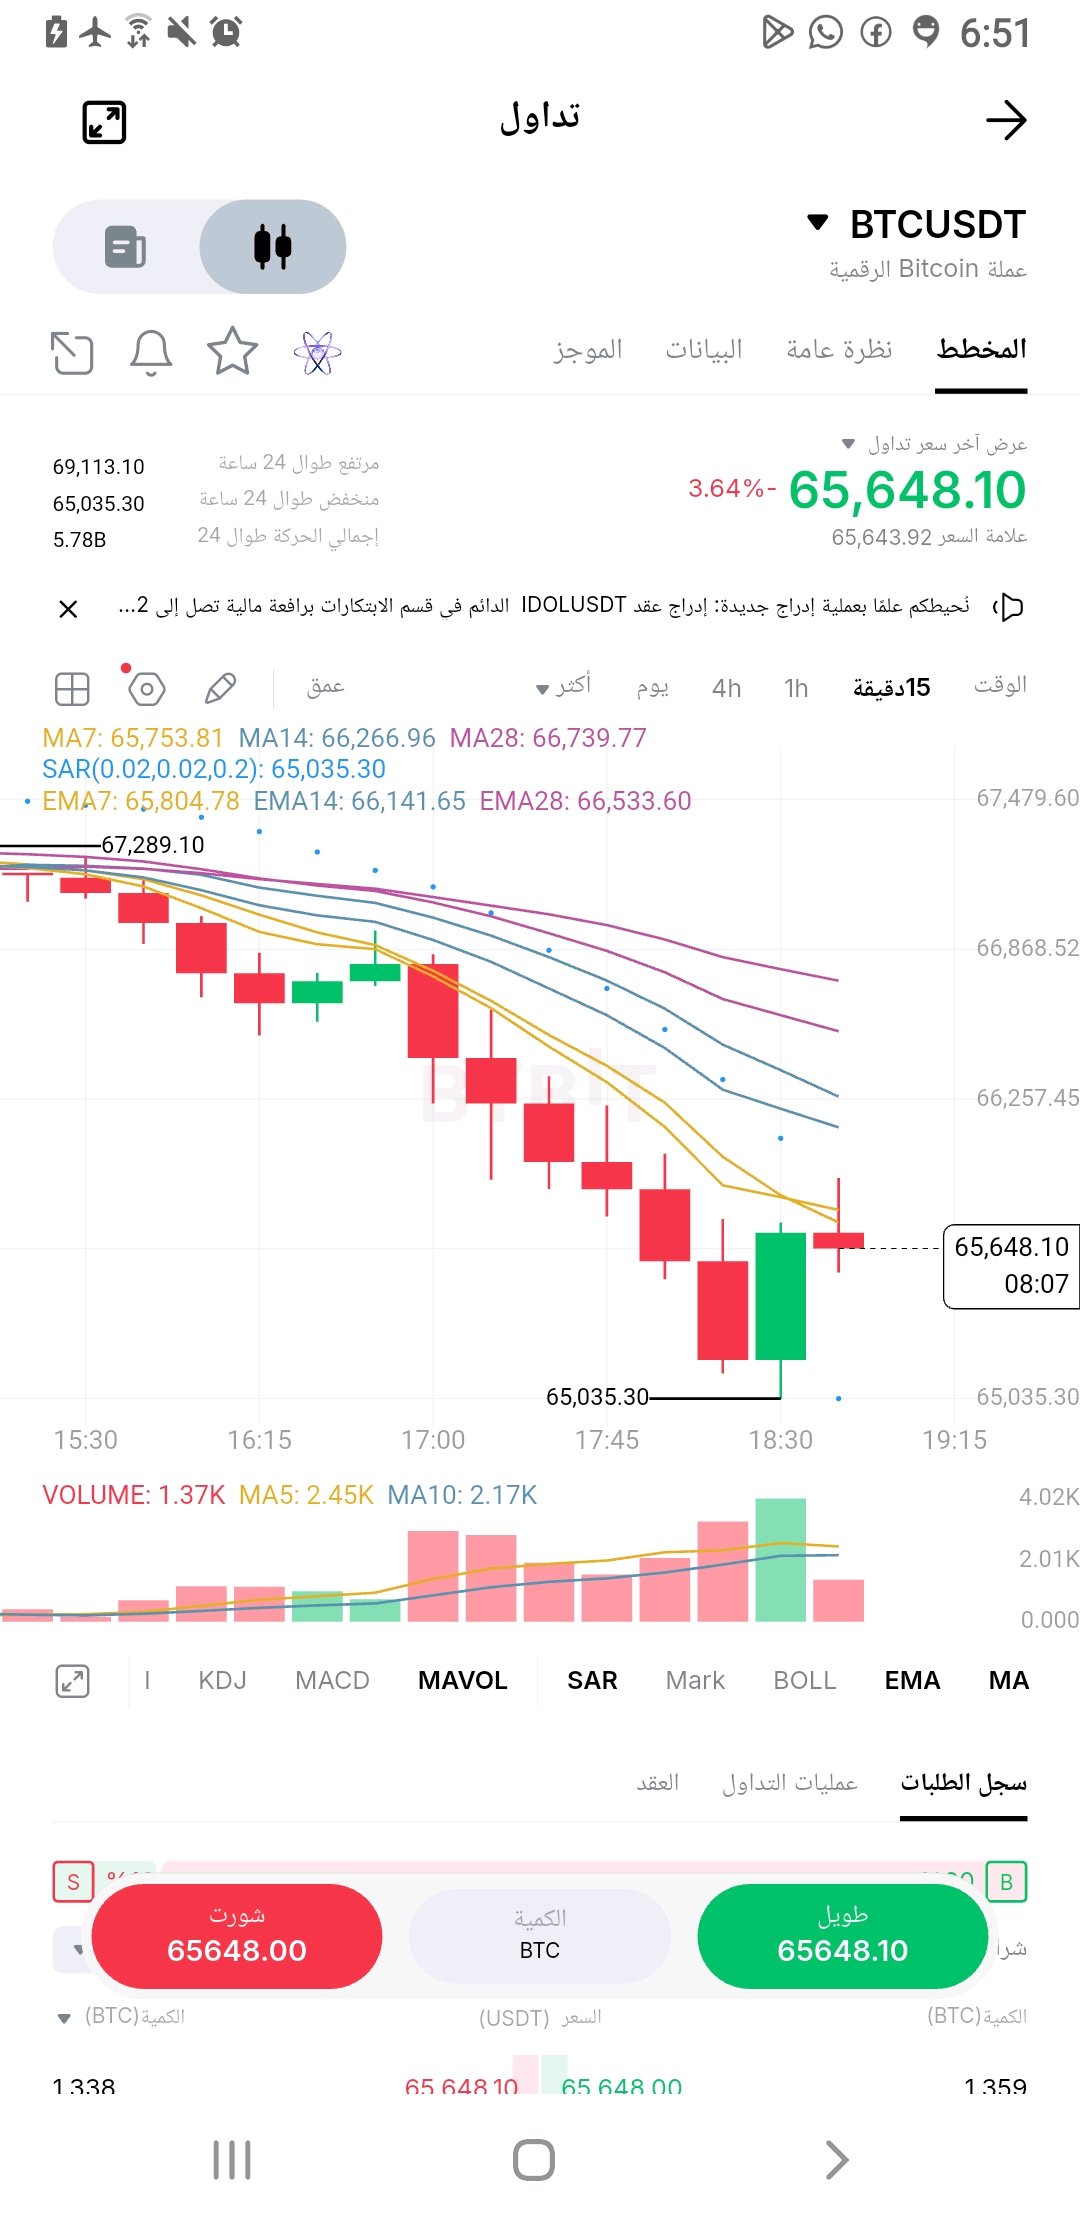
Those who sold will profit.
#ByXIMPACT 🚨🔥 The market is under heavy pressure! Bitcoin and Ethereum face a crucial test... Is a rebound imminent, or has a deeper decline begun? 📊 BTC and ETH Analysis – 15-minute timeframe 🟠 $BTC/USDT – Bitcoin 💰 Price: $68,433 📉 Decline: 5.08% The price is moving below the moving averages, with continued selling pressure and weak rebound attempts. 📍 First Support: $68,073 📍 Next Support: $67,468 🎯 First Resistance: $68,619 🎯 Second Resistance: $68,975 🎯 Key Resistance: $69,112 ⚠️ A break below $68,073 could increase downward pressure, while a recap of $69,112 could give buyers a chance to regain momentum. 🔵 $ETH/USDT – Ethereum 💰 Price: $1,923.45 📉 Decline: 4.40% Ethereum is experiencing clear selling pressure and is trading below the moving averages, with a rebound attempt that has not yet confirmed a trend reversal. 📍 First Support: $1,912 📍 Next Support: $1,894 🎯 First Resistance: $1,931 🎯 Second Resistance: $1,947 🎯 Key Resistance: $1,950 ⚠️ A break above $1,950 and a sustained move above it could support a recovery attempt, while a break below $1,912 could lead to a retest of the lower support. 🔥 Conclusion: Bitcoin and Ethereum are under simultaneous selling pressure, and sellers still hold the upper hand on the short-term timeframe. 👀 Are we witnessing a sudden rebound, or is the worst yet to come? 💬 Share your prediction: 🐂 Up and rebound? 🐻 Down and deeper correction? ⚠️ Technical analysis, not investment advice. Wait for confirmation, and manage risk first. #BTC #ETH #Bitcoin #Ethereum #Crypto #Trading #WSOT2026 #WSOTShowYourAITradeToEarn10USDT #USPPITestsTheHigherForLongerTrade #USInflationRunsHotAndRateHikeBetsRise $BTCUSDT $ETHUSDT @ByX
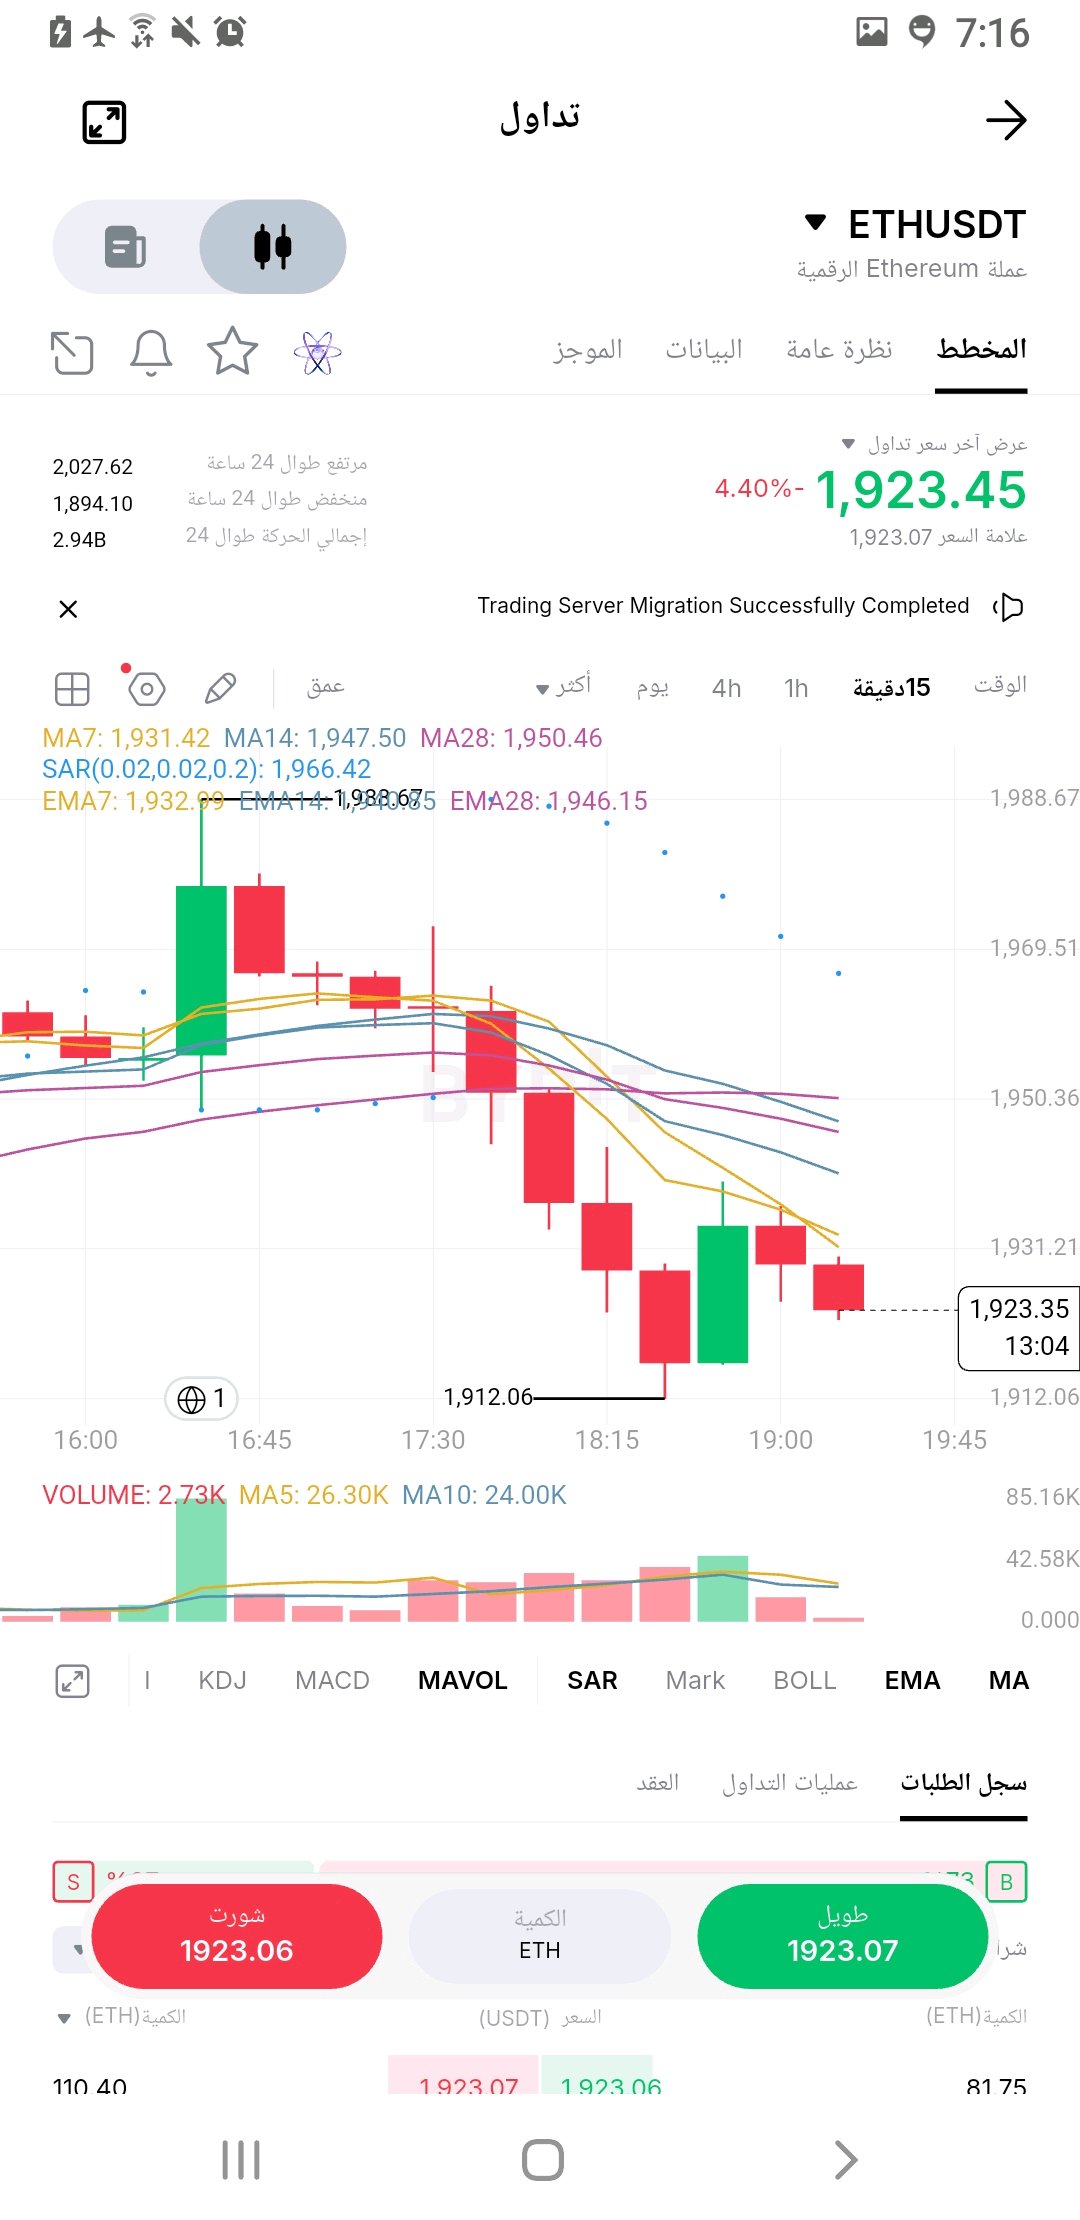
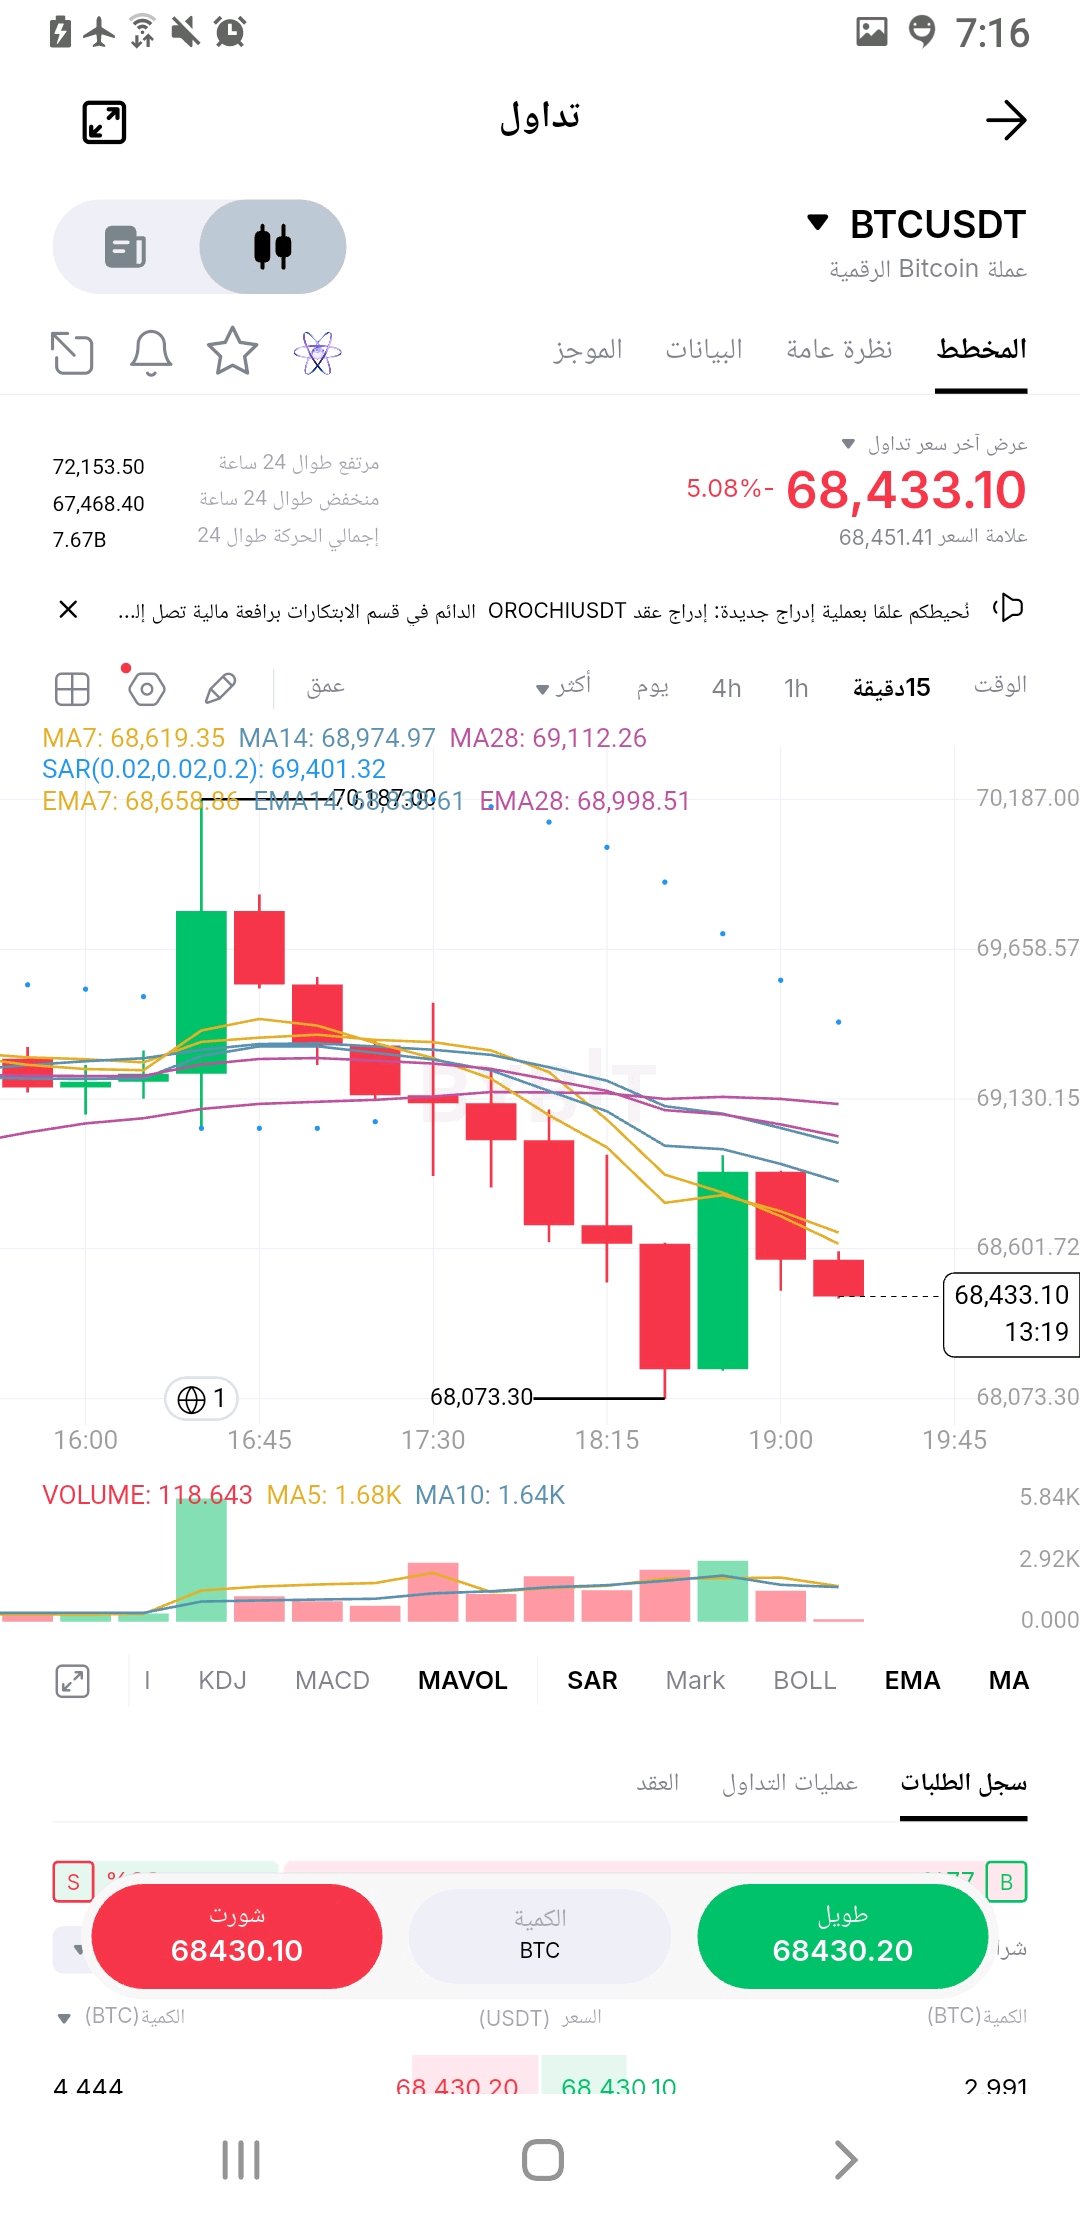
Those who bought are going to regret it
🚨🔥 The market is under heavy pressure! Bitcoin and Ethereum are facing a critical test.. Is a rebound near, or has a deeper drop begun? 📊 BTC & ETH Analysis – 15-minute timeframe 🟠 $BTC/USDT – Bitcoin 💰 Price: $68,433 📉 Decline: 5.08% The price is moving below the moving averages, with continued selling pressure and visible weakness in rebound attempts. 📍 First Support: $68,073 📍 Next Support: $67,468 🎯 First Resistance: $68,619 🎯 Second Resistance: $68,975 🎯 Key Resistance: $69,112 ⚠️ Breaking $68,073 could increase downward pressure, while reclaiming $69,112 might give buyers a chance to regain momentum. 🔵 $ETH/USDT – Ethereum 💰 Price: $1,923.45 📉 Decline: 4.40% Ethereum is showing clear selling pressure and is trading below the moving averages, with a rebound attempt that hasn't confirmed a trend reversal yet. 📍 First Support: $1,912 📍 Next Support: $1,894 🎯 First Resistance: $1,931 🎯 Second Resistance: $1,947 🎯 Key Resistance: $1,950 ⚠️ Breaking above and holding $1,950 could support a recovery attempt, but breaking $1,912 could lead to retesting lower support. 🔥 Bottom line: Bitcoin and Ethereum are under simultaneous selling pressure, and sellers remain in control on the short timeframe. 👀 Will we see a sudden rebound, or is the worst yet to come? 💬 Share your prediction: 🐂 Bullish rebound? 🐻 Bearish drop and deeper correction? ⚠️ Technical analysis, not investment advice. Wait for confirmation, and risk management first. #BTC #ETH #Bitcoin #Ethereum #Crypto #Trading #WSOT2026 #WSOTShowYourAITradeToEarn10USDT #USPPITestsTheHigherForLongerTrade $BTCUSDT $ETHUSDT
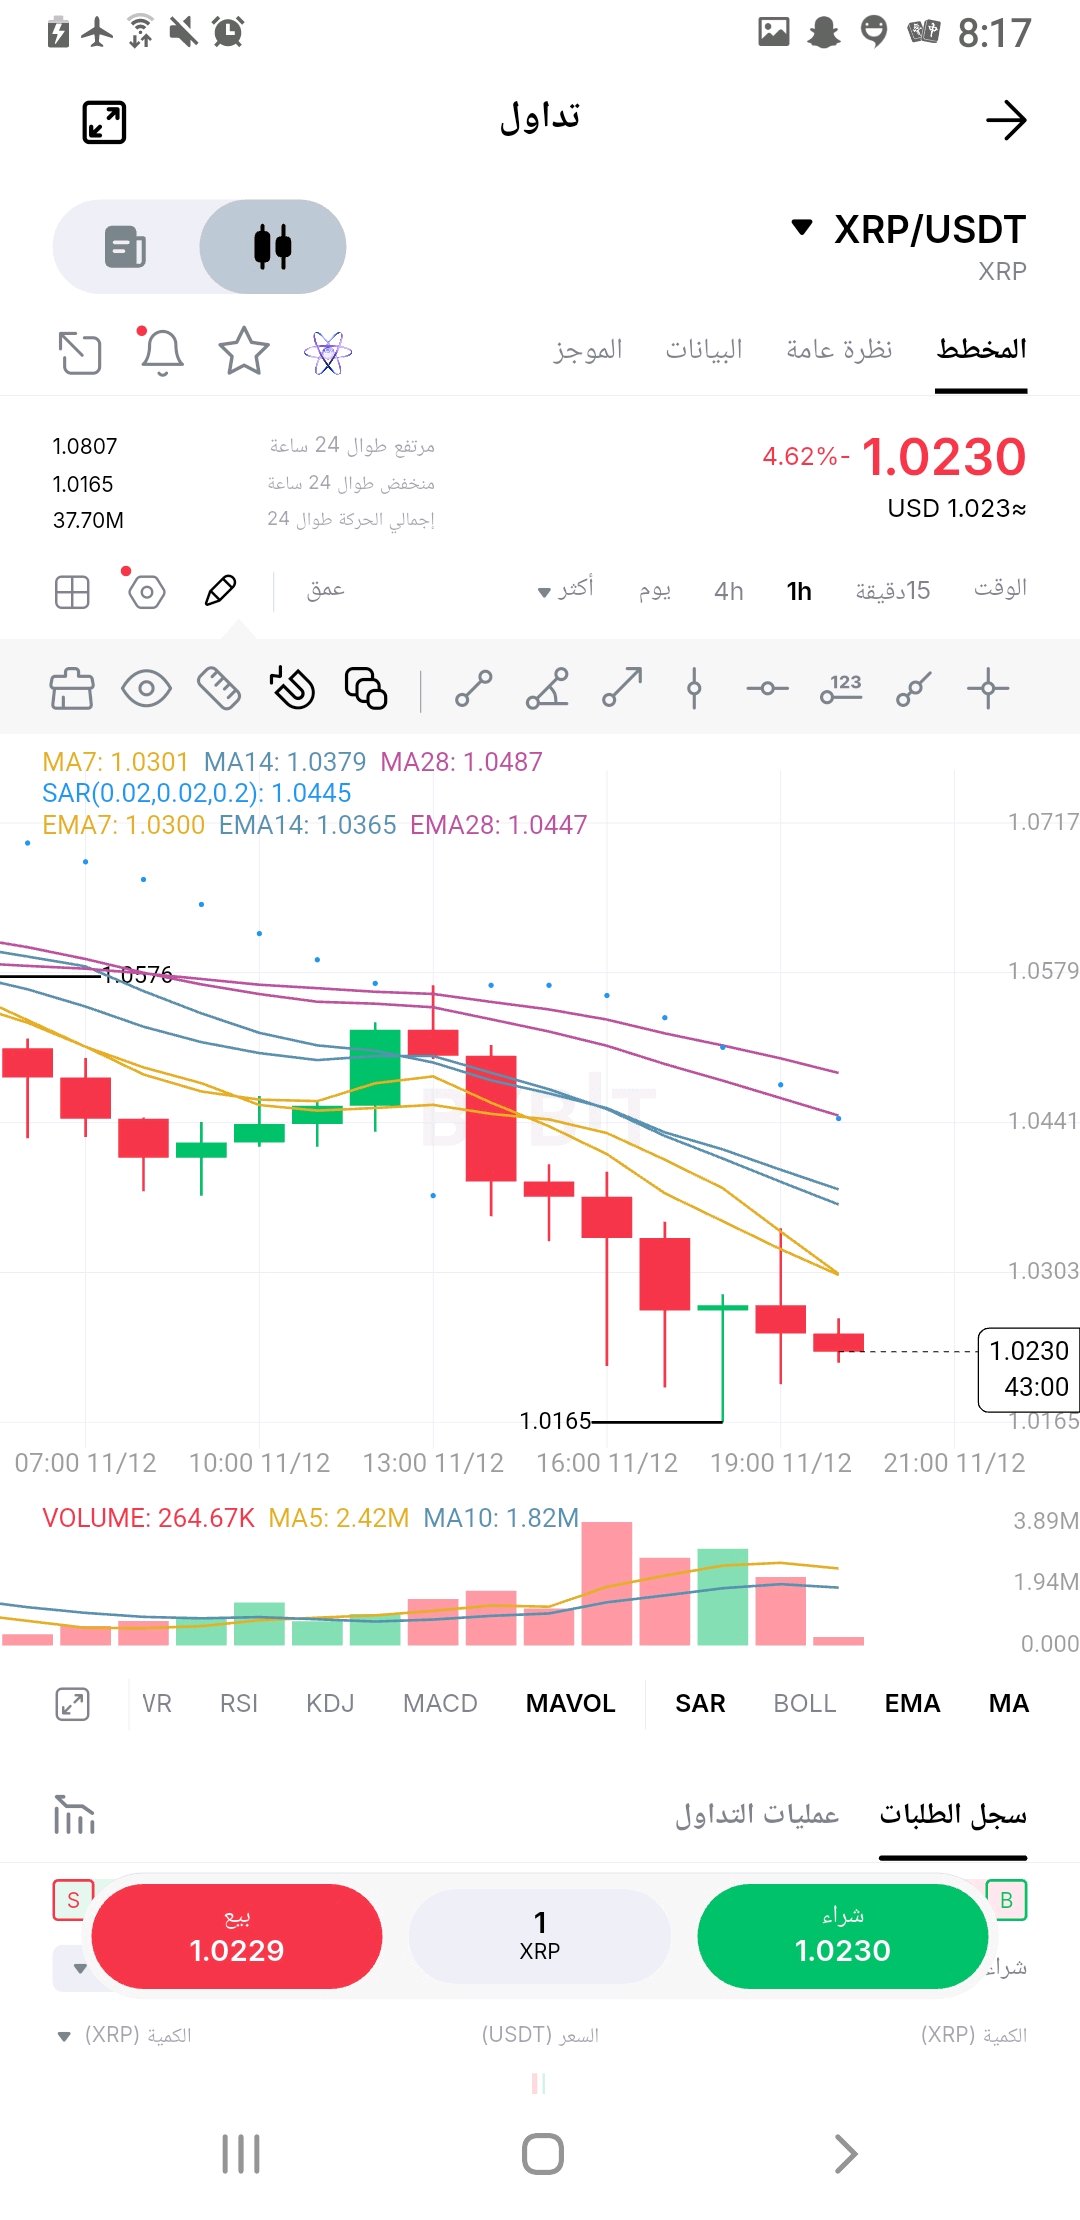
#ByXIMPACT Comprehensive analysis for **XRP/USDT** under the approved trading strategy: ### 📊 Market Overview and Current Price * **Current Price:** ~$1.04 * **Market Capitalization:** ~$66.2 billion * **24-Hour Trading Volume:** ~$511 million * **Weekly Performance:** A decline of ~13.5% with a test of the final support level near **$1.037**. ### 🌐 Fundamentals vs. Price Reality (The Missing Link) The XRPL ecosystem is experiencing notable institutional growth: * Global investment product inflows for XRP reached approximately **$355.3 million** in Q3. * Stablecoin supply on the network expanded to **$1.03 billion**. * Tokenized real-world assets (RWA) approached **$498.7 million**. > **The Core Distinction:** Expansion in stablecoin payments and institutional custody on the network does not automatically translate into immediate buying pressure on the native asset (XRP), explaining the current divergence between ecosystem growth and price suppression. > ### 📉 Derivatives Markets and Leverage * **Open Interest:** Stood at approximately **$2.27 billion** (down 3.18% over 24 hours). * **Funding Rate:** Positive at **+0.0085%** every 8 hours. * **Implication:** A pullback in leverage-driven risk exposure, with bullish positioning remaining cautious. The spot market remains the ultimate decider; a spot-backed recovery will be far more reliable than speculative futures bounces. ### 🎯 Critical Levels and Trading Plan * **Immediate Support:** $1.037 * **Psychological Support:** $1.00 * **Immediate Resistance:** $1.081 #### 🟢 Bullish Confirmation: A successful defense of the **$1.037** level, followed by reclaiming the **$1.081** resistance and holding above it with strong spot liquidity, opens the door to target **$1.10** and subsequently **$1.15**. #### 🔴 Bearish Confirmation: A breakdown below the **$1.037** level will expose the price to a test of the psychological barrier at **$1.00**, and a collapse beneath it will maintain absolute bear dominance. **Summary Outlook:** Institutional interest alone is not enough without concrete evidence of a liquidity shift favoring direct demand in the spot market. Caution remains the priority until the breakout of key resistance levels is confirmed. #XRPUSDT #ByXIMPACT $XRPUSDT $HYPEUSDT #WSOT2026 #USInflationRunsHotAndRateHikeBetsRise #SanDiskAnnounces8For1StockSplit #NovUSCPIWatch @ByX
I converted $100 into $1000
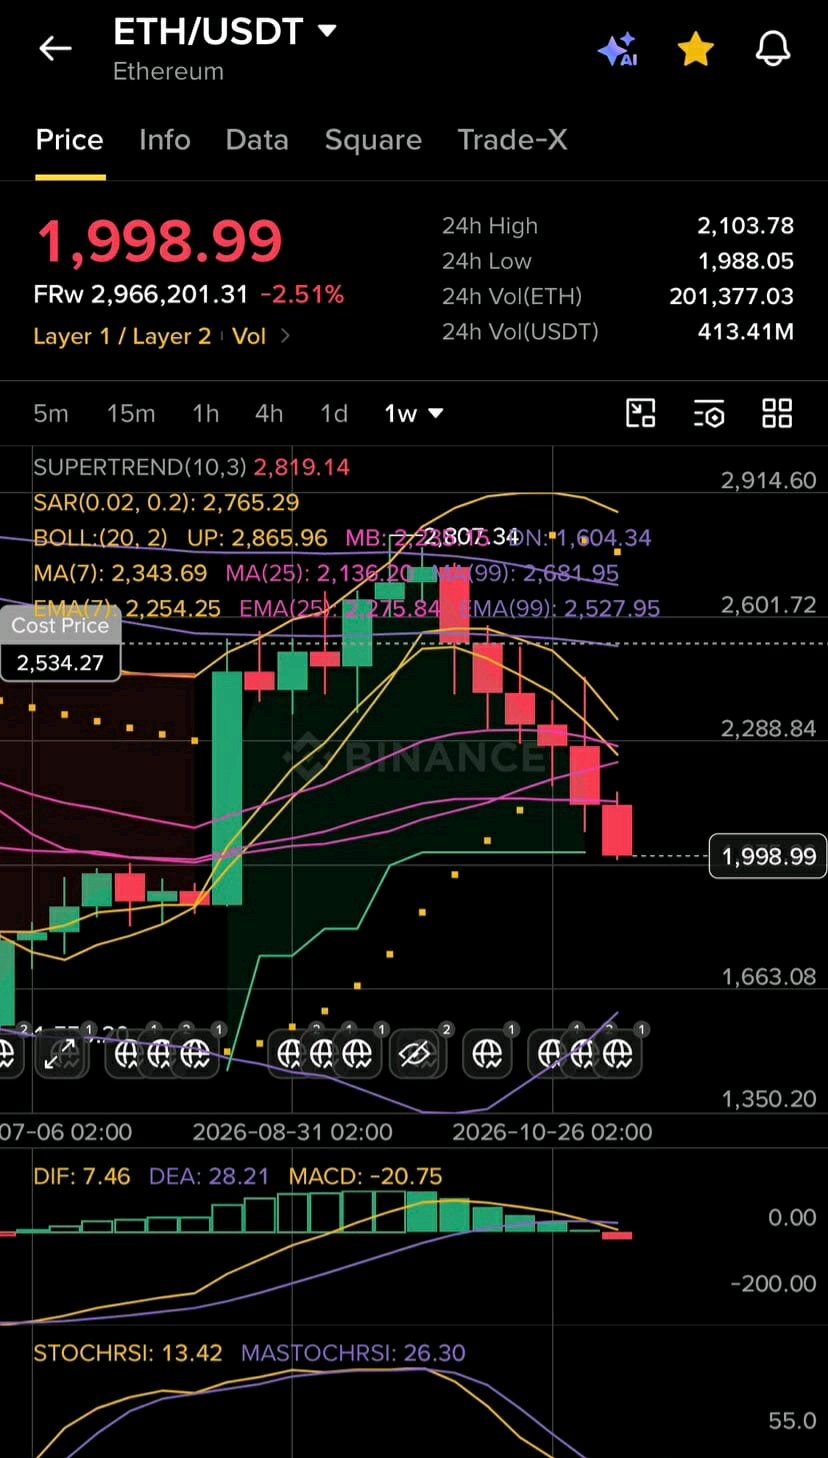
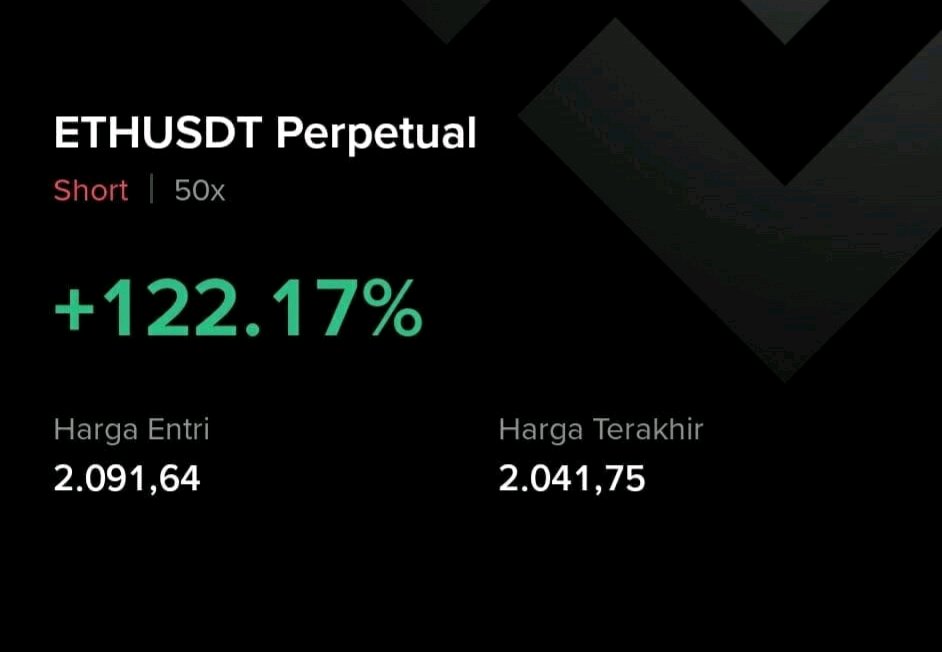
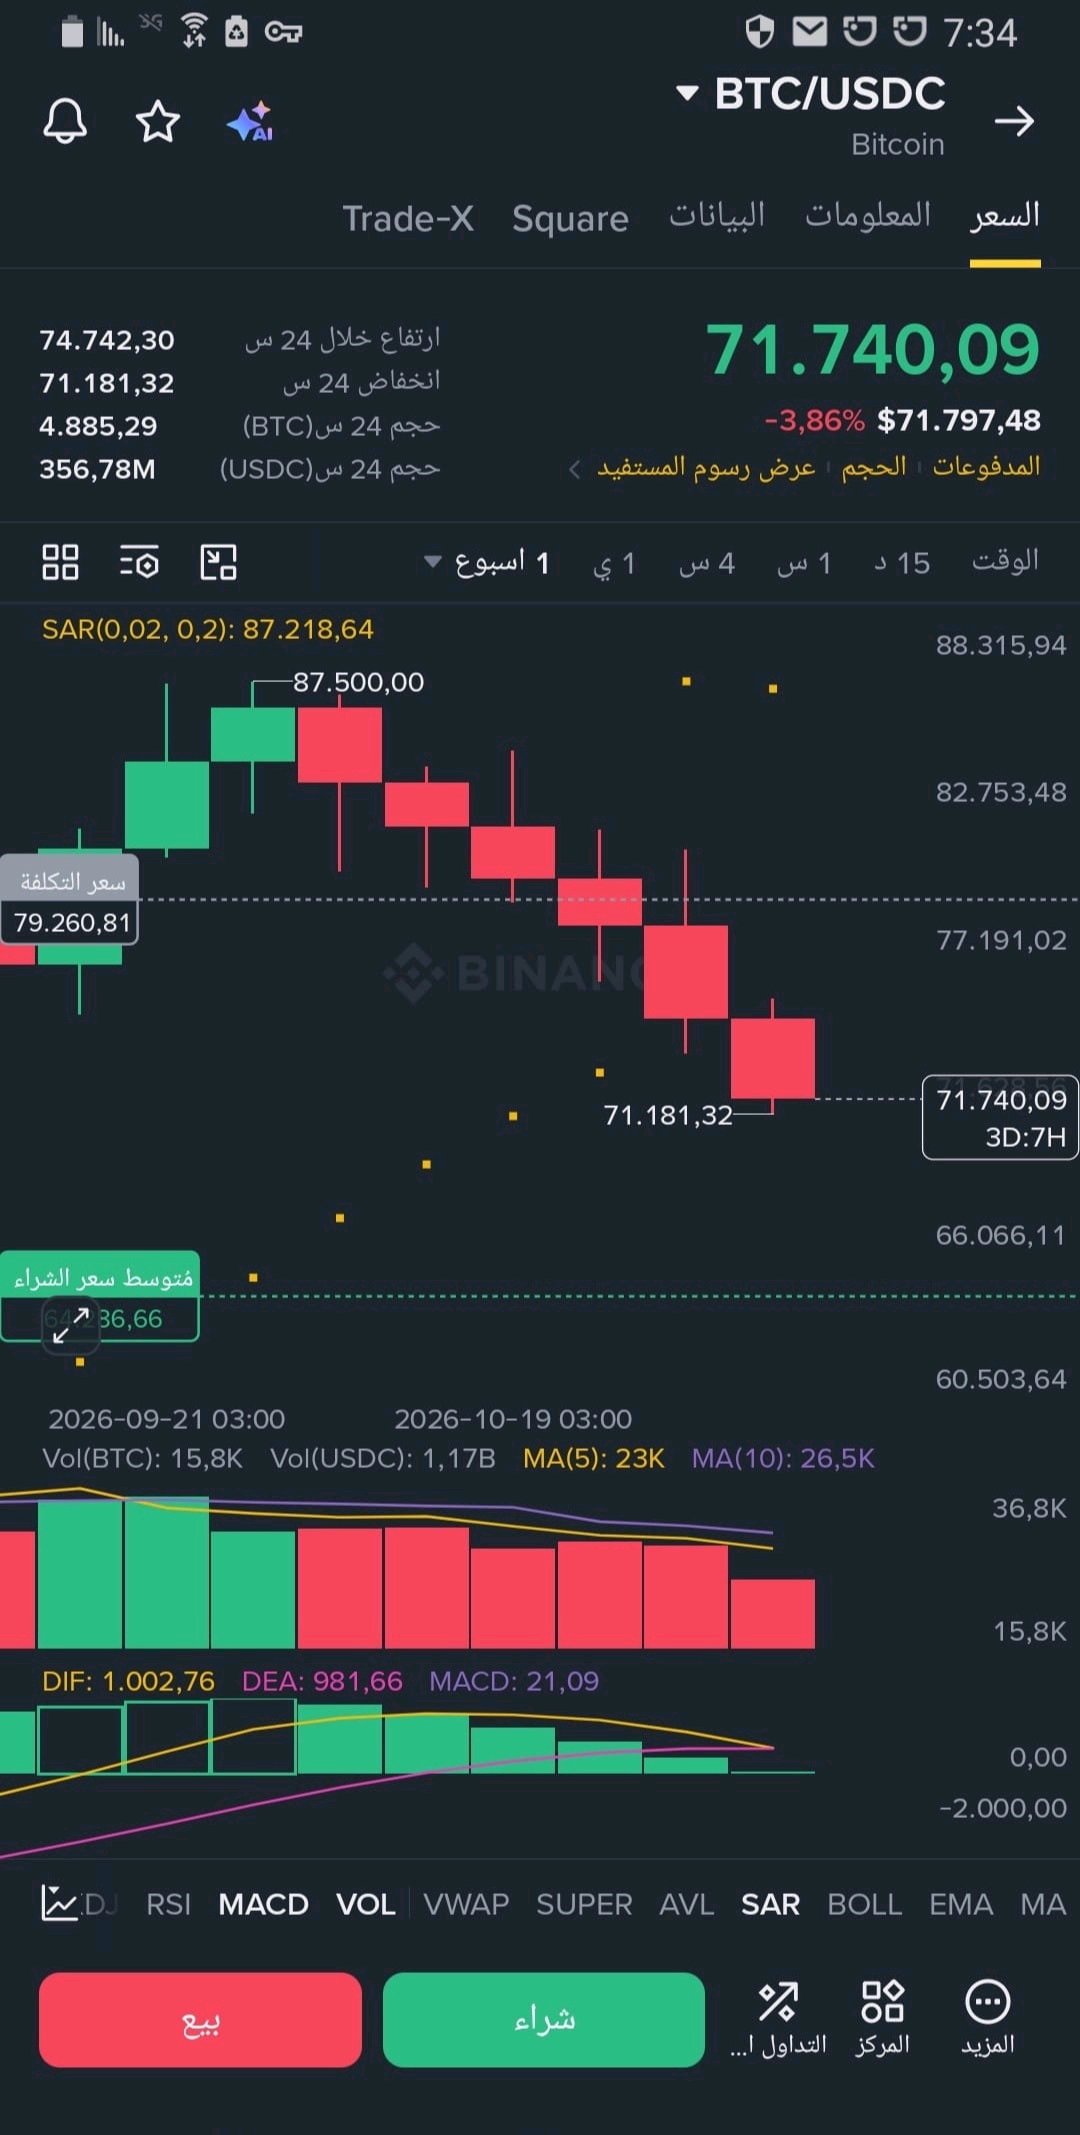
🚨🔥 ETH$ETHUSDT at a crucial point... Will Ethereum regain its strength and return above $2,030? 💎 ETH/USDT | 15-minute timeframe 💰 Current price: $2,006 🟢 Entry zone: $2,000 – $2,006 🚀 Bullish confirmation: Breakout above $2,015 🎯 TP1: $2,020 🎯 TP2: $2,027 🎯 TP3: $2,038 🔥 Extended target: $2,050 🛑 Stop loss: $1,982 📊 Technical analysis: A bounce from $1,982 towards $2,027, but the price is facing resistance at the 28-period EMA near $2,015. A break above this level could strengthen the chances of a continued recovery. 🐂 Is Ethereum poised for a bullish surprise? Eyes on $2,015! #ETH #Ethereum #Crypto #Bybit #Trading ⚠️ Technical analysis only, not a guarantee of profit. Await confirmation and manage your risk first. #WSOT2026 #USInflationRunsHotAndRateHikeBetsRise #SanDiskAnnounces8For1StockSplit #AITechSelloffErases2Point5TrillionFromNasdaq100 #ByXIMPACT 🚨🐋 $BTC$BTCUSDT faces a crucial bounce zone... Will Bitcoin reclaim the $73,000 level? 💎 BTC/USDT | 15-minute timeframe 💰 Current price: $71,751 🟢 Entry zone: $71,500 – $71,800 🚀 Bullish confirmation: Breakout above $72,000 🎯 TP1: $72,250 🎯 TP2: $72,500 🎯 TP3: $72,730 🔥 Extended target: $73,000 🛑 Stop loss: $71,200 📊 Technical analysis: A bounce from the $71,205 low is underway, with an attempt to recover the short-term averages, but the trend remains cautious. A break above $72,000 could give buyers an opportunity to continue the recovery. 🔥 Bitcoin under scrutiny... Is a recovery beginning? #BTC #Bitcoin #Crypto #Bybit #Trading ⚠️ Technical analysis only, not a guarantee of profit. Wait for confirmation and manage your risk first. @ByX
I converted $10 into $100
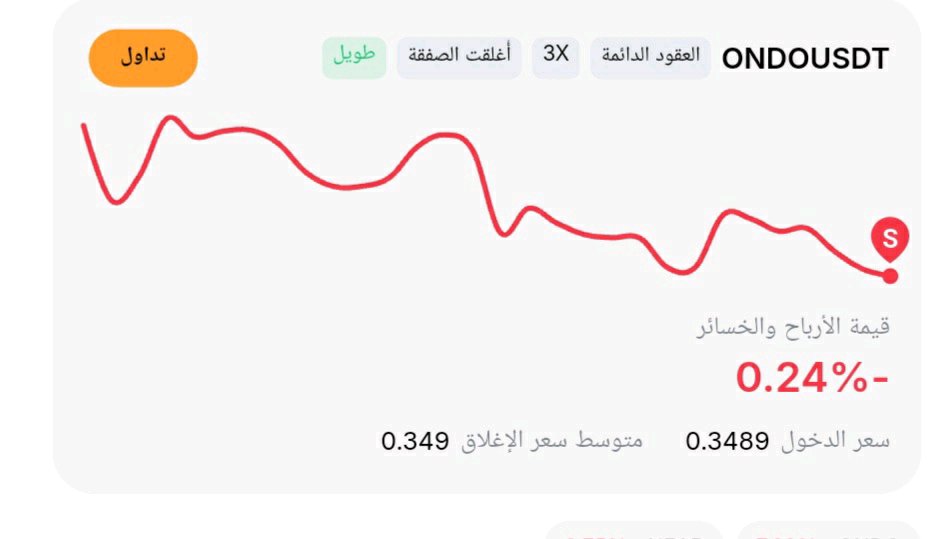
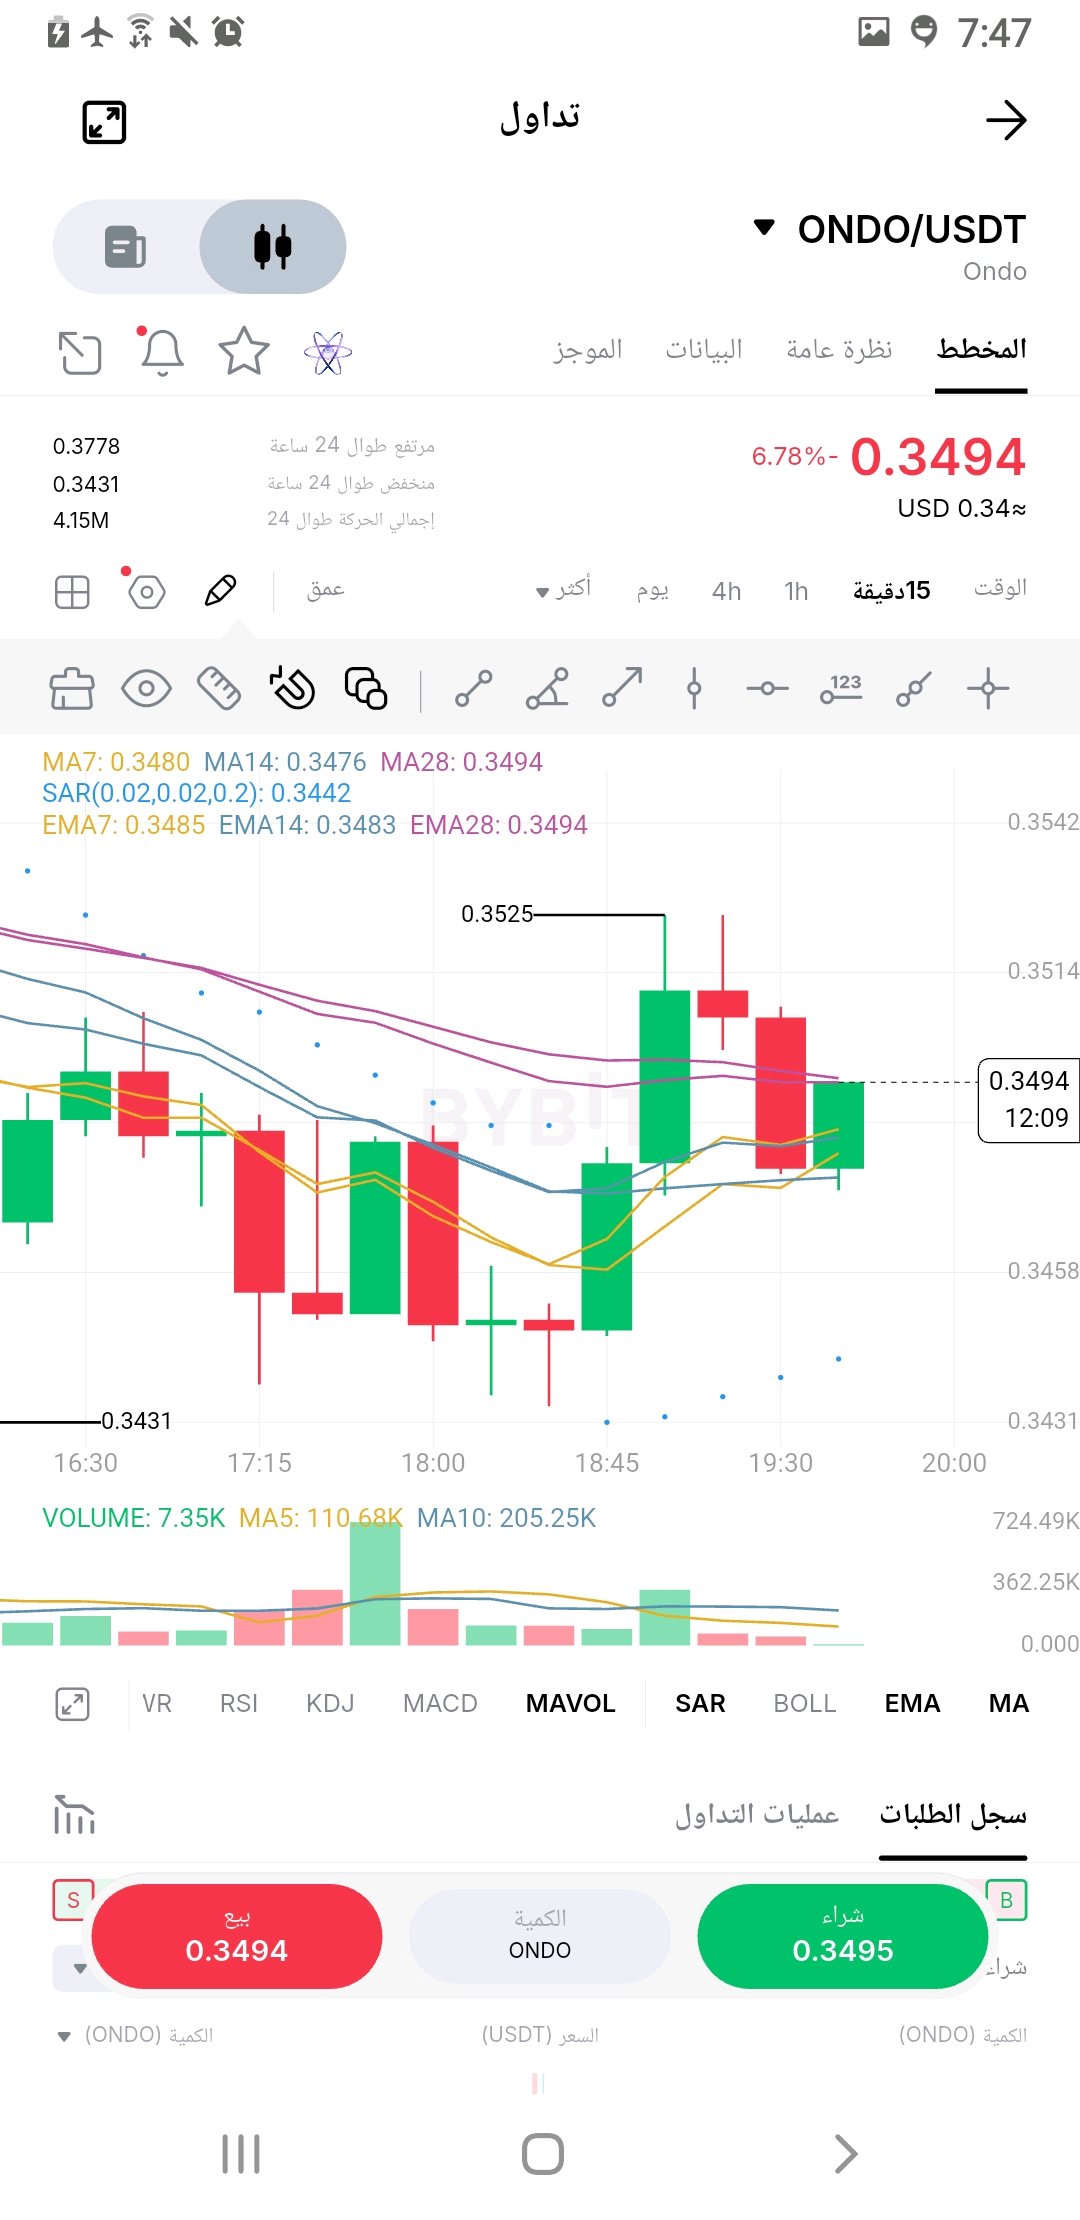
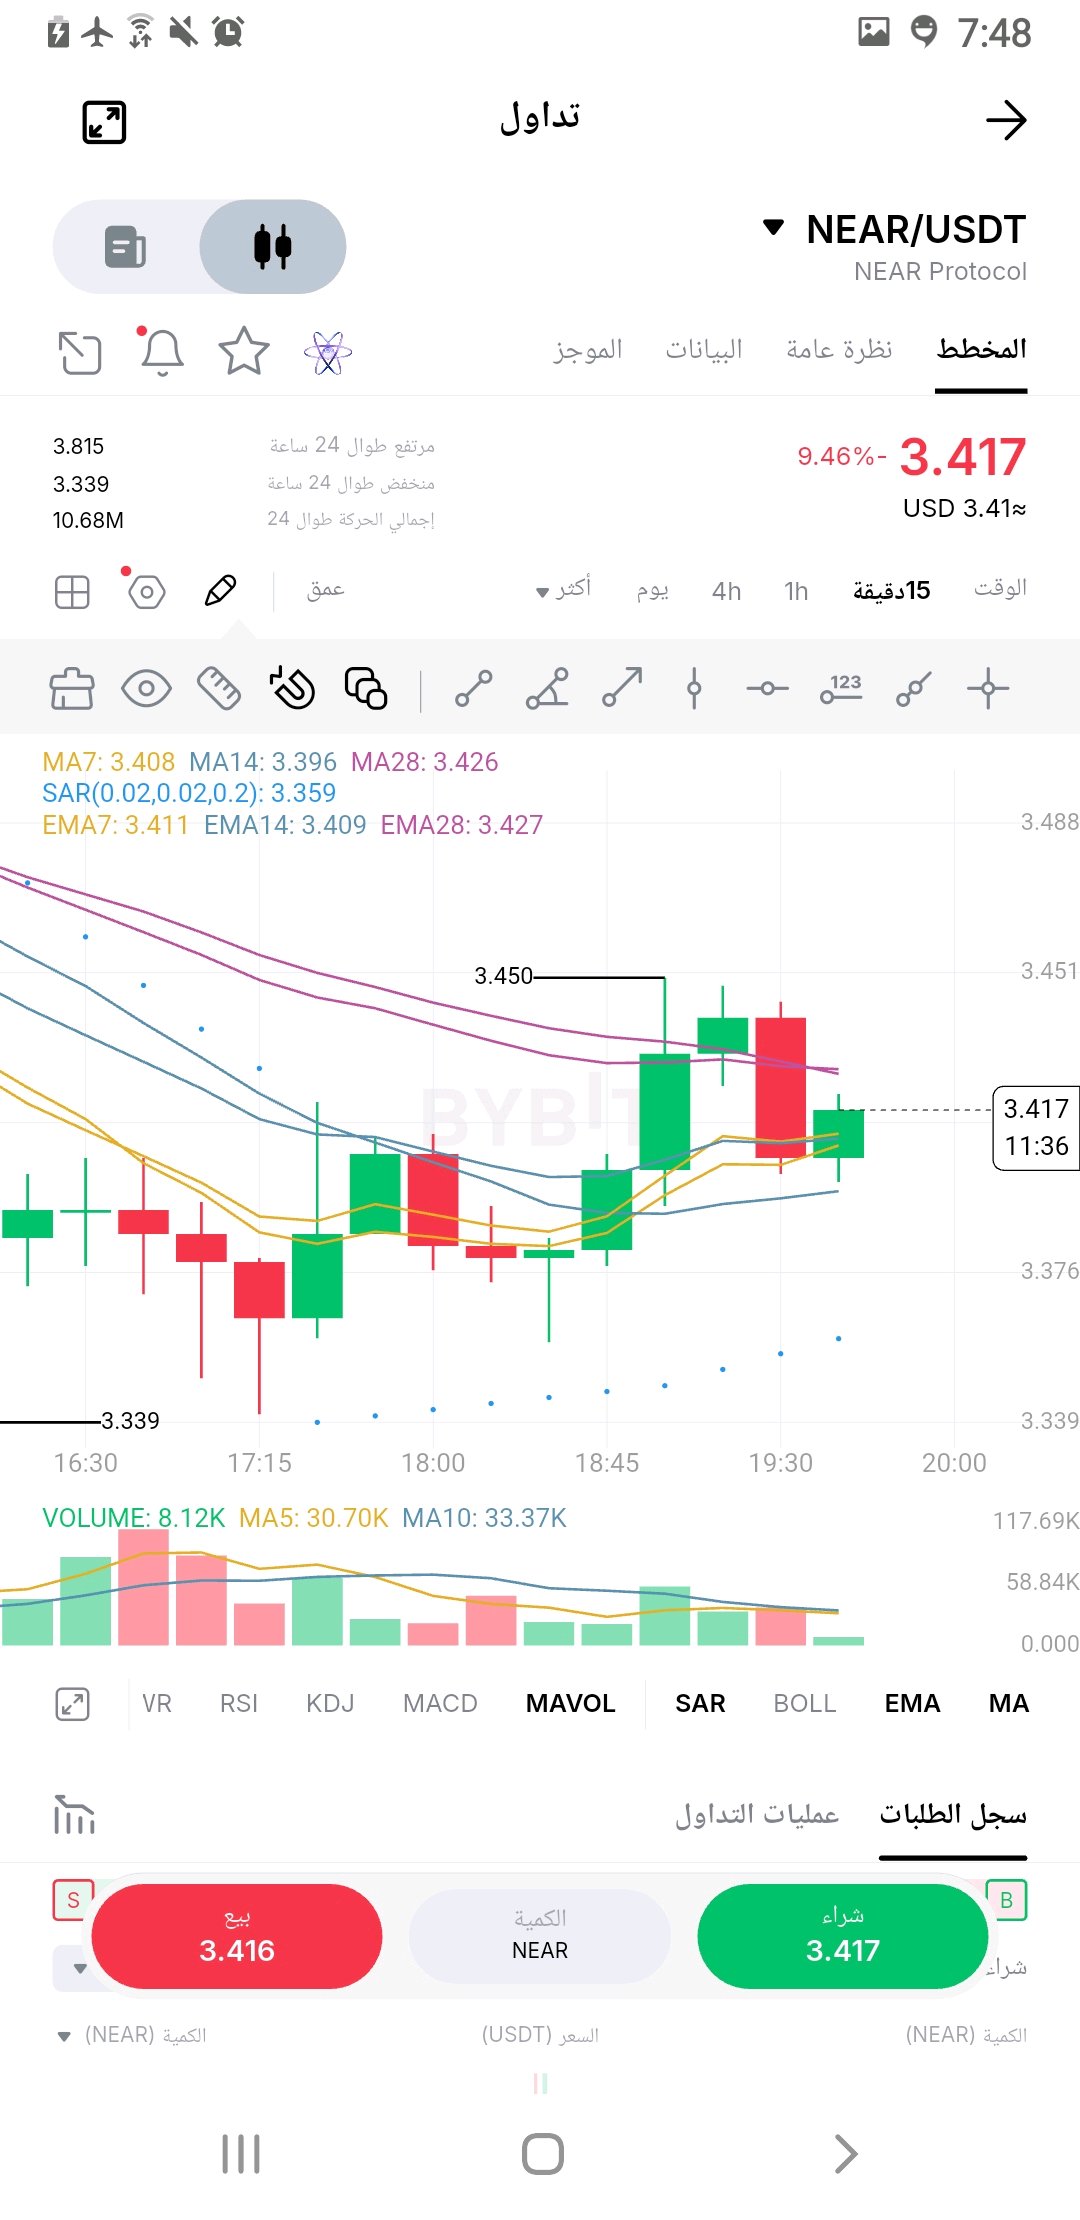
🚨🔥 $$ONDOUSDT ONDO is moving in a critical zone.. Is the bullish explosion near? 💎 ONDO/USDT | 15-minute timeframe 💰 Current Price: $0.3494 🟢 Entry: $0.3470 – $0.3495 🚀 Breakout Confirmation: $0.3525 🎯 TP1: $0.3540 🎯 TP2: $0.3580 🎯 TP3: $0.3650 🔥 Extended Target: $0.3770 🛑 Stop Loss: $0.3430 📊 Technical: Rebound from $0.3431 and an attempt to regain momentum above moving averages. A breakout of $0.3525 could give buyers a new advantage. 🐂 Will $ONDO be the next upward surprise? #ONDO #Crypto #Bybit #Trading #Altcoins ⚠️ Technical analysis, not a guarantee of profit. Manage risk first. #WSOT2026 #USInflationRunsHotAndRateHikeBetsRise #SanDiskAnnounces8For1StockSplit #BitcoinHitsTwoMonthLowAfterUSMidterms #ByXIMPACT 🚨🔥 NEAR$NEARUSDT is poised for another upward attempt... Will we see a breakout above $3.45? 💎 NEAR/USDT | 15-minute timeframe 💰 Current Price: $3.417 🟢 Entry Zone: $3.400 – $3.420 🚀 Bullish Confirmation: Breakout above $3.450 🎯 TP1: $3.480 🎯 TP2: $3.520 🎯 TP3: $3.580 🔥 Extended Target: $3.650 🛑 Stop Loss: $3.375 📊 Technical Analysis: A bounce from $3.339 with the price returning above the short-term averages, attempting to regain upward momentum. The $3.450 level currently represents the most significant resistance. 🐂 Is NEAR preparing for a strong upward surge? All eyes are on the breakout! #NEAR #Crypto #Bybit #Trading #Altcoins ⚠️ Technical analysis is not a guarantee of profit. Do not enter before confirmation, and manage risk first. @ByXIMPACT @ByX
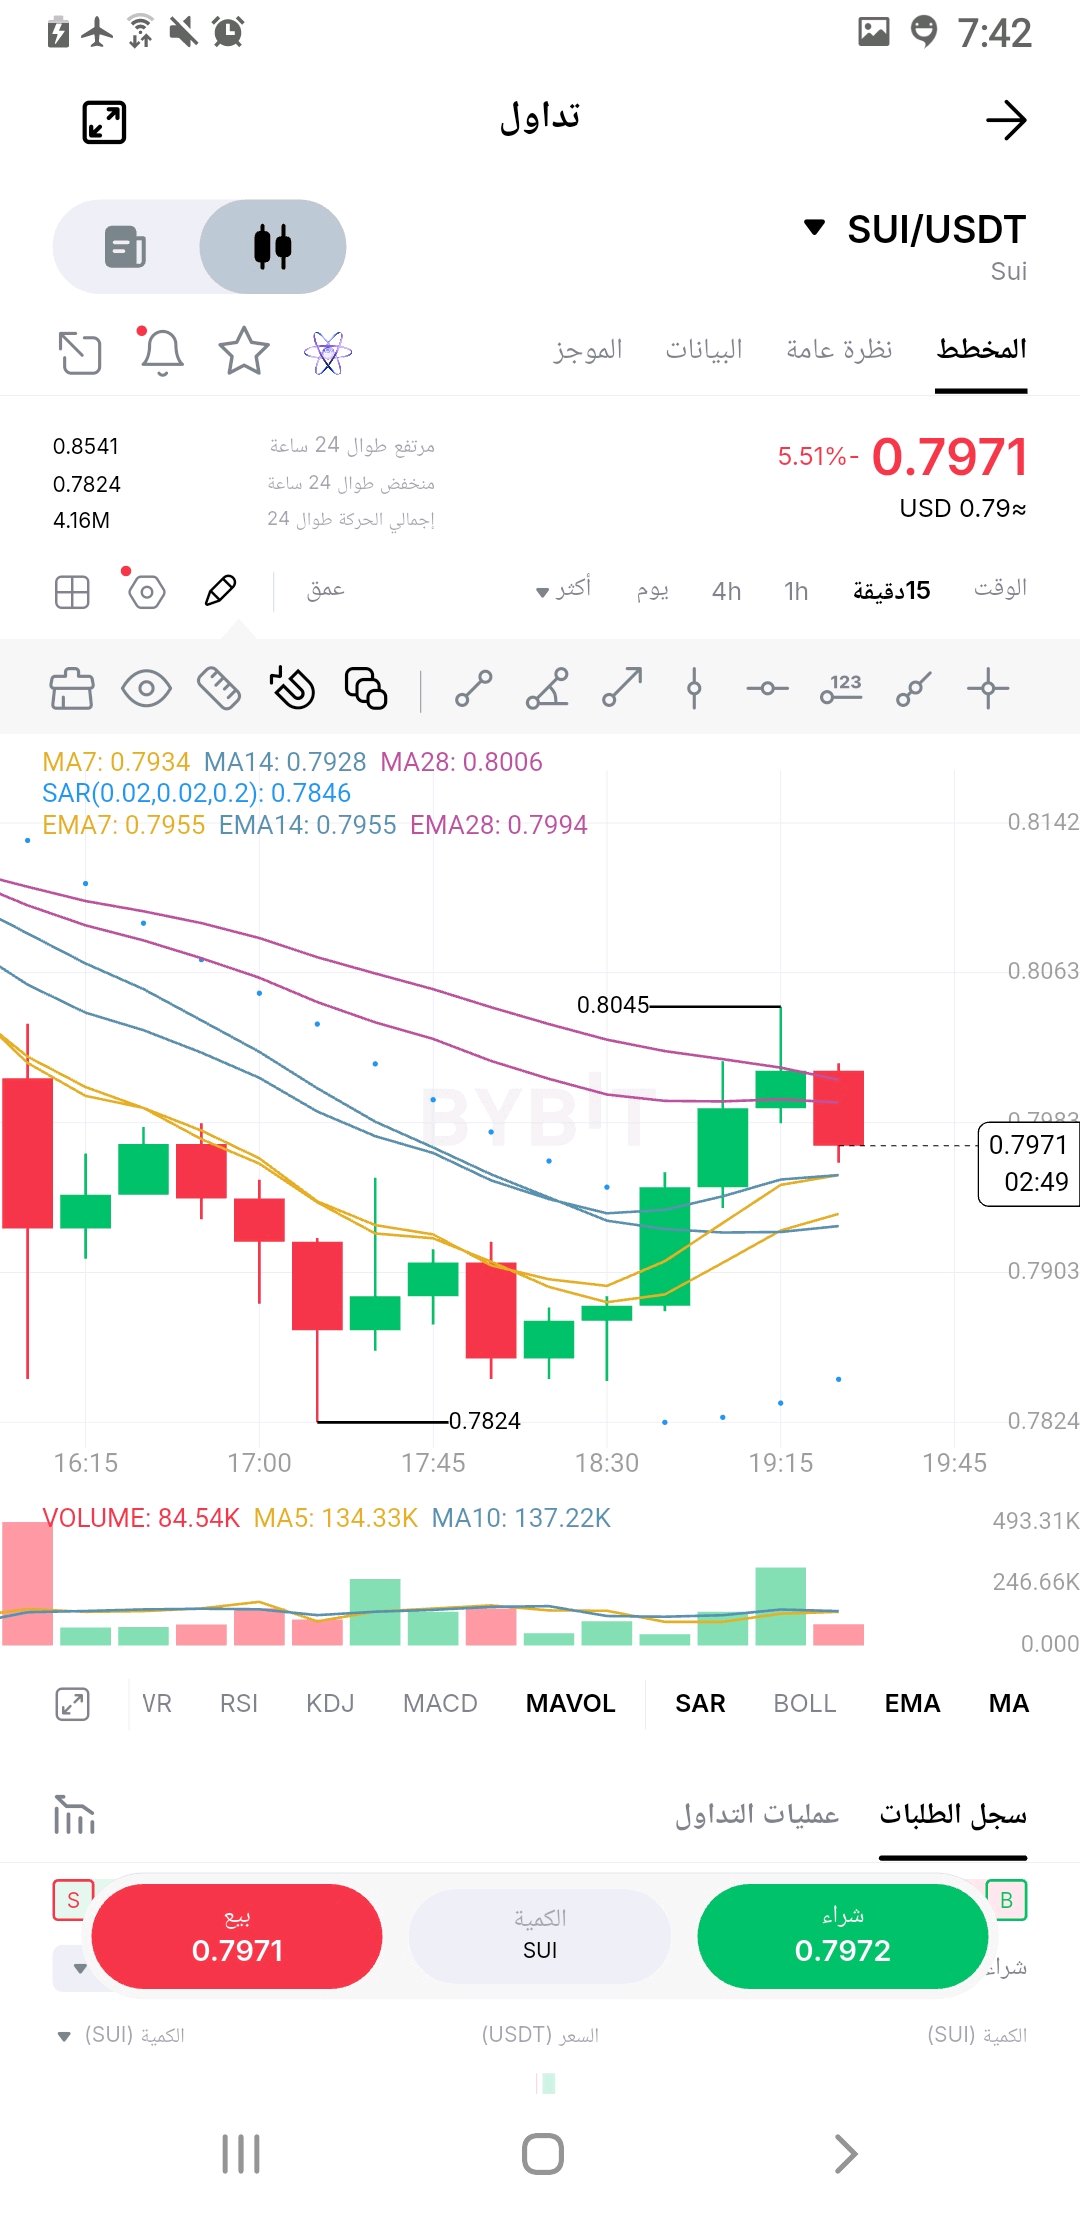
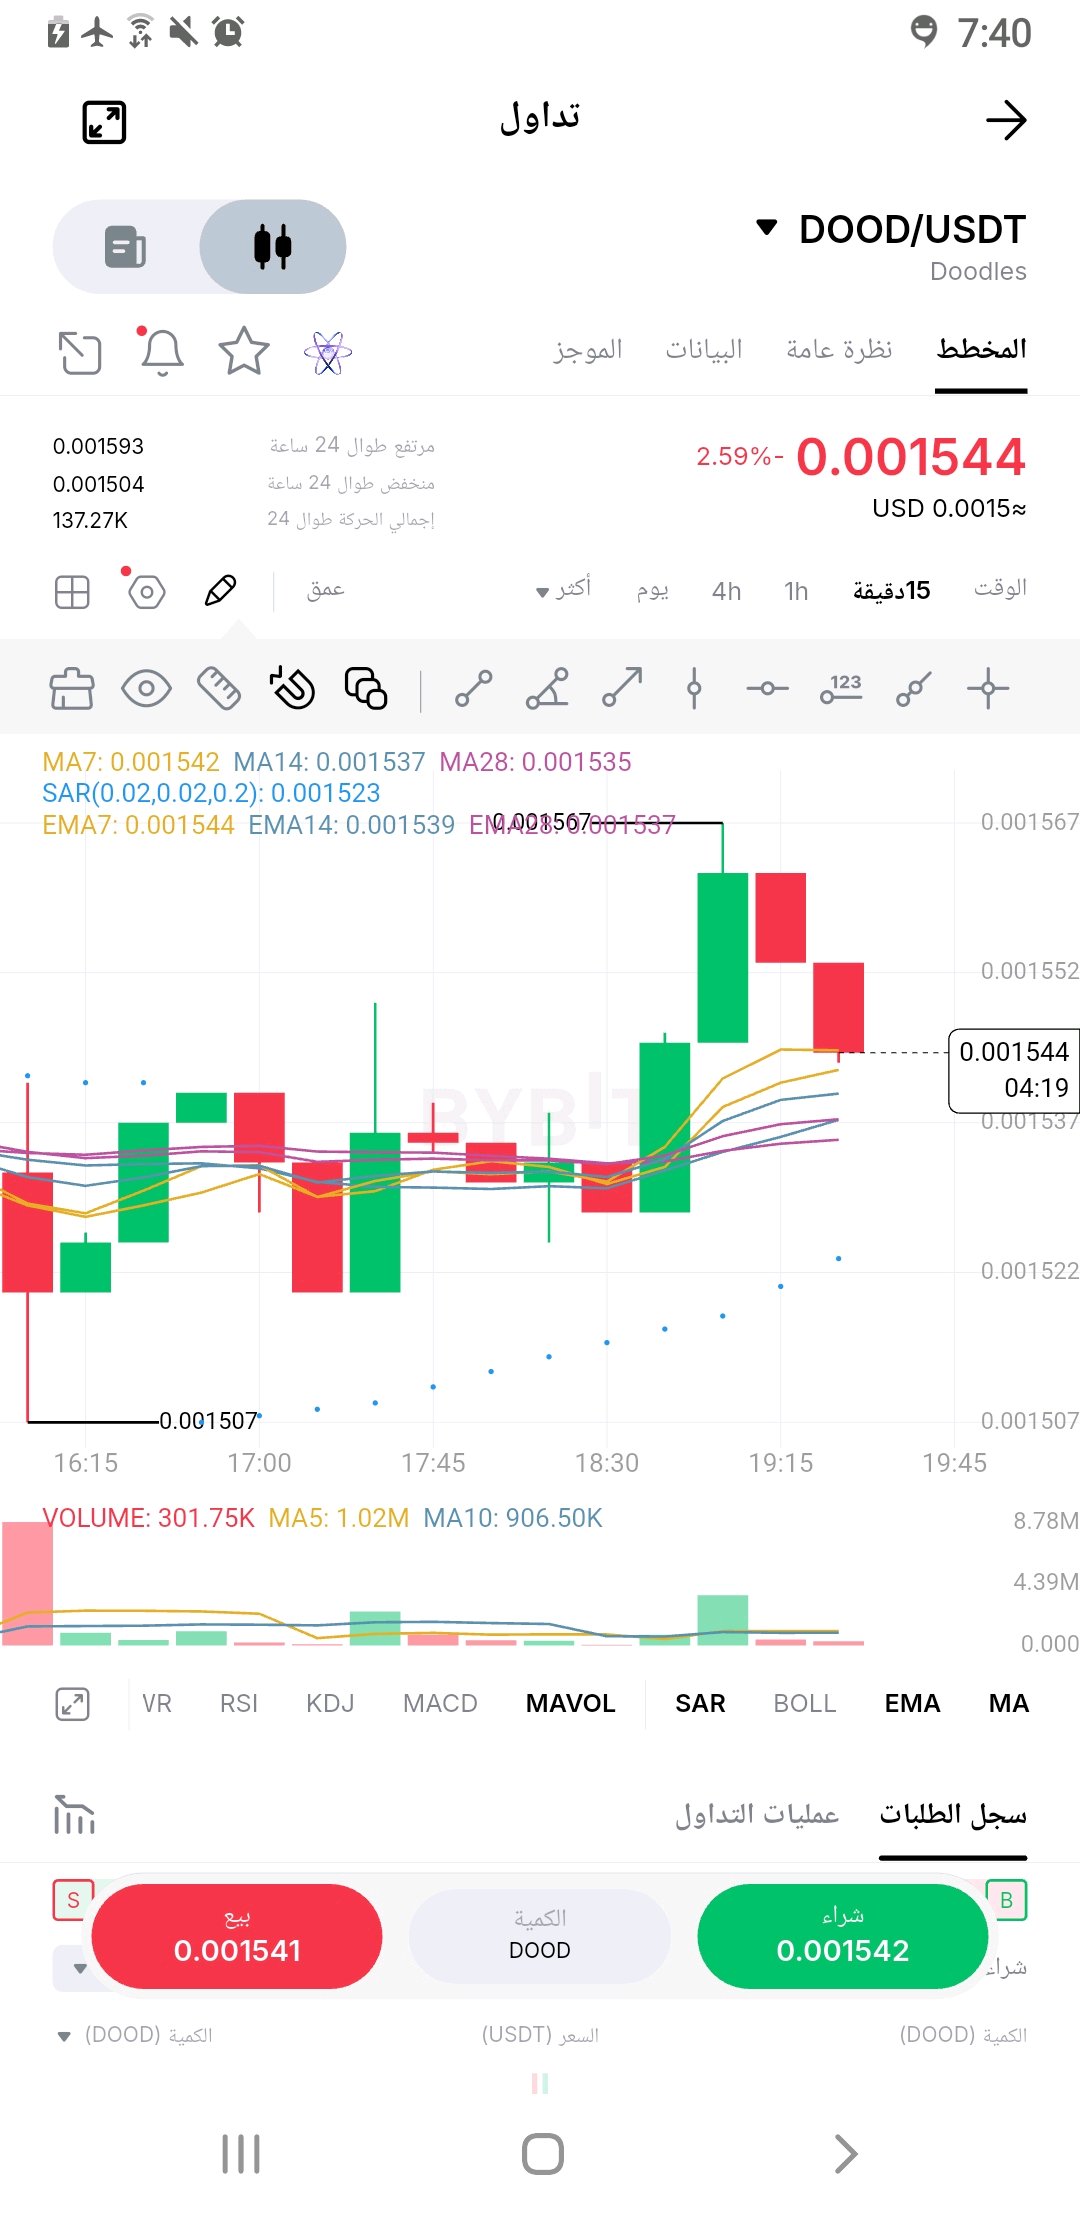
🚨🔥 $SUIUSDT faces a crucial test... Will we see a move towards $0.85? 💎 SUI/USDT | 15-minute timeframe 💰 Current price: $0.7971 🟢 Entry zone: $0.7930 – $0.7970 🚀 Bullish confirmation: Breakout above $0.8050 🎯 TP1: $0.8100 🎯 TP2: $0.8200 🎯 TP3: $0.8350 🔥 Extended target: $0.8500 🛑 Stop loss: $0.7820 📊 Analysis: A clear bounce from $0.7824, and the price is attempting to hold above the short-term averages. Resistance at $0.8000–$0.8045 is key to the next move. 🐂 Will recover to the $0.85 level, or will sellers regain control? #SUI #Crypto #Bybit #Trading #Altcoins ⚠️ Technical analysis, not a guarantee of profit. Risk management first. ByXIMPACT #ByXIMPACT #WSOT2026 #USInflationRunsHotAndRateHikeBetsRise #SanDiskAnnounces8For1StockSplit #BitcoinHitsTwoMonthLowAfterUSMidterms 🚨 $DOOD$DOODUSDT is waking up again... Is the bullish wave about to begin? 🚀🔥 💎 DOOD/USDT | 15-minute timeframe 💰 Price: $0.001544 🟢 Entry: $0.001538 – $0.001545 🎯 TP1: $0.001552 🎯 TP2: $0.001567 🚀 TP3: $0.001590 🛑 Stop Loss: $0.001518 📊 The price is holding above the moving averages MA7, MA14, and MA28 after a strong upward surge, with a pullback to test the support zone. 🔥 A break above $0.001567 could open the door for a new bullish wave! 🐂 Will $DOOD be the next market surprise? #DOOD #Crypto #Bybit #Altcoins #Trading ⚠️ Technical analysis is not a guarantee of profit. Risk management first. @ByX
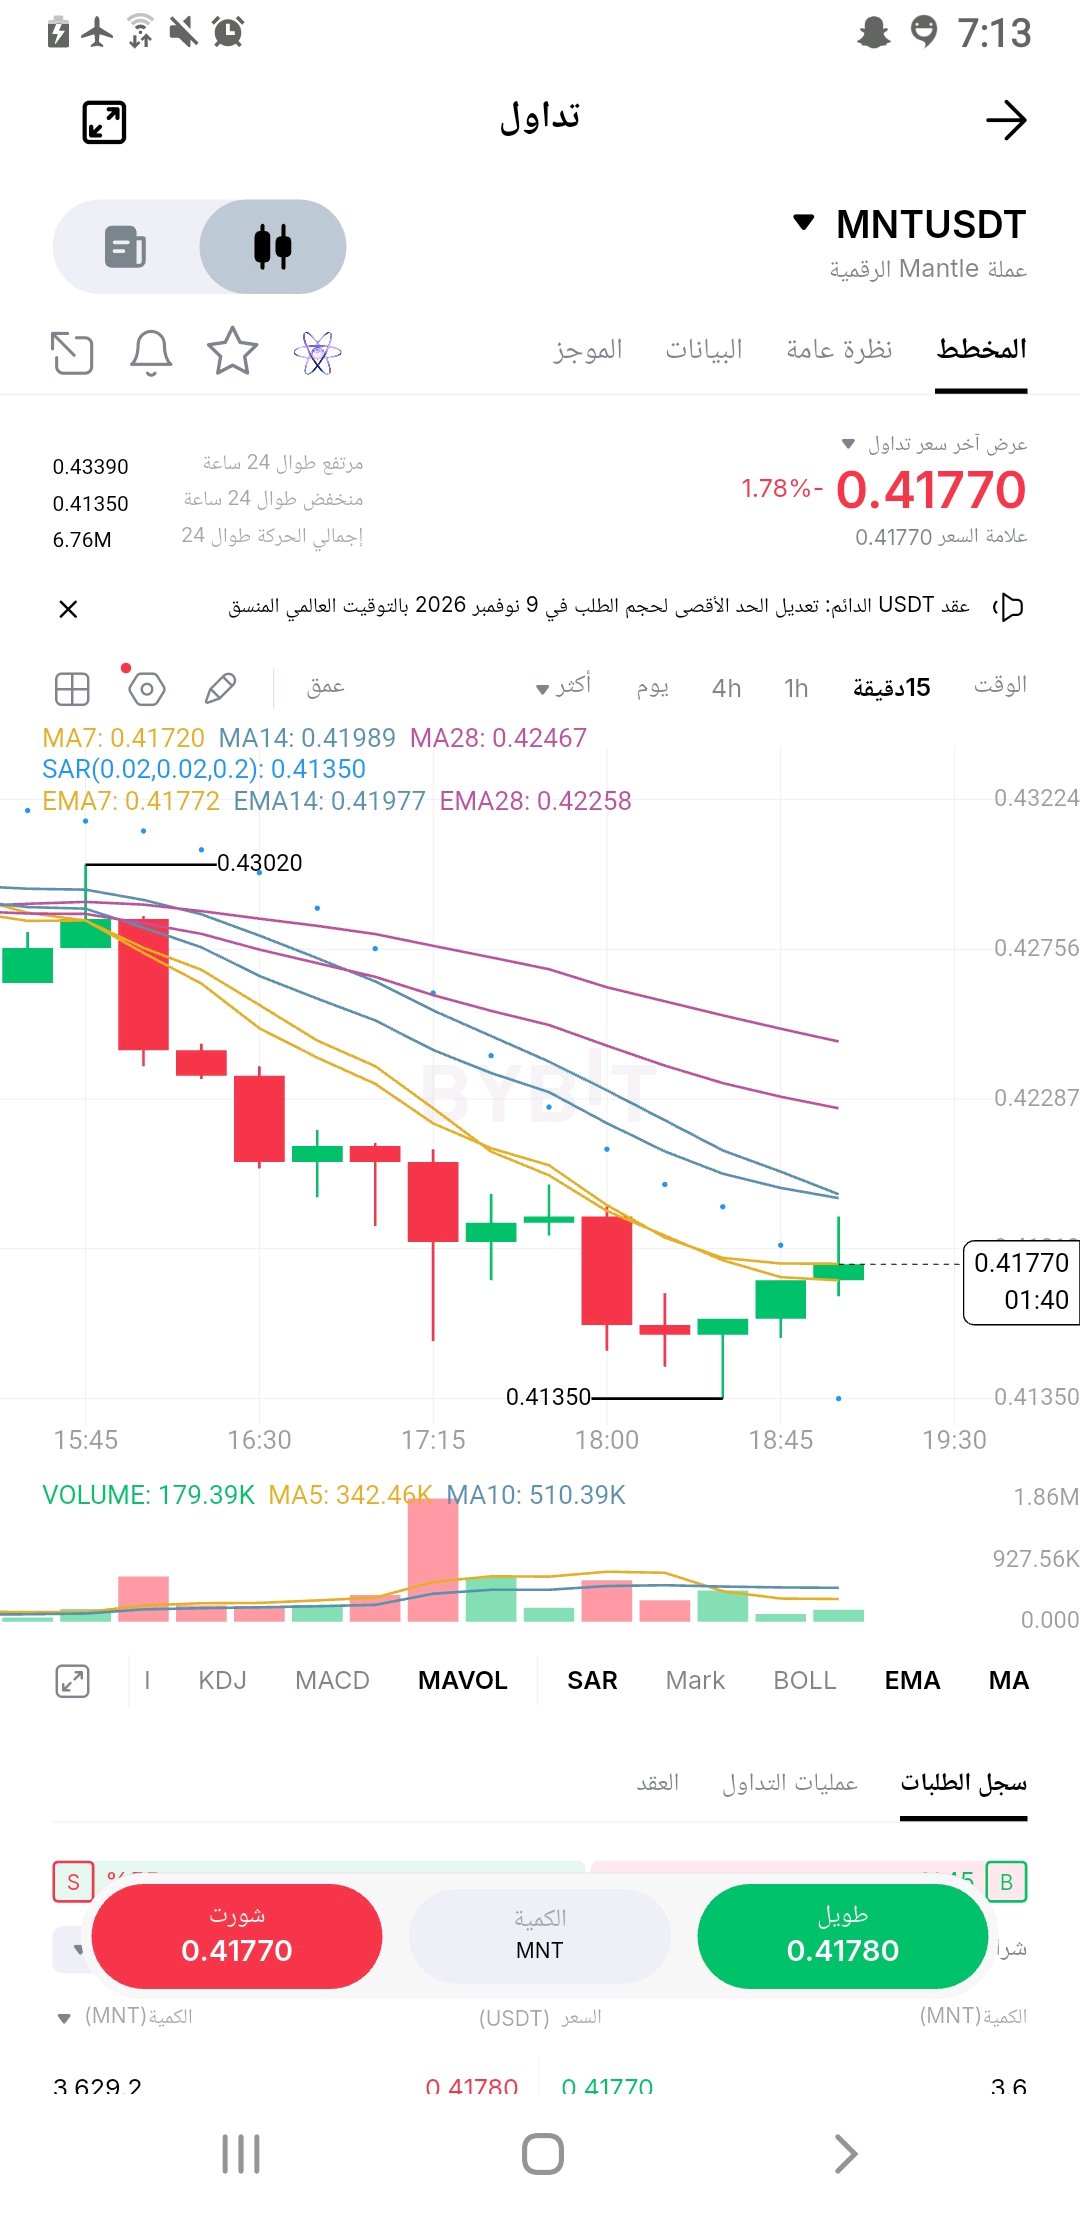
🚨 MNT is poised for a strong move! Has the bullish bounce begun? 🔥 💎 MNT/USDT | 15-minute timeframe 💰 Current price: $0.4177 🟢 Entry zone: $0.4170 – $0.4190 🚀 Bullish confirmation: Breakout above $0.4200 🎯 TP1: $0.4225 🎯 TP2: $0.4245 🎯 TP3: $0.4280 🛑 Stop loss: $0.4130 📊 A bounce from the $0.41350 support is underway as the price attempts to regain momentum, but the trend still needs confirmation with a break above the $0.4200 resistance. 🔥 All eyes are on MNT... Will we witness a new surge? #MNT #Crypto #Bybit #Trading #Altcoins ⚠️ Technical analysis is not a guarantee of profit. Risk management is key. #WSOT2026 #USInflationRunsHotAndRateHikeBetsRise #USPayrollsAndRateDecisionsDriveMacroWeek #NovUSCPIWatch $MNTUSDT #ByXIMPACT $SUIUSDT @ByX
It collapses versus HYPE awakens!
🚨 Dual Technical Analysis: AAVE $AAVEUSDT is collapsing vs. HYPE$HYPEUSDT is waking up! Is it time to enter? Based on the attached charts (ultra-short timeframe - minutes/hours), we notice a sharp divergence in price behavior between the two coins. Here is the precise technical breakdown of each: 🔴 First Chart: AAVE/USDT (Bearish Performance) Timeframe: Appears to be 15-minute or 1-hour. Current Price: $112.90 (sharp decline of -8.41%). · Price Structure: Very strong downtrend. The price has broken successive support levels (highest peak at 125.25). · Moving Averages (MA/EMA): All stacked above the price (between 113.82 and 119.16). The price is trading below the shorter average (EMA7 = 113.90), preventing any upward attempt for now. · Parabolic SAR: Dots are above the candles (at 114.54), confirming the continuation of the bearish momentum. · Liquidity (Order Book): Selling ratio is higher (52%) vs. buying (48%). Speculators prefer selling. · Trading Volume: There was a massive previous red candle with very high trading volume, followed by a green candle (a breath-catching attempt), but it did not break any notable resistance. · Summary: The situation is dangerous for buyers. There are no reversal signals so far. Current support at 110.79 (recorded low) is the last line of defense before further downside. 🟢 Second Chart: HYPE/USDT (Bullish Performance) Timeframe: 15-minute timeframe. Current Price: $71.222 (-2.94% daily decline, but a very strong recent recovery). · Price Structure: Strong V-shape rebound from the bottom at 69.526. The current price is testing a critical resistance zone (71.300) which it recently broke upward. · Moving Averages (MA/EMA): Fast averages (MA7 and EMA7) crossed upward, piercing through the slower averages. The price is trading clearly above the averages (70.681 to 70.884), giving a bullish momentum signal. · Parabolic SAR: Dots are below the candles (at 69.663), confirming buyer dominance. · Liquidity (Order Book): A very clear imbalance! The buying ratio reaches 85% vs. 15% selling. This is massive buying pressure. · Trading Volume: Very high trading volumes accompanying the rising green candles, indicating real money entering to push the price up. · Summary: The situation favors buyers. Breaking the 71.300 level with such high volume gives a positive signal, though caution is required for a retest. 💡 Final Evaluation and Trading Advice: | Comparison Point | AAVE/USDT | HYPE/USDT | |---|---|---| | **Trend** | Bearish | Short-term Bullish | | **Liquidity** | Balanced (slight selling bias) | Massive buying pressure (85%) | | **Moving Averages** | Strong resistance above price | Strong support below price | | **Opportunity** | Wait for reversal confirmation | Quick scalping opportunity | #WSOT2026 #SanDiskAnnounces8For1StockSplit #BitcoinHitsTwoMonthLowAfterUSMidterms #ByXIMPACT @ByX #PiecesOf8

US inflation stronger than expected
# Digital Gold (XAUTXAUTUSDT) Analysis: A real test of support levels amid macroeconomic pressures Digital Gold (XAUT) is facing clear selling pressure in line with the overall performance of gold, affected by the strength of the US dollar and Federal Reserve monetary policy expectations, while spot markets witness serious attempts to absorb this decline. ### Economic Landscape and its Impact on Digital Gold XAUT is currently trading near **$3,971.5**, recording a 1.82% decline over the past 24 hours, coinciding with raw gold dropping to a one-week low. These pressures are driven by stronger-than-expected US inflation data, which pushed the dollar to a 19-month high and reinforced expectations of a rate hike. On the other hand, a striking divergence in market structure stands out: **99% of liquidations** were concentrated on leveraged long positions, while spot markets recorded positive net cash inflows of **$4.6 million**, reflecting a genuine desire from spot investors to seize opportunities at support levels. ### Physical Backing and Fundamentals XAUT rests on a solid safety base, as Tether reserves reports confirm the existence of **827,417.63 ounces** of pure gold in Swiss vaults, valued at over $3.44 billion, supported by strong growth in customer holdings by 73% since last December. Despite the strength of this physical backing, the price remains governed by the general trend of gold in global markets. ### Key Figures for Current Movement: * **Current Price:** $3,971.5 * **Immediate Support:** $3,961.6 * **Immediate Resistance:** $4,053.5 * **Recovery Reference:** $4,100 * **Spot Net Inflow (24h):** +$4.6 million * **Spot Trading Volume:** $51.12 million * **Futures Volume:** $231.81 million ### Upcoming Technical Scenarios: * **Bullish Confirmation:** Requires buyers to defend the **$3,961.6** support level and successfully break through the **$4,053.5** resistance, leading to a sustained stabilization above **$4,100** supported by continued spot cash inflows. * **Bearish Confirmation:** Any decisive breakdown below the current support level will maintain the negative structure under the pressure of dollar strength and successive liquidations. The current stance represents a real test of support levels, awaiting the stabilization of overall gold prices to confirm the next recovery trend. #XAUTUSDT #ByXIMPACT $BTCUSDT #WSOT2026 #BitcoinHitsTwoMonthLowAfterUSMidterms @ByX #NovUSCPIWatch #AITechSelloffErases2Point5TrillionFromNasdaq100 #ByXIMPACT

SOLUSDT$SOLUSDT – I am bullish on a recovery toward $125, but there is a much closer battle that will decide everything. Look at the difference between my two charts: the daily structure remains bearish, with sellers pushing SOL toward $82. But the weekly chart tells a different story. The price has returned to the demand zone between $77 and $93, the exact wider zone that triggered the previous expansion toward $125. This is why I am interested in this long opportunity. The selling has been strong, but SOL is approaching an area where buyers previously showed real strength. I do not believe the bottom is confirmed yet; what I believe is that this zone offers an interesting place to look for a recovery with clearly defined risk. The $100.77 Problem Before anticipating a move to $125, I need to see SOL reclaim the $90-$93 zone. That would be an encouraging first step, but $100.77 is the most critical hurdle. This level previously acted as support; now it sits above the price, and sellers may use it to defend the current downtrend. If buyers reclaim the $100.77 level and maintain their strength, my next upside levels are $113.40 and ultimately $124.95-$124.72. Here is what makes this setup interesting: even a recovery to $100.77 would provide about a 2.14 risk-to-reward ratio (R) from my specified entry point. The full move toward $124.72 offers much more than that, but it also requires a much larger change in market structure. **My Trading Plan and Risk Management** My new daily setup is defined at: * Entry reference: $82.10 * Stop loss: $73.37 * Main target: $124.72 * Extended resistance: $124.95 Potential upside: 51.91% Defined downside: 10.63% Theoretical risk-to-reward ratio: 4.88:1 These calculations apply to the specified entry prior to plotting and slippage. A different entry changes the ratio. I am watching buyers for daily candle stabilization and defense of the weekly demand zone. Any sustained weakness below roughly the $77 level would seriously damage the recovery thesis, while $73.37 is the final invalidation level for this setup. I am very optimistic about SOL's recovery potential, but I do not confuse a major support zone with a confirmed trend reversal. The $125 target is ambitious; the opportunity near $82 is what catches my attention. Now I want to see if buyers can turn this weekly support test into the beginning of a meaningful recovery. #US_Inflation_Rise and increased bets on interest rate hikes #SanDisk Corporation announces an 8-for-1 stock split #Bitcoin drops to a 2-month low following the US mid-term #WSOT2026 elections #ByXIMPACT #SanDiskAnnounces8For1StockSplit #USInflationRunsHotAndRateHikeBetsRise #NovUSCPIWatch $XAUTUSDT @ @ByX
$XRPUSDT $XRPUSDT $GRAMUSDT @– There is a 5:1 risk-to-reward setup showing up on my chart. But there is a reason why I am paying primary attention to the next daily close rather than the potential 49% upside. XRP has dropped through multiple important support levels, leaving behind multiple bearish imbalances. Sellers have dominated the market structure for weeks, and I am not pretending that this trend has suddenly vanished. The difference now is where the price has arrived. Look at the left side of my daily chart. The order block sits in the $1.00 - $1.07 range near the base of a previous major expansion. XRP has returned to that zone, with the latest candle testing the $1.0363 level before trading back around $1.05. This is why I am interested in a counter-trend long trade here. Not because the bottom is confirmed, but because the chart has reached a level where I can define my risk. What will make this recovery real? My first concern is whether buyers can stop the string of lower daily closes. A convincing reaction from this order block, followed by a higher low, would be an encouraging development. The first upside challenge is around $1.15. Beyond that, the $1.20 - $1.25 structure could become resistance, followed by the larger daily imbalance around $1.28 - $1.42. My extended target remains $1.5758, near the identified bearish order block. This is the destination I care about if a recovery develops, not a prediction of where the next candle is going. Risk Management The long position drawing on my chart shows roughly 49% potential upside versus a 9.8% downside, representing a theoretical 5:1 reward-to-risk setup at the designated entry point. My trading plan also designates $0.9616 as a protective stop loss reference. Exact risk-to-reward must be calculated from the actual entry, stop loss, and target rather than assumed from a chart graphic. A sustained loss of the $1.00 level would serve as an early warning that demand is not holding. And reaching the stop loss at $0.9616 will invalidate the specified long trade. I am optimistic about a recovery opportunity, but the daily trend still belongs to the sellers. This is a defined-risk attempt to catch a potential change in behavior, not a confirmation of a new bullish trend. The distant target gives me a reason to study the opportunity. What buyers do inside this order block will determine whether the trade is worth my trust. #IMPACTbyTrade $XRPUSDT #WSOT2026 #PiecesOf8 #NovUSCPIWatch #DeutscheBankLaunchesDigitalAssetCustody #IMPACTbyTrade @ByX @ByXIMPACT

HYPE$HYPEUSDT faces an unusual contradiction: while the Hyperliquid platform generates substantial protocol revenue, its token continues to struggle to maintain the $72 level despite being listed on a major new trading platform. HYPE is trading near $72.03, down roughly 0.26% over 24 hours and 6.02% over seven days. The price has moved between $70.58 and $74.38, keeping the $70.58 level in focus as immediate support. The coin remains about 26.5% below its September all-time high of $97.98. The latest catalyst is HYPE's listing on Upbit on November 10, which expanded HYPE's reach to South Korean traders across Korean Won (KRW), Bitcoin (BTC), and Tether (USDT) markets. However, this listing did not lead to a sustained rally. This indicates that market participants are currently paying more attention to broader selling pressure and market positioning than to increased access via exchanges. Protocol revenue is the primary stronger indicator; Hyperliquid generated about $89.58 million in fees and $68.82 million in protocol revenue over the past thirty days. Its Assistance Fund converts a large portion of protocol fees into open-market purchases of HYPE, creating a direct link between trading activity and token demand. The adopted AQAv2 framework also adds contributions from reserve yields to the fund. These are meaningful value-accrual mechanisms, but they remain dependent on trading activity, exchange balances, and market conditions. Institutional interest has also begun to evolve. Strategies reported $620.6 million in net income for the third quarter, including $803 million in unrealized gains in HYPE, and sought registration as a futures commission merchant in the United States. However, the company's exposure and treasury should not be confused with direct protocol revenue or guaranteed demand for HYPE. Derivatives show that leverage remains significant. Futures volume is about 7.5 times spot trading volume, while open interest stands at around $3.23 billion. The funding rate remains positive at 0.0094%, and about 65% of recent liquidations came from long positions. Positioning remains active, but the market has yet to show a decisive shift toward spot-driven accumulation. Key Figures: $72.03 – Current price $70.58 – Immediate support $74.38 – Immediate resistance $78.00 – Next recovery reference $18.20 billion – Market capitalization $213.39 million – 24-hour spot trading volume $1.60 billion – 24-hour futures trading volume $3.23 billion – Open interest +0.10% – 24-hour open interest change 0.0094% – Funding rate $1.39 million – 24-hour liquidation $68.82 million – 30-day protocol revenue 252.90 million HYPE – Circulating supply 950 million HYPE – Max supply Bullish Confirmation: HYPE needs to defend the $70.58 level and reclaim $74.38 with stronger spot trading participation. A sustained breakout, supported by ongoing protocol revenue and buyback activities, would improve recovery prospects. Bearish Confirmation: A decisive break below the $70.58 level will expose further downside. If futures positions remain elevated with weak spot demand, the liquidation of leveraged long positions could accelerate the decline. Hyperliquid possesses one of the strongest revenue-to-token-demand mechanisms in decentralized finance (DeFi). But the important test is whether protocol activity can continue to generate enough buyback-driven demand to absorb market selling and future supply. The business generates revenue, and HYPE's price still needs to reflect that strength. #HYPEUSDT #ByXIMPACT @ByXIMPACT @ByX #ByXIMPACT $BTCUSDT #WSOT2026 #OilVolatilityTracksIranPeaceTalks #AnthropicIPOTestsTheAIBoom #PiecesOf8

A8 Recovery vs. Token Unlock Test
A8 is bouncing nearly 6%, but a major supply release is approaching. The recovery needs to prove it can attract buyers before another wave of tokens enters circulation. Ancient8 is trading near $0.003056, up approximately 6.07% in 24 hours, but still down 17.87% over seven days. Price has recovered from $0.002883 toward $0.003279, while the broader trend remains weak. The weekly high of $0.004872 is still far above the current market. The fundamental story is Ancient8's attempt to become gaming infrastructure rather than simply another gaming token. Built on Ethereum's Layer 2 architecture using the OP Stack and Celestia for data availability, the project offers infrastructure and distribution tools for Web3 games. Its long-term opportunity depends on attracting developers, retaining actual players and generating recurring ecosystem activity. However, infrastructure alone does not guarantee A8 demand. The market needs evidence that games using Ancient8 are generating meaningful transactions and that those activities create sustained utility for the token. The biggest near-term concern is supply. Approximately 663.55M A8 are circulating against a maximum supply of 1B. On November 17, another 20.61M A8 are scheduled to unlock, representing 2.1% of total supply and approximately 3% of current market capitalization. The release includes allocations to insiders, investors, community and foundation. Not every unlocked token will be sold, but the timing matters when liquidity is relatively thin. There is another important market detail: A8 currently has no established perpetual futures market in the available market data. That means open interest, funding rates and liquidation figures cannot reliably confirm leveraged positioning. This is primarily a spot-driven market, making exchange liquidity and order-book depth especially important. Key figures $0.003056 — Current price $0.002883 — Immediate support $0.003279 — Immediate resistance $0.003430 — Next recovery reference $2.02M — Market capitalization $507.80K — 24H spot volume 663.55M A8 — Circulating supply 1B A8 — Maximum supply 66.4% — Circulating supply percentage 20.61M A8 — November 17 scheduled unlock 2.1% — Unlock as percentage of total supply Bullish confirmation: A8 needs to defend $0.002883 and break above $0.003279 with stronger spot volume. Holding that breakout could open a recovery toward $0.003430 and eventually the $0.0040 area. Bearish confirmation: Losing $0.002883 would invalidate the immediate recovery attempt. Weak liquidity combined with the November 17 unlock could increase downside volatility. Ancient8 has a recognizable gaming-infrastructure direction, but its token faces a difficult test: converting ecosystem adoption into real demand while supply continues entering circulation. The next few sessions matter because the price recovery and upcoming unlock are arriving at the same time. $$A8USDT #ByXIMPACT

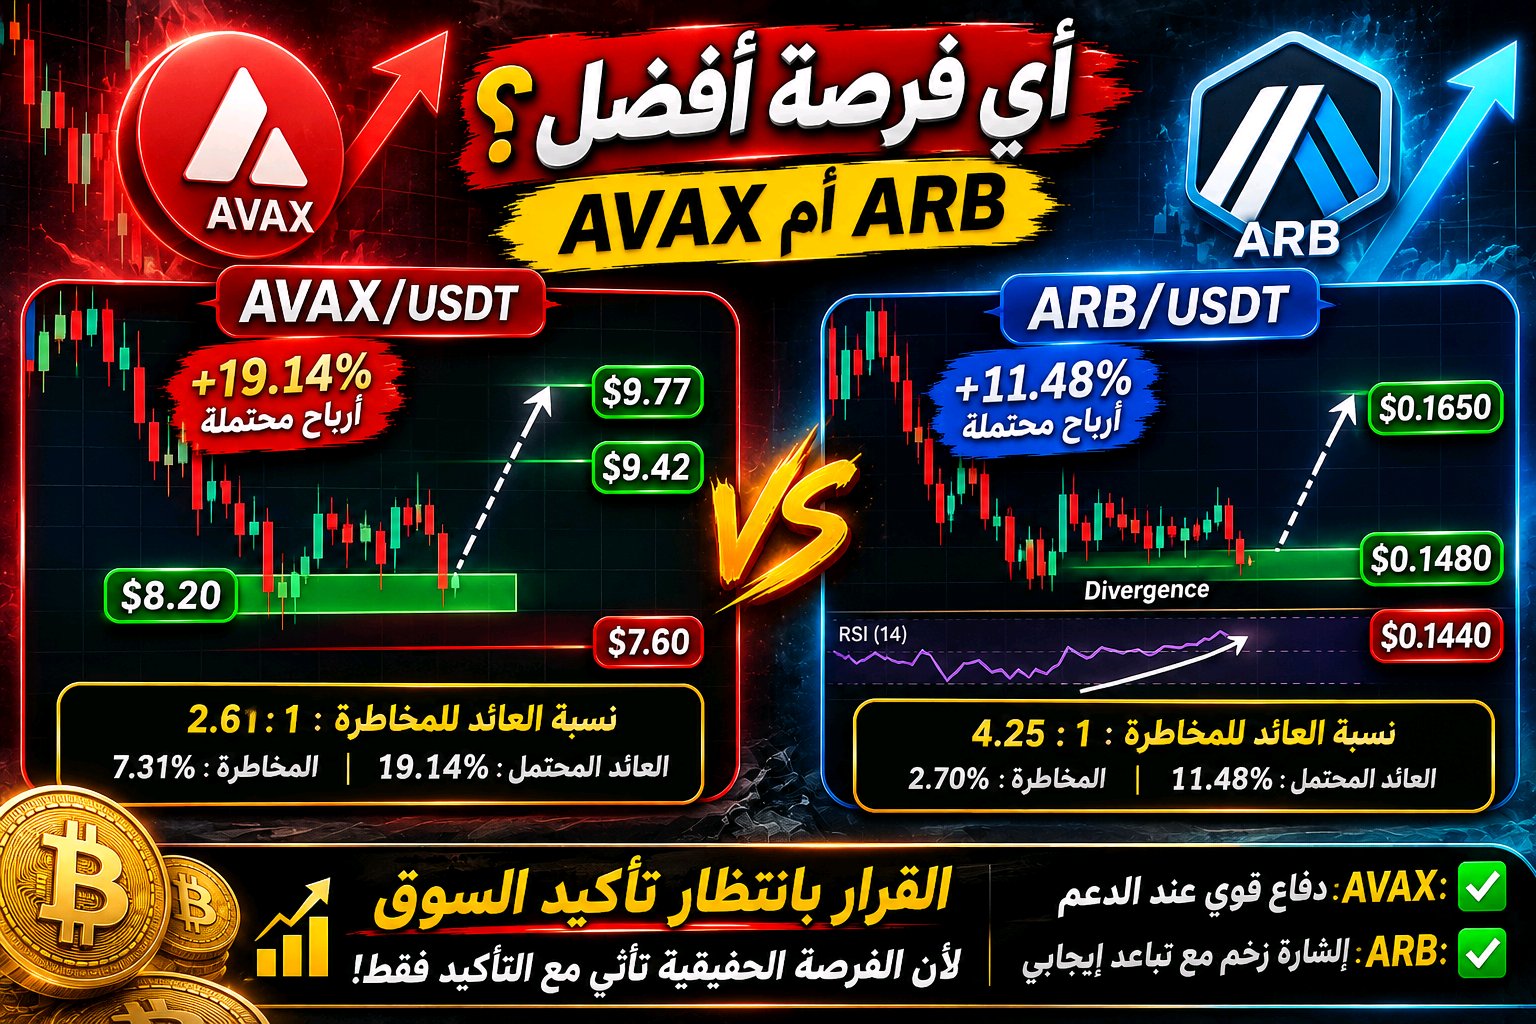
AVAX vs. ARB Trade Setup
Hey, $AVAXUSDT offers nearly 19% potential upside, ARB offers around 11% but the bigger target doesn't automatically make AVAX the better opportunity i've been comparing both charts, and the interesting part isn't how far they could rally. It's how differently buyers are behaving near their recent lows AVAX buyers are facing a serious test After falling from above $12.00, AVAX is back inside the $7.70-$8.20 daily support area. This region supported a major rally before, but the current downtrend hasn't reversed yet chart marks $8.20 as the long entry reference. A convincing defense of this support could open a recovery toward $9.42, followed by $9.77 that second level is my main target, representing approximately 19% upside concern is simple: historical support doesn't mean buyers must defend it again. I want to see price stabilize rather than assume the bottom is already in $ARBUSDT price and momentum are telling different stories Arbitrum has an interesting 4H divergence developing, price has been making lower lows while RSI has formed higher lows. That's an early indication that selling momentum may be weakening but RSI is still around 19.96, below its average near 30.54. So the divergence deserves attention, not blind confidence my marked target is $0.1650, with $0.1480 as the entry reference. I want to see buyers recover the nearby $0.1540 area before becoming more confident about that upside move Risk Comparison Most Traders Overlook AVAX: $8.20 entry, $7.60 stop, $9.77 target. Approximately 19.14% potential reward against 7.31% risk, giving 2.61:1 R.R ARB: $0.1480 entry, $0.1440 stop, $0.1650 target. Approximately 11.48% potential reward against 2.70% risk, giving 4.25:1 R.R these are theoretical ratios from my marked prices, before fees and slippage. Neither chart confirms that a new entry has triggered AVAX has the larger upside projection, but ARB offers a slightly higher reward relative to its defined risk. Neither advantage matters if the market fails to confirm the setup i'm bullish on both recovery possibilities. For AVAX, the important evidence is buyers defending daily support for ARB, it's price confirming the momentum divergence with a stronger 4H structure i'm not choosing between them based on which target looks more exciting will watching which one gives me the better reason to take risk #ByXIMPACT
You're in a winning deal
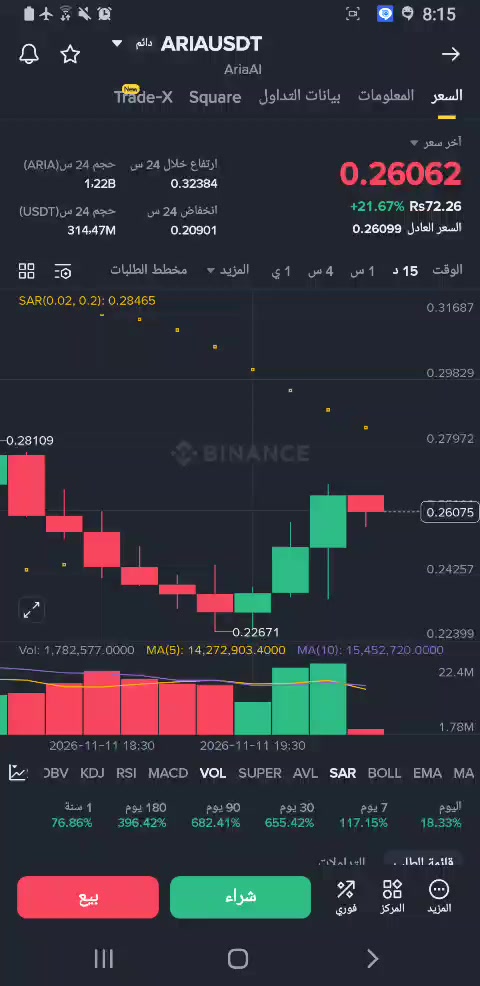
#ByXIMPACT The plan worked, and $ARIA$ARBUSDT did its job. Close the trade here. I hope some of you picked up on this move. Profit: $589 ARIAUSDT Permanent 0.25529 +19.69% My list today includes $INIT and $SPX $SPCXXUSDT If you haven't entered the trade yet (waiting trader): • Avoid buying now (top tip): The current price (0.25921) represents a "chase" after a quick bounce of three green candles. Entering here is very risky, as the last red candle could be the start of a new bearish reversal. • Safe buying scenario (Long): Wait until the price drops back down and tests the support zone (between 0.24200 and 0.24700). If the price reaches this zone and a strong green reversal candle (pin bar) appears, you can enter with a strict stop-loss below the recent low (0.22671). • Breakout scenario: If the price continues to rise strongly and breaks the resistance level at 0.26500, you can enter with the trend. 2. If you are already in the trade (a long position from a lower level): • Take profits immediately: You are in a winning trade, and due to the high volatility of this currency, it is very wise to close a large part of the trade now (e.g., 70-80%) and leave a small portion running with a stop-loss order placed at 0.25000. • Stop-loss is mandatory: Never leave the trade without a stop-loss order, as the SAR indicator is still against you. 3. If you are considering selling (short): • High-risk opportunity: Selling now (short) could be rewarding, as the overall trend is down and the SAR indicator is above the price. However, due to the strength of the recent green candles, the price may rise slightly to test the moving averages. • Entry point: If the price breaks below 0.25500 and a 15-minute candle closes below it, you can enter a short position with a target of 0.24000, placing a stop-loss order above 0.26500. #WSOT2026 #BybitAIEvolving