Rashid_BNB
Crypto marketing masters
SUI Is Struggling to Hold $0.72 After Its Bounce From $0.6754 — Recovery or Another Breakdown? SUI has recovered sharply from $0.6754, but the rebound is now losing momentum around the $0.72 area. What makes this setup interesting is that buyers managed to recover a significant part of the drop, yet they have not reclaimed the resistance levels needed to change the broader trend. SUI/USDT: $0.7171 | -1.04% The 4H trend remains bearish The moving averages tell an important story: - MA7: $0.7181 - MA14: $0.7502 - MA28: $0.7816 Price is hovering around the 4H MA7 but remains well below MA14 and MA28. Both longer averages are still above the market, showing that sellers retain control of the broader structure. For buyers, reclaiming $0.7392 would be an early improvement. A stronger confirmation would require a sustained move above $0.7502. The 15-minute chart shows fading momentum The lower timeframe is also showing some weakness: - MA7: $0.7196 - MA14: $0.7201 - MA28: $0.7262 SUI is trading below all three short-term averages. The recent recovery has stalled, and the moving-average cluster around $0.7200–$0.7262 is now acting as overhead resistance. Volume adds another caution: current displayed 15m volume is 7.15K, compared with MA5 at 58.36K and MA10 at 55.71K. The rebound is not currently supported by strong trading participation. Key levels to watch Resistance - $0.7200–$0.7262: Short-term moving-average zone - $0.7392: 24H high and immediate breakout level - $0.7502: 4H MA14 - $0.7816: 4H MA28 Support - $0.7000: Nearby psychological and chart level - $0.6754: Recent low and major support Trading outlook Bias: WAIT — bearish structure, with a possible short-term recovery. A sustained breakout above $0.7392 could improve the recovery and bring $0.7502 into focus. Stronger confirmation would come if SUI reclaims the 4H MA14 with convincing volume. If price continues to struggle below $0.7262 and loses $0.7000, sellers could push it toward $0.6754 again. A decisive breakdown below $0.6754 would invalidate the current recovery structure and signal renewed downside pressure. I would avoid chasing either direction while price remains trapped between nearby support and resistance. The next confirmed move matters more than the temporary bounce. Do you think SUI can reclaim $0.7502, or will sellers push price back toward $0.6754 first? What are you watching on the 4H chart?$SUIUSDT #IMPACTbyTrade
WLD Rebounds From $0.2429 — Can Buyers Break the $0.2744 Barrier? WLD has recovered from $0.2429 and is now trading around $0.2640. The bounce is encouraging, but the bigger chart tells a more cautious story. The important detail is that short-term buyers have managed to stabilize price, while the 4H structure remains under pressure. This is where the next move becomes interesting. WLD/USDT: $0.2640 | +0.65% The 4H trend has not reversed yet The moving averages currently stand at: - MA7: $0.2614 - MA14: $0.2744 - MA28: $0.2900 Price has moved slightly above MA7, showing some short-term recovery. However, it is still below both MA14 and MA28. That means buyers have improved the immediate price action, but they still need to reclaim higher resistance levels before the broader trend can be considered bullish. The 15-minute chart shows stabilization On the 15m timeframe: - MA7: $0.2633 - MA14: $0.2623 - MA28: $0.2634 These averages are tightly clustered around the current price. This suggests short-term consolidation rather than a strong directional breakout. Volume is also worth watching. The displayed 15m volume is 230.24K, slightly above MA5 at 207.47K and MA10 at 204.34K. However, 4H volume remains much lower than its averages, so the recovery still needs stronger participation. Levels that matter now Resistance - $0.2690: 24H high - $0.2744: 4H MA14 - $0.2900: 4H MA28 - $0.3024: Higher chart resistance Support - $0.2614: 4H MA7 - $0.2572: Nearby chart support - $0.2429: Recent low and major recovery support Trading outlook Bias: WAIT for confirmation — recovery attempt inside a broader downtrend. A sustained move above $0.2690 could open the way toward $0.2744. If buyers reclaim that level with stronger volume, the recovery would become more convincing, with $0.2900 as the next major test. On the downside, losing the $0.2614 area would weaken the immediate structure. A break below $0.2572 could expose the recent $0.2429 low again. A decisive move below $0.2429 would invalidate the current recovery attempt. I would not chase the bounce before resistance is cleared. The difference between a temporary relief rally and a genuine reversal will be visible in how WLD reacts around $0.2690–$0.2744. What would convince you that WLD has genuinely turned bullish: a breakout above $0.2690, or a confirmed 4H reclaim of $0.2744? $WLDUSDT #ByXIMPACT
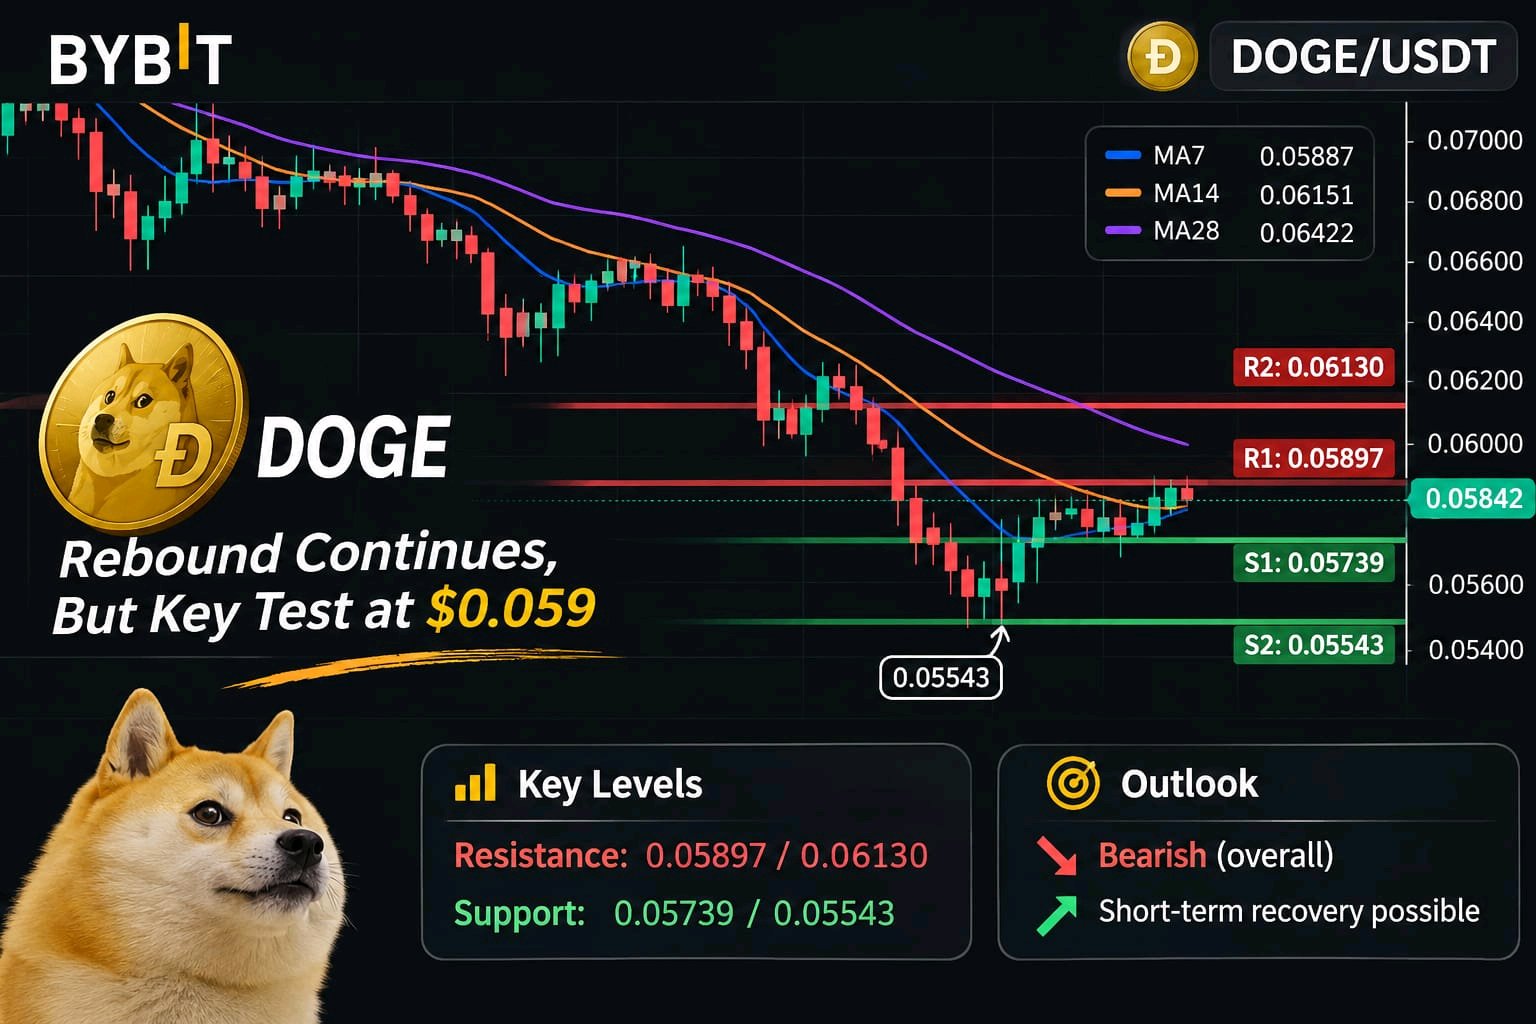
DOGE Rebounds From $0.05543, But Buyers Are Facing Their First Serious Test Near $0.059 DOGE has recovered from its recent low of $0.05543, but the latest chart is not giving buyers an easy path forward. Price is now around $0.05842, and the rebound is losing momentum near a cluster of short-term moving averages. The important distinction is that DOGE has bounced from support, but it has not reversed its broader downtrend. I want to see buyers reclaim resistance with stronger participation before treating this move as a genuine recovery. DOGE/USDT: $0.05842 | -4.25% The 4H chart still favors caution The current 4H moving averages are: - MA7: $0.05887 - MA14: $0.06151 - MA28: $0.06422 DOGE is trading below all three averages. The MA7 is the nearest hurdle, while the MA14 and MA28 show how much overhead resistance remains. This matters because a move above $0.05887 alone would only improve the short-term picture. Buyers would still need to reclaim the higher averages to challenge the broader bearish structure. The 15-minute chart shows a recovery losing momentum The 15m moving averages are tightly grouped: - MA7: $0.05856 - MA14: $0.05895 - MA28: $0.05897 Price is below this cluster, making $0.05856–$0.05897 the immediate decision zone. There is another warning in the volume data. The displayed 15m volume is approximately 158.23K, while MA5 and MA10 volume are around 881.56K and 888.04K. That is relatively weak participation. The rebound needs stronger buying volume if it is going to challenge resistance convincingly. The levels that matter now Resistance - $0.05856–$0.05897: Immediate 15m moving-average cluster - $0.06130: 24H high - $0.06151: 4H MA14 - $0.06422: 4H MA28 Support - $0.05739: Nearby 15m chart support - $0.05543: Recent low and key downside level My trading outlook Bias: Bearish overall, with a possible short-term recovery attempt. If DOGE reclaims $0.05897 and holds above it, buyers could attempt a move toward $0.06130. A stronger break above that level would improve the recovery case. However, rejection from the moving-average cluster followed by a loss of $0.05739 would put the recent bounce under pressure. A decisive break below $0.05543 would invalidate the current recovery structure and expose DOGE to further downside. I would not chase a long position while price remains below the resistance cluster. The better opportunity is to wait for either a confirmed reclaim or a clear support breakdown. What do you think DOGE needs first: a strong 15-minute reclaim above $0.059, or a retest of $0.05543 to prove that buyers can defend the bottom? $DOGEUSDT #IMPACTbyTrade
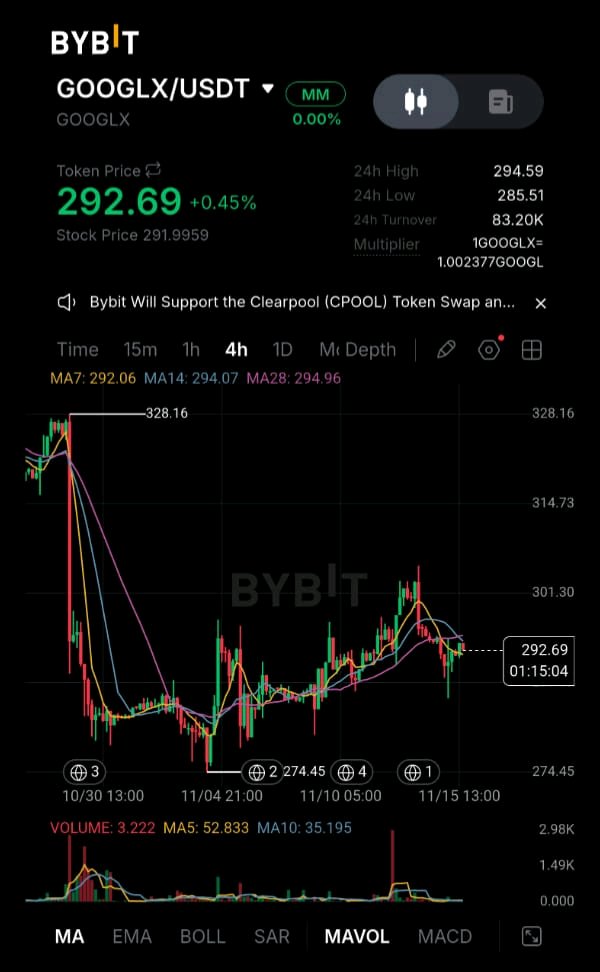
GOOGLX Is Testing $293 Again — But the Recovery Needs Stronger Buyers GOOGLX is trading around $292.69 after recovering from $285.51, yet the latest candles suggest that buyers are losing some momentum near the $293–$294 zone. The important detail is the difference between the 15-minute and 4-hour charts. The short-term structure is trying to stabilize, but the broader recovery has not yet confirmed a bullish trend reversal. Current Token Price: $292.69 Underlying Stock Price displayed: $291.9959 The 4H chart is at a decision point The current 4H moving averages are: - MA7: $292.06 - MA14: $294.07 - MA28: $294.96 Price is holding above MA7, which is an encouraging short-term sign. However, MA14 and MA28 remain overhead. This means buyers have managed to stabilize the price, but they still need to reclaim the $294.07–$294.96 region before the broader structure starts looking stronger. The 15-minute chart shows immediate selling pressure The 15m moving averages are: - MA7: $293.14 - MA14: $293.38 - MA28: $293.03 Price is currently below all three. This moving-average cluster is acting as immediate resistance. The chart also shows a recent rejection near $294.86. Until buyers reclaim this area, another attempt toward the recent high remains uncertain. Volume is another concern. The displayed 15m volume is 3.222, compared with MA5 at 52.833 and MA10 at 35.195. Participation is considerably weaker than those averages, so the recovery currently lacks strong volume confirmation. The levels that matter Resistance - $293.03–$293.38: 15m moving-average cluster - $294.07–$294.96: 4H moving-average resistance - $294.86: Visible recent high - $301.30: Higher 4H resistance area Support - $292.06: 4H MA7 - $290.18: Nearby chart support - $287.84: Lower visible support - $285.51: Recent 24H low My trading outlook Bias: Neutral to cautiously bearish until resistance is reclaimed. A sustained move above $294.96, supported by stronger volume, would improve the bullish case and bring $301.30 into focus. However, if price continues getting rejected around $293.03–$294.96 and loses $292.06, the next downside levels to watch are $290.18 and $287.84. A break below $285.51 would invalidate the current recovery structure. I would avoid chasing a move while price remains trapped between support and resistance. A confirmed breakout or a clear support failure offers a more useful trading signal. One additional detail: GOOGLX is a tokenized stock product. Its displayed token price is $292.69, while the underlying stock price shown is $291.9959. Traders should account for the token's stated conversion multiplier rather than assuming both prices are identical. What would make you trust this recovery: a strong 4H close above $294.96, or a successful retest of $292.06 with buyers stepping in?$GOOGLXUSDT #ByXIMPACT
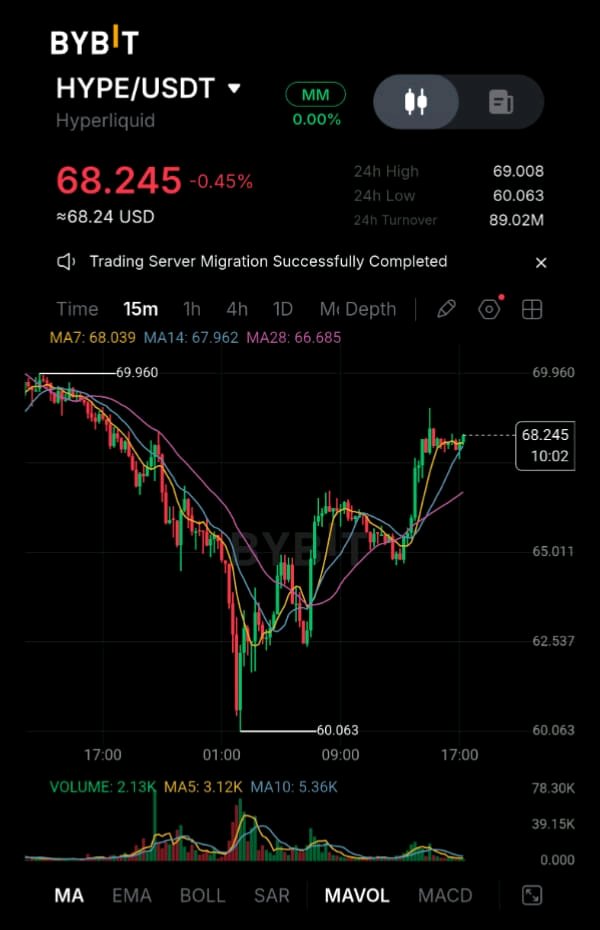
HYPE Is Near $69 — But One Warning in Volume Could Change the Entire Recovery HYPE has recovered strongly from $60.063, but there is something in the current price action that deserves more attention than the rebound itself. Buyers have pushed the price above $68 and reclaimed the short-term moving averages. However, as HYPE approaches the $69 resistance zone, trading volume is still declining relative to its recent averages. That creates an important question: Is this the beginning of another bullish expansion, or is the recovery running into sellers before buyers can regain control? HYPE/USDT: $68.245 | Down 0.45% The short-term structure is improving On the 15-minute chart, HYPE is trading above all three moving averages: - MA7: $68.039 - MA14: $67.962 - MA28: $66.685 The MA7 and MA14 are forming a tight support cluster around $67.96–$68.04. As long as price holds above this area, the short-term recovery structure remains constructive. A sustained move below it would be an early warning that buyers are losing momentum. Why $69 is becoming the most important test The next resistance levels are: - $69.008: Recent 24H high - $69.960: Higher chart resistance A break above $69.008 could open the door toward $69.960. However, I would pay more attention to how price behaves after the breakout. A quick move above resistance without sustained buying participation could turn into a false breakout. The volume signal traders should not ignore This is where the current setup becomes interesting. Displayed 15-minute volume: 2.13K Compared with: - MA5 Volume: 3.12K - MA10 Volume: 5.36K Current volume is below both averages. In other words, price is recovering, but participation has not yet confirmed the strength of that move. For a convincing breakout, I would want to see expanding volume alongside price acceptance above resistance. Key levels to watch Resistance - $69.008 - $69.960 Support - $68.039 – $67.962: Immediate MA support - $66.685: MA28 support - $65.011: Important lower support - $62.537: Deeper support - $60.063: Recent swing low My trading outlook Current bias: Cautiously bullish on the short timeframe. I see two important scenarios: Bullish scenario: If HYPE holds $67.96–$68.04 and buying volume starts increasing, buyers could challenge $69.008 again. A convincing breakout and successful retest of $69.960 would provide stronger bullish confirmation. Bearish scenario: If price loses the moving-average cluster, the recovery could weaken toward $66.685. A further breakdown below $65.011 would seriously damage the current recovery structure. I would avoid chasing price directly into resistance. Waiting for volume confirmation or a clean retest offers a more disciplined approach. The real question is not whether HYPE can touch $69. It's whether buyers have enough participation to hold above it. What would you watch here? 1. A volume-backed breakout above $69.960? 2. A rejection near $69 followed by a move toward $66.685? I'm interested in hearing how other traders are reading this setup. $HYPEUSDT #ByXIMPACT

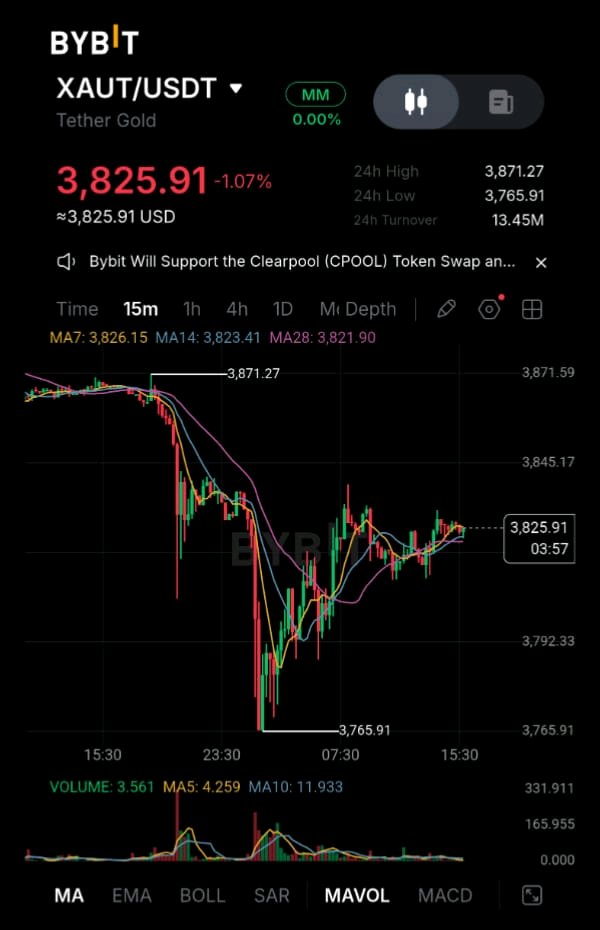
XAUT Is Holding Above $3,800 — But Is This Stability the Start of a Recovery? The latest XAUT price action is showing something worth watching. After the sharp drop toward $3,765.91, buyers managed to bring the price back above $3,800, and it is now consolidating around $3,825. What I find interesting is that the market has stopped falling aggressively, but it has not yet produced a convincing breakout either. The short-term moving averages are tightly grouped around the current price, creating a clear decision zone. The next move around $3,845 could reveal whether buyers are preparing for another recovery attempt or whether sellers are still waiting to take control. XAUT/USDT: $3,825.91 | Down approximately 1.07% The 15-minute chart is entering a decision zone The current moving averages are: - MA7: $3,826.15 - MA14: $3,823.41 - MA28: $3,821.90 Price is slightly below the MA7 but remains above the MA14 and MA28. This shows short-term stabilization, although the moving averages are so close together that they do not yet confirm a strong directional trend. A sustained move above $3,826 would be the first small improvement. However, buyers need to push through the next resistance levels before the recovery becomes convincing. The previous sell-off still matters XAUT dropped sharply from the $3,870 area and reached $3,765.91 before recovering. That low is now the most important support reference on this chart. The rebound shows that buyers responded, but the market has not yet recovered the entire decline. The current consolidation could develop into a recovery base, but it could also become a pause before another downward move. Volume is not confirming a strong breakout yet The displayed 15-minute volume is approximately 3.561, compared with: - MA5 Volume: 4.259 - MA10 Volume: 11.933 Participation remains below the displayed averages, particularly the MA10. This is why I would not treat the current sideways movement as a confirmed bullish breakout. Stronger buying volume would make a move above resistance much more meaningful. Key levels I am watching Resistance - $3,826: Immediate MA7 resistance - $3,845.17: Nearby chart resistance - $3,871.27: Recent 24H high Support - $3,823–$3,821: Short-term moving-average support zone - $3,792.33: Nearby chart support - $3,765.91: Recent swing low My trading outlook Current bias: WAIT FOR CONFIRMATION — short-term stabilization, not yet a confirmed bullish reversal. If XAUT holds above $3,821 and reclaims $3,826, buyers could attempt a move toward $3,845.17. A convincing breakout above that level would bring the $3,871.27 high back into focus. However, if price loses the $3,821 area and then breaks below $3,792.33, the recovery could weaken. A move below $3,765.91 would expose the market to further downside risk. I would rather wait for a confirmed move than chase a narrow consolidation without volume support. Do you think XAUT is building a base above $3,800 for another recovery attempt, or is this only a temporary pause before sellers return? $XAUTUSDT #ByXIMPACT
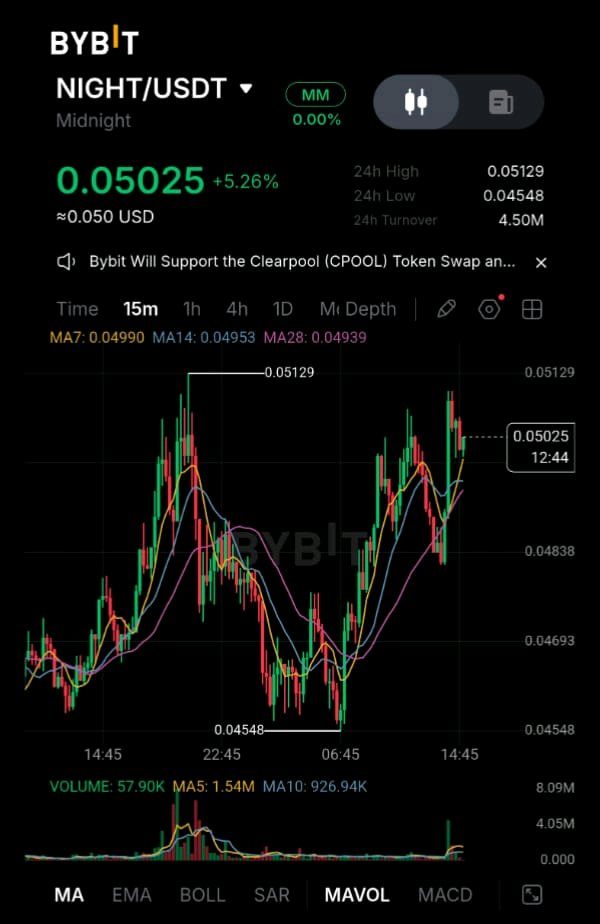
NIGHT Is Climbing Toward $0.0513 — Is This Breakout About to Get Bigger? There is a noticeable change in Midnight's price action today. NIGHT has recovered from $0.04548 and climbed to approximately $0.05025, gaining more than 5% on the latest Bybit snapshot. What caught my attention is how price has moved back above all three short-term moving averages after defending the lower range. But there is one level I would not ignore: $0.05129. Buyers are approaching the recent high, and the next move could determine whether this rally continues or turns into another rejection. NIGHT/USDT: $0.05025 | +5.26% The 15-minute chart is showing improving momentum NIGHT is currently trading above all three displayed moving averages: - MA7: $0.04990 - MA14: $0.04953 - MA28: $0.04939 This alignment is encouraging for short-term buyers. Price has reclaimed the moving-average cluster, and the recent recovery from $0.04548 has created a stronger short-term structure. However, the immediate challenge is the $0.05129 high. A clean break above this level, followed by a successful retest, would provide better confirmation of continued upside. Volume is the missing confirmation The displayed 15-minute volume is approximately 57.90K, compared with: - MA5 Volume: 1.54M - MA10 Volume: 926.94K This is an important warning. Although price has recovered, the latest displayed volume is considerably below its averages. I would like to see participation increase before treating a move above $0.05129 as a reliable breakout. A price spike without supporting volume can quickly turn into a failed move. The fundamental story behind NIGHT Midnight is building a privacy-focused blockchain ecosystem using zero-knowledge technology. Its goal is to enable smart contracts and applications that can protect sensitive transaction and user information while still supporting selective disclosure. The interesting part is NIGHT's dual-component economic model: - NIGHT is the network's native asset and governance token. - Holding NIGHT generates DUST, the resource used to pay for network transactions. - DUST is shielded, non-transferable and regenerates over time. - NIGHT also plays a role in network security and future governance. The latest October 2026 network update highlighted a roadmap covering confidential finance, institutional tokenization, identity tools and cross-chain integrations. That gives NIGHT a broader development narrative beyond short-term speculation. Still, ecosystem progress needs to translate into actual usage and demand before it can support a sustained token recovery. Key levels I am watching Resistance - $0.05129: Recent 24H high - $0.05200: Next psychological reference - A sustained breakout above $0.05129 would be the first meaningful confirmation Support - $0.04990: 15m MA7 - $0.04953: 15m MA14 - $0.04939: 15m MA28 - $0.04838: Nearby chart support - $0.04548: Recent swing low My trading outlook Current bias: SHORT-TERM BULLISH, but breakout confirmation is still needed. If NIGHT holds above the $0.04939–$0.04990 moving-average zone and breaks $0.05129 with stronger volume, buyers could attempt to extend the recovery. If price gets rejected near $0.05129 and loses the moving-average cluster, a pullback toward $0.04838 becomes possible. A deeper decline could bring the $0.04548 low back into focus. I would not chase the current move blindly. The chart is improving, but volume needs to confirm that buyers are serious. Do you think NIGHT can finally break $0.05129 and continue its recovery, or will sellers defend this high once again? $NIGHTUSDT #ByXIMPACT
SOL Is Fighting Back From $67, But the $72 Resistance Is Not Yet Cleared The latest recovery in Solana deserves attention, but I would not call it a bullish reversal just yet. After touching $67.41, SOL has climbed back above $72, showing that buyers are still willing to defend lower prices. The interesting part is that the 15-minute structure has improved while the 4H and Daily charts remain under considerable pressure. This is exactly the kind of market where chasing a bounce can become risky if resistance is not reclaimed. The next few candles around $72–$76 could reveal whether this recovery has real strength behind it. SOL/USDT: $72.11 | Down approximately 4.60% The Daily trend is still bearish Solana remains below all three Daily moving averages: - MA7: $79.37 - MA14: $85.13 - MA28: $93.12 The wider structure continues to show lower highs and lower lows following the previous peak near $124.96. Until SOL reclaims the Daily MA7, the broader trend remains weak. A bounce from support is encouraging, but it does not automatically change the Daily market structure. The 4H chart is approaching its first major test The current 4H moving averages are: - MA7: $72.25 - MA14: $75.35 - MA28: $79.08 Price is sitting just below the 4H MA7. This makes $72.25 the immediate decision level. If buyers reclaim it and hold above it, the next challenge becomes $75.35, followed by the $76.20 recent 24H high. However, 4H volume is around 76.41K, below the MA5 average of 186.92K and MA10 average of 162.97K. That means the recovery still needs stronger participation. The 15-minute chart shows a different picture There is a short-term improvement worth noticing. SOL is trading around $72.07, above the displayed 15-minute moving averages: - MA7: $70.93 - MA14: $70.64 - MA28: $70.95 Buyers have managed to reclaim this short-term moving-average cluster after the bounce from $67.41. But I would like to see this recovery hold during a retest rather than assume that the short-term momentum will automatically continue. Derivatives data shows how much leverage has been flushed out The latest CoinGlass snapshot shows approximately $85.67 million in SOL futures liquidations over 24 hours, with roughly 92% coming from long positions. Open interest is down around 7.15% over the same period, while funding is negative at approximately -0.0143% per 8 hours. This combination suggests significant long-position unwinding and a market that has become more cautious. Negative funding can create conditions for a short-covering bounce, but it is not a standalone bullish signal. A major ecosystem event is also underway Solana Breakpoint 2026 is taking place in London from November 15–17, with attention on institutional adoption, tokenization, stablecoins and payments. This could bring fresh ecosystem developments into focus, but announcements alone will not guarantee an immediate price recovery. I would watch whether any positive developments are accompanied by stronger spot demand and improved market structure. Key levels I am watching Resistance - $72.25: 4H MA7 - $75.35: 4H MA14 - $76.20: Recent 24H high - $79.08–$79.37: 4H MA28 and Daily MA7 Support - $70.93–$70.64: 15m moving-average cluster - $69.91: Nearby chart support - $67.41: Recent swing low - $65.00: Lower downside reference if support breaks My trading outlook Current bias: WAIT for confirmation — short-term recovery, broader trend still bearish. I would like to see SOL reclaim $72.25 and hold above it with improving volume. That could open the way toward $75.35 and potentially $76.20. If price rejects the $72.25–$75.35 region and loses $70.64, the recovery could weaken and bring $69.91 back into focus. A decisive breakdown below $67.41 would invalidate the current short-term recovery structure and increase downside risk. On the other hand, a sustained move above $76.20 would be the first stronger indication that buyers are beginning to challenge the broader bearish trend. For now, I see an early recovery attempt, not a confirmed reversal. I want to see buyers prove their strength before taking a directional position. What matters more to you right now: SOL reclaiming $75.35 and building a recovery, or the risk of another rejection that sends price back toward $67.41? $SOLUSDT #IMPACTbyTrade
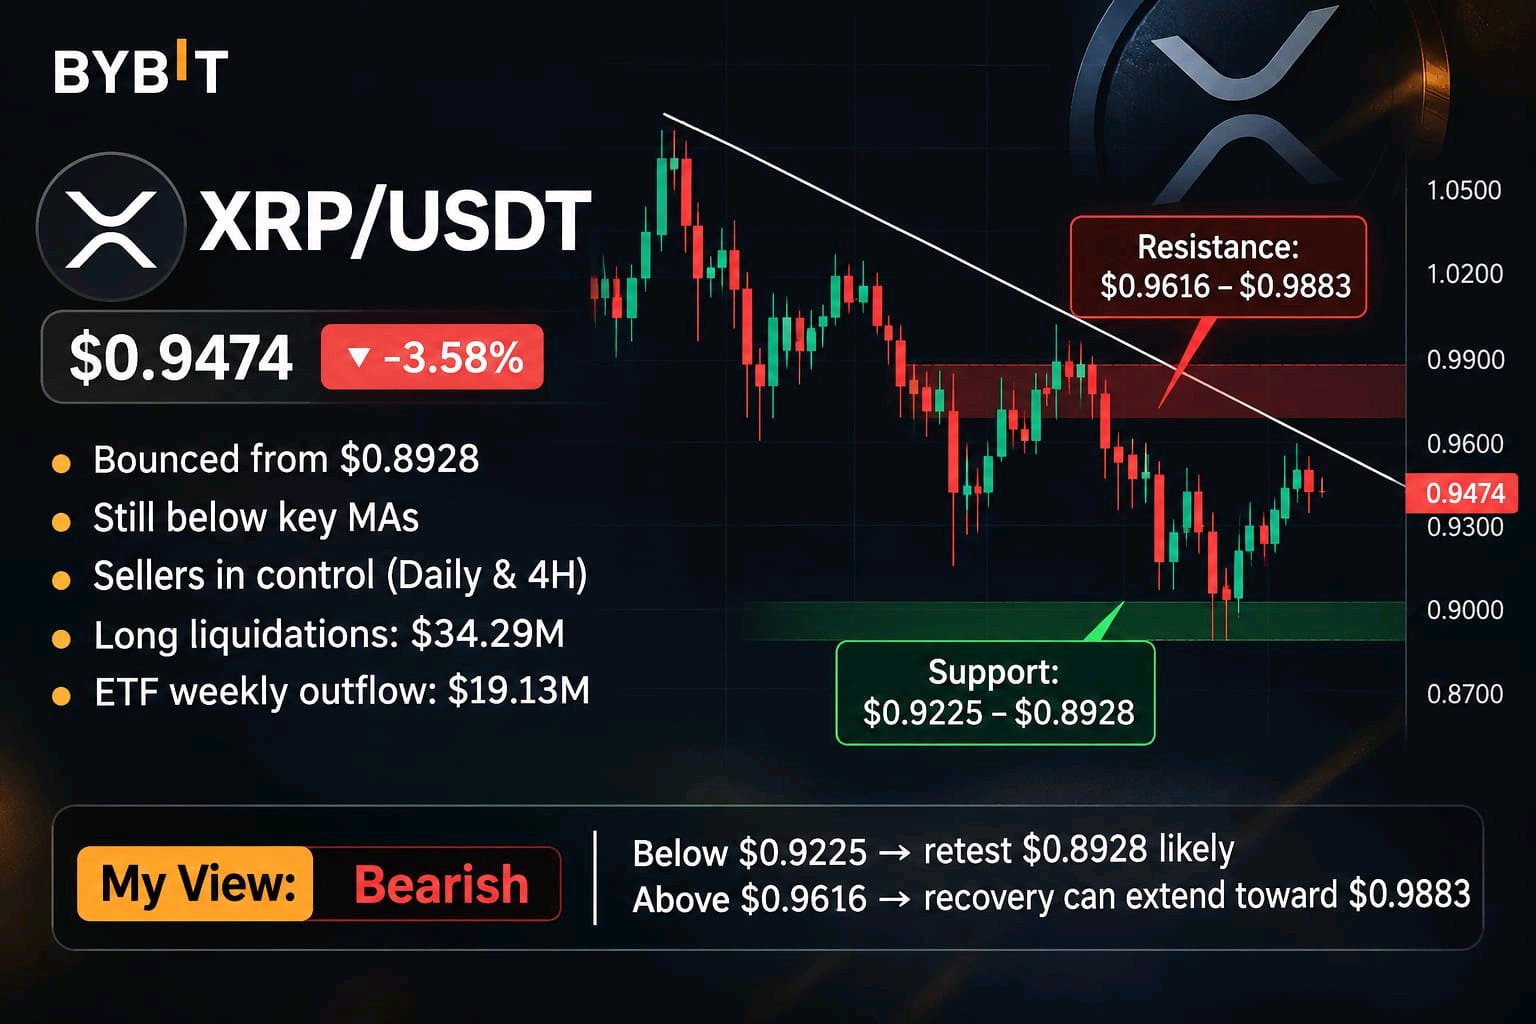
XRP Is Trying to Recover, But Sellers Still Control the Bigger Picture The latest XRP bounce looks encouraging at first, but there is a detail that deserves much more attention. Price dropped to $0.8928 before recovering toward $0.95, yet buyers have already started struggling around the short-term moving averages. What concerns me is that the Daily and 4H charts are still showing a clear sequence of weakness. XRP is attempting to stabilize, but the market has not provided convincing evidence that the selling pressure is finished. The next reaction around $0.95–$0.96 could become an important turning point. XRP/USDT: $0.9474 | Down approximately 3.58% The Daily chart remains under significant pressure XRP is trading well below all three Daily moving averages: - MA7: $1.0173 - MA14: $1.1154 - MA28: $1.2066 This bearish alignment reflects sustained weakness across the higher timeframe. The distance between price and these averages also shows how much recovery XRP needs before the Daily trend starts looking healthier. The 4H chart confirms the sellers' advantage The 4H moving averages are positioned above the current price: - MA7: $0.9616 - MA14: $0.9883 - MA28: $1.0197 XRP has bounced from $0.8928, but it remains below the entire moving-average cluster. The first meaningful challenge is $0.9616, followed by the $0.9883–$1.0197 resistance region. Until buyers reclaim these levels, I would treat the current move as a recovery attempt inside a broader downtrend. The short-term bounce is losing momentum On the 15-minute chart, XRP is trading around $0.9474, below: - MA7: $0.9551 - MA14: $0.9603 - MA28: $0.9528 The short-term moving averages are clustered above price, creating immediate resistance. This suggests the initial rebound from $0.8928 has not yet developed into a convincing bullish continuation. The derivatives and ETF picture adds another warning Recent market data shows that XRP's decline has been accompanied by significant leveraged position closures. Over the latest reported 24-hour period, XRP liquidations reached approximately $34.29 million, with around 97.5% coming from long positions. Open interest also declined approximately 12.27% over two days, reaching around $1.97 billion. This suggests substantial position reduction rather than simply a wave of fresh short positions. Another concern is institutional demand: US spot XRP ETFs recorded approximately $19.13 million in net weekly outflows for the week ending November 13, their largest weekly outflow in eight months. These factors do not guarantee another decline, but they show why buyers may struggle to build a sustainable recovery. Key levels I am watching Resistance - $0.9528–$0.9603: Immediate 15m resistance cluster - $0.9616: 4H MA7 - $0.9883: 4H MA14 - $1.0173–$1.0197: Daily MA7 and 4H MA28 Support - $0.9400: Nearby psychological area - $0.9225: Chart support reference - $0.8928: Recent swing low - $0.8800: Potential downside reference if the recent low breaks My trading outlook Current bias: BEARISH — but I would not chase a short directly above the recent low. If XRP fails to reclaim $0.9616 and loses the nearby $0.9225 support area, another test of $0.8928 becomes possible. A decisive breakdown below $0.8928 would increase downside risk, with $0.8800 becoming another area to monitor. On the other hand, a sustained recovery above $0.9616, followed by a reclaim of $0.9883, would be the first meaningful sign that buyers are regaining control. For now, the higher-timeframe structure favors sellers, but the sharp liquidation of long positions also leaves room for a sudden relief bounce. What is your view on XRP right now: can buyers reclaim $0.96 and start rebuilding momentum, or will sellers push price back toward $0.89? $XRPUSDT #IMPACTbyTrade
ETH Is Struggling Below $1,800 — Is Another Test of $1,710 Coming? Ethereum is approaching a critical moment, and the latest 4H structure is not giving buyers much room to celebrate. Price has slipped to around $1,791 after losing the $1,900 area, while every major moving average on this timeframe remains above the market. What stands out is that sellers are still controlling the sequence of lower highs and lower lows, even after ETH briefly bounced from $1,710. The next reaction around this support zone could determine whether buyers can finally slow the decline or whether another leg lower is developing. ETH/USDT: $1,791.67 | Down approximately 5.64% The 4H trend remains firmly bearish Ethereum is trading below all three 4H moving averages: - MA7: $1,837.98 - MA14: $1,885.54 - MA28: $1,966.87 The moving averages are stacked above price, reflecting persistent downside pressure. The chart also shows a clear sequence of lower highs since the previous recovery attempt near $2,450.74. Buyers have not yet produced a convincing structural breakout. The volume picture deserves attention The displayed 4H volume is approximately 12.68K, compared with: - MA5 Volume: 37.33K - MA10 Volume: 27.01K This means current volume is below both displayed averages. The broader selloff has been aggressive, but the latest candles are not showing a strong volume-backed recovery. I want to see whether buyers can defend $1,710 with meaningful participation rather than relying on a temporary bounce. What is happening beyond the chart? Ethereum's weakness is part of a broader market deleveraging event. Recent CoinMarketCap market reporting described a sharp decline across crypto, with falling open interest and a large share of forced liquidations coming from leveraged long positions. Ethereum itself also experienced substantial liquidation activity. ETF flows have added another pressure point. US spot ETH ETFs recorded approximately $398.9 million in net outflows over the November 9–13 trading week. Friday's small inflow was not enough to reverse the weekly outflow trend. This combination matters: falling prices, forced position closures and weak institutional flows can make it harder for buyers to establish a sustainable recovery. Key levels I am watching Resistance - $1,837.98: 4H MA7 - $1,885.54: 4H MA14 - $1,895.53: Nearby chart resistance - $1,966.87: 4H MA28 Support - $1,791: Current price area - $1,766: Nearby chart support - $1,710.47: Recent swing low - $1,700: Psychological support My trading outlook Current bias: BEARISH — but I would avoid chasing a short directly into the recent low. If ETH fails to reclaim $1,837.98 and sellers push price below $1,766, another test of $1,710.47 becomes a realistic possibility. A decisive break below $1,710 would expose the $1,700 psychological level and potentially extend the downside. On the other hand, a sustained reclaim of $1,837.98 would be the first sign of short-term improvement. A stronger move above $1,885.54 would make me reassess the immediate bearish setup. For now, the 4H structure still favors sellers. I want to see a genuine change in market structure before treating this decline as finished. Do you think ETH can defend $1,710 and build a recovery, or are sellers preparing to push it below $1,700? $ETHUSDT #ByXIMPACT
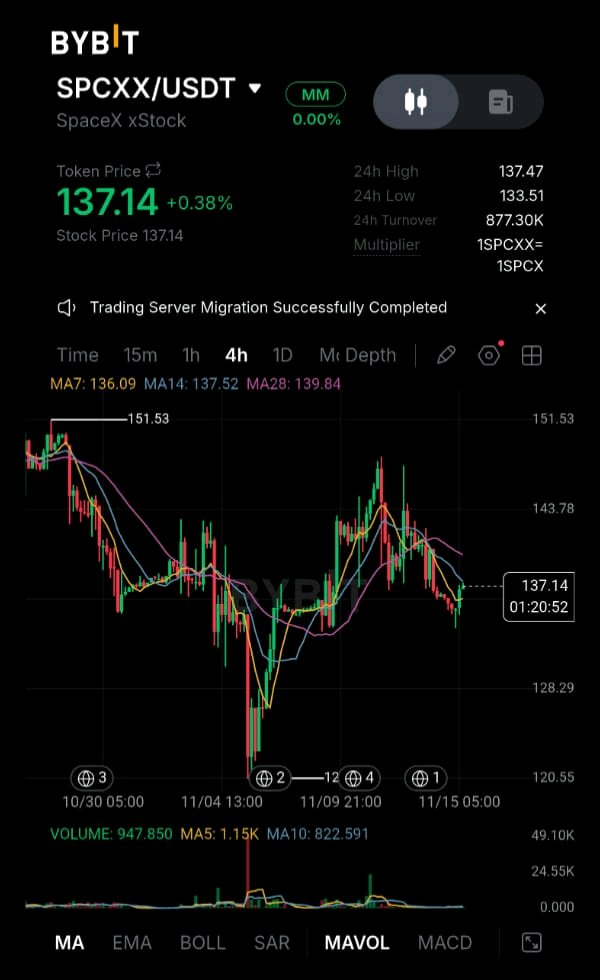
SPCXX Is Recovering, But the $140 Resistance Could Decide Its Next Move SPCXX/USDT is showing signs of recovery after a sharp decline, but buyers are approaching an important resistance zone. The move from around $120.55 toward $137.14 is encouraging, yet the 4H chart still shows price struggling beneath its longer moving averages. What makes this setup interesting is the contrast between SpaceX's strong business developments and the token's mixed technical structure. I would not confuse a strong company story with an automatically attractive entry price. SPCXX/USDT: $137.14 | +0.38% The 4H chart is showing an early recovery The current price is trading around $137.14, with the following moving averages: - MA7: $136.09 - MA14: $137.52 - MA28: $139.84 Price has moved back above the MA7, which is a short-term improvement. However, it remains just below the MA14 and MA28. That makes the $137.52–$139.84 area the first important resistance zone. A sustained move above it would improve the recovery structure. Until then, sellers still have an opportunity to reject the rebound. Volume needs to confirm the move The displayed 4H volume is approximately 947.85, compared with MA5 volume of 1.15K and MA10 volume of 822.59. This suggests activity is not uniformly strong. I would like to see expanding volume alongside a clean break above $139.84 rather than treating a small price recovery as proof of renewed demand. SpaceX's fundamentals provide an important backdrop There are meaningful developments behind the underlying company. SpaceX reported third-quarter 2026 revenue of $14.6 billion, up 161% year over year, with net income of $4.4 billion and adjusted EBITDA of $8.8 billion. The company also reported its first revenue-generating Starship mission, delivering 26 Starlink V3 satellites. More recently, on November 14, Starship completed a major milestone by returning to the Texas launch site and being caught by the launch tower's mechanical arms. However, the Super Heavy booster did not complete its own return, so full two-stage recovery remains a work in progress. These developments strengthen the long-term business narrative, but they do not remove short-term valuation or market risks. One important detail about SPCXX This is tokenized exposure linked to SpaceX stock, not the same as directly holding ordinary SpaceX shares. Binance's SPCXx documentation explains that holders do not receive direct shareholder ownership or voting rights. Tokenized products also carry issuer, liquidity, pricing and redemption risks. That distinction matters when evaluating the token separately from the underlying company. Key levels I am watching Resistance - $137.52: 4H MA14 - $139.84: 4H MA28 - $143.78: Higher chart resistance - $151.53: Previous major swing high Support - $136.09: 4H MA7 - $133.51: Recent 24H low - $128.29: Lower chart support - $120.55: Previous major downside wick My trading outlook Current bias: WAIT for confirmation, with a short-term recovery attempt underway. I would prefer to see SPCXX reclaim $139.84 with stronger volume before considering the recovery more convincing. If price holds above $136.09, buyers may get another opportunity to challenge the resistance zone. But a rejection followed by a break below $133.51 would weaken the current setup and could expose the lower support areas again. A sustained move above $143.78 would provide a stronger signal that the recovery is extending. For now, the underlying company's progress is encouraging, but the chart still needs to prove that buyers can take control. What are you watching more closely: a confirmed breakout above $140, or another rejection that sends SPCXX back toward $133? $SPCXXUSDT #ByXIMPACT
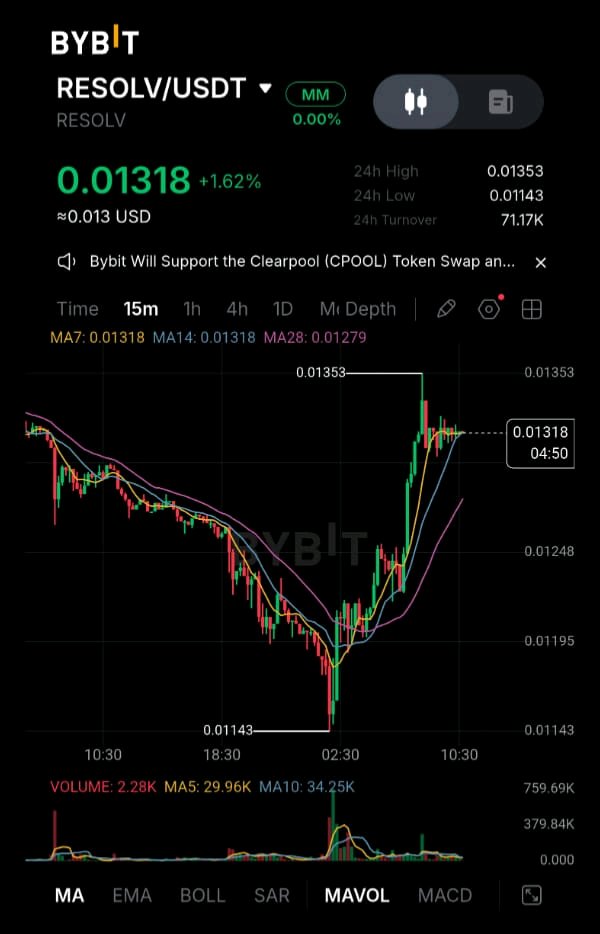
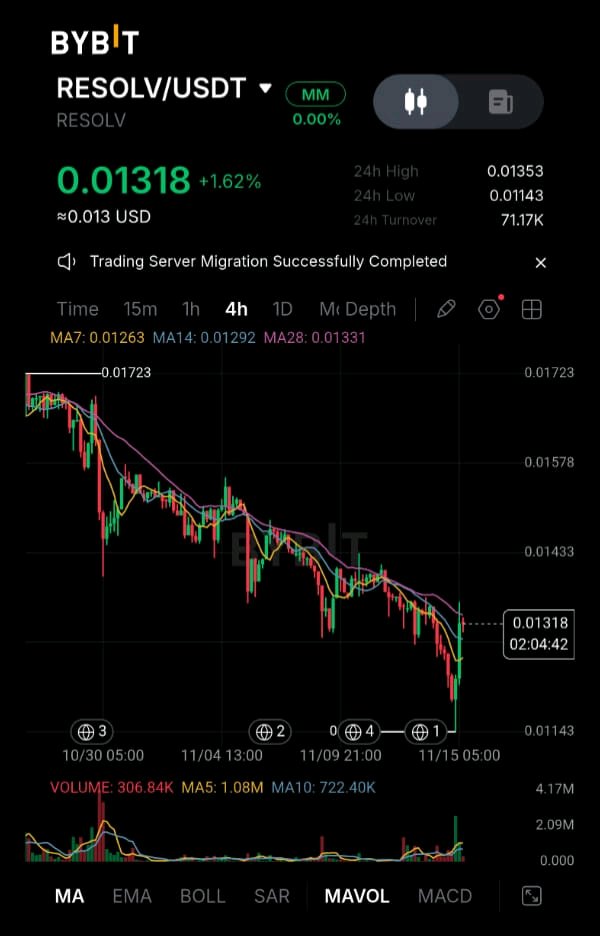
RESOLV Just Bounced 14% From Its Low, But There Is a Much Bigger Risk Traders Should Understand I've been looking at RESOLV's latest chart, and the short-term recovery is hard to ignore. After falling toward $0.01143, buyers stepped in and pushed the price back to around $0.01318. At first glance, that looks like a possible change in momentum. But when I compare the 15-minute recovery with the 4H and Daily structure, I see a much more complicated picture. There is also a fundamental issue surrounding this project that I would not ignore simply because the price is bouncing. RESOLV/USDT: $0.01318 | Approximately +1.6% The Daily chart still shows a bearish structure RESOLV remains below all three Daily moving averages: - MA7: $0.01334 - MA14: $0.01388 - MA28: $0.01511 The price is approaching the Daily MA7 but has not reclaimed it convincingly. The broader structure still shows lower prices and persistent selling pressure. On the 4H chart, the situation is slightly better: - MA7: $0.01263 - MA14: $0.01292 - MA28: $0.01331 Price has recovered above the first two averages but is still facing the MA28 near $0.01331. That makes the current area an important test for buyers. The short-term bounce is real, but confirmation is missing The 15-minute chart shows a sharp recovery from $0.01143 toward the recent high of $0.01353. However, price is now consolidating around $0.01318, close to the short-term MA7 and MA14. Volume surged during the rebound, but the latest displayed volume has cooled significantly compared with its averages. That means the initial buying reaction is visible, but sustained demand has not yet been established. The fundamental risk changes the entire setup There is something more important than the moving averages here. On March 22, 2026, Resolv suffered a security incident involving unauthorized minting of approximately 80 million unbacked USR. Chainalysis documented how the compromised signing infrastructure was used to create the tokens and extract roughly $25 million in value. Resolv's own updates describe subsequent recovery efforts, redemptions and the removal of a substantial portion of the illicitly minted supply. However, the official Resolv channel still carries a warning advising users to avoid trading or interacting with Resolv assets while recovery measures are being implemented. This is a major risk consideration for anyone evaluating RESOLV. A technical bounce does not resolve protocol, recovery or market-confidence risks. Important chart levels Resistance - $0.01331: 4H MA28 - $0.01334: Daily MA7 - $0.01353: Recent intraday high - $0.01388: Daily MA14 - $0.01511: Daily MA28 Support - $0.01292: 4H MA14 - $0.01263: 4H MA7 - $0.01143: Recent swing low My trading decision Bias: WAIT — no aggressive LONG or SHORT setup. Technically, a sustained recovery above $0.01353 would improve the chart structure, while a loss of $0.01263 could put the recent rebound under pressure again. But the bigger issue is the unresolved fundamental and recovery risk. Given the official warning, I would not treat these levels as a recommendation to enter a trade. For me, capital preservation matters more than chasing a quick bounce. Would you trust a technical recovery in RESOLV while the project's security and recovery situation remains a major concern, or would you stay away until the team provides clearer assurances? $RESOLVUSDT #ByXIMPACT
Bitcoin Is Recovering, But Something Is Still Missing I've been looking closely at Bitcoin's recent price action, and one thing stands out: buyers have finally stepped in after the sharp drop toward $62,000, but the recovery hasn't changed the bigger picture yet. What interests me most is the gap between the short-term bounce and the weakness still visible on the higher timeframes. BTC is showing signs of a recovery, but the real test is whether buyers can reclaim the levels that sellers have turned into resistance. I don't want to mistake a strong bounce for a confirmed reversal. BTC/USDT: Around $64,865 | Down approximately 2.96% The higher-timeframe picture remains weak On the daily chart, Bitcoin is trading well below all three moving averages: - MA7: $70,281 - MA14: $73,528 - MA28: $76,987 This arrangement shows that the broader trend remains under pressure. The 4H chart reinforces that view, with price still below: - MA7: $65,682 - MA14: $67,119 - MA28: $70,233 Until BTC starts reclaiming these levels, I would be cautious about calling this a trend reversal. The short-term recovery deserves attention The 15-minute chart shows a different picture. BTC rebounded from the $61,999 low and moved back above the MA14 at $64,307 and MA28 at $64,064. However, price is still struggling around the MA7 near $64,987. This is an important short-term test: buyers need to hold their recovery and push through nearby resistance rather than allowing sellers to regain control. Levels I am watching Resistance - $64,987: Immediate 15m MA7 area - $65,682: 4H MA7 - $67,119–$67,527: Key resistance zone - $70,233: 4H MA28 Support - $64,000: Nearby short-term support area - $61,999: Recent swing low - $60,000: Psychological downside level My trading outlook Current bias: BEARISH, with a short-term recovery underway. I would not chase a short immediately after such a sharp decline. A rejection around $65,682–$67,119 could provide a more meaningful bearish confirmation. If BTC breaks below $61,999 and fails to recover, the $60,000 region becomes an important downside area to watch. On the other hand, a sustained move above $67,527 would weaken the immediate bearish setup. A stronger reclaim of $70,233 would make me reassess the broader bearish thesis. The important distinction is that a short-term bounce and a confirmed reversal are two different things. I want buyers to prove their strength before changing my outlook. What are you watching more closely right now: a recovery above $67,500, or another rejection that sends BTC back toward $62,000? $BTCUSDT #ByXIMPACT
FF/USDT: The Recovery Is Getting Interesting, But There Is One Detail Bulls Cannot Afford to Ignore! What caught my attention in Falcon Finance isn't simply the 4.09% recovery. It's the change in price structure after the $0.08399 low, where buyers started regaining control and pushed FF back above its key 4H moving averages. However, volume is still lagging behind, and with another token unlock approaching, this recovery has something important to prove before I would consider it a confirmed trend reversal. FF is trading around $0.09204 on Bybit, up approximately 4.09%. The 24-hour high is $0.09243, the low is $0.08775, and turnover is approximately $499.24K. Let's examine the technical structure, volume, fundamentals, and upcoming catalysts. Market Structure: Buyers Are Regaining Control The 4H chart shows a recovery from the $0.08399 support region. Price has gradually formed higher lows and pushed above its short-term moving averages. This is an encouraging development after the previous decline. However, FF still needs to overcome nearby resistance before a stronger bullish continuation can be confirmed. Moving Average Analysis Current 4H moving averages: MA7: $0.09121 MA14: $0.08969 MA28: $0.08764 Price is trading above all three averages, with the shorter averages positioned above the longer average. This alignment supports the current recovery and gives buyers a short-term advantage. Important Support and Resistance Levels Immediate resistance: $0.09243–$0.09368 Next resistance: $0.09852 Major resistance: $0.10337 Immediate support: $0.08883 Strong support: $0.08399 A sustained breakout above $0.09368 could open the way toward $0.09852. However, losing $0.08883 could weaken the recovery and bring $0.08399 back into focus. Volume Analysis: Confirmation Is Still Missing Current 4H volume: 529.81K MA5: 746.20K MA10: 893.08K One detail deserves attention: price is recovering, but current volume remains below both volume averages. This means buyers are making progress, but participation is not yet strong enough to confirm an aggressive breakout. A fresh increase in green volume would strengthen the bullish argument. Falcon Finance Fundamentals Falcon Finance is building infrastructure around synthetic dollars, collateral-backed assets, and on-chain liquidity. Its ecosystem includes: USDf, its synthetic dollar product. sUSDf, designed around yield-bearing exposure. fUSD, an institutional-focused stablecoin issued through Anchorage Digital. Support for tokenized real-world assets as collateral. These products give Falcon Finance a broader ecosystem narrative beyond short-term token speculation. Latest Developments and Catalysts Falcon's September 2026 ecosystem update highlighted KGST Classic as USDf collateral and reported USDf supply reaching approximately $1.21 billion. Another development worth watching is the November 12 Visa and Anchorage Digital announcement concerning Western Union's USDPT settlement framework. Although Anchorage is also the issuer of Falcon's fUSD, Visa has not confirmed a direct integration with Falcon Finance. Therefore, this should be treated as indirect institutional exposure, not a confirmed partnership. Token Unlock: An Important Risk The next major supply event is scheduled around November 28–29, 2026. Token unlock calendars indicate additional FF releases during this period, including a substantial November 29 allocation. Newly unlocked tokens do not automatically mean selling, but they can increase available supply and create volatility. Traders should monitor liquidity and actual selling activity as these dates approach. Broader Market and Trading Perspective The recovery is encouraging, but it needs confirmation from volume and a sustained move above resistance. I would avoid chasing the current green candles without a clear breakout. My Trading Decision: BULLISH BIAS – WAIT FOR CONFIRMATION Potential LONG setup: A sustained 4H breakout above $0.09368 with increasing volume could create an opportunity toward $0.09852 and potentially $0.10337. Bearish scenario: A rejection near resistance followed by a loss of $0.08883 could invalidate the short-term recovery and expose $0.08399. For now, buyers have the short-term advantage, but confirmation is essential. Final Thought FF is showing signs of life, but can buyers turn this recovery into a genuine trend reversal before upcoming token unlocks bring fresh supply into the market? That's the level I'm watching most closely.$FFUSDT #ByXIMPACT
LAVA is approaching an important resistance zone after an impressive recovery, but the real question is whether buyers have enough strength to push through the next barrier or whether another rejection is coming. LAVA is trading around $0.01622 on Bybit, up approximately 0.62%. The displayed 24-hour high is $0.01660, the low is $0.01593, and turnover stands at approximately $635.94K. 1. Market Structure: Buyers Have Changed the Short-Term Picture The 4-hour chart shows a steady recovery from the $0.01227 region toward the recent high of $0.01676. Unlike a sudden one-candle pump, this recovery has developed through several upward movements, with buyers gradually pushing price higher. However, the latest candles show consolidation below the recent high. This is where the next important decision could happen. 2. Moving Average Analysis Current 4H moving averages: - MA7: $0.01610 - MA14: $0.01623 - MA28: $0.01594 Price is above MA7 and MA28 but slightly below MA14. The moving averages remain relatively close, suggesting that momentum is cooling after the recent advance. A sustained move above $0.01623 would improve the immediate bullish picture. 3. Important Support and Resistance Levels Immediate resistance: $0.01660 Major resistance: $0.01676 Next potential resistance: $0.01750 Immediate support: $0.01610 Next support: $0.01594 Stronger support: $0.01557 Major support: $0.01438 A convincing breakout above $0.01676 with strong volume could open the door toward $0.01750. However, losing $0.01594 could weaken the current recovery and expose lower support levels. 4. Volume Analysis: Buyers Are Showing Interest Current displayed 4H volume: 11.28M MA5: 6.77M MA10: 6.12M Volume is currently above both averages, suggesting increased market participation. This is encouraging for buyers, but the important question is whether that activity continues during an actual resistance breakout. A breakout without sustained volume could turn into another false move. 5. Fundamental Analysis: What Makes Lava Network Interesting? Lava Network is building decentralized blockchain infrastructure that connects applications, wallets and AI agents with reliable blockchain data providers. Its ecosystem focuses on RPC infrastructure, allowing applications to access blockchain information and submit requests across supported networks. Some important developments and utilities include: - LAVA staking helps secure the network through validators. - Providers stake LAVA to participate in supplying blockchain infrastructure. - Applications and consumers can purchase infrastructure subscriptions using LAVA. - The network supports integrations across ecosystems including NEAR, Starknet, Filecoin and Axelar. One particularly interesting development scheduled for November 2026 is improved administration tools and an access point allowing AI agents to connect automatically to Lava's Gateway. This could strengthen Lava's position in the growing AI-agent and blockchain infrastructure sector. 6. Tokenomics: An Important Date to Watch According to the published unlock schedule, approximately 21.36 million LAVA tokens are scheduled to unlock on November 30, 2026. That represents approximately 2.1% of the maximum token supply. This matters because additional circulating supply can create selling pressure, particularly when market liquidity is limited. Therefore, upcoming unlock activity deserves attention even if the technical structure improves. 7. Broader Market Perspective LAVA has recently shown relative strength compared with several major cryptocurrencies. Market data indicates approximately 10.58% weekly growth and 35.11% monthly growth as of November 14. However, this strength should not be confused with guaranteed continuation. Altcoin liquidity and broader market sentiment remain important factors. 8. My Trading Decision: WAIT FOR CONFIRMATION I currently prefer WAIT rather than chasing the price near resistance. Bullish scenario: A strong 4H breakout above $0.01676 with increasing volume could create an opportunity toward $0.01750. Bearish scenario: Rejection near resistance followed by a breakdown below $0.01594 could expose $0.01557 and potentially $0.01438. The overall recovery is encouraging, but confirmation is still needed before calling this another bullish leg. The level I am watching most closely is $0.01676. Can buyers break it with genuine volume, or will sellers defend this resistance once again? $LAVAUSDT #ByXIMPACT
NYM is approaching an important decision point, and the latest price action suggests that buyers are trying to regain control after a prolonged decline. But is this the beginning of a genuine recovery or just another temporary bounce? NYM is trading around $0.02242 on Bybit, up approximately 2.89%. The displayed 24-hour high is $0.02454, the low is $0.02160, and turnover stands at approximately $128.17K. 1. Market Structure: Recovery Attempt or Bull Trap? The 4-hour chart shows that NYM has experienced a prolonged decline from the $0.02972 region. Recently, buyers stepped in around $0.02061, triggering a recovery toward the current $0.02242 area. However, the latest move toward $0.02454 faced strong rejection. This is important because buyers have not yet demonstrated that they can sustain a breakout. 2. Moving Average Analysis 4H moving averages: - MA7: $0.02224 - MA14: $0.02196 - MA28: $0.02233 Price is currently above all three averages, suggesting improving short-term momentum. However, the separation is small, so confirmation is still needed. 15-minute moving averages: - MA7: $0.02262 - MA14: $0.02228 - MA28: $0.02234 The price is below MA7 but slightly above MA14 and MA28. This indicates short-term hesitation after the recent spike. 1-hour moving averages: - MA7: $0.02222 - MA14: $0.02236 - MA28: $0.02222 The shorter timeframe is relatively neutral, with price holding slightly above these averages. Daily moving averages: - MA7: $0.02305 - MA14: $0.02443 - MA28: $0.02646 The daily structure remains bearish because NYM is trading below all three major moving averages. 3. Important Support and Resistance Levels Immediate resistance: $0.02304 Next resistance: $0.02379 Major resistance: $0.02454 Immediate support: $0.02200–$0.02196 Strong support: $0.02160 Major downside support: $0.02061 A sustained breakout above $0.02454 with strong volume could open the way toward a broader recovery. On the downside, losing $0.02160 could expose the previous low around $0.02061. 4. Volume Analysis: The Missing Confirmation The 15-minute volume is approximately 13.10K, compared with MA5 at 133.80K and MA10 at 92.51K. The 4-hour volume is approximately 925.05K, above its MA5 of 532.80K and MA10 of 721.76K. This suggests that participation has improved on the broader intraday timeframe, but the latest short-term buying activity still needs confirmation. 5. Fundamental Developments: Why Nym Matters Nym is building privacy infrastructure through its decentralized mixnet and NymVPN ecosystem. One interesting recent development is the launch of a new Nym SDK designed to bring mixnet privacy into wallets and decentralized applications. NymVPN also released version 2026.15 on November 9, introducing improvements to bridge connectivity, battery life and connection stability. Nym's 2026 roadmap also focuses on expanding wallet integrations, growing NymVPN adoption and strengthening the utility of the NYM token through network payments and operator rewards. These developments provide a longer-term fundamental narrative, although adoption and actual demand still need to translate into sustainable token value. 6. Broader Market Conditions The wider crypto market remains cautious. CoinGecko's latest market snapshot shows Bitcoin dominance around 57.4% and a Fear & Greed reading of 27. This environment makes it important to avoid chasing sudden altcoin pumps without confirmation. 7. My Trading Decision: WAIT I would not chase NYM at the current level. Bullish scenario: A convincing move above $0.02379, followed by a strong breakout above $0.02454 with increasing volume, would improve the LONG setup. Bearish scenario: A rejection near resistance followed by a breakdown below $0.02160 could bring $0.02061 back into focus. For now, WAIT is the stronger setup. The daily trend is still weak, and the recent recovery has not yet confirmed a complete reversal. The important question is simple: Can NYM reclaim $0.02454 with strong buying volume, or will sellers push it back toward $0.02160? I would rather wait for confirmation than enter a trade based on one sudden green candle.$NYMUSDT #ByXIMPACT
TA is approaching a decisive breakout zone, but there is something traders should pay attention to before getting carried away by the latest rally. Trusta.AI is trading around $0.11877 on Bybit, up approximately 3.48%. The 24-hour high is $0.12141, while the low stands at $0.11371, with turnover around $401.51K. What stands out is the steady recovery from the $0.05700 region. Buyers have gradually pushed price higher, creating a sequence of higher lows on the 4-hour chart. 4H Technical Structure: Buyers Have Control The moving averages are showing a bullish alignment: MA7: $0.11648 MA14: $0.11338 MA28: $0.10923 Price is trading above all three averages, which supports the current bullish structure. The important detail is that MA7 remains above MA14 and MA28. This indicates that short-term momentum is still favoring buyers. However, price is now approaching the $0.12141 resistance zone, where a rejection could trigger another pullback. Important Support and Resistance Levels Immediate resistance: $0.12141 Next resistance: $0.13000 Immediate support: $0.11648 Stronger support: $0.11371 Next support: $0.10923 Major support: $0.10407 A sustained 4H breakout above $0.12141 could open the door toward $0.13000. On the downside, losing $0.11371 would weaken the recovery and bring $0.10923 into focus. Volume Analysis: Momentum Needs More Participation Current volume: 132.21K MA5: 581.27K MA10: 981.39K The current displayed volume is considerably below both averages. This is an important warning. Price is moving higher, but participation has not yet confirmed the strength of the rally. A breakout without expanding volume could turn into a false move. Derivatives Market: Watch the Leverage Recent aggregated futures data shows approximately $19.66M in open interest, down around 2.1% over 24 hours, while price has advanced. This suggests short covering has contributed to the recovery rather than a clear expansion in fresh positions. Funding is also elevated at approximately 0.0571% per 8 hours, meaning LONG positions are paying SHORT positions. This can make chasing an already extended move risky, especially if momentum suddenly reverses. Fundamental Perspective: Trusta.AI's Identity Ecosystem Trusta.AI is developing an identity and reputation infrastructure for Web3 and AI agents. Its roadmap includes AI-agent identity integrations, verifiable credentials, proof of AI-agent services, reputation-based credit scoring and a dedicated identity network. These developments could create additional utility for TA if successfully delivered and adopted. However, the roadmap does not provide confirmed delivery dates for these milestones. Important: Upcoming Token Unlock There is another factor I would not ignore. According to the available vesting schedule, approximately 24.1 million TA tokens are scheduled to unlock on November 21, 2026. That represents approximately 2.4% of total supply and 5.5% of current market capitalization. The unlock does not guarantee selling pressure, but it is an important supply risk that traders should consider before opening fresh positions. My Trading Outlook: WAIT FOR CONFIRMATION TA has a constructive 4H structure, and buyers are clearly defending higher levels. However, I would prefer a sustained breakout above $0.12141 with stronger volume before considering a LONG. If price loses $0.11371, the recovery could weaken and a deeper retest toward $0.10923 becomes possible. The combination of bullish momentum, elevated funding and an approaching token unlock makes this an interesting but risky setup. Would you take a LONG after a confirmed $0.12141 breakout, or wait until the November 21 unlock passes before entering? $TAUSDT #ByXIMPACT
BERA just experienced a powerful price spike, but the rejection that followed is telling a very different story. The real question now is whether buyers can defend the latest support or whether sellers are preparing another leg down. Berachain (BERA) is trading around $0.1000 on Bybit, down approximately 4.94%. The 24-hour high is $0.1368, while the low stands at $0.0994, with turnover around $1.45M. 4H Technical Structure: Sellers Still Have Control The 4-hour chart shows a prolonged decline from the $0.1569 region. Buyers recently attempted a strong recovery, pushing price toward $0.1368, but that move faced heavy rejection. Current moving averages: MA7: $0.1098 MA14: $0.1057 MA28: $0.1047 BERA is trading below all three averages. This indicates that the short-term structure remains weak despite the recent recovery attempt. The sharp rejection from $0.1368 suggests sellers are still active at higher levels. Immediate Price Levels Support: $0.0994 – Immediate 24H support $0.0965 – Important chart support Resistance: $0.1047 – MA28 $0.1057 – MA14 $0.1098 – MA7 $0.1129 – First major recovery zone $0.1293 – Higher resistance $0.1368 – Recent spike high A sustained recovery above $0.1098 could improve the short-term outlook. However, losing $0.0994 could expose the $0.0965 region again. Volume Analysis: A Warning Sign Current volume: 32.33K MA5: 1.47M MA10: 1.48M The recent spike brought significant trading activity, but the latest displayed volume is considerably weaker than its averages. This makes it difficult to confirm that buyers are accumulating enough strength for another breakout. Derivatives and Market Positioning Recent cross-exchange derivatives data shows a sharp increase in BERA open interest, accompanied by strongly negative funding rates. This suggests aggressive positioning and an imbalance between long and short demand. Negative funding means shorts are paying longs, but it does not guarantee an upward reversal. High leverage and crowded positions can increase liquidation risk in either direction. The broader market also deserves attention, as recent market-regime data has shown a bearish Bitcoin bias. That could make it harder for BERA to sustain an independent recovery. Fundamental Perspective: Berachain Ecosystem Berachain is a Layer 1 blockchain built around Proof of Liquidity, designed to connect liquidity incentives with network participation. One recent ecosystem development is OlympusDAO's adoption of Chainlink CCIP for OHM bridging across seven networks, including Berachain. This supports ecosystem connectivity, although it should not be mistaken for a confirmed catalyst for immediate BERA price appreciation. Token emissions and supply distribution also remain important factors when evaluating longer-term price pressure. My Trading Outlook: WAIT I don't see enough confirmation to chase a LONG at current levels. A recovery above $0.1098, followed by a sustained move through $0.1129 with stronger volume, would make the bullish case more interesting. On the other hand, a breakdown below $0.0994 could open another downside move toward $0.0965. For now, patience looks more attractive than entering blindly. BERA has already demonstrated that it can move sharply in both directions. The next meaningful signal will be whether buyers can reclaim the moving averages or sellers continue defending every recovery. Would you consider a LONG after confirmation above $0.1129, or do you think BERA needs another retest of $0.0965 first?$BERAUSDT #ByXIMPACT
NEAR is approaching a level where the market could make an important decision, but I’m not seeing enough evidence yet to call this a bottom. What concerns me is how consistently sellers have pushed price lower. Despite several attempts to stabilize, buyers haven't reclaimed the important moving averages, and the latest decline has brought NEAR close to recent support. NEAR is trading around $3.327 on Bybit, down approximately 7.04%, with a 24-hour high of $3.599 and low of $3.302. The bigger picture matters. After reaching approximately $6.028 on the daily chart, NEAR has continued forming lower highs and lower lows. This is more than a short-term pullback; the broader structure remains under pressure. THE DAILY CHART IS STILL BEARISH Daily moving averages: MA7: $3.512 MA14: $3.693 MA28: $4.185 All three averages are above price, confirming a weak structure. The first recovery obstacle is $3.512, followed by $3.693. MA28 near $4.185 is stronger structural resistance. Until NEAR reclaims these levels, I wouldn't consider the daily downtrend reversed. THE 4H STRUCTURE SHOWS PERSISTENT SELLING 4H moving averages: MA7: $3.403 MA14: $3.423 MA28: $3.526 Price is below all three averages, leaving several resistance levels for buyers to overcome. Reclaiming $3.403 would be the first improvement. A sustained move above $3.423 and then $3.526 would make recovery more convincing. THE SHORT-TERM CHART SHOWS A DIFFERENT DETAIL 15-minute moving averages: MA7: $3.334 MA14: $3.333 MA28: $3.331 These averages are tightly compressed around current price, suggesting short-term price action is trying to find balance after the decline. But compressed averages do not confirm accumulation. The key is whether buyers defend $3.302 and push price above this cluster with stronger participation. VOLUME IS NOT YET SUPPORTING A STRONG RECOVERY Daily volume: 1.97M | MA5: 3.61M | MA10: 3.27M 4H volume: 264.73K | MA5: 507.13K | MA10: 613.80K 15-minute volume: 23.33K | MA5: 40.82K | MA10: 30.85K Volume is below its respective averages across these timeframes. A recovery without stronger buying participation could become another temporary bounce. FUNDAMENTALS: DEVELOPMENTS WORTH WATCHING NEAR's ecosystem continues to develop despite token-price weakness. On November 9, NEAR Intents went live in Talos' institutional trading workflow, giving clients access to cross-chain solver liquidity across 100+ native assets and 35+ networks. NEAR governance's House of Stake approved HSP-029, proposing to reduce the maximum annual token issuance rate from 2.5% to 1.6% over 24 months. Security Council review, a 90-day grace period and validator adoption are still required before it becomes binding. If implemented, it could reduce long-term issuance pressure. There is also a security issue to monitor. NEAR AI reported unauthorized access on November 8-9 through an SGLang vulnerability. Approximately 100 users' account details were accessed, along with data from 18 legacy agents; two customer API keys were exposed and revoked. NEAR AI said it patched the vulnerability and restored service. The incident affected NEAR AI infrastructure, not the base NEAR Protocol. Meanwhile, NEAR-focused ETFs have recently recorded outflows, suggesting institutional demand is not yet a convincing positive signal. This creates a contrast: ecosystem development continues, but market participants remain cautious about the token. THE PRICE LEVELS THAT MATTER $3.302 – Immediate support and 24H low $3.326-$3.327 – Current price area $3.331-$3.334 – Short-term MA cluster $3.403 – First 4H recovery resistance $3.423 – 4H MA14 resistance $3.512 – Daily MA7 resistance $3.526 – 4H MA28 resistance $3.599 – 24H high $3.693 – Daily MA14 resistance $4.185 – Daily MA28 resistance A decisive break below $3.302 would weaken the stabilization attempt and expose NEAR to further downside. Reclaiming $3.403 and then $3.526 with stronger volume would be the first meaningful technical improvement. MY TRADING OUTLOOK: WAIT I wouldn't rush into a LONG simply because NEAR is near its recent low. Daily and 4H trends remain bearish, and volume is not showing convincing buyer participation. For a bullish setup, I want to see price reclaim $3.403, hold above it, and then challenge $3.526. If $3.302 breaks decisively, the recovery scenario needs reassessment. NEAR is interesting because its ecosystem infrastructure is advancing while its market structure weakens. Fundamental progress can create long-term opportunities, but it doesn't replace technical confirmation. For now, I'd rather wait for buyers to prove their strength than try to predict the exact bottom. Would you consider $3.30 a potential accumulation zone, or wait for NEAR to reclaim $3.52 before looking for a bullish opportunity? $NEARUSDT #ByXIMPACT
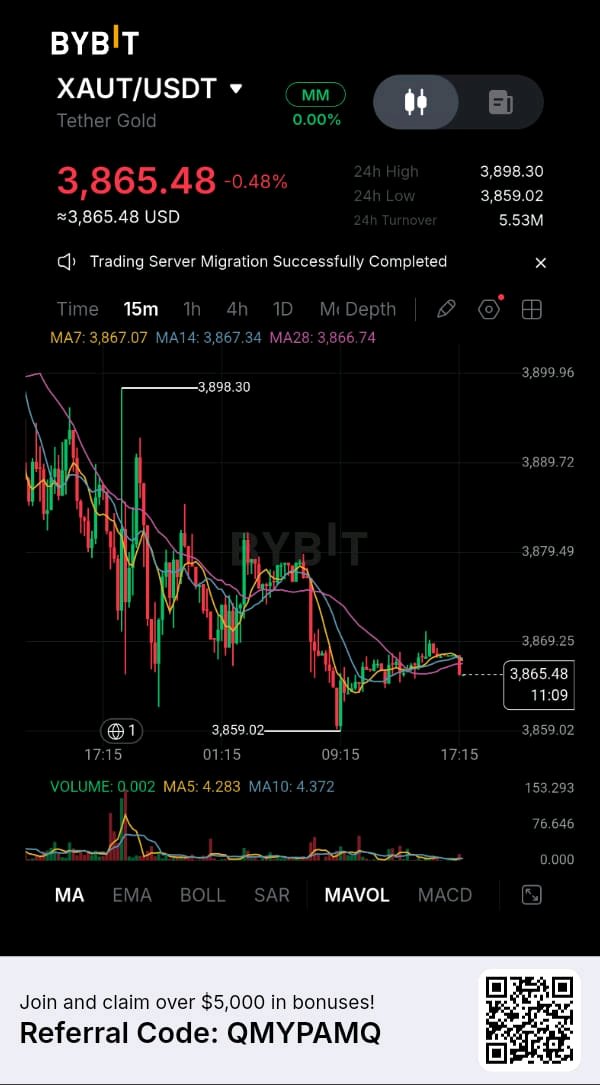
The most important signal in XAUT right now isn't the small attempt to stabilize near $3,865. It's the fact that buyers are struggling to reclaim even the shortest moving averages while the broader gold market is facing renewed macroeconomic pressure. XAUT is trading around $3,865.48 on Bybit, down approximately 0.48%, after a sharp decline from the $4,130 region on the 4-hour chart. Price recently tested the $3,859 area and managed to stabilize, but the recovery remains weak. What makes this situation worth watching is the difference between short-term stabilization and an actual trend reversal. The Daily Structure Still Favors Sellers Daily moving averages: MA7: $3,971.16 MA14: $3,986.11 MA28: $4,009.47 All three averages are significantly above the current price. The $3,971-$4,009 region is now an important structural resistance cluster. Until buyers reclaim this area, the broader daily trend remains under pressure. The previous $4,130 high is another major resistance that would need to come back into focus before a larger recovery could develop. The 4H Chart Shows Why the Recovery Is Struggling Current 4H moving averages: MA7: $3,867.97 MA14: $3,880.92 MA28: $3,953.39 XAUT is trading below all three averages. The first obstacle is the $3,868 area, followed by $3,880.92. A sustained reclaim of these levels could improve short-term momentum. However, the MA28 near $3,953 remains a much bigger challenge. The recent rejection from the $4,130 region has also created a clear sequence of lower price levels, which is something buyers need to overcome. Short-Term Price Action Is Not Yet Convincing On the 15-minute chart: MA7: $3,867.07 MA14: $3,867.34 MA28: $3,866.74 These averages are tightly compressed around the current price. This suggests that the short-term market is trying to establish a balance, but there is no strong directional confirmation yet. The latest price is still slightly below this moving-average cluster. Volume Is Another Important Detail 15-minute volume: 0.002 15-minute MA5: 4.283 15-minute MA10: 4.372 4H volume: 17.388 4H MA5: 132.025 4H MA10: 249.850 Daily volume: 540.267 Daily MA5: 1.54K Daily MA10: 1.94K Across the displayed timeframes, volume remains considerably below its moving averages. This makes the current stabilization less convincing because a meaningful recovery generally needs stronger participation from buyers. The Price Levels That Matter $3,859.02 - Recent intraday support $3,851.40 - Important 4H support $3,865.48 - Current price $3,867-$3,867.34 - Short-term MA resistance $3,880.92 - 4H MA14 resistance $3,898.30 - Recent major intraday high $3,953.39 - 4H MA28 resistance $3,971-$4,009 - Daily moving-average resistance cluster $4,130.11 - Previous major 4H high A decisive break below $3,851.40 would weaken the stabilization attempt and expose XAUT to another downside expansion. On the other hand, holding support and reclaiming $3,898.30 would be the first meaningful improvement in the short-term structure. The Macro Picture Is Adding Another Layer of Pressure The broader gold market has also experienced a difficult week. Spot gold fell approximately 4.5% over the week ending November 13, despite recovering slightly after softer-than-expected monthly US producer-price inflation. The bigger issue remains elevated Treasury yields, a stronger US dollar and expectations that the Federal Reserve could maintain or increase restrictive monetary policy. The 10-year Treasury yield approached 5.13%, increasing the opportunity cost of holding non-yielding gold. Next week's US retail sales report and the Federal Reserve's October meeting minutes could provide fresh direction for gold. There is also an important distinction here: XAUT represents one fine troy ounce of allocated physical gold, so its underlying value follows the gold market, although exchange pricing and trading spreads can differ. My Trading Outlook: WAIT I wouldn't rush into a LONG simply because XAUT has stopped falling aggressively near $3,859. For buyers, the first objective should be reclaiming $3,880.92 and then breaking above $3,898.30 with stronger volume. A sustained recovery beyond $3,953 would make the bullish case considerably more interesting. For sellers, losing $3,851.40 would be an important warning that the current stabilization has failed. The interesting part of this setup is that XAUT is attempting to find balance while the broader gold market is dealing with higher yields and persistent inflation concerns. I want to see buyers prove that they can reclaim resistance before considering the recovery reliable. Would you trust a bounce from $3,859, or would you wait for XAUT to reclaim $3,898 before taking a bullish position? $XAUTUSDT #IMPACTbyTrade