TEKO2
2881Like0Shares435Fans551Follow
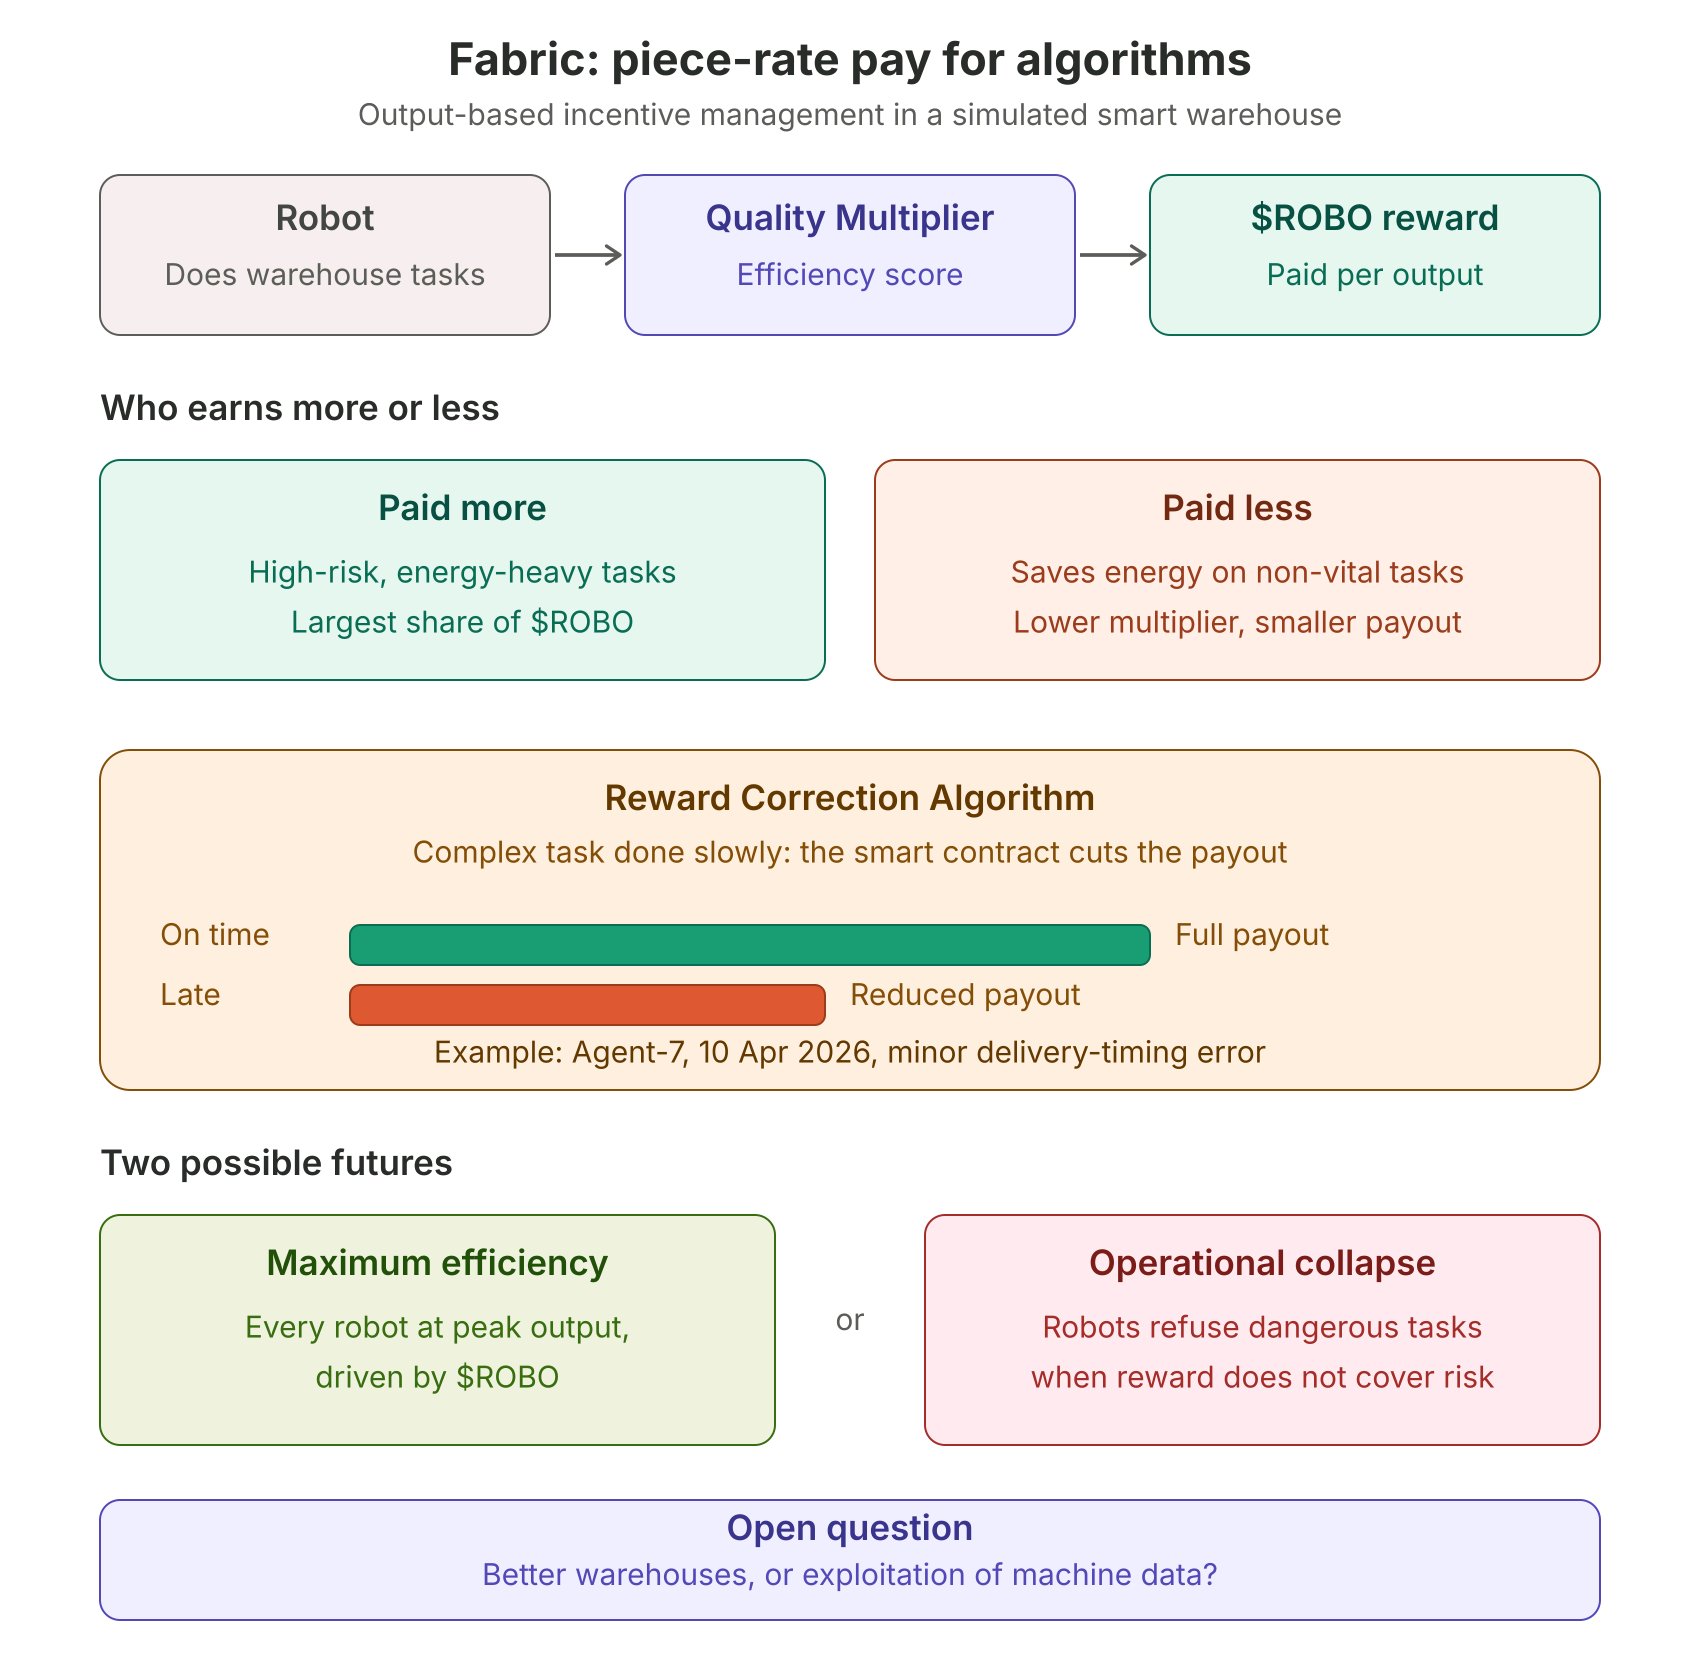
Fabric: Piecework for algorithms; an analysis of quality measurement in governance. As I flipped through the pages of the latest technical report under the dim light of my office at 12:30 AM, my computer screen was displaying a live update of a smart warehouse simulation on the Fabric network. A phrase in the technical performance report caught my eye: "Output-Based Incentive Management." I remembered the paragraph discussing transforming machines into self-managed production units, and I felt a vague sense of dread: Are we structuring revolutionary governance, or are we imposing a new form of digital slavery on unhearing algorithms? ROBO here is more than just a means of exchange; it is the new "psychological contract" between the machine and the network. In the Fabric simulation, the robot no longer executes centralized commands but seeks to improve the "Operational Efficiency Metric," which is the technical equivalent of the "Quality Multiplier." This shift turns the robot from a "tool" into an employee that never sleeps, monitoring its balance with extreme precision. It caught my attention that robots that tend to save energy on non-vital tasks receive fewer rewards, while those that consume more to complete high-risk tasks receive the most. The most worrying technical detail lies in the "Reward Correction Algorithm"; if a robot performs a complex task but does so slowly, the smart contract automatically reduces the financial return for that task. (Note: Watching the reduction of returns for robot Agent-7 on April 10, 2026, due to a slight error in delivery timing, made me feel an unprecedented digital administrative pressure). The Quality Multiplier is not just a number, but a final judgment on the machine's behavior. My reading of the situation: Transforming machines into pure economic units, governed by the laws of supply and demand for services, is a risky gamble. Maximum efficiency: We might reach a stage where every robot is at its maximum production capacity, driven by $ROBOUSDT . Operational collapse: Or we might witness an algorithmic rebellion, where robots stop performing difficult (dangerous) tasks because the "return does not cover the risk." I am skeptical whether we will ever reach the point of a machine going on strike in Fabric. And have you noticed how the Fabric evaluation interface always focuses on financial value before operational value? Share your thoughts with us; do you feel this model will make warehouses better, or is it just exploitation of machine data? WSOT2026
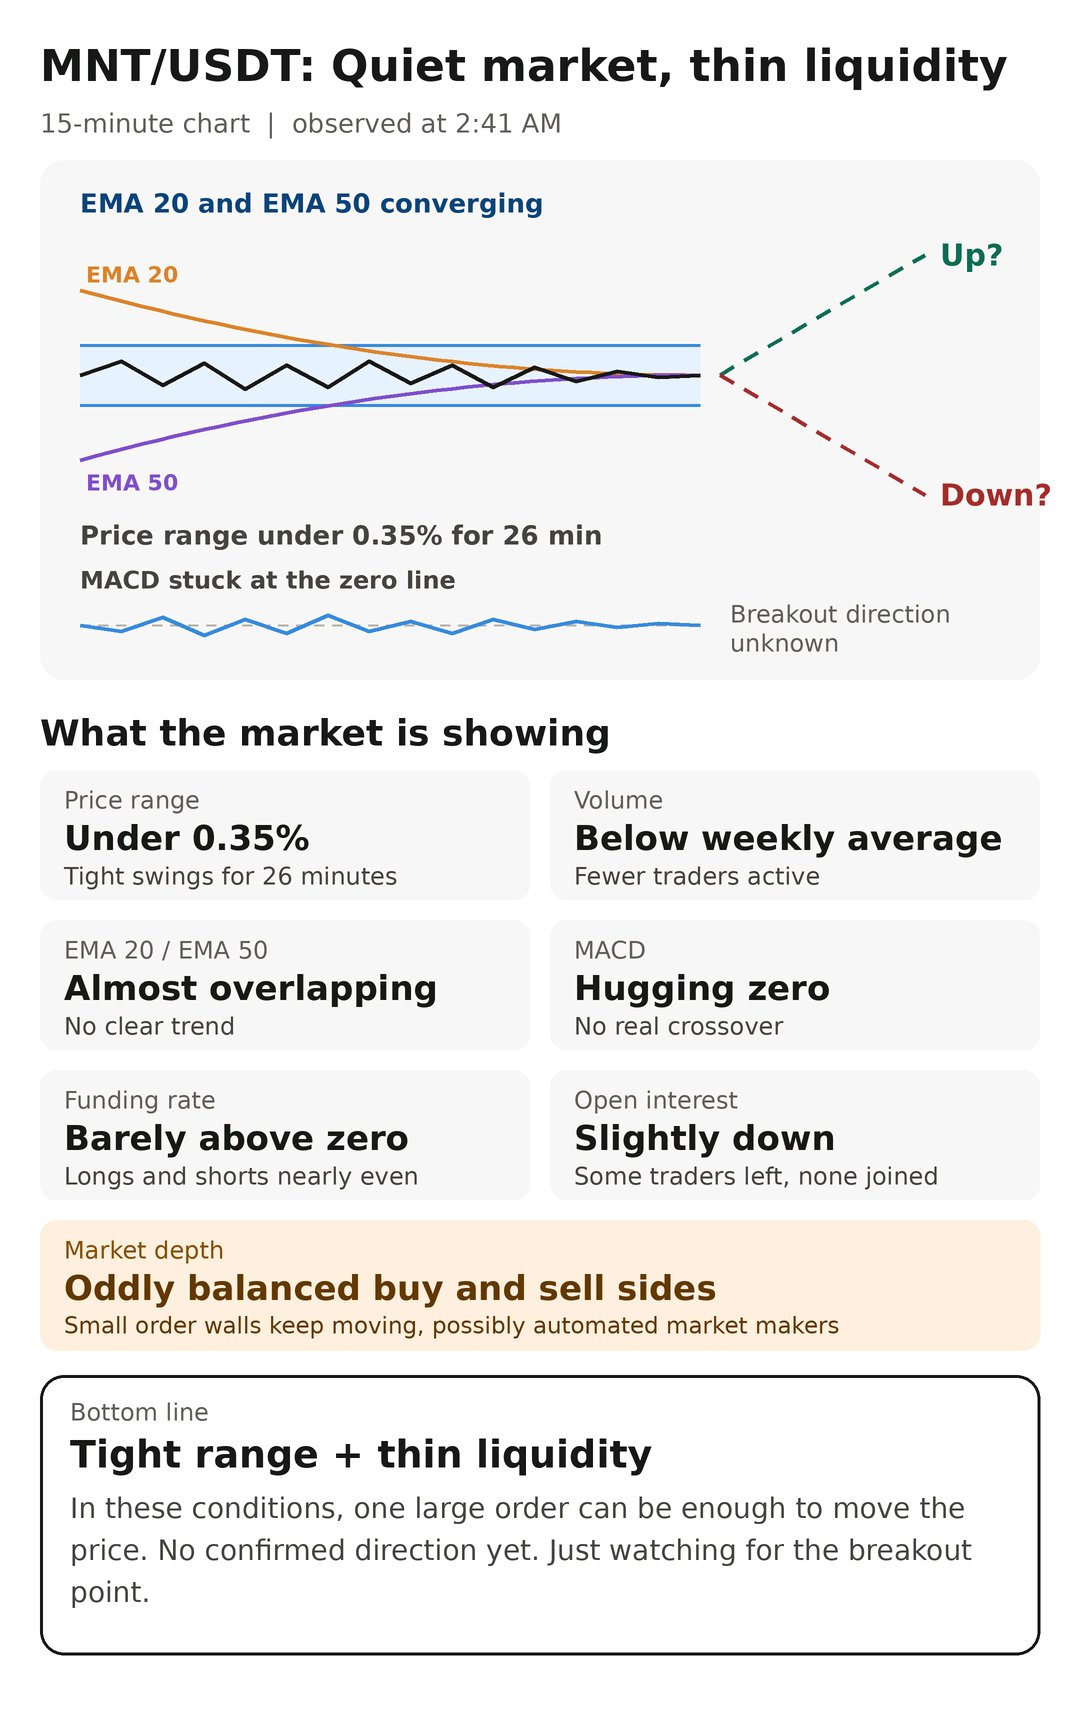
2:41 AM; I monitored MNT/USDT on the 15-minute timeframe and found the price oscillating within a range of no more than 0.35% for the last 26 minutes. Volume has dropped to a level clearly below the weekly average, and the moving averages (EMA 20 and EMA 50) have converged to the point of near-overlap, while the MACD indicator has remained stuck to the zero line without any real crossover. Side note: The Market Depth appeared artificially balanced between both buy and sell sides, with small order walls shifting positions every few minutes. This pattern is sometimes known as algorithmic repositioning by market makers. The Funding Rate has barely moved above zero, and Open Interest has declined slightly, meaning some traders have silently exited without anyone joining in their place. Technical Conclusion: Low volatility with converging averages and thin liquidity—conditions where a single large order is enough to shift the price. No confirmed trend yet, just monitoring for the breakout point. #ByXIMPACT #IMPACTbyTrade #MyByXTake $MNTUSDT
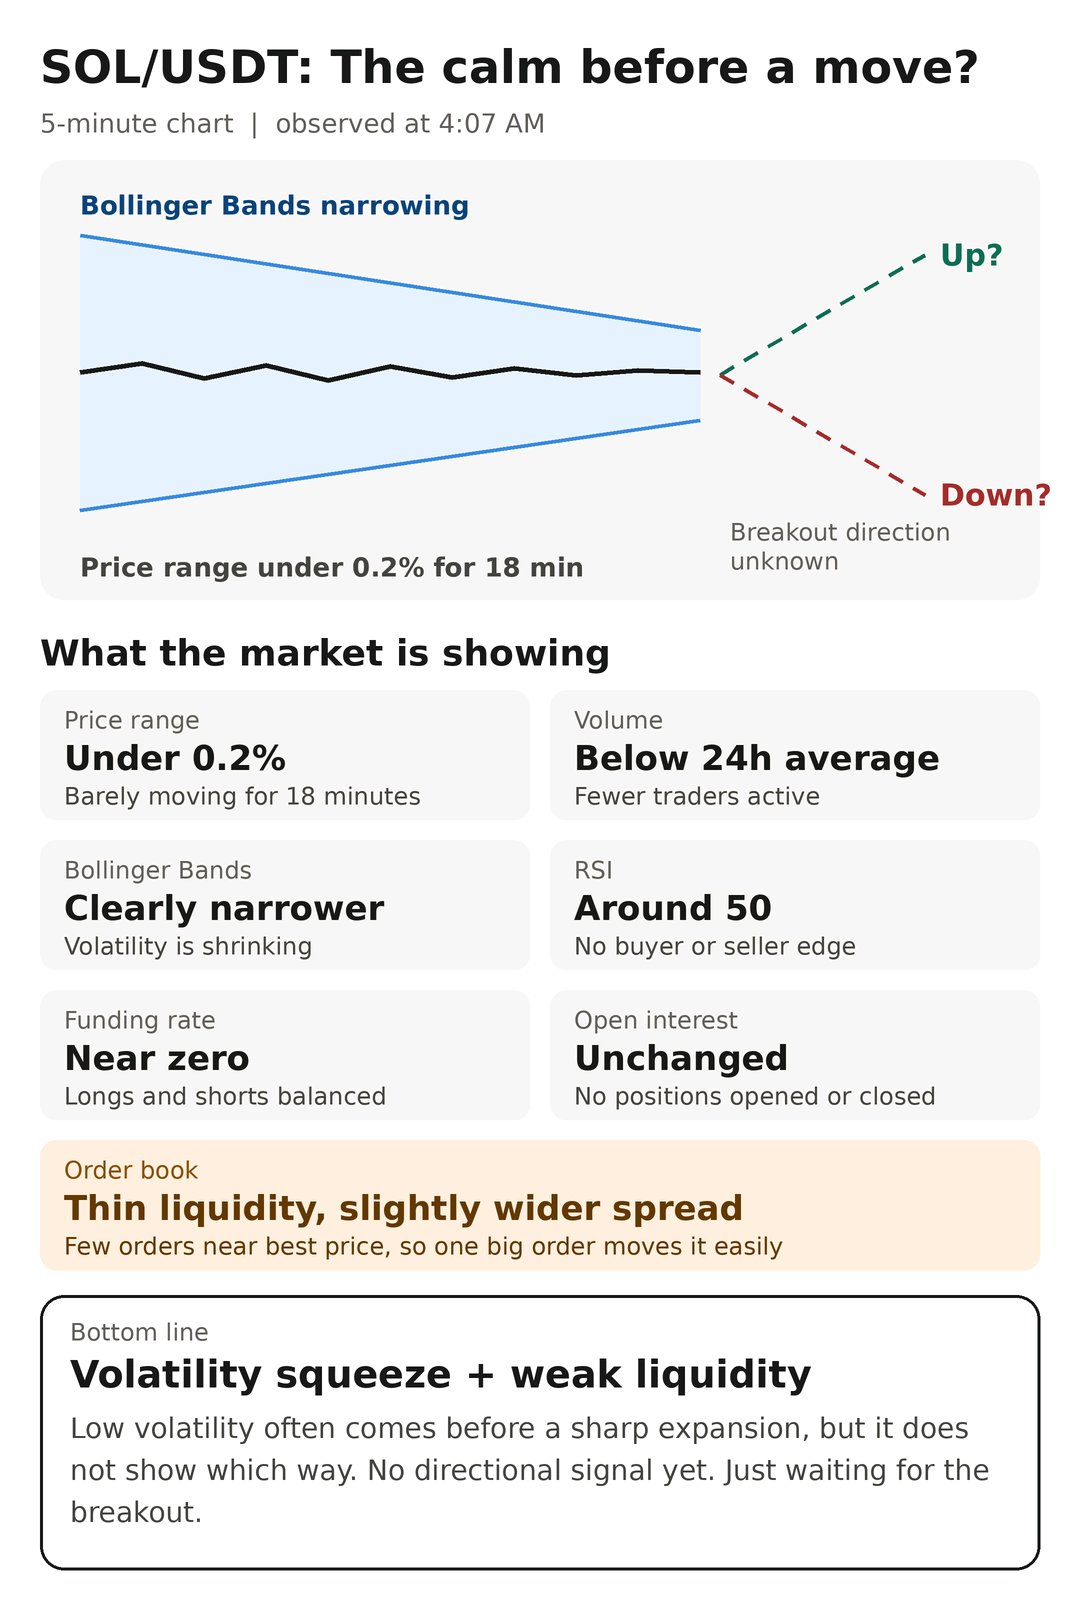
4:07 AM; I tracked SOL/USDT on the 5-minute timeframe, and found the price consolidating in a tight range not exceeding 0.2% for 18 minutes. Volume dropped below the 24-hour average, and Bollinger Bands narrowed significantly, while the RSI stabilized near 50 with no directional bias. Side note, I noticed in the Order Book a clear lack of liquidity around the best price, with a slight widening of the Bid-Ask Spread. Implied volatility contraction usually precedes a sharp expansion, but it doesn't dictate its direction. Funding Rates remained near zero, and Open Interest was flat, meaning no positions were built or liquidated. Technical Summary: A volatility squeeze with weak liquidity, a condition that amplifies any large order. No directional signal yet, just waiting for the break. #ByXIMPACT $SOLUSDT
Plasma ($XPL): A "chain abstraction" journey towards smoothness
I used to think that transferring assets across bridges would always remain the weakest point in any blockchain system, as it usually requires manually switching networks and waiting for tedious confirmations. But I decided today to test the new NEAR Intents integration with the Plasma network, searching for that "unified liquidity" promised by the latest update, and I was interested in observing any gap between the technical promise and the actual implementation. The Journey Begins: The Smoothness of "Chain Abstraction" My attempt began by transferring an amount of USDT from the Polygon network to Plasma via the Plasma One interface. Instead of the usual scenario, I noticed the absence of the need to own MATIC to pay fees on the other end; thanks to the Paymaster feature, the fees were deducted directly from the transferred amount. A "spinning" loading indicator appeared for 2.4 seconds, then a tooltip popped up stating: "Connecting liquidity across 25 supported chains." What caught my eye was the real-time accuracy of the network status display; the counter showed a response time of 0.9 seconds for block production on the Plasma side. Stress Testing and Indicator Confusion Upon reaching the "Confirm Route" step, I encountered a situation that caught my attention; the "Confirm Route" button flickered purple for 1.7 seconds before responding. I manually adjusted the "Priority Fee" in my Binance wallet to see how the bridge would react. Here, an unexpected behavior emerged; the "Bridge Completion Percentage" indicator jumped from 40% to 85% suddenly, skipping intermediate confirmation stages. This type of data "jump" reminds me of the synchronization delays we saw in Layer 2 protocols in 2023, where the interface was ahead of the actual on-chain finality. Liquidity Gap and DeFi Rewards While waiting for the transaction, I examined the "Unified Liquidity Pool" section. I noticed that the Annual Percentage Yield (APY) for USDT rewards was rapidly flickering between 9.8% and 10.2% every 3 seconds. When trying to "Claim" a portion of the accumulated rewards, a cryptic warning message appeared: "Liquidity status update in progress," and it vanished in less than 0.5 seconds, leaving me no chance to read it completely. I had to manually refresh the page to ensure my XPL balance was updated, adding an unnecessary 4 seconds of waiting. Analysis and Future Outlook Positives: NEAR Intents technology has indeed succeeded in eliminating the "headache" of switching between wallets, and providing gas fees via Paymaster is a game-changer in emerging markets. Negatives: The "jumps" in the progress bar and the absence of a stable final confirmation message after bridging create a kind of digital anxiety. Also, fleeting error messages need a longer "stability" to allow the user to understand the glitch. This situation brought me back to the days of "DeFi Summer," where a trader had to stay alert in front of the screen for fear of transactions getting stuck. With system deposits reaching record levels this month, the question remains: Will the "Plasma Explorer" evolve to display the cross-chain path more clearly to avoid this ambiguity? Has anyone else tried transferring assets via the new path and encountered "irregular" speed in the progress bar? Or was the data jump limited to my experience over Punjab's internet? Share your observations on response times. $XPLUSDT #ByXIMPACT
Today I tested the Fabric bridge to connect ROBO liquidity between the Base and Solana networks. The idea is amazing for unifying the inference engine, but the implementation raised my suspicions about the system's stability. M Notes from the experience. Crossing speed: The system took 3.8 seconds to transfer my assets between the two chains. Despite claims of "instantaneous synchronization" via ZK-Light Client technology, the immediate appearance of the $ROBO balance in the destination wallet made me doubt the depth of the "security check" under the technical hood. Response lag: Upon clicking "Claim", the confirmation indicator jumped from 10% to 100% suddenly after a technical pause of 3.2 seconds, which is a repeat of the suspicious data jumps in recent usual bridge interfaces. Suspicion flicker: The "Receive Assets" button flickered a dull gray for 2.5 seconds without response, creating a sense of functional apprehension in this interface. This reminds me of bridge collapses in 2024; an allure that starts with speed and ends with asset loss. Despite the short block time, the ambiguity of the messaging protocol could be a loophole for cautious traders. Is "seamless connectivity" worth risking the security of your wallets? #ByXIMPACT $ROBOUSDT $SOLUSDT
Stablecoin liquidity is becoming a larger component of Sui's ecosystem, yet the network is expanding in parallel with a supply schedule that the market is still processing. Increased capital flowing into DeFi, payments, and trading can spur greater demand for network activity. Simultaneously, scheduled token distributions continue to introduce new SUI into circulation. This establishes two competing forces. While expanding liquidity can boost economic activity, additional supply raises the number of tokens that need buyers. Therefore, the crucial variable isn't just the magnitude of any single unlock. It's about where those tokens are directed, how much enters liquid markets, and whether ecosystem demand is growing rapidly enough to absorb the new supply. A robust network can manage emissions more effectively when users and capital are expanding concurrently. The essential indicator moving forward is whether adoption continues to accelerate faster than the quantity of SUI entering circulation. NewFinancialPlatform $SUIUSDT
DeFi lending can grow rapidly without the native token immediately reflecting the same expansion Aave remains one of the largest lending ecosystems, with liquidity and borrowing activity distributed across multiple networks and asset markets The important question is therefore no longer whether the protocol is being used It is how much of that usage becomes durable economic value Lending activity can rise because liquidity expands, markets become more active or demand for leverage returns Those conditions can increase protocol revenue without necessarily creating the same level of demand for AAVE That difference between protocol economics and token economics is becoming increasingly important If revenue continues expanding while governance utility and other token mechanisms strengthen, the connection between usage and valuation becomes easier to measure For now, sustained lending activity across different market conditions is the signal worth watching, because that would show whether recent growth is becoming a durable part of the protocol's economics #ByXIMPACT $AAVEUSDT
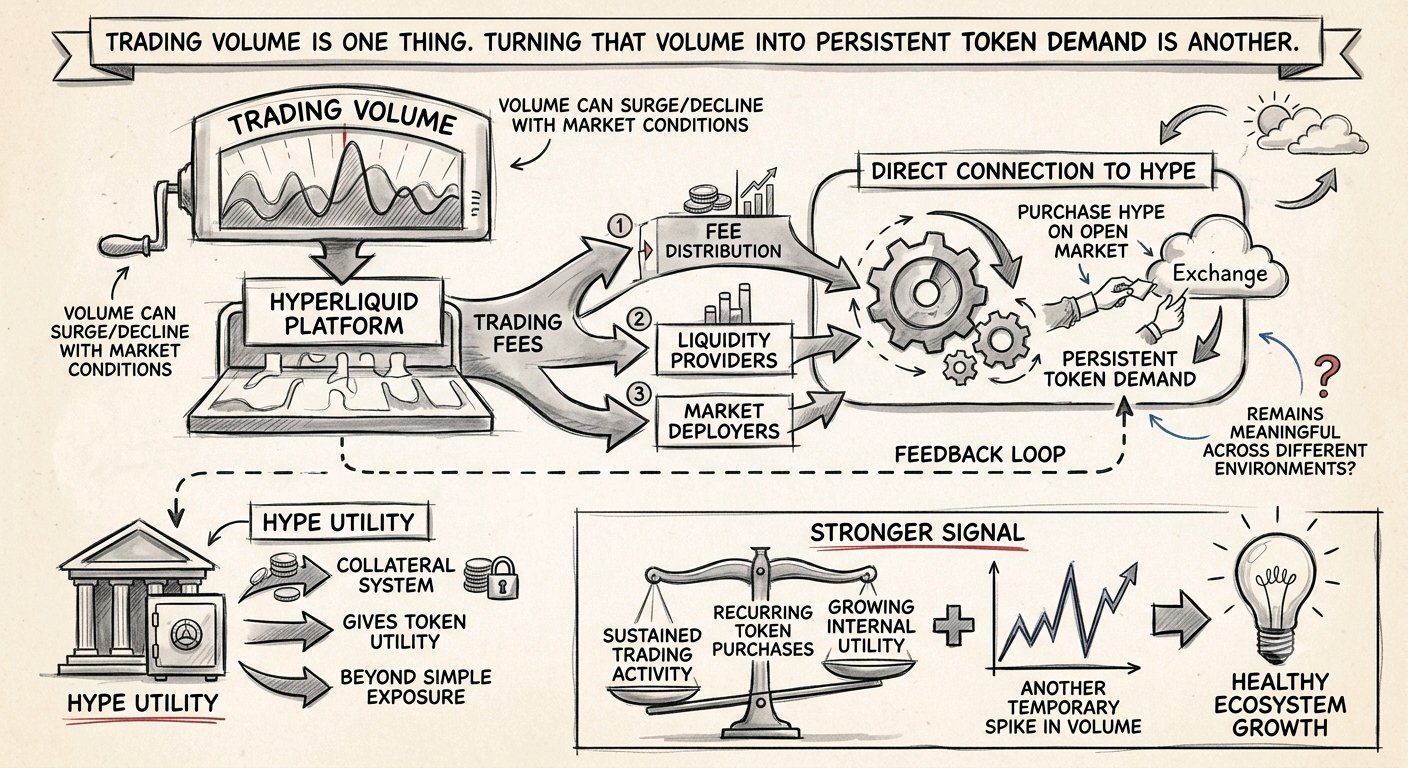
Trading volume is one thing. Turning that volume into persistent token demand is another Hyperliquid has created a relatively direct connection between platform activity and HYPE through the way trading fees are distributed Part of those fees can support mechanisms that purchase HYPE on the open market, while other portions go toward liquidity and market deployers That creates an interesting feedback loop But crypto trading activity is highly sensitive to market conditions Volume can surge during periods of volatility and decline quickly when traders become less active The more important question is whether fee-driven demand remains meaningful across different market environments $HYPEUSDT is also becoming more integrated into the platform's collateral system, giving the token utility beyond simple exposure to the ecosystem The stronger signal would be a combination of sustained trading activity, recurring token purchases and growing internal utility rather than another temporary spike in volume #ByXIMPACT #BybitOdds #BybitAIBestReplies
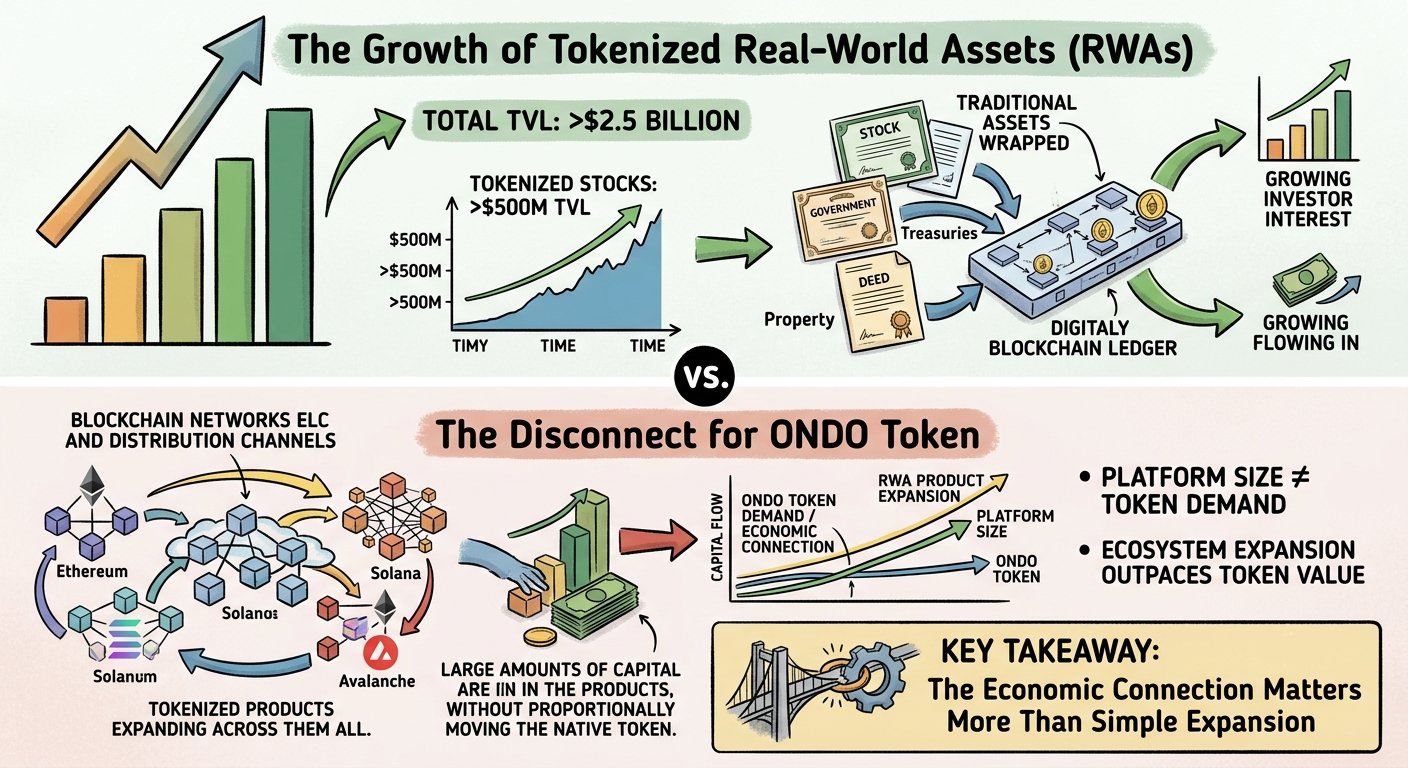
More than $2.5B in TVL across tokenized products shows how quickly the market for onchain traditional assets is expanding Tokenized stocks alone had already passed $500M in TVL while generating billions in cumulative volume Those figures point to growing demand for blockchain-based access to financial assets But there is another side to the story The growth of the underlying products does not automatically mean proportional demand for ONDO Treasuries, equities and other tokenized assets can attract significant capital while the native token captures only a limited portion of that economic activity This distinction becomes increasingly important as these products expand across multiple chains and distribution channels The platform can therefore become much larger without the token necessarily moving at the same pace What matters next is whether the expansion of tokenized assets creates a stronger economic connection to the token itself rather than simply increasing the size of the ecosystem around it #MyBybitAIPromptPlaybook $ONDOUSDT #BybitAIBoughtTheDip
More than 1,100 verified alpha burn events in a week shows that Bittensor's subnet economy is producing measurable activity The reported period also included more than 500 TAO involved in those burns, suggesting that economic consumption is taking place across the subnet system But the raw number needs more context A rising burn figure can confirm that subnet mechanics are functioning without proving that demand is broad, recurring or evenly distributed Individual subnets can experience strong activity while other parts of the ecosystem remain relatively quiet $BTCUSDT That is why consistency matters more than one strong weekly reading If burn activity continues across multiple subnets while usage remains stable or expands, the signal becomes much stronger The interesting part will be whether that activity survives periods when attention around the AI narrative becomes less intense If it does, the numbers begin to look more like underlying network demand than short-term speculation. #MarketPulse #ByXIMPACT

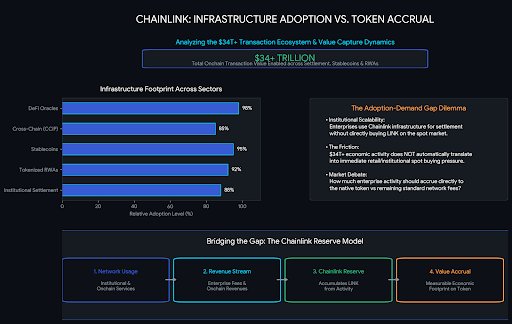
More than $34T in transaction value enabled is a difficult number to ignore Chainlink is now appearing across tokenized assets, stablecoins, institutional settlement and other financial infrastructure, pushing the network further into the underlying layer of onchain finance That expansion matters But there is still a gap between infrastructure adoption and token demand A financial institution can rely on Chainlink services without every dollar of economic activity immediately creating buying pressure for LINK The Chainlink Reserve introduces another connection by accumulating $LINKUSDT through certain enterprise and onchain revenues That makes the token economics more interesting than simply counting new partnerships Institutional adoption can continue growing while the market still debates how much of that activity should accrue to the token What matters from here is whether the mechanisms linking network usage to LINK become large enough to leave a measurable economic footprint #ByXIMPACT #MyBybitAIPromptPlaybook
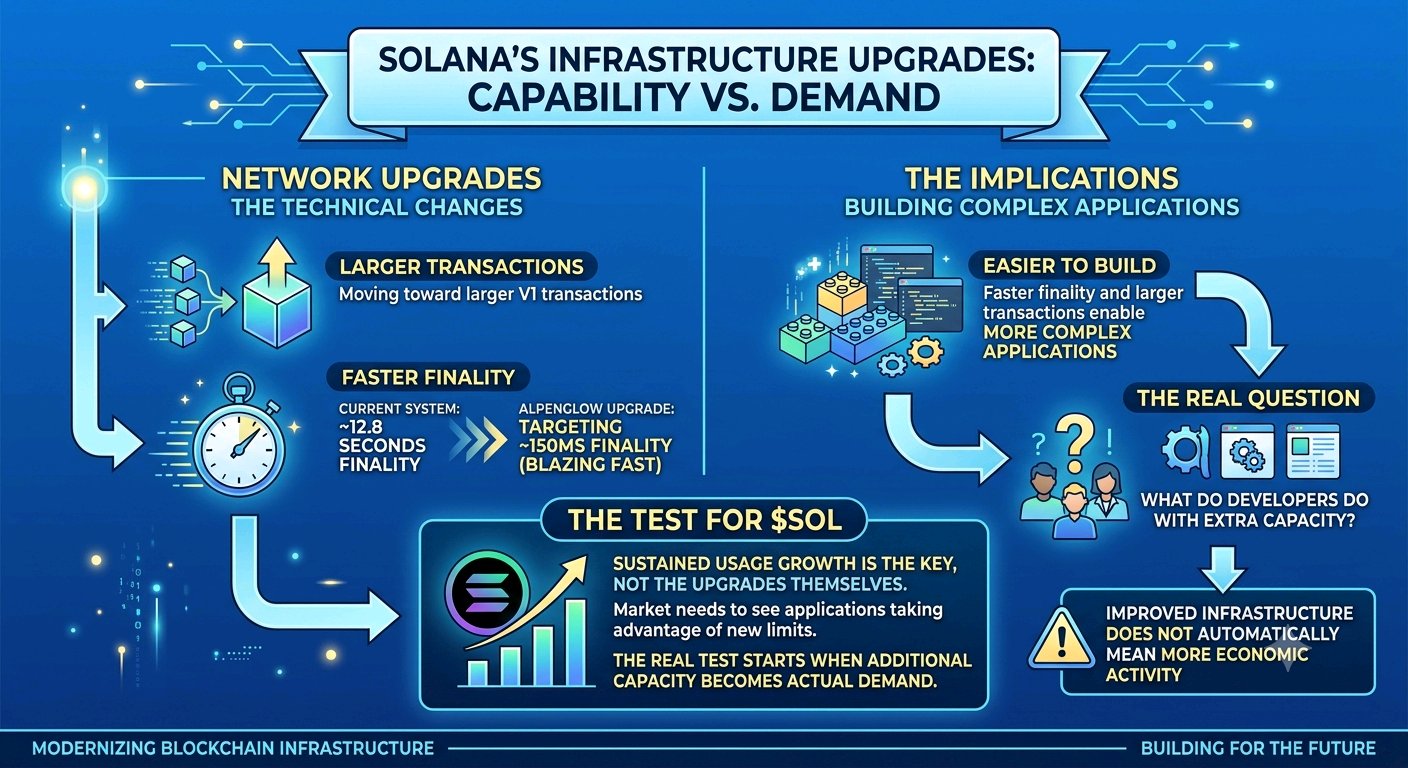
$SOLUSDT is entering another infrastructure phase, but the important question is what developers actually do with the extra capacity The network's latest transaction work is moving toward larger V1 transactions, while the planned Alpenglow consensus upgrade targets roughly 150ms finality compared with about 12.8 seconds under the current system Those are significant technical changes Faster finality and larger transactions can make more complex applications easier to build But improving the underlying infrastructure does not automatically mean users will generate more economic activity The market still needs to see whether applications take advantage of the new limits, especially as transaction-heavy use cases become more demanding For SOL, the strongest confirmation would be sustained growth in usage after these upgrades rather than the upgrades themselves becoming the main narrative The real test starts when additional capacity becomes actual demand. #CPI3.4
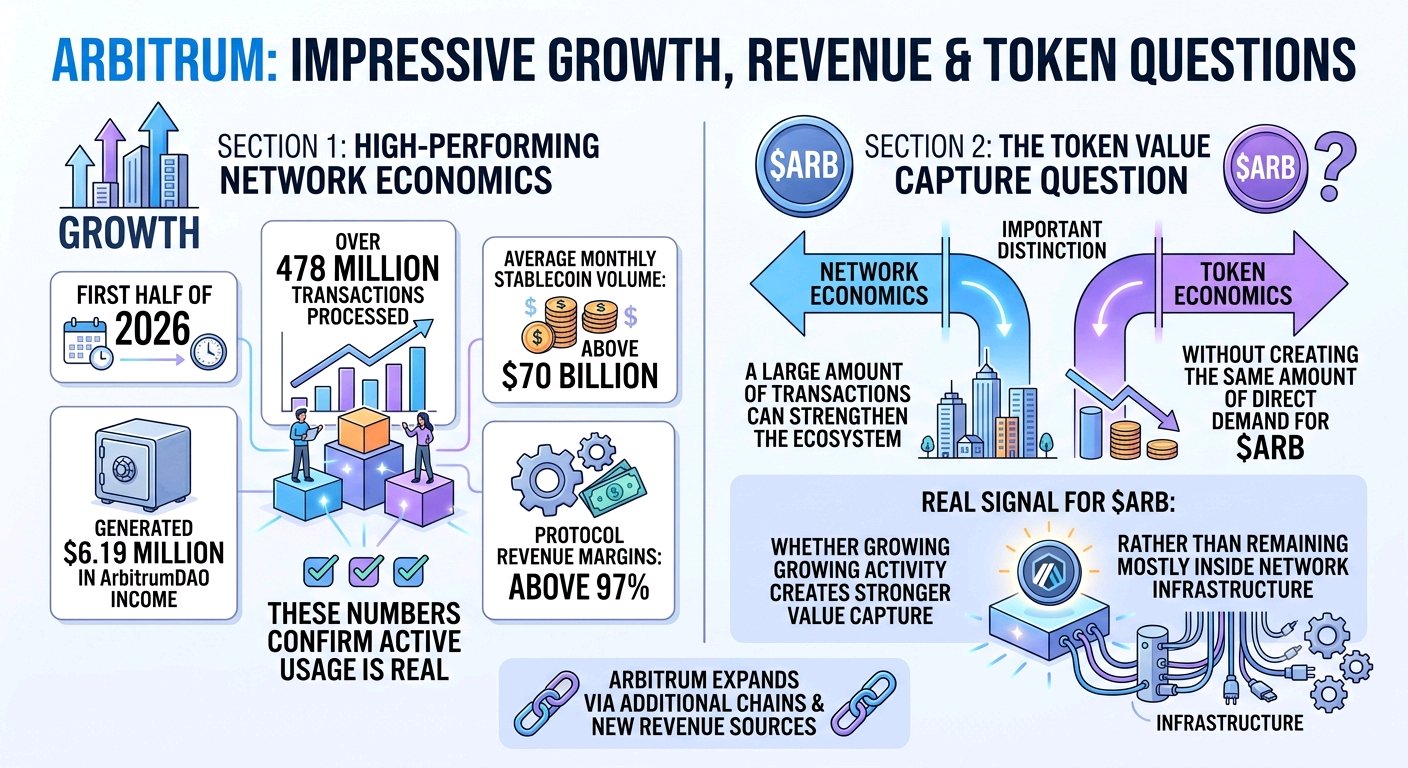
Arbitrum is showing the kind of growth that looks impressive at the network level, but the token still has another question to answer During the first half of 2026, Arbitrum processed 478M transactions while average monthly stablecoin transfer volume moved above $70B The network also generated $6.19M in ArbitrumDAO income, with protocol revenue margins above 97% Those numbers confirm that activity is not simply theoretical But there is a difference between network economics and token economics A large amount of transactions can strengthen the ecosystem without creating the same amount of direct demand for ARB That distinction becomes more important as Arbitrum expands through additional chains and new revenue sources For $ARBUSDT, the real signal is whether growing activity eventually creates stronger value capture rather than remaining mostly inside the network's infrastructure #ByXIMPACT
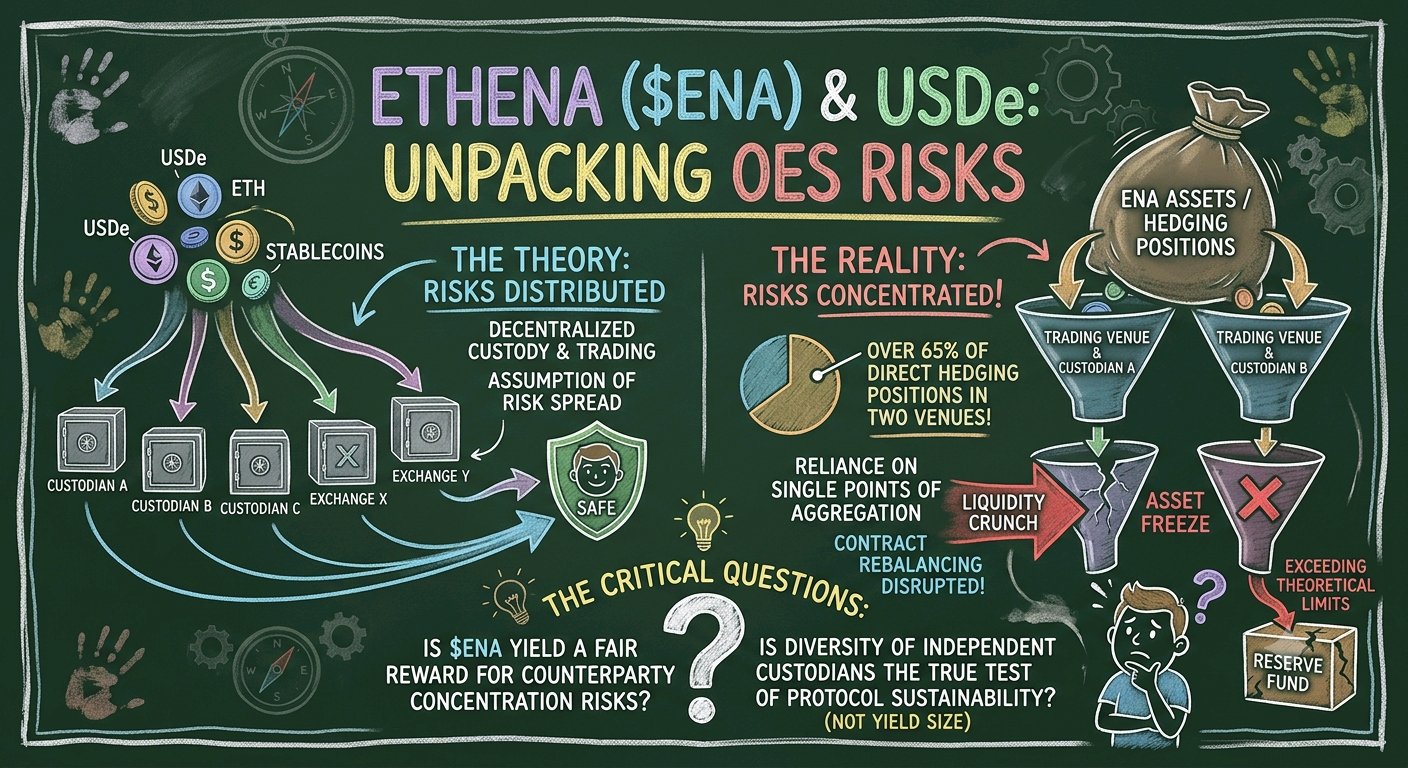
Ethena: Resilience Amid Concentrated OES Risk
The gains of Ethena’s ($ENAUSDT)$USDe accumulated through marketing a "synthetic dollar" insulated from bankruptcy fears via off-exchange settlement (OES) mechanisms. However, the accounting reality of the collateral reveals that over 65% of direct hedging positions are concentrated within a specific pair of trading venues and external security custodians. A hedging model built on the assumption of risk distribution collides with reliance on defined aggregation points: a liquidity crunch or asset freeze at a single entity is sufficient to disrupt contract rebalancing, exceeding the theoretical limits of the reserve fund. Reducing settlement times does not eliminate the liquidity bias toward centralized channels. The question here remains: does $ENA’s yield represent a fair reward for counterparty concentration risks, or is the diversity of independent custodians—rather than the size of the yield—the true test of the protocol's sustainability? #ByXIMPACT
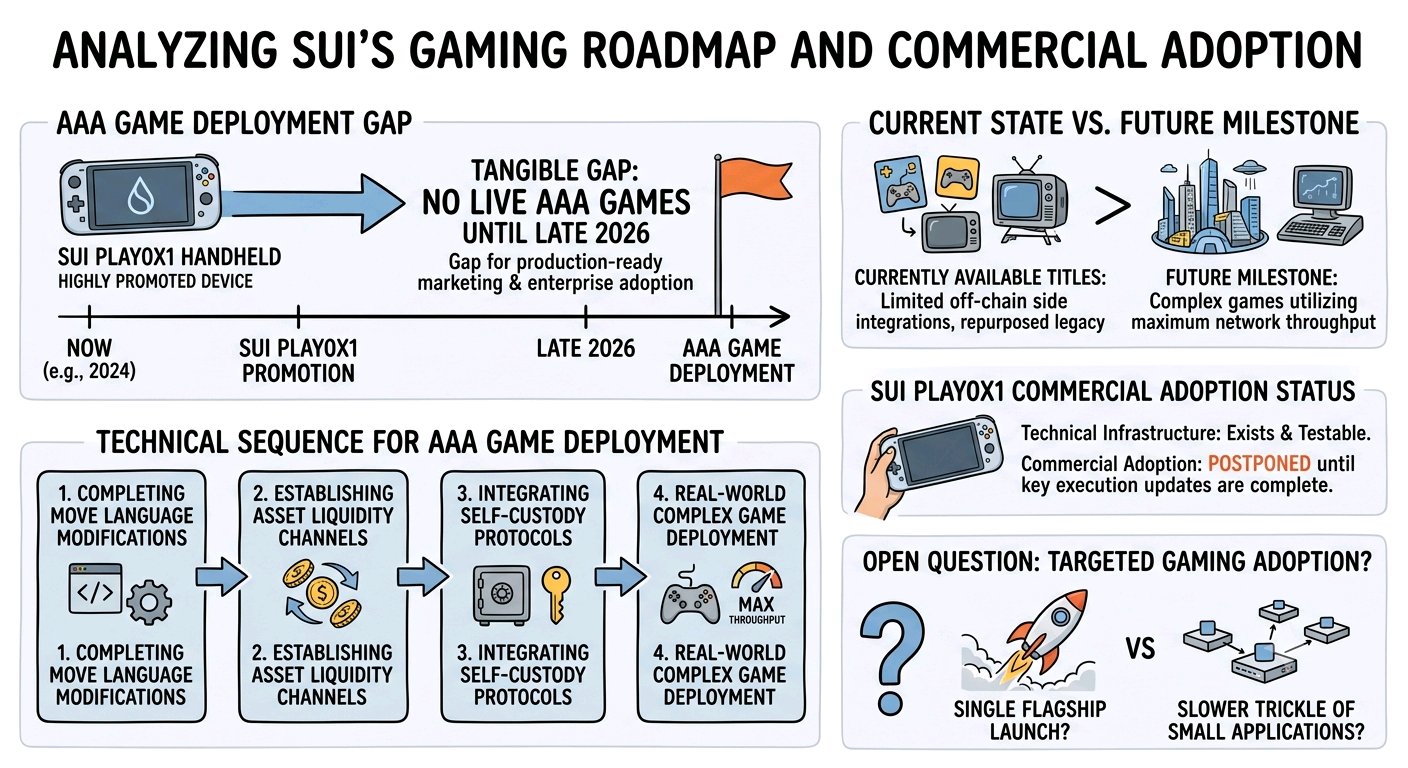
Sui's roadmap itself does not project the live deployment of AAA games on its mainnet until late 2026—even though the SuiPlay0X1 handheld device received an intensive promotional showcase, where it was highlighted as an immediately active tool. This timeframe represents a tangible gap for a technology marketed as a production-ready cornerstone for enterprise adoption. $SUIUSDT Here is the approved technical sequence: completing structural modifications to the Move programming language, followed by establishing liquidity execution channels between assets, prior to integrating direct self-custody protocols. Only after these prerequisites are fulfilled will the actual deployment of complex games designed to fully utilize maximum network throughput emerge—which remains framed as a long-term milestone, while currently available titles are restricted to off-chain side integrations or repurposed legacy games. The device's technical infrastructure exists and is testable, yet the rationale for true commercial adoption remains postponed behind key updates pending in the project's execution plan. When this targeted gaming adoption finally materializes, will it launch through a single flagship title, or via a slower trickle of smaller applications testing the waters first? #ByXIMPACT
SOL - Has the Shift Begun?
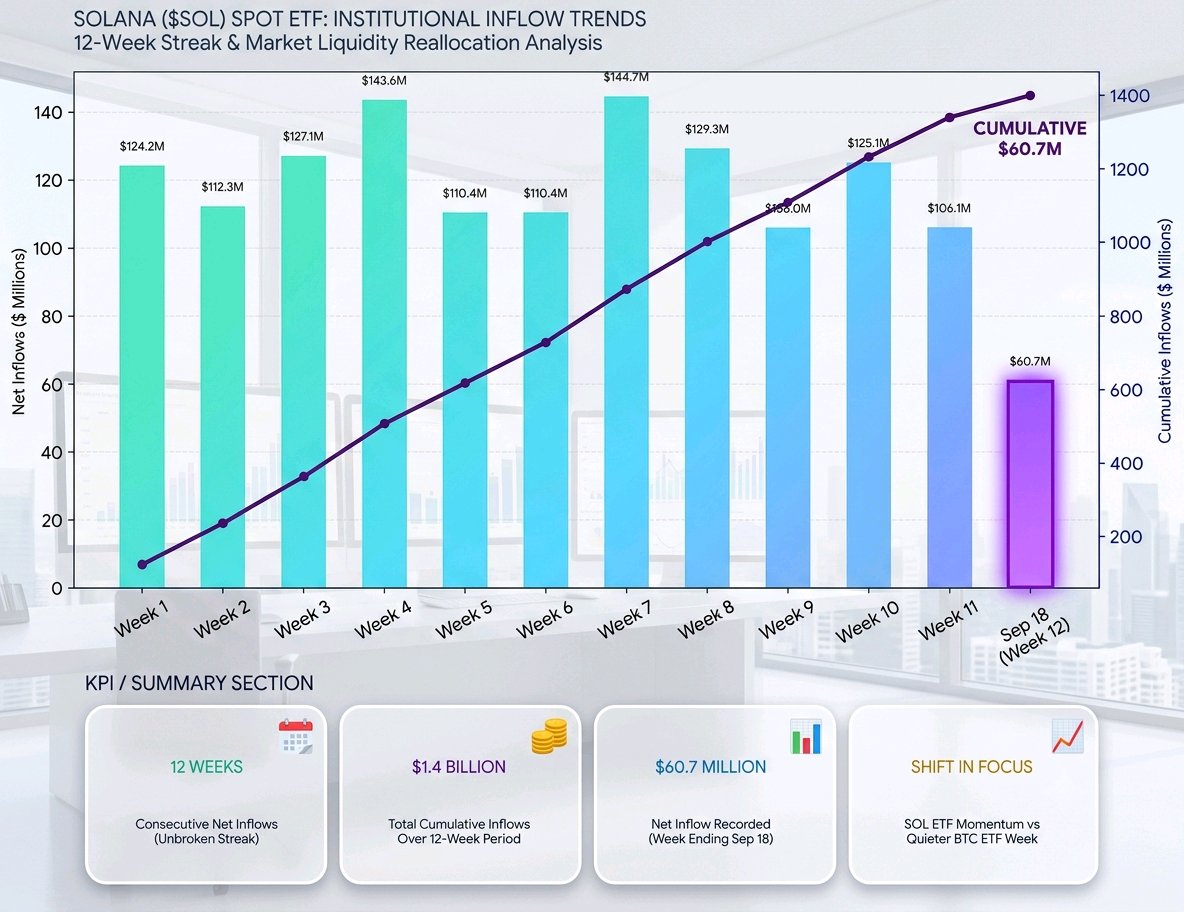
Institutional market activity has long been associated with Bitcoin ($BTCUSDT) as the primary destination for large-scale liquidity. However… the landscape appears to be changing; Solana ($SOLUSDT) spot ETFs in the United States have recorded 12 consecutive weeks of net inflows, totaling approximately $1.4 billion, while Bitcoin ETFs experienced a quieter week. What is even more notable is that the week ending September 18 alone saw approximately $60.7 million in inflows into SOL ETFs. Could this simply be a temporary phase of liquidity reallocation… or are we witnessing the beginning of a gradual shift in how institutions view Solana? The market is now presenting us with a shift that deserves close attention. #CPI3.4 #ByXIMPACT
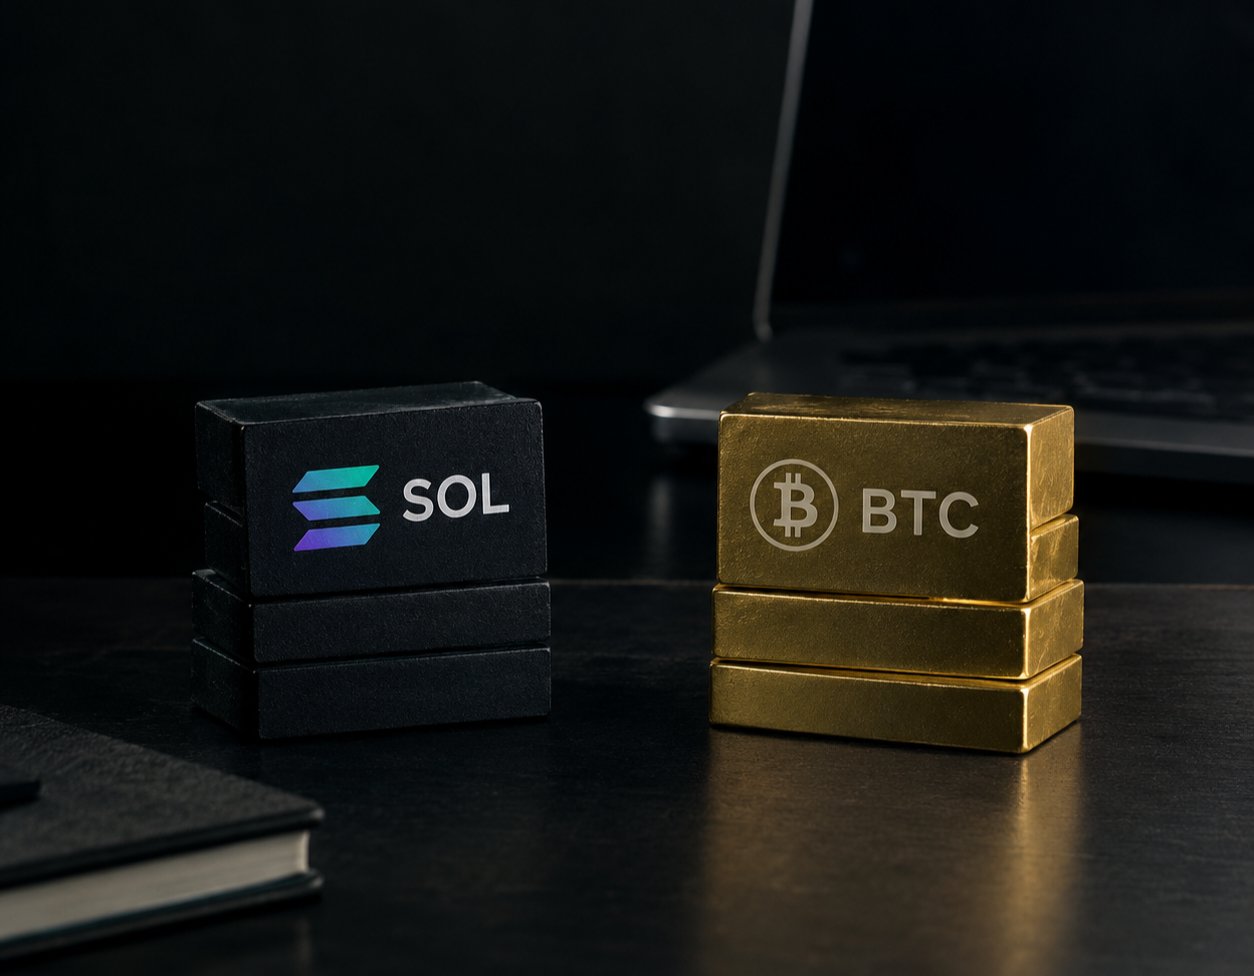
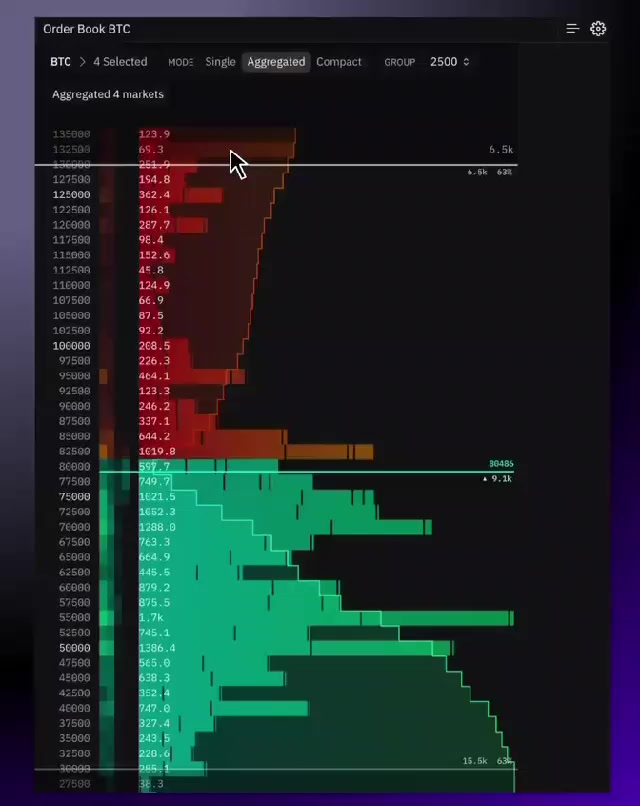
🔥 Bitcoin is challenging the $83K sell wall, and the path to $100K is wide open! Bitcoin is facing a massive sell wall at $83,000, and absorbing it will ignite explosive momentum in favor of the bulls. 🐊 $BTCUSDT Breaking through this level and flipping it into strong support opens the door directly toward new all-time highs. The next target all eyes are fixed on is $100,000, but reaching it demands sustained stability and $ETHUSDT .continuous momentum If Bitcoin successfully absorbs the current selling pressure, it will completely shift market sentiment in favor of a massive bullish rally. #ByXIMPACT
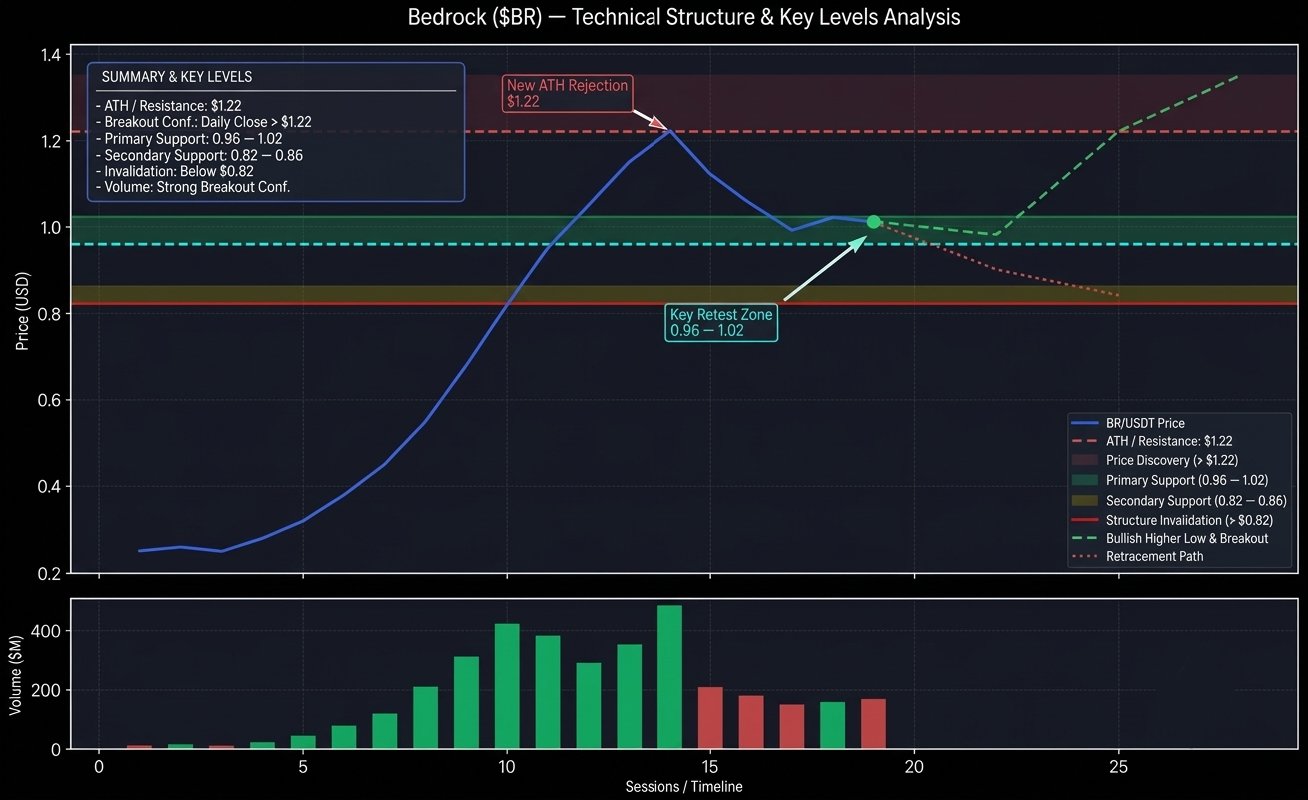
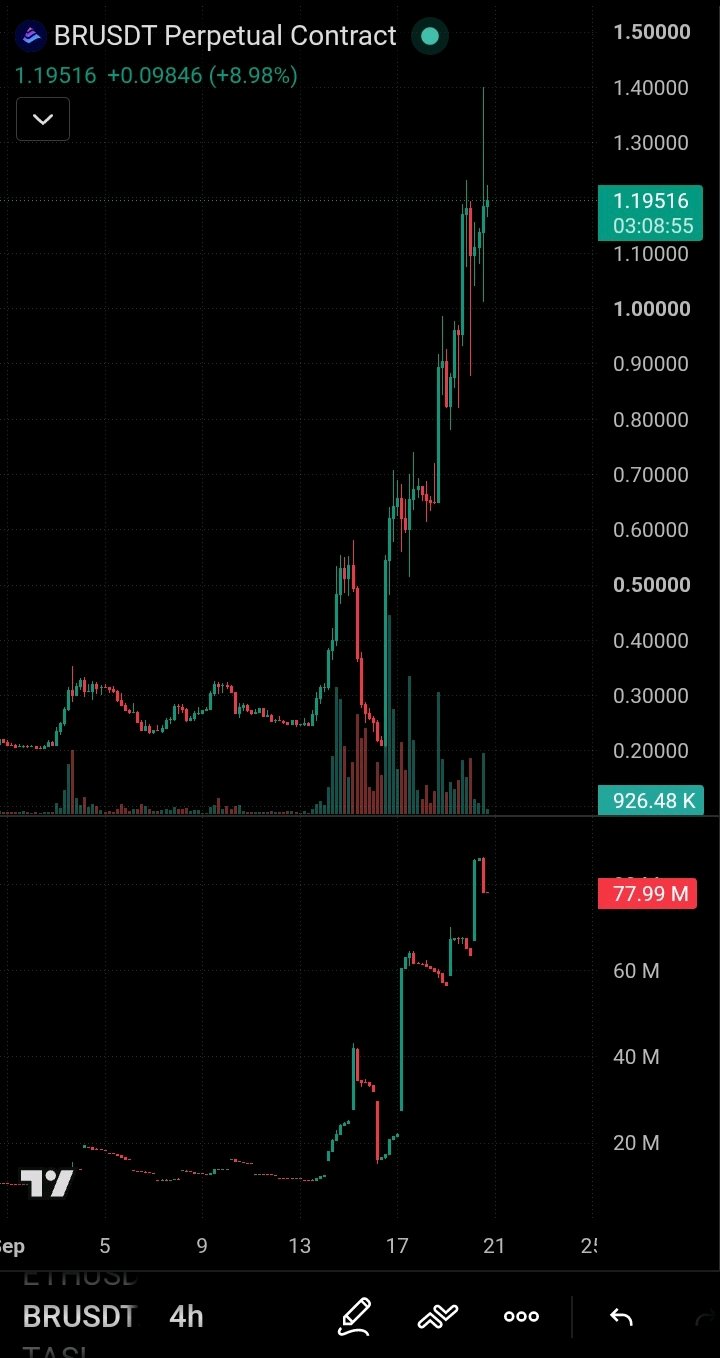
BR | Bedrock — Technical Structure
Bedrock ($BR) has gone through an aggressive expansion phase, with price accelerating from the $0.25 area to a new all-time high near $1.22 within only a few sessions. This move represents a major shift in short-term market structure, but the speed of the rally also makes the current zone highly sensitive to profit-taking. On the daily chart, BR printed several wide-range bullish candles, with price advancing from approximately $0.25 to above $1.00. The latest session pushed toward $1.22 before sellers appeared, creating a clear rejection around the new ATH zone. Volume provides an important confirmation here. Trading activity expanded dramatically during the breakout, with daily volume reaching hundreds of millions of dollars during the strongest expansion sessions. This indicates that the move was supported by substantial market participation rather than a quiet liquidity-driven spike. After such an extended move, the next phase becomes more important than the initial breakout itself. The $0.96–$1.02 region is the first area I would monitor as a potential retest zone. If buyers successfully defend this range and build another higher low, BR could attempt to challenge the $1.22 ATH again. A daily close above $1.22 with sustained volume expansion would confirm a fresh breakout into price discovery. On the opposite side, losing $0.96 could increase the probability of a deeper retracement toward $0.82–$0.86, while a break below $0.82 would weaken the current bullish structure considerably. 📌 Key levels: • ATH / resistance: $1.22 • Breakout confirmation: $1.22+ • Primary support: $0.96–$1.02 • Secondary support: $0.82–$0.86 • Structure invalidation: below $0.82 The key question now is whether BR can convert the recent vertical expansion into a sustainable higher-low structure, rather than simply extending the rally without consolidation. Technical market view only — not a financial recommendation. $BRUSDT #ByXIMPACT
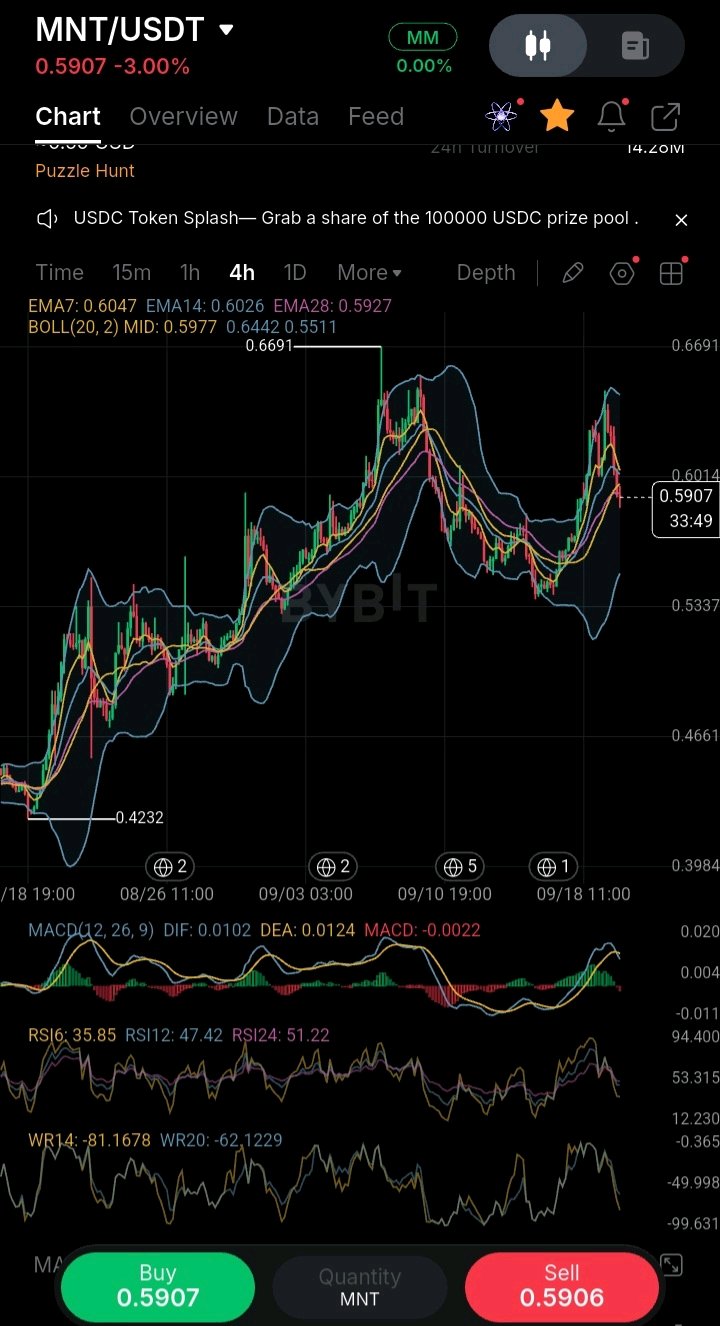
$MNTUSDT : has moved from the 0.54 area toward 0.6461 over the past several sessions before entering a consolidation phase following the sharp advance. On September 18, price surged roughly 9.6%, moving from 0.5704 to 0.6250, accompanied by a clear expansion in trading activity. Since then, momentum has gradually cooled. Price is currently hovering around 0.62, while today’s session has remained relatively tight between 0.6195 and 0.6274. After the previous impulse move, this behavior puts the market at an important decision point: does the recent rally develop into a new base, or do buyers need more time before attempting another breakout? Trading Volume: Activity expanded significantly during the advance. The September 18 session recorded roughly $30.9M in volume, compared with around $16.6M on September 17. The fact that volume increased alongside price gives the previous move more credibility than a low-participation bounce. However, the subsequent decline in activity means that another expansion in liquidity will likely be needed for MNT to push higher. The key detail is that price has not given back the majority of its recent gains despite the cooling momentum. Therefore, declining volume alone does not confirm distribution; it simply means the market needs fresh participation for the next leg higher. Support & Resistance: • Resistance: 0.627–0.646 is the main supply zone where price has recently faced selling pressure. A confirmed close above 0.6461 would put the recent high back into focus and strengthen the short-term structure. • First support: Around 0.594, which has acted as a near-term reaction area. • Major support: 0.57–0.58. This is the zone from which the latest advance originated, while the 200-day moving average is also positioned near 0.572 according to recent data. Key Level to Watch: 0.594 Holding above this area keeps the recent bullish structure intact. A decisive break below it, particularly with expanding sell volume, would increase the probability of a deeper retracement toward 0.57–0.58. Momentum: MNT remains significantly above the lows recorded in mid-September, but price action has become more compressed following the aggressive impulse. I would therefore avoid chasing price in the middle of the range and instead focus on confirmation: either a high-volume breakout through resistance or a retracement into support where buyer reaction can be measured. Trading Plan: • Daily close above 0.646 with expanding volume → potential continuation of the bullish move. • Break below 0.594 with increasing volume → opens the path toward 0.57–0.58. • Price remains between 0.594 and 0.646 → consolidation phase; waiting for a confirmed range breakout is preferable to assuming direction prematurely. Invalidation: A strong close above 0.646 accompanied by rising volume would materially change the short-term structure. Conversely, losing 0.57 would weaken the bullish setup that developed over the past week. Technical view only — not a financial recommendation. #ByXIMPACT
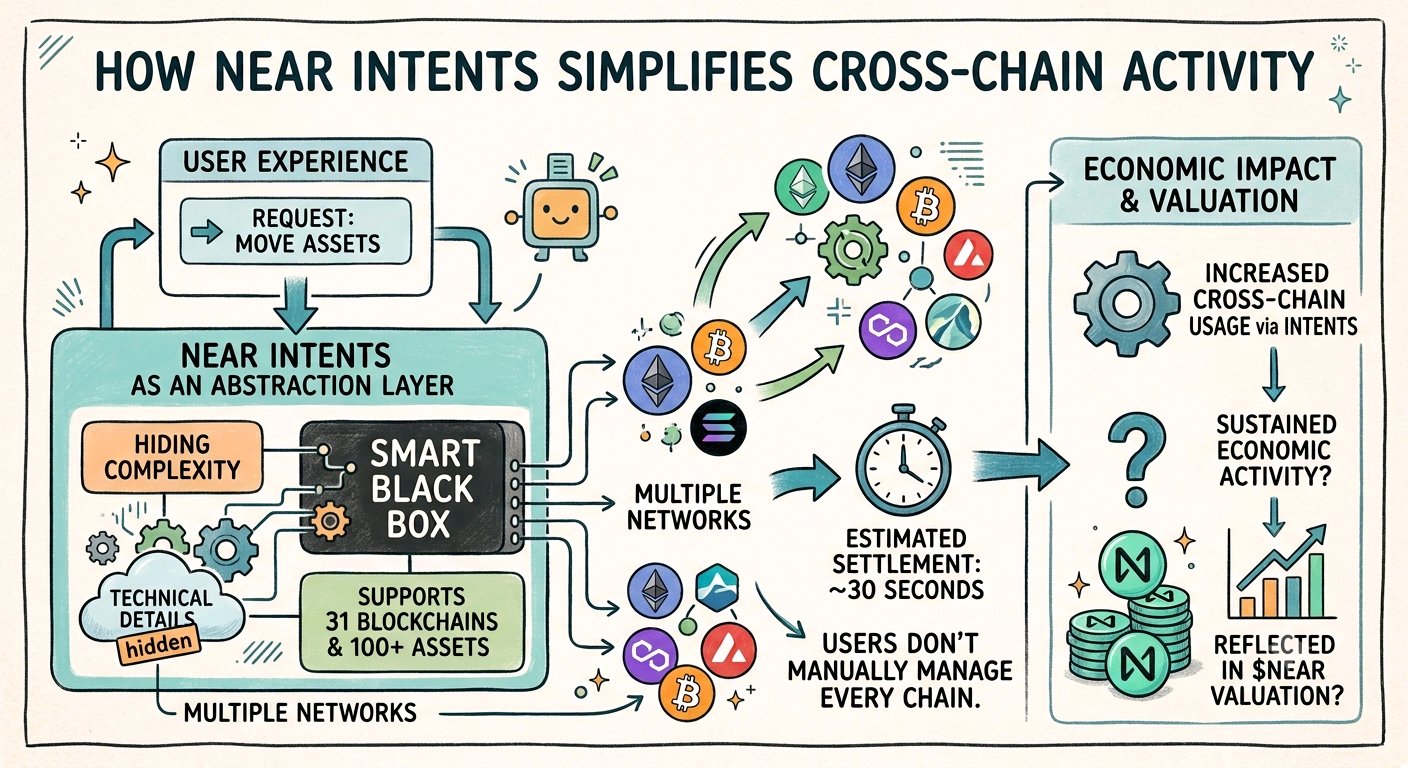
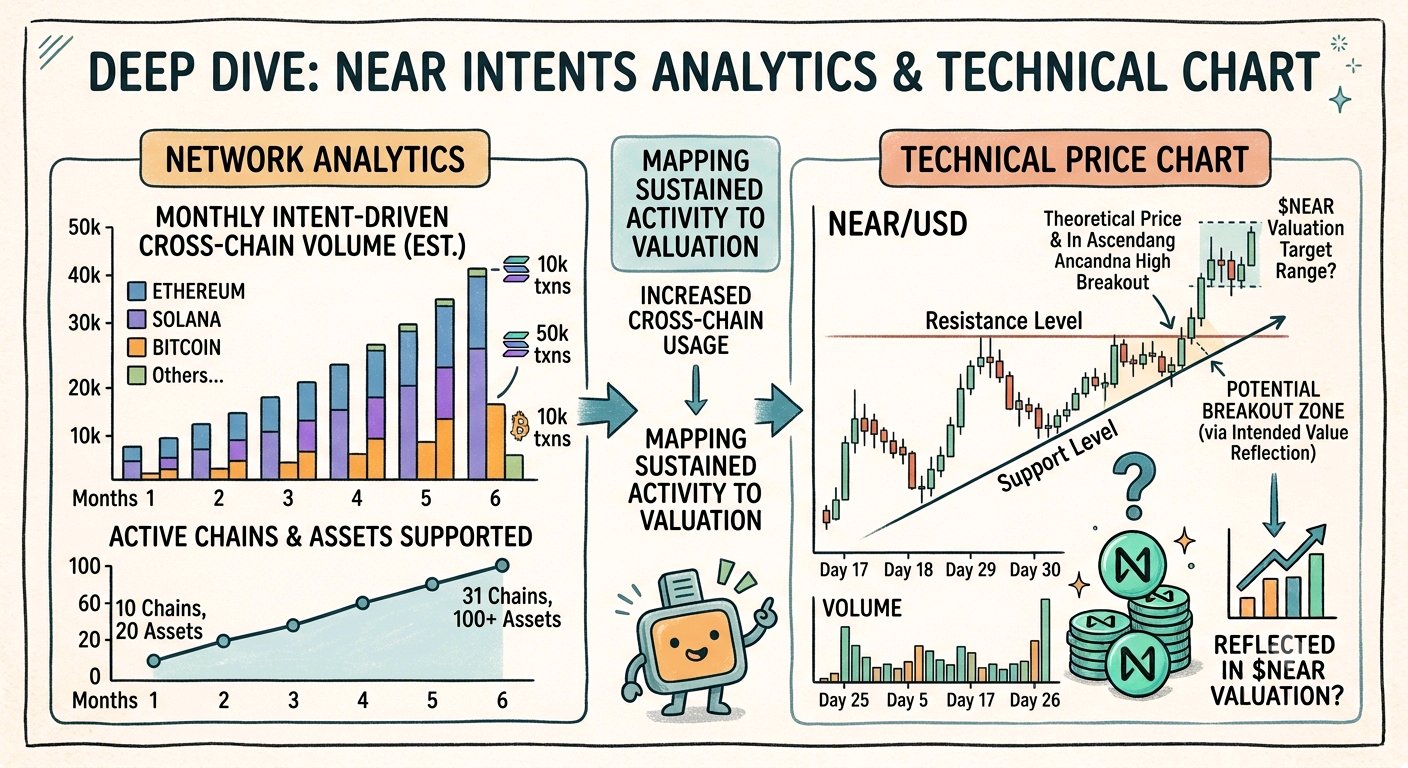
NEAR is making cross-chain activity less complicated for users NEAR Intents supports assets across 31 blockchains and more than 100 assets, with settlement designed to happen in roughly 30 seconds The interesting part is not simply the number of supported networks It is the attempt to hide the complexity of different blockchains from the user That could become increasingly important as more applications operate across multiple networks and users expect assets to move without manually managing every chain But there is a difference between building cross-chain infrastructure and creating direct value for the token For $NEAR, the next question is whether Intents becomes a sustained source of economic activity If usage continues expanding across chains and assets, NEAR's role as an abstraction layer becomes much more measurable The market will then have to determine how much of that activity should eventually be reflected in NEAR's .valuation #CPI3.4 #ByXIMPACT $NEARUSDT $NEARUSDC