ZachXBTC
7225Me gusta84Compartir en el chat168Aficionados72Seguir
BTC • ETH • SOL Specialist.High-probability setups & market structure analysis.Real-time trade ideas. SMC Trader 📈
BTC • ETH • SOL Specialist.High-probability setups & market structure analysis.Real-time trade ideas. SMC Trader 📈
guau $FETUSDT Gracias jefe

$FETUSDT — I'm bullish on FET's recovery potential, but my chart contains two very different opportunities. Treating them as one trade would be a mistake. The first is a possible rebound inside the descending channel. The second is a much larger bullish reversal that hasn't happened yet. Here's why I'm making that distinction. In August, FET reached $0.1194. By September, it had climbed to $0.2597 — a recovery of more than 117%. That rally was impressive, but it never established a lasting break from the broader bearish structure. October brought another move toward $0.2784. Sellers rejected that advance, and by November 14, FET had fallen back to $0.1213. Two major recoveries, yet the market eventually returned to almost the same lower price region. This is what makes my 3-day chart interesting. The descending channel has offered substantial recovery opportunities, but it has also repeatedly punished traders who assumed the first strong rally meant a new bull market. At my latest Bybit spot check, FET was around $0.1310, following the recent reaction from $0.1213. I'm interested in the possibility that this lower region produces another meaningful recovery. However, I'm separating that opportunity from the much larger projection toward $0.60. For now, I want to study whether FET can recover the $0.1597–$0.1667 area and, more importantly, retain a meaningful portion of those gains during the next pullback. That would tell me more about the quality of demand than one impressive green candle. There's another important detail on my chart. The upper resistance line is descending over time. Its breakout level changes as the chart develops. So I won't declare a bullish breakout simply because FET reaches a price where a previous rally was rejected. I need to see price establish itself above the actual descending resistance, rather than briefly trade through it and fall back into the channel. The previous $0.24–$0.28 region would also remain important overhead resistance. My projection toward approximately $0.60 in 2027 represents what a larger trend reversal could eventually achieve. It isn't my immediate target, and the current price structure doesn't justify treating that outcome as confirmed. Risk Management The November 14 low at $0.1213 is my first important downside reference. A sustained breakdown beneath it would weaken the latest recovery attempt. The broader channel support lies approximately around $0.11–$0.12, depending on when price tests the descending line. A decisive 3-day breakdown below that structure would invalidate my current channel-recovery thesis. One mistake I specifically want to avoid is continuously lowering a protective stop just because the diagonal support line keeps descending. That would turn a controlled trading idea into an expanding loss. I haven't established a confirmed new entry or protective stop, so there's no valid fixed risk-to-reward calculation yet. My bullish conviction is based on the possibility of another substantial recovery from this lower region. But I'm keeping two decisions separate. A successful rebound could justify a shorter-term trade. A genuine breakout above the descending channel would justify reconsidering the larger bullish outlook. FET has already demonstrated that those two outcomes are not the same thing. #IMPACTbyTrade
$COREUSDT subirá algún día🚀
$COREUSDT — The highest-volume completed 4H candle on November 17 failed to hold its breakout. That is the detail I'm studying before committing to my bullish recovery scenario. During that candle, approximately 7.93 million CORE changed hands. Price reached $0.01024 but finished at $0.00990. That's an important result. There was enough activity to push CORE above its recent trading range, but the move couldn't maintain those higher prices. Strong participation doesn't automatically mean buyers are winning. The following developing candle has brought CORE back toward $0.01017, giving buyers another opportunity to challenge the rejected high. I like this developing recovery, particularly after the sharp November 14 sell-off that briefly drove price to $0.00916. However, I want to distinguish a market that has stopped falling aggressively from one that has actually started trending higher. My bullish expectation becomes more convincing if CORE can produce a strong 4H close above $0.01024 and maintain that progress during the next pullback. That would begin changing the character of the recent price action. A successful recovery could then challenge $0.0108–$0.0110, followed by the previous resistance around $0.0115. My larger projection on the chart extends toward $0.0133. From approximately $0.01017, that represents about 31% potential upside. But the white projection is my recovery scenario, not a confirmed price path. Risk Management The $0.00959 area is my immediate warning level because it marks the recent lower boundary of consolidation. Sustained weakness below it would suggest that the attempted recovery is losing support. The November 14 low at $0.00916 is my deeper structural invalidation. A decisive breakdown beneath it would invalidate this bullish setup. I haven't confirmed a new entry or protective stop, so I won't present an artificial risk-to-reward ratio. Any position must account for CORE's volatility, execution costs and the distance to its actual exit. I'm bullish on CORE's potential to recover, but I won't confuse a high-volume breakout attempt with a successful breakout. The next test is straightforward: can buyers finally keep the price above a level where they previously failed? #IMPACTbyTrade
$ETHUSDT 1D: Los fondos están vendiendo ETH mientras los monederos lo compran, y esa tensión es toda la historia ahora mismo. Por el lado de la venta, los ETF de ETH al contado en EE. UU. registraron unas salidas netas de unos 399 M$ en la semana del 9 al 13 de noviembre, ETH cayó aproximadamente un 14% en siete días, perdió los 2000 y el MACD diario sigue en negativo. Por el lado de la compra, se informó que monederos vinculados a Erik Voorhees y Bitmine añadieron ETH en la caída, y el precio rebotó desde el mínimo del fin de semana cerca de 1712 hasta volver a unos 1830. Ese rebote también volvió a situar a ETH en una línea de tendencia de soporte alcista de cuatro años que los traders están vigilando. Me inclino por el optimismo, pero solo porque el riesgo a la baja ya está definido. Si los 1712 se mantienen, el riesgo es pequeño en comparación con el movimiento de vuelta a los 2000. Zona de entrada: de 1780 a 1830, tras una vela diaria o de 4H que mantenga la zona Invalidación: cierre diario por debajo de 1700 Objetivo 1: 2000, el nivel perdido la semana pasada Objetivo 2: 2100, un nivel redondo por encima de este Desde 1810, eso supone unos 110 de riesgo por 190 a 290 de recompensa. La idea es errónea si ETH cierra por debajo de 1700, ya que eso rompería tanto el mínimo del fin de semana como la línea de tendencia. Un movimiento directo a través de 1866, el máximo de 24h, sin un retroceso también significa que me salto la entrada y espero a una nueva prueba. La compra de ballenas es un titular, no una garantía, y la compra de un monedero puede ser minúscula en comparación con una semana de ventas de ETF. Riesgo: esto es un escenario, no una predicción. Los flujos de los ETF aún no han cambiado, el impulso sigue siendo negativo y un BTC más débil puede empujar a ETH a través del soporte independientemente del gráfico. Mantén el apalancamiento bajo y el tamaño lo suficientemente pequeño para que un stop-out no duela. Los niveles están redondeados a partir de varias fuentes de datos y difieren ligeramente según el mercado. Si ETH mantiene los 1780 pero los flujos de los ETF se mantienen negativos esta semana, ¿seguirías comprando o esperarías al primer día de flujo positivo? $BTCUSDT $ETHUSDT #ShareANTTradeToWin20U

$ETHUSDT — The second red circle on my chart hasn't happened yet. I drew it because I see the possibility of a major Ethereum recovery, not because the bottom is already confirmed. Look at the earlier structure on the left side of my video. ETH formed two important lows near $1,550, recovered through the marked inverse fair value gap (iFVG), and eventually rallied toward $2,800. That was a completed market move. The pattern I'm projecting now is different. Ethereum has experienced another aggressive decline, but the second leg of my proposed double bottom still needs to develop. Here's what the actual price action tells me. On November 14, ETH dropped to $1,728.93. The following day, sellers pushed it slightly lower to $1,710.47, but buyers recovered enough to produce a daily close at $1,835.37. That reaction was encouraging. However, November 16 reached $1,866.80 before closing back at $1,820.65. At my latest Bybit check, ETH was still trading around $1,816. So buyers have rejected the deepest prices, but they haven't established a convincing upward structure. I'm heavily bullish on the possibility of another major recovery from this region. Still, I believe the quality of the next reaction matters more than the resemblance to the earlier double bottom. If ETH revisits the $1,710 area, I'll study whether sellers can sustain the breakdown or whether buyers recover the level quickly. A successful defense followed by a move above $1,866.80 would improve the short-term picture. Recovering the previous $1,936 region would provide stronger evidence that the market is beginning to repair its bearish structure. But there's another important obstacle on my chart. The green iFVG around $2,030–$2,120 is not confirmed support at the current price. It is an overhead region where sellers could interrupt the recovery. For my larger bullish projection to become credible, I want Ethereum to move through that area and establish sustained price acceptance above it. Only then would I begin evaluating a recovery toward $2,400 and eventually the $2,800 region. Risk Management The recent $1,710.47 low is my immediate structural reference. A temporary move below it could still be consistent with a liquidity sweep, but sustained trading below $1,700 without a convincing recovery would seriously weaken this bullish thesis. I haven't confirmed a new entry or protective stop. Any long position requires an actual execution plan, controlled position size and a risk-to-reward calculation based on achievable resistance levels rather than the distant $2,800 objective. The blue path in my video is a proposed recovery scenario extending into 2027, not a prediction of completed future candles. I believe Ethereum has substantial recovery potential from these prices. But the next opportunity I'm studying is not simply a second touch of the lows. It's whether that reaction can develop enough buying strength to carry ETH through the overhead imbalance that currently stands between this potential bottom and my larger bullish objective. #IMPACTbyTrade #ShareANTTradeToWin20U
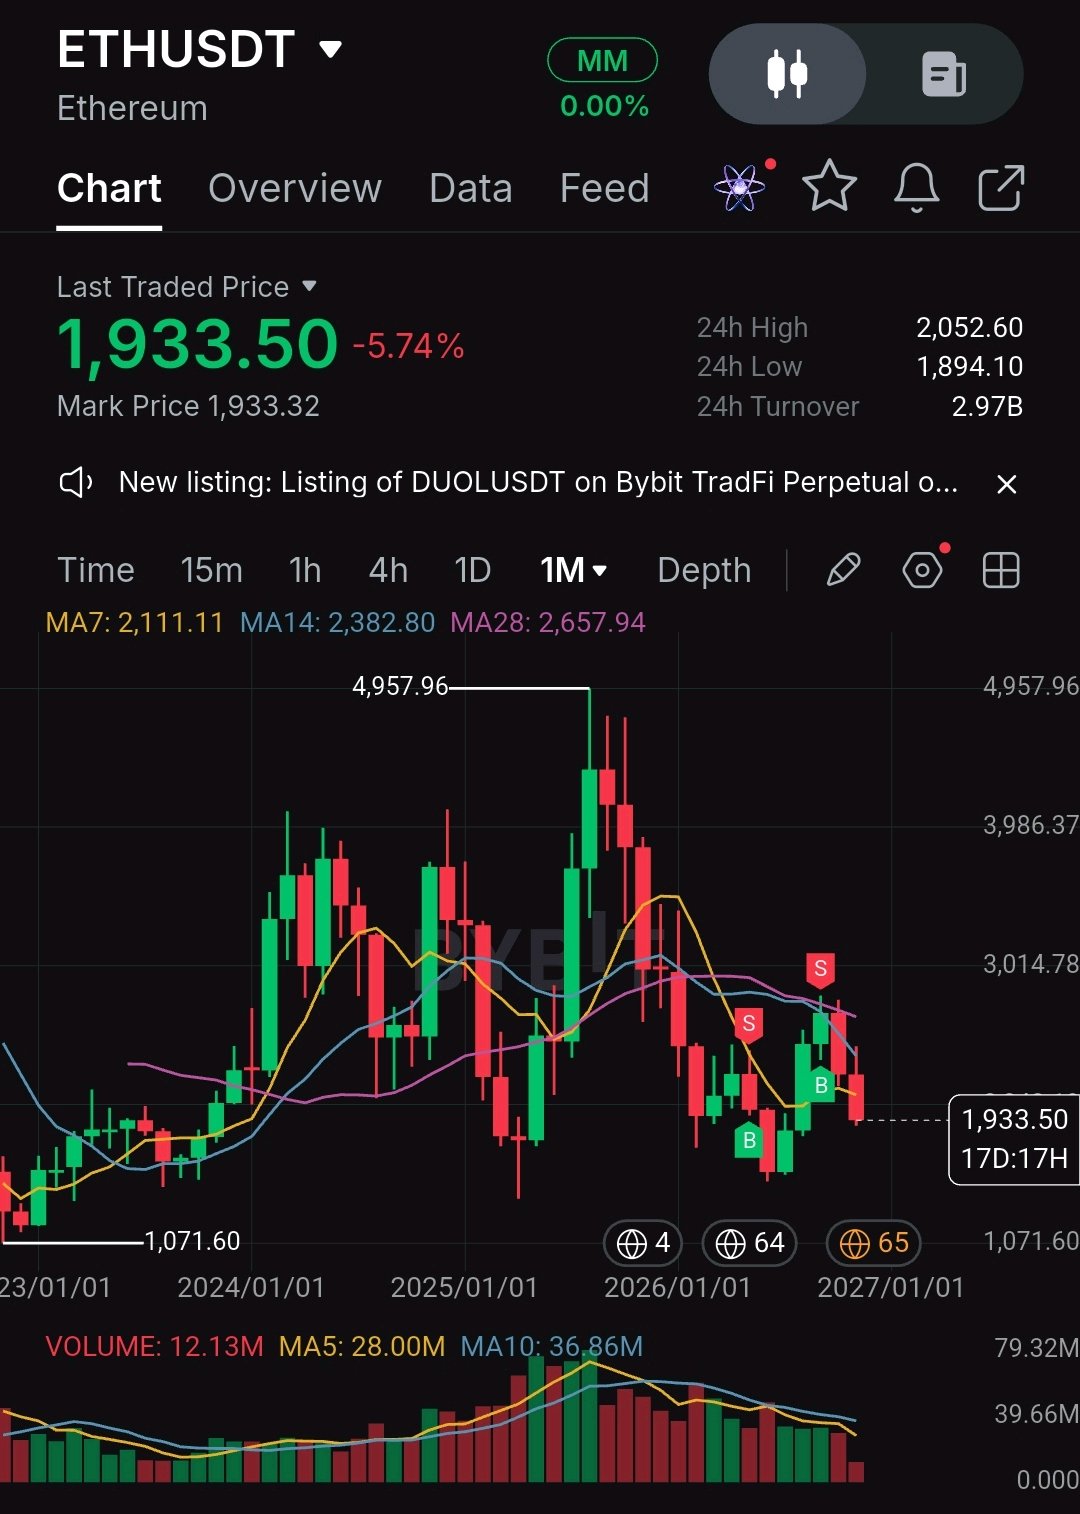
$ETHUSDT 1M: El nivel de 5.000 es donde apunta mi tesis alcista a largo plazo para ETH, pero es un objetivo para "más adelante", no para "pronto". Aquí está la imagen mensual. ETH está en 1.933,50 tras caer un 5,74% en un día, y la vela de este mes es roja. El precio se sitúa por debajo de las tres medias móviles mensuales: la de 7 en 2.111, la de 14 en 2.383 y la de 28 en 2.658. El máximo histórico en este gráfico es 4.957,96, así que 5.000 está aproximadamente un 159% por encima del precio de hoy. Un movimiento tan grande lleva meses o más, y necesita primero un cambio de tendencia. Por qué sigo siendo constructivo: ETH ya ha corregido alrededor de un 61% desde ese máximo, y el volumen mensual ha ido disminuyendo (12M frente a una media de 10 periodos de unos 37M), lo que a menudo muestra que la presión vendedora se desvanece. Las primeras señales de compra en el gráfico vinieron de la zona cercana a 1.500, según mi lectura de las velas mensuales, así que tomad esa cifra como aproximada. Cómo lo planificaría: - Zona de interés: de 1.900 hacia 1.500, entrando en pequeñas partes, no con una sola entrada grande - Confirmación: un cierre mensual de nuevo por encima de 2.111 (la MM de 7 meses) - Escalones: 2.383, 2.658, luego el área de 3.000 - Objetivo a largo plazo: 4.958 a 5.000, solo si se recuperan primero los niveles anteriores - Invalidación: un cierre mensual por debajo de aproximadamente 1.500 Dónde falla esto: ETH sigue en una clara tendencia bajista en este marco temporal, y un cierre mensual por debajo de 1.500 significaría que la base ha fallado. Un movimiento también puede mantenerse débil durante muchos meses antes de darse la vuelta. Esto es un escenario, no una predicción, y un shock macroeconómico o grandes salidas de capital de los ETF pueden empujarlo más abajo independientemente del gráfico. Ajustad el tamaño de posición y mantened el apalancamiento bajo. Si ETH recupera los 2.111 en un cierre mensual, ¿añadiríais más o esperaríais a que se supere primero los 2.383? $ETHUSDT #SanDisk anuncia un desdoblamiento de acciones de 8 por 1 #Bitcoin alcanza su mínimo de dos meses tras las elecciones de mitad de mandato en Estados Unidos
$BTCUSDT $ETHUSDT — Same sell-off. Two completely different short-term decisions. The measured move on my charts is severe: BTC has dropped about 14.9% from the marked reference point, while ETH has fallen roughly 21.2%. These are multi-candle moves on the chart, not single-day losses. I have seen plenty of aggressive sell-offs during my trading career, but seeing both majors lose this much ground without a meaningful recovery is still unusual. It does not make me afraid. It makes me separate investment decisions from short-term trading bias. BTC is the weaker short-term setup for me. The $74,990 level has already failed, and price is now trading around $68,798 inside the broader demand area marked on my chart. I am accumulating BTC for the long term, but I am not assuming this zone must immediately produce a bottom. Until the damaged structure starts repairing itself, I still see room for BTC to trade lower in the short term. ETH is different. Around $1,932, ETH has already travelled almost the full 21.2% measured decline and reached the lower edge of the daily order-block area I had marked in advance. That changes my short-term risk assessment. I do not expect ETH to follow BTC with another equally aggressive leg down from here. My short-term bias on ETH is bullish because price has finally reached the area where I wanted to evaluate demand. But an order block is not protection from further downside. If ETH begins accepting price below this zone instead of reacting from it, my immediate bullish view is wrong and needs to be reassessed. So my positioning has two different time horizons: I am accumulating both BTC and ETH for the long term. Short term, however, I remain bearish on BTC and bullish on ETH near this daily demand area. The important distinction is simple: long-term conviction does not require me to pretend both charts look equally strong today. #USInflationRunsHotAndRateHikeBetsRise #BitcoinHitsTwoMonthLowAfterUSMidterms
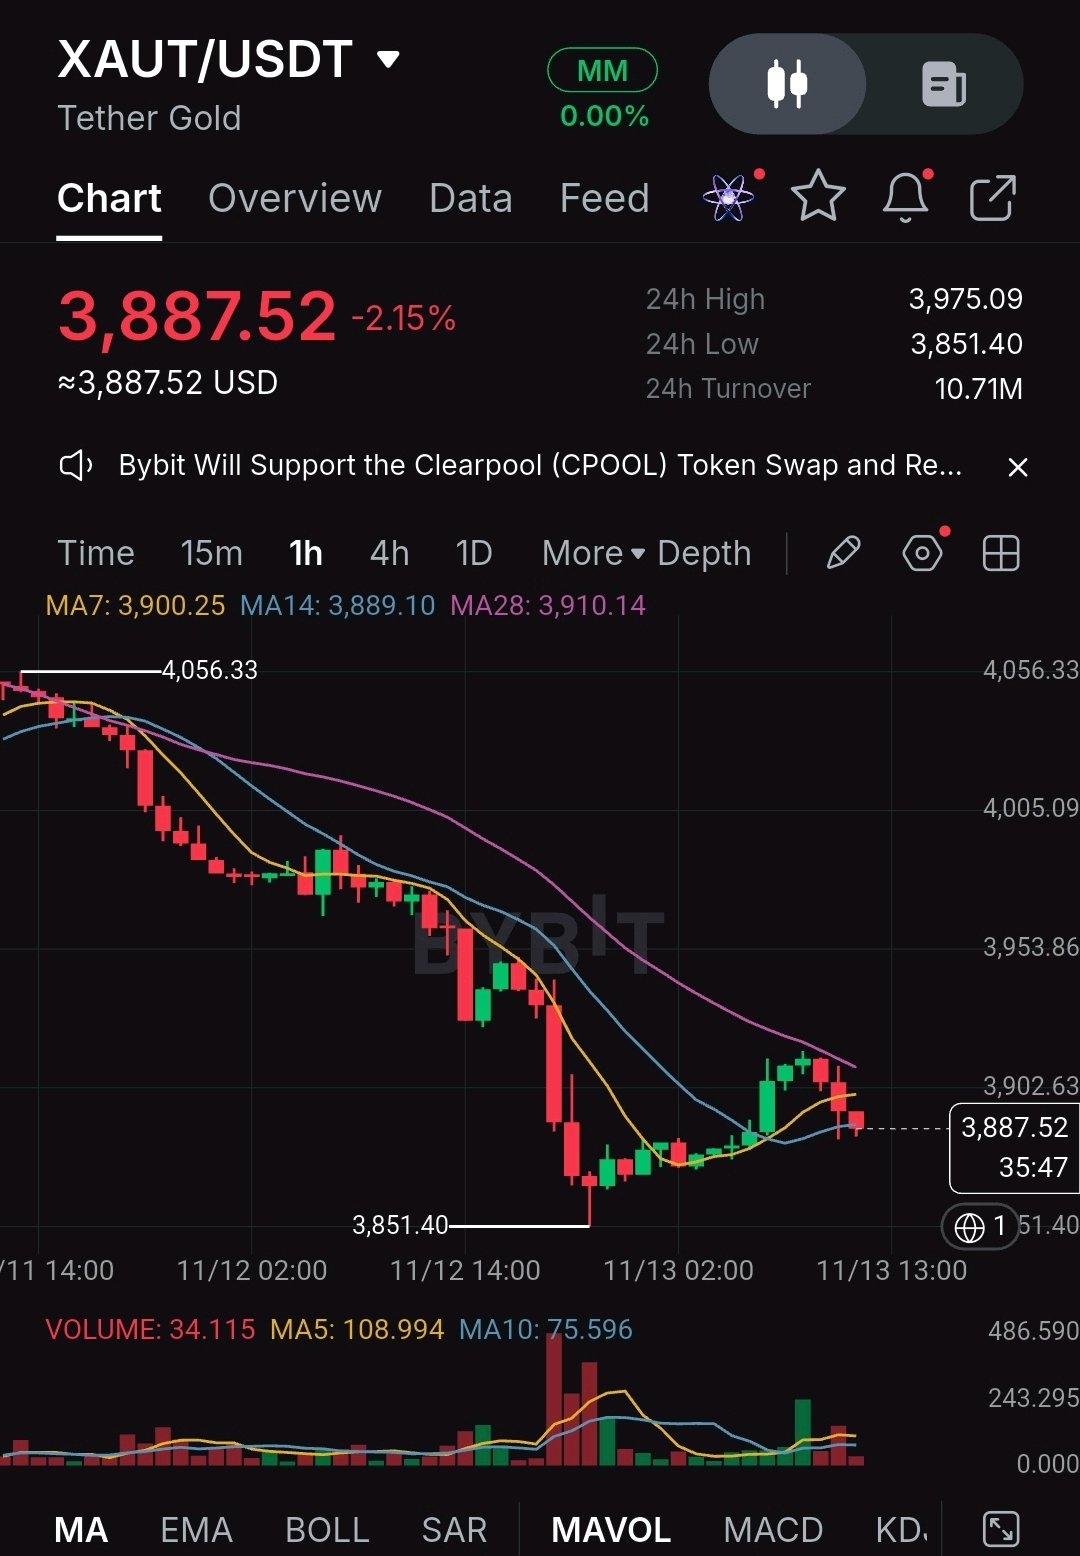
$XAUTUSDT 1H: Esta es una lectura bajista a corto plazo. El token de oro está en 3.887,52, bajando un 2,15% en el día, y el gráfico de 1 hora muestra que los vendedores siguen al mando. El gran movimiento fue la larga caída roja hasta el mínimo de 3.851,40, y vino acompañada del mayor volumen en el gráfico. El rebote posterior fue menor, con un volumen mucho más ligero, y se estancó entre 3.925 y 3.930, justo debajo de la MA28 (3.910) mientras esta se inclinaba hacia abajo. El precio está ahora de vuelta por debajo de la MA7 y apoyado en la MA14 en 3.889. Las tres medias móviles apuntan hacia abajo, y cada repunte desde el máximo de 4.056 ha fracasado por debajo de ellas. No voy a ponerme corto en el mínimo. Prefiero esperar a otro repunte hacia la resistencia y vender si falla. Zona de entrada: 3.900 a 3.925, tras una vela de rechazo de 1H Stop: Cierre de 1H por encima de 3.955 Objetivo 1: 3.851,40, el mínimo de 24h Objetivo 2: 3.800, un nivel redondo justo por debajo Desde 3.912, eso supone un riesgo de unos 44 puntos para una recompensa de entre 61 y 112. Un cierre de 1H por debajo de 3.851 sin rebote es la continuación más clara, pero no hay nivel gráfico por debajo, así que no entraría a perseguirlo. La idea queda anulada si XAUT recupera 3.955 al cierre, porque eso desharía la estructura de máximos decrecientes. Riesgo: esto es un escenario, no una predicción. XAUT sigue al oro spot, por lo que los titulares macro pueden invertir una tendencia horaria en minutos, y un rebote después de una caída del 7% desde los máximos es un resultado normal. El volumen aquí es escaso y los niveles provienen de un gráfico de 1H, así que trátalos como zonas, mantén el tamaño de posición pequeño y el apalancamiento bajo. Si XAUT rebota hacia 3.910 y se estanca de nuevo, ¿venderías en ese rechazo o esperarías primero a una ruptura de 3.851? $XAUTUSDT #LaInflaciónDeEEUUSeDisparaYAumentanLasApuestasSobreSubidasDeTipos
Gold is not at my preferred investment price yet. I expect another decline before the long-term buying opportunity I'm preparing for. My daily chart shows why. Gold remains under descending resistance, and the support area around $3,850–$3,880 is under pressure. The recent decline has also been reinforced by a stronger US dollar and rising interest-rate expectations. If sellers maintain control, my next important area is $3,727–$3,732. This is where my long-term investment plan becomes interesting. I don't intend to buy simply because gold reaches that price. I want to see sellers lose control, a convincing reaction from the zone, and signs that the daily structure is beginning to recover. Only then will I consider accumulating gradually. My investment objective is much bigger than a short-term bounce. The $4,600 swing high is an important recovery milestone, followed by the projected $4,897 area shown in my video. Beyond those levels, my ultimate long-term objective is a return toward gold's historical all-time-high region near $5,595. That is a long-term scenario, not a prediction of an immediate rally. Risk Management The $3,679 area is the lower structural reference on my chart. Sustained weakness below it would challenge the proposed accumulation setup and require a fresh assessment. I will prioritize controlled capital allocation, avoid leverage, and define my actual exit conditions before investing. Without a confirmed entry and protective stop, there is no fixed risk-to-reward ratio to claim. The green candles in my video represent my projected recovery, not confirmed future price action. For now, my plan begins with patience and a lower entry—not an immediate purchase. #IMPACTbyTrade $XAUTUSDT
¡Qué configuración!😎😎 $HYPEUSDT
$LITUSDT — While the Market Panicked, LIT Was Preparing for a Breakout📈 The 4H chart explains my entry. When the broader crypto market was crashing, LIT kept testing the inducement area around $3.00 without giving sellers a decisive breakdown. That was an important sign of relative strength. I took my position around $3.17. Since then, LIT has reclaimed its internal market structure near $3.30 and recovered toward $3.43–$3.45. That's roughly an 8% price move from our entry, before leverage and trading costs. The daily chart explains why I'm still holding. Price is now above its 7-day and 21-day EMAs, while the MACD histogram has turned positive. The recovery is gaining technical support across both timeframes. But there's still resistance around $3.50–$3.56. Clearing that area would strengthen my expectation of a move toward $3.92–$3.98. My chart's original measurement shows approximately 26.76% potential upside across the full setup. That remains the bigger opportunity I'm positioned for, not a profit already secured. Risk Management With the entry already taken, I'm paying attention to how LIT behaves around the reclaimed $3.30 structure. Losing that level would weaken short-term momentum. A sustained 4H breakdown below $3.00 would challenge the relative-strength setup that led me into this trade. The deeper downside reference on my chart is $2.5758. I'm not claiming a fixed risk-to-reward ratio without confirming the actual protective stop. Finding an entry like this during a market crash is genuinely satisfying. The target hasn't been reached yet, but seeing the original reasoning play out across both timeframes is exactly why I put so much effort into finding these opportunities. #IMPACTbyTrade
$NEARUSDT Perfect Analysis
$NEARUSDT — A 49% recovery opportunity is on my chart, but there's one important reason I'm not calling the bottom yet. NEAR has lost roughly 32% over the past month, and the 4H chart is still showing a sequence of lower highs. That's the bearish reality. But something interesting is happening around $3.60. Price has returned to my marked $3.35–$3.65 demand zone, an area that previously supported a strong expansion toward $6.02. The question now isn't whether this support looks attractive. It's whether buyers can create a different market structure this time. What I'm Watching The first sign of strength would be a reclaim of $3.75–$3.80, followed by a higher low on the 4H chart. If NEAR can establish support above $4.00, I'll be watching the $4.40–$4.75 resistance area next. A successful recovery through those levels would bring my main target at $5.462 into focus. Until then, this remains an early bullish reversal idea inside a bearish trend. Management My marked long setup: Entry reference: $3.655 Stop-loss: $3.204 Target: $5.462 Potential upside: 49.44% Potential downside: 12.34% Risk-to-reward: 4.01:1 This is a planned setup, not a confirmed entry. The marked entry is an aggressive support-based approach; waiting for breakout confirmation would require a new risk-to-reward calculation. A sustained breakdown below the demand zone would weaken my thesis. Reaching $3.204 would invalidate this specific trade plan. The stop is relatively wide, so position sizing matters. I'm bullish on NEAR's recovery potential, but the buyers still have work to do. Would you consider an early entry around this demand zone, or wait for the 4H structure to turn bullish? #IMPACTbyTrade
$HYPEUSDT — I’m bullish on a second recovery attempt Yesterday, buyers took HYPE from around $72.50 to $76.77. The pullback since then has returned price toward $73.50, and I’m watching whether that earlier low survives. Holding above it would give buyers room to build a higher low and challenge resistance again. Trading activity has also picked up. HYPE’s 24-hour volume is up approximately 28%, reaching around $1.32 billion. I want to see that participation translate into stronger closes and buyers defending the recovery. The first area to recover is $75.30–$75.40. A strong 4H close above it, followed by a successful retest, would put $76.77 back in focus. Above that recent high, my next recovery zone is $77.50–$78.20. What makes this setup interesting is the chance to see buyers defend the same area that started yesterday’s rebound. A higher low followed by a reclaimed resistance would strengthen my bullish view. Risk Management A 4H close below $72.46 followed by a failed reclaim would invalidate this bounce setup. For a fresh long, I’d place the protective stop below the confirmed retest low and calculate position size from the entry-to-stop distance. Entry quality matters because $76.77 is the first obstacle after confirmation. I’d calculate the actual R:R against that target before committing; chasing the breakout could leave too little reward for the risk. My focus is a recovery toward $76.77–$78.20, supported by buyers holding the ground they regain.

$HYPEUSDT — There is one weakness in my own chart projection that I want traders to notice. The path I drew shows a recovery toward $85 before a potential decline toward $65.71. But the market has an obstacle to clear long before reaching that upper target. HYPE was trading near $73.7 when I recorded this chart, just beneath the $74–$78.31 area that previously attracted buyers. That changes how I interpret the projected bounce. A brief move back into this area would not be enough. I want to see whether buyers can reclaim $78.31 on the 4H chart and maintain that level. If they fail, the recovery could lose momentum before price ever reaches the red $82–$87.5 supply zone. Upbit and Bithumb have opened new trading access for HYPE in South Korea. That adds an important market catalyst, but it does not remove the resistance already visible on the chart. If $78.31 continues to reject price and the recent $72.84 low breaks, I will watch $70 first. The deeper $65.71 level remains a projected downside scenario, not a guaranteed destination. A successful reclaim of $78.31 would change the immediate outlook and bring the higher supply zone back into focus. Management I will not enter a short simply because my projected arrow eventually points downward. First, I need an actual rejection, a clear entry and a stop beyond the resulting swing high. Only then can I judge whether the available downside offers a worthwhile risk-to-reward ratio. Sustained strength above $87.5 would invalidate this bearish continuation plan. The drawing shows a possible route. Price must confirm whether that route is open. Next Update On $BTCUSDT Big Volume Coming..... #IMPACTbyTrade
perfect entry on $AVAXUSDT
$SPCXXUSDT — I'm already positioned, and my target is $182. The recent drop toward $120 looked brutal. But the reaction from that area is exactly why I'm maintaining my bullish conviction. On the daily chart, SPCX pushed into my marked demand and inducement zone, swept the lows, and recovered above the important $130.36 level. That rejection matters to me. Sellers managed to drive price into the lower part of the range, but they couldn't keep it there. Why I'm Heavily Bullish After falling from the $175 region, SPCX has finally shown a meaningful reaction from demand. Price is now trading around $137.60, and I'm watching whether buyers can turn this recovery into a stronger market structure shift. My upside roadmap has three important levels: $152.42 — First major resistance. $163.82 — The next important recovery level. $182.45 — My main bullish target. From the current chart price, that final objective represents approximately 32.6% potential upside. I'm not expecting a straight line upward. There will likely be pullbacks and resistance tests along the way. But if buyers continue defending this recovery, I believe the larger upside scenario remains attractive. Concern The $130.36 level is my first structural checkpoint. Losing it again would weaken the immediate recovery and increase the risk of another test of the demand zone. A sustained breakdown below the broader demand area near $117 would seriously challenge my bullish thesis. I'm already positioned, but conviction doesn't mean ignoring risk. I will continue monitoring the daily structure and manage exposure if the market stops supporting my analysis. My outlook remains strongly bullish. I'm watching for SPCX to reclaim $152.42 first, build momentum above $163.82, and eventually challenge $182.45. The recovery has started. Now buyers need to prove they can sustain it #IMPACTbyTrade
¡Guau, explicación sencilla! $BTCUSDT $XRPUSDT
$ARBUSDT — Buyers are showing strength, and the 4H chart is starting to confirm it🚀🚀 Arbitrum is gaining momentum while much of the broader crypto market remains under pressure. At my latest check, price was trading around $0.17631, up 3.74% over 24 hours, with $32.47M in turnover on Bybit. But the percentage gain isn't the main reason I'm bullish. What the Chart Reveals After recovering from the $0.1497 low, Arbitrum has gradually formed higher lows. The IDM zone around $0.163 remains an important area beneath the current structure. Now the indicators are supporting that recovery: EMA7: $0.17106 EMA21: $0.16798 RSI(14): 64.99 MACD histogram: +0.00049 Price is trading above both EMAs, with the faster average above the slower one. MACD momentum is positive, while RSI shows strengthening buying pressure without yet reaching the traditional overbought threshold of 70. These signals support the bullish case, although they don't guarantee a breakout. My Bullish Outlook The immediate challenge is the 24-hour high at $0.17832. A strong 4H close above this resistance, followed by a successful retest, would strengthen the case for continued upside. I'm watching $0.185–$0.190 as an intermediate resistance area, with $0.2043 remaining my larger recovery objective. That final target represents approximately 16% potential upside from the price shown in my latest chart. Concern The $0.163 IDM area is important for the short-term structure. A liquidity sweep followed by a quick recovery could still support the bullish scenario. However, sustained trading below this zone would weaken the immediate setup. Losing the $0.1497 structural low would invalidate the broader recovery thesis. With RSI approaching 65, I also recognize the possibility of a temporary pullback before another attempt higher. My outlook remains bullish, but the next confirmation matters: can Arbitrum turn its recent strength into a sustained breakout above $0.17832? #IMPACTbyTrade
yo también soy alcista con $BTCUSDT
Bitcoin broke below $75,000. I'm still looking for a $7,000 recovery move — and here's why. After spending days trapped in a tight range, $BTCUSDT finally made an aggressive move below the level everyone was watching. The recent liquidation snapshot showed approximately $748 million wiped out in one hour, mostly from long positions. To me, this looks like a major leverage flush. It may have cleared out crowded positions, but that alone doesn't prove the move was manipulation or that the bottom is confirmed. What interests me now is the reaction after that sell-off. BTC is trying to stabilize around $75,000 as a new trading week begins. I'm heavily bullish on the possibility of a relief bounce from this area. A sustained reclaim of $75,000, followed by stronger buying above $76,000, would give me much more confidence. The $79,120 area is an important test before my higher target. My marked long setup: Entry reference: $74,925.87 Stop-Loss: $72,704.37 Target: $81,949.49 Potential upside: 9.37% Defined risk: 2.97% Risk-to-reward: 3.16:1 Risk Management This is a short-term bullish recovery setup, not a claim that the broader bearish pressure has disappeared. If BTC loses the recent low and moves toward my stop, the trade thesis is failing. I won't increase risk simply because I feel confident. Position size must respect the defined stop. I'm not a financial advisor. My conviction is bullish, but price still has to confirm it. A breakdown can trigger more selling, or it can become the starting point of a strong recovery. For this setup, how BTC behaves around $75,000 will make the difference. #WSOT2026
Se avecina un gran movimiento de XRP $BTCUSDT $XRPUSDT #WSOT2026
$XRPUSDT at $1.15 — a 3.38:1 long setup is taking shape, but one condition matters. XRP has dropped into the lower part of my daily demand zone. After losing the previous $1.20 support, this is a fresh opportunity to evaluate—not a reason to blindly defend the old bullish plan. The green zone is where I want to see buyers step in. If it holds and XRP starts reclaiming $1.2469 with stronger buying volume, my first recovery target is $1.3986. That would be a meaningful move from current levels. My second target sits at $1.5492. If traditional markets reopening brings stronger participation and XRP builds bullish momentum, this higher target becomes possible. But I won't assume both targets will be reached immediately. Price needs to prove the recovery first. My marked long setup: Entry reference: $1.1572 TP1: $1.3986 — approximately 20.86% upside TP2: $1.5492 — approximately 33.87% upside Stop-Loss: $1.0413 Defined Risk: approximately 10.02% R:R to TP1: 2.08:1 R:R to TP2: 3.38:1 Management The $1.0843 level is an important structural warning. Losing it would weaken my bullish outlook before the planned stop at $1.0413 is reached. This is an early support-zone entry, so position size matters. Waiting for confirmation above $1.2469 offers more evidence of strength, but entering higher would change the risk-to-reward calculation. I'm not a financial advisor. I'm bullish on the potential recovery, but the real opportunity depends on whether buyers can turn this demand zone into a convincing defense. #IMPACTbyTrade
confío en $PEPEUSDT
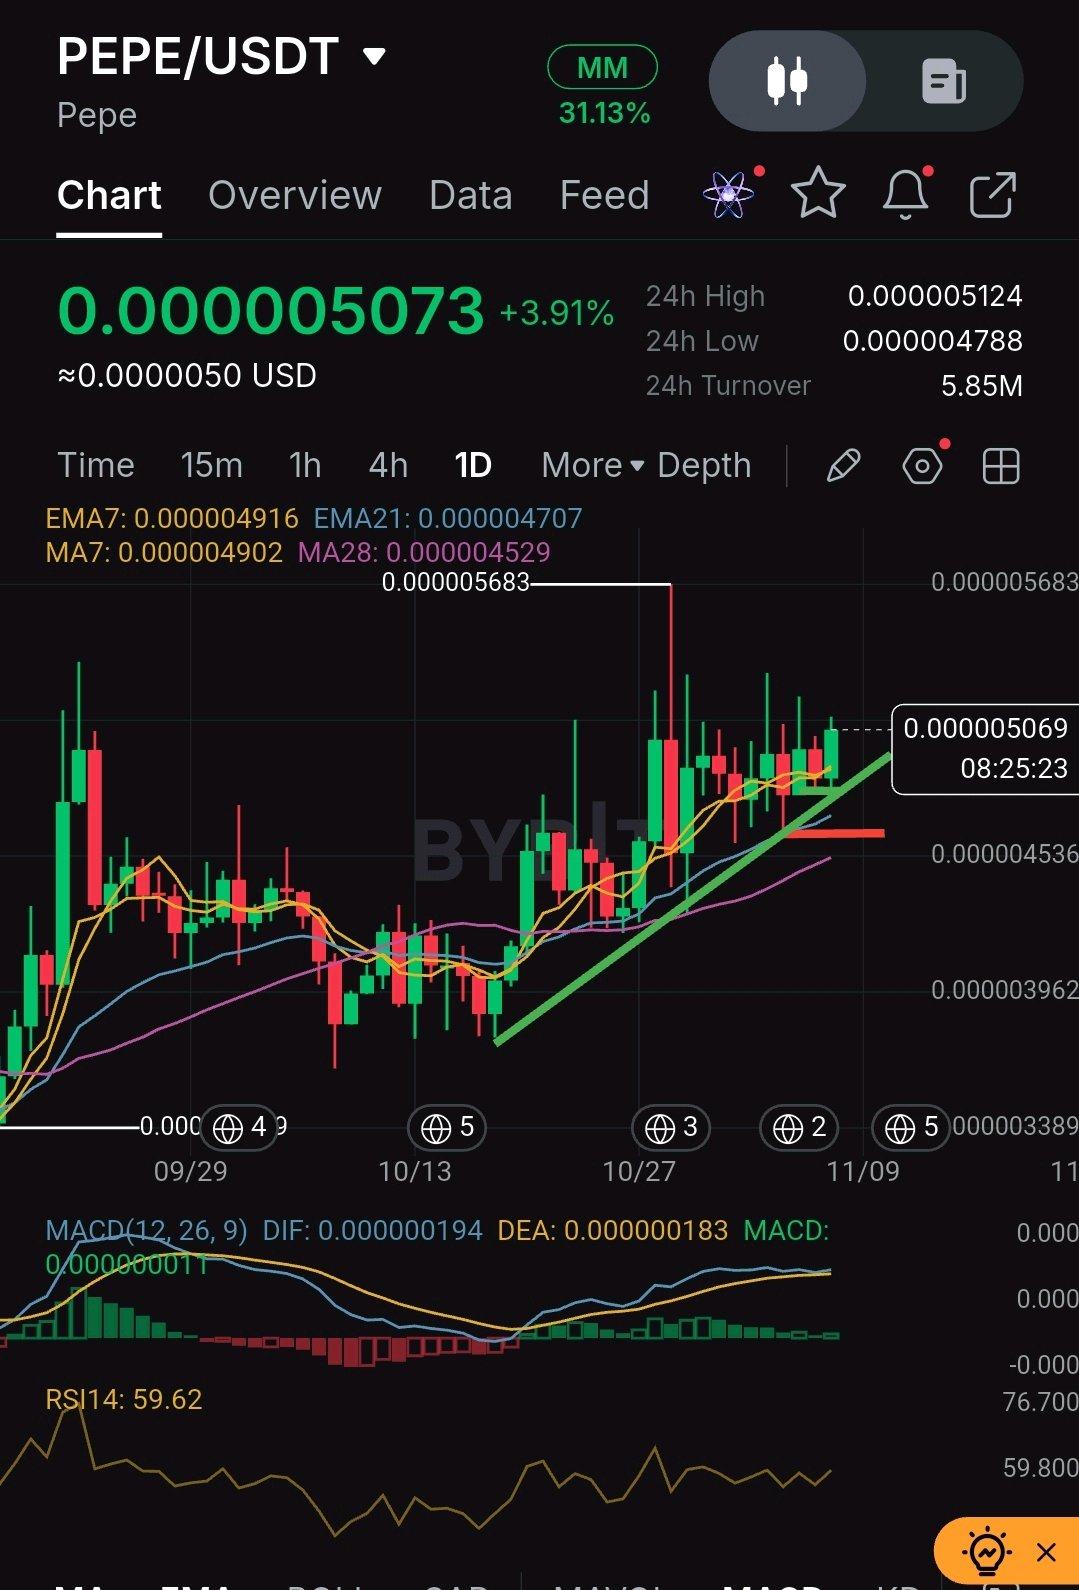
$PEPEUSDT is showing something Bitcoin hasn't managed recently. Over the past 30 days, $BTCUSDT has fallen roughly 8%, while PEPE has gained around 30%. That relative strength caught my attention. But the real reason I'm bullish is what the charts are showing beneath the price. On the daily timeframe, PEPE continues to build higher lows above its rising trendline. Price is holding above the 7 and 21 EMAs, suggesting buyers are maintaining control of the broader recovery. The 4-hour chart adds another positive signal. Price has reclaimed its short-term moving averages, RSI is approaching 60, and MACD has turned slightly positive. Buyers are gaining momentum, although the current breakout attempt still needs confirmation. My next important level is $0.000005309. A strong 4-hour close above it, followed by a successful retest, could open the path toward the daily resistance at $0.000005683. If price pulls back first, I'll watch whether buyers defend the marked support around $0.00000478–$0.00000480. Management I'm bullish while the daily higher-low structure remains intact. A decisive loss of the 4-hour demand zone and rising daily support would weaken this outlook. I'll wait for a confirmed entry and define my stop before calculating R:R. PEPE is volatile, so position sizing matters. I'm not a financial advisor. A single green candle can attract attention. What keeps me interested is PEPE's ability to defend its structure across two timeframes. #IMPACTbyTrade
Soy extremadamente optimista con $COREUSDT
One red line. Two upside levels. This is why $COREUSDT has my attention. The most important number on my chart is $0.01161. That's where my bullish idea faces its real test. CORE is trading near historical lows, while my weekly RSI analysis suggests a possible bullish divergence. The daily chart has already shown an initial reaction, and price is now testing that base again. What I want to see is buyers absorbing the selling pressure, followed by a clear shift in daily market structure. If that happens with stronger volume, my marked swing targets are $0.02550 and $0.03022. From the video's $0.01244 reference price, those levels represent roughly 105% and 143% potential upside. These are ambitious scenarios, not guaranteed returns. Monday's reopening of traditional markets could bring fresh activity, but CORE needs its own buying volume to support a meaningful recovery. Its relatively small market size also means sharp moves can happen in either direction. Management: If price breaks below $0.01161 and cannot recover that level, my bullish setup is no longer valid. For a new position, I want a confirmed daily higher low, a break above the latest lower high, and expanding volume. The protective stop belongs below the confirmed structure. Position size and the final risk-to-reward ratio must be calculated from the actual entry and stop, not assumed in advance. I'm heavily bullish on CORE's recovery potential, but the next volume-backed move will determine whether this remains a promising chart or becomes a trade worth taking #IMPACTbyTrade
Hiddem Gems $LITUSDT $PEPEUSDT
$LITUSDT — The most important part of this chart isn't today's pump. It's what happened before it. Look at my blue box on the 4H chart. That entire consolidation happened while Bitcoin and the broader market were under heavy selling pressure. Yet LIT kept trading around $3.25–$3.56 instead of giving back its earlier gains. Now buyers are pushing price toward the top of that range. The numbers support this relative strength: LIT has gained approximately 28.6% over the past seven days while Bitcoin is down around 1.8%. That difference is a major reason I'm strongly bullish. The weekly chart adds another piece. Price pulled back into my marked imbalance and demand area, swept nearby liquidity, and started recovering. On the 4H timeframe, the reaction from the $2.95–$3.08 zone has been particularly strong. I see this as an attempt to shift market structure, although the larger breakout still needs confirmation. A decisive move above $3.56–$3.60 could open the way toward $4.00 and $4.50. If weekly momentum continues and resistance gives way, the previous highs around $5.00–$5.50 become the bigger liquidity objective. I want a confirmed 4H breakout and successful retest before treating $3.56 as support. Losing $3.25 would weaken the immediate bullish structure, while a sustained breakdown below my marked $2.6884 level would invalidate the broader setup. Any entry needs a defined stop and acceptable risk-to-reward ratio, especially if Bitcoin faces another selloff. I'm heavily bullish, but the next confirmation is specific: can LIT turn the ceiling of that blue consolidation box into support? If it does, the weekly recovery could have much further to run. #IMPACTbyTrade
yo también creo esto $HYPEUSDT $XAUTUSDT
Bitcoin's most important move may happen before the breakout🚀🚀 Everyone is watching $BTCUSDT 's red candles. But there's something far more interesting in this $XAUTUSDT comparison. On the 2-month chart, Gold defended its rising support around 2022–2023, then spent time building strength beneath resistance. The explosive rally didn't begin simply because support held. It came after Gold finally broke through that resistance in 2024. That's the part of this comparison most traders are missing. Now look at Bitcoin. Price is approaching a similar long-term rising support, but the bullish breakout is still unconfirmed. My $75K order-block plan already failed, so I'm cautious about further downside in the short term. However, a weak short-term structure doesn't automatically destroy a long-term bullish setup. If BTC defends its macro trendline, forms a clear bullish market structure shift, and eventually breaks its upper resistance, my longer-term $90K–$100K outlook becomes much stronger. Those are my targets, not a guarantee from Gold's historical pattern. I'm watching for confirmation, not blindly buying a familiar-looking chart. A sustained higher-timeframe break below rising support, followed by a failed reclaim, would invalidate this setup. Any new entry needs a defined stop below the confirmed structure and a favorable risk-to-reward ratio before execution. Gold has already shown what can happen after years of consolidation. Bitcoin still needs to earn its breakout. Here's the real question: Are we watching Bitcoin build its next major move, or is this rising support about to fail? #IMPACTbyTrade
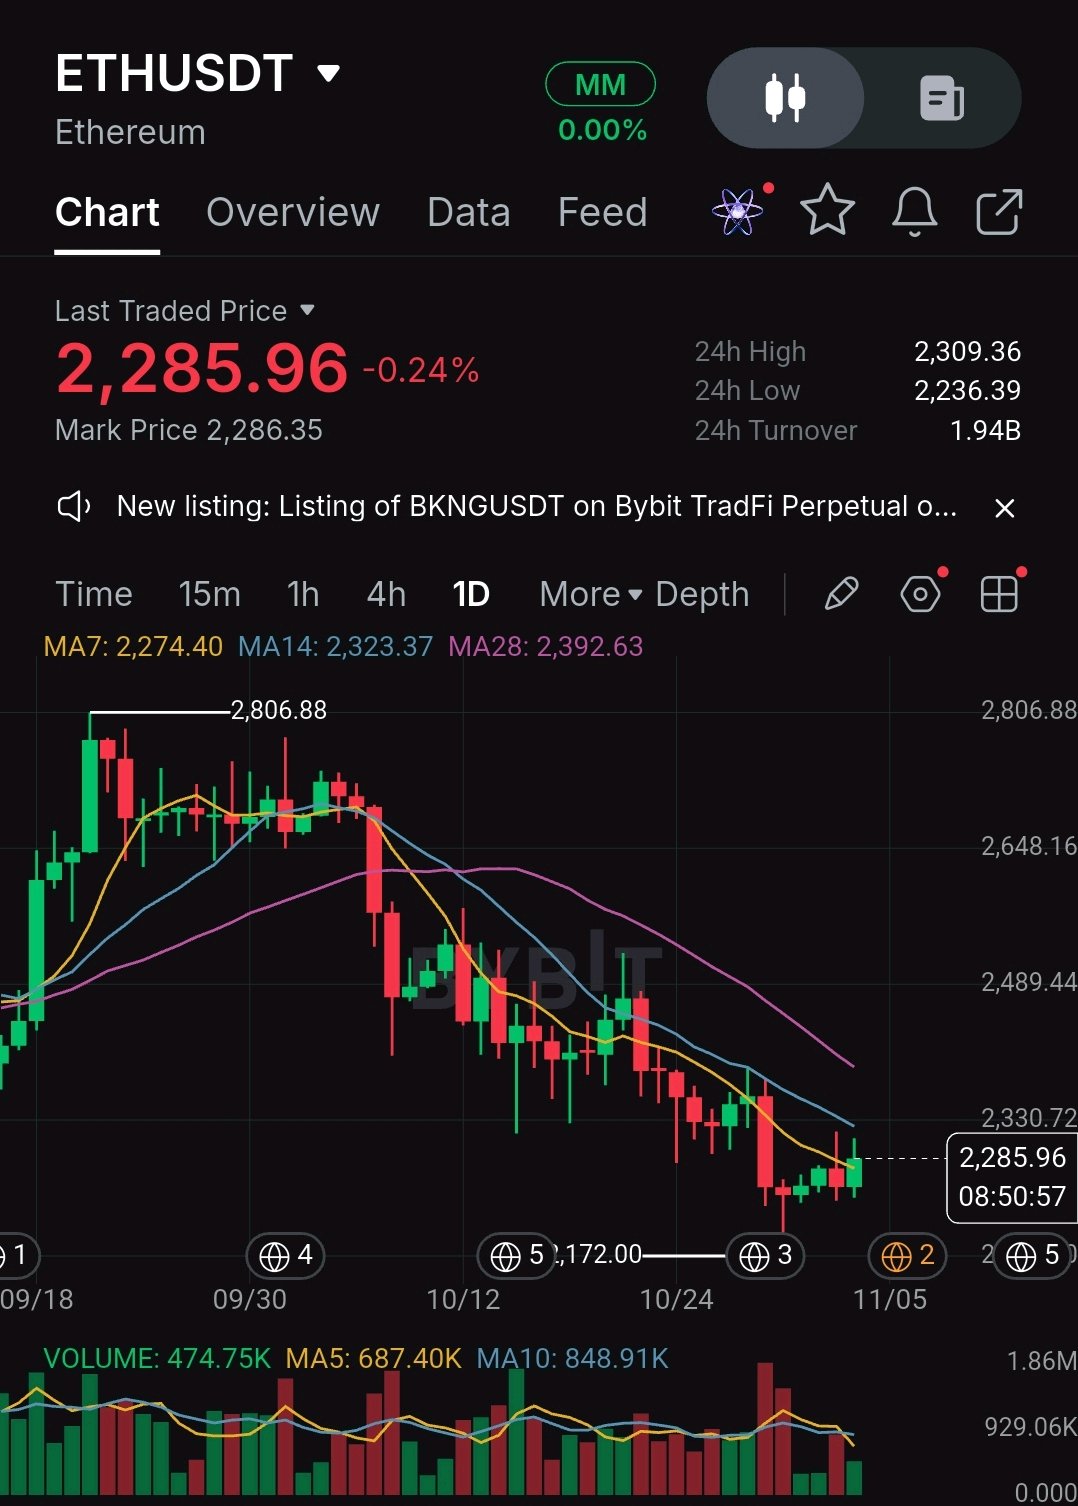
$ETHUSDT 1D: ETH está en 2.285,96 y el gráfico diario muestra ahora sus primeras pequeñas señales de una base. Los mínimos han subido durante varias sesiones por encima del mínimo oscilante de 2.172, y el precio ha vuelto a subir por encima de la media móvil (MA) de 7 días (2.274). Aun así, todas las MA diarias están apiladas por encima y con pendiente descendente, y las de 14 días (2.323) y 28 días (2.393) son las que importan. Me interesa un punto. Medido desde el máximo de 2.806,88 hasta el mínimo de 2.172, el retroceso de 0,236 se sitúa cerca de 2.322. Eso es casi exactamente la MA de 14 días en 2.323 y el nivel de 2.330 en el gráfico. Cuando un retroceso y una media móvil se solapan, lo trato como la prueba real, y ETH aún no ha cerrado por encima. El volumen es el punto débil: 475K hoy frente a una media de 5 días de 687K. El rebote es silencioso, así que no me fiaría hasta que un cierre lo confirme. Dos formas en las que lo jugaría: 1. Recuperación: un cierre diario por encima de 2.331, seguido de un retesteo que aguante. Stop por debajo de 2.274, primer objetivo 2.414 (el 0,382), luego 2.489 (el 0,5). 2. Caída (Dip): un rebote desde 2.236 a 2.260 (la zona de mínimos de 24h) tras una vela de reacción diaria. Stop en un cierre diario por debajo de 2.172. Son unos 80 puntos de riesgo por aproximadamente entre 70 y 240 de recompensa, así que solo tiene sentido si ajusto el tamaño de la posición. Pasaré de ambas si ETH cierra por debajo de 2.236 sin que entren compradores, porque 2.172 es el único soporte que queda en este gráfico. Esto es un escenario, no una predicción. Las salidas de los ETF han afectado a las criptos en general esta semana, así que un BTC débil arrastrará a ETH a través de estos niveles independientemente de la estructura. Mantén el apalancamiento bajo. ¿Confías en un cierre diario por encima de 2.331 como confirmación, o necesitas ver que se recupere primero los 2.414? $BTCUSDT $ETHUSDT #WSOT2026 #Observatorio del mercado de las elecciones de mitad de mandato #Las nóminas de EE. UU. y las decisiones sobre tipos de interés marcan una semana macroeconómica #AnthropicIPOValuationTest #Nóminas no agrícolas de EE. UU.
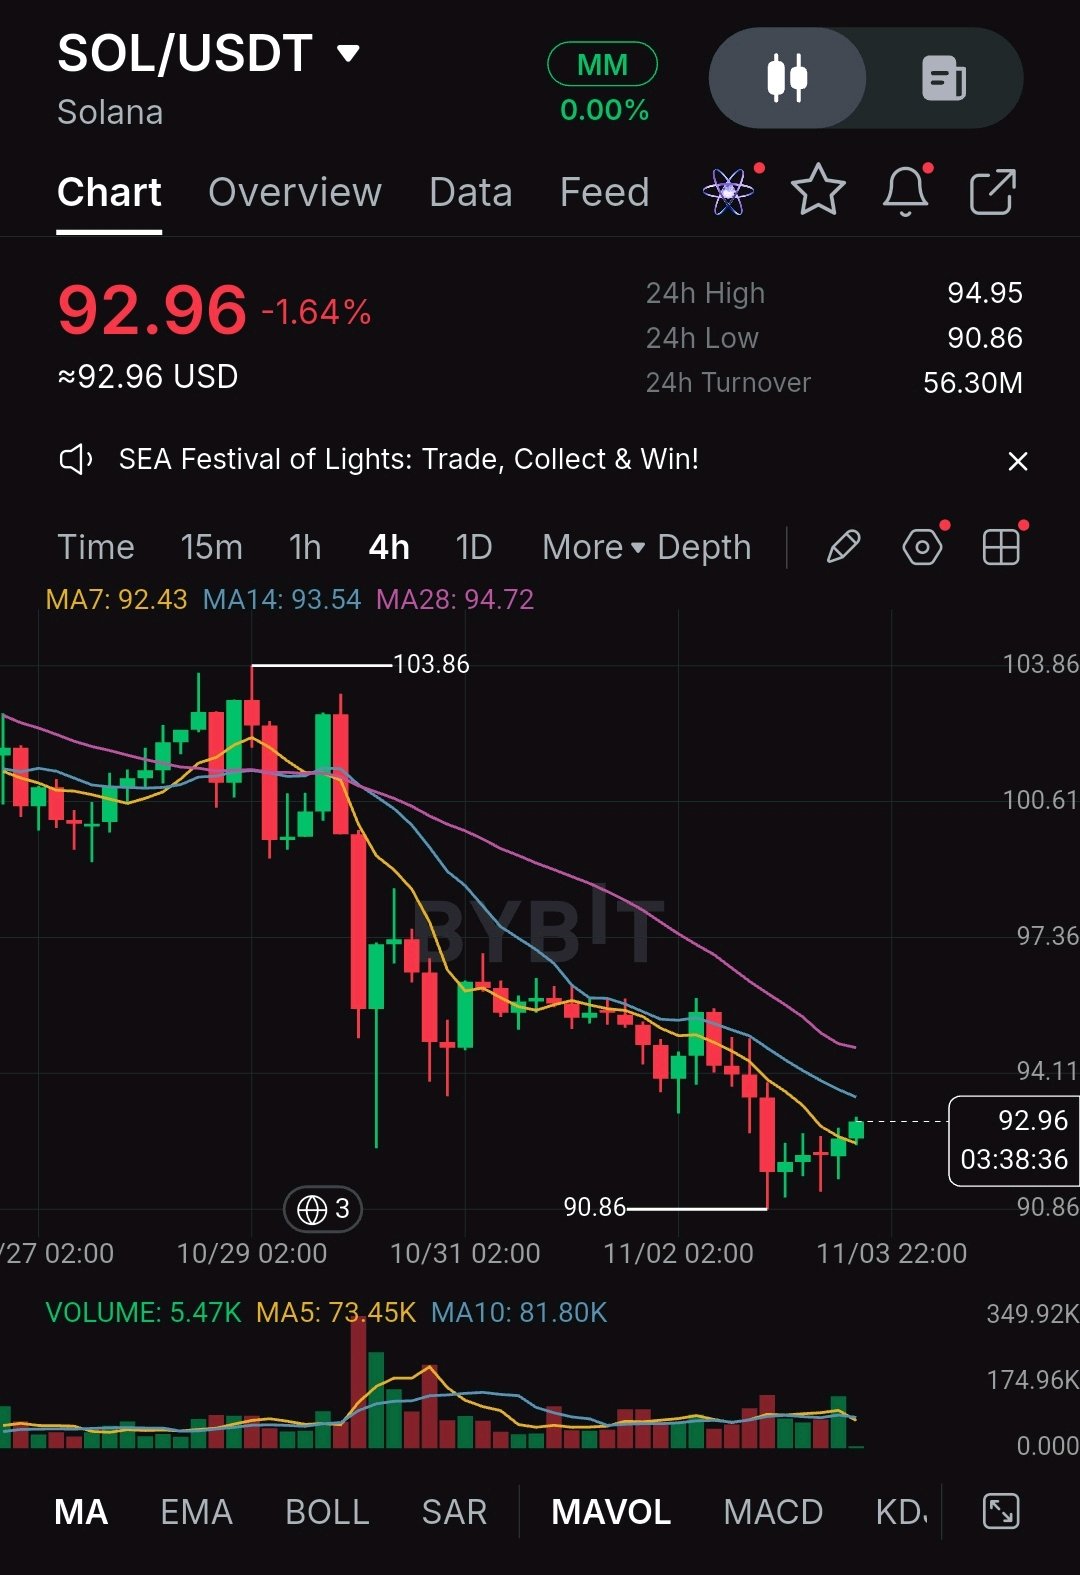
$SOLUSDT 4H: Solana cotiza a 92,96, solo unos 2,3 por encima del mínimo de 90,86 que alcanzó anteriormente, y la tendencia en este gráfico sigue siendo claramente bajista. Las medias móviles de 7, 14 y 28 periodos están apiladas en ese orden (92,43, 93,54 y 94,72) y todas tienen pendiente negativa, con el precio fracasando repetidamente por debajo de ellas desde el máximo de 103,86. Lo que ha cambiado hoy es pequeño, pero real. SOL marcó 90,86, hubo compras, y ahora está de nuevo por encima de la MA7 en 92,43. Ese es un primer paso y nada más. Todavía no ha cerrado por encima de la MA14, y mucho menos de la MA28, así que lo llamaría un rebote dentro de una tendencia bajista hasta que se demuestre lo contrario. El cálculo del retroceso me da mi mapa. Medido desde 103,86 hasta 90,86, el 0,382 se sitúa cerca de 95,83 y el 0,5 en 97,36, un nivel que también aparece en el eje de precios del gráfico. Un rebote que no logra alcanzar los 94,7 a 95,8 no me dice mucho. Lo que me gustaría ver antes de confiar en una posición larga: - Un cierre en 4H por encima de 94,72, la MA28, seguido de un retesteo que aguante. Cualquier cosa construida sobre eso tiene un stop por debajo de 92,40 y un primer objetivo en 97,36. - O una caída de vuelta a la zona de 90,86 a 91,50 que vuelva a ser comprada, con un stop en un cierre de 4H por debajo de 90,50. Si el precio cierra por debajo de 90,86, ya no queda soporte en este gráfico y me mantendría fuera. El volumen en las velas de rebote es bajo, por lo que este movimiento aún no tiene mucho respaldo. Esto es un escenario, no una predicción, y BTC es el factor principal aquí. Si BTC pierde el soporte, los niveles de SOL se romperán con él. Mantén el tamaño de la posición lo suficientemente pequeño para que un stop-out no haga daño. ¿En cuál confiarías más, en un retesteo de 94,7 o en un segundo rebote desde 91? $SOLUSDT #IMPACTbyTrade
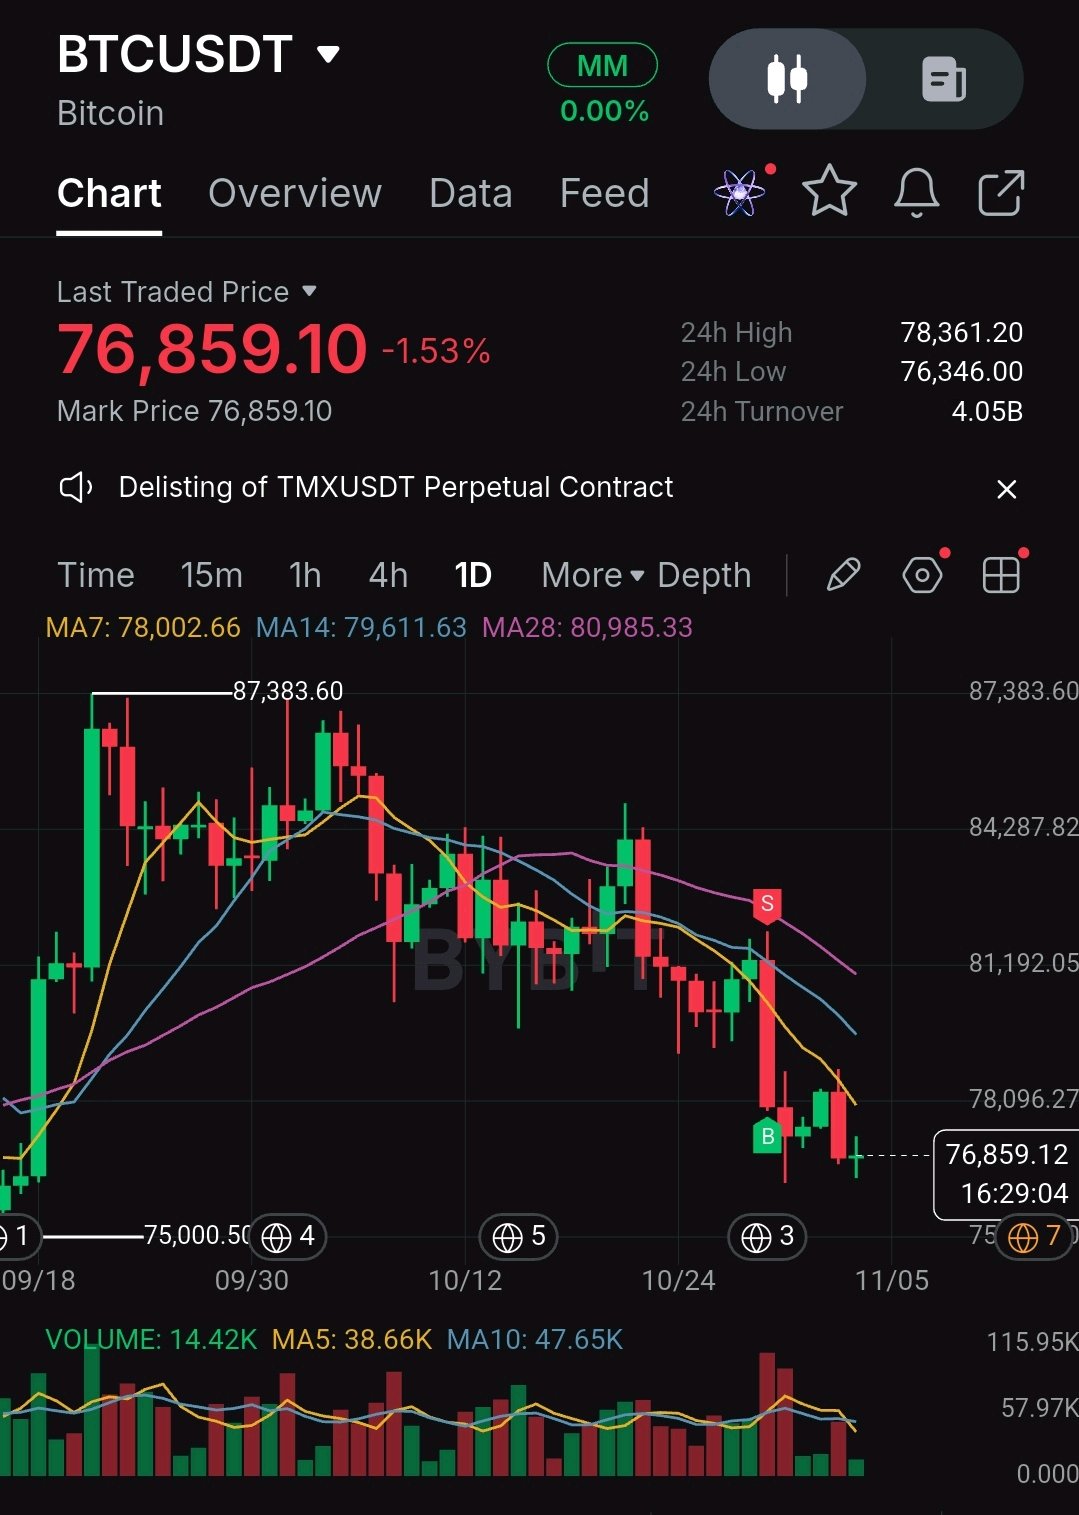
$BTCUSDT: My stance today is wait, not buy. BTC is near 76,700, about 3.6% lower on the week, and it has slipped under the 100-day EMA around 77,750. The pressure is coming from flows. Spot ETFs saw roughly $399M of outflows on Nov 2 after $643M on Oct 30, and the Fear & Greed Index has fallen to 26. Today is the US midterm vote, with the jobs report due Nov 6, so headline risk is high. Several market reports I checked put support at 76,000 to 76,600. That is the line I'm watching, but a level being named by many people doesn't mean it will hold. Until I see buyers react there, I have no trade. Here is what would change my mind: - A 4H or daily candle that rejects the 76,000 to 76,600 zone and closes back above it. That would give me a long idea with a stop below 75,000 and a first target at 78,500, for roughly 1,300 of risk against 2,200. - A daily close below 76,000. That would put 75,000 in play, and I'd stay out. - A move above 78,500 with no pullback. I'd skip it rather than chase, since the 79,500 to 80,500 area is where reports list resistance after BTC dropped below 80,000. Levels vary slightly between data sources, so I treat them as zones, not exact lines. This is a scenario, not a prediction, and a surprise in the jobs data can move BTC through any of these levels. Keep leverage low if you trade it. If BTC does reclaim 78,500 this week, would you treat it as a real recovery, or wait for a retest first? $BTCUSDT
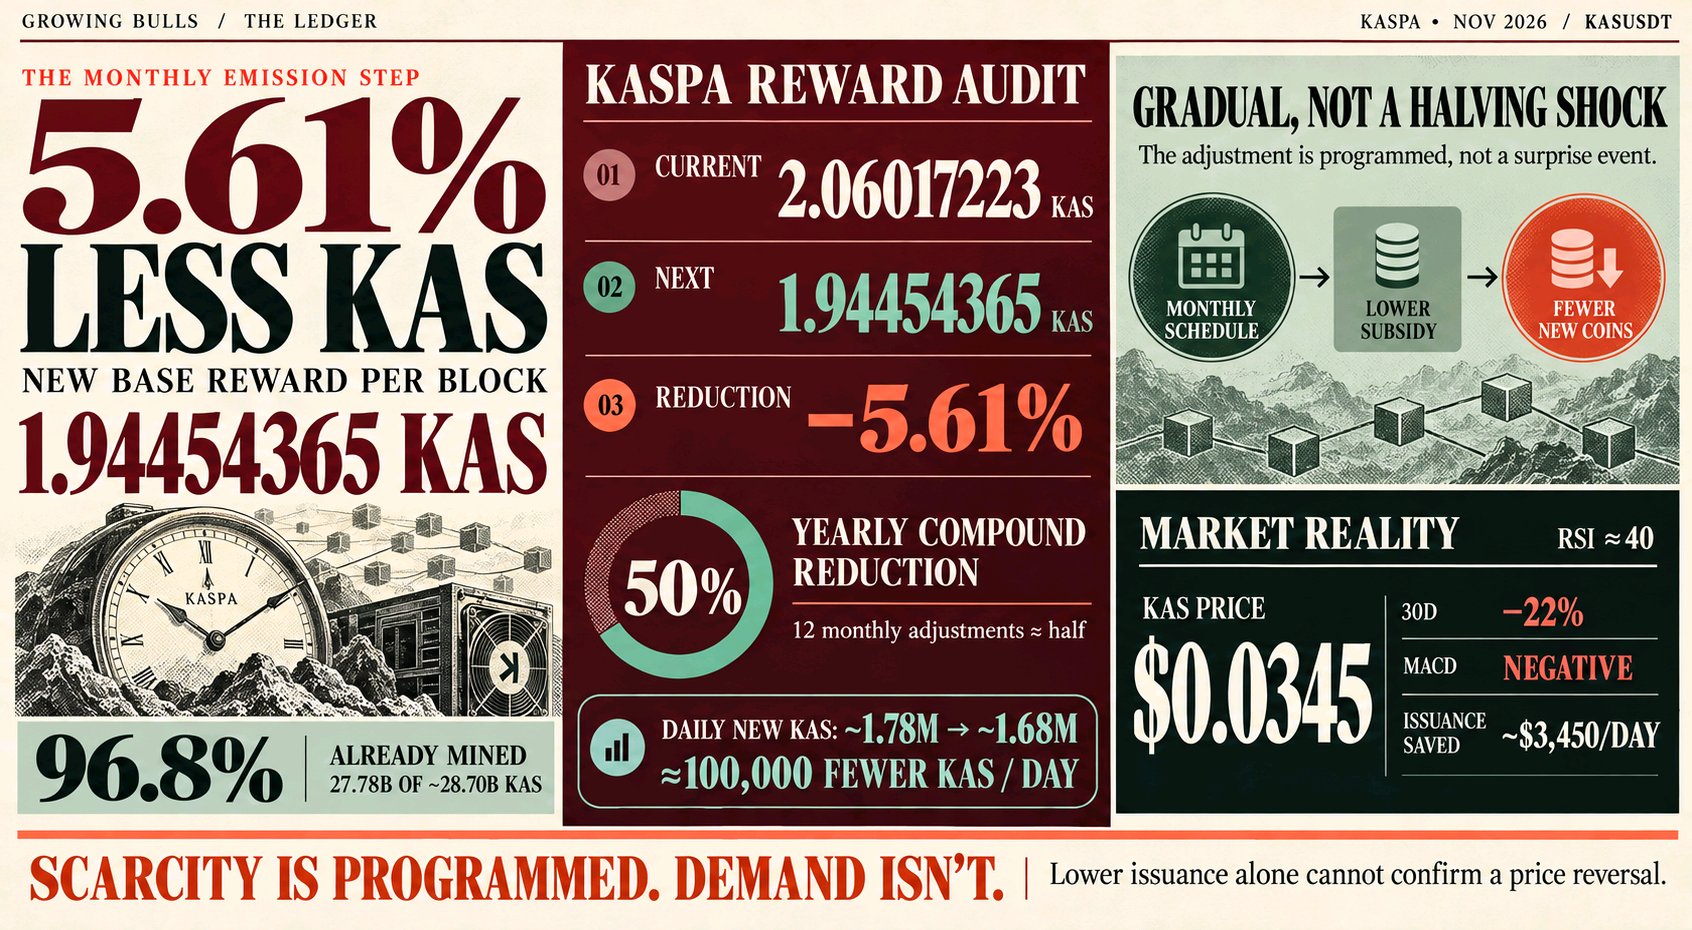
$KASUSDT — KASPA ESTÁ A PUNTO DE REDUCIR DE NUEVO LAS RECOMPENSAS DE MINERÍA. PERO LA REDUCCIÓN DEL 5,6% NECESITA CONTEXTO. Se espera la próxima reducción programada de la recompensa de minería de Kaspa alrededor del 4 de noviembre de 2026. La recompensa base por bloque de la red cambiará de: Recompensa actual: 2,06017223 KAS Siguiente recompensa: 1,94454365 KAS Reducción: Aproximadamente 5,61% Eso suena como un evento significativo para la oferta. Pero hay un detalle importante que muchos inversores pasan por alto. A diferencia de Bitcoin, que reduce a la mitad su subsidio de minería aproximadamente cada cuatro años, Kaspa reduce sus recompensas de minería gradualmente cada mes. Cada reducción mensual es de aproximadamente el 5,61%. Doce reducciones sucesivas se acumulan para un descenso del 50% durante un año. Así que el ajuste de noviembre no es un halving nuevo e inesperado. Es otro paso en el programa de emisión existente de Kaspa. Aquí es donde la economía se pone interesante. A la tasa objetivo de la red de 10 bloques por segundo, el subsidio actual produce aproximadamente 1,78 millones de nuevos KAS al día. Después de la siguiente reducción, eso caerá a aproximadamente 1,68 millones de KAS por día. Son alrededor de 100.000 KAS menos entrando en circulación diariamente. Al precio reciente de KAS cercano a los $0,0345, la diferencia representa aproximadamente $3.450 en tokens recién emitidos por día. La reducción de la oferta es real, pero su impacto inmediato en dólares es considerablemente menor de lo que el titular podría sugerir. Hay otro número que vale la pena vigilar. Aproximadamente 27,78 mil millones de KAS ya han entrado en circulación de un suministro máximo cercano a los 28,70 mil millones. Eso significa que aproximadamente el 96,8% del suministro máximo de Kaspa ya ha sido minado. Esto hace que la emisión restante de Kaspa sea relativamente limitada en comparación con su suministro circulante existente. Sin embargo, una menor emisión no crea automáticamente una mayor demanda. Los mineros todavía pueden vender KAS acumulados anteriormente. Los titulares existentes pueden vender. Y las condiciones más amplias del mercado pueden superar el efecto de un ajuste de recompensa programado. Esa distinción importa en este momento. KAS cotiza cerca de los $0,0345, un descenso de aproximadamente el 22% en los últimos 30 días. Su RSI diario está alrededor de 40, mientras que el MACD sigue siendo negativo. El programa de emisión se está volviendo más restrictivo, pero la tendencia del precio aún no ha confirmado una renovada fuerza compradora. Para los mineros, la próxima reducción también significa menores recompensas base con precios y costes operativos sin cambios, lo que podría afectar a la rentabilidad. Para los inversores, la verdadera pregunta es si la demanda puede crecer más rápido que el suministro restante que entra en circulación. El mecanismo de escasez de Kaspa ya está establecido. La próxima reducción de recompensa fortalece ese perfil de suministro a largo plazo, pero la apreciación sostenible del precio todavía depende de la adopción, la liquidez y la demanda real. La escasez está programada. La demanda no. #Presentación S-1 de Anthropic #ByXIMPACT #IMPACTbyTrade