Tahir28
3691Me gusta0Compartir en el chat53Aficionados16Seguir
Crypto Learner & Market Observer Chart Analysis | Risk Management | Crypto Education Learn First. Manage Risk.
Crypto Learner & Market Observer Chart Analysis | Risk Management | Crypto Education Learn First. Manage Risk.
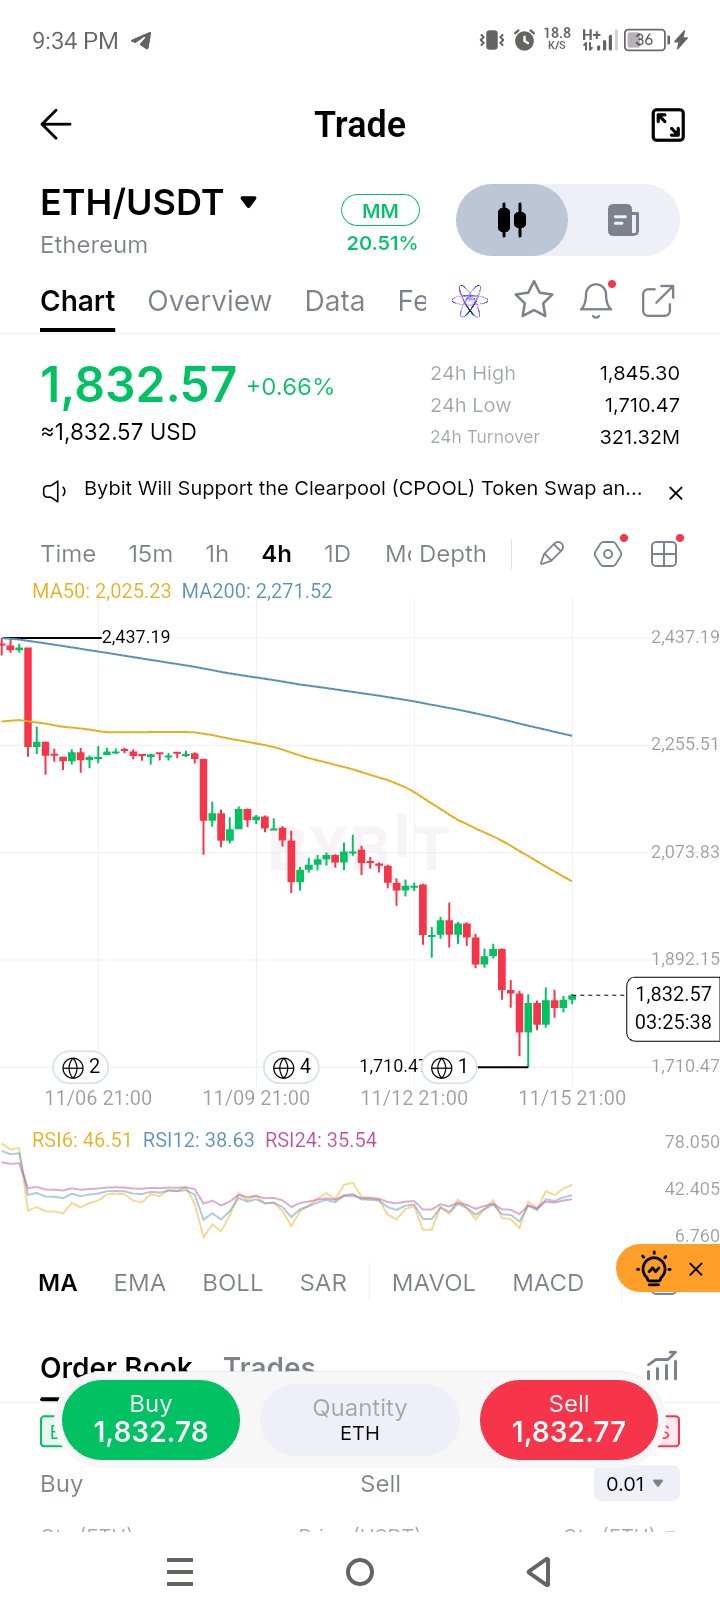
Análisis de mercado de ETHEREUM en 4H
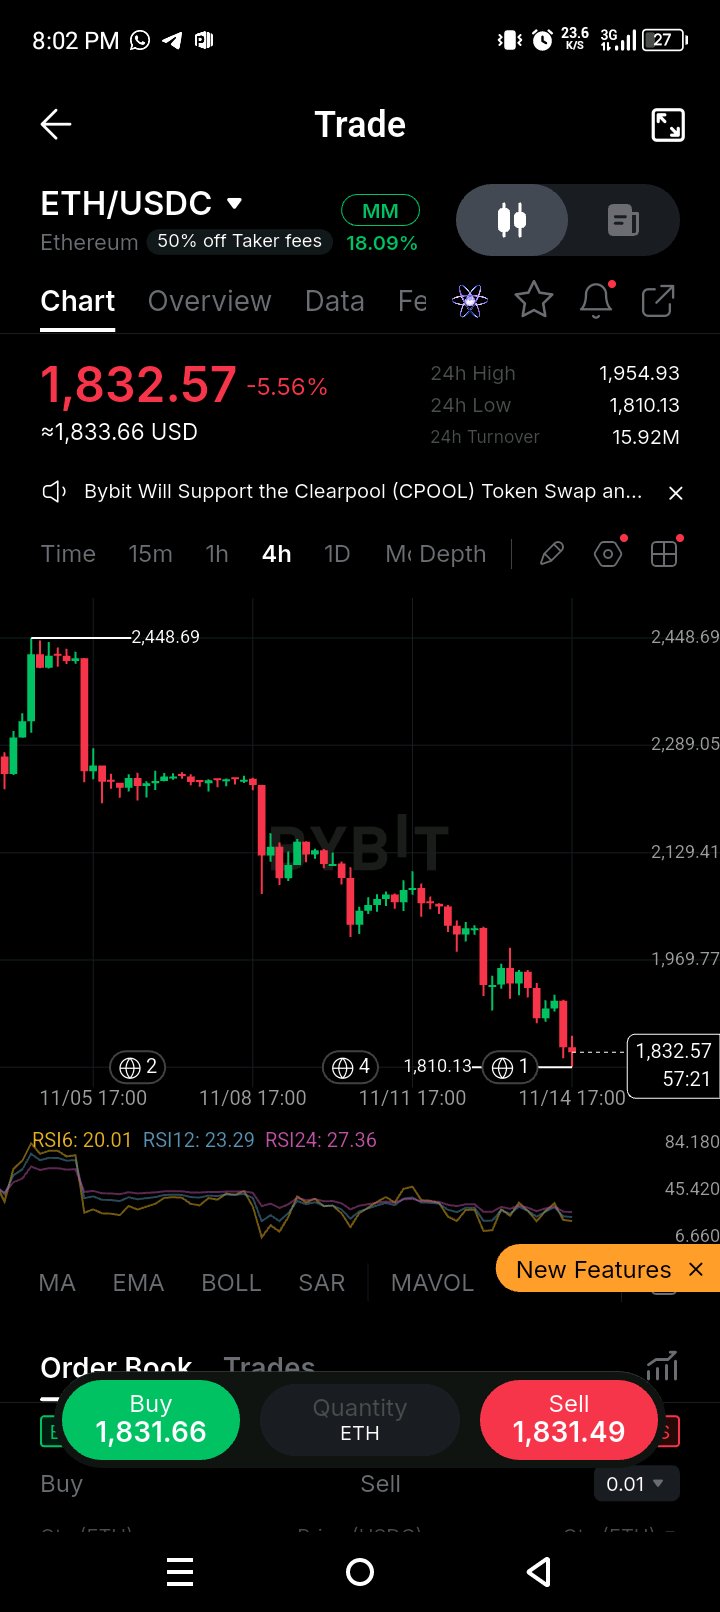
$ETHUSDT muestra una pequeña recuperación tras caer a la zona de soporte de $1,710, pero la tendencia general sigue siendo bajista. ETH cotiza actualmente alrededor de los $1,832, todavía por debajo de la MA50 ($2,025) y la MA200 ($2,271), lo que confirma que los vendedores siguen teniendo el control. Los indicadores RSI muestran algo de mejora, pero el impulso alcista aún no es lo suficientemente fuerte como para confirmar un cambio de tendencia. Niveles clave a observar: Soporte: $1,710 Resistencia: $1,892 Resistencia mayor: $2,025 Un movimiento sostenido por encima de los $1,892 podría fortalecer la recuperación. Sin embargo, un rechazo en la resistencia podría provocar otra prueba de un soporte más bajo. Por ahora, la paciencia y la gestión de riesgos siguen siendo esenciales. Un rebote a corto plazo no significa necesariamente que la tendencia bajista haya terminado. #ByXIMPACT $ETHUSDT
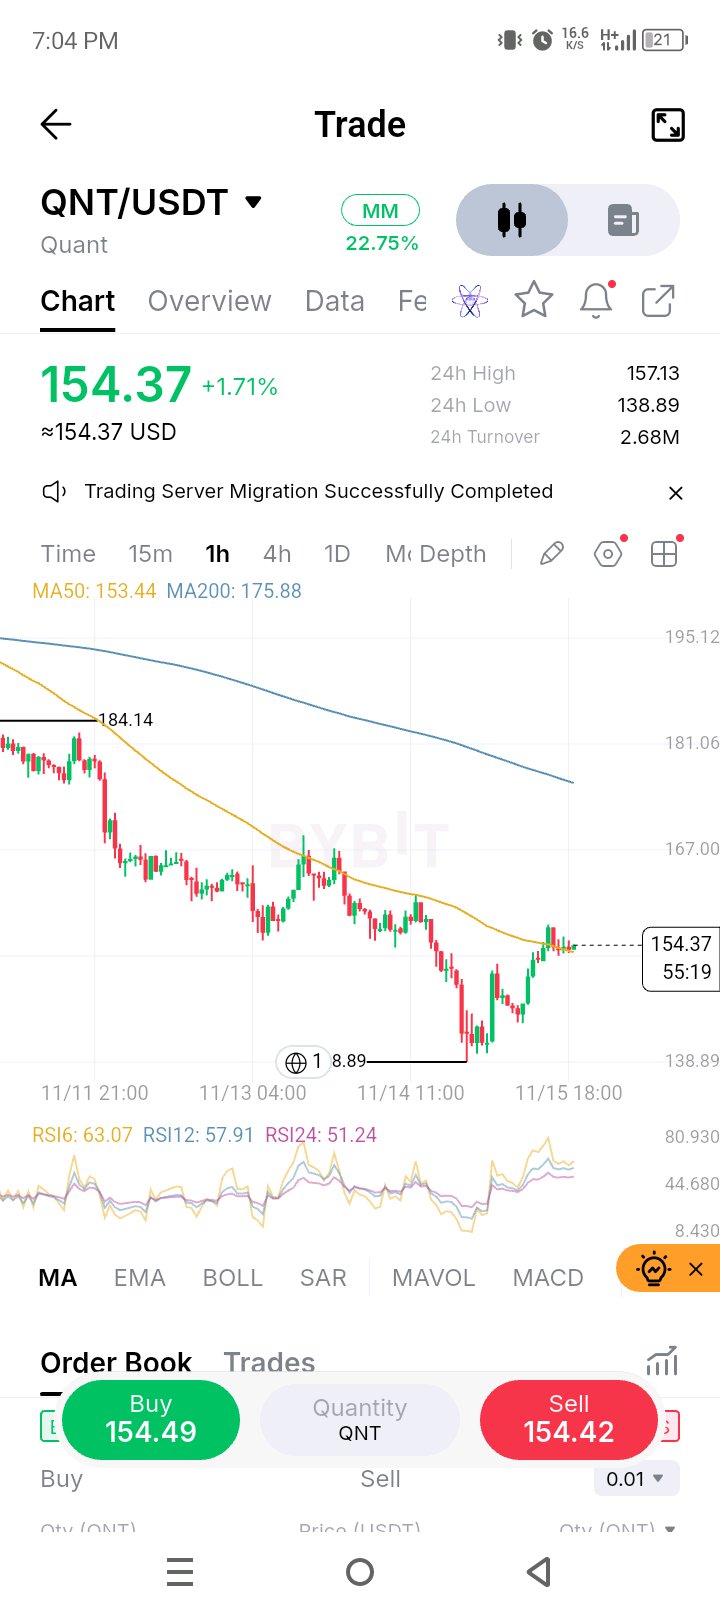
$QNT wicks to 138.89 and reclaims 154
$QNTUSDT is at 154.37, up 1.71%, and sitting right on its MA50 (153.44) after a wick down to 138.89 and a sharp V back up, so the real question is whether this holds above the line or the bounce is just a relief move inside the downtrend. In my last QNT post I said losing 155 would leave no support on the chart, and price did lose it, then took it right back, which is a classic failed breakdown. The sequence was a rejection at 184.14, a long grind lower through every level, a final flush to 138.89, and then a strong recovery that has brought price about 11% off the low. RSI6 has lifted to 63 while RSI12 (58) and RSI24 (51) are climbing behind it, so momentum is turning with price without being stretched. The MA200 (175.88) is still far overhead and sloping down, so the bigger trend has not changed. 153-155 is the level that matters, since that is the MA50 and the old 155 floor sitting together. Hold it on a pullback and a push toward 157.13 and then the 167 area is possible. Lose 148 and the failed-breakdown idea is dead, with the 138.89 wick back in play. I would wait for a close above 157 before trusting this as more than a bounce. #ByXIMPACT $QNTUSDT
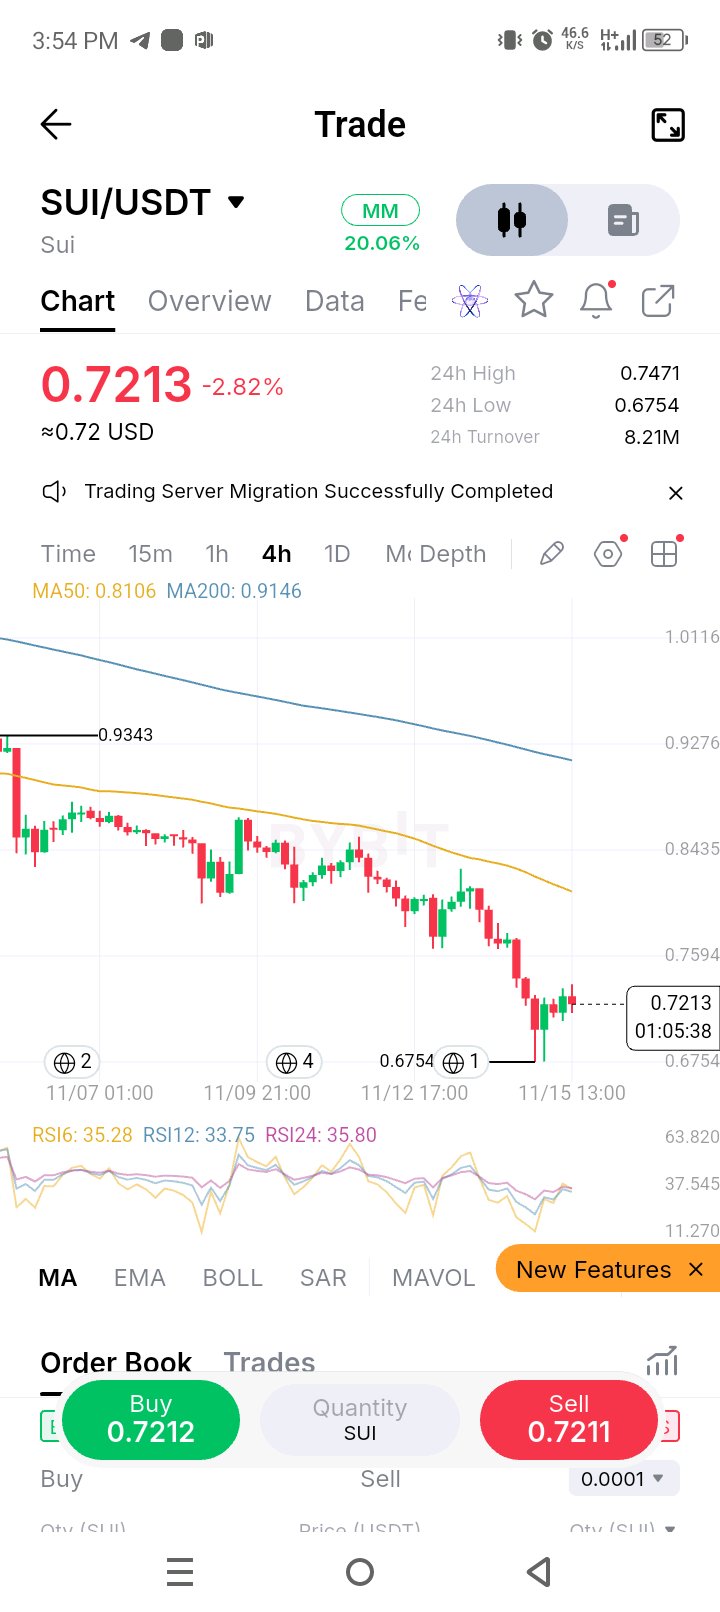
$SUI sinks 39% from 1.185, wick holds at 0.6754
$SUIUSDT is at 0.7213, down 2.82% on the day and about 39% below the 1.1853 level from my last SUI post, so the real question is whether the 0.6754 wick marks a floor or this is just a pause in a long downtrend. In that post price was holding above its MA50 after a clean pullback, and that structure has since broken completely. The sequence was a rejection at 0.9343, a long grind lower with lower highs through every bounce, and then a heavy red candle that wicked to 0.6754 before a small recovery. Price is now about 11% below the MA50 (0.8106) and further below the MA200 (0.9146), and both averages are sloping down. RSI is low at 34-36 across all three, so selling is stretched but not capitulating, and the bounce so far is only two small candles. 0.6754 is the level that matters, since it is the 24h low and the base of the flush. Hold it and a bounce toward 0.7594 is possible, though the MA50 near 0.81 is the real test of whether anything has changed. Lose 0.6754 and there is no support shown on this chart. I would not try to catch the bottom and would wait for a higher low or a close above 0.7471 before trusting any bounce. #ByXIMPACT $SUIUSDT
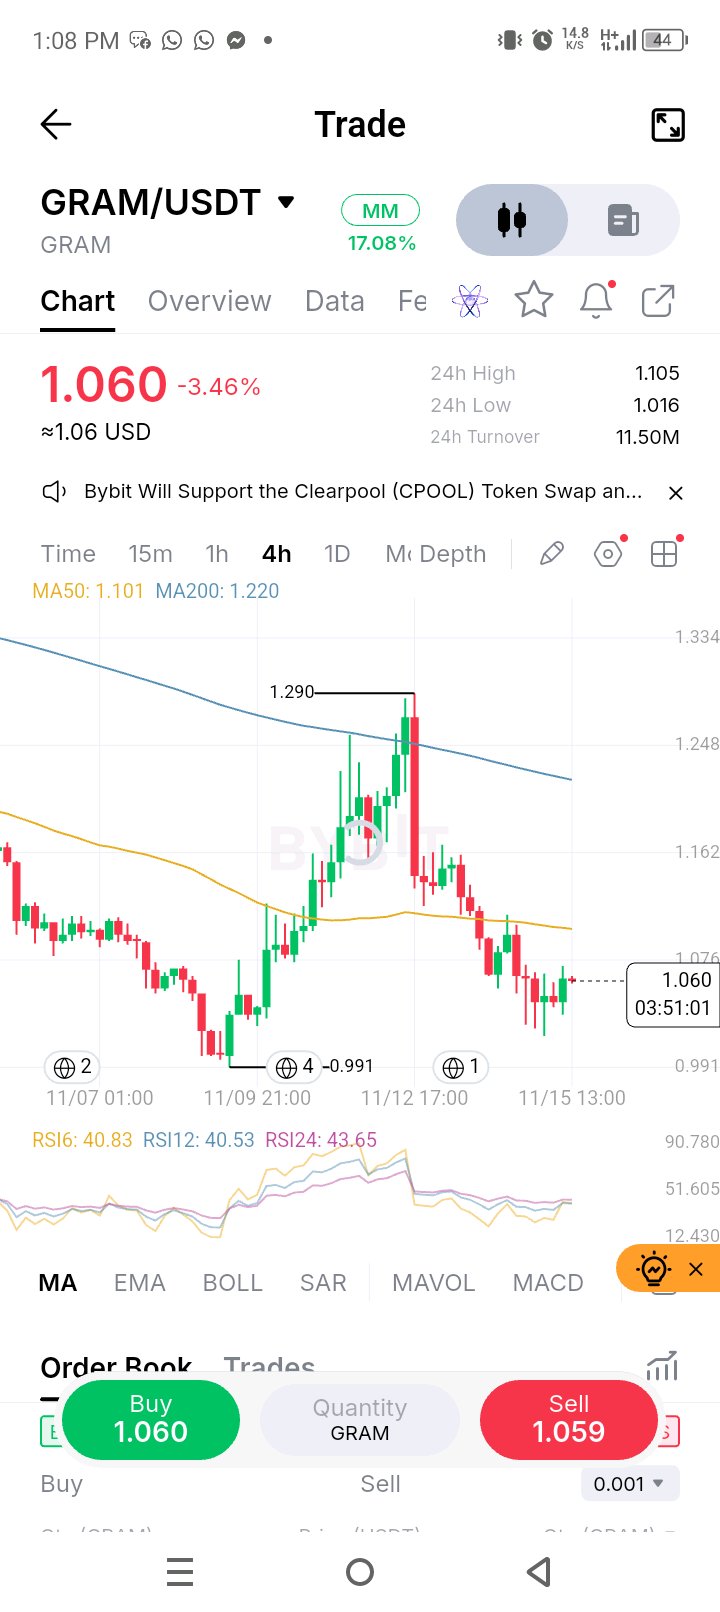
$GRAM fails at the MA200 and gives back the V
$GRAMUSDT is at 1.060, down 3.46%, after the push into the MA200 (1.220) I flagged in my last post spiked to 1.290 and reversed in one heavy candle, so the real question is whether the 1.016 low holds or the whole V-shaped recovery from 0.991 gets erased. I said the wicks near 1.258 showed sellers waiting, and that is what played out. The sequence was a base at 0.991, a strong run through the MA50 (1.101), a spike through the MA200 to 1.290, and then a sharp reversal that took price back through both averages. Price is now about 4% below the MA50, which has turned from support into resistance, and the MA200 is far overhead and sloping down. RSI has reset from hot to low at 41-44 across all three, so the heat is gone and momentum has flipped to the downside. 1.016 is the level that matters, since it is the 24h low and the last dip that was bought. Hold it and a bounce toward the MA50 near 1.10 is possible, though a close back above it is the real test. Lose 1.016 and the 0.991 low comes back into play, with no support shown below. I would wait for a close back above 1.105 before trusting any recovery. #ByXIMPACT $GRAMUSDT
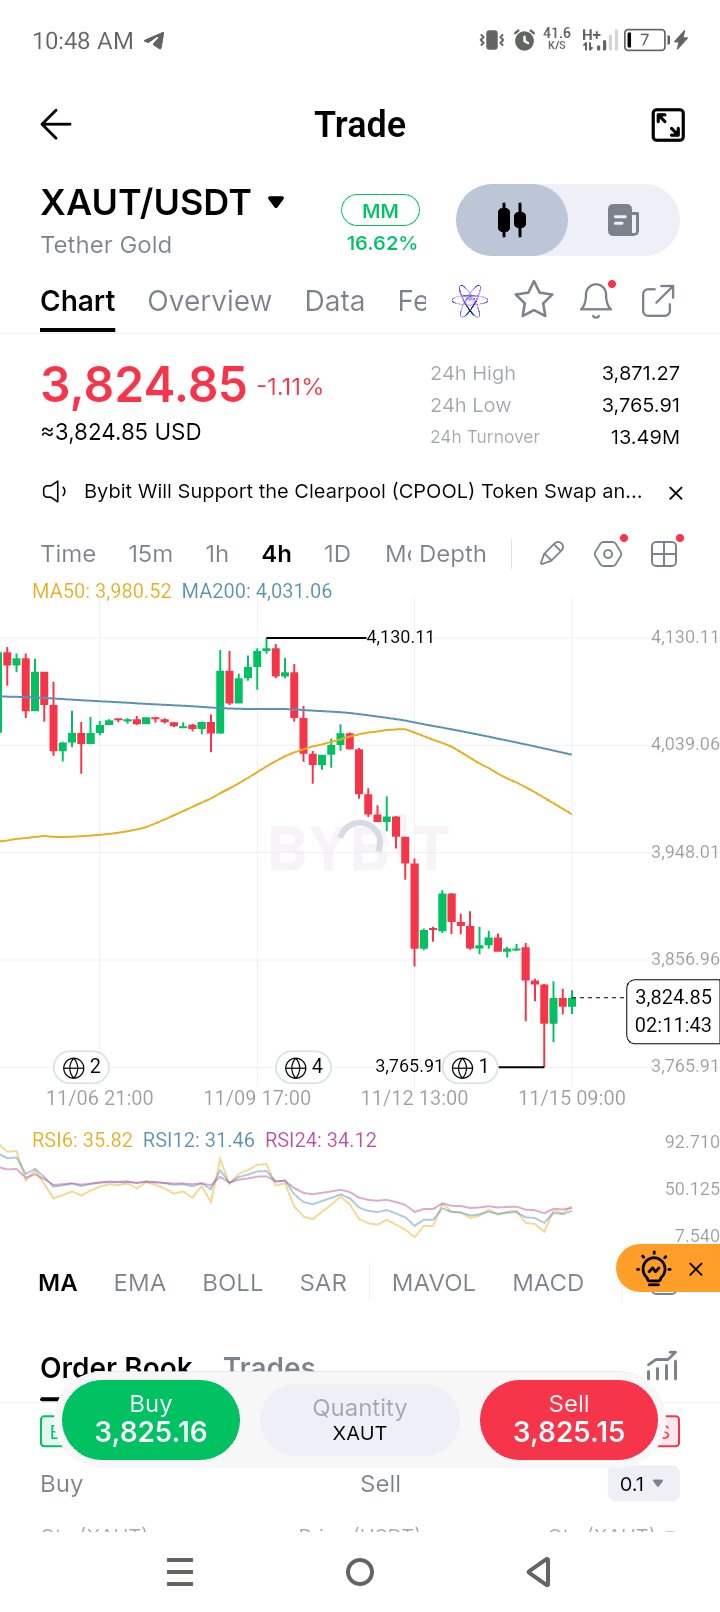
$XAUT loses 3,859 and wicks to 3,765
$XAUTUSDT is at 3,824.85 after the 3,859 floor I flagged in my last gold post gave way and price wicked down to 3,765.91, so the real question is whether that wick marks the low of this slide or the quiet range was just the pause before another leg. I said losing 3,859 would leave no support on the chart, and that is what has played out. The sequence was a rejection at 4,130.11, a drop through the MA50 and MA200, a quiet range near 3,860-3,890, and then a break to 3,765.91 with a small bounce. The MA50 (3,980.52) has now crossed below the MA200 (4,031.06) and both are sloping down, so every rally runs into resistance. RSI is low at 31-36 across all three, which means selling is stretched without being extreme. 3,765 is the level that matters, since it is the low of the flush. Hold it and a bounce toward 3,857 is possible, with the old 3,859 floor now acting as resistance. Lose 3,765 and there is no support shown on this chart. I would not try to catch the bottom here and would wait for a higher low or a close above 3,857 before trusting any recovery. #ByXIMPACT $XAUTUSDT
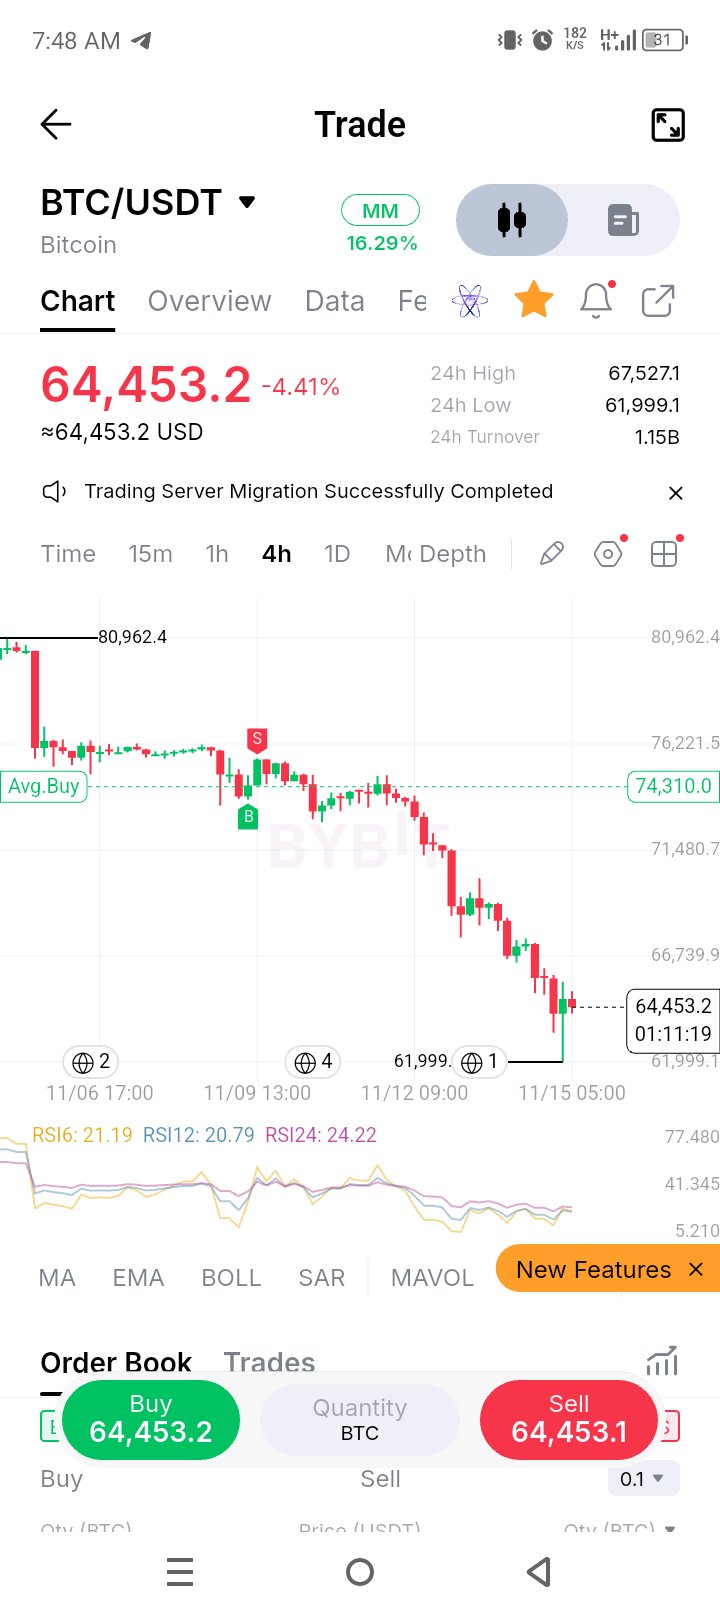
$BTC loses 66.4k and wicks to 62k
$BTCUSDT is at 64,453, down 4.41% on the day, after the 66,448 low I flagged in my last post gave way and price wicked down to 61,999.1 before bouncing, so the real question is whether that wick marks a capitulation low or this is a pause before another leg. I said losing 66,448 would leave no support on the chart, and price has now fallen about 14% below the 74,871 floor from two posts ago. The sequence was a rejection at 80,962, a heavy drop through 76k and 71k, a failed bounce around 74k, and then a staircase of lower highs down to 61,999.1. RSI is deeply oversold at 21-24 across all three, which means selling is stretched on every timeframe, but oversold can stay oversold when level after level breaks. The bounce so far is one green candle with a long lower wick. 61,999 is the level that matters, since it is the 24h low and the base of the flush. Hold it and a bounce toward 66,740 is possible, with the old 66,448 low now acting as resistance. Lose 61,999 and there is no support shown on this chart. I would not try to catch the bottom here and would wait for a higher low or a close above 66,740 before trusting any recovery. #ByXIMPACT $BTCUSDT
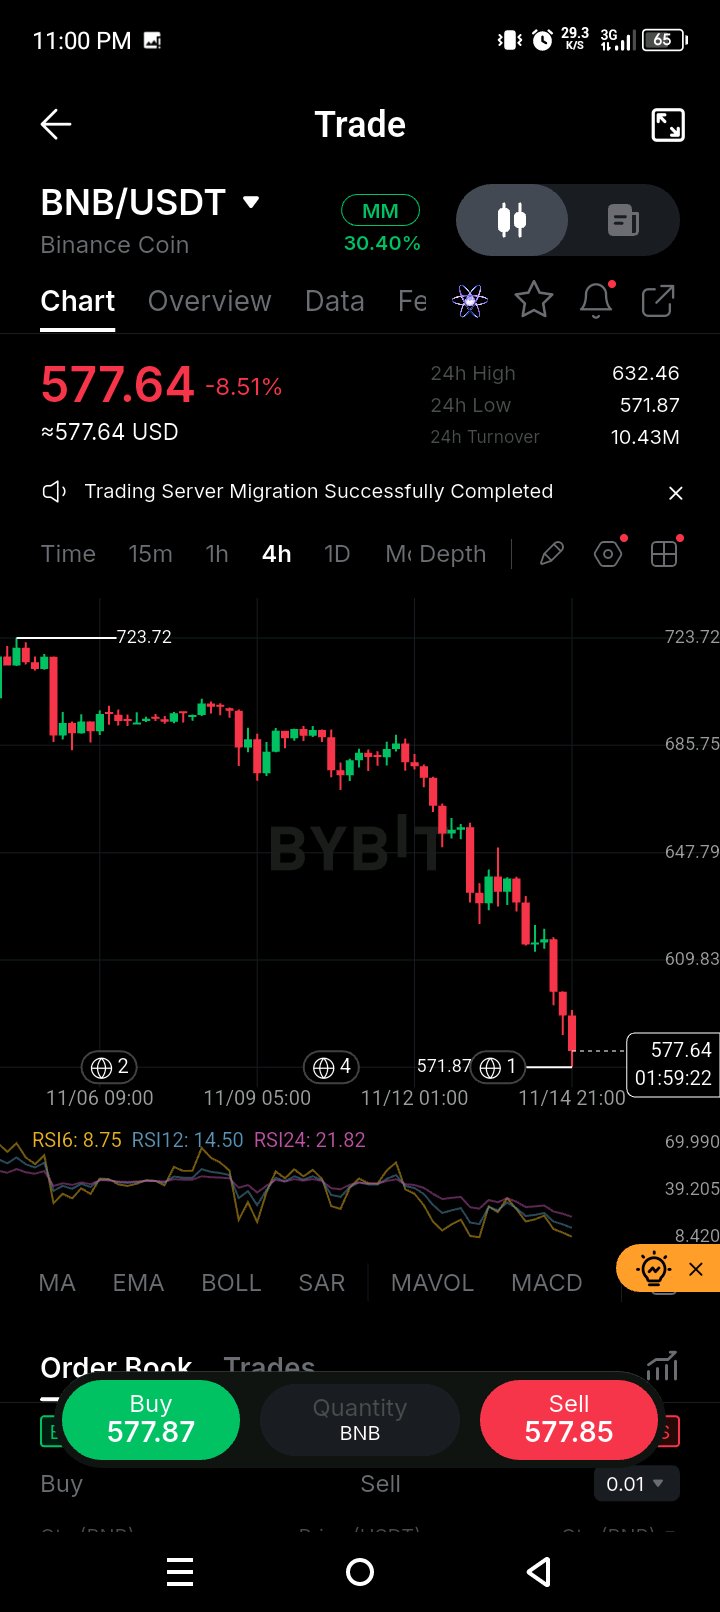
🚨 ¡BNB sufre un golpe fuerte! ¿Es $570 la próxima batalla clave? $BNBUSDT se enfrenta a una fuerte presión de venta, cotizando alrededor de $577.64, con una caída del 8.51% en la gráfica de 4H. 📉 Esto es lo que nos dice la gráfica: 🔹 Tendencia bajista: Velas rojas consecutivas fuertes muestran que los vendedores están dominando el mercado. 🔹 RSI sobrevendido: El RSI6 está alrededor de 8.75, RSI12 en 14.50 y RSI24 en 21.82. La presión de venta es extrema, pero las condiciones de sobreventa no garantizan un rebote inmediato. 🔹 Soporte clave: $571.87 es el mínimo reciente a vigilar. Una ruptura podría exponer a BNB a mayores caídas. 🔹 Resistencia: $609.83 es el primer nivel de recuperación importante, seguido de $647.79. 📊 Mi observación: BNB necesita mostrar una clara fuerza de compra antes de que se pueda considerar una reversión alcista. ⚠️ No te apresures a entrar en un mercado en caída. Proteger el capital es más importante que atrapar cada bajada. ¿Crees que $BNB rebotará desde los $570 o seguirá bajando? #ByXIMPACT $BNBUSDT
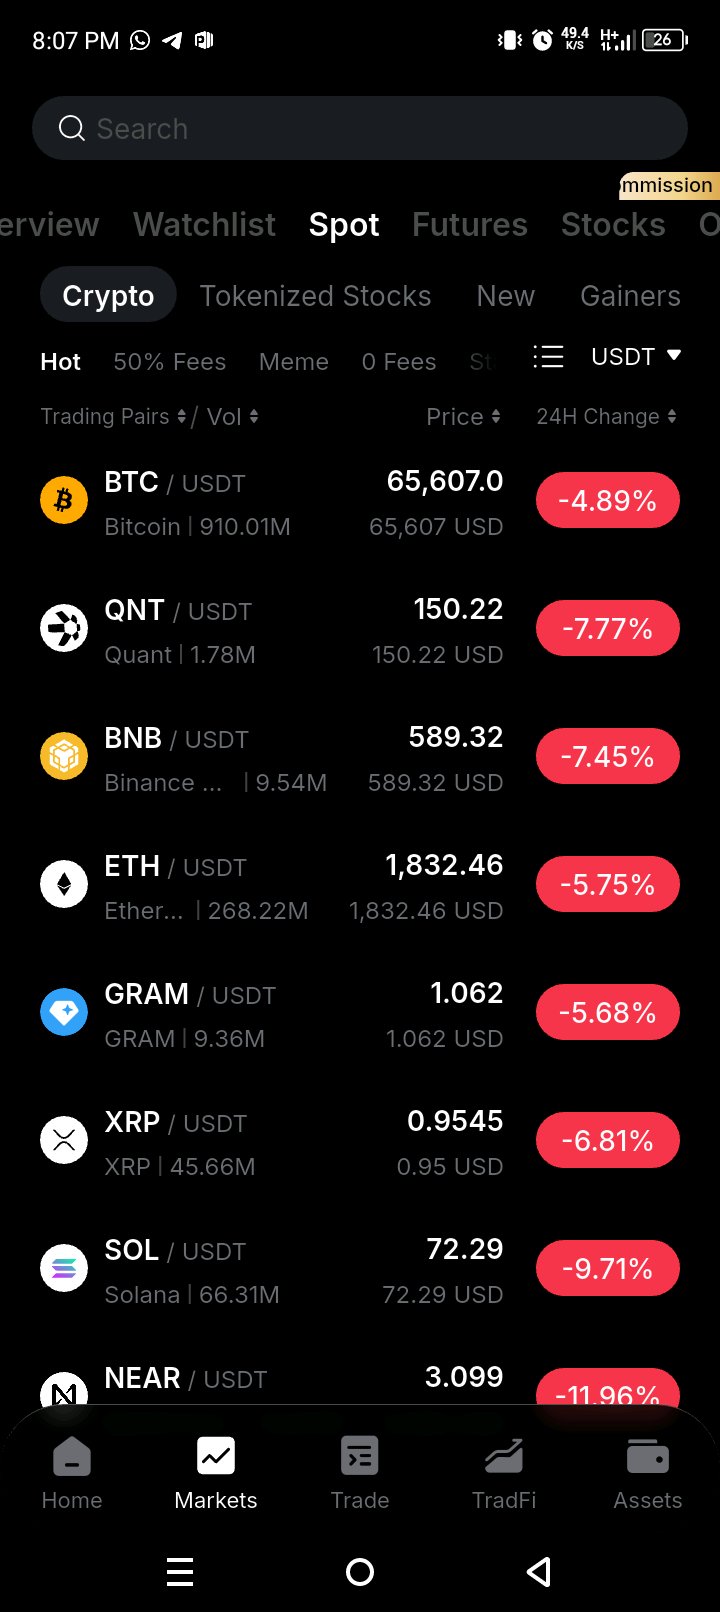
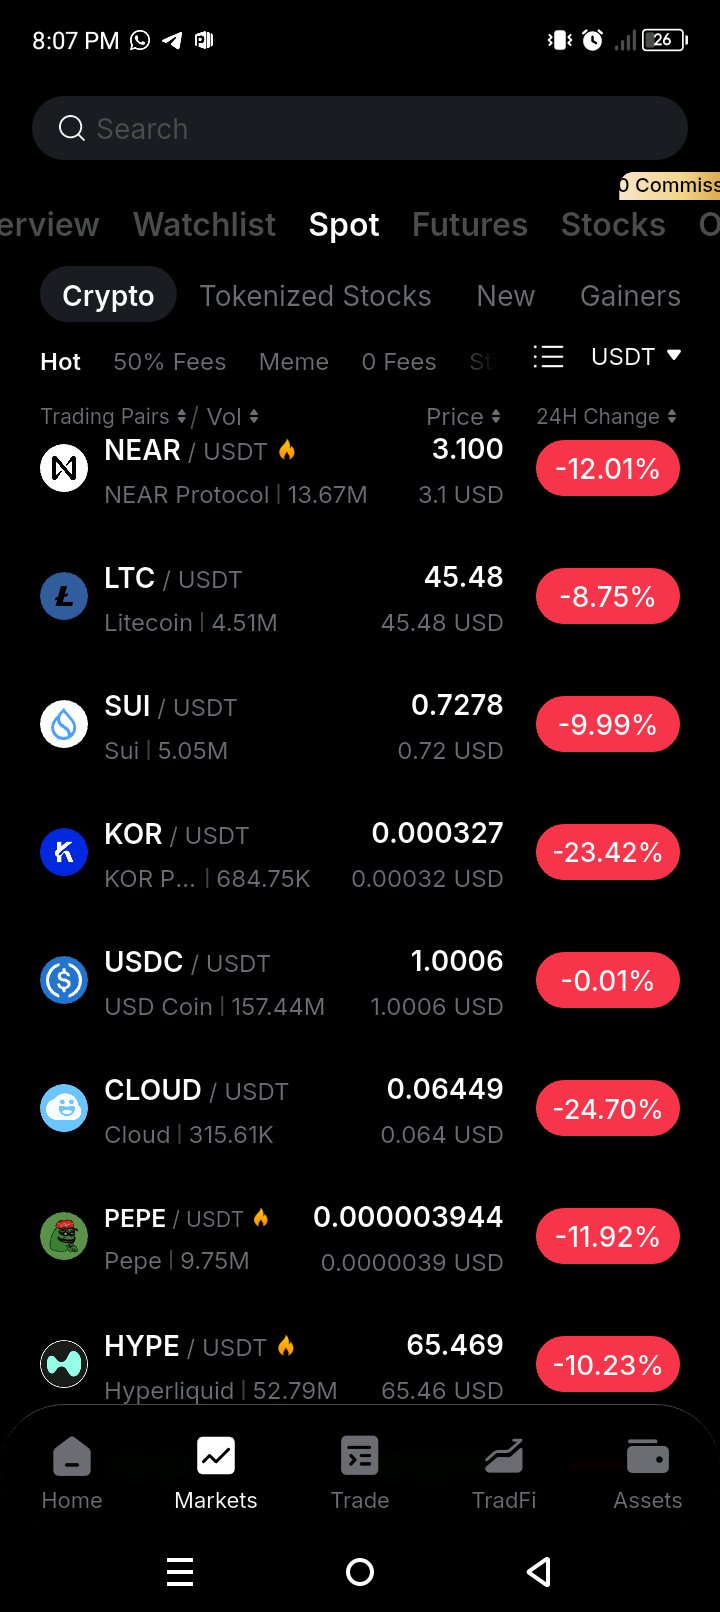
CRYPTO MARKET UNDER PRESSURE: BTC, ETH AND ALTS ARE BLEEDING! The market is facing another wave of selling pressure. $BTCUSDT is moving lower, $ETHUSDT has dropped to around $1,832 on the 4H chart, and many altcoins are following the same bearish direction. What this tells us: 🔹 Bitcoin: Weak BTC momentum is putting pressure on the wider crypto market. 🔹 Ethereum: is down 5.56%, with RSI readings around 20–27, showing strong selling pressure. 🔹 Altcoins: Many altcoins are also struggling as market confidence weakens. 🔹 Key ETH support: $1,810 is an important level to watch. A breakdown could bring further downside. 🔹 Market outlook: A relief bounce is possible, but oversold conditions alone do not confirm a reversal. My strategy in this market is simple: ⚠️ Avoid panic trading. 📊 Wait for confirmation. 🛡️ Protect capital before chasing opportunities. Sometimes, staying out of the market is also a trading decision. Do you think this is a buying opportunity, or should traders remain patient? #BitcoinHitsTwoMonthLowAfterUSMidterms $ETHUSDT $BTCUSDT
$NIGHT stairs up from 0.0408, wick at 0.0513
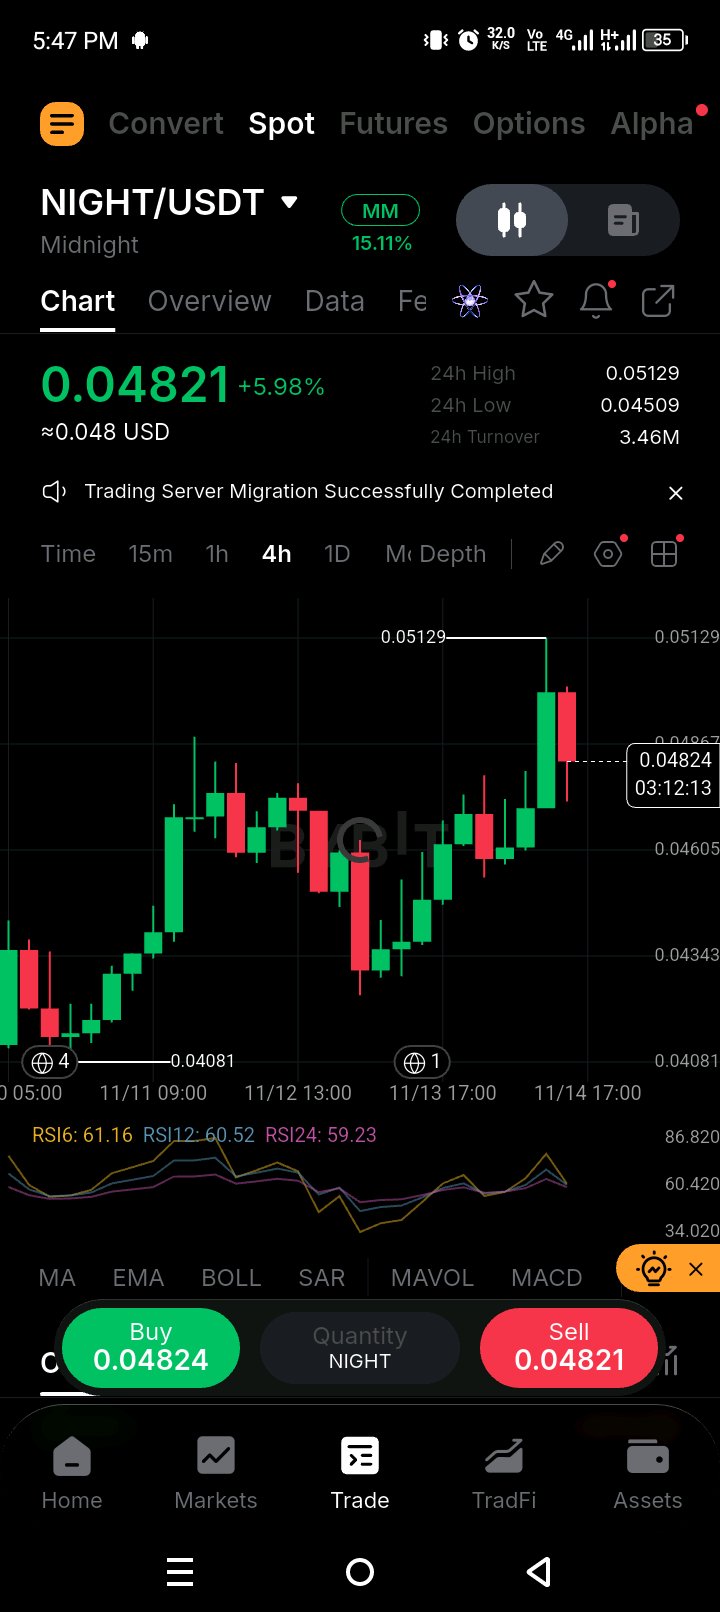
$NIGHTUSDT is up 5.98% to 0.04821 after a clean staircase of higher lows off 0.04081, but the latest candle left a long upper wick near 0.05129, so the real question is whether buyers can hold the pullback or that wick marks a short-term top. The move has been steady, with each dip bought higher than the last. The sequence was a base at 0.04081, a climb to the 0.047 area, a dip to about 0.0455 that got bought, and then a strong green candle that tagged 0.05129 before the next candle gave part of it back. RSI is balanced at 59-61 across all three, so momentum agrees with price and nothing is stretched. There are no moving averages on this chart, so the structure comes from the higher lows alone. 0.0451-0.0460 is the level that matters on a pullback, since the 24h low sits at 0.04509 and the last dip was bought there. Hold it and another try at 0.05129 is possible, with a close above it opening fresh air. Lose 0.0451 and the higher-low structure fails, with 0.04081 as the floor. I would wait for a close above 0.05129 before trusting a breakout. #ByXIMPACT $NIGHTUSDT
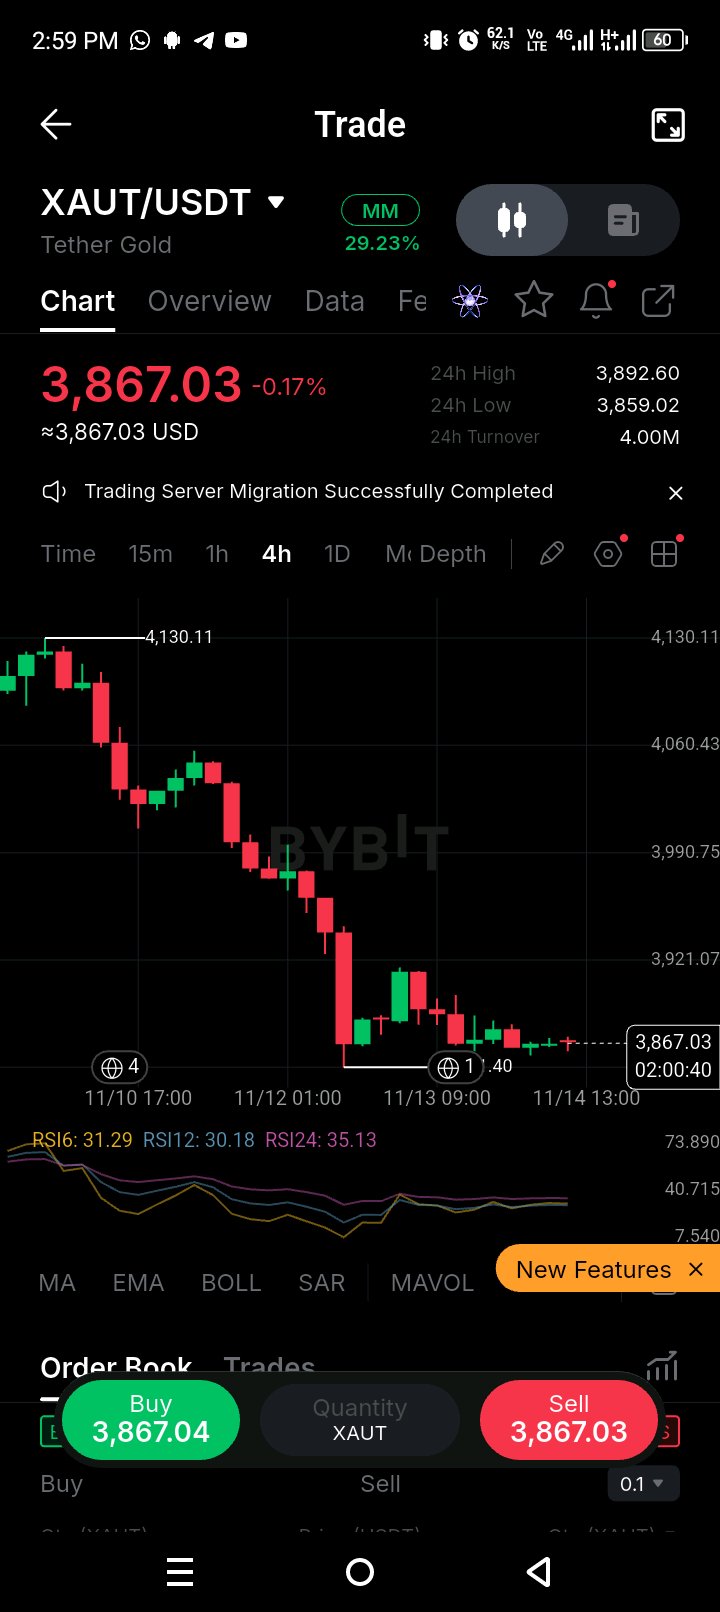
$XAUT loses 3,872 and goes quiet near 3,860
$XAUTUSDT is at 3,867.03 and trading in a tight range under 3,893 after the 3,872 base I flagged in my last gold post gave way, so the real question is whether this quiet stretch is a base forming or just a pause before the next leg lower. I said losing 3,872 would mean the base had failed, and price has now spent days sitting just below it. The sequence was a rejection at 4,130.11, a long run of lower highs through 4,060 and 3,990, a heavy red candle down toward the 3,850s, a small bounce to about 3,950, and then a series of tiny candles around 3,860-3,893. The latest candles are almost flat, which means selling has dried up but buyers have not stepped in. RSI is low at 30-35 across all three, so selling is stretched without being extreme. 3,859 is the level that matters, since it is the 24h low and the floor of this tight range. Hold it and a bounce toward 3,921 is possible, with the old 3,872 base now acting as resistance. Lose 3,859 and there is no support shown on this chart. Tight ranges after a drop like this usually end with a sharp move, so I would wait for the break instead of guessing its direction. #ByXIMPACT $XAUTUSDT
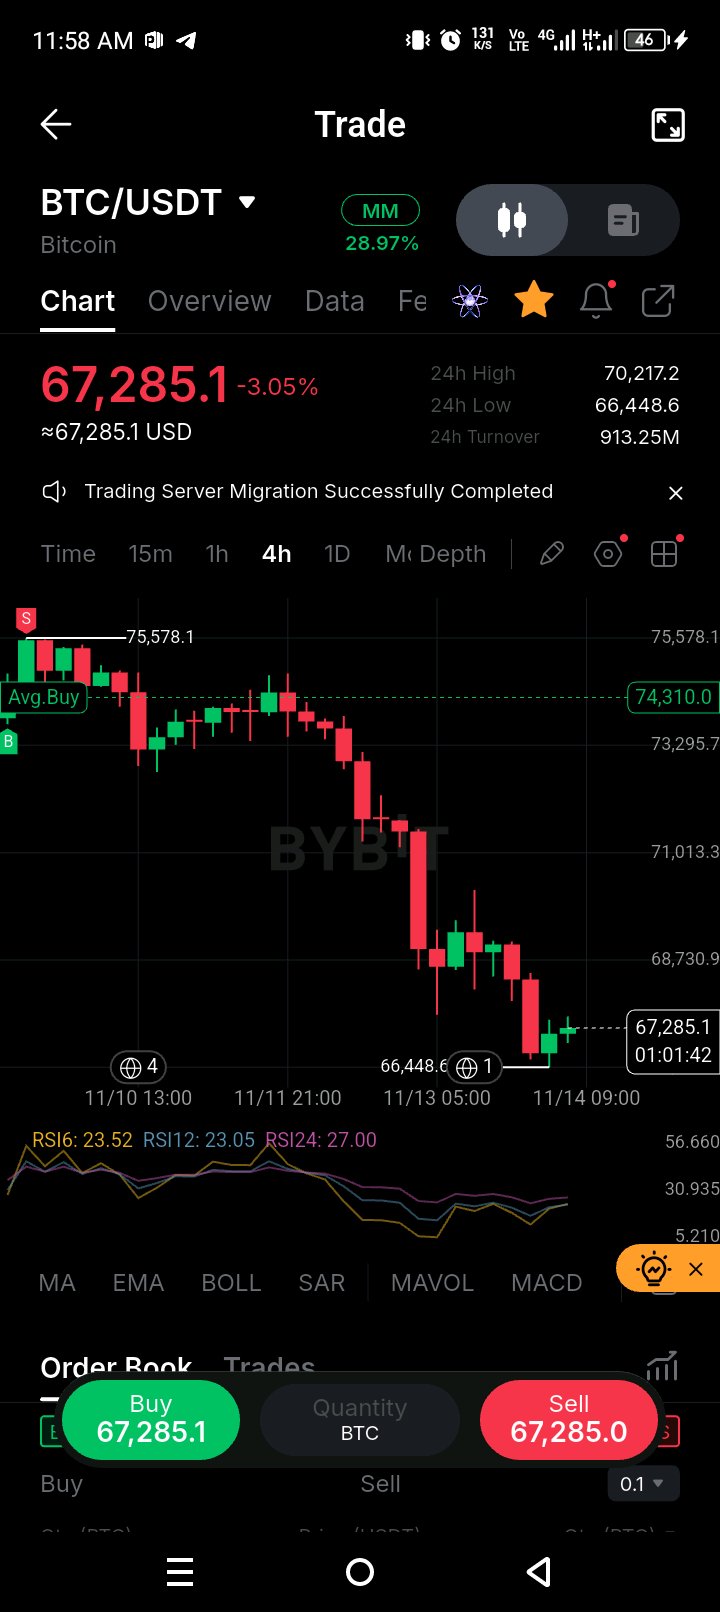
$BTC loses 74.8k and flushes to 66.4k
$BTCUSDT is at 67,285, down 3.05% on the day, after the 74,871 low I flagged in my last two posts finally gave way and price flushed all the way to 66,448.6, so the real question is whether this is a capitulation low or the first leg of a deeper move. I said losing 74,871 would leave no structure on the chart, and that is what has played out, with price now about 10% below it. The sequence was a rejection at 75,578, a heavy red candle through 73-71k, a failed bounce, a second leg to the 68,730 area, and then a final drop to 66,448.6 before a small bounce. RSI is deeply oversold at 23-27 across all three, which means selling is stretched on every timeframe, but oversold can stay oversold when a level this big breaks. The bounce so far is only two small green candles. 66,448 is the level that matters, since it is the low of the flush. Hold it and a bounce toward 68,730 and then 71,000 is possible, with the old 74,871 floor now acting as resistance. Lose 66,448 and there is no support shown on this chart. I would not try to catch the bottom here and would wait for a higher low or a close above 68,730 before trusting any recovery. #ByXIMPACT $BTCUSDT
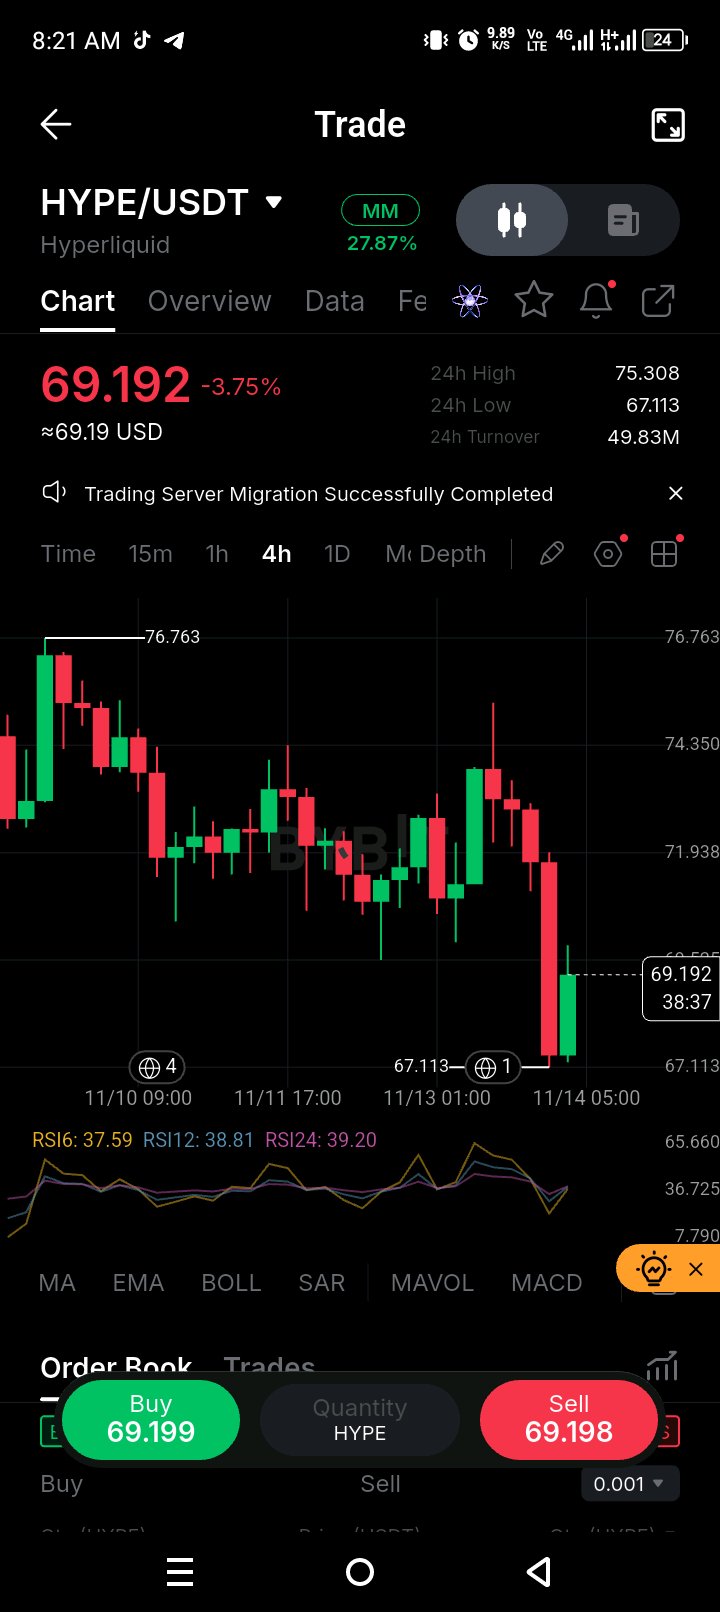
$HYPE breaks 69.5 and wicks to 67.1
$HYPEUSDT is at 69.192, down 3.75%, and the 69.526 double bottom I flagged in my last post has given way, with price wicking to 67.113 before a small bounce back to the old level. The real question is whether that wick marks a floor or 69.5 now becomes resistance on the way lower. I said losing 69.5 would leave no support on the chart, and that is what is playing out. The sequence was a rejection at 76.763, a slide with lower highs, a double bottom near 69.5, a bounce that tagged 75.308 and got sold, and then a heavy red candle through the floor to 67.113. The last candle is green and recovered part of the drop, but it closed right under 69.526. RSI is low at 38-39 across all three, which means selling is stretched without being extreme. 69.5 is the level that matters, since it just flipped from support to resistance. A 4H close back above it would turn the break into a fakeout, with 71.9 as the first target. Lose 67.113 and there is no support shown on this chart. I would not try to catch the bottom here and would wait for a reclaim of 69.5 before trusting any bounce. #ByXIMPACT $HYPEUSDT
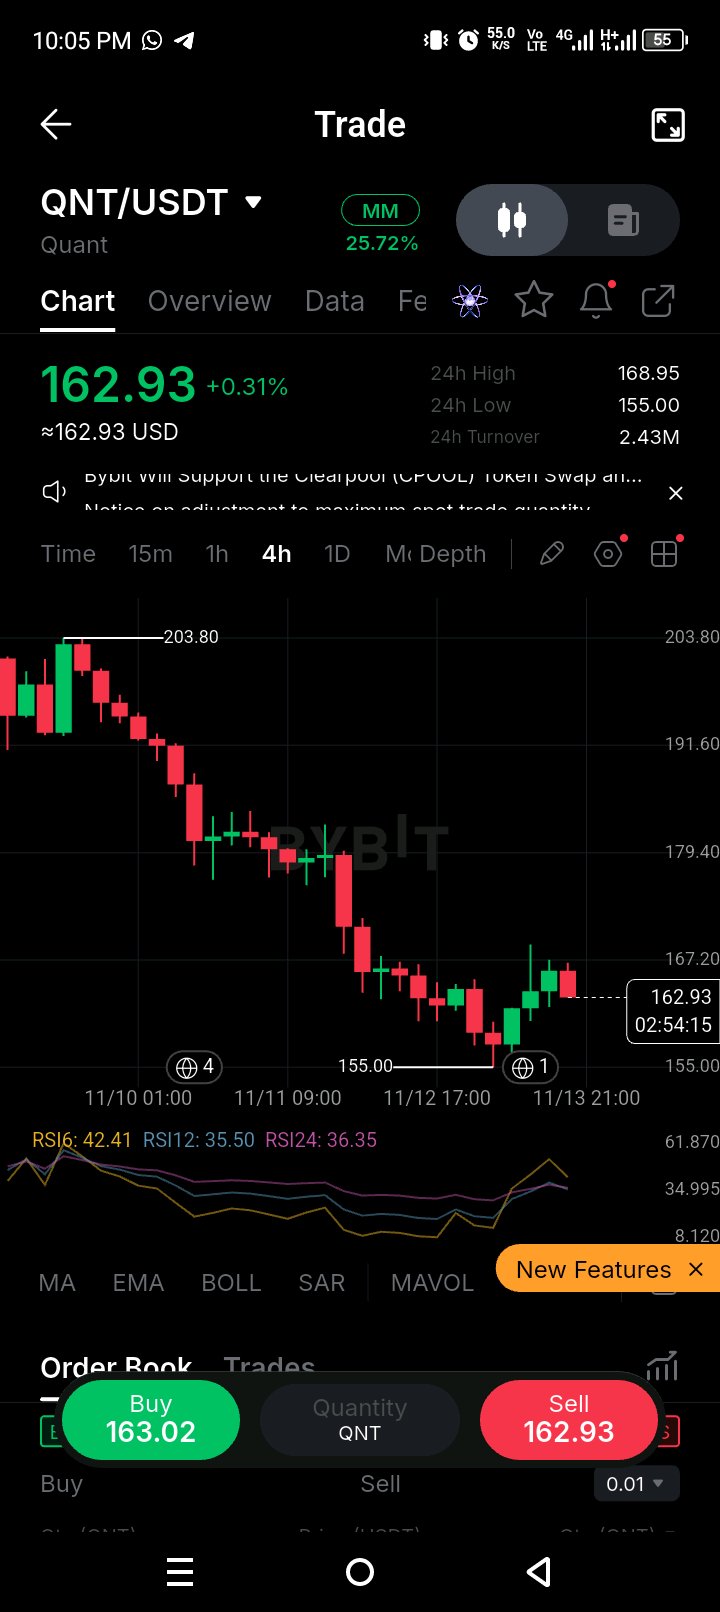
$QNT breaks 162.73 and finds a bid at 155
$QNTUSDT is at 162.93 and pulling back from a bounce that tagged 168.95, after the 162.73 low I flagged in my last post gave way and price flushed down to 155.00, so the real question is whether 155 holds or this slide keeps going with nothing left below. The bounce was strong, but the latest candle is red and price is already giving part of it back. The sequence was a rejection at 203.80, a long run of lower highs through 188 and 173.95, and then a flush to 155.00 that was bought quickly. Since then price has made two green candles and one red one, which is the first real attempt at a base in days. RSI6 has lifted to 42 while RSI12 (36) and RSI24 (36) are still low, so the fast line has turned but the broader momentum is still washed out. 155 is the level that matters, since it is the 24h low and the base of the whole move. Hold it and a push toward 168.95 and then 173.95, the old floor that is now resistance, is possible. Lose 155 and there is no structure shown below on this chart. I would not try to catch the bottom here and would wait for a higher low above 155 or a close above 168.95 before trusting any bounce. #ByXIMPACT $QNTUSDT
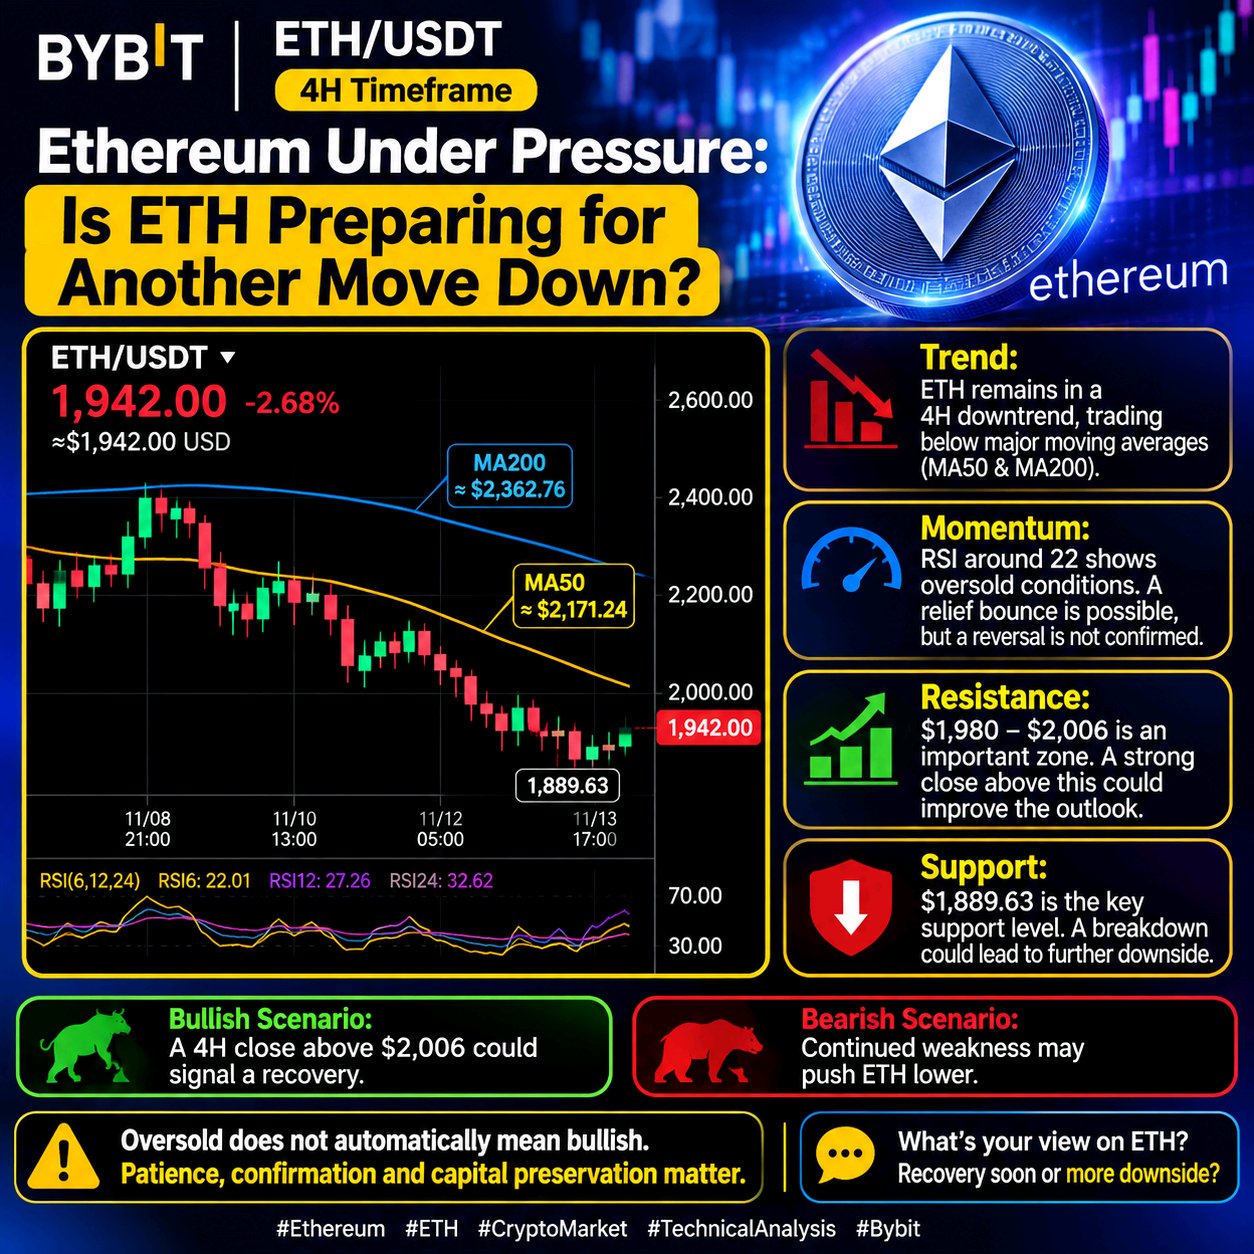
Ethereum Under Pressure: Is ETH Preparing for Another Move Down? $ETHUSDT is facing strong selling pressure, with the 4H chart showing a bearish market structure. Key things I'm watching: 🔹Trend: ETH remains in a 4H downtrend, with price trading below major moving averages. 🔹Momentum: RSI around 22 on the 4H chart indicates oversold conditions. A relief bounce is possible, but a reversal is not confirmed. 🔹Resistance: $1,980–$2,006 is an important zone to watch. Buyers need to reclaim this area to improve the short-term outlook. 🔹Bearish scenario: Continued weakness could expose ETH to further downside if sellers maintain control. 🔹Bullish scenario: A strong 4H close above resistance could signal improving momentum. Oversold does not automatically mean bullish. Patience, confirmation and capital preservation matter. What's your view on ETH: recovery soon or more downside ahead? #ByXIMPACT $ETHUSDT
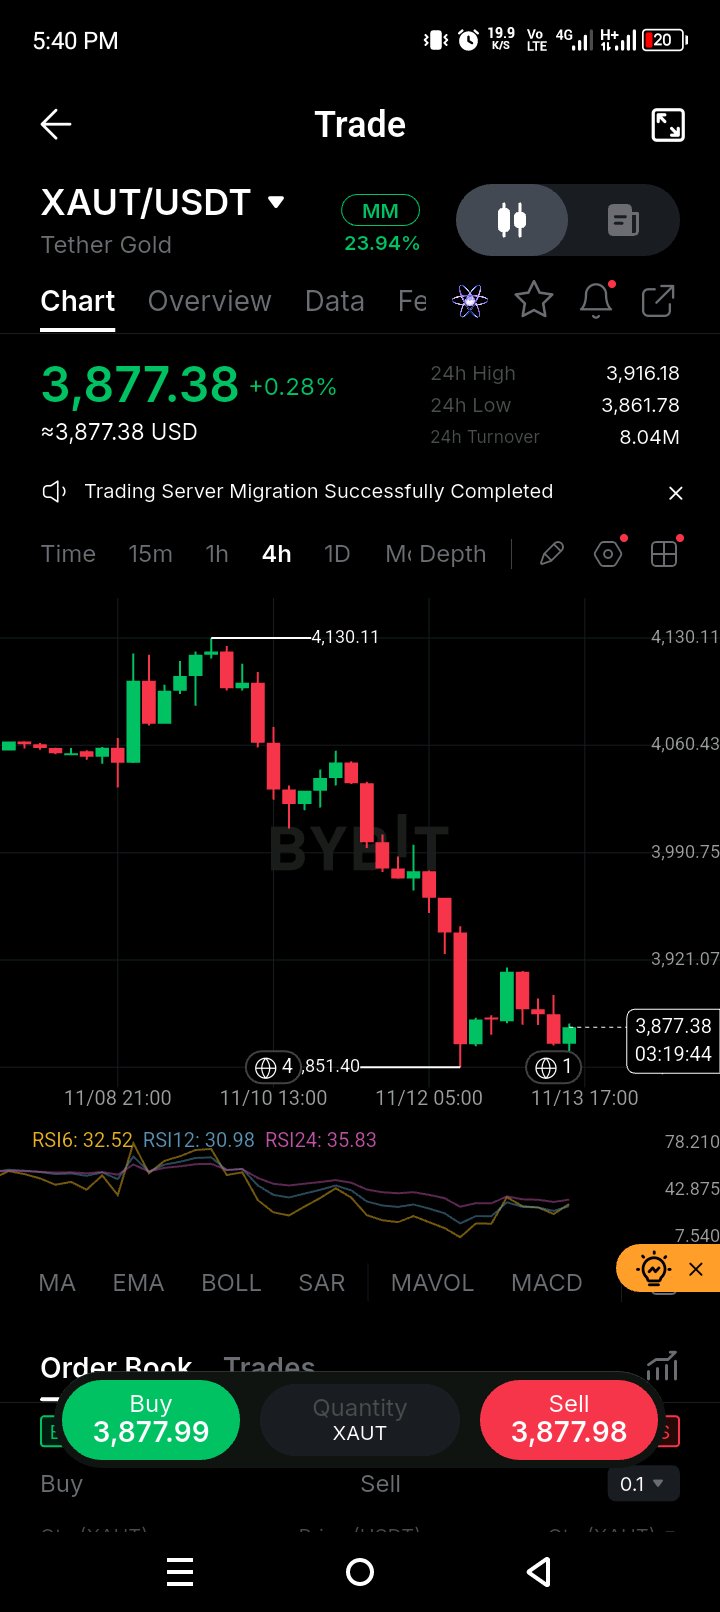
Gold-Backed $XAUT Faces Selling Pressure — Is a Recovery Ahead? $XAUTUSDT is trading around $3,877.38, up 0.28%, but the 4H chart still shows a broader downward trend. Key levels I'm watching: 🔹 Market structure: Price has fallen significantly from the recent high near $4,130.11. 🔹 Momentum: RSI readings around 31–36 indicate weak momentum, although a short-term recovery attempt is visible. 🔹 Support: $3,851.40 is the key recent low to watch. 🔹 Resistance: $3,921.07 is the first resistance area. A stronger recovery could face another challenge around $3,990.75. If buyers defend support, XAUT may attempt a recovery. However, a breakdown below $3,851 could bring more selling pressure. ⚠️ Remember: short-term price movements in gold-backed tokens can be volatile. Always manage your risk. Do you think $XAUT will recover or test lower levels first? #ByXIMPACT $XAUTUSDT
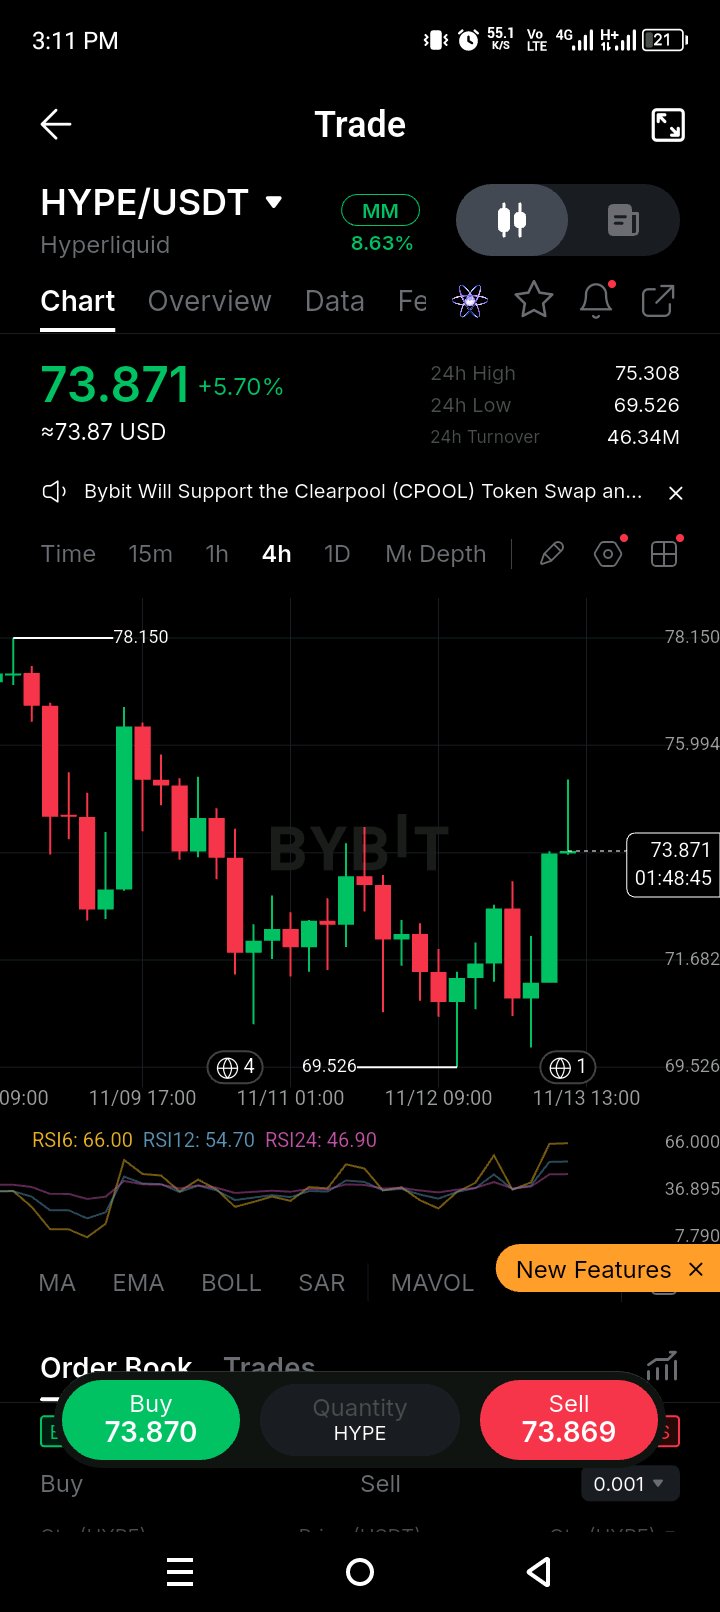
$HYPE loses the 84 zone, bounces off 69.5
$HYPEUSDT is up 5.70% to 73.871 and bouncing hard off the 69.526 low, so the real question is whether this double bottom holds or the rejection wick near 75.3 shows sellers are still waiting overhead. In my last HYPE posts I said losing the 83.8-85 retest zone would put the breakout in question, and that zone has failed, with price now about 12% below it. The sequence was a rejection at 78.150, a slide with lower highs down to 69.526, a small bounce, a second dip that held the same area, and then a strong green candle that recovered most of the drop. The long upper wick at 75.3 shows sellers stepped in right away. RSI6 has jumped to 66 while RSI12 (55) and RSI24 (47) are still catching up, so the fast line has turned but the broader momentum has not confirmed. 69.5 is the level that matters, since two separate dips have now held it. Hold it and a push toward 75.308 and then 75.994 is possible, with a close above 78.150 as the first real sign the structure has changed. Lose 69.5 and there is no support shown on this chart. I would wait for a close above 75.3 before trusting this as more than a bounce. #ByXIMPACT $HYPEUSDT
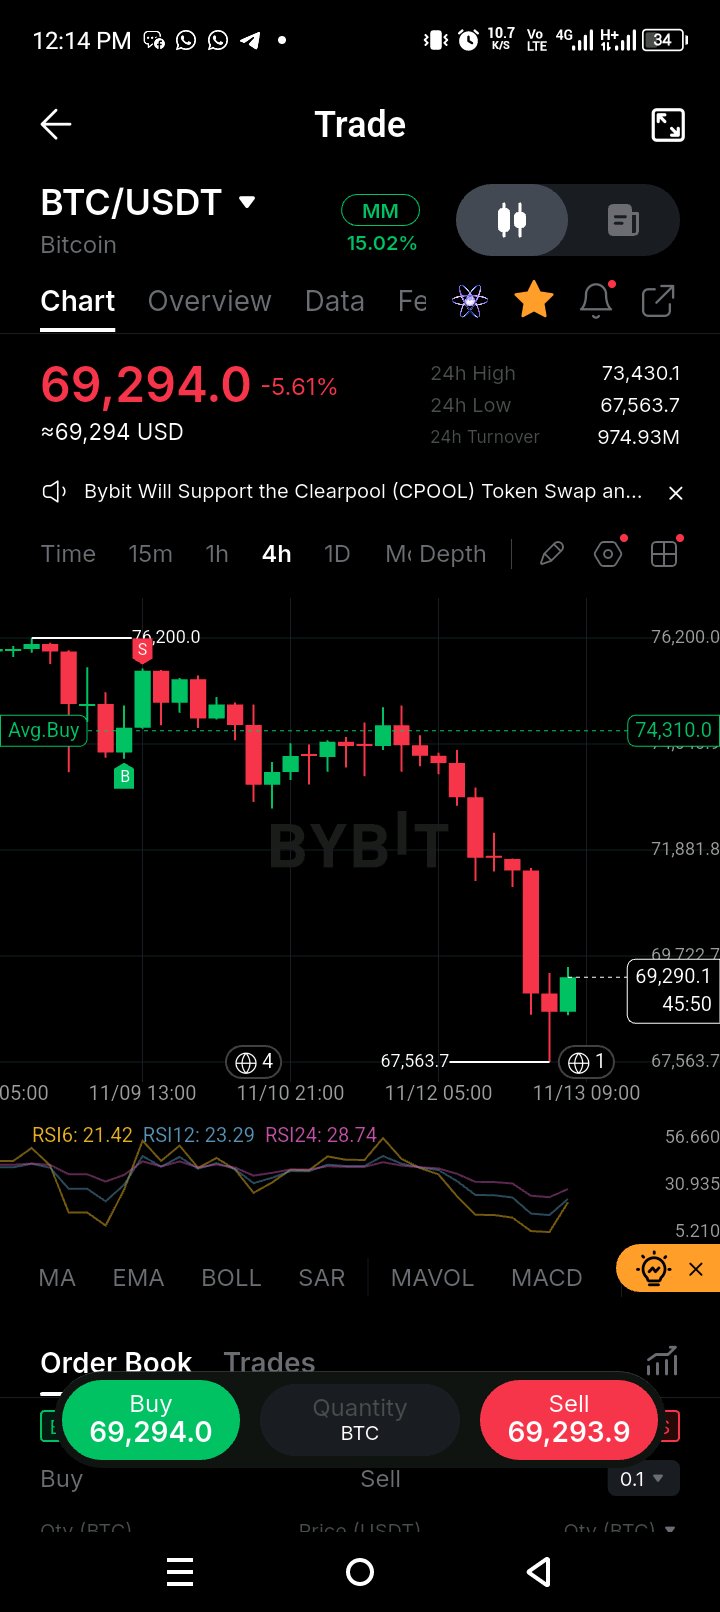
Bitcoin Drops Below $70K — Is a Relief Bounce Coming? $BTCUSDT is trading around $69,294, down 5.61% on the 4H chart. Sellers have taken strong control, pushing price sharply lower. What the chart shows: 🔹 Bearish momentum: BTC has broken below the $71,881 area and is trading under significant selling pressure. 🔹 Oversold conditions: RSI readings are around 21–29, suggesting strong downside momentum. A short-term bounce is possible, but a reversal is not confirmed. 🔹 Key support: $67,563 is the recent low to watch. 🔹 Resistance: $69,722 is the nearest visible level, followed by the $71,881 area. If support breaks, further downside is possible. If buyers defend it, BTC could attempt a relief rally. Oversold doesn't automatically mean it's time to buy. Risk management comes first. Do you expect BTC to bounce from $67.5K or continue falling? #ByXIMPACT $BTCUSDT
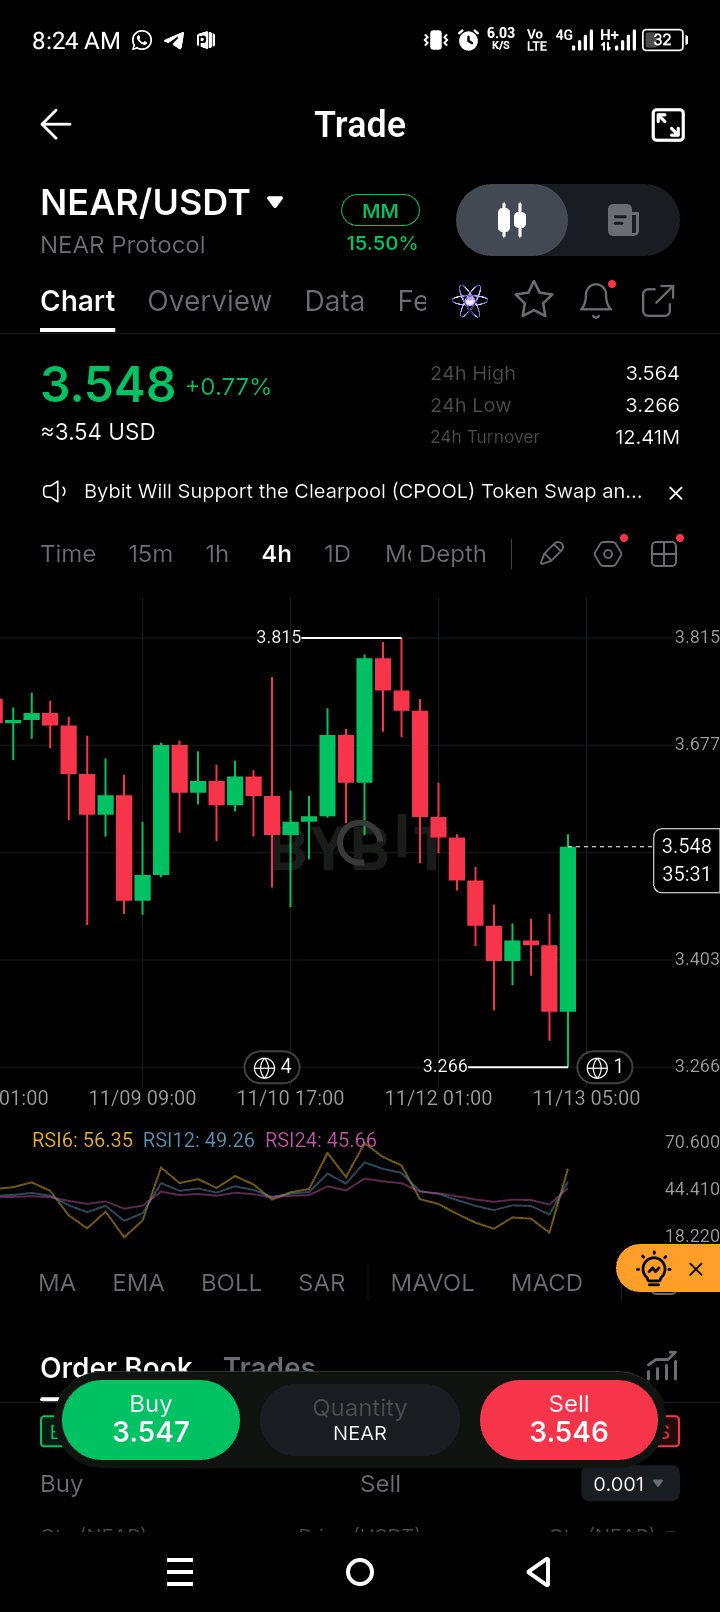
$NEAR snaps back from 3.266 with a long wick
$NEARUSDT is up 0.77% to 3.548 after one big green candle took it back from the 3.266 low, so the real question is whether that long lower wick marks a floor or just a relief bounce inside a lower-high structure. In my last NEAR post price was pressing the MA200 at 3.78, and it got rejected at 3.815 and gave the whole move back. The sequence was a rejection at 3.815, a run of red candles with lower highs, a sharp flush to 3.266, and then a strong reversal candle that closed near its high and recovered most of the drop. RSI6 has lifted to 56 while RSI12 (49) and RSI24 (46) are still neutral, so the fast line has turned but the broader momentum has not caught up yet. 3.266 is the level that matters, since the wick defines the floor. Hold it and a bounce toward 3.677 is possible, though 3.564, the 24h high, is the first level to retake. Lose 3.266 and there is no structure shown below on this chart. I would wait for a close above 3.564 before treating this as more than a one-candle bounce. #ByXIMPACT $NEARUSDT
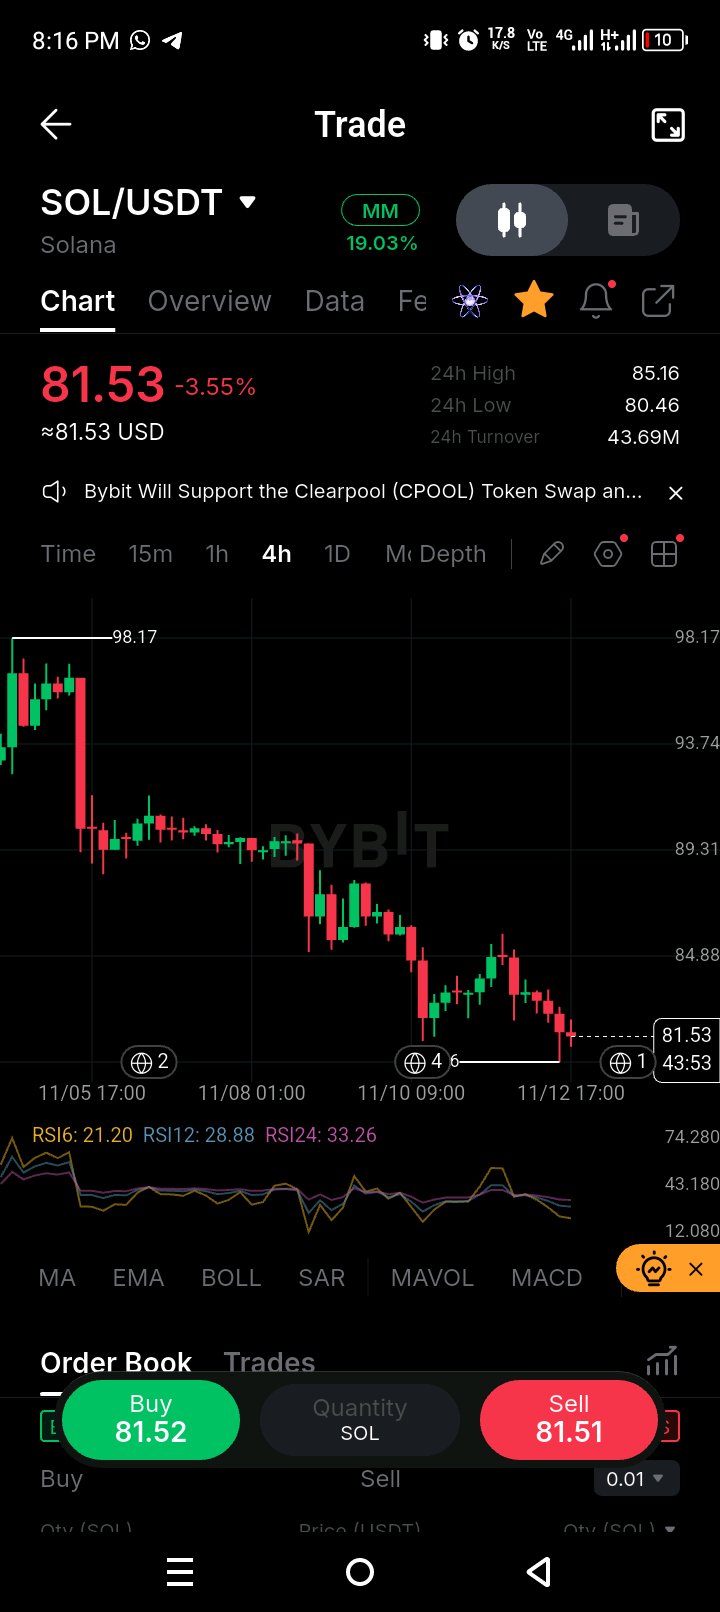
$SOLUSDT Technical Analysis (4H Chart) Current Price: $81.53 (-3.55%) 24h High / Low: $85.16 / $80.46 24h Turnover: 43.69M USDT Market Structure & Price Action * Bearish Trend: On the 4-hour timeframe, SOL/USDT remains in a clear downtrend after failing to hold above the $98.17 high and breaking down through the $89–$90 consolidation zone. * Lower Highs & Lower Lows: After bouncing off the recent swing low near $80.46, price attempted a recovery toward the $84.88–$85.16 area before facing fresh selling pressure, forming a lower high and drifting back toward key support. Technical Indicators (RSI) * RSI(6): 21.20 (Oversold) * RSI(12): 28.88 (Oversold) * RSI(24): 33.26 (Approaching Oversold) Both the short-term RSI(6) and RSI(12) are sitting deep in oversold territory below 30. While overall momentum favors sellers, this reading suggests selling pressure may be overextended in the short term, opening the door for a technical relief bounce or consolidation if buyers defend support. Key Levels to Watch * Immediate Support: $80.46 (24h Low) — A critical floor holding current price action. * Major Psychological Support: $80.00 — A confirmed 4H candle close below $80.00 could trigger further downside continuation. * Immediate Resistance: $84.88 – $85.16 (Recent swing high & 24h High). * Major Resistance: $89.31 — Previous breakdown zone that bulls must reclaim to shift short-term structure. Trading Outlook & Scenarios * Bullish Relief Scenario: If buyers hold the $80.00–$80.46 support zone and oversold RSI triggers a bounce, look for a retest of $84.88–$85.16. Breaking above $85.20 with strong volume opens a path toward $89.31. * Bearish Continuation Scenario: If $80.00 fails to hold on a 4H close, expect sellers to remain in control with potential downside liquidity sweeps below $78.00–$75.00. Disclaimer: This analysis is for informational and educational purposes only—not financial advice. Always manage your risk and wait for candle confirmation before entering trades. #ByXIMPACT $SOLUSDT
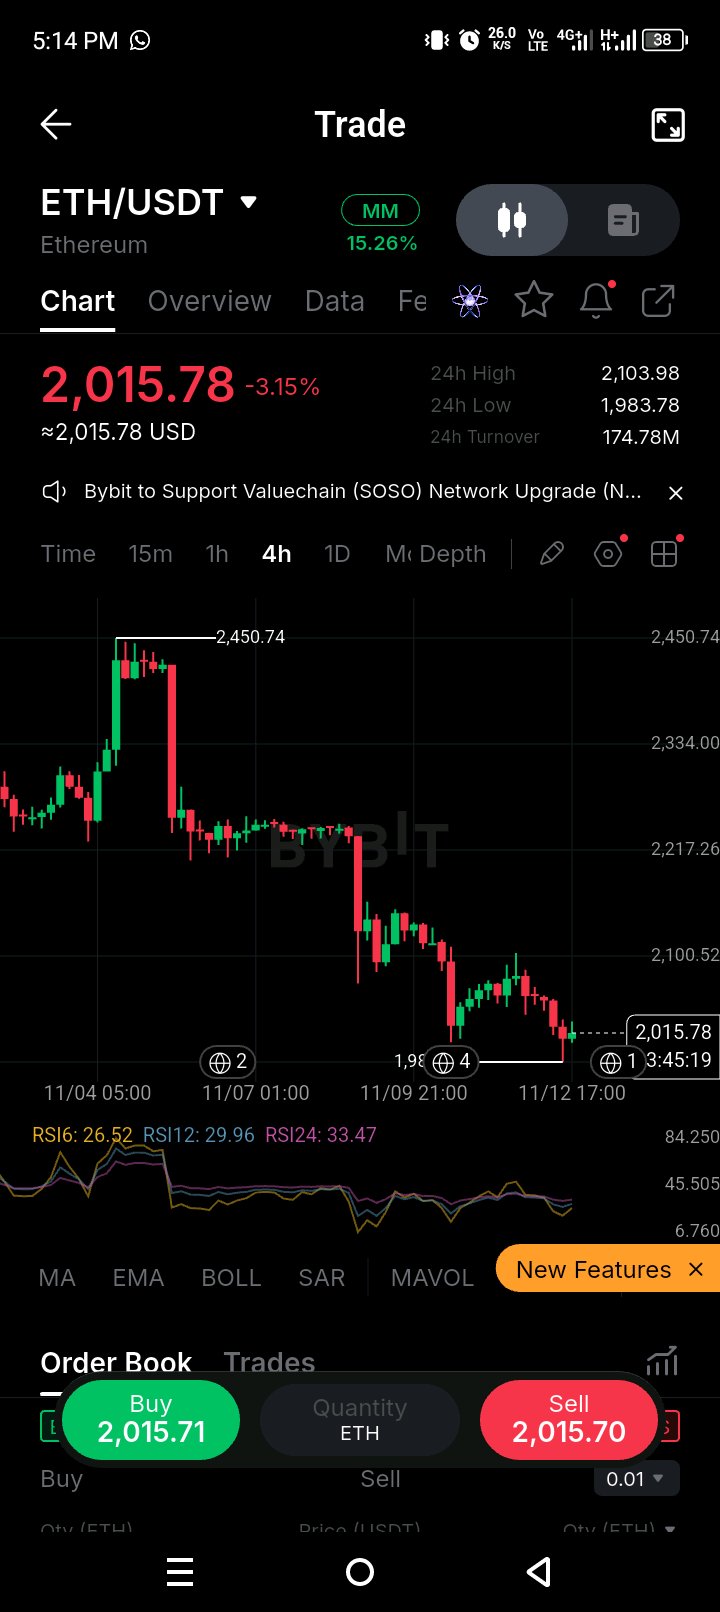
$ETH loses 2,005 and wicks to 1,983
$ETHUSDT is at 2,015.78, down 3.15%, and it has just wicked through the 2,005 low I flagged in my last post down to 1,983.78 before bouncing back above it, so the real question is whether that wick is a final shakeout or the start of a deeper leg. In my last ETH posts I said there was no structure shown below 2,005, and that is now playing out. The sequence was a rejection at 2,450.74, a quiet base near 2,250, one heavy red candle through it, a failed bounce to about 2,150, and then a second leg down to 1,983.78. The lower highs on every bounce show sellers are still in control. RSI is low at 27-33 across all three, which means selling is stretched, but oversold can stay oversold in a trend like this. 2,005 is the level that matters, now as resistance, since price just reclaimed it from the wick. Hold above it and a bounce toward 2,100 is possible, with the 2,103.98 24h high as the first real test. Lose 1,983 and there is no support shown on this chart. I would not try to catch the bottom here and would wait for a base with higher lows or a close back above 2,100. #ByXIMPACT $ETHUSDT