Shugaba1717
2652Me gusta1Compartir en el chat192Aficionados3Seguir
trader
trader
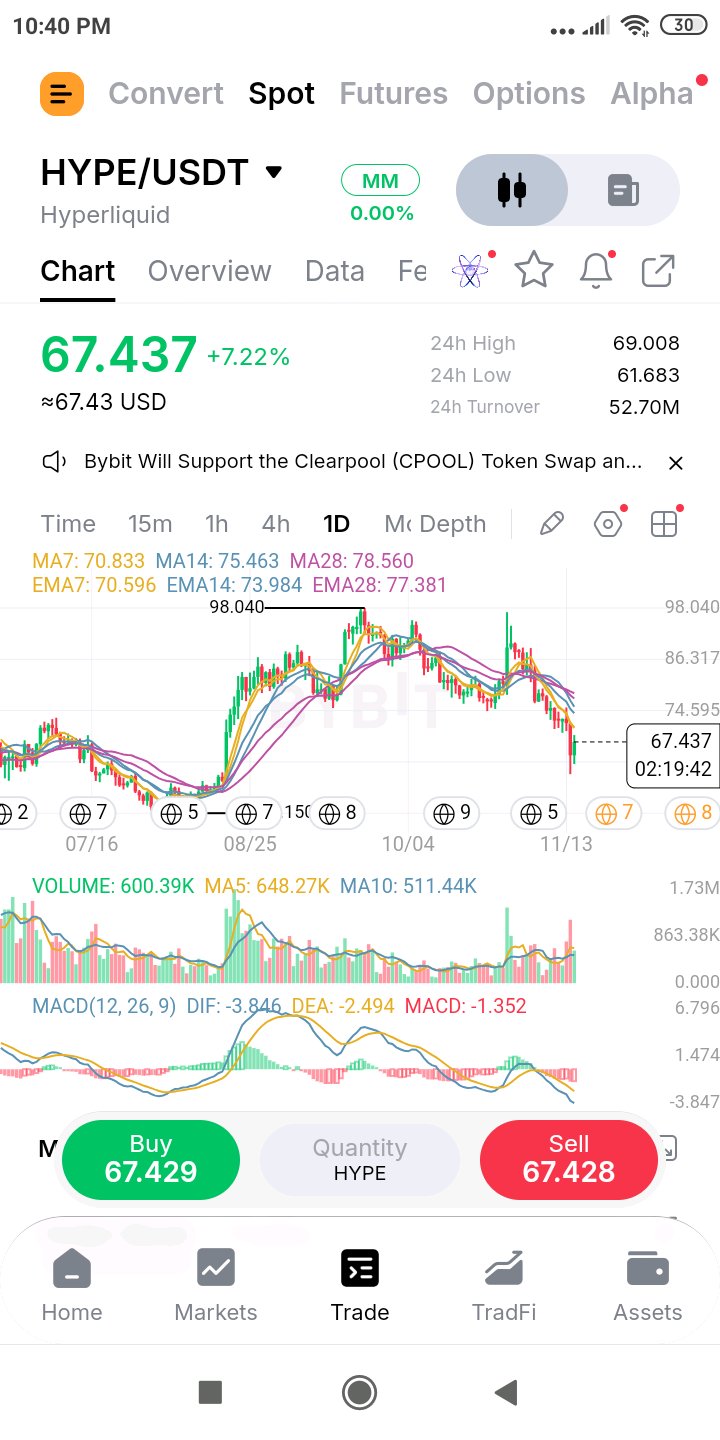
$HYPEUSDT rebotó un 9% desde un mínimo que se mantuvo justo por encima del 0.786 y se estancó 0.05 por debajo del 0.618 roto, así que ahora el retesteo decidirá. Contexto HYPE marcó una mecha hasta 61.683, solo 0.5 por encima del retroceso 0.786 en 61.18, luego subió hasta un máximo de 69.008, 0.05 corto del 0.618 roto en 69.06, y cotiza a 67.437 (+7.22% en las últimas 24h móviles). Eso está aproximadamente un 31% por debajo del pico de 98.04, con aproximadamente el 65% del avance desde 51.15 retrocedido. Todos los seis promedios siguen estando por encima: EMA7 70.596, MA7 70.833, EMA14 73.984, MA14 75.463, EMA28 77.381 y MA28 78.560, con las de 7 periodos un 4.7-5% por encima del precio, las de 14 un 10-12% y las de 28 un 15-16%. El MACD (DIF -3.846, DEA -2.494, histograma -1.352) está en su lectura más baja en este gráfico, por lo que el impulso no ha cambiado. La vela diaria es verde hasta ahora, con una larga mecha inferior. Volumen de negociación El volumen de 24h es de 52.70M USDT (aproximadamente 800K HYPE) en un rango de 24h de 61.683 a 69.008, alrededor de un 12%. Ese total móvil es aproximadamente 1.6 veces el promedio de 10 días, mayormente por la fuerte venta al principio del periodo. La vela de hoy es de 600.39K con unas 2.3 horas restantes, encaminada a unos 665K, en línea con el promedio de 5 días (648.27K) y por encima del de 10 días (511.44K). Así que el rebote es con volumen ordinario, no un pico. Mantener un Fibonacci clave y rebotar es bueno, pero un rebote que no puede superar el 0.618 roto en un día fuerte aún no es una reversión. Soporte y resistencia Soporte: 61.68 (mínimo de 24h), 61.18 (0.786), 60.00 (número redondo), luego la base de 51.15. Resistencia: 69.01 (máximo de 24h), 69.06 (el 0.618 roto), 70.00 (número redondo), 70.60-70.83 (EMA7 y MA7), 73.98 (EMA14), 74.595 (0.5), 75.46 (MA14), 77.38-78.56 (las de 28), 80.13 (0.382), 86.97 (0.236), luego 97-98.04. Nivel a vigilar 61.18 abajo y 69.06-70.00 arriba. Un cierre diario por encima de 70.9 despeja el 0.618, el número redondo 70 y ambas medias de 7 en un solo movimiento. Un cierre diario por debajo de 61.18 cede la zona del 0.786. Consideración Volver a probar un nivel roto desde abajo es donde las tendencias bajistas suelen fallar, y esta se estancó por unos centavos. Las de 7 están justo encima, en 70.6-70.8, así que hay un techo acumulado en un rango de unos 2.5 puntos. Trataría el rebote del 9% como una reacción en el soporte, no como un cambio de tendencia, hasta que un cierre diario supere los 70.9. Plan de trading Retesteo del mínimo: comprar en 61.7-63.0 (la zona de barrido y el 0.786), stop por debajo de 59.9, unos 2.4 de riesgo desde 62.3. Los objetivos son 69.06 y 74.6, aproximadamente 2.8R y 5.1R. Reclamación: esperar un cierre diario por encima de 70.9, comprar el retesteo de 70.0-70.9, stop por debajo de 68.3, unos 2.2 de riesgo desde 70.5. Los objetivos son 74.6 y 80.13, aproximadamente 1.9R y 4.4R. No voy a comprar en 67.4 por debajo del 0.618 y el número redondo 70. Un stop por debajo de 61.2 arriesgaría unos 6.2 para ganar unos 1.6 hasta el 0.618 y 3.2 hasta las de 7, aproximadamente medio R en el mejor de los casos. Inválido si Un cierre diario por debajo de 61.18 cede la zona del 0.786, con 51.15 como siguiente, un 16% más abajo, y preferiría mantenerme al margen antes que promediar a la baja. La idea de retesteo del mínimo muere por debajo de 59.9, y la idea de reclamación muere con un cierre diario por debajo de 68.3. El escenario bajista sigue al mando hasta un cierre diario por encima de 75.5, la MA14. Nota de riesgo HYPE ha estado variando entre un 10-12% diario últimamente, así que reduce el tamaño de las posiciones y usa órdenes límite. A la vela de hoy todavía le quedan unas 2 horas, así que el volumen y el precio cambiarán antes del cierre. Los niveles Fibonacci son zonas, no garantías. Los niveles se leen desde mi gráfico. Solo es una idea, no un consejo financiero. ¿Reversión o un retesteo que falla? Un cierre diario por encima de 70.9 o por debajo de 61.18 lo dirá. $ByXIMPACT
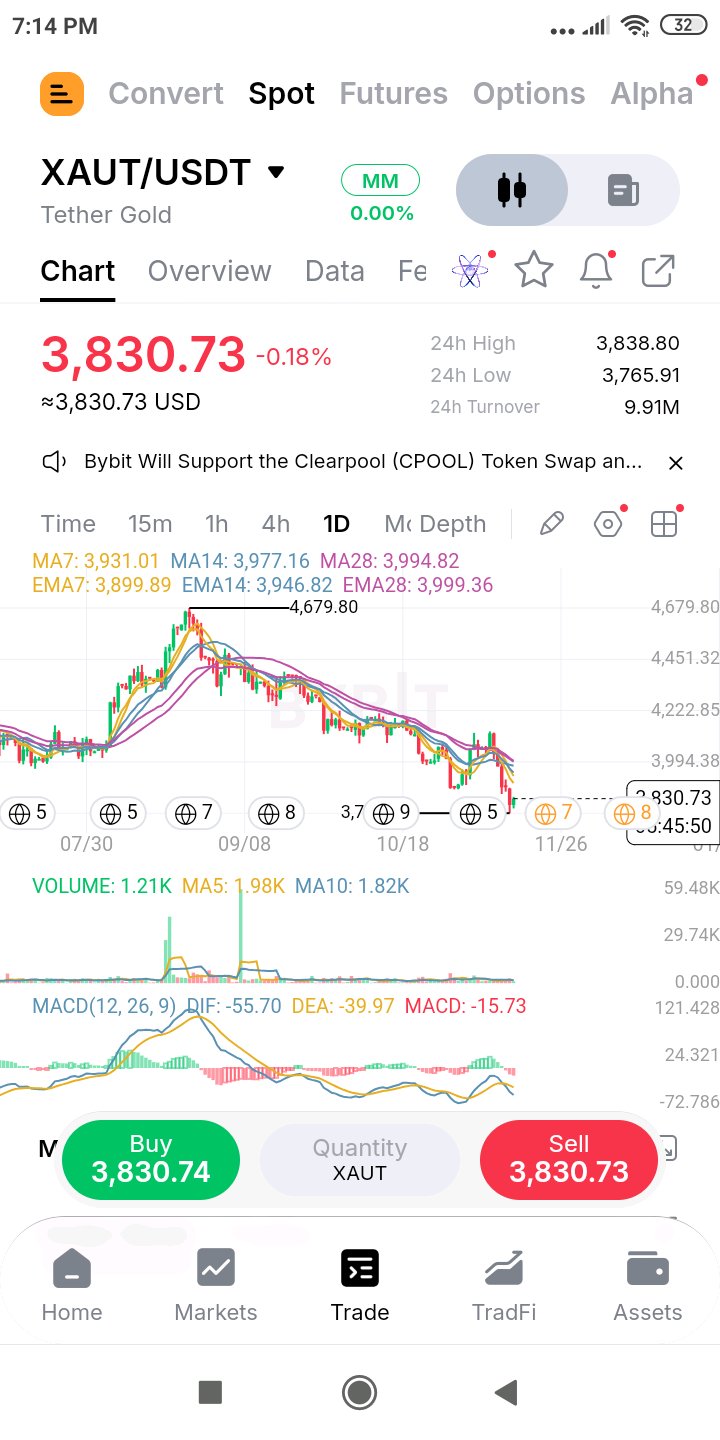
$XAUTUSDT undercut 3,800 and bounced, but it's the fourth lower low in under three weeks, and buying the old low has been punished each time. Context Today's low of 3,765.91 undercut the 3,800 round number and the 3,805 low, then price recovered 1.7% to 3,830.73 (-0.18% on the rolling 24h). The staircase is clear: 3,872, then 3,851, then 3,805, now 3,766, each about 1% lower than the last, and each one was undercut before the bounce. Price is 18% under the 4,679.80 peak and under all six averages: EMA7 3,899.89, MA7 3,931.01, EMA14 3,946.82, MA14 3,977.16, MA28 3,994.82 and EMA28 3,999.36. They are packed into a 99-point band that starts 1.8% above price and ends 4.4% above it. MACD (DIF -55.70, DEA -39.97, histogram -15.73) is turning down again. The daily candle is green so far. Turnover and volume 24h turnover is 9.91M USDT, roughly 2,600 XAUT, about 1.4x the 10-day average (1.82K), on a 24h range of 3,765.91 to 3,838.80, about 1.9%. Today's own candle is lighter: 1.21K with about 5.8 hours left, on pace for roughly 1.6K, under both the 5-day (1.98K) and 10-day averages. The heavier trading sits in the earlier part of the rolling 24 hours, so today's sweep came on below-average participation. A sweep without a volume spike is not a washout, and I haven't seen the flush that usually marks a low. Support and resistance Support: 3,766 (24h low), 3,700 (round number), and nothing marked on this chart below. Resistance: 3,805 and 3,800 (the broken low and round number), 3,839 (24h high), 3,851-3,872 (the broken October lows), 3,900 (EMA7), 3,931 (MA7), 3,947-3,999 (EMA14, MA14, MA28 and EMA28, with the 0.236 bounce level at 3,982), 4,115 (0.382), 4,223 (0.5), then the 4,679.80 peak. The bounce levels are measured from the new low, so treat them as provisional. Level to watch 3,766 below and 3,935 above. A daily close under 3,766 makes it a fifth lower low. A daily close above 3,935 clears both 7s and is the first real change in structure. Consideration Buying right at the old low has lost money four times running, because each low got undercut by about 1% first. That says to wait for a higher low or a reclaim instead of guessing the bottom. The six averages sit in one 99-point band, so a bounce that clears the 7s has a compact target, but also a wall of supply right behind it. Trade plan Low retest: buy 3,766-3,800, stop under 3,735, about 50 of risk from 3,785. Targets are 3,900 and 3,977, roughly 2.3R and 3.8R. Reclaim: wait for a daily close above 3,935, buy the retest of 3,900-3,935, stop under 3,860, about 65 of risk from 3,925. Targets are 4,115 and 4,223, roughly 2.9R and 4.6R. I'm not buying 3,831 under a band of six averages. A stop under 3,735 risks about 96 to make about 69 to the EMA7, under 1R. Invalid if A daily close under 3,766 makes a fifth lower low, with the 3,700 round number as the only reference below, and I'd stand aside rather than catch it. The low-retest idea is dead under 3,735, and the reclaim idea is dead on a daily close back under 3,860. The bearish structure stays in charge until a daily close above 4,000, above every average. Risk note XAUT follows gold, so a macro headline can gap price through any level, and turnover around 10M means market orders can slip, so use limits. Today's candle still has about 6 hours left, so judge on the close. Levels are read off my chart. Idea only, not financial advice. A fifth lower low or the first higher low? A daily close above 3,935 or under 3,766 will say. #ByXIMPACT
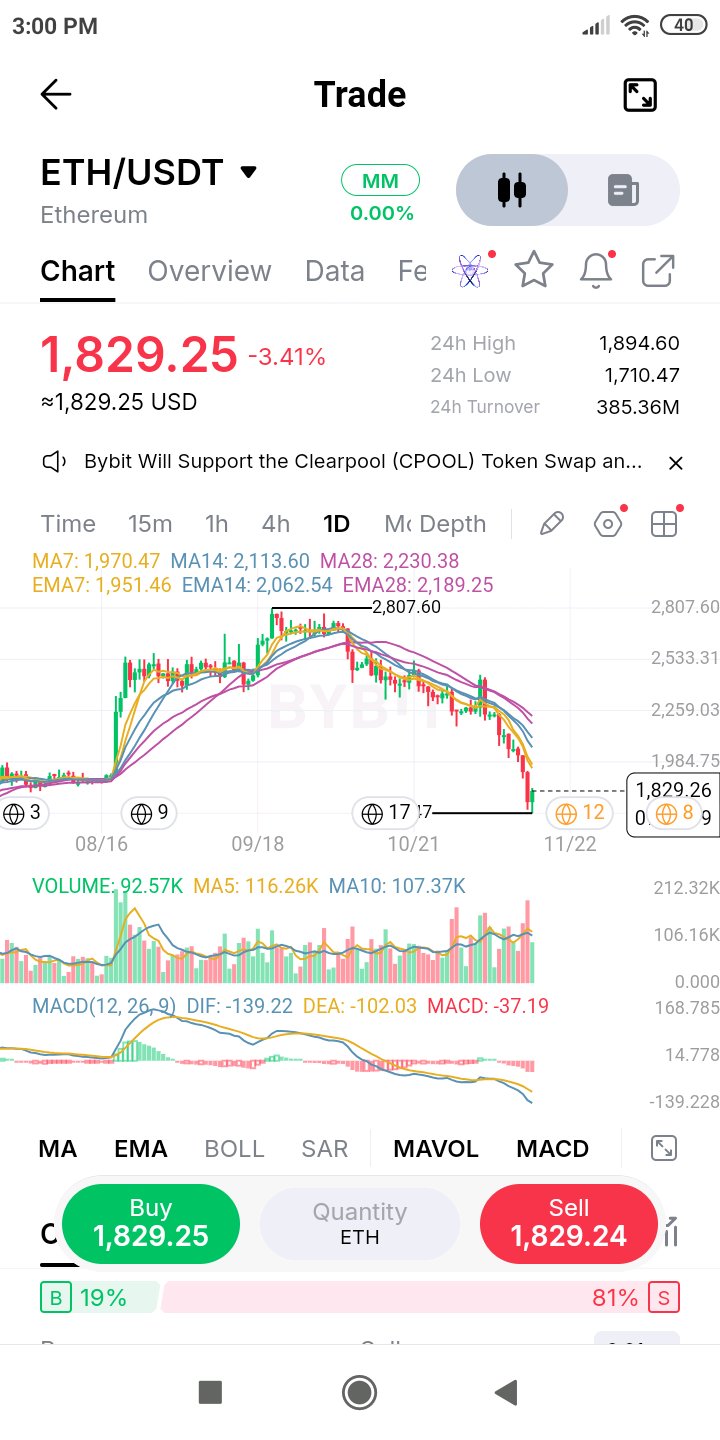
$ETHUSDT swept the 1,773 July low by about 3.5% and reclaimed it on double normal volume, so the daily close around 1,773 decides if this was capitulation. Context ETH wicked to 1,710.47, undercutting the 1,773.41 July low, then reclaimed it and recovered 6.9% to 1,829.25 (-3.41% on the rolling 24h). That is the lowest print on this chart window, which goes back to late July, and it puts price about 35% under the 2,807.60 peak, with the low itself 39% under. All six averages are overhead: EMA7 1,951.46, MA7 1,970.47, EMA14 2,062.54, MA14 2,113.60, EMA28 2,189.25 and MA28 2,230.38, with the 7s 6.7-7.7% above price and the 28s 20-22%. MACD (DIF -139.22, DEA -102.03, histogram -37.19) is at its lowest reading on this chart. The daily candle is green so far, with a long lower wick. Turnover and volume 24h turnover is 385.36M USDT, roughly 214K ETH, about 2x the 10-day average (107.37K), on a 24h range of 1,710.47 to 1,894.60, roughly 10.8%. Daily volume is 92.57K about 14 hours in, on pace for roughly 160K, 1.4-1.5x both the 5-day (116.26K) and 10-day averages. Double-normal rolling volume, a long wick through a major low and a 7% bounce is capitulation behavior, but it needs a quiet retest to be confirmed. The order book showed 81% of its visible size on the ask when I took this chart, so sellers are still leaning on it. Support and resistance Support: 1,800 (round number), 1,773 (the July low, reclaimed), 1,710.47 (the wick low), 1,700 (round number), and no marked structure below on this chart. Resistance: 1,894.60 (24h high), 1,900 (round number), 1,951-1,970 (EMA7 and MA7, with the 0.236 bounce level at 1,969), 2,000 (round number), 2,063 (EMA14), 2,114 (MA14), 2,130 (0.382), 2,189-2,230 (the 28s), 2,259 (0.5), then the 2,807.60 peak. The bounce levels are measured from the new low, so treat them as provisional. Level to watch 1,773 below and 1,975 above. A daily close above 1,773 keeps the July low reclaimed. A daily close above 1,975 clears both 7s and the 0.236 in one move. Consideration Sweeping and reclaiming a multi-month low on double volume is the shape of capitulation, but three things stand against trusting it yet. The book is 81% ask, the 7s sit 6.7-7.7% overhead, and MACD is still widening. The first test is whether 1,773 holds on a daily close. Without that, this is just a bounce. Trade plan July-low retest: buy 1,775-1,830, stop under 1,690 (below the wick low), about 110 of risk from 1,800. Targets are 1,970 and 2,130, roughly 1.5R and 3.0R. Reclaim: wait for a daily close above 1,975, buy the retest of 1,951-1,975, stop under 1,900, about 65 of risk from 1,965. Targets are 2,130 and 2,259, roughly 2.5R and 4.5R. I'm not buying 1,829 into an 81% ask book. A stop under 1,690 risks about 139 to make about 122-141 to the 7s, only about 1R. Invalid if A daily close under 1,773 turns the reclaim into a failed one, with the 1,710 wick low and 1,700 as the only references, and I'd stand aside rather than catch it. The retest idea is dead under 1,690, and the reclaim idea is dead on a daily close back under 1,900. The downtrend stays in charge until a daily close above 2,114. Risk note A 10% daily range means cut size, use limit orders, and expect wicks through levels. Liquidation cascades can run price through any zone. Today's candle still has about 10 hours left, so volume and price will shift by the close. Fib levels are zones, not guarantees. Levels are read off my chart. Idea only, not financial advice. Capitulation or just a lower step? A daily close back above 1,975 or under 1,773 will say. #ByXIMPACT
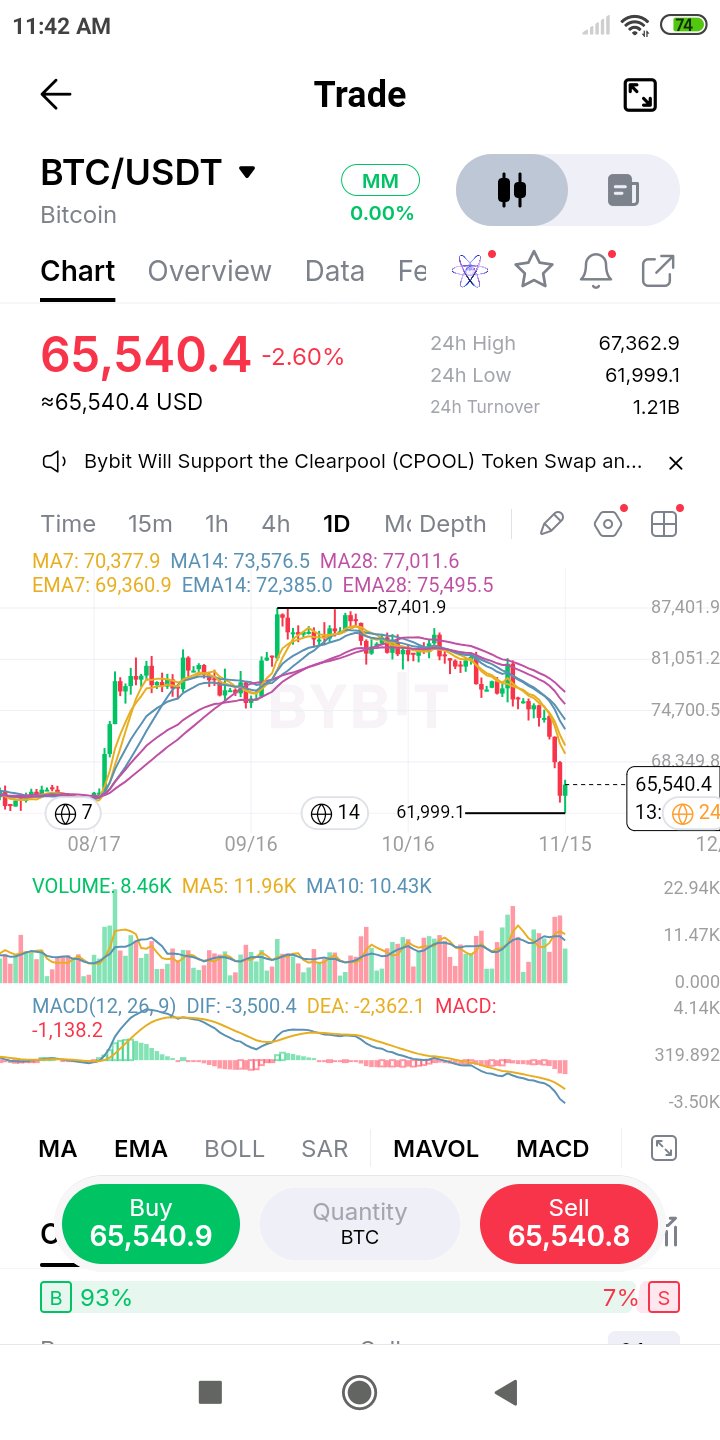
$BTCUSDT swept the 62,270 August base by about 270 points and snapped back 5.7% on nearly double normal volume, and the close decides whether it was a spring or just a pause. Context BTC wicked to 61,999.1 today, undercutting the August base, then recovered to 65,540.4 (-2.60% on the rolling 24h). That is the lowest print on this chart window, which goes back to August, and it puts price 25% under the 87,401.9 peak, with the low itself 29% under. BTC has retraced about 87% of the advance from the base. All six averages are overhead: EMA7 69,360.9, MA7 70,377.9, EMA14 72,385.0, MA14 73,576.5, EMA28 75,495.5 and MA28 77,011.6, with the 7s 5.8-7.4% above price and the 28s 15-17.5%. MACD (DIF -3,500.4, DEA -2,362.1, histogram -1,138.2) is at its lowest reading and still widening. The daily candle is green so far, with a long lower wick. Turnover and volume 24h turnover is 1.21B USDT, roughly 18.7K BTC, about 1.8x the 10-day average (10.43K), on a 24h range of 61,999 to 67,363, about 8.7%. Daily volume is 8.46K about 10.7 hours in, on pace for roughly 19K, 1.6-1.8x the 5-day (11.96K) and 10-day averages. The order book showed 93% of its visible size on the bid when I took this chart, which after a flush often means the asks got thin, so I treat it as a snapshot, not a signal. Heavy volume plus a long wick through a major base looks like capitulation, but it stays unconfirmed until the close and a quiet retest. Support and resistance Support: 65,000 (round number), 62,270 (the August base, reclaimed), 61,999 (the wick low), 60,000 (round number), then the 57,800 area from the earlier, wider chart. Resistance: 66,000 (round number), 67,363 (24h high), 67,650 (the 0.786), 68,000, 69,361-70,378 (EMA7 and MA7, with 70,000), 71,872 (0.618), 72,385-73,577 (EMA14 and MA14), 74,837 (0.5), 75,496-77,012 (the 28s), then the 87,401.9 peak. Level to watch 62,270 below and 67,650 above. A daily close above 62,270 turns the sweep into a reclaimed base. A daily close above 67,650 takes back the 0.786 and today's high, which is what would start to change the structure. Consideration A sweep of a major base followed by a sharp reclaim is the shape of a spring, but the daily candle is not done yet, and the averages stack 5.8-17.5% overhead. A green hammer only matters with follow-through, and the first resistance at 66,000-67,650 is close. I'd rather buy a quiet retest of the base than the bounce itself. Trade plan Base retest: buy 62,300-63,500, stop under 61,600 (below the wick low), about 1,300 of risk from 62,900. Targets are 67,648 and 70,378, roughly 3.7R and 5.8R. Reclaim: wait for a daily close above 67,650, buy the retest of 66,800-67,650, stop under 65,500, about 1,800 of risk from 67,300. Targets are 71,872 and 74,837, roughly 2.5R and 4.2R. I'm not buying 65,540 after a 5.7% bounce off the wick. A stop under 61,600 risks about 3,940 to make about 2,100 to the 0.786, roughly half an R. Invalid if A daily close under 62,270 turns the wick into a real break of the August base, with 60,000 next and then the 57,800 area, about 7% lower, and I'd stand aside rather than catch it. The base-retest idea is dead under 61,600, and the reclaim idea is dead on a daily close back under 65,500. The downtrend stays in charge until a daily close above 73,600. Risk note A wick through a major base means volatility is high, so cut size and use limit orders. Liquidation cascades can run price through any level. Today's candle still has about 13 hours left, so volume and price will shift by the close. Fib levels are zones, not guarantees, and they are measured from the August base. Levels are read off my chart. Idea only, not financial advice. Spring or just a pause before 60,000? A daily close back above 67,650 or under 62,270 will say. #ByXIMPACT
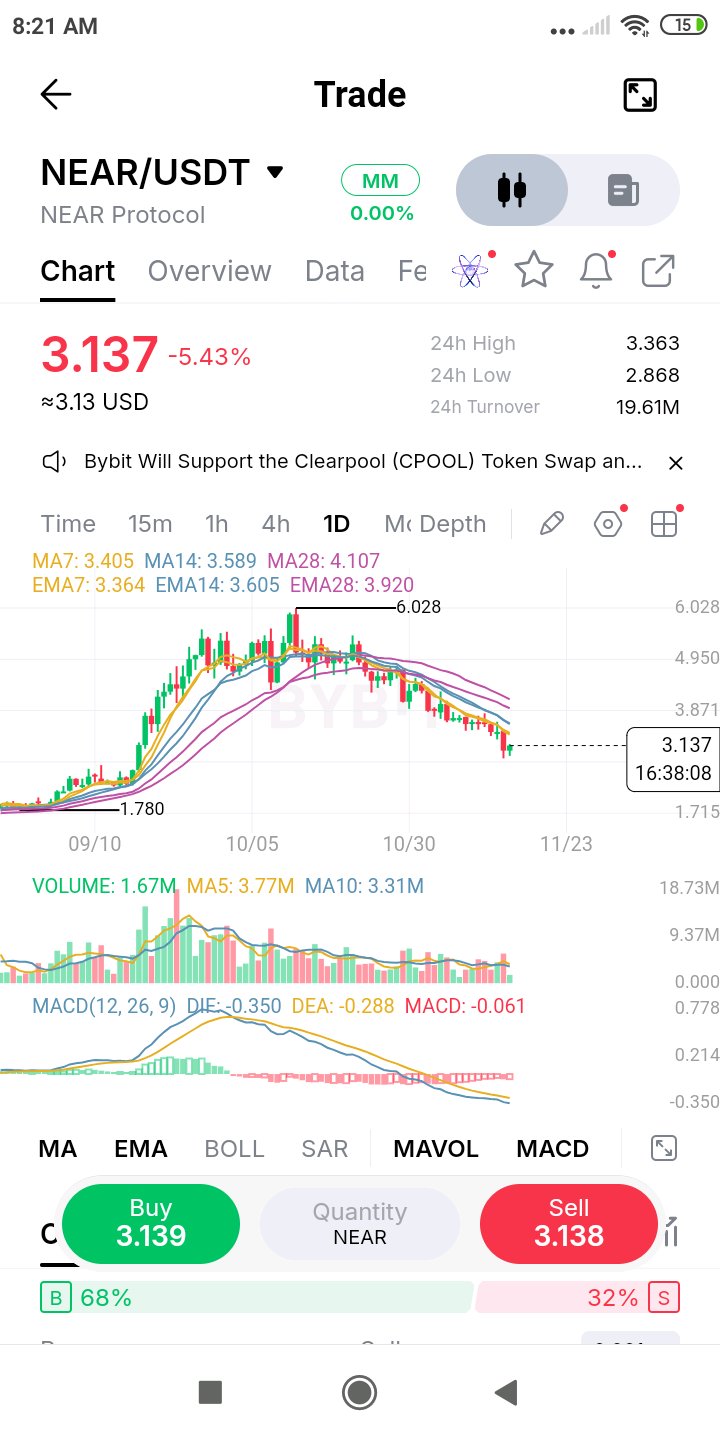
$NEARUSDT flushed to 2.868 on nearly double normal volume and bounced 9%, but it's still under the 0.618 at 3.253, so the wick needs a close to mean anything. Context NEAR has fallen about 48% from the 6.028 peak and has retraced roughly 64% of the advance from the 1.538 base. Today it wicked down to 2.868, then recovered 9.4% to 3.137 (-5.43% on the rolling 24h), but price is still under the 0.618 retracement at 3.253. All six averages are overhead and falling: EMA7 3.364, MA7 3.405, EMA14 3.605, MA14 3.589, EMA28 3.920 and MA28 4.107, with the 7s 7-8% above price and the 28s 25-31%. MACD (DIF -0.350, DEA -0.288, histogram -0.061) is at its lowest reading on this chart. The daily candle is green so far, with a long lower wick. Turnover and volume 24h turnover is 19.61M USDT, roughly 6.3M NEAR, about 1.9x the 10-day average (3.31M), on a 24h range of 2.868 to 3.363, roughly 17%. Daily volume is 1.67M about 7 hours in, on pace for roughly 5.4M, 1.4-1.6x the 5-day (3.77M) and 10-day averages. Rolling volume near double normal, with a long lower wick, is what a flush looks like: panicked selling met real bids at 2.87. The test is whether the next sessions hold 2.87-3.00 on lighter volume. The order book showed 68% of its visible size on the bid when I took this chart, but that is a snapshot. Support and resistance Support: 2.868 (24h low), 2.80 (round number), 2.499 (0.786), then the 1.538 base. Resistance: 3.253 (0.618), 3.364-3.405 (EMA7 and MA7), 3.589-3.605 (MA14 and EMA14), 3.783 (0.5), 3.920-4.107 (EMA28 and MA28), 4.313 (0.382), then the 6.028 peak. Level to watch 2.868 below and 3.253-3.405 above. A daily close under 2.868 breaks the wick low. A daily close above 3.405 takes back the 0.618 and both 7s in one move. Consideration A long lower wick on heavy volume is a first sign of buyers, but the daily candle is only about a third done, and price is still 7-8% under the 7s. A wick is not a base. What counts is follow-through, a daily close above 3.253, and until then the averages keep falling onto price, so a bounce into 3.25-3.41 is more likely a sell zone than a turn. Trade plan Wick retest: buy 2.87-3.00, stop under 2.78, about 0.15 of risk from 2.93. Targets are 3.364 and 3.605, roughly 2.9R and 4.5R. Reclaim: wait for a daily close above 3.41, buy the retest of 3.25-3.41, stop under 3.10, about 0.23 of risk from 3.33. Targets are 3.783 and 4.313, roughly 2.0R and 4.3R. I'm not buying 3.14 into the 0.618 and the 7s. A stop under 2.78 risks about 0.36 to make 0.12 to the 0.618 and 0.23 to the EMA7, under 1R. Invalid if A daily close under 2.868 breaks the wick low, with 2.499 next, about 13% lower, and I'd stand aside rather than average down. The wick-retest idea is dead under 2.78, and the reclaim idea is dead on a daily close back under 3.10. The downtrend stays in charge until a daily close above 3.605. Risk note A 17% daily range means stops need room or size needs to shrink. Use limit orders and judge on closes. Today's candle still has about 16 hours left, so volume and price will shift. Fib levels are zones, not guarantees, and they are measured from a base I read as 1.538. Levels are read off my chart. Idea only, not financial advice. Flush low or just the first wick? A daily close above 3.253 or under 2.868 will say. #ByXIMPACT
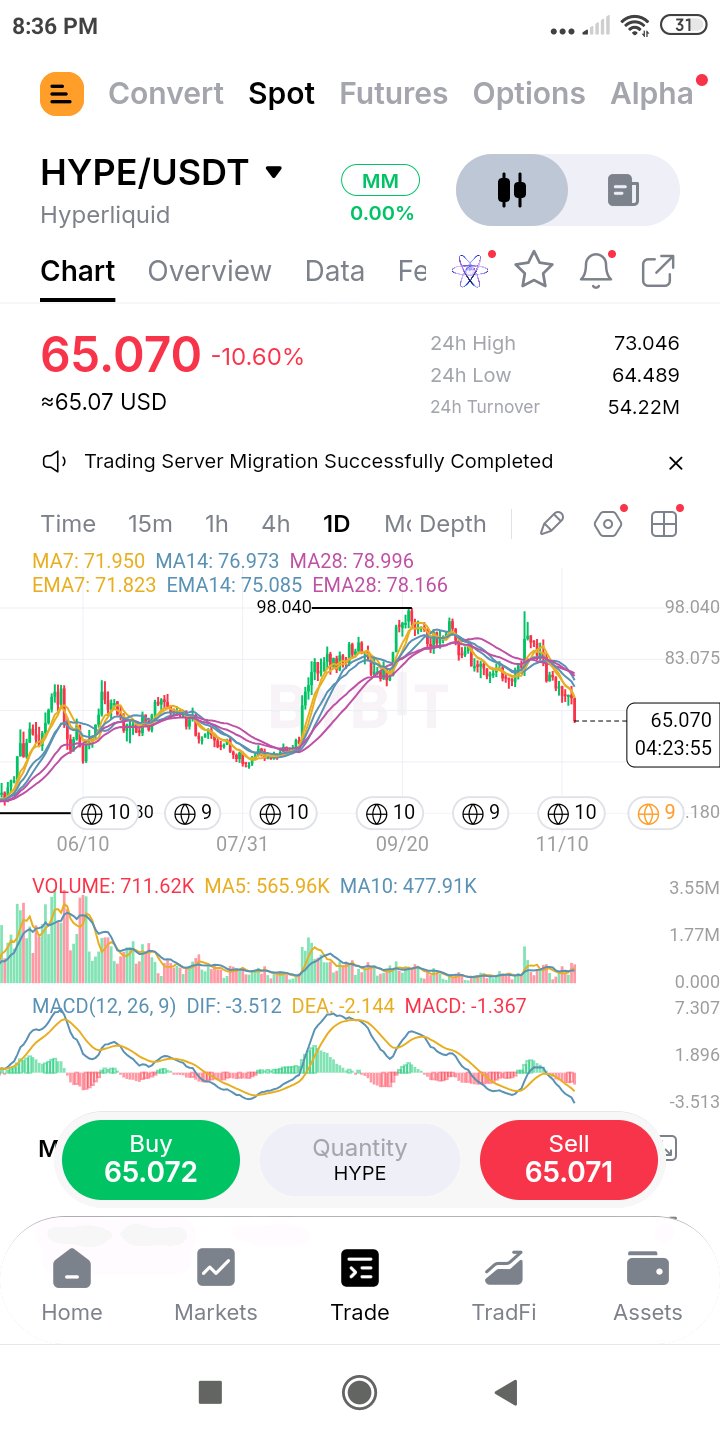
$HYPEUSDT está en 65.070 (-10.60%), 10.9% por debajo del máximo de 24 horas de 73.046. Ha retrocedido alrededor del 70% del avance desde 51.15 y está 33.6% por debajo del pico de 98.04. El doble techo, con el máximo de 98.04 y el pico de finales de octubre a cerca de 97, sobre una línea de cuello de 74.6, ahora está totalmente roto, y su movimiento medido proyecta hacia 52. Las seis medias están por encima y cayendo: EMA7 71.823, MA7 71.950, EMA14 75.085, MA14 76.973, EMA28 78.166 y MA28 78.996, con las de 7 periodos alrededor de 10.5% por encima del precio y las de 28 alrededor de 20%. El MACD (DIF -3.512, DEA -2.144, histograma -1.367) está en su lectura más baja en este gráfico, que se remonta a mayo. Volumen y rotación La rotación de 24 horas es de 54.22M USDT (aproximadamente 800K HYPE) en un rango de 24 horas de 64.489 a 73.046, alrededor del 13%. El volumen diario es de 711.62K con cerca de 4.4 horas restantes, ya por encima de los promedios de 5 días (565.96K) y 10 días (477.91K) y a un ritmo de aproximadamente 870K, cerca de 1.5-1.8x. Un volumen pesado en un día de -10% parece comportamiento de capitulación, pero un solo día no es un suelo. Un lavado real usualmente necesita un seguimiento: una re-prueba tranquila con menor volumen que se mantenga por encima del mínimo. Soporte y resistencia Soporte: 64.49 (mínimo de 24h), 61.18 (0.786), 60.00 (número redondo), luego la base de 51.15. Resistencia: 69.06 (el 0.618 roto), 70.00 (número redondo), 71.82-71.95 (EMA7 y MA7), 74.595 (0.5), 75.09 (EMA14), 76.97 (MA14), 78.17-79.00 (las de 28), 80.13 (0.382), luego 97-98.04. Nivel a vigilar 61.18 por debajo y 69.1 por encima. Un cierre diario por debajo de 61.18 cede la zona de 0.786. Un cierre diario de vuelta por encima de 69.1 recupera el 0.618 y sugiere que la liquidación fue comprada. Consideración La matemática de retroceso indica que el caso bajista se está desarrollando, porque la línea de cuello se rompió y el siguiente nivel fib está a solo un 6% de distancia. Un solo día pesado aún puede producir un rebote fuerte, pero con las medias de 7 periodos un 10% por encima, un rebote por sí solo no es un cambio de tendencia. Primero quiero ver estabilización: un cierre lejos del mínimo, luego una re-prueba tranquila que se mantenga. Plan de trading Liquidación (Flush): comprar 61.2-62.5 (la zona de 0.786) después de que el precio se estabilice ahí, stop por debajo de 59.6, cerca de 2.2 de riesgo desde 61.8. Los objetivos son 69.06 y 71.82, aproximadamente 3.3R y 4.6R. Reclamación: esperar un cierre diario por encima de 69.1, comprar la re-prueba de 69.0-70.4, stop por debajo de 67.4, cerca de 2.3 de riesgo desde 69.7. Los objetivos son 74.6 y 80.13, aproximadamente 2.1R y 4.5R. No estoy comprando a 65.07 a mitad de vela en un día de -10%. El mínimo de 24h en 64.489 está solo 0.6 por debajo, y un stop tan ajustado es alcanzado por una segunda liquidación, así que prefiero esperar al cierre. Invalidez Un cierre diario por debajo de 61.18 cede la zona de 0.786, con 51.15 como siguiente, cerca de 16% más abajo, y preferiría mantenerme al margen en lugar de promediar a la baja. Nota de riesgo Un día de 10% significa volatilidad extrema, así que reduce el tamaño, usa órdenes límite y espera mechas a través de los niveles. La vela de hoy todavía tiene cerca de 4 horas, así que el volumen y el precio cambiarán para el cierre. Los niveles Fib son zonas, no garantías. Los niveles se leen desde mi gráfico. Solo una idea, no es asesoramiento financiero. ByXIMPACT
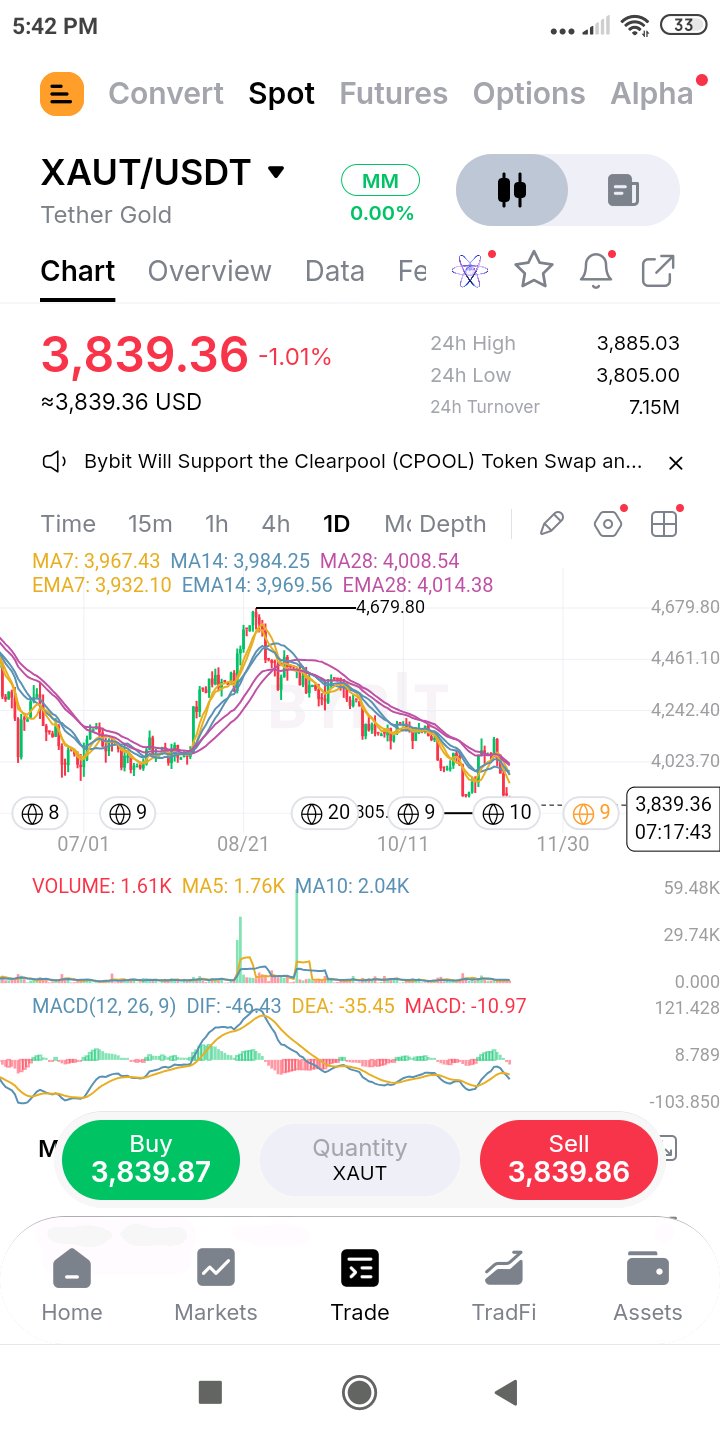
$XAUTUSDT keeps grinding lower under a bunched wall of averages, and the 3,800 round number held to within five points today. Context Today's low of 3,805.00 undercut the 3,851 and 3,872 October lows and is the lowest print on this chart window, which goes back to June. At 3,839.36 (-1.01%) price sits 0.9% above that low, 18% under the 4,679.80 peak, and under all six averages: EMA7 3,932.10, MA7 3,967.43, EMA14 3,969.56, MA14 3,984.25, MA28 4,008.54 and EMA28 4,014.38. They are packed into an 82-point band that starts 2.4% above price and ends 4.6% above it. MACD (DIF -46.43, DEA -35.45, histogram -10.97) has turned back down after its earlier bounce. Turnover and volume 24h turnover is 7.15M USDT, roughly 1,860 XAUT, about 0.9x the 10-day average (2.04K), on a 24h range of 3,805.00 to 3,885.03, about 2.1%. Daily volume is 1.61K with about 7 hours left, on pace for roughly 2.3K, near 1.1-1.3x the 5-day (1.76K) and 10-day averages. This is orderly, not climactic. Volume that is merely average during new lows says it is a grind lower, not a panic, and grinds usually end with a volume spike that hasn't appeared yet. Support and resistance Support: 3,805 (24h low), 3,800 (round number), 3,700 (round number), and nothing marked on this chart below. Resistance: 3,851-3,872 (the broken October lows), 3,885 (24h high), 3,932 (EMA7), 3,967-3,985 (MA7, EMA14 and MA14), 4,009-4,014 (MA28 and EMA28), then the 4,679.80 peak. Level to watch 3,800 below and 3,890 above. A daily close under 3,800 breaks the round number and the window low together. A daily close above 3,890 takes back the broken October lows and today's high. Consideration The six averages sit in one 82-point band, so a relief bounce meets all of them in one go. That is both a wall of supply and a compact target, because a bounce that clears the 7s can reach the whole band quickly. I'd rather see the broken 3,872 low reclaimed on a close first. Until then, rallies are more likely sell zones than turns. Trade plan Test: buy 3,800-3,830, stop under 3,760, about 55 of risk from 3,815. Targets are 3,932 and 3,984, roughly 2.1R and 3.1R. Reclaim: wait for a daily close above 3,890, buy the retest of 3,872-3,890, stop under 3,840, about 40 of risk from 3,880. Targets are 3,970 and 4,014, roughly 2.2R and 3.4R. I'm not buying 3,839 in open air. The first target at 3,872 is only about 33 away, and a stop under 3,760 risks about 79, under half an R. Invalid if A daily close under 3,800 breaks the round number and the window low, with 3,700 as the next reference, and I'd stand aside rather than catch it. The test idea is dead under 3,760, and the reclaim idea is dead on a daily close back under 3,840. The bearish structure stays in charge until a daily close above 4,015, above every average. Risk note XAUT follows gold, so a macro headline can gap price through any level, and turnover around 7M means market orders can slip, so use limits. Today's candle still has about 7 hours left, so judge on the close. Levels are read off my chart. Idea only, not financial advice. Floor or a stepping stone? A daily close under 3,800 or above 3,890 will say. #ByXIMPACT
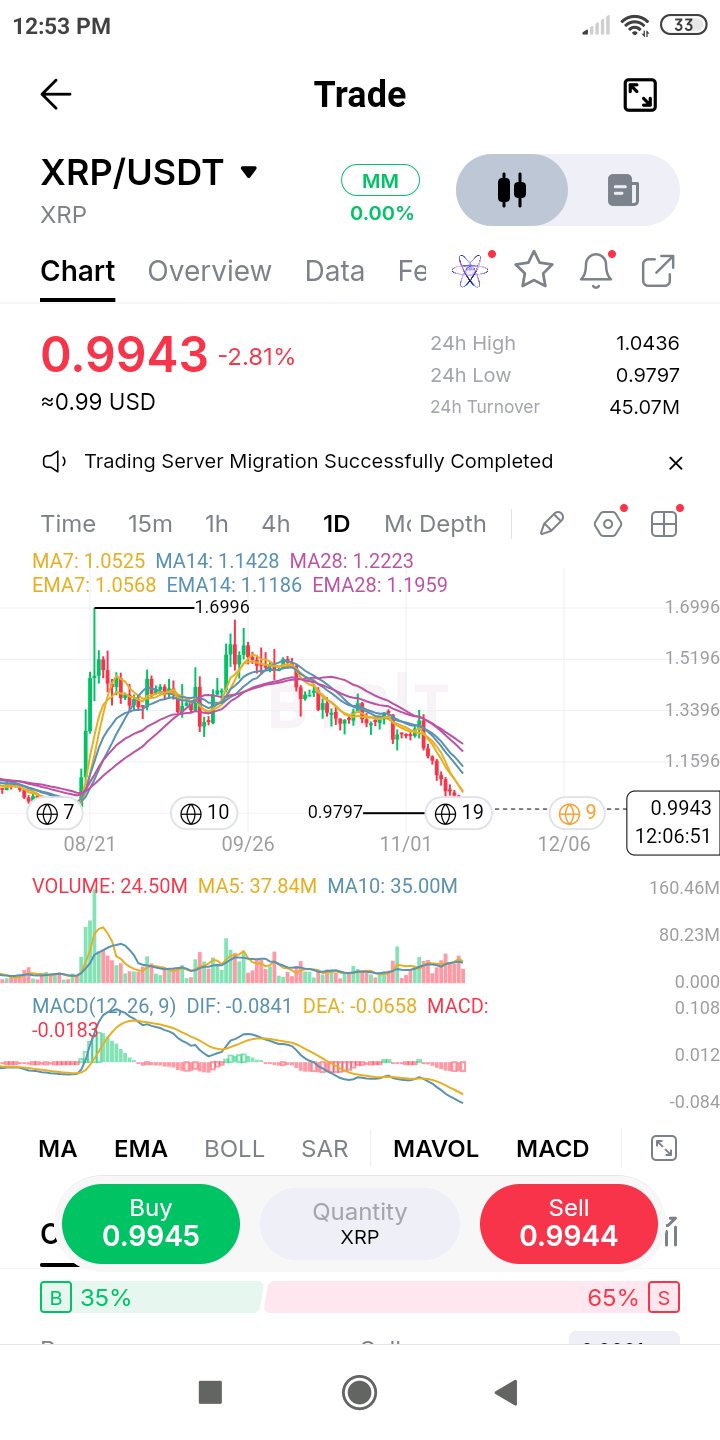
$XRPUSDT has slipped under $1 and printed its lowest price on this chart, so the next levels are round numbers, not structure. Context XRP is at 0.9943 (-2.81%), 1.5% above today's 0.9797 low, the lowest print in this chart window. The 24h high of 1.0436 is now 4.7% above price, so it sold off through the day and lost the $1 round number. It is down 41.5% from the 1.6996 peak and sits under the area it broke out from in August, roughly 1.05-1.10 by my read, where the 7s now sit. All six averages are overhead and falling: EMA7 1.0568, MA7 1.0525, EMA14 1.1186, MA14 1.1428, EMA28 1.1959 and MA28 1.2223, with the 7s about 6% above price, the 14s 12-15% and the 28s 20-23%. MACD (DIF -0.0841, DEA -0.0658, histogram -0.0183) is at its lowest reading on the chart. Turnover and volume 24h turnover is 45.07M USDT (about 44.6M XRP) on a 24h range of 0.9797 to 1.0436, roughly 6.5%. Daily volume is 24.50M with about 12 hours left, on pace for roughly 49M, about 1.2-1.4x both the 5-day (37.84M) and 10-day (35.00M) averages. With the 5-day above the 10-day, activity has been picking up into the decline. This is a little heavier than average selling, but not a flush. The order book showed 65% of its visible size on the ask when I took this chart. Support and resistance Support: 0.9797 (24h low), 0.9500 and 0.9000 (round numbers), and nothing marked on this chart below. Resistance: 1.0000 ($1 round number), 1.0436 (24h high), 1.0525-1.0568 (MA7 and EMA7), about 1.10 (the August breakout shelf, by my read), 1.1186-1.1428 (EMA14 and MA14), 1.1959-1.2223 (the 28s), about 1.25-1.35 (the October shelf, by my read), then the 1.6996 peak. Level to watch 0.9797 below and 1.0570 above. A daily close under 0.9797 breaks the window low with no marked support under it. $1 itself is a magnet for round-number orders, but the real filter is the 7s, so a daily close above 1.0570 is what would change the picture. Consideration Round numbers attract attention, but they don't make a floor by themselves, and a first reclaim of $1 often fails on the retest. With no price history below on this chart, a clean break of 0.9797 has room to travel. I'm treating $1 as a reference point, not support, until price closes above the 7s. Trade plan Low retest: buy 0.9800-0.9900, stop under 0.9650 (giving the low a sweep), about 0.0200 of risk from 0.9850. Targets are 1.0436 and 1.1186, roughly 2.9R and 6.7R. Reclaim: wait for a daily close above 1.0570, buy the retest of 1.0500-1.0570, stop under 1.0100, about 0.0435 of risk from 1.0535. Targets are 1.1428 and 1.2223, roughly 2.1R and 3.9R. I'm not buying 0.9943 under $1. A stop under 0.9650 risks about 0.029 to make 0.006 to the $1 line and 0.058 to the MA7, so the first obstacle pays almost nothing. Invalid if A daily close under 0.9797 breaks the window low, with 0.9500 and then 0.9000 as the only references, and I'd stand aside rather than average down. The low-retest idea is dead under 0.9650, and the reclaim idea is dead on a daily close back under 1.0100. The downtrend stays in charge until a daily close above 1.1428. Risk note XRP can move 5-7% in a day, so a tight stop is easy to run. Use limit orders, keep size modest, and judge on closes. Today's candle still has about 12 hours left, so volume and price will shift. Levels are read off my chart. Idea only, not financial advice. Is $1 a floor or a doorway? A daily close back above 1.0570 or under 0.9797 will say. #ByXIMPACT
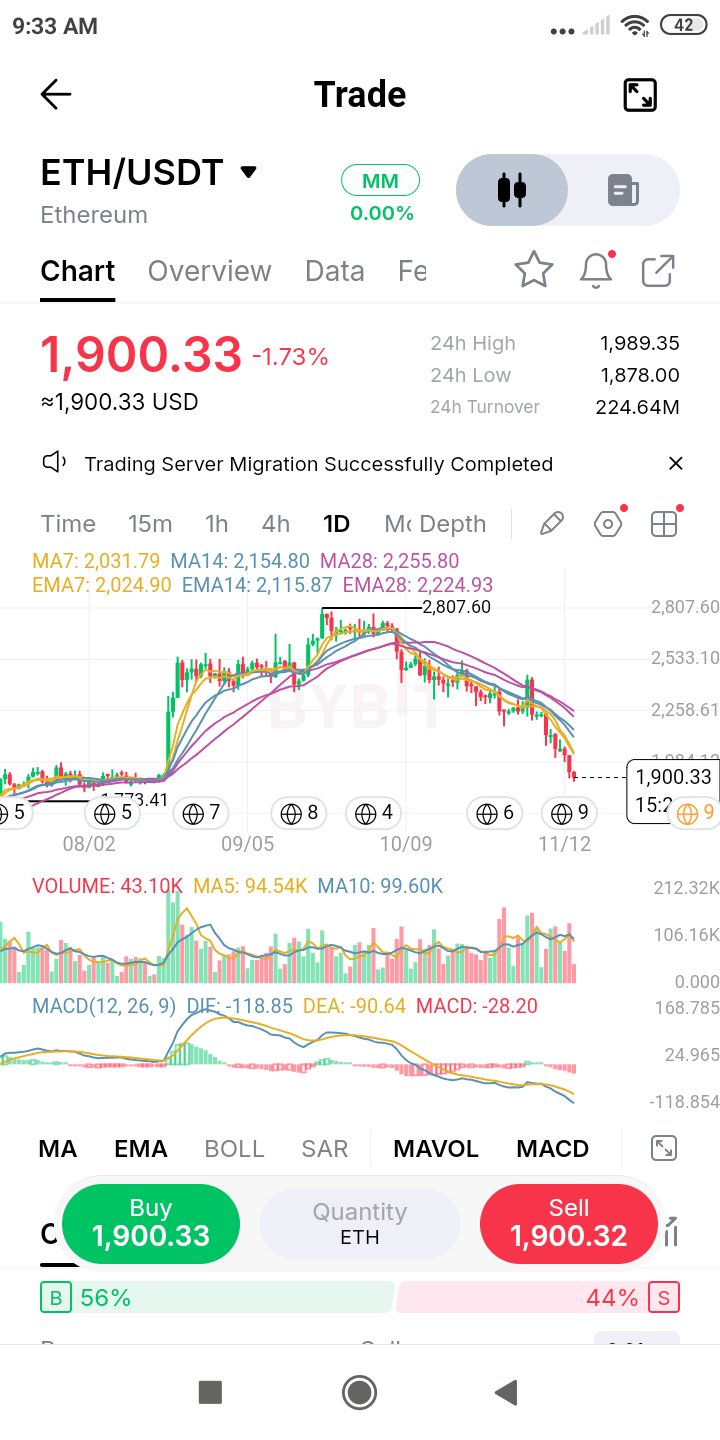
$ETHUSDT is probing the bottom of its August launch range, with the 0.786 and the old 2,005 floor stacked overhead and the July low at 1,773 as the next verified level. Context ETH is down about 32% from the 2,807.60 peak and has retraced about 88% of the advance from the 1,773.41 July low. Today's 24h low of 1,878.00 undercut the last low slightly, and price bounced to 1,900.33 (-1.73%). The 24h high of 1,989.35 stalled just under the 0.786 retracement at 1,995 and the old 2,005 floor, which sit on top of each other. Price is inside the August launch range, roughly 1,880-1,950 by my read, and under all six averages: EMA7 2,024.90, MA7 2,031.79, EMA14 2,115.87, MA14 2,154.80, EMA28 2,224.93 and MA28 2,255.80. The 7s are about 6.6-6.9% overhead and the 28s 17-19%. MACD (DIF -118.85, DEA -90.64, histogram -28.20) is at its lowest reading on this chart, with the red histogram widening. Turnover and volume 24h turnover is 224.64M USDT, roughly 116K ETH, about 1.2x the 10-day average (99.60K). Daily volume is 43.10K with about 15.5 hours left, on pace for roughly 120K, close to 1.2x both the 5-day (94.54K) and 10-day averages. That is above average but not climactic, because there has been no spike big enough to look like a washout. I'd want a heavy-volume flush followed by a quiet retest that holds before calling a low. The order book was near even, 56% bid to 44% ask, when I took this chart. Support and resistance Support: 1,878 (24h low), 1,880-1,950 (the August launch range, by my read), 1,800 (round number), then 1,773.41 (the July low). Resistance: 1,989 (24h high), 1,995-2,005 (the 0.786 and the old floor), 2,025-2,032 (EMA7 and MA7), 2,116-2,155 (EMA14 and MA14), 2,168 (0.618), 2,225-2,256 (the 28s), 2,290 (0.5), 2,413 (0.382), then the 2,807.60 peak. Level to watch 1,878 below and 2,030 above. A daily close under 1,878 puts the July low in play, only about 6.7% lower. A daily close above 2,030 clears the 0.786, the old floor and both 7s together. Consideration Price has spent days inside the August range without a decisive close in either direction, and the averages keep sliding down onto it. A hold here would be a test of the launch base, which can work, but the ceiling is stacked, with the 0.786, the old floor and the 7s all within about 140 points. If 1,878 gives way, I'd rather wait for the July low than catch the fall in between. Trade plan Hold: buy 1,880-1,905 only after a daily candle rejects 1,878, stop under 1,860, about 35 of risk from 1,895. Targets are 2,025 and 2,116, roughly 3.7R and 6.3R. Reclaim: wait for a daily close above 2,030, buy the retest of 1,995-2,030, stop under 1,960, about 50 of risk from 2,010. Targets are 2,168 and 2,290, roughly 3.2R and 5.6R. I'm not buying mid-candle. The 24h low at 1,878 has to hold on a close, and a stop only 18 under it sits exactly where a second flush would take it out. Invalid if A daily close under 1,878 puts the July low at 1,773.41 in play, and I'd stand aside rather than catch it. The hold idea is dead under 1,860, and the reclaim idea is dead on a daily close back under 1,960. The downtrend stays in charge until a daily close above 2,155. Risk note A 6% daily range is normal for ETH right now, so a tight stop can get run before the move. Use limit orders, keep size modest, and judge on closes. Today's candle still has about 15 hours left. Fib levels are zones, not guarantees, and they are measured from the 1,773.41 low. Levels are read off my chart. Idea only, not financial advice. Hold or hand-off to the July low? A daily close above 2,030 or under 1,878 will say. #ByXIMPACT
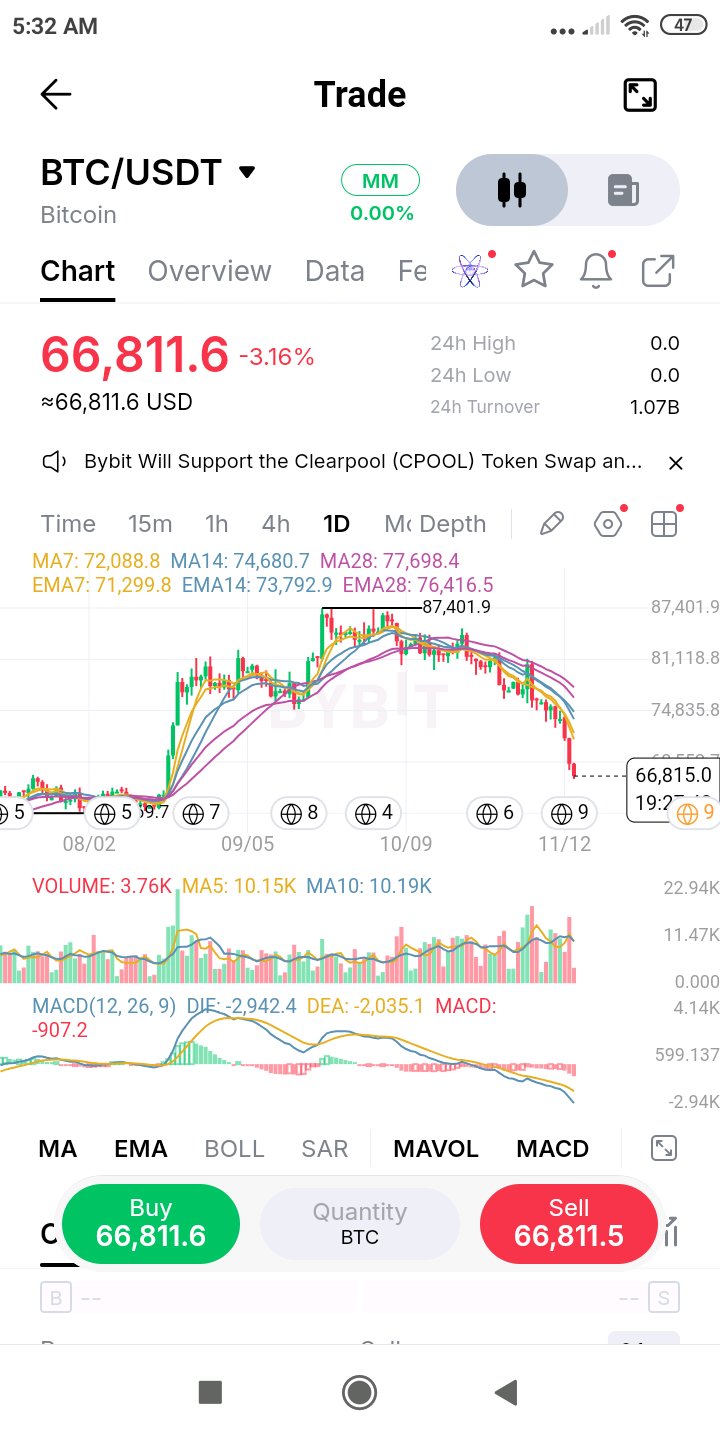
$BTCUSDT has slipped under the 0.786 retracement at 67,648, and the next marked level is the August base at 62,270, about 7% lower. Context BTC is at 66,811.6 (-3.16%), below the last marked retracement before the base. It is down 23.6% from the 87,401.9 peak and has retraced about 82% of the advance from the 62,270 August base. All six averages are overhead and falling: EMA7 71,299.8, MA7 72,088.8, EMA14 73,792.9, MA14 74,680.7, EMA28 76,416.5 and MA28 77,698.4, with the 7s 7-8% above price and the 28s 14-16%. MACD (DIF -2,942.4, DEA -2,035.1, histogram -907.2) is at its lowest reading on this chart, with the red histogram still widening, so downside momentum is accelerating. Turnover and volume 24h turnover is 1.07B USDT, roughly 15.7K BTC, about 1.5x the 10-day average (10.19K). Daily volume is 3.76K only about 4.5 hours into the candle, already around 37% of the 10-day average. That early-session pace can't be trusted, but it says sellers are active again. Above-average turnover while price breaks a retracement means selling pressure is not fading, and I haven't seen the flush-and-reclaim that usually marks a bottom. Support and resistance Support: 66,800 (where price sits), 66,000 and 65,000 (round numbers), then the 62,270 August base. The June-July low sits lower still, around 57,800 by my earlier read. Resistance: 67,650 (the broken 0.786), 68,000 and 70,000 (round numbers), 71,300-72,090 (EMA7 and MA7), 71,870 (the broken 0.618), 72,727 (the old box floor), 73,793-74,681 (EMA14 and MA14), 74,840 (0.5), 76,417-77,698 (the 28s), then the 87,401.9 peak. Level to watch 66,000 below and 67,900 above. A daily close under 66,000 puts the August base in play. A daily close back above 67,900 retakes the 0.786 zone and says this was a shake. Consideration There is no marked structure between here and the base except the 66,000 and 65,000 round numbers, so a clean break of 66,000 has room to run. Momentum is accelerating, not fading, so I'm waiting for stabilization instead of guessing the low: a volume spike followed by a quiet retest that holds. The 7s are 7-8% overhead, so even a sharp relief bounce wouldn't change the structure. Trade plan Base: buy 62,300-63,500, stop under 60,800, about 2,100 of risk from 62,900. Targets are 67,648 and 71,870, roughly 2.3R and 4.3R. Reclaim: wait for a daily close above 67,900, buy the retest of 67,650-68,000, stop under 66,400, about 1,400 of risk from 67,800. Targets are 70,000 and 72,727, roughly 1.6R and 3.5R. I'm not buying 66,800 mid-candle. A stop under 66,000 risks about 810 to make about 840 back to the 0.786, only 1R. Invalid if The base idea is dead on a daily close under 60,800, and I'd stand aside rather than catch it lower. The reclaim idea is dead on a daily close back under 66,400. The downtrend stays in charge until a daily close above 74,700, the MA14. Risk note After two heavy red days, volatility is high, so cut size, use limit orders, and expect wicks through levels. Liquidation cascades can run price through any zone. Today's candle is only about 4.5 hours old, so volume and price will shift by the close. Fib levels are zones, not guarantees. Levels are read off my chart. Idea only, not financial advice. Second leg or final leg? A daily close above 67,900 or under 66,000 will say. #ByXIMPACT
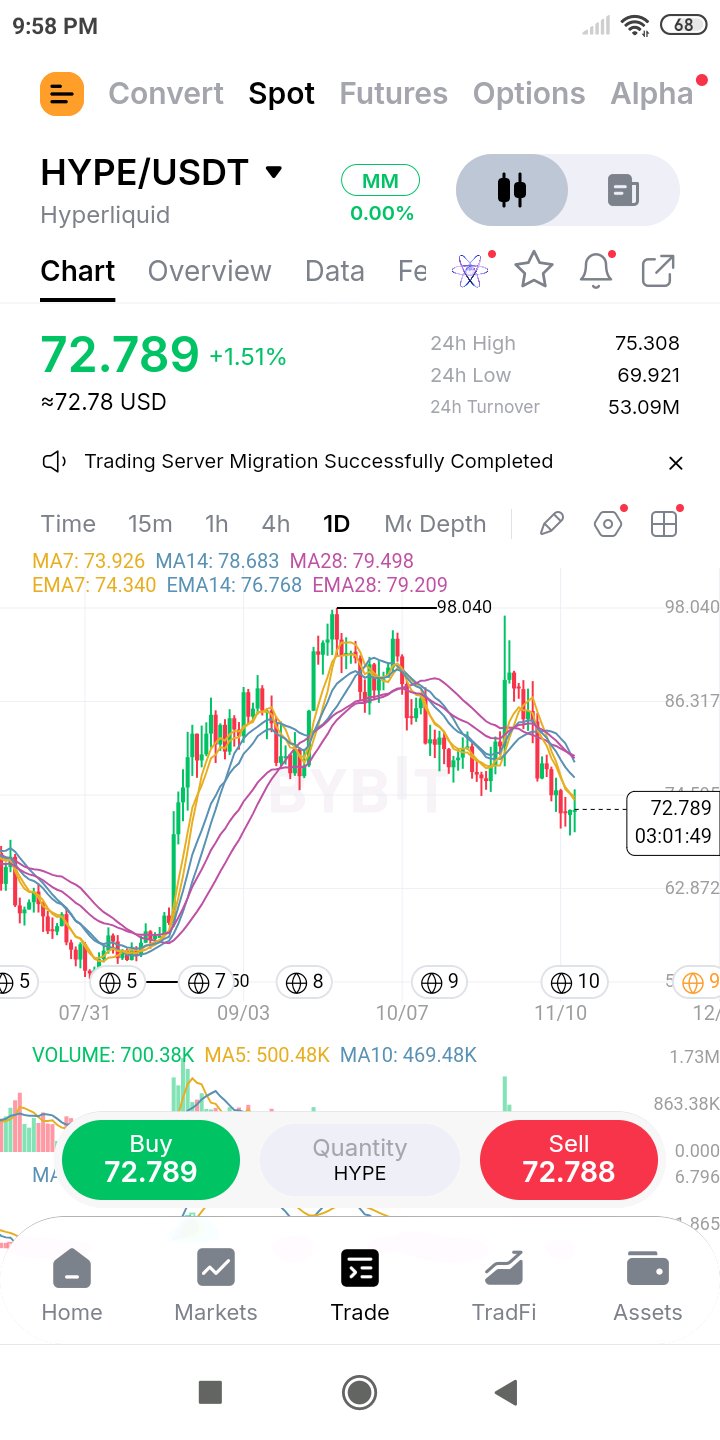
$HYPEUSDT perforó su mínimo de 70.4 con volumen fuerte, se mantuvo por encima del 0.618 y rebotó un 4%, pero el primer intento de superar los 74.6 falló, así que ese techo sigue siendo la prueba. Contexto HYPE corrió de 51.15 a 98.04, tocó techo dos veces y perdió la línea de cuello de 74.6. Hoy perforó su mínimo de 70.4 de principios de esta semana, llegando a 69.921, se sostuvo sobre el retroceso de 0.618 en 69.06 y rebotó un 4.1% hasta 72.789 (+1.51%). El máximo de 24h de 75.308 asomó por encima del 0.5 en 74.595 y por arriba de ambas medias de 7, para luego retroceder. Las seis medias móviles siguen por encima: MA7 73.926, EMA7 74.340, EMA14 76.768, MA14 78.683, EMA28 79.209 y MA28 79.498, con las de 7 periodos un 1.6-2.1% arriba del precio y las de 28 un 9%. La vela diaria es verde con una mecha inferior larga. Volumen y rotación La rotación de 24h es de 53.09M USDT (unos 730K HYPE) en un rango de 24h de 69.921 a 75.308, un amplio 7.7%. El volumen diario es de 700.38K con unas 3 horas restantes, ya por encima de los promedios de 5 días (500.48K) y 10 días (469.48K) y con ritmo para alcanzar unos 800K, cerca de 1.6-1.7x. Volumen fuerte en los mínimos con una mecha inferior larga y una vela verde es cómo se ve una prueba de soporte: los vendedores presionaron y los compradores absorbieron. Eso solo cuenta si las siguientes sesiones mantienen los 69.9-70 con menor volumen. Soporte y resistencia Soporte: 69.92 (mínimo de 24h), 70.00 (número redondo), 69.06 (0.618), 61.18 (0.786), luego la base de 51.15. Resistencia: 74.595 (0.5, la línea de cuello), 73.93-74.34 (MA7 y EMA7), 75.31 (máximo de 24h), 76.77 (EMA14), 78.68 (MA14), 79.21-79.50 (las de 28), 80.13 (0.382), 86.97 (0.236), luego 97-98.04. Nivel a vigilar 69.06 abajo y 75.3 arriba. Un cierre diario por encima de 75.3 despeja el 0.5, ambas medias de 7 y el máximo de hoy de un solo movimiento. Un cierre diario por debajo de 69.06 pierde el 0.618 y el mínimo de hoy simultáneamente. Consideración Perforar un mínimo anterior con volumen fuerte y recuperar es la forma de un 'spring', pero un 'spring' necesita confirmación, y el primer intento de recuperar los 74.6 ya falló. La pila de medias sigue bajista, con las de 7 en 73.9-74.3, las de 14 en 76.8-78.7 y las de 28 en 79.2-79.5, así que incluso un buen rebote tiene capas de oferta por superar. Solo lo trataría como una base después de un cierre por encima de las medias de 7. Plan de trading Retesteo: comprar 70.0-71.5, stop por debajo de 68.9 (abajo del 0.618 y del mínimo de hoy), unos 1.9 de riesgo desde 70.8. Objetivos son 74.6 y 78.68, aproximadamente 2.0R y 4.1R. Recuperación: esperar un cierre diario por encima de 75.3, comprar el retesteo de 74.6-75.4, stop por debajo de 73.0, unos 2.0 de riesgo desde 75.0. Objetivos son 80.13 y 86.97, aproximadamente 2.6R y 6.0R. No estoy comprando 72.8 en el vacío. Un stop por debajo de 68.9 arriesga unos 3.9 para ganar cerca de 1.1 hasta la MA7, menos de 1R. Nota de riesgo HYPE se mueve rápido y un rango diario de 7-8% es normal, así que un stop dentro de ese rango es ruido. Usa órdenes limitadas, mantén el tamaño modesto y juzga basándote en los cierres. A la vela de hoy le quedan unas 3 horas, así que el volumen aún cambiará. Los niveles de Fibonacci son zonas, no garantías. Los niveles están leídos de mi gráfico. Solo una idea, no es consejo financiero. ¿'Spring' o rebote de gato muerto? Un cierre diario por encima de 75.3 o por debajo de 69.06 lo dirá. $ByXIMPACT
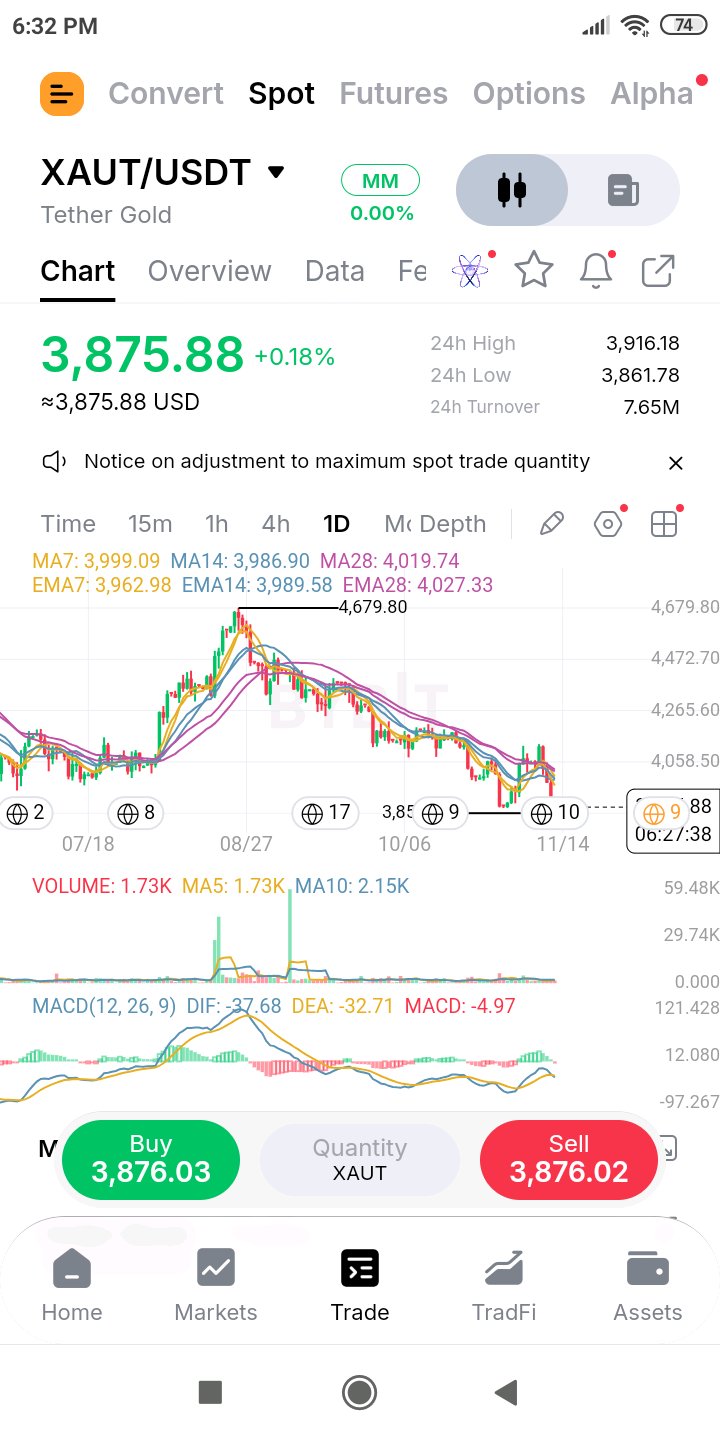
$XAUTUSDT is bleeding out, and the recent attempt to reverse the trend has completely failed. Context: After the massive drop from 4,679, XAUT tried to find a bottom around 3,860. We saw a brief bounce, but the momentum has completely died. We are currently printing at 3,875.88, stuck in a relentless downtrend. The daily moving averages are acting as a heavy ceiling, with the MA7 (3,999.09) and EMA7 (3,962.98) sloping aggressively downward. Price is entirely disconnected from the 28-day average (4,019.74). Turnover and volume: 24h turnover is a mere 7.65M USDT. Look at the volume pane at the bottom. It is completely dead. Today's volume is 1.73K, matching the 5-day average but sitting far below the 10-day average of 2.15K. The market has zero interest in buying this bounce. There is no bid support stepping in. Support and resistance: Support: 3,861.78 (24h low). This is the final structural floor. If this breaks, we are in price discovery to the downside. Resistance: 3,962.98 (EMA7) and 3,999.09 (MA7). Level to watch: 3,861.78. A daily close below this level confirms the continuation of the macro crash. Bulls need a miracle to push price back above the EMA7 (3,962). Trade plan: Short: If price bounces back toward 3,900 - 3,920 and rejects, short the dead-cat bounce. Stop above 3,960 (below the EMA7), targeting a breakdown of the 3,861 floor. Long: Stand aside. There is no structural reason to buy this chart. You are fighting a heavy downtrend with no volume. Invalidation: A daily close above the MA7 (3,999.09) invalidates the immediate bearish thesis. It would signal a massive shift in momentum and a reclaim of the trend. Until then, the bears are in full control. Risk note: Look at the MACD. The DIF (-37.68) is aggressively crossing back down toward the DEA (-32.71), and the histogram is about to flip red. This is a failed bullish crossover. If the histogram prints red, bearish momentum is officially accelerating again. Do not try to catch this falling knife. Is this the beginning of a deeper flush, or is there one last defense of the 3,860 floor? #ByXIMPACT
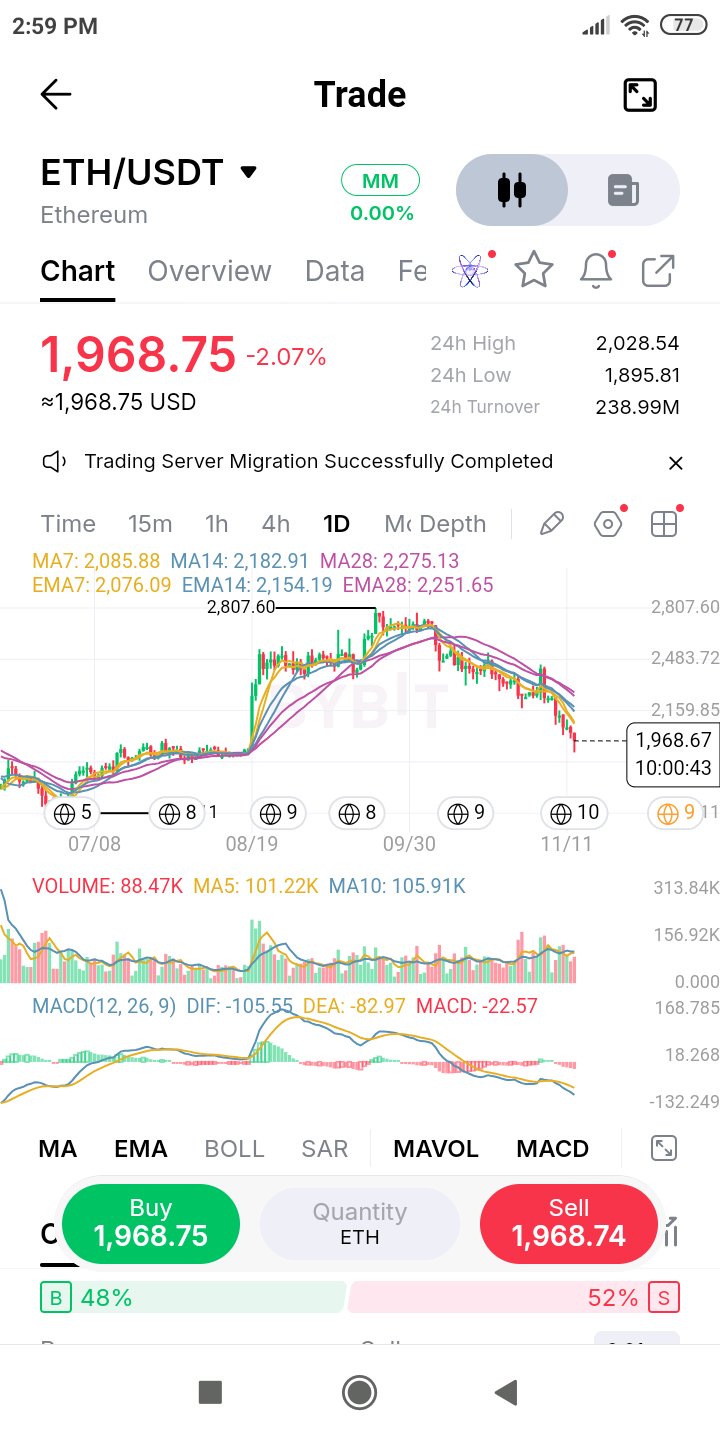
$ETHUSDT broke the 2,005 floor on rising volume, wicked to 1,896, and is now back inside the range it broke out of in August. Context ETH is down about 30% from the 2,807.60 peak and has given back roughly 85-86% of the August-to-October advance (the base is near 1,830, with the label hidden). Today it broke the 2,005 low and the 2,000 round number, wicked to 1,895.81, then bounced 3.9% to 1,968.75 (-2.07%). That puts price back inside the consolidation it launched from in August, which I read as roughly 1,880-1,950. All six averages are overhead: EMA7 2,076.09, MA7 2,085.88, EMA14 2,154.19, MA14 2,182.91, EMA28 2,251.65 and MA28 2,275.13, with the 7s 5.5-6% above price and the 28s 14-16%. MACD (DIF -105.55, DEA -82.97, histogram -22.57) is below zero with the red histogram widening. Turnover and volume 24h turnover is 238.99M USDT, roughly 122K ETH, about 1.15x the 10-day average (105.91K). Daily volume is 88.47K with about 10 hours left, on pace for roughly 150K, about 1.4-1.5x both the 5-day (101.22K) and 10-day averages. The break of 2,005 came with heavier volume than the quiet days before it, so it is real selling. The 3.9% bounce off the low also tells me buyers showed up at 1,896. What I want next is a retest of that low on lighter volume. Support and resistance Support: 1,895.81 (24h low), 1,880-1,950 (the August launch range, by my read), 1,822-1,840 (the early-August low, label hidden), 1,800 (round number). Resistance: 2,005 (the broken low, with the 2,000 round number), 2,028.5 (24h high), 2,076-2,086 (EMA7 and MA7), 2,154-2,183 (EMA14 and MA14), 2,252-2,275 (the 28s), then the 2,807.60 peak. Level to watch 1,895 below and 2,030 above. A daily close under 1,895 breaks today's low and opens the early-August low, only about 3-4% lower. A daily close above 2,030 takes back the broken floor and says the break was a flush. Consideration With about 85% of the advance retraced, the structure is decisively bearish, and the broken 2,005 floor now caps any bounce. Holding the August range would be a test of the launch base, and tests of a base can work, but they can also be the last stop before a lower low. The 7s are 5.5-6% overhead, so a relief bounce can be sharp without changing the trend. Trade plan Base zone: buy 1,895-1,940, stop under 1,860, about 60 of risk from 1,920. Targets are 2,076 and 2,183, roughly 2.6R and 4.4R. Reclaim: wait for a daily close above 2,030, buy the retest of 2,000-2,030, stop under 1,955, about 60 of risk from 2,015. Targets are 2,183 and 2,275, roughly 2.8R and 4.3R. I'm not buying 1,969 in the middle of the range. A stop under 1,860 risks about 109 to make 107 to the EMA7, only about 1R. Invalid if A daily close under 1,895 opens 1,822-1,840 and then 1,800, and I'd stand aside rather than average down. The base-zone idea is dead under 1,860, and the reclaim idea is dead on a daily close back under 1,955. The downtrend stays in charge until a daily close above 2,185. Risk note A 7% daily range is normal for ETH right now, so a stop inside that is noise. Use limit orders, keep size modest, and judge on closes. Today's candle still has about 10 hours left, so volume and price will shift. Support zones here are read off my chart, not exact lines. Idea only, not financial advice. Launch zone or just a landing? A daily close under 1,895 or back above 2,030 will say. #ByXIMPACT
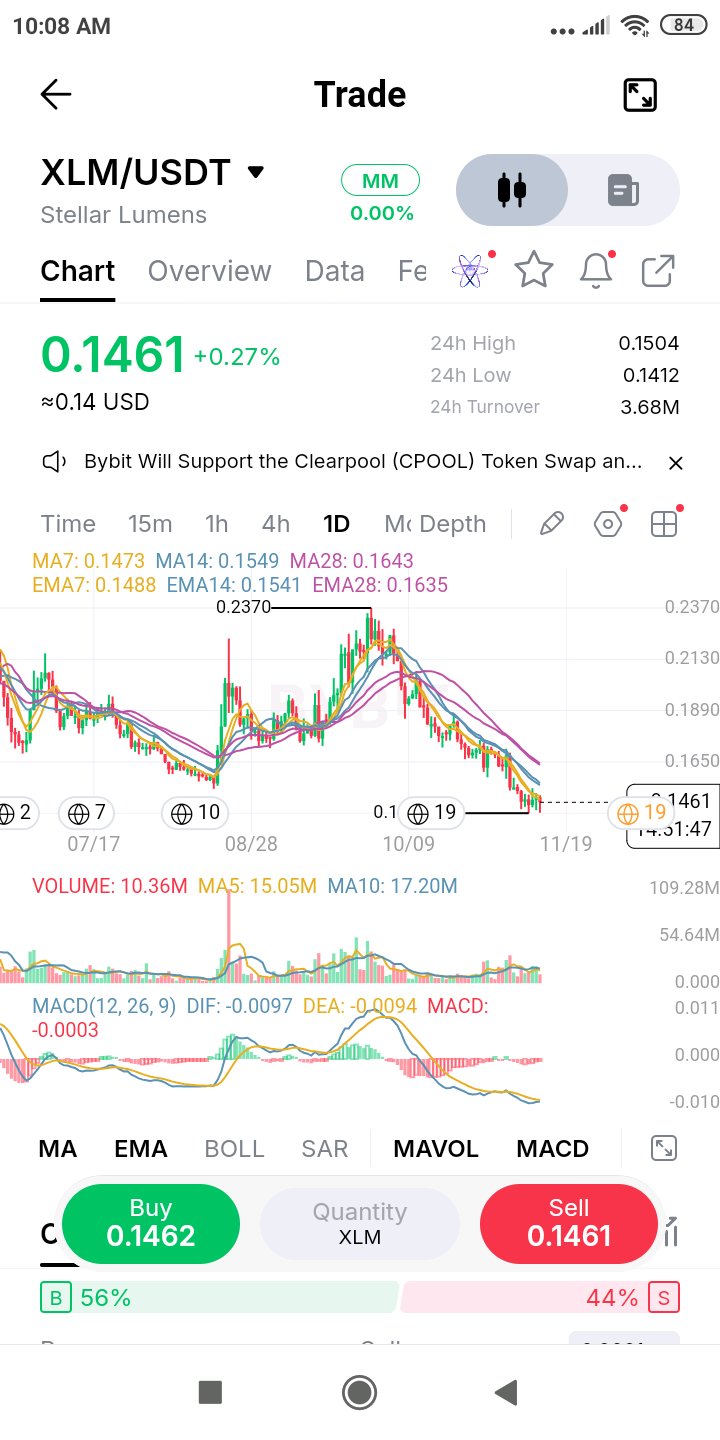
$XLMUSDT held the 0.141 low a second time, but the bounce stalled at the 0.1500 round number and the 7s, so it's still a bounce, not a base. Context XLM is down about 38% from the 0.2370 peak. Today's 24h low of 0.1412 matches the recent low near 0.141 (the chart label is partly hidden), so that level has now held twice. At 0.1461 (+0.27%) price is 3.5% off it, but the 24h high of 0.1504 stalled at the 0.1500 round number after poking above the 7s, and price has fallen back under them. All six averages are still overhead: MA7 0.1473, EMA7 0.1488, EMA14 0.1541, MA14 0.1549, EMA28 0.1635 and MA28 0.1643, with the 7s 1-2% above price, the 14s about 6%, and the 28s about 12%. MACD (DIF -0.0097, DEA -0.0094, histogram -0.0003) is flat with the lines almost touching, so bearish momentum has stopped growing but hasn't flipped. Turnover and volume 24h turnover is 3.68M USDT (about 25M XLM) on a 24h range of 0.1412 to 0.1504, roughly 6.5%. That rolling figure is about 1.5x the 10-day average of 17.20M, so activity has picked up on this second test. Daily volume is 10.36M with about 15 hours left. If the rest of the day runs at only half the pace so far, it finishes near 19M, above both the 5-day (15.05M) and 10-day averages. A bounce on rising volume is better quality than a thin grind, but volume without a close above the 7s is not proof of a turn. Support and resistance Support: 0.1412 (24h low), 0.1410 (the recent low), 0.1400 (round number), then nothing marked on this chart. Resistance: 0.1473-0.1488 (MA7 and EMA7), 0.1500 (round number, where today's high stalled), 0.1541-0.1549 (EMA14 and MA14), 0.1635-0.1643 (EMA28 and MA28), about 0.18-0.19 (the Sept-Oct shelf, by my read), then the 0.2370 peak. Level to watch 0.1400 below and 0.1505 above. A daily close above 0.1505 clears the round number and both 7s at once. A daily close under 0.1400 breaks the double low and the round number together. Consideration Two holds at the same low only start to look like a base if the bounces improve, and for now each one has failed at the same 7s and 0.1500 zone. The tell is a daily close above 0.1505 on above-average volume. With MACD's lines nearly touching, a bullish cross is close, but a cross while price is still under the 14s is an early hint, not confirmation. Trade plan Second low: buy 0.1415-0.1440, stop under 0.1385 (below the round number and the low), about 0.0043 of risk from 0.1428. Targets are 0.1541 and 0.1635, roughly 2.6R and 4.8R. Reclaim: wait for a daily close above 0.1505, buy the retest of 0.1488-0.1505, stop under 0.1440, about 0.0055 of risk from 0.1495. Targets are 0.1643 and 0.1800, roughly 2.7R and 5.5R. I'm not buying 0.1461 under the 7s. A stop under 0.1385 risks about 0.0076 to make 0.0012 to the MA7 and 0.0039 to the round number, under 1R. Invalid if A daily close under 0.1400 breaks the round number and the double low, with no marked support below, and I'd stand aside rather than average down. The low-buy idea is dead under 0.1385, and the reclaim idea is dead on a daily close back under 0.1440. The downtrend stays in charge until a daily close above 0.1549 and is retired only above 0.1643. Risk note XLM is a thinner pair, so market orders can slip. Use limits and keep size modest. Today's candle is still young, so volume and price will shift by the close. Levels are read off my chart. Idea only, not financial advice. Second hold, or a pause before the third test? A daily close above 0.1505 or under 0.1400 will say. #ByXIMPACT
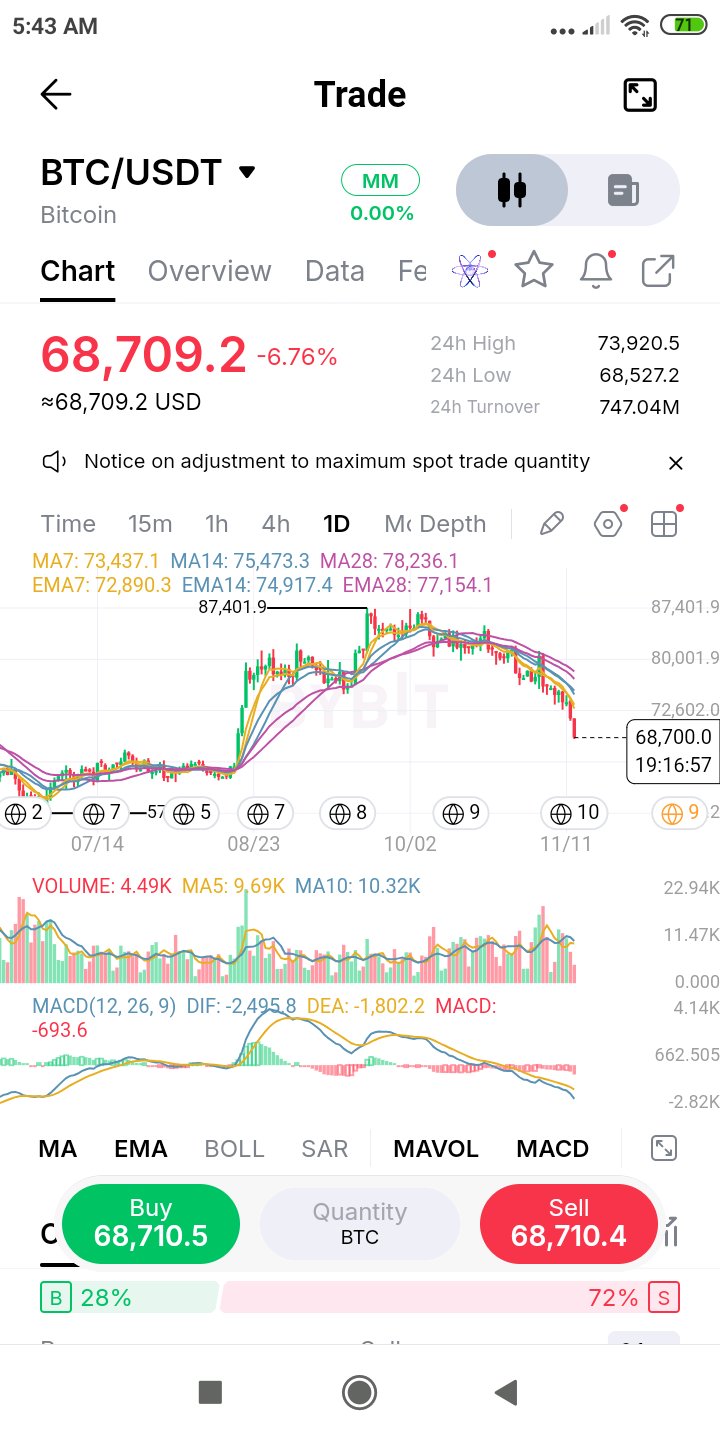
$BTCUSDT fell through the box floor, the 0.618 zone and 70,000 in one candle, and the 0.786 zone at 67,650-67,900 is the next marked level. Context BTC is at 68,709.2 (-6.76%), with a 24h range of 68,527.2 to 73,920.5, about 7.9%. It is down 21.4% from the 87,401.9 peak and has handed back about 74% of the advance from the August base near 62,300. All six averages are overhead and falling: EMA7 72,890.3, MA7 73,437.1, EMA14 74,917.4, MA14 75,473.3, EMA28 77,154.1 and MA28 78,236.1, with the 7s 6-7% above price and the 28s 12-14%. MACD (DIF -2,495.8, DEA -1,802.2, histogram -693.6) is at its lowest reading on the chart, with the red histogram widening fast, so downside momentum is accelerating. Turnover and volume 24h turnover is 747.04M USDT, roughly 10.5K BTC. Daily volume is already 4.49K only about 5 hours into the candle, over 40% of the 10-day average (10.32K). That early-session pace can't be trusted, but if the rest of the day runs at only half of it, the candle still finishes around 13-14K, above both the 5-day (9.69K) and 10-day averages. This is heavy selling, the opposite of the fading-volume drift of recent days. Heavy-volume breaks tend to get retested, so the question is where the retest stalls. The order book showed 72% of its visible size on the ask when I took this chart. Support and resistance Support: 68,527 (24h low), 68,000 (round number), 67,650-67,900 (0.786 zone), 65,000 (round number), then the August base near 62,300. The June-July low sits lower still, around 57,800 (the chart label is partly hidden). Resistance: 70,000 (round number, now overhead), 71,870-72,070 (the broken 0.618 zone), 72,727 (the broken box floor), 72,890-73,437 (EMA7 and MA7), 74,840 (0.5), 74,917-75,473 (EMA14 and MA14), 77,154-78,236 (the 28s), then the 87,401.9 peak. Level to watch 67,650-67,900 below and 70,000 above. A daily close back over 70,000 says the flush was bought. A daily close above 72,727 says the box floor break was a fake-out. A close under 67,650 gives up the 0.786 zone. Consideration A -6.8% candle on elevated volume is a trend day, and I don't want to catch it mid-candle. I want stabilization first: a close well off the low, or a volume spike followed by a quiet retest that holds. With the 7s 6-7% overhead, a relief bounce of 3-4% can happen without changing anything, so a bounce alone isn't a signal. Trade plan Flush: buy 67,650-68,200 after price stabilizes there, stop under 66,500, about 1,400 of risk from 67,900. Targets are 70,000 and 72,727, roughly 1.5R and 3.4R. Reclaim: wait for a daily close above 72,727, buy the retest of 72,000-72,727, stop under 71,000, about 1,400 of risk from 72,400. Targets are 74,840 and 77,150, roughly 1.7R and 3.4R. I'm not buying 68,700 mid-candle. A stop under 67,500 risks about 1,200 to make about 1,300 to 70,000, roughly 1.1R. Invalid if A daily close under 67,650 gives up the 0.786 zone and opens 65,000 and then the August base, about 9% lower, and I'd stand aside rather than catch it. The flush idea is dead under 66,500, and the reclaim idea is dead on a daily close back under 71,000. The downtrend stays in charge until a daily close above 75,500. Risk note After a 7% day, volatility is elevated, so cut size or widen stops, and use limit orders. Liquidation cascades can run price through any level. Today's candle still has about 19 hours left, so judge on the close. Fib levels are zones, not guarantees, and they are measured from a base I read off the chart. Levels are read off my chart. Idea only, not financial advice. Capitulation candle or the first leg of a bigger move? Where this closes against 70,000 and 67,650 will say. #ByXIMPACT
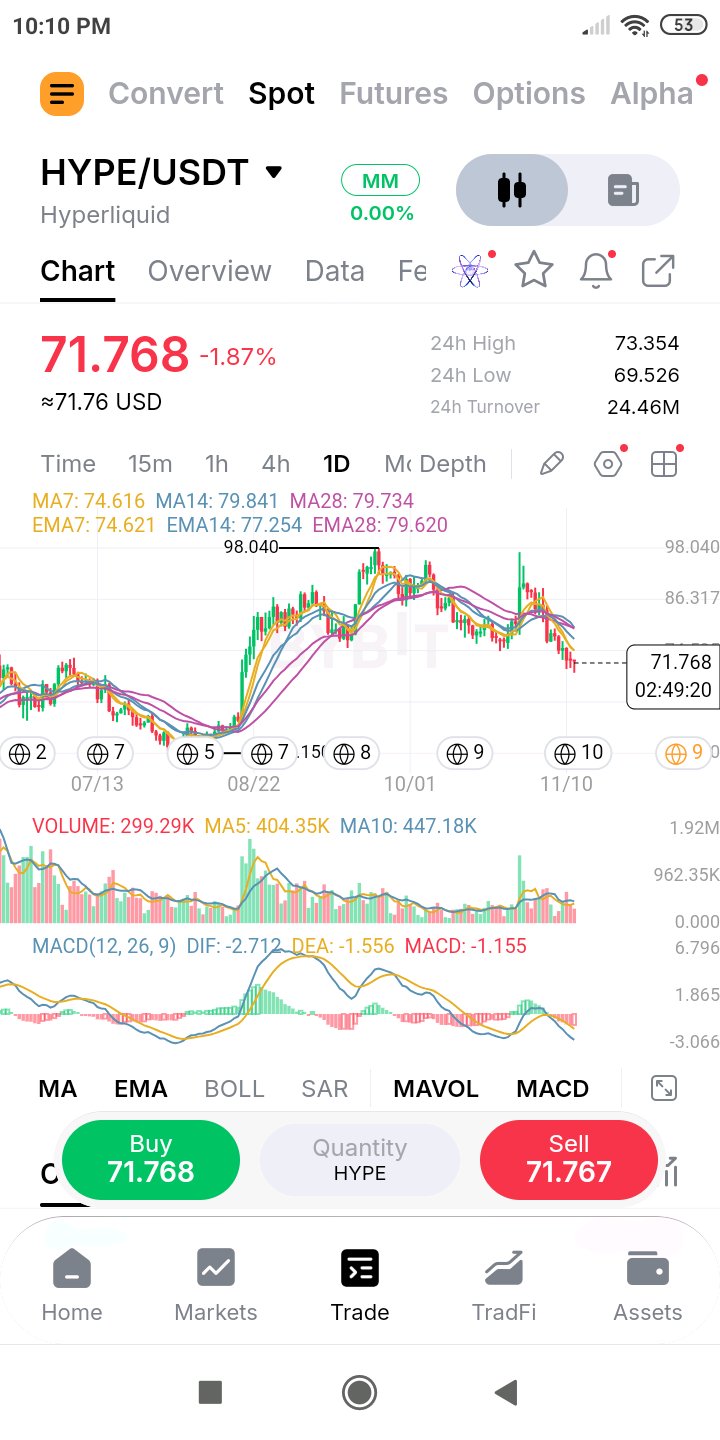
$HYPEUSDT se está desplomando y el reciente intento de subir ha fallado por completo. Contexto: Después de la subida masiva a 98.040, HYPE ha estado marcando una serie clara de máximos más bajos. Tuvimos un breve rebote hace poco, pero se estancó justo por encima de 86, y ahora estamos vendiendo agresivamente de nuevo, con una caída actual del -1.87% a 71.768. Las medias móviles (MA7 en 74.616, EMA14 en 77.254 y MA28 en 79.734) tienen todas una pendiente descendente, actuando como un techo dinámico pesado. Esta es una tendencia bajista confirmada. Volumen y rotación: La rotación de 24h es de 24.46M USDT. Observa las barras de volumen. El reciente rebote a 86 tuvo un volumen relativamente débil en comparación con la venta inicial. El volumen de hoy (299.29K) está por debajo de los promedios de 5 días (404.35K) y 10 días (447.18K). Estamos viendo una falta de convicción por parte de los compradores. El mercado intentó subir, no encontró seguidores y ahora está desangrándose hacia abajo. Soporte y resistencia: Soporte: 69.526 (El mínimo de 24h y piso local actual). Esta es la línea roja. Resistencia: 74.616 (MA7) y 77.254 (EMA14). La resistencia inmediata superior es estrecha. Nivel a vigilar: 69.526. Si el precio rompe por debajo de este mínimo de 24h, se confirma el siguiente tramo de la tendencia bajista macro. Si los toros quieren salvar este gráfico, deben recuperar la MA7 (74.616) inmediatamente, lo cual parece muy poco probable actualmente. Plan de trading: Corto: La tendencia es claramente bajista. Si el precio rebota ligeramente a la zona de 73.5 - 74.5 (donde se encuentran la MA7 y el máximo de 24h) y se rechaza, abre un corto en el máximo más bajo. Stop por encima de 76, objetivo de ruptura por debajo de 69.5, y déjalo correr hasta 65. Largo: Mantente al margen. Estás intentando atrapar un cuchillo cayendo en medio de una clara tendencia bajista. Invalidación: Un cierre diario por encima de la EMA14 (77.254) invalidaría la tesis bajista. Significaría que las medias móviles se han recuperado y la tendencia está cambiando. Hasta entonces, los osos tienen el control total. Nota de riesgo: Mira el MACD en la parte inferior. El DIF (-2.712) se está hundiendo bruscamente por debajo de la DEA (-1.556) y las barras rojas del histograma se están expandiendo. El impulso bajista se está acelerando. Además, observa que el precio actual está muy por debajo de la MA28 (79.734). La brecha entre el precio y el promedio de 28 días es amplia, lo que significa que cualquier rebote probablemente será aprovechado para vender. Mantén el tamaño de las posiciones pequeño. ¿Ha fallado oficialmente el rebote o queda una última defensa del piso de 69? #ByXIMPACT
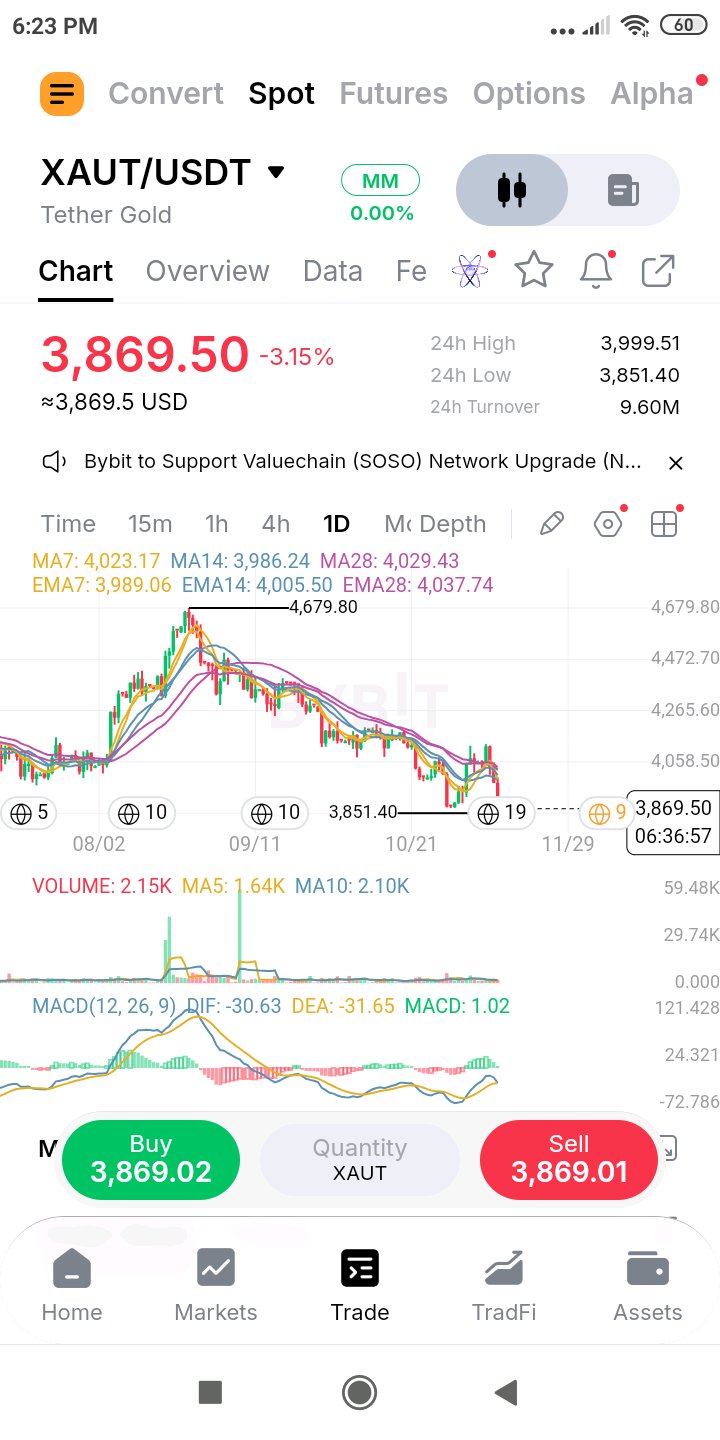
$XAUTUSDT just undercut the October low at 3,872 on above-average volume, and the daily close decides whether it's a real break or a false one. Context Today's low of 3,851.40 is a fresh low for the whole move. Price sits at 3,869.50 (-3.15%), about 3.3% under the 24h high of 3,999.51 and 17.3% under the 4,679.80 peak. The averages are still bunched in a 52-point band, MA14 3,986.24 at the bottom and EMA28 4,037.74 at the top, with EMA7 3,989.06, EMA14 4,005.50, MA7 4,023.17 and MA28 4,029.43 in between, and price has dropped out of the bottom of it. MACD (DIF -30.63, DEA -31.65, histogram +1.02) still shows a tiny green histogram, but that is a lagging leftover and it flips red with another down close. Turnover and volume 24h turnover is 9.60M USDT, roughly 2,450 XAUT, on a 24h range of 3,851.40 to 3,999.51, about 3.9%. Daily volume is 2.15K with about 6.6 hours left, already above the 5-day (1.64K) and 10-day (2.10K) averages, on pace for roughly 3.0K. Rising volume as price breaks a major low is the opposite of a quiet drift, because sellers are committing. That is why I respect the break until a close back above 3,872 says otherwise. The flip side is that a flush on volume like this is also what washouts look like, so the next one or two daily closes matter most. Support and resistance Support: 3,851 (new low), 3,800 (round number), 3,700 (round number), and nothing marked on this chart below the new low. Resistance: 3,872 (the broken October low), 3,986-3,989 (MA14 and EMA7), 4,000-4,005 (round number and EMA14), 4,023-4,038 (MA7, MA28 and EMA28), 4,047 (0.236 of the leg down), 4,168 (0.382), 4,266 (0.5), 4,363 (0.618), then the 4,679.80 peak. Level to watch 3,872 above and 3,851 below. A daily close back over 3,872 turns this into a false break. A daily close under 3,851 confirms new lows with no structure under them. Consideration A break of a major low on above-average volume usually deserves the benefit of the doubt until price proves otherwise. The retracement levels above are measured from the 4,679.80 peak to the new low, so treat them as provisional until the low settles. A relief bounce would have to chew through the 3,986-4,038 band, where six averages sit, before it means anything. Trade plan False break: if price closes back above 3,872, buy the retest of 3,860-3,885, stop under 3,830, about 45 of risk from 3,875. Targets are 3,986 and 4,047, roughly 2.5R and 3.8R. Flush: buy 3,780-3,820 only after a daily candle rejects the 3,800 round number, stop under 3,740, about 60 of risk from 3,800. Targets are 3,986 and 4,047, roughly 3.1R and 4.1R. I'm not buying 3,870 before the close. The break is on above-average volume, and a tight stop under 3,851 sits exactly where a continuation flush would take it out. Invalid if A daily close under 3,851 confirms the break, with 3,800 and then 3,700 next, and I'd stand aside rather than catch it. The false-break idea is dead under 3,830, and the flush idea is dead under 3,740. The bearish structure stays in charge until a daily close above 4,040, above every average. Risk note XAUT follows gold, so a macro headline can gap price through any level, and turnover under 10M means market orders can slip, so use limits. Today's candle still has about 6 hours left, so judge on the close. Levels are read off my chart. Idea only, not financial advice. Real break or false one? A daily close back above 3,872 or under 3,851 will say. #ByXIMPACT
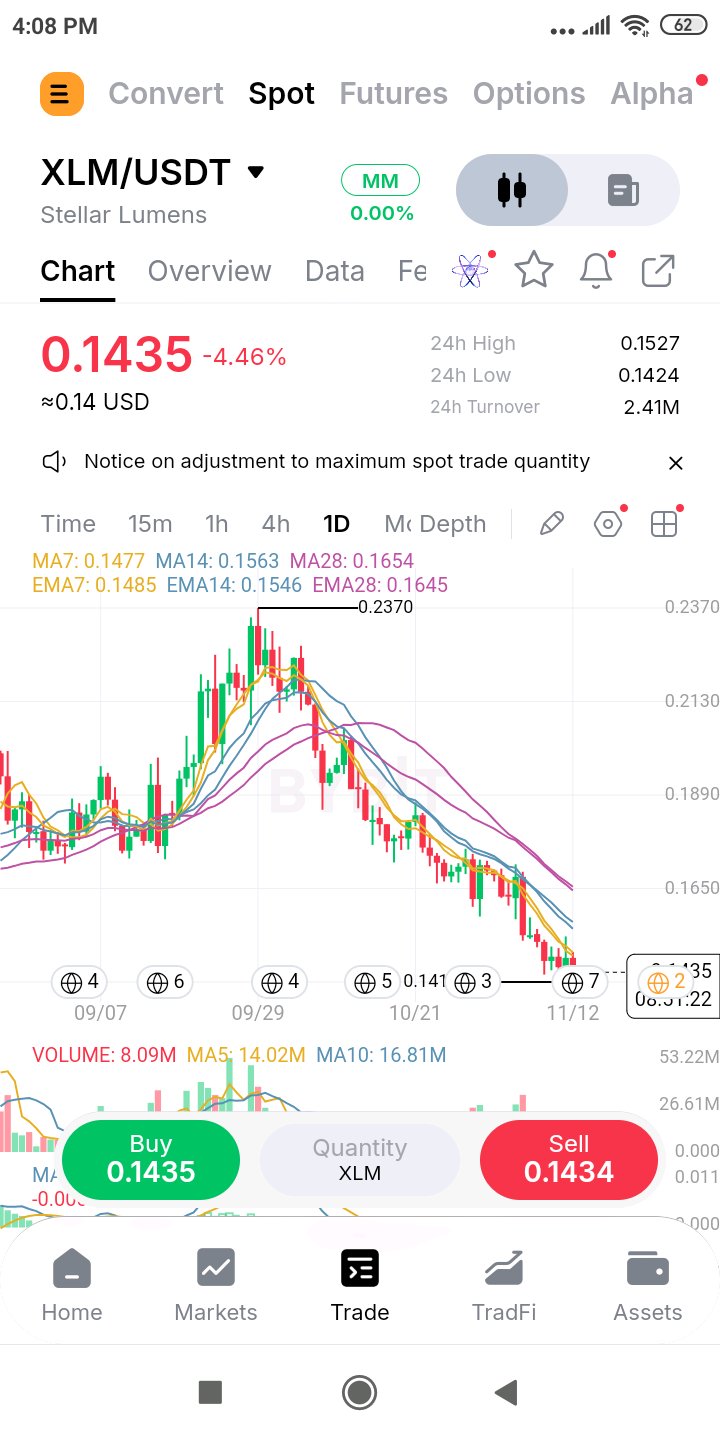
$XLMUSDT is sliding in a staircase with every bounce capped by the 7s, and the decline is on below-average volume, so there is no flush yet to call a bottom. Context XLM has fallen about 40% from the 0.2370 peak in a near-unbroken run of lower highs and lower lows, and it now trades about 15% under the 28-period averages, which sit roughly where the September advance launched (by my read). At 0.1435 (-4.46%) it is only 1.8% above the 0.141 recent low, and under all six averages: MA7 0.1477, EMA7 0.1485, EMA14 0.1546, MA14 0.1563, EMA28 0.1645 and MA28 0.1654. Today's 24h high of 0.1527 is 6% above price, so it sold off through the day instead of bouncing. Turnover and volume 24h turnover is 2.41M USDT (about 16M XLM) on a 24h range of 0.1424 to 0.1527, roughly 7.2%. Daily volume is 8.09M with about 9 hours left, on pace for roughly 12.8M, under both the 5-day (14.02M) and 10-day (16.81M) averages. A 4.5% drop on below-average volume is a grind, not a panic. A real washout would print volume well above the 10-day, and that hasn't happened. It also means the next leg lower doesn't need many sellers, and this is a thin pair, so it can move on little. Support and resistance Support: 0.1424 (24h low), 0.1410 (recent low, label partly hidden), 0.1400 (round number), then nothing marked on this chart. Resistance: 0.1477-0.1485 (MA7 and EMA7), 0.1500 (round number), 0.1527 (24h high), 0.1546-0.1563 (EMA14 and MA14), 0.1645-0.1654 (EMA28 and MA28, the launch zone), about 0.18-0.19 (the mid-October shelf, by my read), then the 0.2370 peak. Level to watch 0.1410-0.1400 below and 0.1485 above. A daily close under 0.1400 breaks the round number and the recent low together. A daily close above 0.1485 takes both 7s back and is the first step toward ending the staircase. Consideration Price sits about 15% under the 28s, which looks stretched, but in a staircase decline the averages keep falling onto price, so stretched is not a buy signal. What I want to see is a base: a flush on heavy volume, then a quiet retest that holds. Until then, any bounce is more likely a sell zone at the 7s than a turn. Trade plan Low retest: buy 0.1410-0.1430, stop under 0.1375, about 0.0045 of risk from 0.1420. Targets are 0.1527 and 0.1654, roughly 2.4R and 5.2R. Reclaim: wait for a daily close above 0.1485, buy the retest of 0.1470-0.1485, stop under 0.1420, about 0.0058 of risk from 0.1478. Targets are 0.1563 and 0.1654, roughly 1.5R and 3.0R. I'm not buying 0.1435 under falling 7s. A stop under 0.1375 risks about 0.0060 to make 0.0042 to the MA7, under 1R. Invalid if A daily close under 0.1400 breaks the floor with no marked support below, and I'd stand aside rather than average down. The low-retest idea is dead under 0.1375, and the reclaim idea is dead on a daily close back under 0.1420. The downtrend stays in charge until a daily close above 0.1563 and is retired only above 0.1654. Risk note XLM is a thinner pair, so market orders can slip. Use limits and keep size modest. Today's candle still has about 9 hours left, so judge on the close. Levels are read off my chart. Idea only, not financial advice. Staircase continuing or the last step? A daily close under 0.1400 or back above 0.1485 will say. #ByXIMPACT
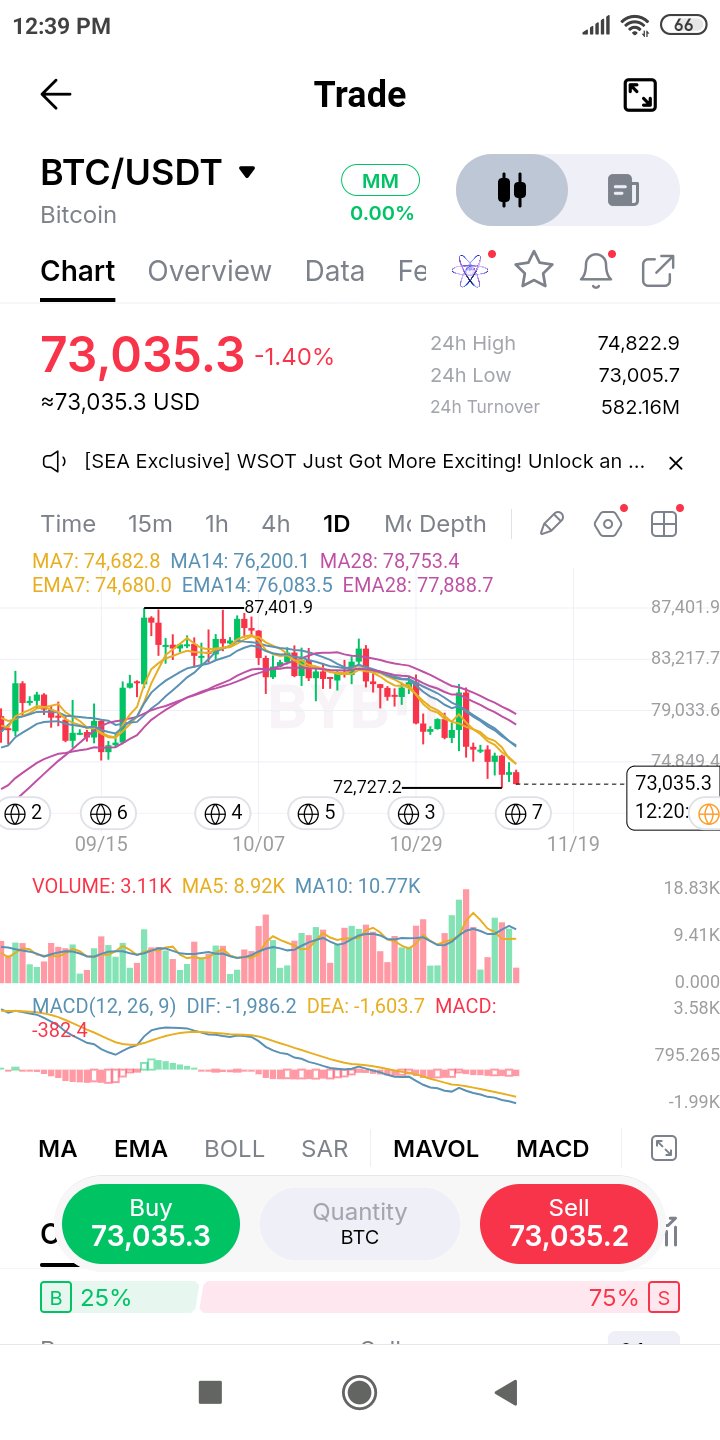
$BTCUSDT is back at the bottom of a two-day box after a second rejection at 74,820-74,850, and the volume behind the move down is fading. Context BTC has handed back about 57% of its advance from the 62,272 base to the 87,401.9 peak and is down 16.4% from the top. The 0.5 retracement and the 7-period averages stack at 74,680-74,850, and price has now turned from that line twice in two days. At 73,035.3 (-1.40%) it sits just 0.4% above the 72,727 low of the last sweep, which has held since. All six averages are overhead: EMA7 74,680.0, MA7 74,682.8, EMA14 76,083.5, MA14 76,200.1, EMA28 77,888.7 and MA28 78,753.4, the 7s about 2.3% above price and the 28s 6.6-7.8%. MACD (DIF -1,986.2, DEA -1,603.7, histogram -382.4) is at its lowest reading on this chart, so the path of least resistance is still lower. Turnover and volume 24h turnover is 582.16M USDT, roughly 7.9K BTC, on a 24h range of 73,006 to 74,823, about 2.5%. Daily volume is 3.11K with about 12 hours left, on pace for roughly 6.4K, well under the 5-day (8.92K) and 10-day (10.77K) averages. With the 5-day also under the 10-day, participation has been shrinking through the drift lower. A quiet fall into support is not a capitulation, because no flush has cleared the sellers out. It also means nobody is selling with conviction. The order book showed 75% of its visible size on the ask when I took this chart. Support and resistance Support: 73,006 (24h low, where price sits), 72,727 (the recent low), 71,870-72,070 (0.618 zone), 70,000 (round number), 67,650-67,900 (0.786 zone), then the base near 62,300. Resistance: 74,680 (EMA7 and MA7), 74,820-74,850 (rejected twice, with the 0.5), 76,084-76,200 (EMA14 and MA14), about 77,800-77,900 (0.382 and EMA28), 78,753 (MA28), about 81,500 (0.236), then the 87,401.9 peak. Level to watch 72,727 below and 74,850 above. The box is only about 2.9% tall, so the first daily close outside it is the signal. A close above 74,850 takes the 0.5 and the 7s together. Consideration A box with both sides quiet resolves with an expansion move, and the averages sliding down onto price tilt the odds toward the downside. But a drop on fading volume can also just bleed out and get bought, so I want a close, not a wick, before I pick a side. If the floor gives way, the 0.618 zone at 71,870-72,070 is only about 1,000 points lower, and there is no marked structure below it except the 70,000 round number. Trade plan Floor: buy a dip into 72,730-73,000, stop under 71,900 (below the 0.618 zone), about 1,000 of risk from 72,900. Targets are 74,680 and 76,200, roughly 1.8R and 3.3R. Reclaim: wait for a daily close above 74,850, buy the retest of 74,680-74,850, stop under 73,700, about 1,070 of risk from 74,770. Targets are 77,800 and 81,470, roughly 2.8R and 6.3R. I'm not buying a push into 74,700-74,850. That line has rejected price twice already, and a stop under 73,700 would risk about 1,100 to make about 1,400 to the 14s, roughly 1.3R. Invalid if A daily close under 72,700 breaks the box floor, with the 0.618 zone next and then 70,000, and I'd stand aside rather than catch it. The floor idea is dead under 71,900, and the reclaim idea is dead on a daily close back under 73,700. The downtrend stays in charge until a daily close above 76,200. Risk note Liquidation cascades can run BTC through any level, so keep size modest and use limit orders. Today's candle still has about 12 hours left, so judge on the close. Fib levels are zones, not guarantees, and they are measured from a base I read off the chart. Levels are read off my chart. Idea only, not financial advice. Floor or trapdoor? A daily close under 72,700 or above 74,850 ends the box. #ByXIMPACT
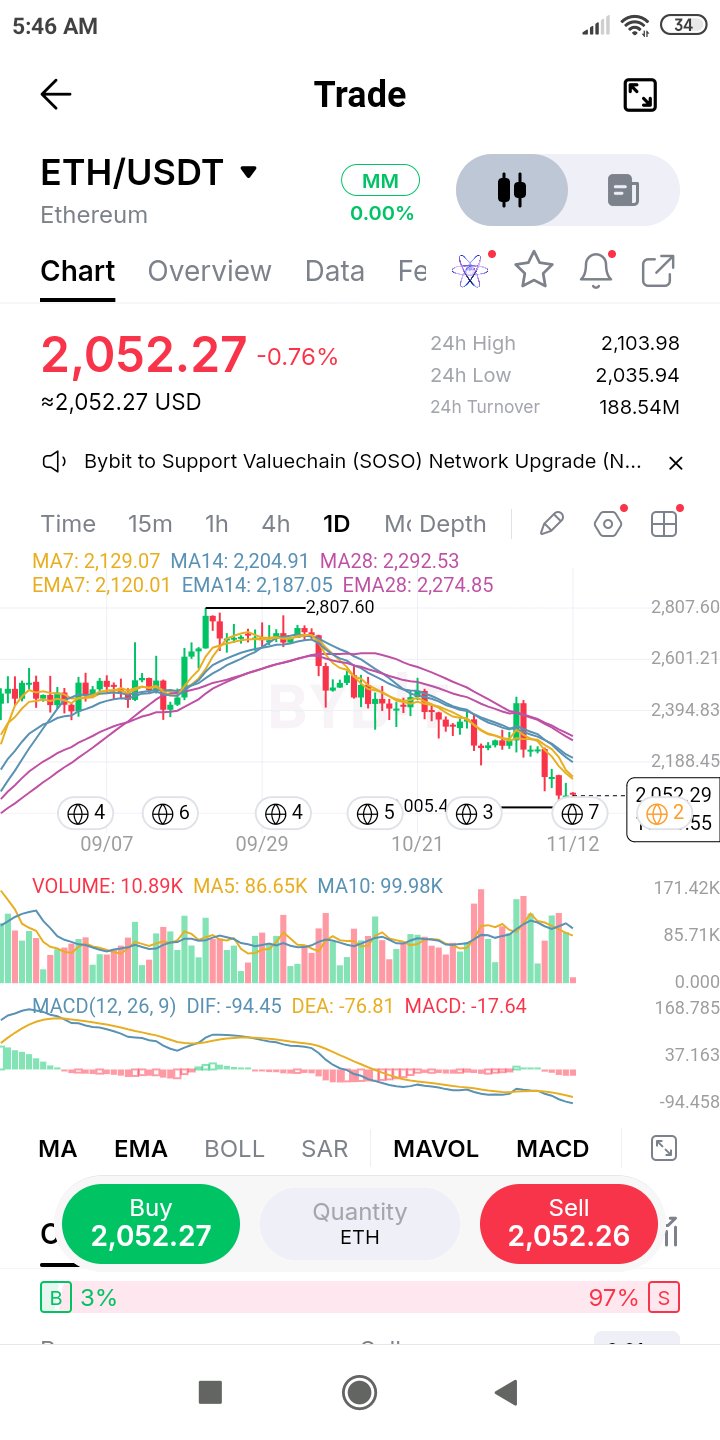
$ETHUSDT is holding a higher low above 2,005, but with 97% of the visible book on the ask and the 7s still 3% overhead, I'm not trusting it yet. Context ETH is down about 27% from the 2,807.60 peak and has spent the last day hovering over the 0.786 retracement zone, roughly 2,033-2,047 (the base label is hidden, so I give a zone). The 2,005.46 low from the last sweep has held, and today's 24h low of 2,035.94 sits a touch higher. At 2,052.27 (-0.76%) price is under all six averages: EMA7 2,120.01, MA7 2,129.07, EMA14 2,187.05, MA14 2,204.91, EMA28 2,274.85 and MA28 2,292.53. The 7s are about 3.3-3.7% overhead and the 28s about 11-12%. MACD (DIF -94.45, DEA -76.81, histogram -17.64) is at its lowest reading on this chart, so momentum is still falling. Turnover and volume 24h turnover is 188.54M USDT, roughly 91K ETH, just under the 10-day average of about 100K. The 5-day average (86.65K) sits below the 10-day, so participation has been fading since the early-November leg down, where the heaviest volume on this chart printed. Today's candle is only about 5 hours old (10.89K), so its own volume tells me little yet. Quieter trade while price holds a higher low is how bases start, but there has been no flush and reclaim yet. The order book showed 97% of its visible size on the ask when I took this chart, which says nobody is stepping up to defend price in the near term. Support and resistance Support: 2,036 (24h low), 2,033-2,047 (0.786 zone), 2,005 (the low), 2,000 (round number), then the base around 1,822-1,840. Resistance: 2,104 (24h high), 2,120-2,129 (EMA7 and MA7), 2,187-2,205 (EMA14 and MA14, with the 0.618 zone at 2,198-2,210 inside), 2,275-2,293 (EMA28 and MA28), 2,315-2,324 (0.5), about 2,435 (0.382), then the 2,807.60 peak. Level to watch 2,005 below and 2,130 above. A daily close over 2,130 retakes both 7s in one move. A daily close under 2,005 gives up the last low and opens the base. Consideration A higher low is only a hint while every average is still above price and falling. When buyers do return, I expect it to show first as a green day on volume above the 10-day average, near 100K ETH, with a close above the 2,104 high. Without that, a bounce toward the 7s is more likely a sell zone than a trend change. Trade plan Floor: buy 2,005-2,040 (the low and the 0.786 zone), stop under 1,985, about 45 of risk from 2,030. Targets are 2,129 and 2,205, roughly 2.2R and 3.9R. Reclaim: wait for a daily close above 2,130, buy the retest of 2,104-2,130, stop under 2,075, about 40 of risk from 2,115. Targets are 2,205 and 2,293, roughly 2.2R and 4.4R. I'm not buying 2,052 mid-range. A stop under 2,005 risks about 47 to make about 77 to the 7s, only about 1.6R into a stacked ceiling. Invalid if A daily close under 2,005 breaks the last low and opens the base about 9% lower, and I'd stand aside rather than average down. The floor idea is dead under 1,985, and the reclaim idea is dead on a daily close back under 2,075. The downtrend stays in charge until a daily close above 2,205. Risk note ETH can swing 3-6% in a day, so a stop inside that range is noise. Use limit orders, keep size modest, and judge on closes. Today's candle is young, so volume and price will shift by the close. Fib levels are zones, not guarantees. Levels are read off my chart. Idea only, not financial advice. Is 2,005 the floor or just a landing? A daily close above 2,130 or under 2,005 settles it. #ByXIMPACT