IBRAHIMcrypto
64394Me gusta0Compartir en el chat1782Aficionados40Seguir
PRO CRYPTO TRADER / MENTOR CRYPTO GUY 💯 /NFTs lover🎨/GAMER💻🎮/🏋
PRO CRYPTO TRADER / MENTOR CRYPTO GUY 💯 /NFTs lover🎨/GAMER💻🎮/🏋
If you think $HYPEUSDT has permanently topped just because the rest of crypto is digital trash, take a hard look at its ever expanding fundamentals Why does this matter? Because Hyperliquid is a revenue machine where every dollar of collateral and every dollar of trading volume contributes to deflationary $HYPEUSDT buybacks More adoption → less circulating $HYPE overtime. Its that simple and no other asset has this. $TSLA ran hard off its early-November low, broke the prior swing high, and is now pulling back. I'm leaning long, but I'm not buying here. I want price to come down into a specific pullback zone first. Chasing the middle of a pullback is how you get a bad entry. The drop from the recent high looks like a retracement inside the up-leg, not a trend change. The 12h still prints higher lows. Why the zone matters: - The 4h, 12h and daily moving averages stack at the same level - The 62% retracement of the last up-leg lands there too - Recent equal lows sit just below it Four separate reasons on one shelf make a bounce there mean more. The ICT read: those equal lows hold a pool of stop orders. A sweep through them that snaps back into the discount zone is the setup I'd take. Targets are the liquidity resting above the recent swing highs. Where I'm wrong: if price gives up the 12h swing low, the daily 200-day average and the bottom of the optimal retracement band together, the pullback read is dead and I step aside. Risks: Nvidia earnings on Nov 18 and December rate-hike worries could shake AI and high-beta names. Thin weekend pricing means the Monday open can gap. Not investment advice. All decisions and responsibility are your own. $BTC has only been oversold on the weekly 4 times in it's entire history 📉 But, an oversold weekly RSI hasn't always marked the final bear-market bottom. 📉 2015: BTC bottomed 210 days later. 📉 2019: Oversold RSI coincided with the bottom. 📉 2022: BTC bottomed 147 days later. 2026: Already 280 days since the initial oversold signal, with a definitive bottom still to be confirmed. When BTC first became oversold this cycle, it was trading around $60,000. Yesterday's flush saw BTC trade as low as $62,000, meaning price has spent 280 days without establishing a sustained recovery. This is the longest period between an initial weekly oversold RSI signal and a confirmed cycle bottom among the historical examples examined. Only in 2019 did the oversold RSI coincide with the final bottom. The other examples tell us, an oversold weekly RSI doesn't guarantee an immediate reversal. Historically, it has often been followed by months of further consolidation or downside before a definitive bottom forms. #IMPACTbyTrade
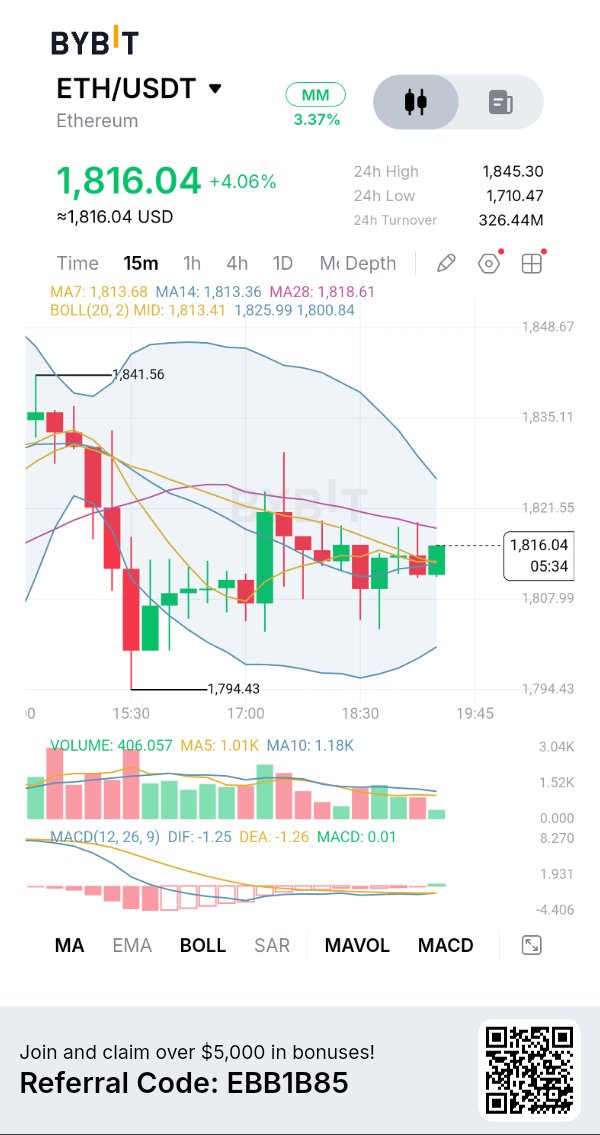
ETH Attempts Recovery Above $1,816: Are Buyers Preparing a Stronger Reversal? Ethereum is showing signs of short-term stabilization after experiencing considerable selling pressure, but the current recovery still needs confirmation. ETH has managed to reclaim the $1,800 region following a decline toward $1,794.43, and buyers are now attempting to build momentum around $1,816. The important question is whether this recovery can develop into a sustainable upward move or whether sellers will use the current bounce as another opportunity to regain control. CHART + TECHNICAL ANALYSIS My Bybit $ETHUSDT 15-minute chart shows ETH trading around $1,816.04, up approximately 4.06%, with a 24-hour high of $1,845.30 and low of $1,710.47. The recent price structure shows a sharp decline followed by a recovery and consolidation. Buyers have defended the $1,794.43 swing low, but price is still approaching several overhead resistance levels. The moving averages provide an interesting picture. MA7 is around $1,813.68, MA14 around $1,813.36 and MA28 around $1,818.61. ETH is trading above the shorter averages but remains below MA28, making $1,818.61 an important immediate resistance reference. The Bollinger Bands show a middle line around $1,813.41, an upper band near $1,825.99 and a lower band around $1,800.84. A sustained move above the middle band could strengthen the recovery, while rejection around the upper band would suggest that buyers still face considerable resistance. MACD + VOLUME ANALYSIS MACD is showing an early improvement, with DIF at -1.25, DEA at -1.26 and histogram around +0.01. The slightly positive histogram suggests that bearish momentum is easing. However, both MACD lines remain below zero, meaning a full bullish momentum reversal has not yet been confirmed. Volume currently stands around 406.057, below MA5 at 1.01K and MA10 at 1.18K. This is an important concern because the recovery is developing without strong participation. I would prefer to see expanding volume during an upward breakout before treating this move as a convincing reversal. BULLISH SCENARIO If ETH maintains support around $1,813–$1,814 and successfully reclaims $1,818.61, I would watch for a continuation toward $1,821.55. A stronger breakout could open the way toward $1,825.99, which aligns with the upper Bollinger Band. My preferred entry approach would be to wait for a decisive 15-minute close above resistance, followed by a successful retest with improving volume. A sustained breakdown below $1,807.99 would weaken this immediate bullish setup. MY TRADING PLAN I wouldn't chase the current recovery while ETH is trading between support and resistance. For a long position, I want to see buyers reclaim $1,818.61, confirm the breakout and demonstrate stronger volume. For a short position, I would wait for a confirmed breakdown below $1,807.99 and a failed recovery attempt. #IMPACTbyTrade
QNT Surges 10% as Bulls Approach $157
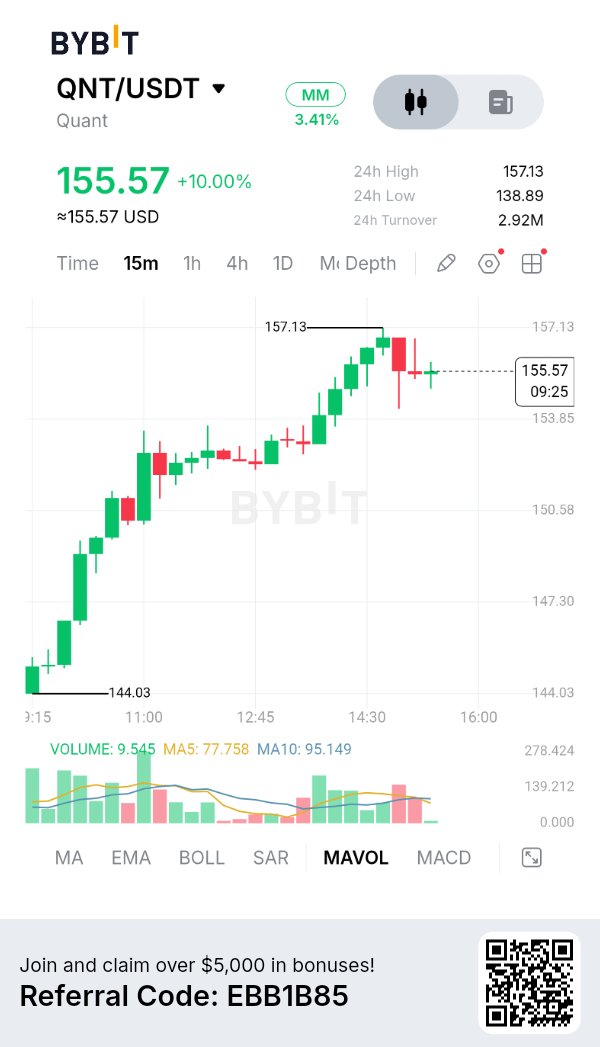
Quant's QNT is demonstrating strong intraday buying momentum, with price advancing from the $144 region toward $157.13 before encountering some selling pressure. The approximately 10% gain is significant, but the latest consolidation suggests that buyers may need to absorb available supply before attempting another upward move. My Bybit $QNTUSDT 15-minute chart shows price trading around $155.57, with a 24-hour high of $157.13 and a low of $138.89. The structure is currently bullish, with a sequence of higher highs and higher lows indicating that buyers have maintained control throughout most of the observed session. CHART + TECHNICAL ANALYSIS The most important development is the strong recovery from the visible $144.03 low. QNT advanced through the $147.30 and $150.58 regions before extending toward $157.13. This movement demonstrates considerable short-term buying interest. However, price is now consolidating around $155.57 after the rejection near the session high. The immediate resistance is $157.13. A convincing breakout above this level, supported by stronger volume, could create room for another upward extension. On the downside, I am watching $153.85 as the first important support reference. Below that, $150.58 becomes a more significant level to monitor, followed by the $147.30 region. VOLUME AND MARKET PARTICIPATION Volume currently reads approximately 9.545K, compared with MA5 at 77.758K and MA10 at 95.149K on the supplied chart. This is an important observation. Although QNT has recorded an impressive price advance, the latest trading activity is considerably below its volume averages. My interpretation is that the market needs renewed participation to sustain another breakout. Without stronger buying activity, the current consolidation could develop into a deeper pullback. I would particularly watch whether volume expands when price approaches $157.13 again. FUNDAMENTAL PERSPECTIVE Quant occupies an interesting position in the blockchain infrastructure sector through its Overledger technology. Its broader proposition focuses on interoperability, allowing different distributed ledger networks and existing financial infrastructure to communicate and exchange information. This is particularly relevant as financial institutions explore tokenization, digital asset infrastructure and the integration of blockchain technology into existing systems. QNT also has utility within the Quant ecosystem, including its role in accessing network services and supporting the platform's economic model. BULLISH SCENARIO If QNT maintains support around $153.85 and successfully breaks above $157.13 with stronger buying volume, I would consider the possibility of another bullish continuation. My next upside reference would be $160, followed by $163 as a further extension area. I would prefer a confirmed 15-minute breakout followed by a successful retest before considering an entry. A sustained move below $153.85 would weaken this immediate bullish setup. BEARISH SCENARIO If QNT repeatedly fails to overcome $157.13 and subsequently loses $153.85 on a decisive 15-minute close, I would watch for a failed retest before considering a bearish opportunity. The next downside reference would be $150.58, followed by $147.30. A deeper correction toward these levels would not automatically destroy the broader recovery, but it would indicate that buyers are losing their immediate advantage. A strong reclaim of $157.13 would invalidate this short-term bearish scenario. MY TRADING PLAN I wouldn't chase QNT after an approximately 10% intraday advance. Entering directly below resistance without confirmation could expose a position to unnecessary volatility. For a bullish setup, I want to see price hold $153.85, break $157.13 and demonstrate stronger volume during the breakout. For a bearish setup, I would wait for a confirmed breakdown below $153.85 and a failed recovery attempt. Position size should remain controlled, with a predefined stop-loss and partial profit-taking at the first target. MY INTERPRETATION The encouraging development is the strength of QNT's recovery from $144.03 and the formation of a clear upward intraday structure. However, the declining volume readings near the current price suggest that buyers need to demonstrate additional commitment before I can confidently expect another major upward extension. My short-term outlook remains cautiously bullish while $153.85 holds. The $157.13 resistance is the immediate test. If buyers overcome it with convincing volume, the recovery could continue. If they fail, a retest of lower support becomes increasingly possible. For now, I would rather wait for confirmation than chase an already extended move. The next reaction around $157.13 could determine QNT's next meaningful direction. #IMPACTbyTrade
INTERESTING IS HAPPENING WITH $HYPE
While $HYPEUSDT continues to experience significant price volatility, CoinStats data reveals a completely different trend beneath the surface. The percentage of CoinStats users holding $HYPE has climbed from approximately 0.59% to over 1.10%. That's an increase of more than 85% in the proportion of users holding the token. And the most interesting part? The chart shows a sustained upward trend, with new highs appearing even after temporary pullbacks. To me, this suggests that interest in holding $HYPE has been expanding within the CoinStats user base, despite the uncertainty surrounding short-term price movements. Of course, this data represents CoinStats users rather than the entire Hyperliquid investor population, and it doesn't tell us how much $HYPE each person holds. Still, the direction is worth paying attention to. Prices can fall while the proportion of portfolio trackers holding an asset continues to rise. That's exactly the kind of divergence I like to monitor when evaluating market sentiment. The price chart shows volatility. The ownership trend shows growing participation. #IMPACTbyTrade
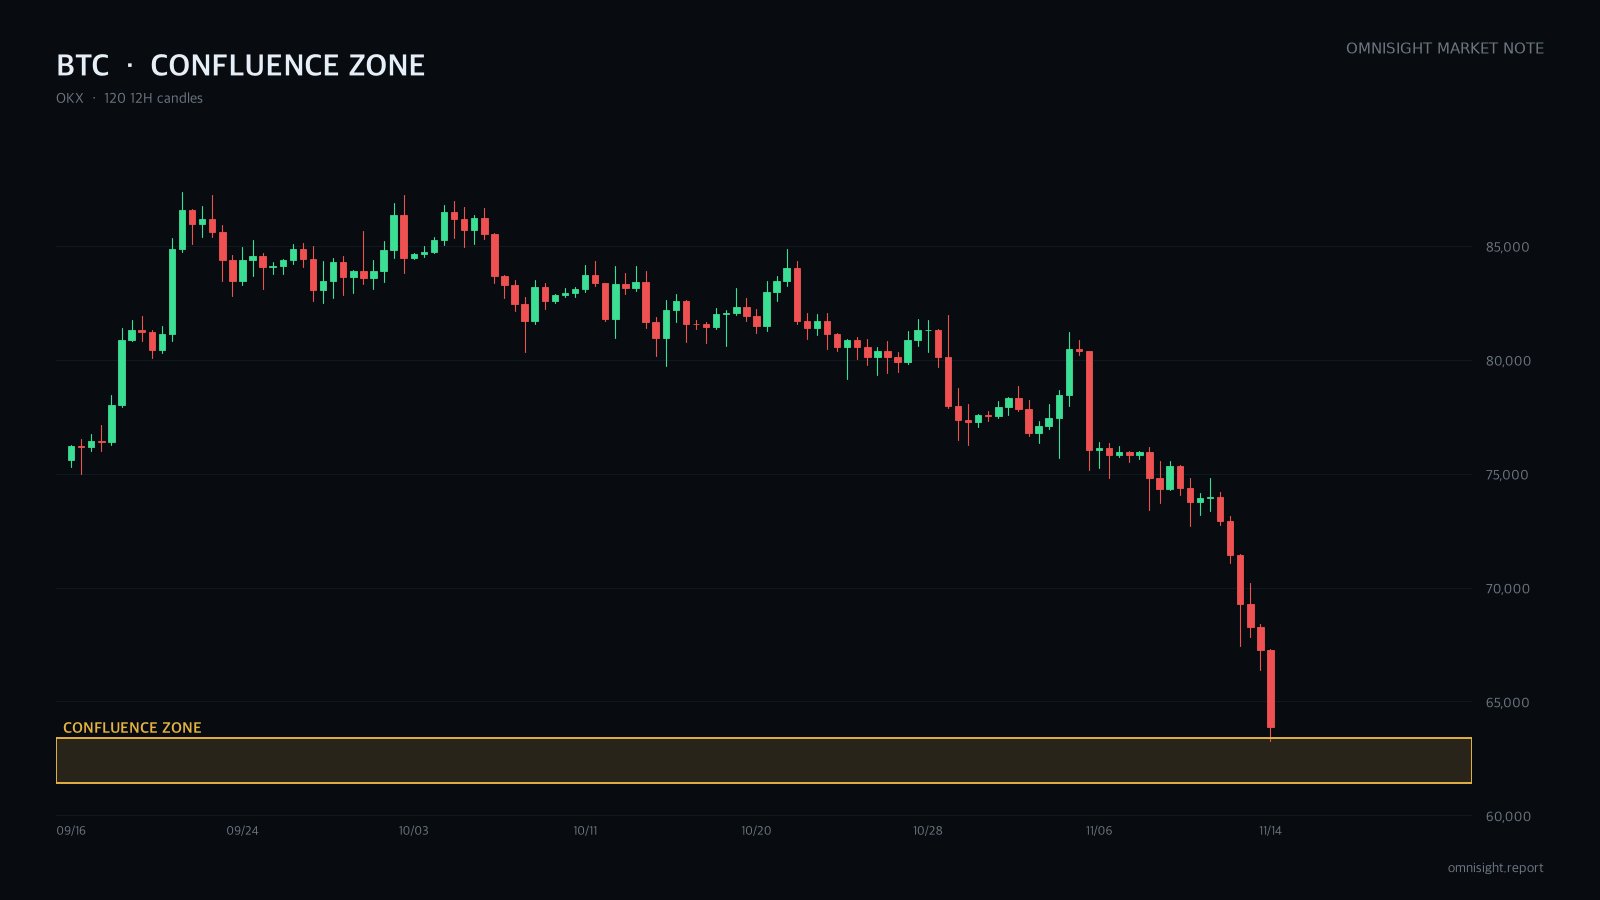
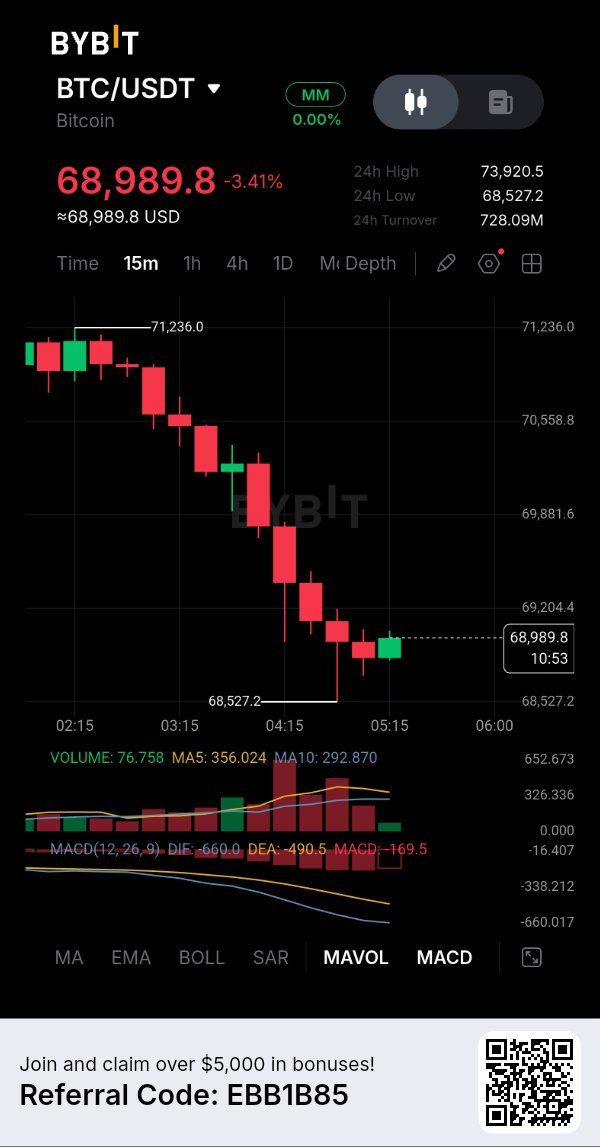
I'm leaning long $BTCUSDT, but not at the current price. It slid hard in under two weeks and is now sitting on the old base where the last rally started. I want a limit fill on one more flush under the lows. The catch: every timeframe is still in a downtrend. Context: it fell close to 6% this morning alone and sits below every moving average. Funding is negative and fear is extreme. Why I still lean up: - Three of four technical methods point long, and all three flag the same zone. - Volume on the daily, hourly and 15m charts printed range highs. That looks like capitulation. - On the 1h, price made a lower low while RSI made a higher low. Downside force is fading. Different methods, same area. That overlap is why I'd rest an order there. The Elliott read: the drop from the top is a clean five-wave move. Wave 5 already exceeds wave 1's length, so it's late. I'm waiting just above the extension targets for that last leg to finish. Where I'm wrong: a daily close below the old accumulation base, which also breaks the extension count. Then it's a deeper leg, not a bottom. Risks: Fed hike odds and ETF outflows keep macro bearish. Thin weekend liquidity can run stops fast. Not investment advice. All decisions and responsibility are your own. #IMPACTbyTrade
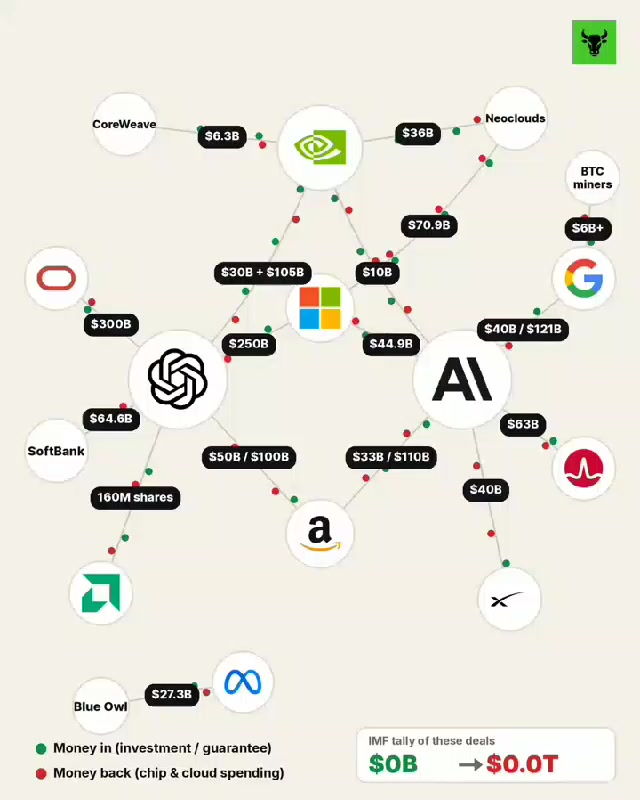
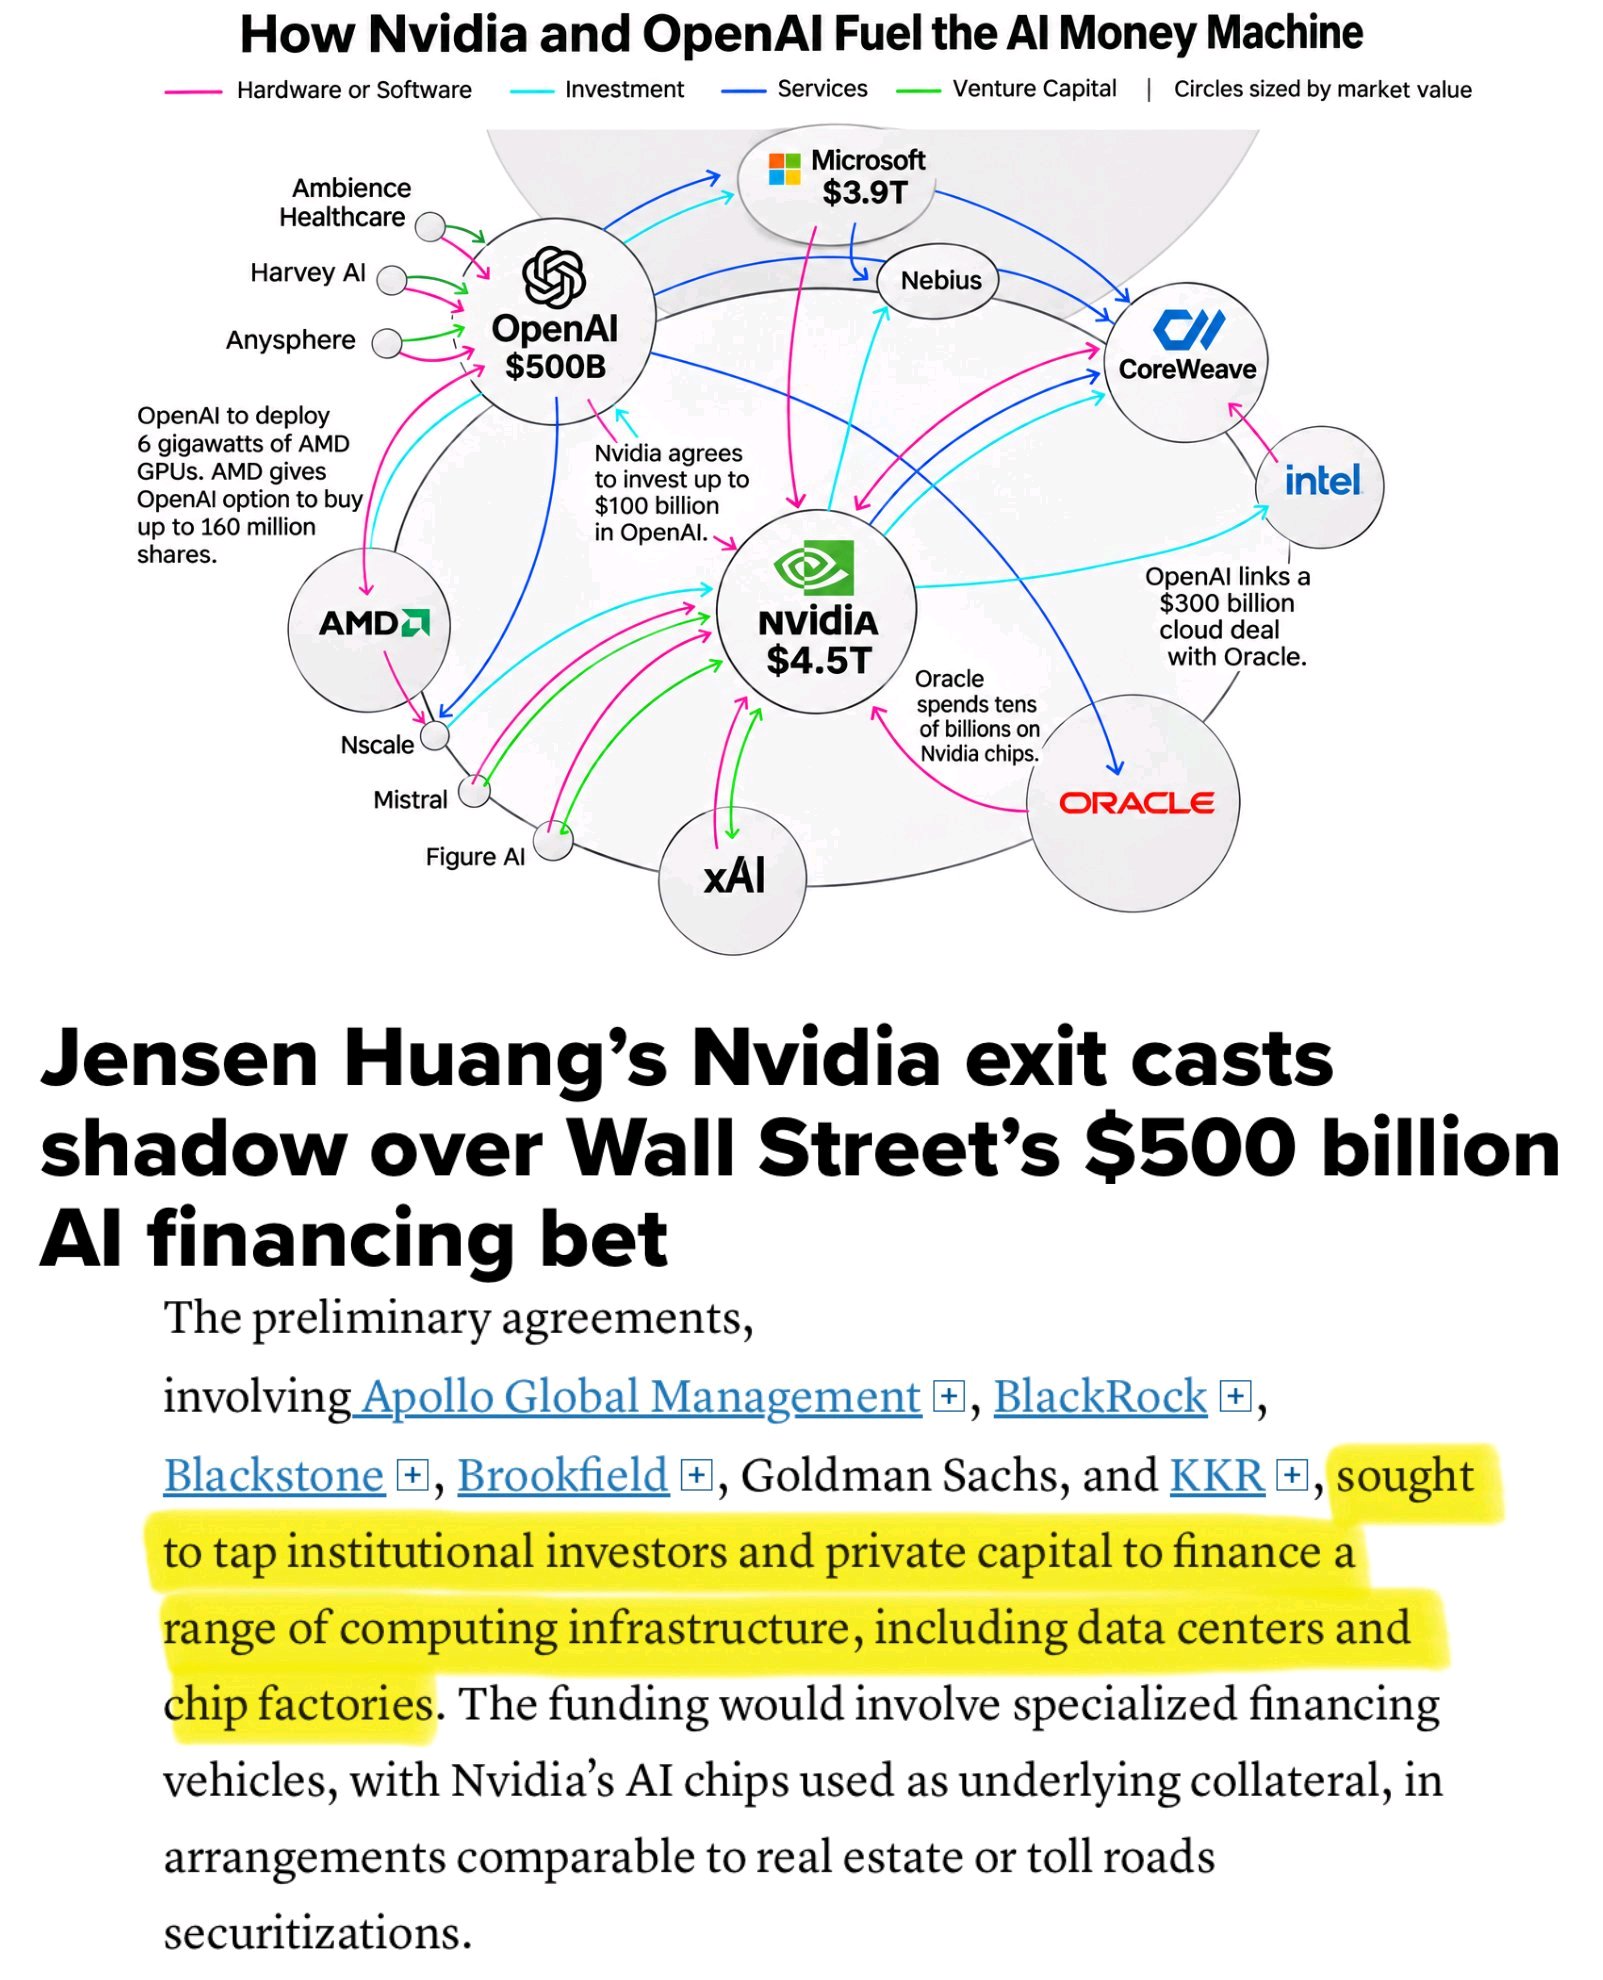
The IMF has officially sounded the alarm that circular financing deals tied to the AI boom total a whopping $1.4 trillion (about 1,900 trillion won) 🤯 In short, big tech and chipmakers are investing in and guaranteeing debt for the customers that buy their products, then that money goes around and around and comes back as big tech revenue. It’s a massive round-robin scheme lol Here’s a rundown of all 17 AI circular deals now disclosed to the market. The numbers are genuinely insane. 1. Nvidia $NVDAXUSDT ↔ OpenAI Nvidia is investing $30 billion in OpenAI and guaranteeing up to $105 billion in leases for an Ohio data center. OpenAI is filling that data center with Nvidia chips. 2. Oracle $ORCL ↔ OpenAI OpenAI has signed a $300 billion cloud deal with Oracle. Oracle is maxing out its borrowing to build it. 3. Microsoft $MSFT ↔ OpenAI Microsoft owns about 27% of OpenAI, and OpenAI has committed to spending $250 billion on Microsoft’s Azure cloud. 4. SoftBank ↔ OpenAI SoftBank has poured $64.6 billion into OpenAI, and OpenAI is renting data centers from SoftBank subsidiary SB Energy. 5. Amazon $AMZN ↔ OpenAI Amazon is investing up to $50 billion in OpenAI, and OpenAI has expanded its Amazon cloud contract by another $100 billion. 6. AMD $AMD ↔ OpenAI AMD is giving OpenAI warrants to buy up to 160 million shares of its stock at $0.01 per share (basically free). In return, OpenAI buys AMD chips. 7. Google $GOOGL ↔ Anthropic Google is investing up to $40 billion in Anthropic, and Anthropic has committed to spending at least $121 billion on Google Cloud. 8. Amazon ↔ Anthropic Amazon is investing up to $33 billion in Anthropic, and Anthropic has committed to spending at least $110 billion on AWS. 9. Broadcom $AVGO ↔ Anthropic Banks are lending $63 billion to a special-purpose company (SPC) to buy Broadcom chips and lease them to Anthropic. Broadcom is even guaranteeing the residual value of those used chips. 10. Microsoft + Nvidia ↔ Anthropic Together, the two are investing up to $15 billion, and Anthropic has committed to spending at least $44.9 billion on Microsoft’s cloud. 11. SpaceX $SPCXXUSDT ↔ Anthropic SpaceX is taking out a $40 billion loan to buy Nvidia chips and reselling that computing power to Anthropic. By the way, Nvidia is a SpaceX shareholder. 12. Nvidia ↔ CoreWeave $CRWV Nvidia owns about 11% of CoreWeave and has guaranteed it will buy $6.3 billion worth of unused capacity. CoreWeave, of course, buys Nvidia chips. 13. Nvidia ↔ Neoclouds Nvidia has promised to buy $36 billion worth of capacity from small and midsize AI cloud companies. They use that guaranteed revenue as collateral to borrow money and buy Nvidia chips. 14. Microsoft ↔ Core Scientific, Nebius $NBIS, IREN $IREN Microsoft has signed contracts worth up to $70.9 billion with them, and they use that money to buy GPUs. 15. Google ↔ Former Bitcoin Miners Google is guaranteeing billions of dollars in data center leases for TeraWulf $WULF and Cipher Mining $CIFR in exchange for equity stakes. 16. Meta $META ↔ Blue Owl $OWL They’re building a $27.3 billion data center through a joint venture, with Meta backing it with $28 billion in guarantees. 16. Meta $META ↔ Blue Owl $OWL They’re building a $27.3 billion data center through a joint venture, with Meta backing it with $28 billion in guarantees. 17. Anthropic IPO Chip and cloud suppliers Nvidia, Google, AMD, Micron $MU, Broadcom, and Microsoft are buying $26 billion worth of shares in Anthropic’s IPO. Meanwhile, Anthropic alone owes these companies hundreds of billions of dollars going forward 😂 Why does this matter? As long as the money keeps circulating and the debt keeps rolling, everyone from big tech to semiconductors to data centers looks like their revenue is going through the roof, with earnings surprises every quarter. But here’s the thing. This $1.4 trillion party only keeps going if end consumers spend big on AI services. The moment monetization at the end of the chain falls short of expectations, the IMF’s bombshell warning is that AI model companies and neoclouds that borrowed to fund capital expenditures (CAPEX) will be the first to blow up, and big tech companies with equity investments and lease guarantees tied up in the mix could see their heads roll in a domino effect. Bottom line: When the money is flowing, it’s the most dazzling perpetual motion machine in the world, but the moment the pump stops, it could turn into a historic domino collapse. So you absolutely have to check the guarantees and debt behind the revenue numbers. Not a recommendation to buy or sell any particular stock, nor investment advice. You make your own decisions and bear your own responsibility (Not Financial Advice) #IMPACTbyTrade
$HYPEUSDT perdió su promedio de 1 año y el mínimo anterior (swing low) en un cierre diario, cayendo más de un 12%. Mi sesgo es bajista (short). Pero no voy a vender aquí. Quiero un rebote hacia la zona que dejó atrás la ruptura. Vender en el hueco suele ser la peor ejecución. La estructura es clara en la bajada. Máximos más bajos tanto en 4h como en 12h. EMAs apiladas de forma bajista. En lo que se basa la lectura combinada: - Tres de los cuatro métodos técnicos apuntan a la baja - El cierre diario se sitúa por debajo tanto del promedio anual como del antiguo soporte - Contexto de aversión al riesgo (risk-off): IPC alto, tasas cerca de máximos, salidas de ETFs Razones acumuladas en una banda estrecha dan cobertura a los vendedores. Visión ICT: el precio se sitúa profundamente en el lado de descuento (discount) del movimiento. El lado de prima (premium) contiene el gap sin cubrir de la caída, los mínimos de 4h rotos, la EMA20 de 1h y el retroceso profundo de Fibonacci, todo solapándose. Ahí es donde vendería. Por debajo, la liquidez del lado de venta (sell-side liquidity) bajo el mínimo reciente es el primer objetivo. Dónde me equivoco: un impulso a través del máximo interno de 4h y el promedio anual roto. Eso sería un cambio de estructura, no un retroceso. Riesgos: todas las temporalidades están profundamente sobrevendidas, y la lectura de Elliott prevé un rebote. Si el precio se desliza sin rebotar, la orden nunca se ejecuta y no voy a perseguir el precio. No es consejo de inversión. Todas las decisiones y responsabilidades son suyas. #IMPACTbyTrade
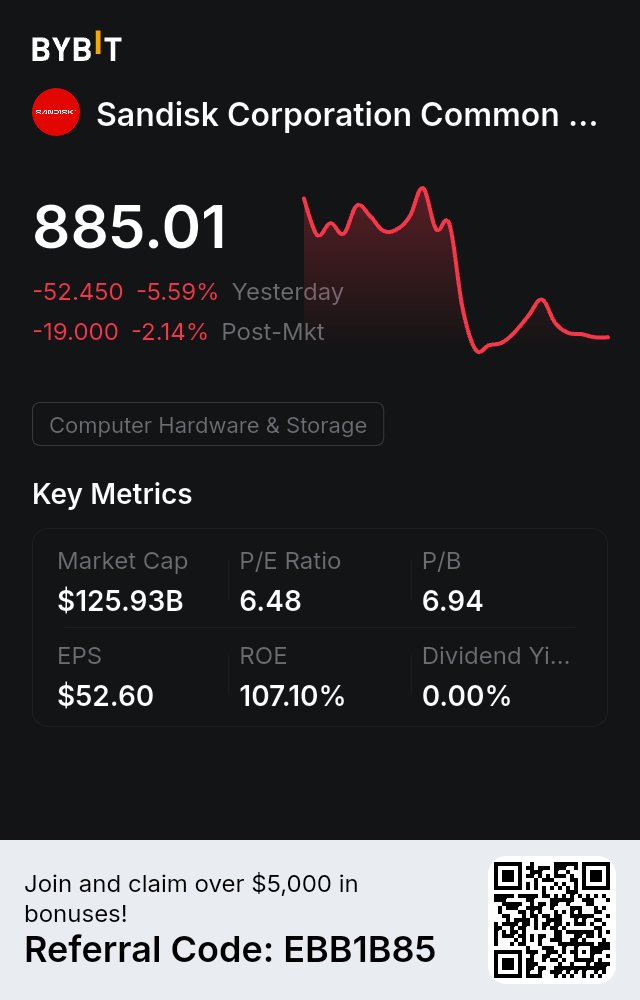
$SNDK fell another 8% or so today, down nearly 15% over two days. $MU fell 4% to 5%, and SK hynix fell about 5%. First, separate the fundamentals from the stock price. $MU posted $54.2 billion in revenue last quarter, up from just $11.3 billion a year earlier, with a GAAP gross margin of 86.8%. Its guidance calls for another roughly 13% increase next quarter. That performance would be top-tier in any industry. Yet $MU is down about 20% over the past month and has fallen more than 30% from its high. With numbers this good, why is the stock still falling? The most dangerous phase for memory stocks often isn't when they're losing money, but when margins are sky-high and the market starts pricing in the next wave of supply ahead of time. A gross margin of 86.8% in an industry known for its wild swings is enough to keep you up at night on its own. The selling isn't about this quarter; it's a discount for "how long can this peak last?" There's another layer of pressure this week. $NVDA is changing CEOs, and the market is worried that the pace of downstream AI compute orders could be disrupted. HBM is closest to $NVDA, so it's the first to get repriced. $SNDK makes NAND, so it's a bit further removed from $NVDA, but it had rallied even harder beforehand. On Wednesday, it rose more than 10% in a single day alongside $MU, so it's giving those gains back just as quickly over the past two days. But a few things haven't changed. Memory supply is still tight. $MU's new $4.5 billion plant in Taiwan recently halted work because of a labor dispute, so capacity expansion will only get slower. SK hynix has already sold half its supply for the next two years. $NVDA isn't the only company running AI; other companies' accelerators also need high-bandwidth memory. A $NVDA leadership change disrupts the timing, not where the demand comes from. So I'm still bullish on memory. But being bullish on memory doesn't mean catching the falling knife right now. A 5% daily move is normal for these stocks. Since October, $MU has moved more than 5% on a third of its trading days. With $NVDA's earnings and $ANT's listing still ahead, that volatility will only get bigger. Being bullish on an industry and deciding where to enter and how large a position to take are two different questions. I'll wait for two things: first, what $NVDA says about HBM and orders in its earnings report, and second, for $MU and $SNDK to stop falling and form their first higher low. Then I'll buy in stages, rather than jumping in halfway up the mountain. Demand is still there, and the cycle is still there. Both of those things have to be acknowledged. $NVDAXUSDT #SanDiskAnnounces8For1StockSplit #AITechSelloffErases2Point5TrillionFromNasdaq100 #IMPACTbyTrade
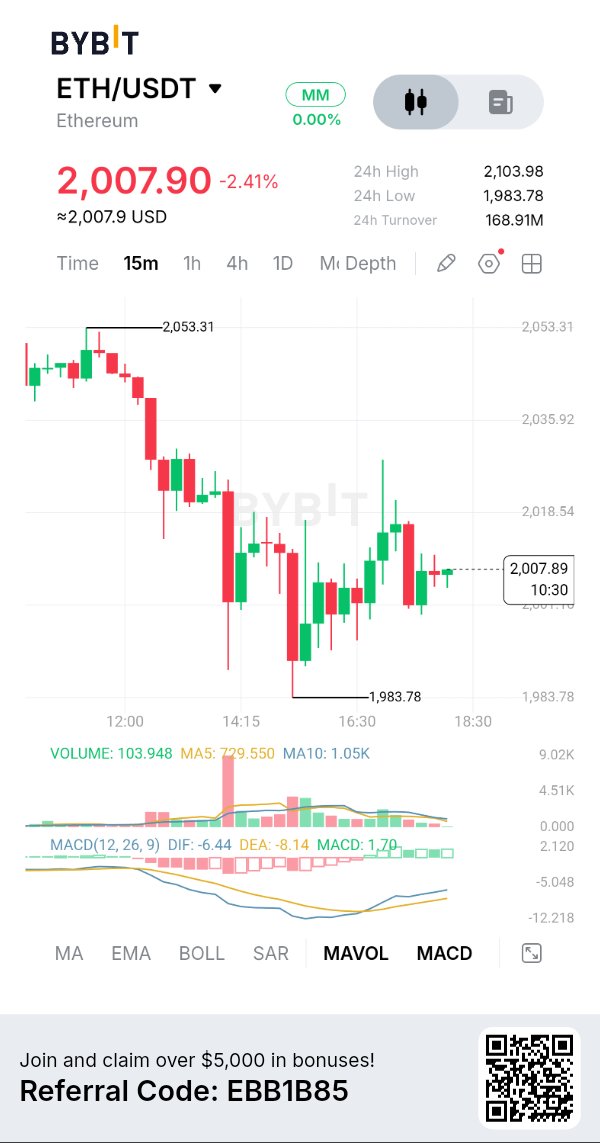
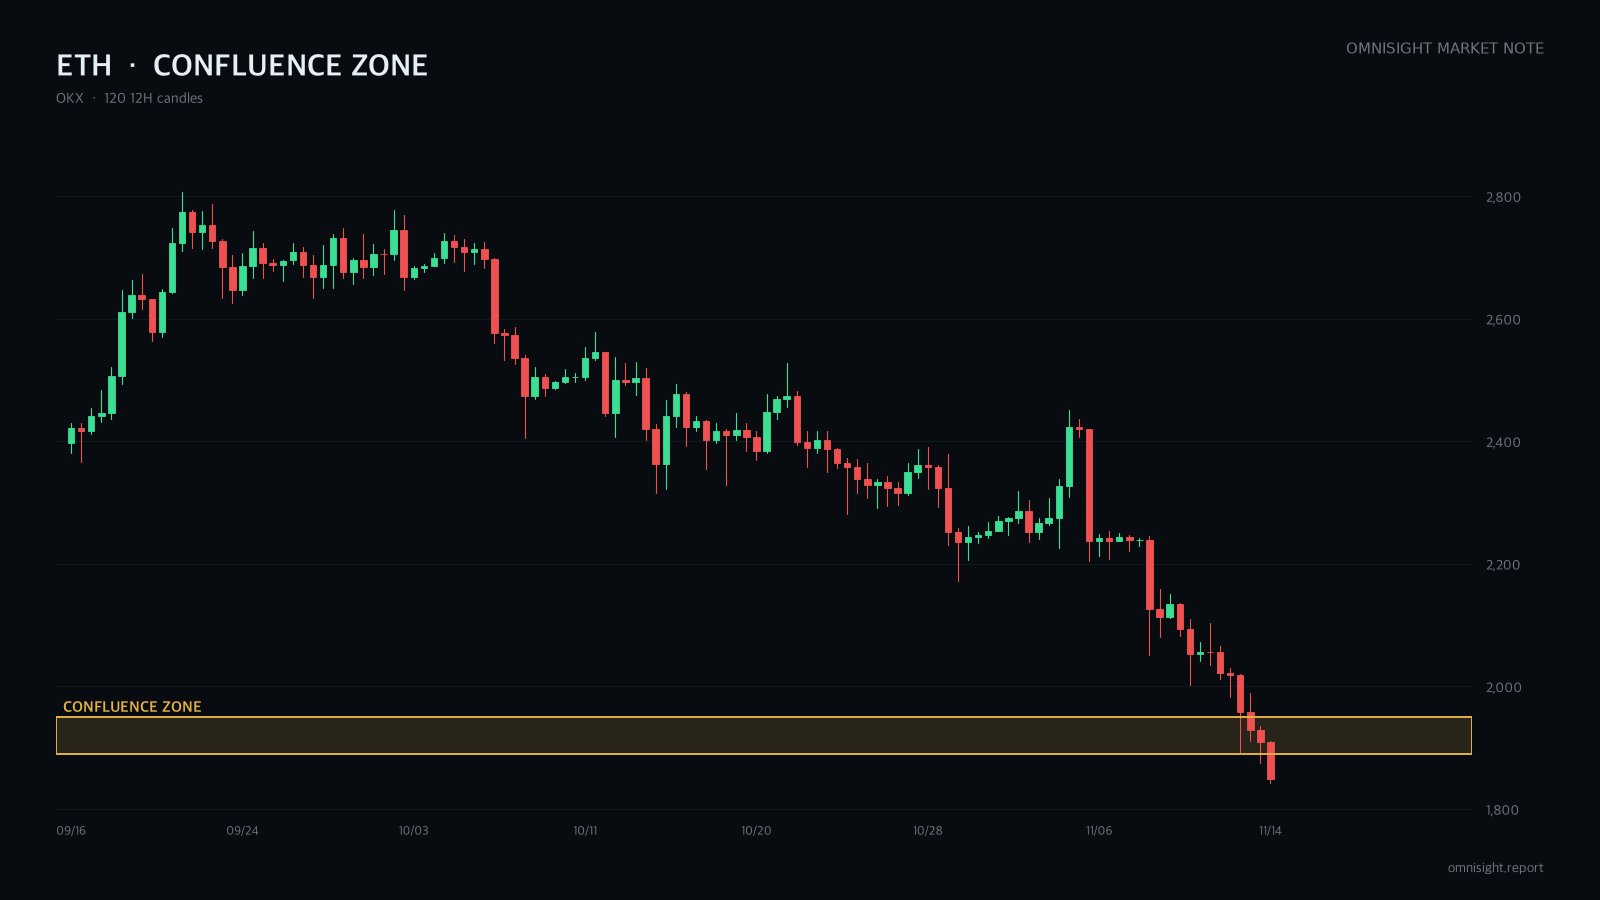
$ETHUSDT just flushed to its lowest price in 50 days within a single hour. My read is still short, but I'm not selling into this. I'm waiting for a bounce into the zone where broken support turns into resistance. The catch: it's deeply oversold, and that cuts both ways. Daily, 12h and 4h are all printing lower highs and lower lows. Price sits below every moving average on those timeframes. Why short: - Structure is down on every higher timeframe. - The bullish divergence only shows on 4h and 1h, not on 12h or daily. - Risk-off backdrop and ETF outflows act as a tailwind, not a trigger. Two of four technical methods lean short. The higher-timeframe trend breaks the tie. ICT view: the broken 4h support, the last up-candle before the drop, and the midpoint of the final down leg stack into one area. Selling the expensive side of the retrace is the cleanest short here. Where I'm wrong: a move above yesterday's bounce high ends the lower-high sequence. If 4h closes a body above the last bounce high before fill, I pull the order. Risks: extreme oversold and negative funding can fuel a sharp squeeze. And if price keeps sliding without a bounce, the order never fills. Not investment advice. All decisions and responsibility are your own. #IMPACTbyTrade
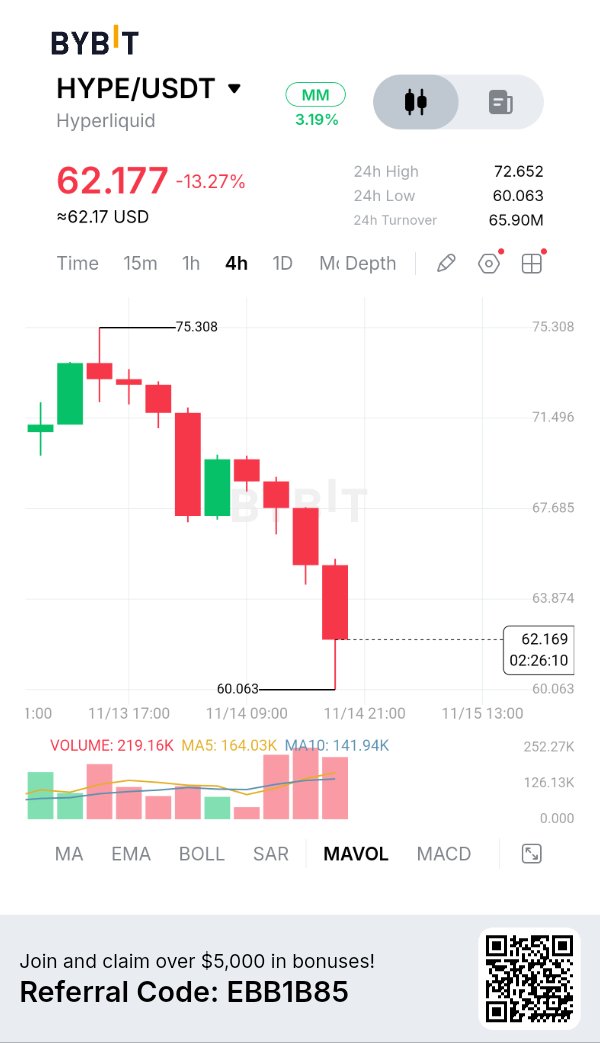
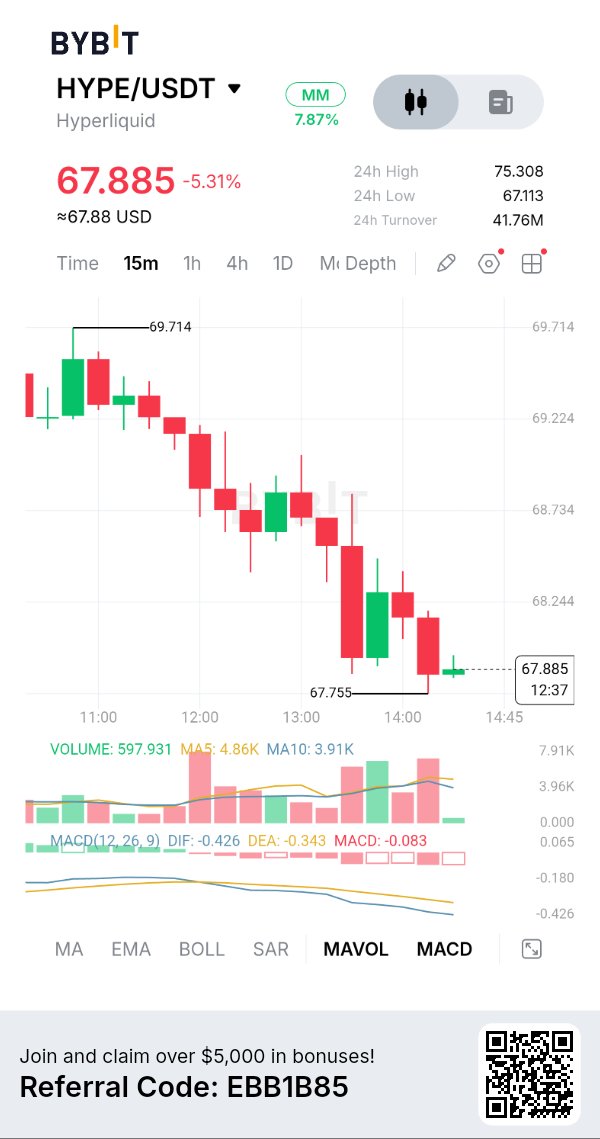
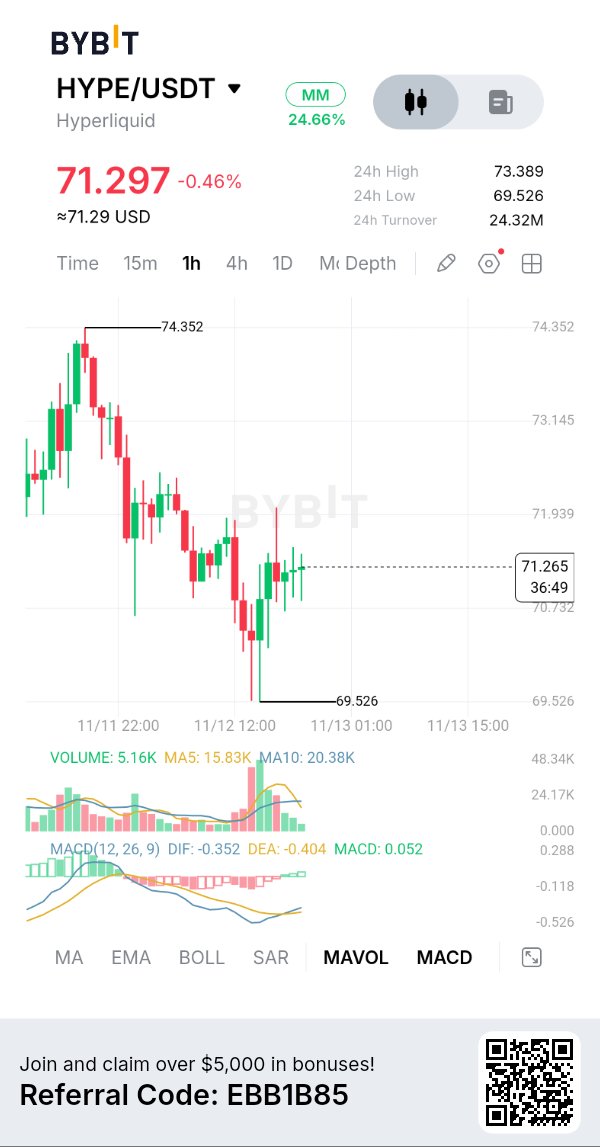
$HYPEUSDT lost the floor it held for two days, and it didn't just wick it. Two big hourly candles closed through on roughly 4x normal volume. I'm short-biased, waiting for a bounce back into that broken floor. The catch: it's already oversold, so no chasing. Since the cycle high, both highs and lows have been stepping lower on the daily and 12h. Why the retest area matters: - The broken floor, the daily 200 EMA and today's unfilled hourly gap stack in one place. - It also lines up with the deep retracement of today's drop. - A first retest of old support is where sellers tend to reappear. That overlap is why it's a zone, not a single line. On ICT, the liquidity below the floor wasn't swept and reclaimed. It was taken with closes. That turns the old floor into resistance, and the upper half of today's drop becomes the area to sell into, not chase. I'm wrong if a 4h close reclaims today's high along with the short-term averages. That's a reversal, not a pullback, and the short case is gone. Risks: BTC just hit a 12-week low after heavy liquidations, so sharp squeezes can hit. HYPE's own tailwinds (rising open interest, buybacks) may slow the drop. Not investment advice. All decisions and responsibility are your own. #IMPACTbyTrade
🚨 This is why Bitcoin keeps crashing
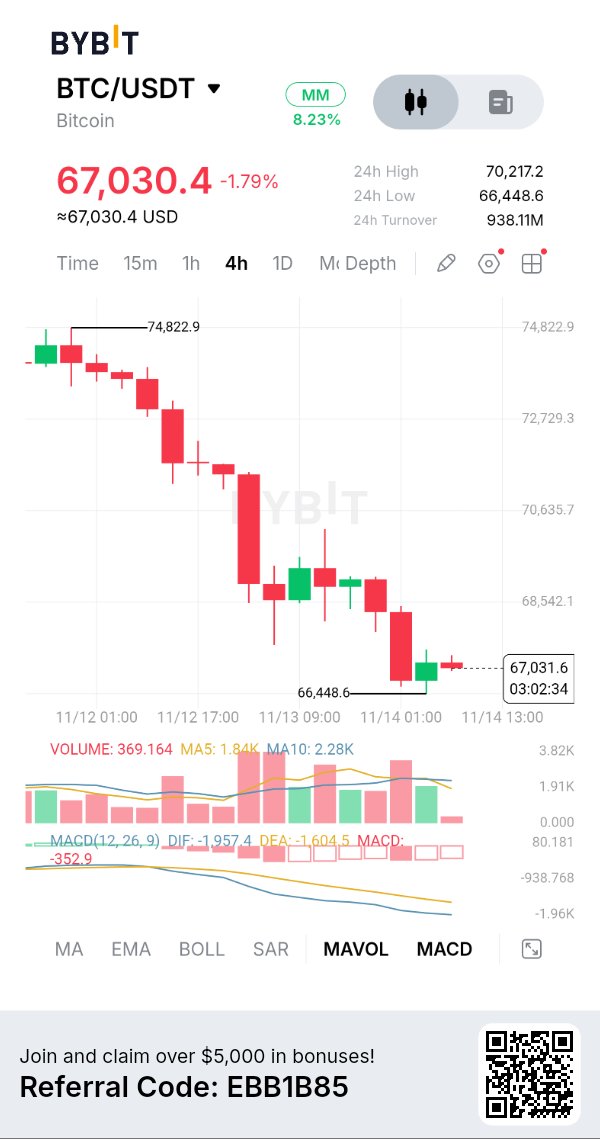
If you still think $BTCUSDT trades like an asset whose price is determined by supply and demand, you need to read this carefully. Because that market no longer exists at all. What you're seeing right now is not normal price action. This isn't just an AI stock sell-off. This isn't just a higher-than-expected inflation reading. And this is definitely not retail investors panic-selling. Most people have no idea what's happening. And by the time everything becomes obvious, the damage has already been done. And by the time everything becomes obvious, the damage has already been done. This cycle didn't start today. It's been quietly brewing beneath the surface for years. And now it's accelerating. The truth is: Once Bitcoin exposure can be created on paper, the 21 million coin cap no longer determines the price. And when paper determines the price, Bitcoin follows leverage and forced selling. That's exactly what's happening to Bitcoin. And it's the same kind of breakdown that has already hit these markets: → Gold → Silver → Oil → Stocks Once derivatives take over, real buyers lose control. Bitcoin's original investment thesis has collapsed. Bitcoin's value was built on two ideas: → A hard cap of 21 million coins → No coin being lent out twice The moment Wall Street built the following on top of it, that framework died: → Futures settled in cash rather than coins → Perpetual contracts → Options → ETFs → Broker loans, wrapped BTC and swaps Since then, paper Bitcoin has effectively become unlimited. Not on-chain. But in the market that determines the price, and that's what really matters. Liquidations. The one metric that explains everything. Over $1.6 billion in leveraged bets wiped out in 24 hours. $870 million hit Bitcoin longs. Spot Bitcoin ETFs saw $1.88 billion in outflows this month. Once paper selling overwhelms real buyers, the price no longer responds to demand. It responds to positions, hedging and cascading liquidations. Wall Street can now sell Bitcoin. They're not guessing the direction. They're doing what they do in every derivatives-driven market: 1⃣ Create paper BTC 2⃣ Short the bounce 3⃣ Force liquidations 4⃣ Close out at lower prices 5⃣ Repeat This isn't “betting.” This is inventory creation. One real BTC can now be counted as: → One ETF share → One futures contract → One perpetual contract → One broker loan All at the same time. That's four claims on a single coin. That's not a free market. That's a Wall Street pricing system wearing a Bitcoin mask. You can choose to ignore it, but don't pretend nobody warned you. $BTC is trading at $68,658, down 4.28% in 24 hours, its lowest level since August and 45.6% below its high of $126,200. If it loses $65,000, traders will next watch $62,500. Throughout the weekend, liquidation data and ETF fund flows will keep showing up on our screens. Follow us to get confirmed data first. #IMPACTbyTrade
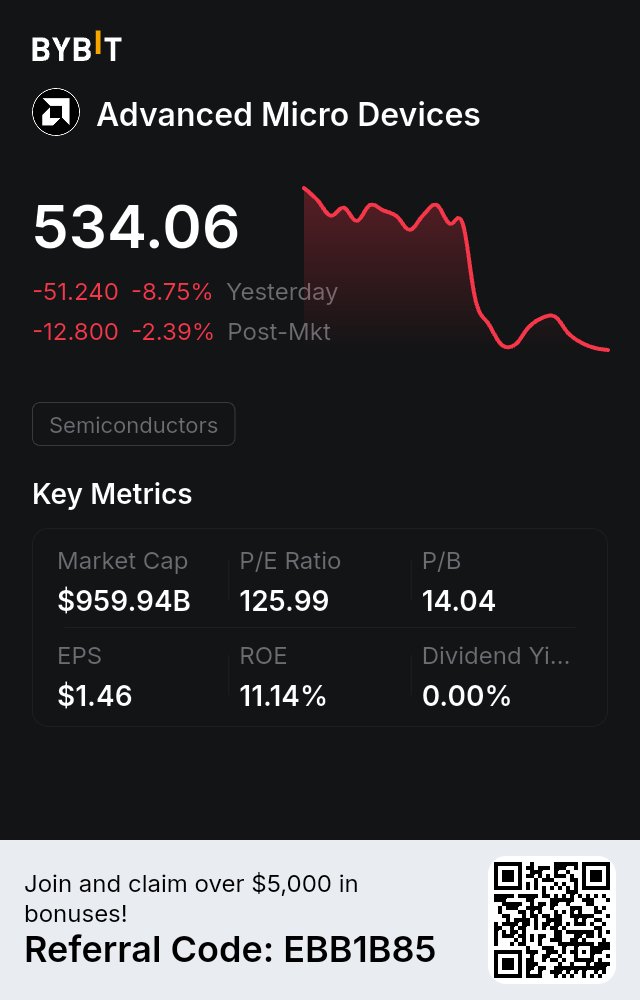
$AMD fell 10% in a single day, even harder than $NVDA. That’s the key thing to understand today. On Thursday, the day Jensen Huang stepped down, the market’s first reaction was to pull money out of $NVDA and move it into $AMD and $AVGO, betting that if Nvidia ran into trouble, orders would flow to its rivals. Today, that trade was unwound entirely: $AMD fell about 10% intraday, $AVGO about 5%, while $NVDA fell only 2% to 3%. The positions that had been moved over were pulled back in a single day, showing that the market wasn’t betting on who would take market share from whom, but was marking down the entire AI supply chain together. The reason for the markdown also came out into the open today. While Jensen Huang was there, $NVDA had been financing and guaranteeing loans for new cloud companies downstream, using its own money to help customers buy its own chips. The moment he left, the market’s first concern was whether that circular financing could keep turning. So the hardest hit today were new cloud companies like $CRWV and $NBIS, both down about 9% intraday. Britain’s Nscale revised its prospectus, with its net loss for the first nine months widening to $1.7 billion. $MSFT is also rumored to be reexamining its contracts with new cloud companies and planning to use fewer of them. Optical modules $LITE and $COHR, and servers $DELL and $HPE, fell anywhere from 6% to 11%. Where the money is flowing out is clear from the order of the declines: those most dependent on financing fell first, those living off $NVDA orders fell next, and the giants with the thickest cash flows fell the least. Interest rates are also working against the market. The 10-year U.S. Treasury yield climbed back above 5% on Thursday, rose above 5.1% intraday today, and the 30-year is around 5.4%. PPI was actually milder than expected, but the bond market isn’t buying it. Tech stocks with high valuations and heavy capital spending are the most sensitive to this number. The Nasdaq 100 fell about 1.7% intraday, the Dow was basically flat, and consumer staples were actually rising. Then there’s next week’s $ANT. Pricing is Wednesday, listing is Thursday, 825 million shares at $70 to $78 per share, raising as much as over $60 billion. With a subscription of that size, funds have to free up cash in advance, and the easiest way is to sell the AI stocks they already hold that have risen and are liquid. $NVDA itself also committed to subscribing for $10 billion in the placement, and now that Jensen Huang is gone, the market is also guessing whether that money will still come through. With these three things stacked on top of each other, a drop like today’s is not surprising at all. So why isn’t this a crash yet? Because only the AI chain is falling; the broader market hasn’t collapsed with it. The S&P fell less than 1% intraday, and the Dow was flat. Money is rotating within tech and hiding in defensive sectors, not selling everything. The kind of panic that sent the SOX down 12% in a single day on 11/5 did not show up today. Positioning has to be calculated carefully too. Through Thursday’s close, the SOX was about 12% higher than last Friday. The earlier rebound was too fast, and part of today’s drop is giving back that rebound. What comes next comes down to two things. One is $NVDA’s earnings on 11/17: how the new management talks about orders, and how it talks about financing for customers. The other is $ANT’s pricing and its first-day performance. If $ANT goes smoothly, it means the primary market is still willing to pay up for AI assets, and the money that was pulled out has a chance to flow back. If pricing is pushed to the bottom of the range or it even opens below the offering price, this round of selling will most likely go back to test the 11/5 lows. I won’t catch a falling knife like $AMD’s 10% drop in a single day this week, and I won’t bet on $NVDA’s earnings night either. Trim on the rebound, buy in batches when it reaches a level, and keep cash to get through next week. The companies are still the same companies. It’s just that right now, no one is willing to carry a bit more exposure before $ANT lists. #JensenHuangExitTestsNvidiasAILeadership $NVDAXUSDT #IMPACTbyTrade
IMF FLAGGED $1.4 TRILLION IN CIRCULAR AI DEALS.
Big Tech is funding its own customers so they can keep buying from Big Tech. Here is every known AI circular financing loop right now: 1. Nvidia ↔ OpenAI: Nvidia invested $30 billion in OpenAI and guarantees up to $105 billion of its Ohio data center leases. OpenAI fills those data centers with Nvidia chips. 2. Oracle ↔ OpenAI: OpenAI signed a $300 billion cloud deal with Oracle. Oracle is borrowing heavily to build the data centers for it. 3. Microsoft ↔ OpenAI: Microsoft owns about 27% of OpenAI. OpenAI committed $250 billion to Microsoft's Azure cloud. 4. SoftBank ↔ OpenAI: SoftBank invested $64.6 billion in OpenAI. OpenAI rents data centers from SoftBank's SB Energy. 5. Amazon ↔ OpenAI: Amazon is investing up to $50 billion in OpenAI. OpenAI expanded its Amazon cloud deal by $100 billion. 6. AMD ↔ OpenAI: AMD gave OpenAI the right to buy up to 160 million AMD shares for $0.01 each. In return, OpenAI buys AMD chips. 7. Google ↔ Anthropic: Google is investing up to $40 billion in Anthropic. Anthropic committed at least $121 billion to Google Cloud. 8. Amazon ↔ Anthropic: Amazon is investing up to $33 billion in Anthropic. Anthropic committed at least $110 billion to Amazon's cloud. 9. Broadcom ↔ Anthropic: Banks lent $63 billion to a special company that buys Broadcom chips and leases them to Anthropic. Broadcom backs the chips' resale value. 10. Microsoft + Nvidia ↔ Anthropic: They are investing up to $15 billion combined. Anthropic committed at least $44.9 billion to Microsoft's cloud. 11. SpaceX ↔ Anthropic: SpaceX borrowed $40 billion to buy Nvidia chips and sells the computing power to Anthropic. Nvidia is a SpaceX shareholder. 12. Nvidia ↔ CoreWeave: Nvidia owns about 11% of CoreWeave and agreed to buy $6.3 billion of its unused capacity. CoreWeave buys Nvidia chips. 13. Nvidia ↔ neoclouds: Nvidia agreed to buy $36 billion of cloud capacity from smaller AI cloud companies. They use that guaranteed income to borrow and buy Nvidia chips. 14. Microsoft ↔ Nscale, Nebius, IREN: Microsoft signed up to $70.9 billion in contracts with them. They use the money to buy GPUs. 15. Google ↔ former bitcoin miners: Google guarantees billions in leases at TeraWulf and Cipher and gets their shares in return. 16. Meta ↔ Blue Owl: A $27.3 billion data center was built through a joint company, with Meta backing it with a $28 billion guarantee. 17. Anthropic IPO: Its chip and cloud suppliers, Nvidia, Google, AMD, Micron, Broadcom and Microsoft, are buying $26 billion of its shares. Anthropic owes those same companies hundreds of billions in future spending. When money keeps flowing, these loops make everyone's revenue look strong. $NVDAXUSDT #IMPACTbyTrade
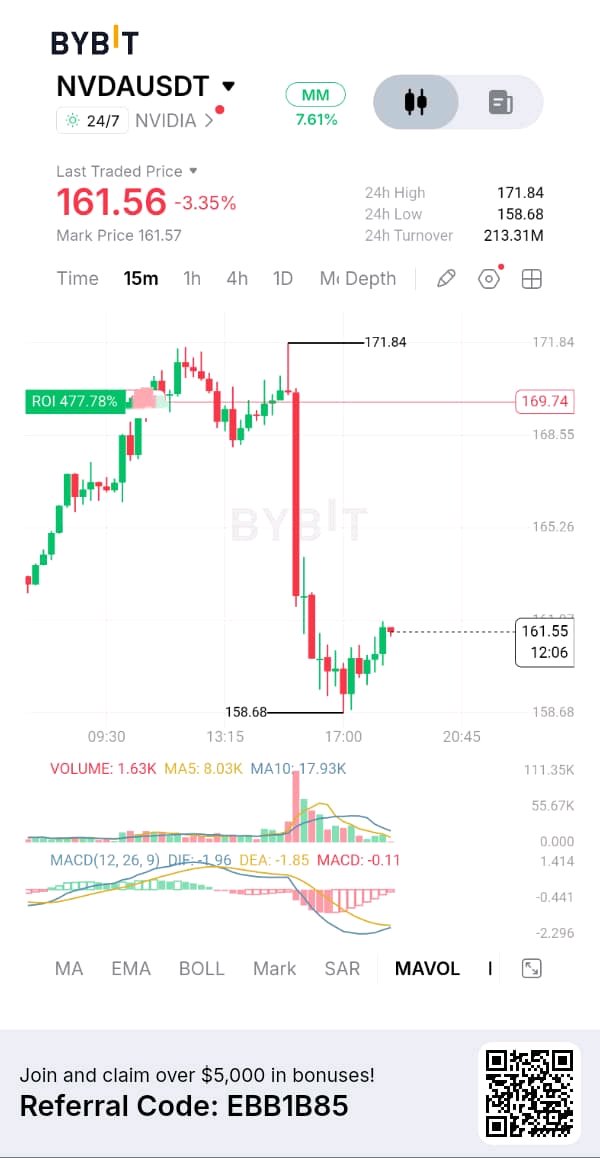
NVIDIA's NVDAUSDT market is experiencing significant selling pressure after a sharp intraday reversal from the $171.84 high. Although buyers have started defending the $158.68 region, the recovery remains relatively weak, and the market has not yet confirmed that the selling pressure is over. My Bybit 15-minute chart shows $NVDAXUSDT trading around $161.56, down approximately 3.35%. The price action suggests that sellers have regained short-term control following an earlier bullish move. The next reaction around $158.68 could determine whether this is simply a temporary correction or the beginning of another downward leg. CHART + TECHNICAL ANALYSIS The most important development is the aggressive bearish candle that pushed price from the $169 region toward $160, followed by another move that established an intraday low of $158.68. Buyers have attempted to recover from that low, gradually pushing price toward $161.56. However, the recovery has not yet reclaimed the previous breakdown structure. MACD remains negative, with DIF at -1.96, DEA at -1.85 and histogram around -0.11. Although the negative histogram suggests bearish momentum is easing slightly, the indicator has not confirmed a bullish reversal. FUNDAMENTAL PERSPECTIVE NVIDIA remains one of the most important companies in the global semiconductor industry, with its GPUs playing a central role in artificial intelligence training, data centers and accelerated computing. Its long-term growth opportunity is connected to continued AI infrastructure investment, demand for advanced chips and expansion of enterprise computing. However, strong company fundamentals do not prevent short-term market corrections. Valuation, earnings expectations, capital expenditure trends and broader technology-sector sentiment can all influence price performance. MACRO + MARKET CONDITIONS Technology stocks are sensitive to interest-rate expectations, liquidity conditions and changes in investor appetite for risk. A weaker broader equity market could increase pressure on NVDA, even if its company-specific fundamentals remain strong. I would also monitor the performance of major semiconductor stocks and the wider Nasdaq market. A recovery supported by the broader technology sector would provide stronger confirmation than an isolated bounce. MY TRADING PLAN I wouldn't chase the current bounce or enter blindly during the consolidation. For a bullish position, I want to see buyers defend $158.68, reclaim resistance and demonstrate stronger volume. For a bearish position, I would prefer a confirmed breakdown followed by a failed attempt to recover the lost support. Position sizing will remain controlled, with a predefined stop-loss and partial profit-taking at the first target. #IMPACTbyTrade
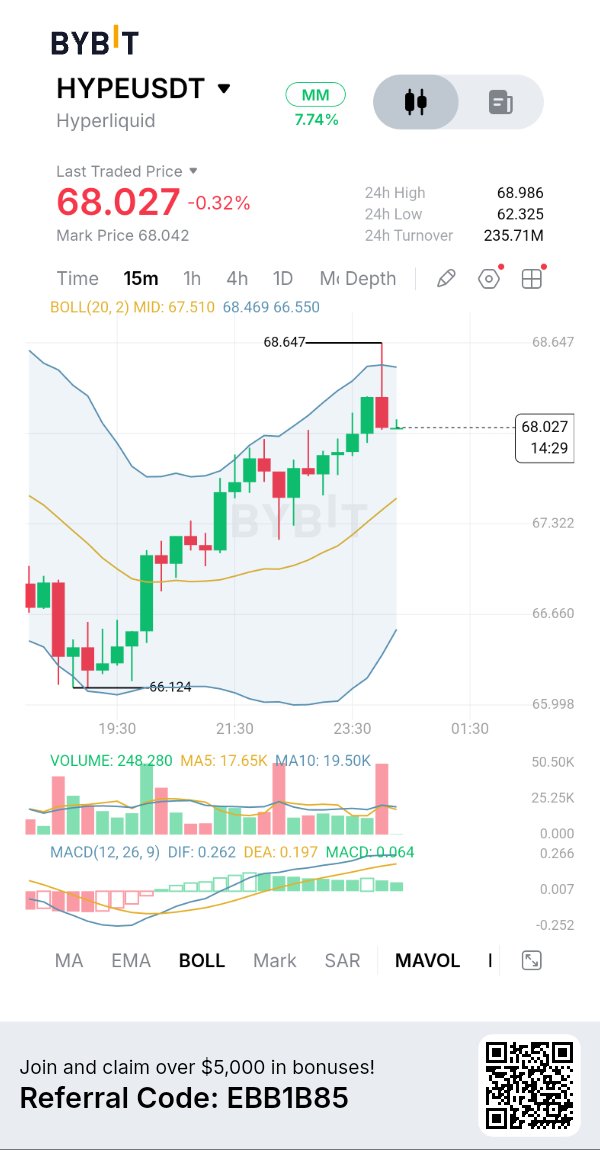
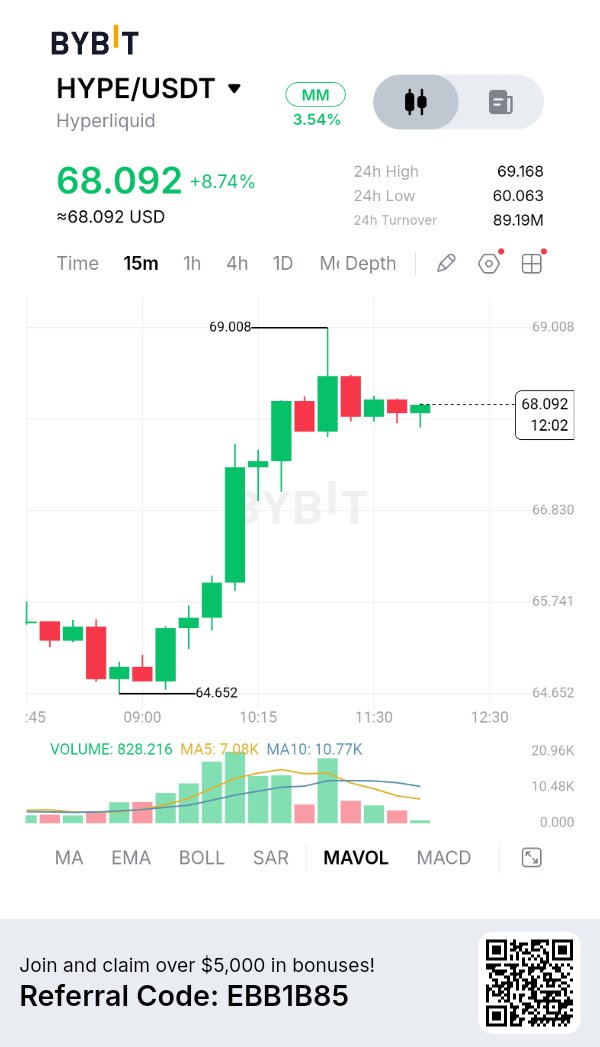
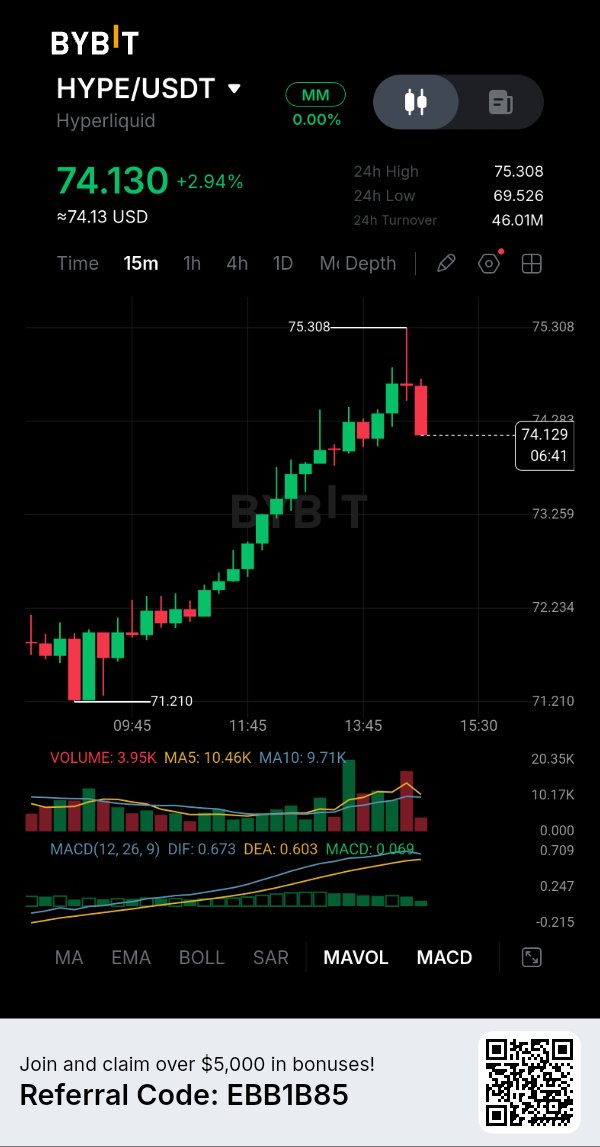
$HYPEUSDT is showing renewed buying strength after recovering from the $71 region, but the latest rejection near $75.30 suggests that the market is approaching an important decision point. Buyers have made considerable progress during this intraday recovery, although the next move will depend on whether they can overcome resistance with stronger volume and maintain the newly established bullish structure CHART + TECHNICAL ANALYSIS My Bybit $HYPEUSDT 15-minute chart shows price trading around $74.13, up approximately 2.94%. Price advanced from an intraday low of $71.210 to a high of $75.308, representing a strong recovery within the observed session. For HYPE, the important question is how increasing platform activity translates into sustainable token demand. A growing ecosystem can strengthen long-term fundamentals, but token appreciation still depends on market demand, liquidity and the economic value captured by the token. TOKENOMICS AND VALUE ACCRUAL HYPE has utility within the Hyperliquid ecosystem, including staking, validator participation and trading-related mechanisms. An important component of its token economics is the Assistance Fund, which uses protocol revenue to acquire HYPE through its fee-related mechanism. This creates a potential connection between platform activity and token supply reduction. The key levels on my chart are $75.308 resistance, $73.259 immediate support, $72.234 secondary support and $71.210 as the major visible intraday swing low. FUNDAMENTAL ANALYSIS Hyperliquid continues to develop its position as a major decentralized trading infrastructure platform. Its ecosystem includes perpetual futures, spot markets and HyperEVM, which expands the possibilities for decentralized applications and financial services. The HIP-3 framework is particularly interesting because it allows approved third-party deployers to introduce additional perpetual markets. This potentially expands the range of assets and trading opportunities available within the ecosystem. The candle structure shows a sequence of higher highs and higher lows, suggesting that short-term buyers have gained control. However, the latest rejection candle indicates that sellers are becoming active around the $75.30 resistance region. MACD remains positive, with DIF at 0.673, DEA at 0.603 and histogram around +0.069. This indicates that bullish momentum is still present, although the narrowing difference between the MACD lines makes it important to monitor whether momentum continues improving. Volume currently reads approximately 3.95K, below MA5 at 10.46K and MA10 at 9.71K. This is an important observation because a breakout without stronger trading participation may struggle to sustain itself. #IMPACTbyTrade

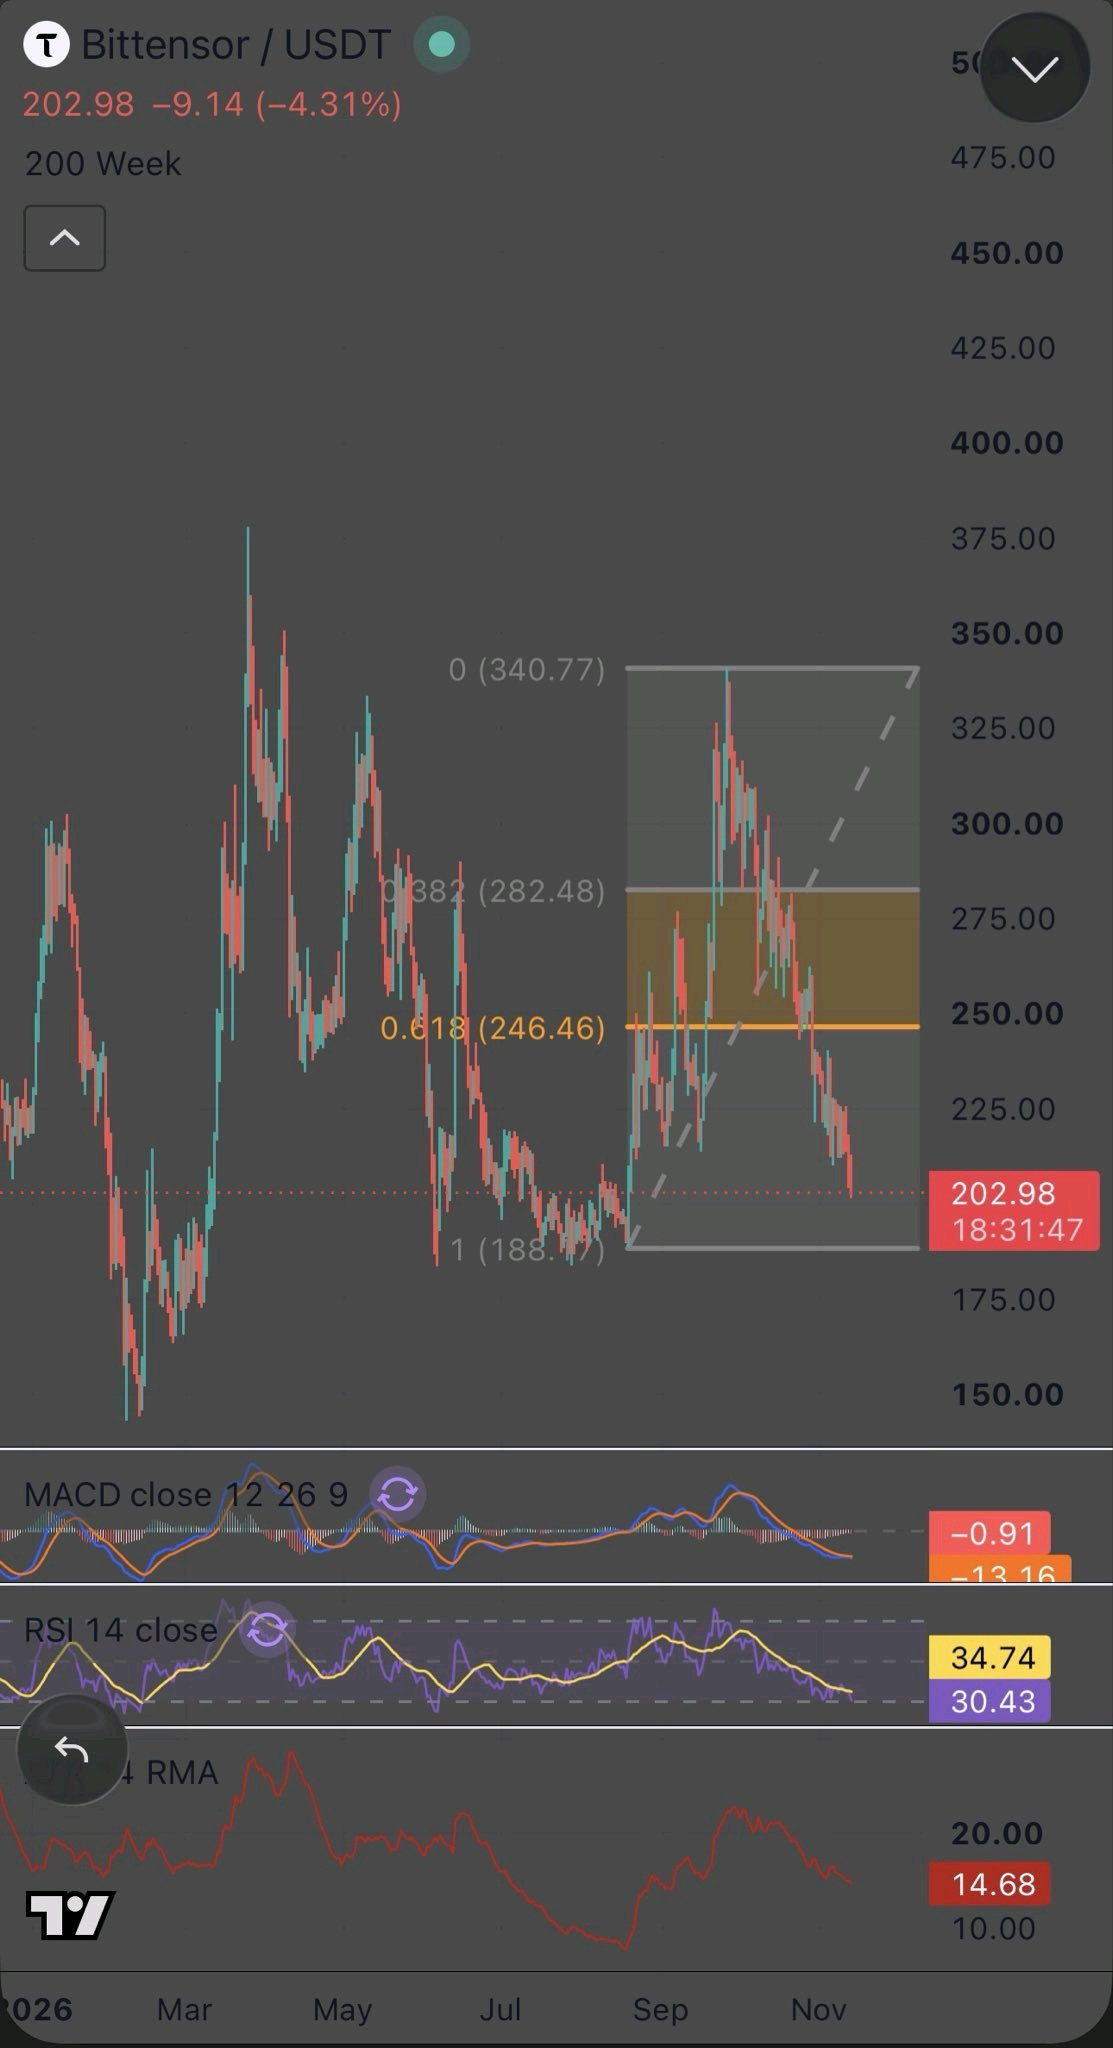
You bought $TAO at $280 because it finally felt safe again. Now you open the chart, see $203, and close the app before anyone asks how your bags are doing. I know that feeling. That is exactly why I kept posting this level for weeks. Fib drawn from the $188 low to the $340 high: 0.382 sits at $282 0.618 sits at $246 The full retrace sits at $188 The golden pocket was the line in the sand. Once it cracked in late October, every bounce died right back under it. Now $TAO trades at $203. That is roughly 7% above the floor I kept pointing at while most people were still waiting for $340 to come back. What momentum says right now: RSI near 30, knocking on oversold MACD still below signal, but the histogram is shrinking Sellers are getting tired, they are not finished yet The decision level is $188. Hold it, and this becomes a double bottom with the July base. First wall to reclaim is $246. Lose it on a daily close, and the thesis is dead. The March lows near $150 come back into play. I did not guess where this was going. I drew the map weeks ago and price just followed it. The pain you feel today was printed on this chart long before it reached your portfolio. $QNTUSDT $NVDAXUSDT #IMPACTbyTrade
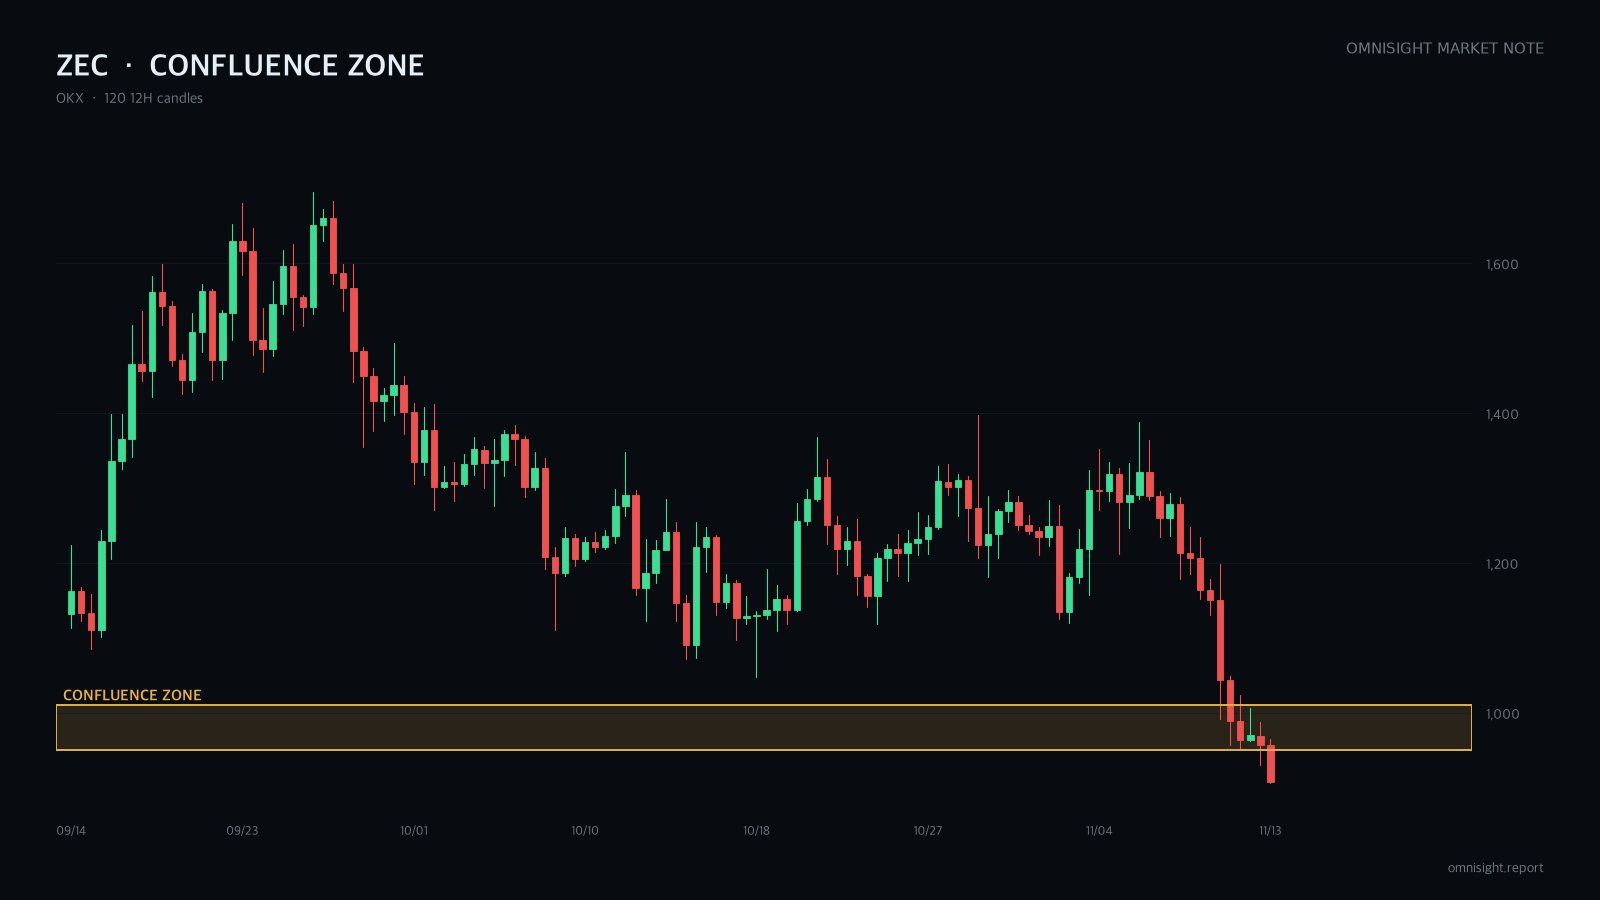
$ZEC lost a six-week floor on heavy volume and has now printed four lower highs on the daily. I'm leaning short, but I'm not selling here. I want a bounce back into the area where the break happened. The catch: it's already deeply oversold, so that bounce may never come. The floor held for six weeks before two heavy sell days took it out. Price then lost the 12h long-term average too. Every daily rally since has stalled lower than the last. What lines up in the sell area: - the 50-79% retracement of the latest 4h leg down - the recent 1h bounce highs - the underside of the broken floor, where trapped buyers may want out Three reasons in one area is why I wait instead of chasing. From an ICT view, higher-timeframe structure has already broken down, so retracements are premium to sell, not a reversal. Buy-side liquidity sits above the recent 4h and 12h swing highs. The stop goes beyond that, so a sweep alone doesn't take me out. I'm wrong if a 4h candle closes back above the 12h swing high. That ends the lower-high sequence. Risks: price may fall straight to the daily 200 EMA without retracing, leaving the order unfilled. Post-crash BTC swings can whip both ways. Not investment advice. All decisions and responsibility are your own. $BTCUSDT #IMPACTbyTrade
$BTCUSDT just printed a fresh low after a straight-line slide. I'm bearish, but I'm not selling here. I'm waiting for the bounce to come back into the support that just broke. Chasing after a liquidation flush is usually the worst short you can take. Since the early-November high, daily, 12h and 4h all keep making lower highs and lower lows. Today's leg cut through a 4h box that held since last evening. Why I still lean short: - All four technical methods point the same way. - RSI keeps falling with price. No bullish divergence; the 4h shows a hidden bearish one. - Macro is a tailwind, not a trigger: hot CPI, ETF outflows. My zone stacks the broken box, a ~38% retrace of today's drop, and a 1h gap. First retest of support turned resistance. On Elliott, wave 3 down just matched wave 1 in length. A wave-4 bounce usually starts here and stalls near that retrace before a fifth leg lower. I'm wrong if price clears the last 12h swing high and overlaps the wave-(i) low. That breaks the lower-high sequence and kills the count. Risks: deeply oversold after a long squeeze, so the bounce can be violent. Fed and index events could stretch this to 3-10 days. Not investment advice. All decisions and responsibility are your own. #IMPACTbyTrade
$HYPEUSDT ha estado haciendo máximos más bajos y mínimos más bajos en las temporalidades diaria, de 12h y de 4h. Soy bajista, pero no voy a vender aquí. El precio se encuentra en la mitad de descuento del rango de 4h después de una caída abrupta. Ponerse en corto en este punto ofrece una mala relación riesgo/beneficio. Estoy esperando un rebote hacia la zona de arriba. Desde el pico anterior, cada rebote de 4h se ha estancado por debajo del anterior. Todavía no hay un cambio de estructura. Por qué importa la zona de arriba: - Es el retroceso de 0.618-0.79 del último tramo bajista. - La EMA de 20 de 4h pasa justo por ahí. - Se solapa con la oferta dejada por la última vela alcista antes de la caída. - Un soporte roto ahora se sitúa ahí como resistencia. Cuatro razones distintas apiladas en una misma banda. Ahí es donde espero que los vendedores vuelvan a probar. Lectura de ICT: el bloque de órdenes bajista cubre la mitad premium del rango. Vender en un retroceso hacia él mantiene el stop por encima de la estructura. El primer objetivo se sitúa bajo el doble suelo, donde descansan los stops del lado vendedor. Dónde me equivoco: una ruptura por encima del último máximo más bajo en 4h/12h. Eso termina la secuencia de máximos más bajos y me hago a un lado. Riesgos: el mínimo reciente se alinea con la EMA de 200 diaria. Y BTC acaba de tocar un mínimo de 12 semanas por las tasas y los titulares del CEO de Nvidia, así que las oscilaciones pueden ser violentas en ambas direcciones. No es consejo de inversión. Todas las decisiones y responsabilidades son tuyas. #IMPACTbyTrade
$ETHUSDT swept below its prior low today and snapped back. It looks like a bottom. I read it as fuel for a bounce I want to sell. Bias: short. I'm waiting for the bounce to reach today's broken support. The catch: the bounce could run past it. Context: daily, 12h and 4h all print lower highs and lower lows. Price sits below the 20, 50 and 200 EMAs on every timeframe. Today's inflation shock pushed it through a round-number floor before buyers stepped in. Why that zone: - Three of four technical methods (ICT, Wyckoff, Elliott) point short - Broken support, a 1h order cluster and the midpoint of the recent drop stack in one area - Macro and news are risk-off, so there's little fuel for a bigger rally When independent reads land on one zone, sellers have a reason to defend it. From an ICT lens, the sweep took out resting stops but didn't change structure. No break above the last 4h lower high yet, so rallies are retracements inside a downtrend. Where I'm wrong: a 4h close above that lower high breaks the sequence. Then I step aside. Risks: - Bullish divergence on 4h and 1h could stretch the bounce - If price drops without bouncing, the order never fills. I won't chase Not investment advice. All decisions and responsibility are your own. #IMPACTbyTrade