PERROUQ_LTC
2164Me gusta0Compartir en el chat87Aficionados131Seguir
Technical analysis and risk management focused professionally
Technical analysis and risk management focused professionally
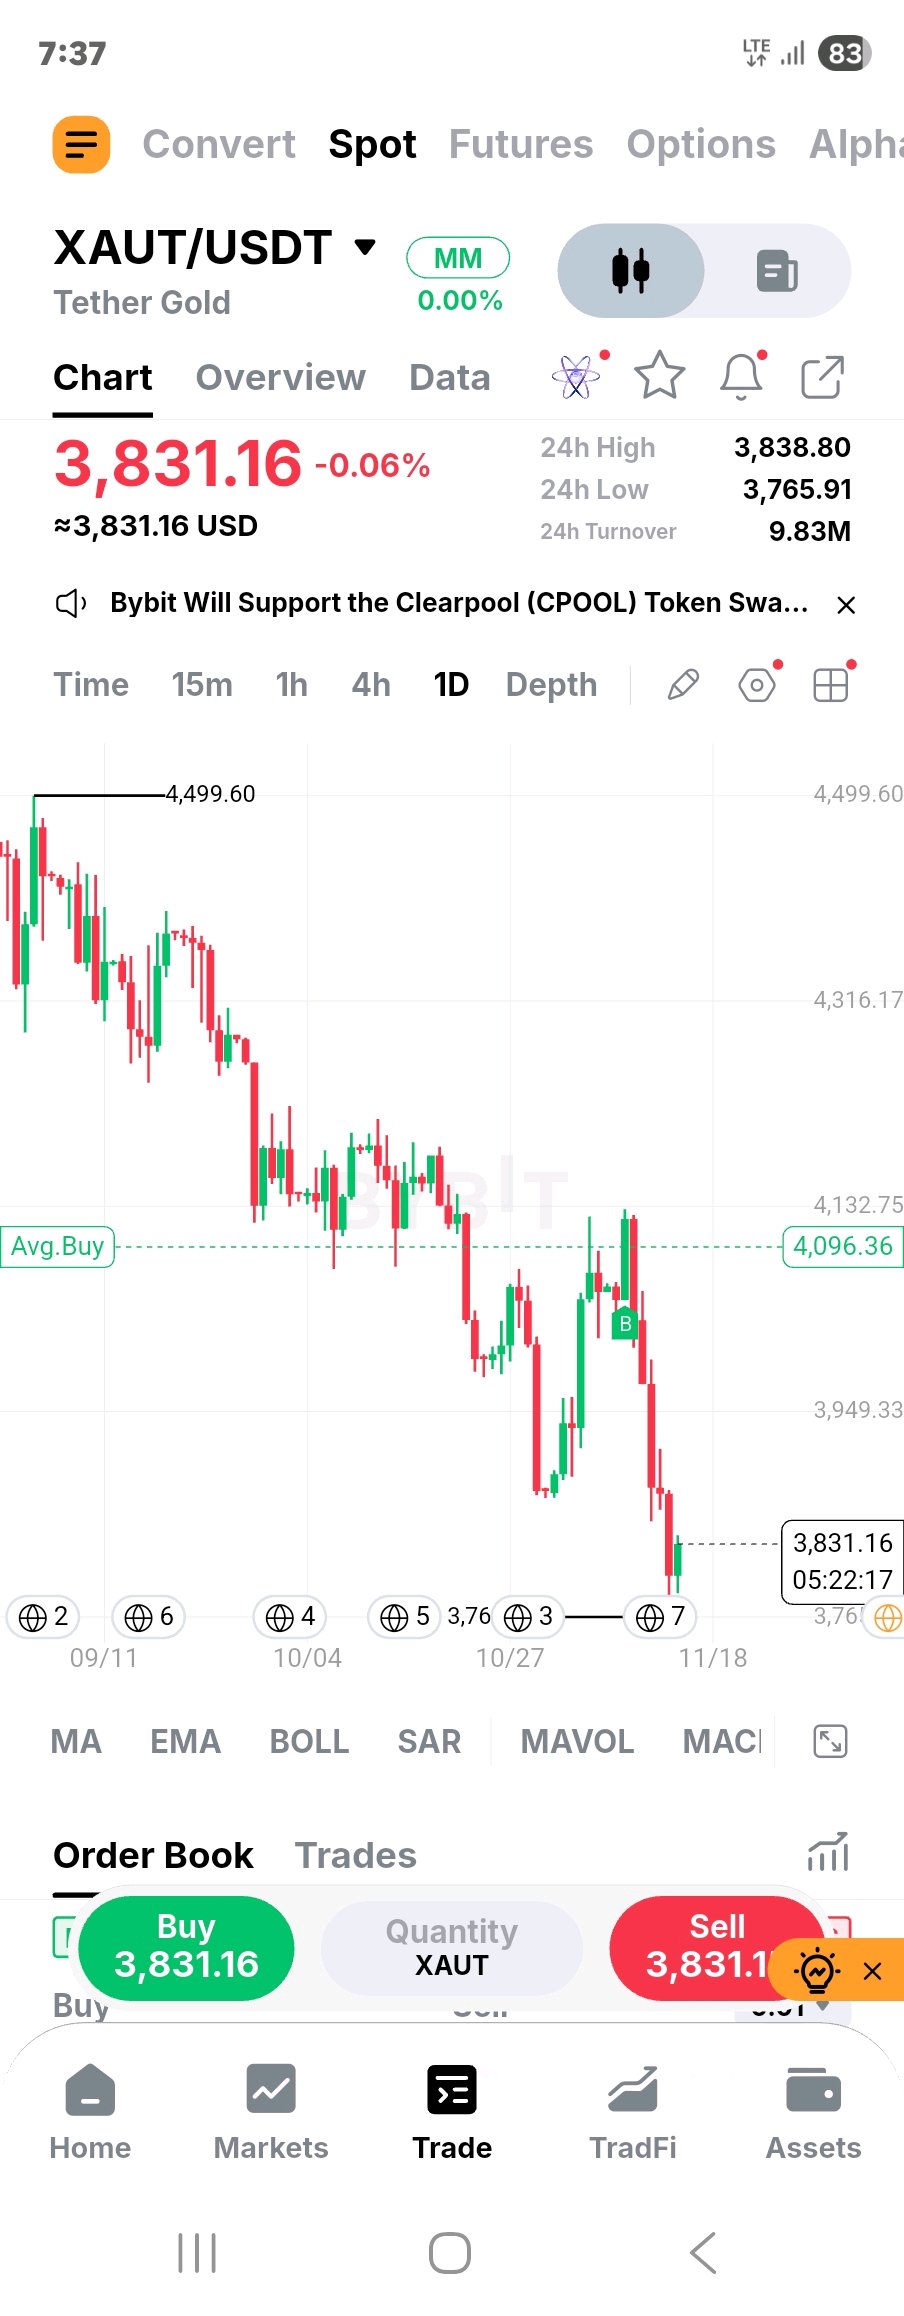
$XAUTUSDT | El mercado del oro está poniendo a prueba la convicción de los compradores. El gráfico diario del oro muestra una estructura que merece atención. Después de cotizar alrededor de los $4,500, XAUT ha experimentado un descenso sostenido, con máximos más bajos y mínimos más bajos dominando la acción general del precio. El último movimiento hacia los $3,766 ha atraído cierto interés comprador, empujando el precio de vuelta hacia los $3,831. Sin embargo, un rebote desde el soporte no significa automáticamente que los vendedores hayan perdido el control. Esto es lo que estoy observando: $3,765–$3,800: Zona de soporte inmediata. Los compradores necesitan defender esta área para evitar otro tramo a la baja. $3,949: Primer obstáculo de recuperación significativo. Recuperar este nivel mejoraría el panorama a corto plazo. $4,096–$4,132: Una región de resistencia más importante. Esta área atrajo presión de venta anteriormente, lo que la convierte en una prueba clave para cualquier recuperación alcista. Mi perspectiva del mercado: La estructura diaria sigue siendo bajista hasta que se demuestre lo contrario. Un movimiento sostenido por encima de los $3,949 sería una primera señal alentadora, mientras que recuperar la región de $4,096–$4,132 proporcionaría una evidencia más fuerte de que los compradores están recuperando el control. Por otro lado, perder el soporte de $3,765 podría exponer a XAUT a más caídas. Estoy más interesado en cómo reacciona el precio en estos niveles que en perseguir el rebote actual. La verdadera pregunta: ¿Es este el comienzo de una recuperación o simplemente una pausa antes de que regresen los vendedores? Me gustaría ver que el mercado responda eso antes de tomar una posición direccional. $ByXIMPACT
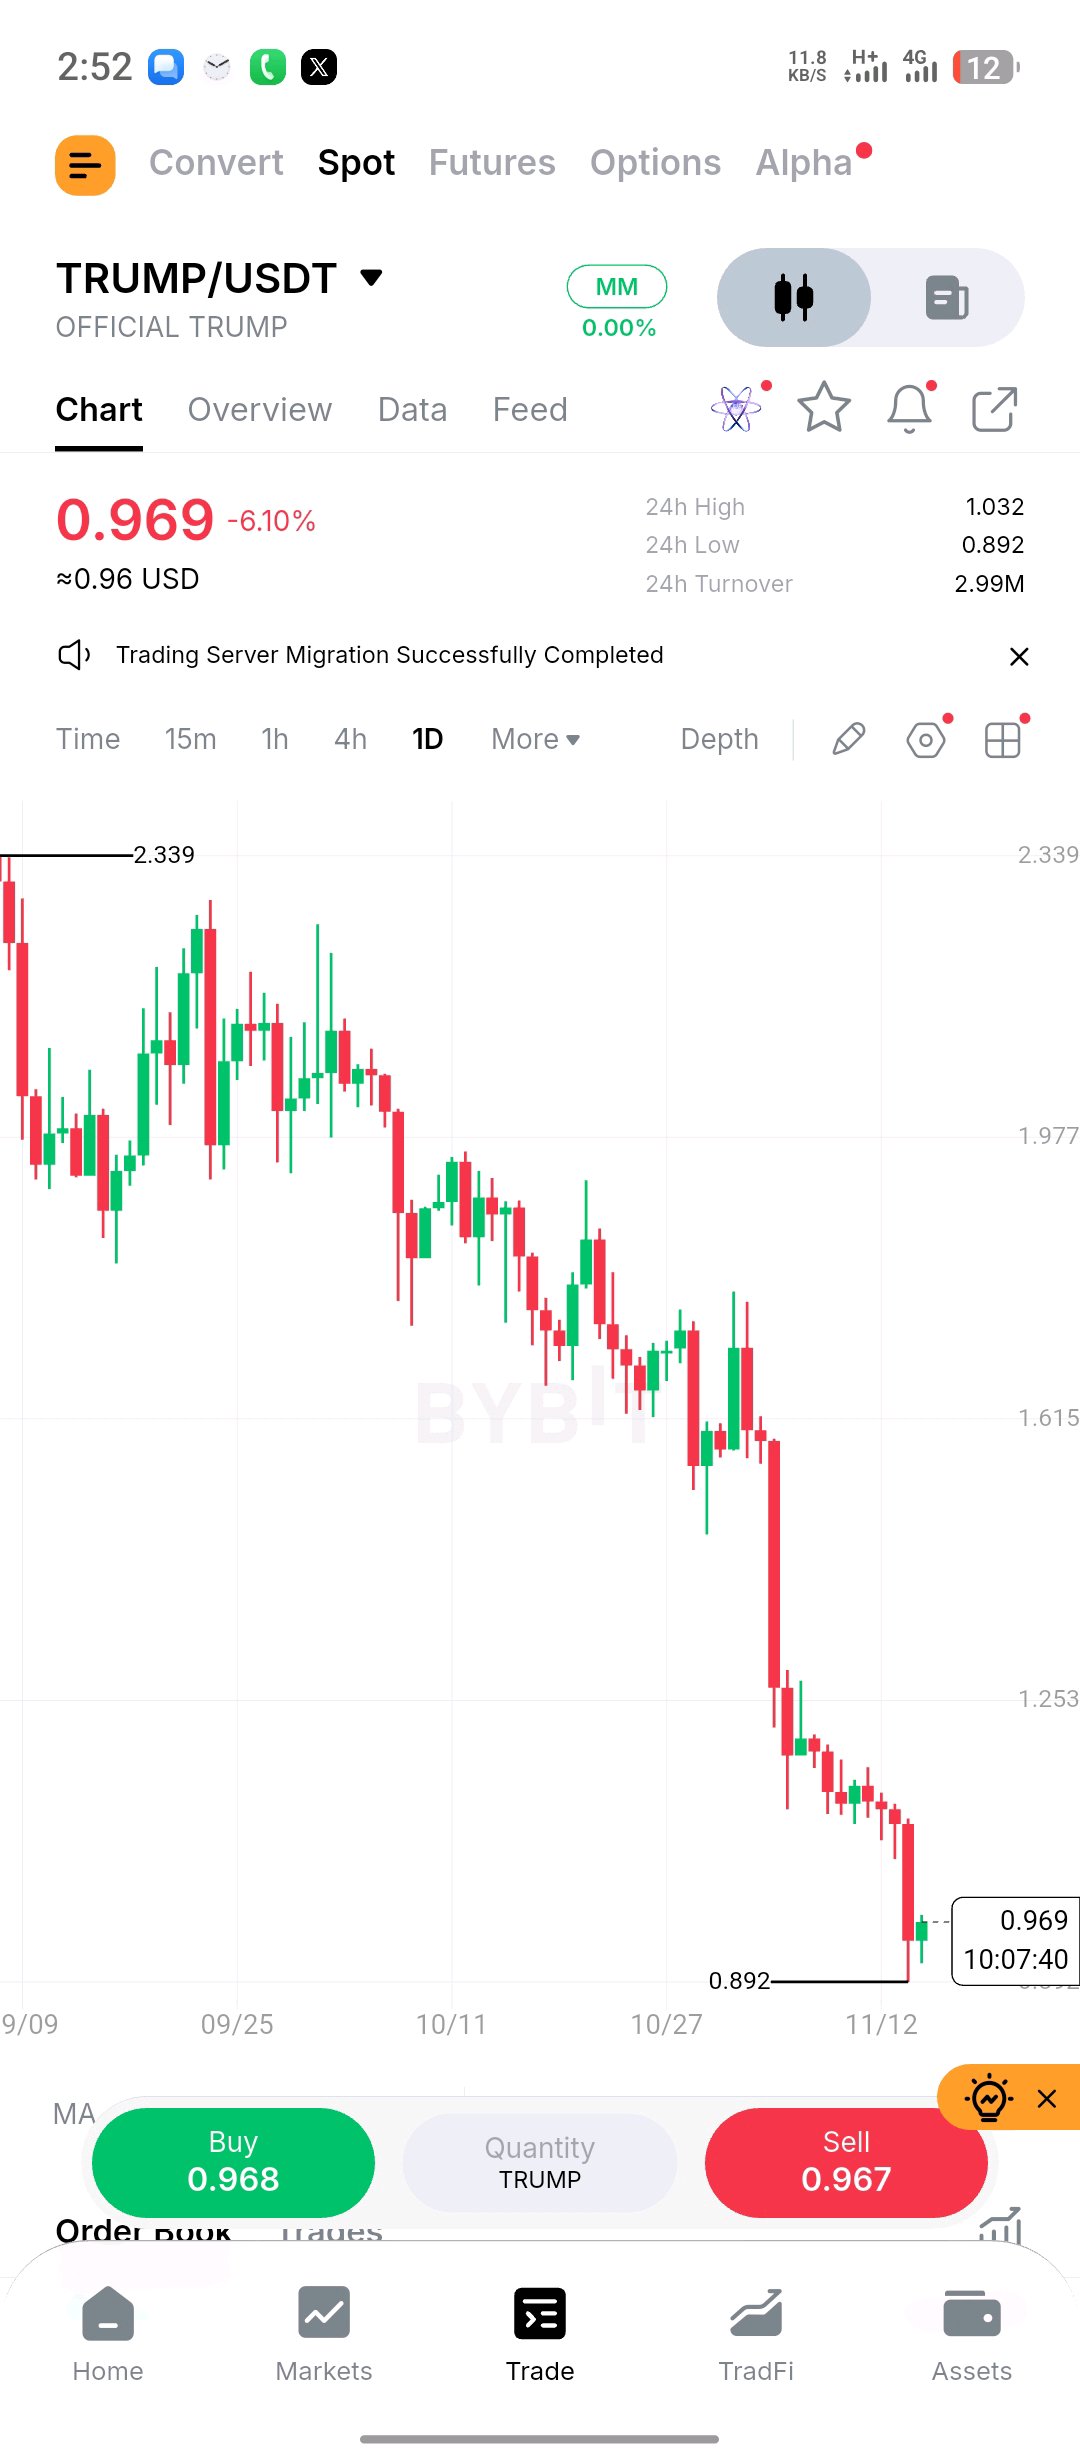
$TRUMPUSDT : When Selling Pressure Becomes Exhaustion, What Comes Next? There's an interesting development on the TRUMP/USDT daily chart. After trading around $2.339 at its previous high, the token has experienced a prolonged decline, with sellers consistently controlling the direction of price. Now trading around $0.969, TRUMP has recently tested $0.892 and produced a small reaction. But here's where I think traders need to be careful. A sharp decline can eventually attract bargain hunters, but lower prices alone don't confirm that sellers have exhausted their strength. I'm watching three areas: $0.892 — The defensive line. This is the recent swing low. If buyers fail to protect it, further downside pressure becomes a possibility. $1.032 — The first recovery test. Reclaiming this level would be an early indication that buyers are becoming more active. $1.253 — The bigger challenge. A sustained move above this region would make the recovery considerably more interesting. What concerns me is the broader structure. TRUMP continues to print lower highs, and buyers haven't yet demonstrated the strength needed to change that pattern. My approach here is simple: don't confuse a reaction with a reversal. I'd rather miss the first part of a recovery than enter based on a signal that hasn't been confirmed. One thing worth discussing: Does TRUMP need another liquidity sweep below $0.892 before a meaningful recovery, or can buyers build a base above the current level? The next few daily candles could provide important clues.#ByXIMPACT
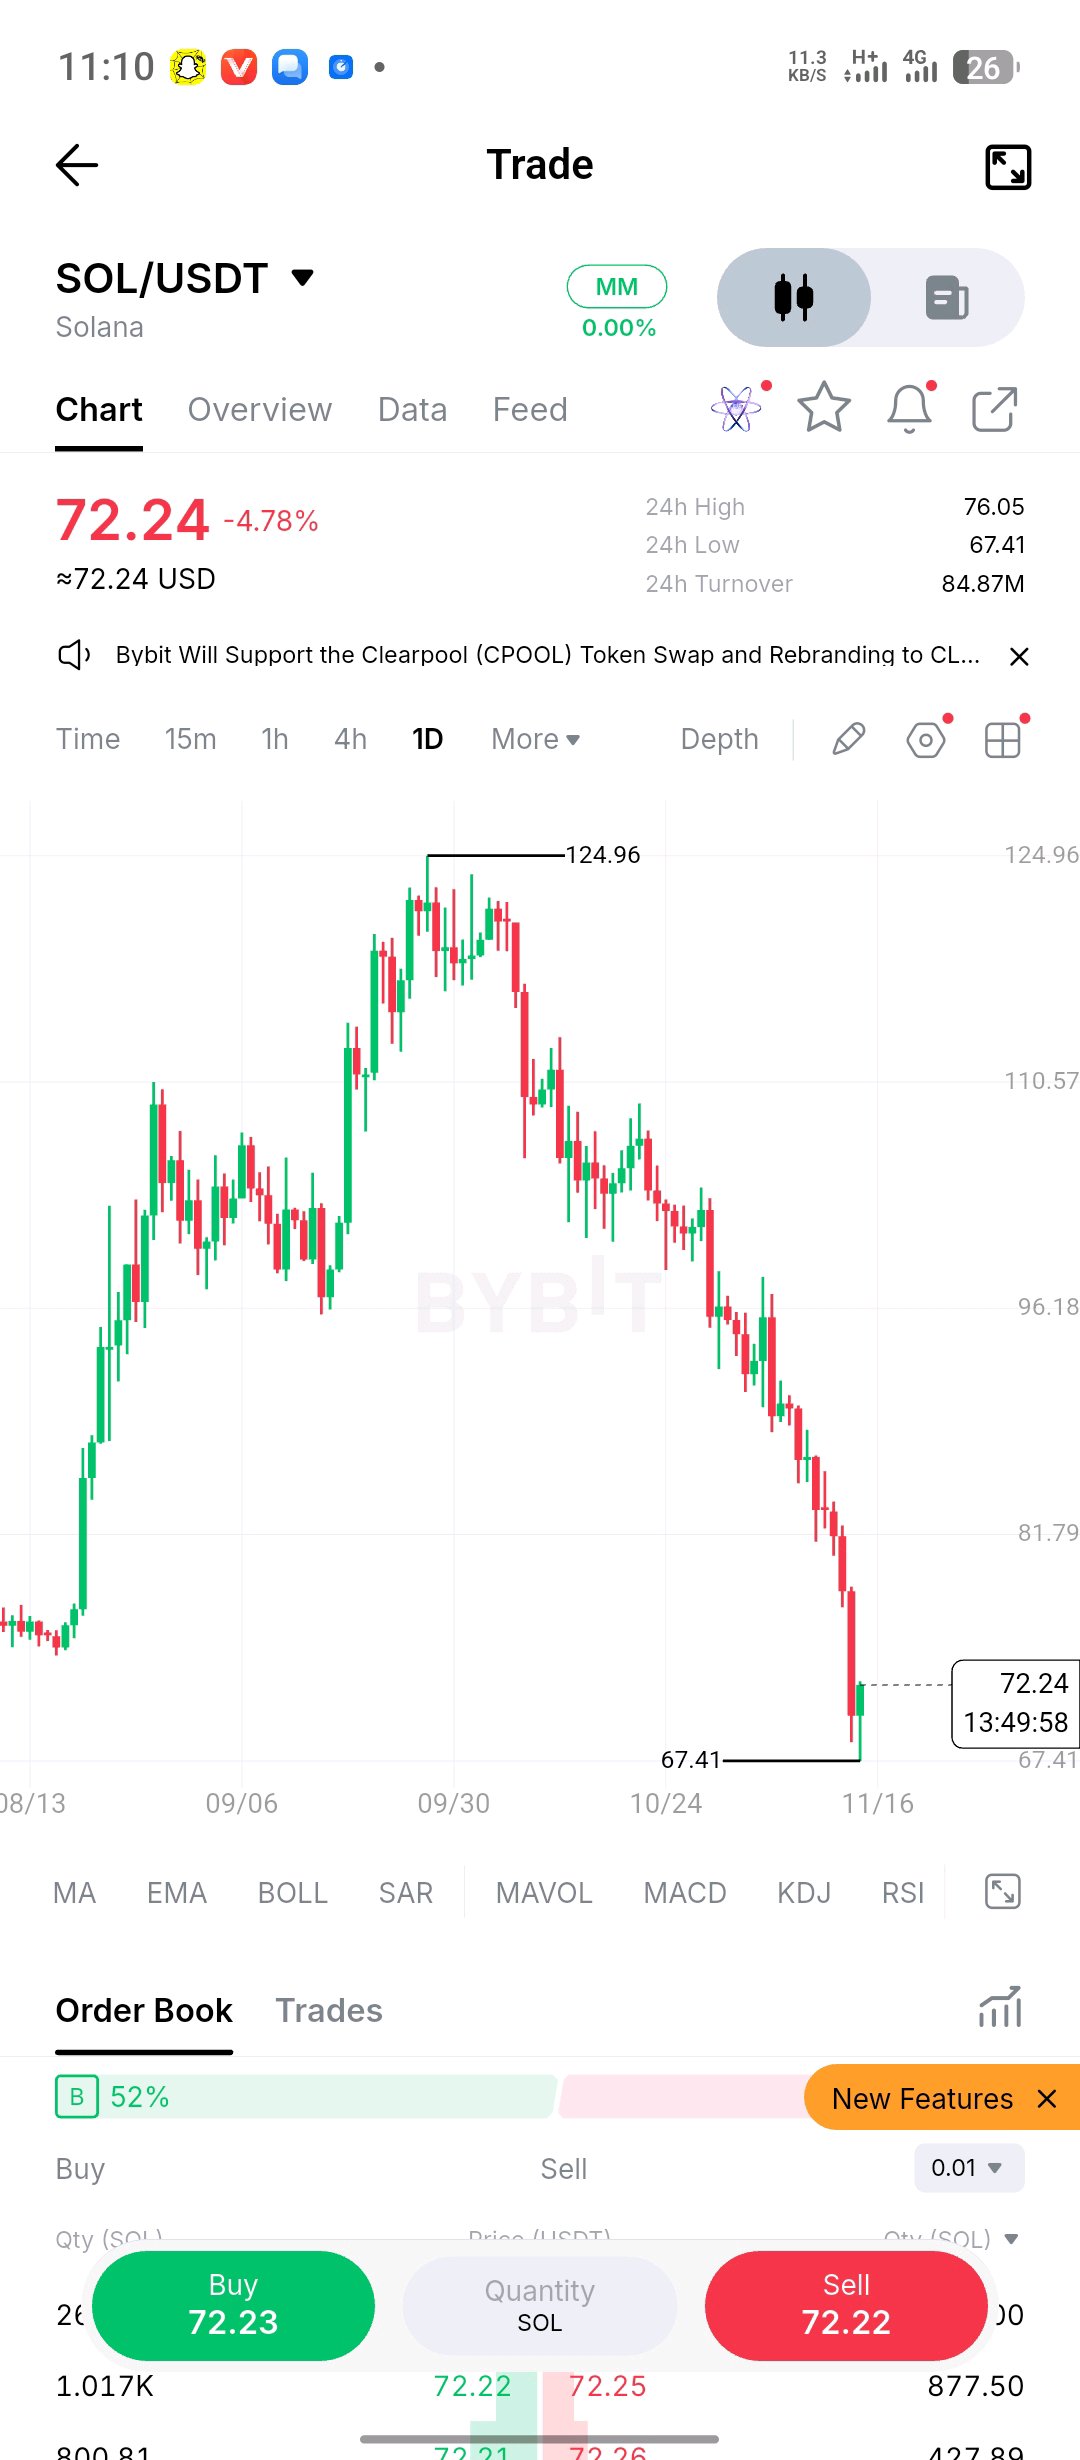
$SOLUSDT : A Small Bounce Doesn't Erase a Much Bigger Problem. Solana has experienced a significant change in market structure. The move from $124.96 to the current $72 region hasn't been an ordinary pullback. The daily chart shows a sequence of lower highs, weakening recoveries and increasingly aggressive selling. But something deserves attention now. SOL recently tested $67.41 and managed to bounce. That reaction is interesting, but I wouldn't interpret it as confirmation that the bottom is in. Here's the situation I'm monitoring: $67.41: The immediate level buyers need to defend. A convincing breakdown could introduce another wave of selling. $76.05: The first important recovery challenge. Reclaiming this area would be an encouraging development. $81.79: A more significant resistance level. Getting back above it would help improve the short-term technical picture. One thing traders should remember: markets can produce impressive relief rallies even while the larger trend remains bearish. For SOL, the priority should be rebuilding structure, not simply recovering a few dollars. I want to see buyers demonstrate consistency, establish a higher low and challenge the resistance levels that previously acted as support. Until then, caution remains justified. Sometimes the most important trading decision isn't finding the perfect entry. It's knowing when the market hasn't given you enough evidence to take one. What do you think SOL needs first: a strong reclaim of $76, or another test of the $67 support before a meaningful recovery?#ByXIMPACT
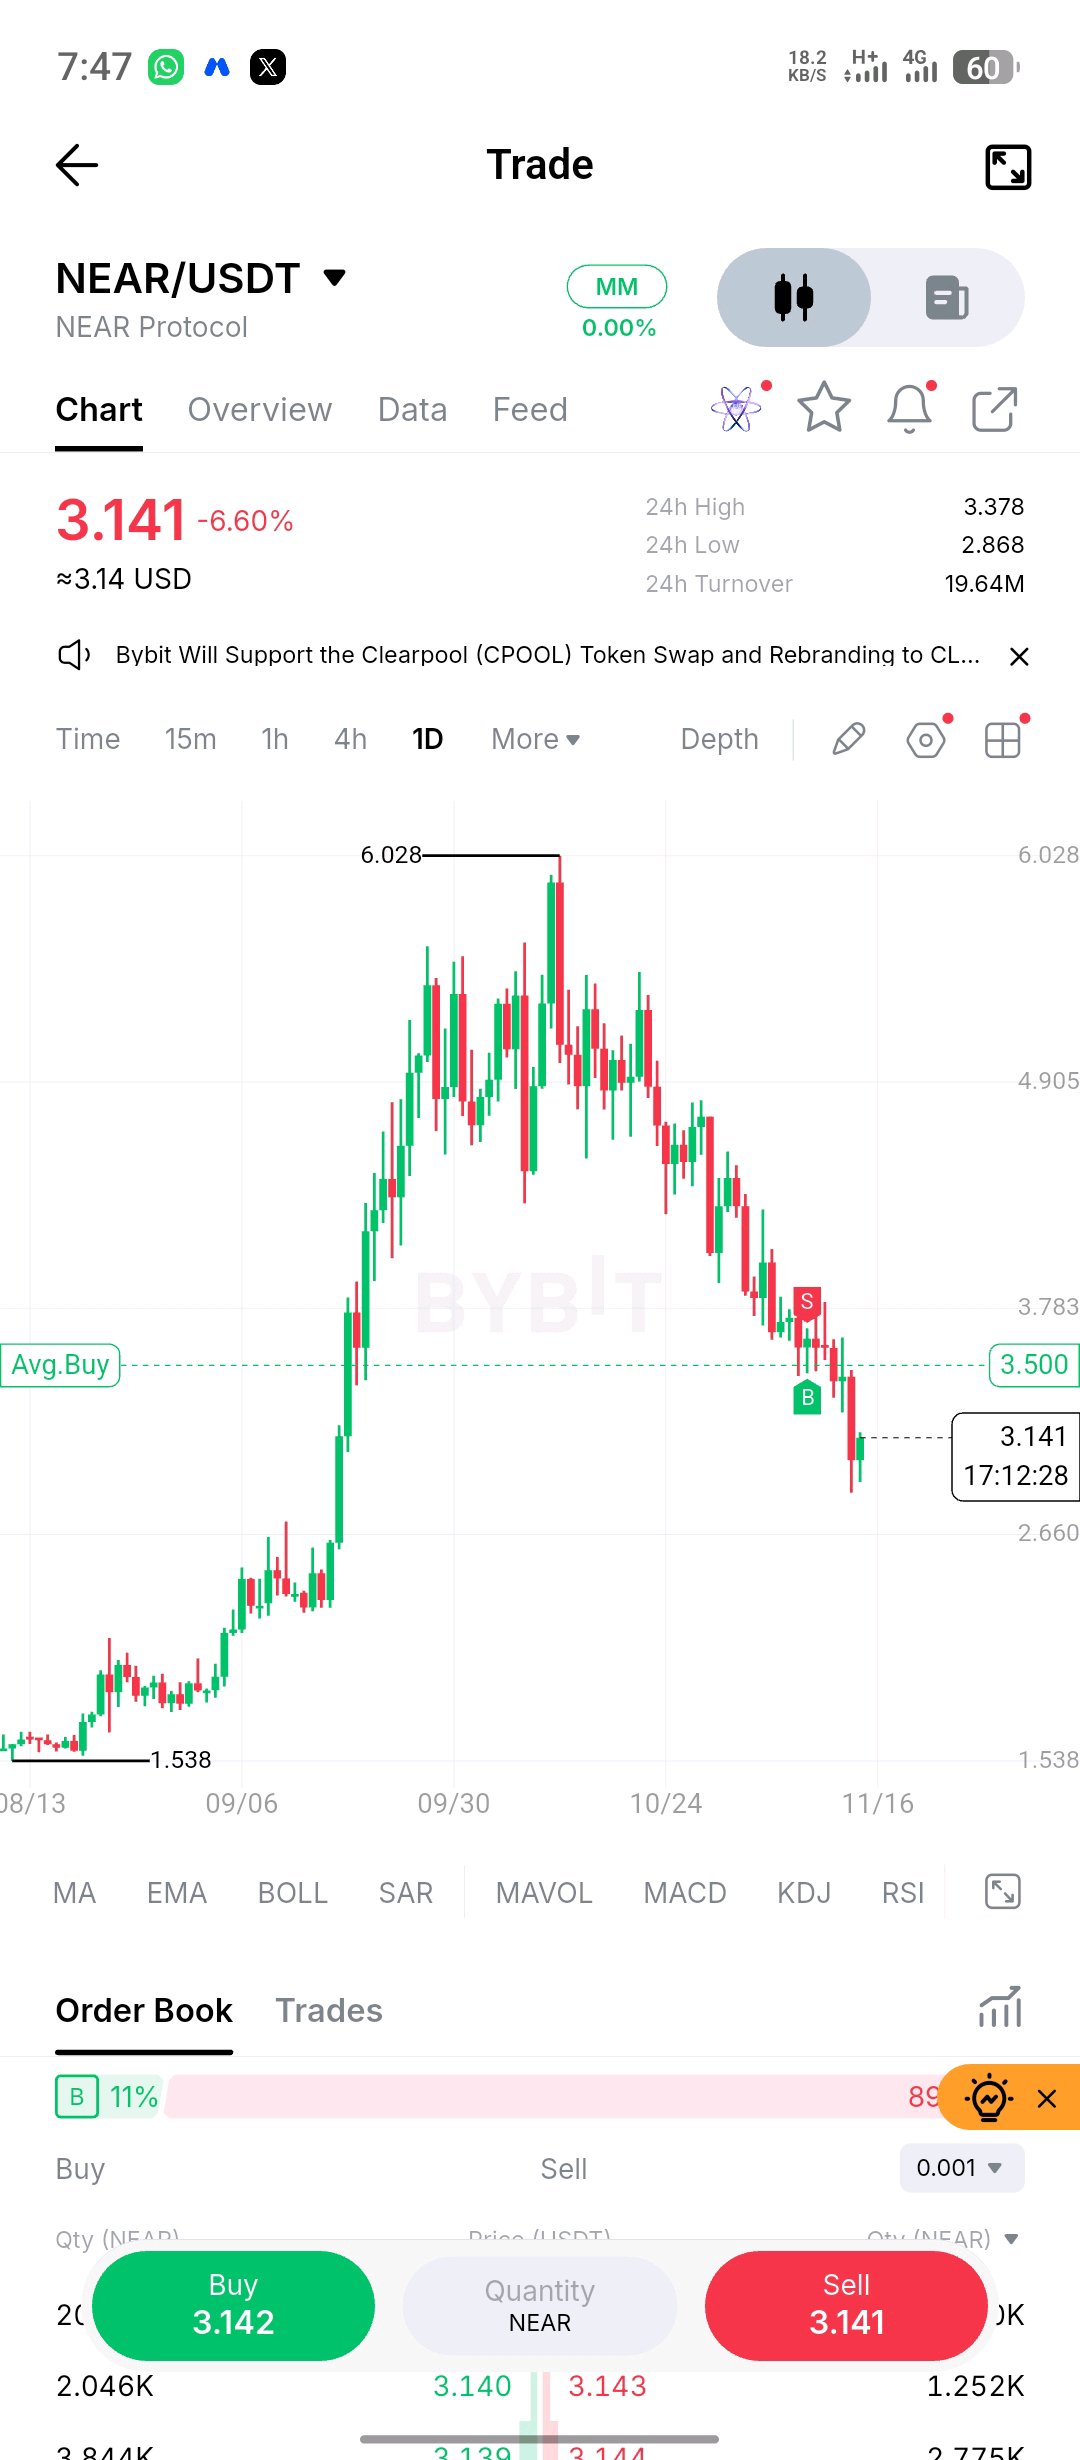
$NEARUSDT Protocol: What Happens After a Rally Loses Its Momentum? NEAR's chart tells an interesting story about market psychology. After climbing from roughly $1.53 to $6.02, the asset entered a sustained correction. What's particularly important is that the decline hasn't been characterized by just one major sell-off. Instead, sellers have repeatedly taken control whenever price attempts to recover. That's a sign worth paying attention to. At around $3.14, NEAR is approaching an important decision area. Here's my current market perspective: The defensive zone: $2.86–$2.90. Buyers recently reacted around this region. If it fails to hold, $2.66 becomes an important downside reference. The recovery challenge: $3.50 is the first level I'd like to see reclaimed. Beyond that, $3.78 could provide a more meaningful test of bullish strength. But there's something traders should avoid here: confusing a bounce with a trend reversal. NEAR doesn't necessarily need another aggressive rally immediately. It first needs to demonstrate that buyers can absorb selling pressure and establish a stronger market structure. Until that happens, the broader bearish setup deserves respect. My takeaway: The next meaningful move will be determined by whether buyers can turn the current support reaction into an actual structural recovery. Are we approaching a potential accumulation phase, or is NEAR still searching for a durable bottom?#ByXIMPACT
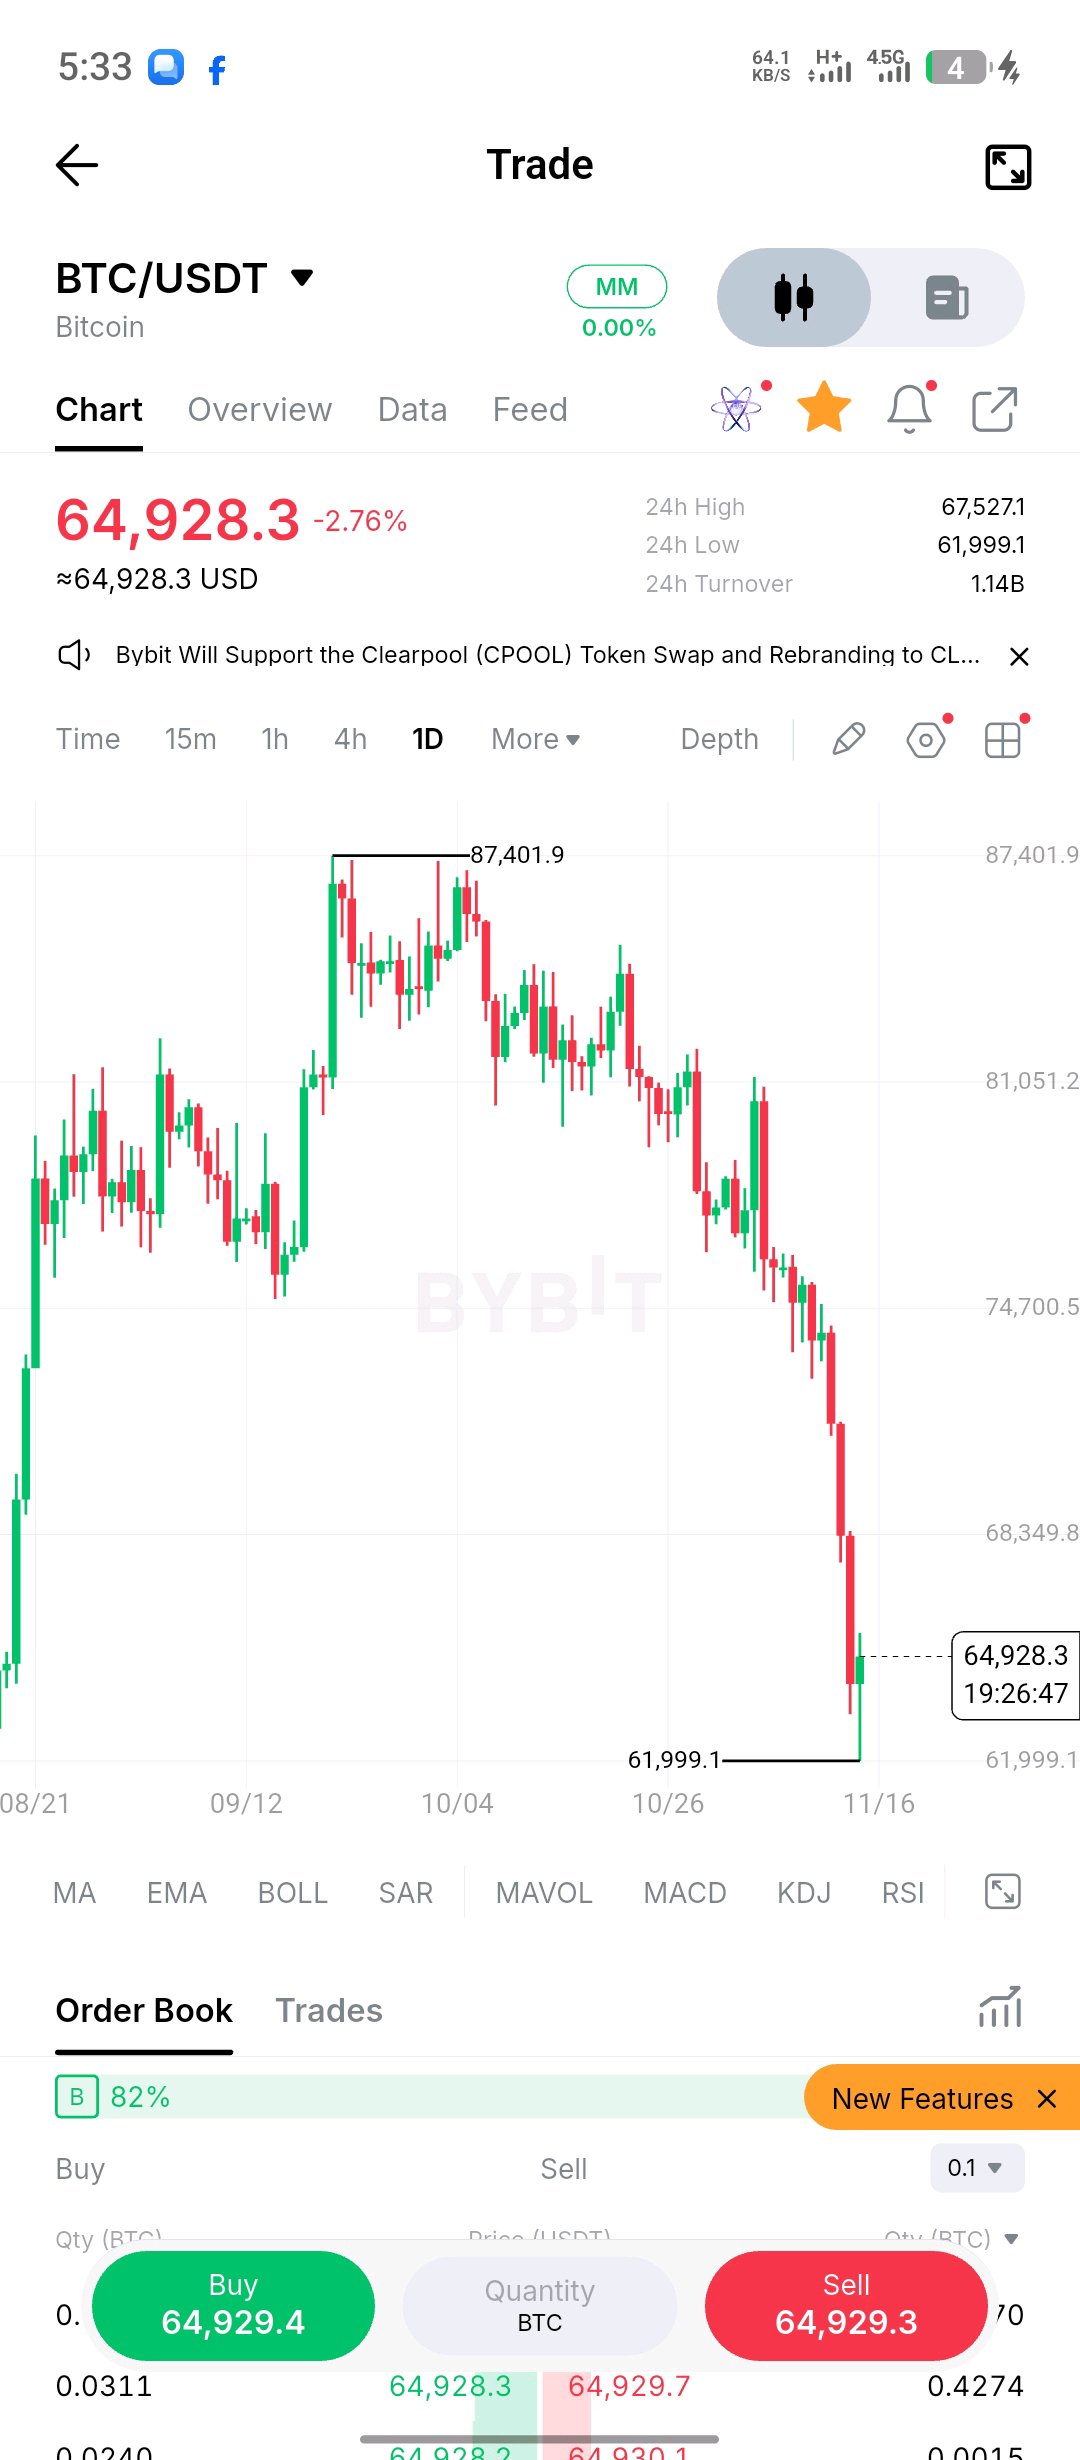
$BTCUSDT BITCOIN'S SELL-OFF IS GETTING SERIOUS — IS $62,000 THE NEXT BATTLEGROUND? Bitcoin is facing renewed downside pressure, with BTC trading around $64,928, down approximately 2.76% on the displayed chart. The daily timeframe reveals a significant deterioration in market structure. What deserves attention is not just the decline itself, but the aggressive rejection of higher prices and the failure of buyers to sustain recovery attempts. TECHNICAL MARKET BREAKDOWN 1. Market Structure BTC has transitioned into a bearish short-term structure, characterized by lower highs and increasingly aggressive selling pressure. 2. Price Action The latest sell-off pushed Bitcoin toward the $62,000 region before a modest recovery. This suggests buyers are attempting to defend the lower levels, but a sustainable reversal is not yet confirmed. 3. Support & Resistance The immediate priority is whether BTC can establish stability above its recent support region or whether sellers will force another breakdown. KEY LEVELS TO WATCH Major Support: $62,000–$62,500 Immediate Resistance: $65,500–$66,000 Major Resistance: $67,400 📉 Downside Scenario: A decisive daily close below $62,000 could expose BTC to another bearish extension. BEARISH INVALIDATION A sustained daily close above $66,000 would weaken the immediate bearish continuation thesis and suggest buyers are beginning to regain control. Until that happens, recovery attempts should be treated cautiously. TRADE STRATEGY & RISK MANAGEMENT My approach is to prioritize confirmation over anticipation. - Avoid chasing aggressive bearish candles. - Watch for a confirmed breakdown below support before considering short exposure. - Monitor rejection around resistance for potential bearish opportunities. - Keep individual trade risk within 0.5–1% of account equity. - Aim for a minimum 1:2 risk-to-reward ratio. - Define stop-loss and invalidation before entering. - Avoid excessive leverage during periods of elevated volatility. A good trader doesn't need to catch every move. The objective is to survive volatility, preserve capital and execute only when the risk is justified. FINAL MARKET OUTLOOK Bitcoin remains vulnerable to further downside while it trades below the immediate recovery zone. However, the reaction around $62,000 could become important in determining whether this is another continuation move or the beginning of a meaningful relief rally. The next daily closes deserve close attention. LET'S DEBATE: Is Bitcoin preparing to break below $62K, or have sellers pushed the market far enough to create a powerful recovery? Are you bearish until $66K is reclaimed, or do you believe this is where buyers finally step in? I want to hear the technical reasoning behind your position. #ByXIMPACT
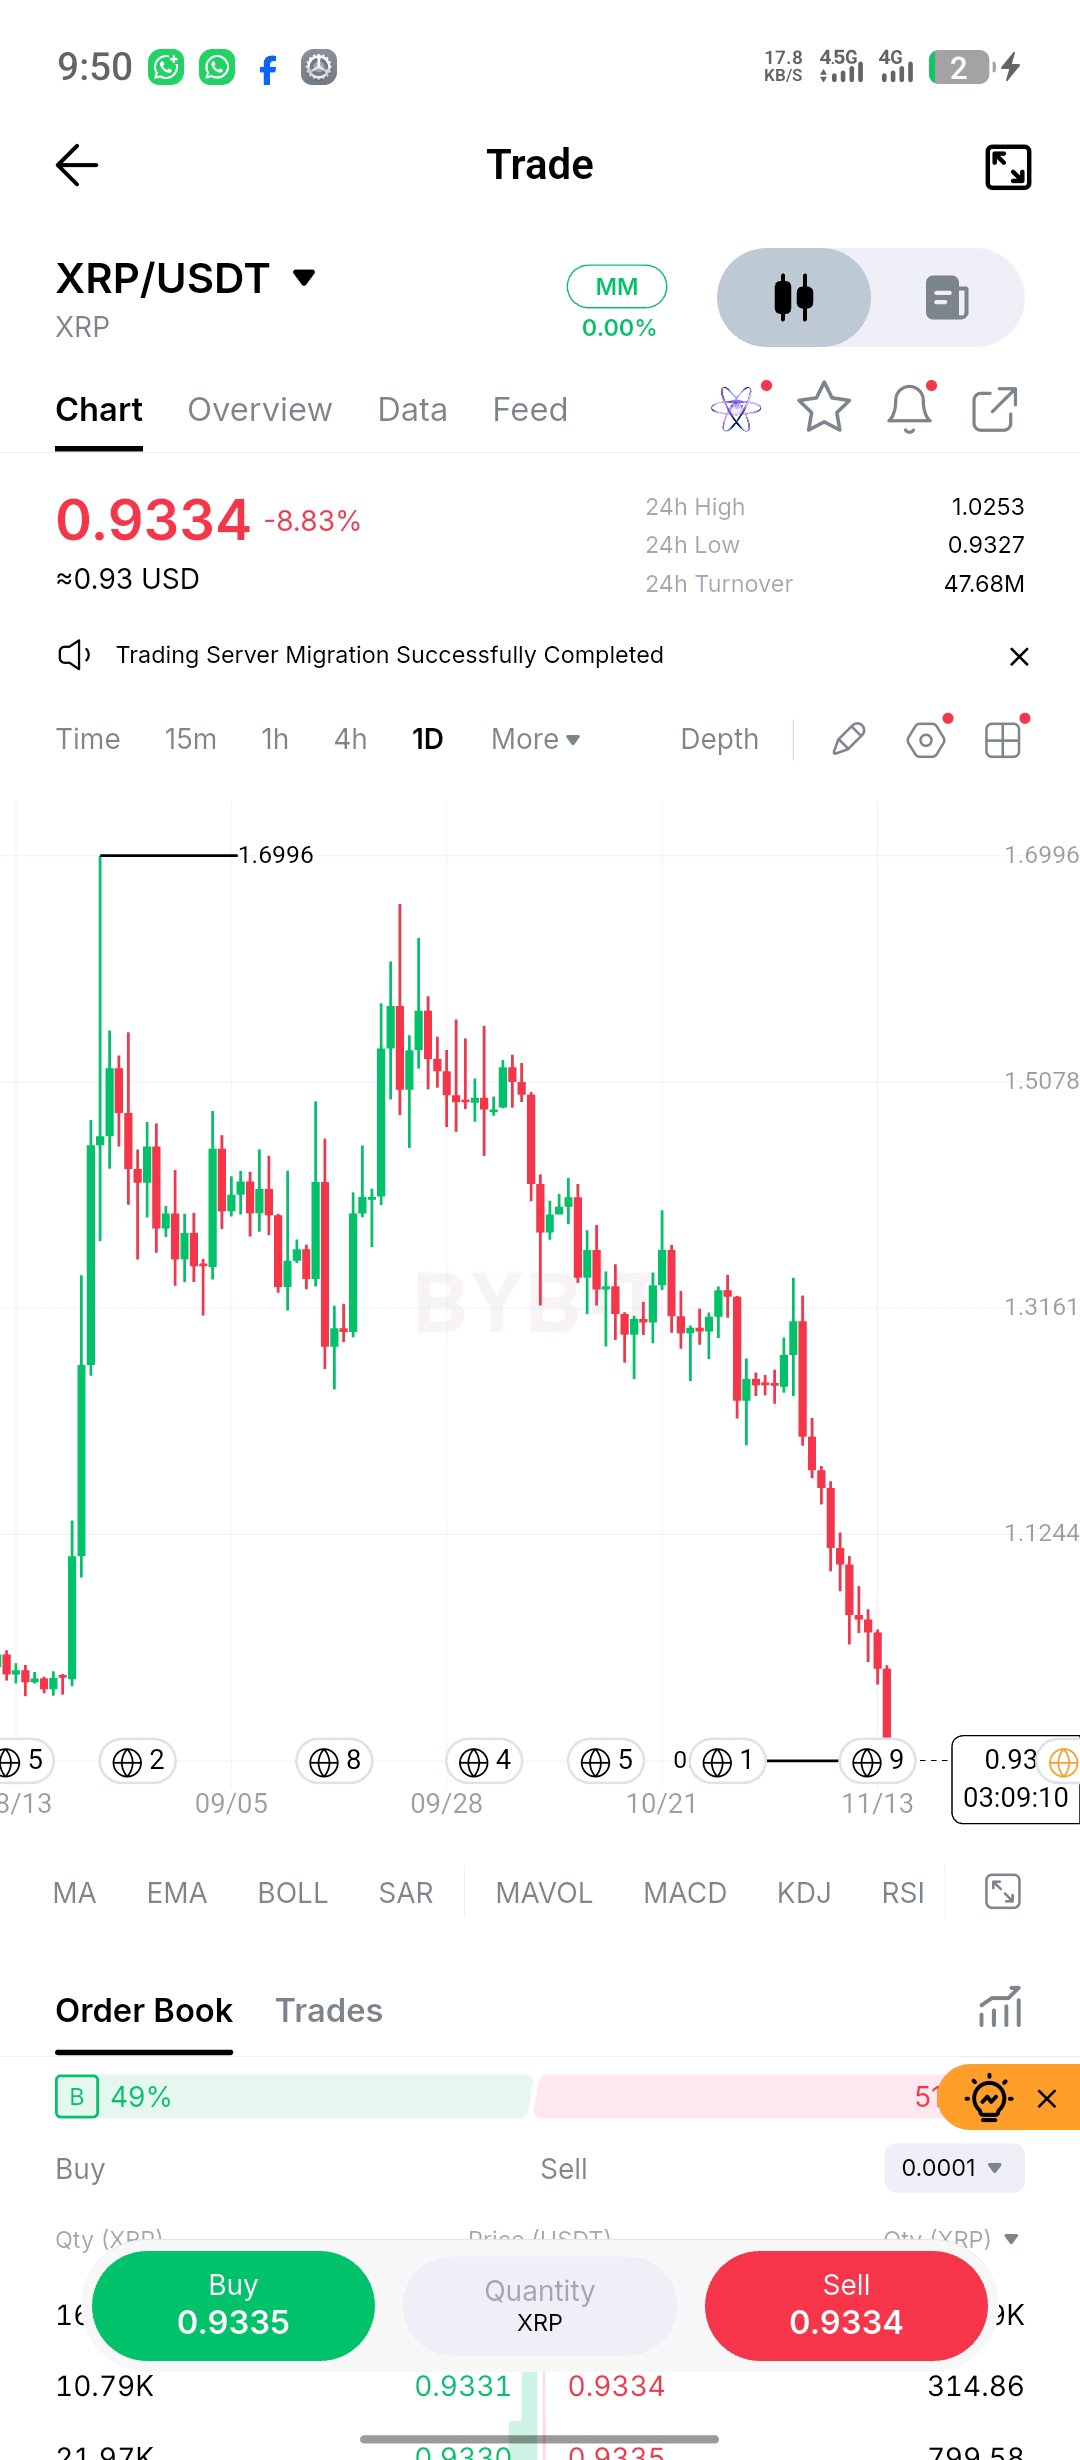
$XRPUSDT BAJO FUERTE PRESIÓN DE VENTA — ¿SE ESTÁ PREPARANDO EL MERCADO PARA OTRO DESCENSO? XRP muestra una debilidad significativa en el marco temporal diario, con el precio actualmente alrededor de $0.9334, tras una caída agresiva. Lo que hace que este movimiento sea particularmente importante es que la estructura general de precios se ha debilitado progresivamente. Los compradores han fallado repetidamente en establecer una recuperación sostenida, mientras que los vendedores continúan empujando el precio hacia niveles más bajos. ANÁLISIS TÉCNICO DEL MERCADO 1. Estructura del mercado XRP ha desarrollado una secuencia de máximos más bajos y mínimos más bajos tras su rally anterior. Esto indica una estructura alcista debilitada y un control bajista continuo. 2. Acción del precio Las últimas velas bajistas sugieren una fuerte participación vendedora. La fuerte caída también indica que a los compradores les ha costado defender los niveles de precio anteriores. 3. Soporte y resistencia El mercado se está acercando a una importante zona de soporte alrededor de $0.90–$0.93. Una ruptura sostenida por debajo de esta área podría exponer a XRP a una mayor caída. NIVELES IMPORTANTES A VIGILAR Soporte inmediato: $0.90–$0.93 Primera resistencia: $1.00–$1.05 Zona de recuperación principal: $1.10–$1.15 Invalidación bajista: Un cierre diario sostenido por encima de la región de $1.05–$1.10 debilitaría significativamente la tesis inmediata de continuación bajista. EJECUCIÓN DE OPERACIONES Y GESTIÓN DE RIESGO Mi enfoque es mantenerme paciente en lugar de perseguir una vela bajista extendida. - Espere una ruptura de soporte confirmada antes de considerar una exposición corta. - Alternativamente, observe si hay un rechazo cerca de la resistencia antes de buscar una entrada bajista. - Mantenga el tamaño de la posición proporcional al capital de la cuenta. - Arriesgue un máximo del 0.5–1% del capital de trading por configuración. - Apunte a una relación riesgo-beneficio mínima de 1:2. - Defina siempre la colocación del stop-loss antes de entrar. - Evite el apalancamiento excesivo y el trading emocional. La preservación del capital es lo primero. No hay razón para arriesgar toda una cuenta tratando de predecir la siguiente vela. PERSPECTIVA PROFESIONAL DEL MERCADO XRP permanece bajo presión bajista, pero la caída actual también trae la posibilidad de un rebote de alivio a corto plazo. No consideraría una reversión confirmada hasta que los compradores recuperen una resistencia importante y establezcan una estructura de mercado más fuerte. Por ahora, la confirmación importa más que la predicción. LA GRAN PREGUNTA: ¿Se está preparando XRP para perder el soporte de $0.90 y extender su caída, o los vendedores se están acercando al agotamiento? ¿Está buscando una oportunidad de ruptura o esperando una reversión confirmada? Discutamos la estructura del mercado, no solo la dirección. #ByXIMPACT
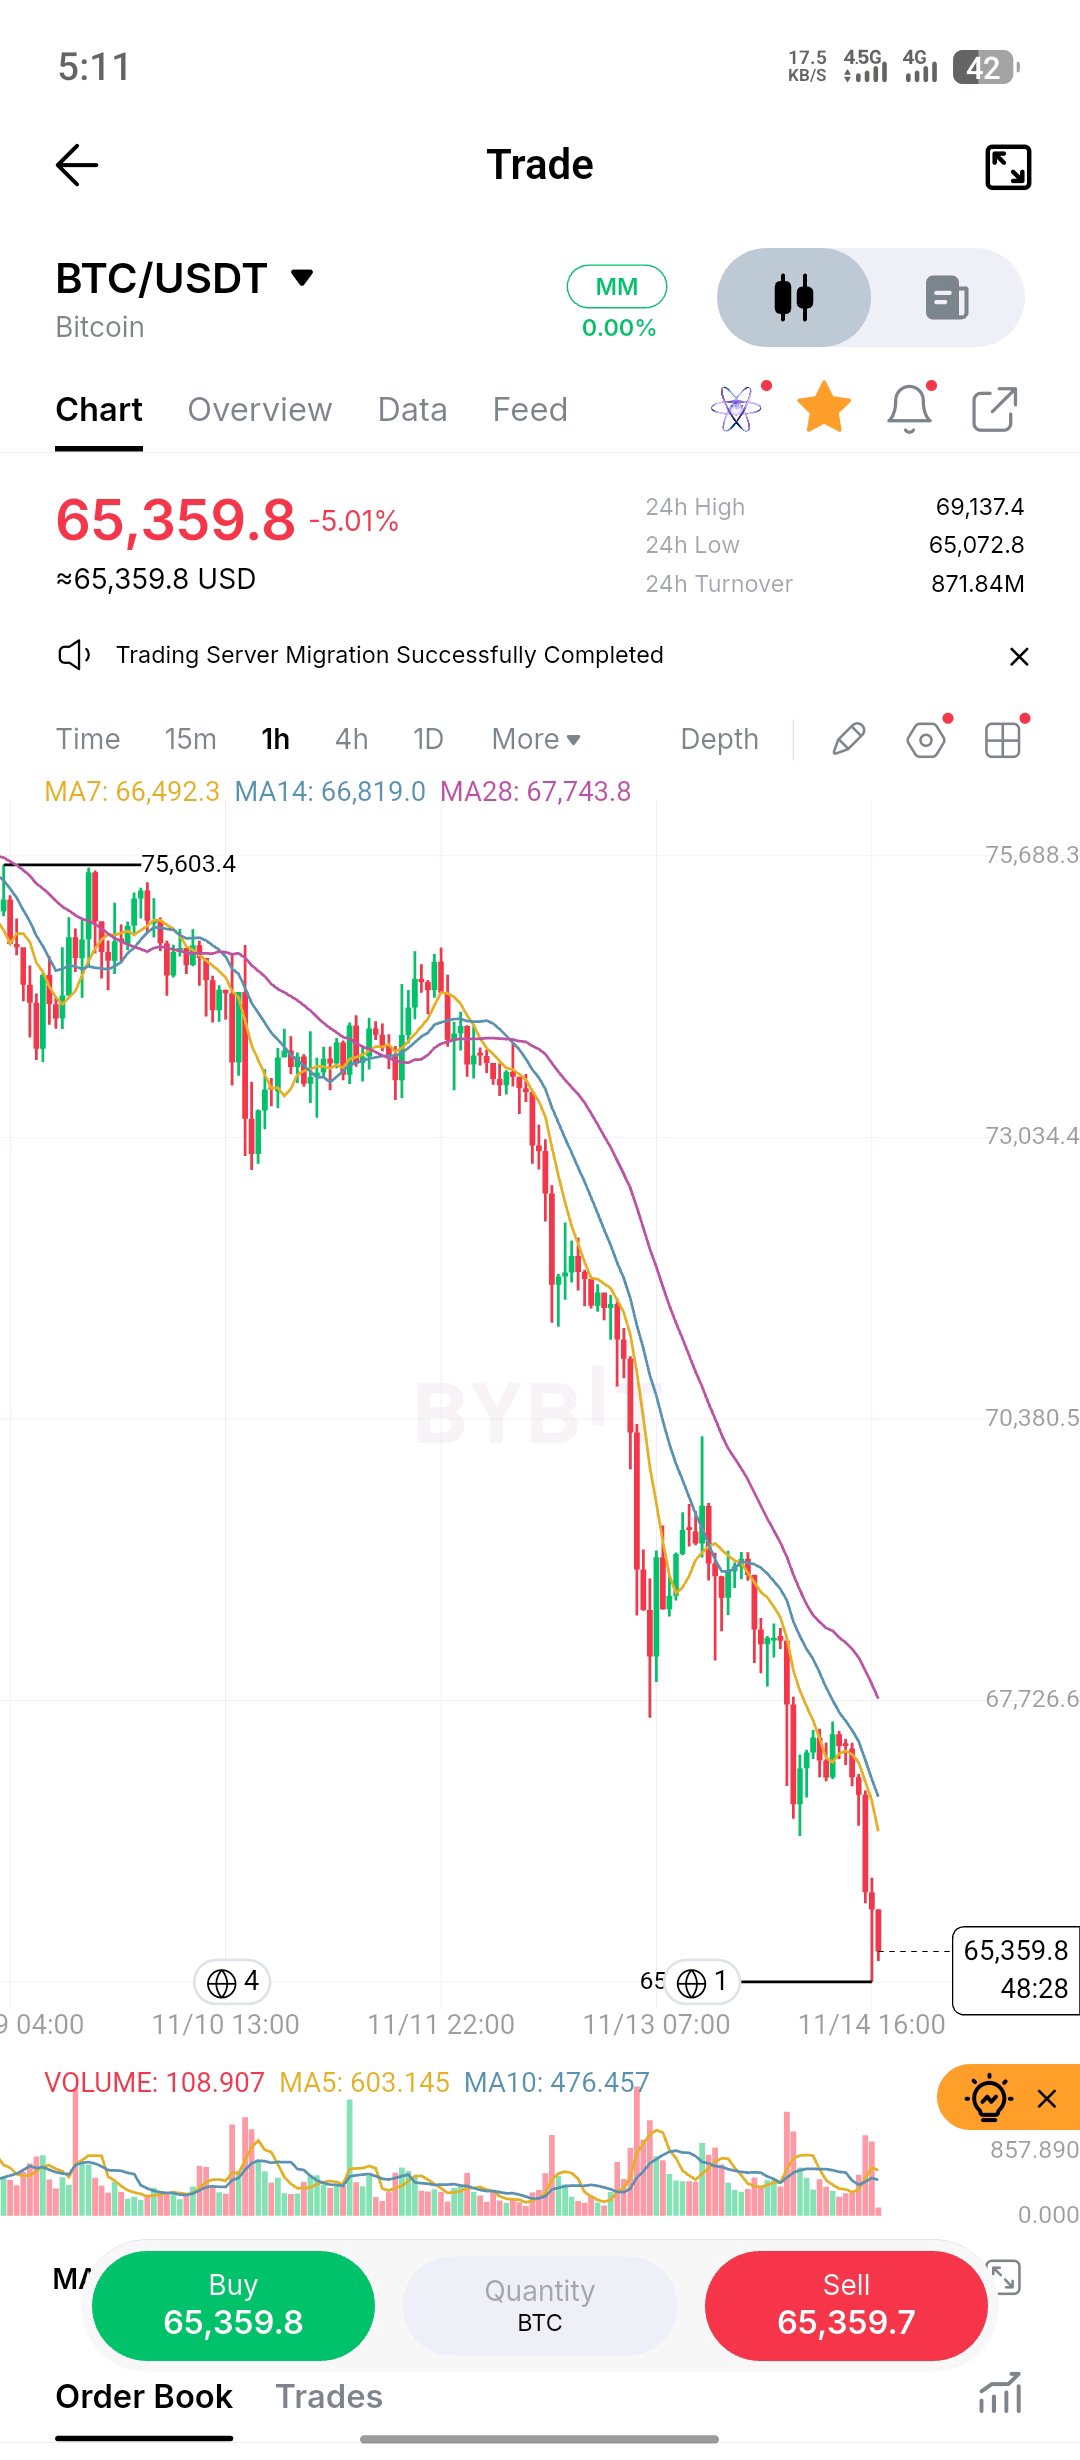
$BTCUSDT BITCOIN UNDER PRESSURE: HOW MUCH LOWER CAN IT GO? Bitcoin's sell-off is becoming increasingly aggressive. Sellers remain in control, but the next move will depend on whether buyers can defend the current support zone. Technical Breakdown • Market structure continues to favor sellers, with lower highs and lower lows. • Moving averages remain bearish and act as overhead resistance. • Selling volume is increasing, suggesting strong downside participation. KEY LEVELS TO WATCH Support: 65,000k — Losing this level could accelerate downside pressure. Resistance: 67,700k — First major recovery hurdle. BEARISH INVALIDATION: 67,700k A sustained 4H candle close above 67,700k would weaken the current bearish setup and suggest buyers are regaining control. Until then, downside pressure remains the dominant scenario. My Take I wouldn't rush to buy this dip just because BTC looks oversold. A reversal needs confirmation, not hope. LET'S SETTLE THE DEBATE: Is Bitcoin preparing for another leg down, or are sellers running out of ammunition? Are you BUYING this weakness or staying SHORT? Drop your reasoning below. #ByXIMPACT
$HYPEUSDT TODAVÍA NO MUESTRA SEÑALES DE FORTALEZA. EL PRÓXIMO MOVIMIENTO PODRÍA SER DECISIVO. Una caída pronunciada ha cambiado el equilibrio de poder hacia los vendedores, y la acción del precio más reciente plantea una pregunta importante: ¿están los compradores esperando un descuento o han perdido la confianza en la estructura actual del mercado? Esto es lo que importa: • Tendencia: Los máximos más bajos y los mínimos más bajos siguen definiendo la estructura del precio. • Resistencia dinámica: Los promedios móviles permanecen por encima y apuntan hacia abajo, lo que hace que los intentos de recuperación sean vulnerables al rechazo. • Volumen: La actividad de venta ha aumentado alrededor de la última caída. Esto merece atención, aunque se necesita una continuación sostenida para confirmar la tendencia. • Área crítica: El mínimo reciente alrededor de 66.80 es el nivel inmediato a monitorear. Una ruptura convincente podría extender la presión bajista. ¿Qué cambiaría mi perspectiva? Quiero ver que los vendedores pierdan impulso, seguido de una fuerte recuperación del grupo de promedios móviles y un máximo más alto confirmado. Hasta entonces, sería prematuro cantar un fondo. Mi evaluación: La continuación bajista sigue siendo el escenario con mayor probabilidad a menos que los compradores recuperen una resistencia significativa. Una cosa que estoy observando de cerca: si HYPE puede defender su mínimo reciente o si lo convierte en otro nivel de resistencia. ¿Cuál es tu interpretación de este movimiento? ¿Es este el comienzo de la acumulación, o los toros se están metiendo demasiado pronto? $ByXIMPACT
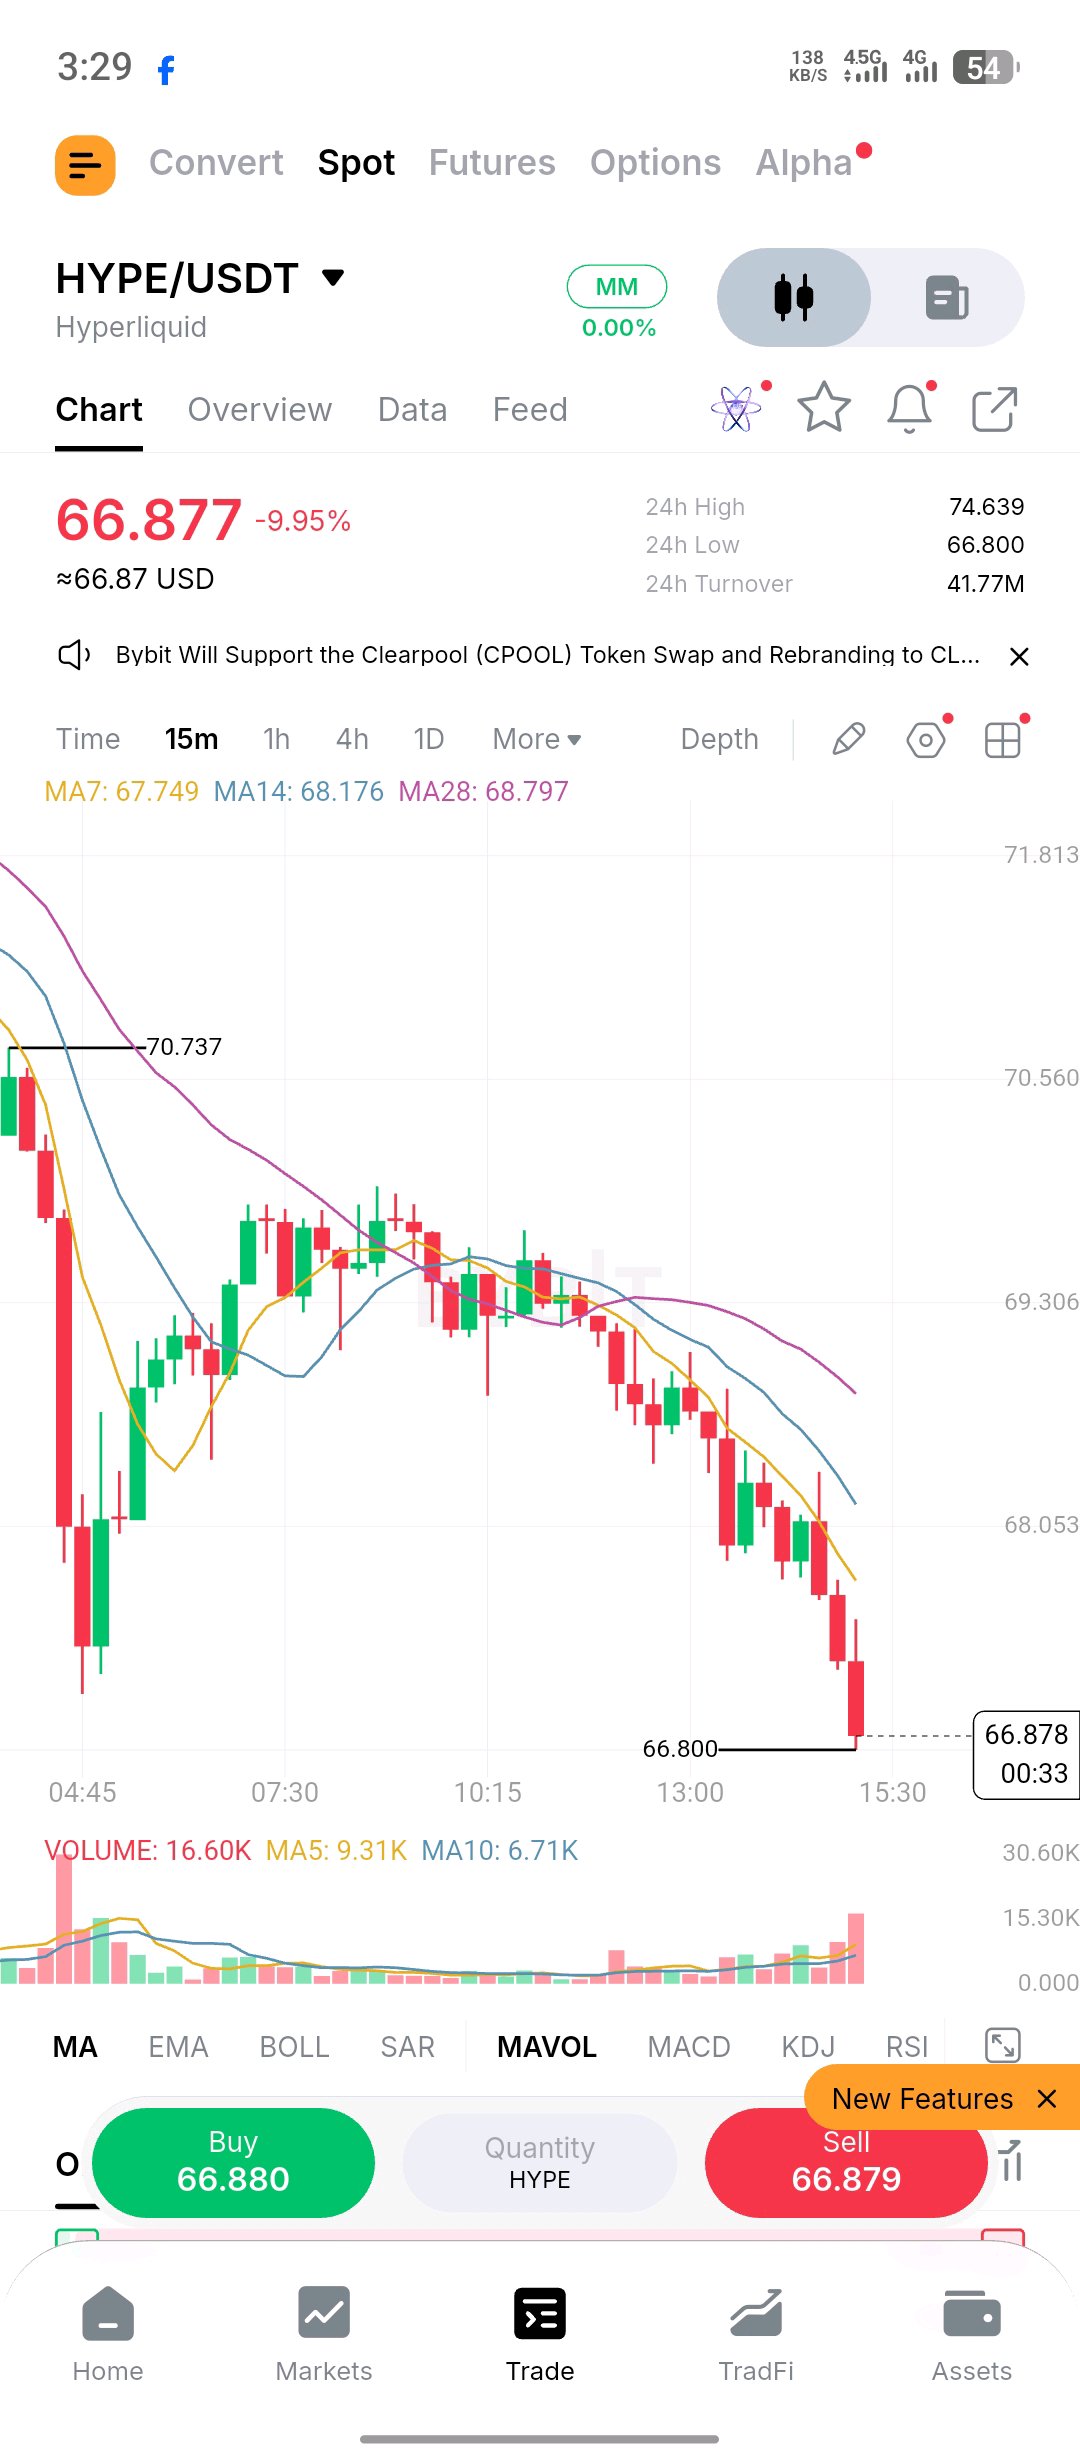
HYPE ISN'T SHOWING SIGNS OF STRENGTH YET. THE NEXT MOVE COULD BE DECISIVE. A sharp decline has shifted the balance of power toward sellers, and the latest price action raises an important question: are buyers waiting for a discount, or have they lost confidence in the current market structure? Here's what matters: • Trend: Lower highs and lower lows continue to define the price structure. • Dynamic resistance: The moving averages remain overhead and point downward, making recovery attempts vulnerable to rejection. • Volume: Selling activity has picked up around the latest decline. This deserves attention, although sustained follow-through is needed to confirm continuation. • Critical area: The recent low around 66.80 is the immediate level to monitor. A convincing breakdown could extend bearish pressure. What would change my outlook? I want to see sellers lose momentum, followed by a strong reclaim of the moving-average cluster and a confirmed higher high. Until then, calling a bottom would be premature. My assessment: Bearish continuation remains the higher-probability scenario unless buyers reclaim meaningful resistance. One thing I'm watching closely: whether HYPE can defend its recent low or turns it into another resistance level. What's your interpretation of this move? Is this the beginning of accumulation, or are bulls stepping in too early? #ByXIMPACT
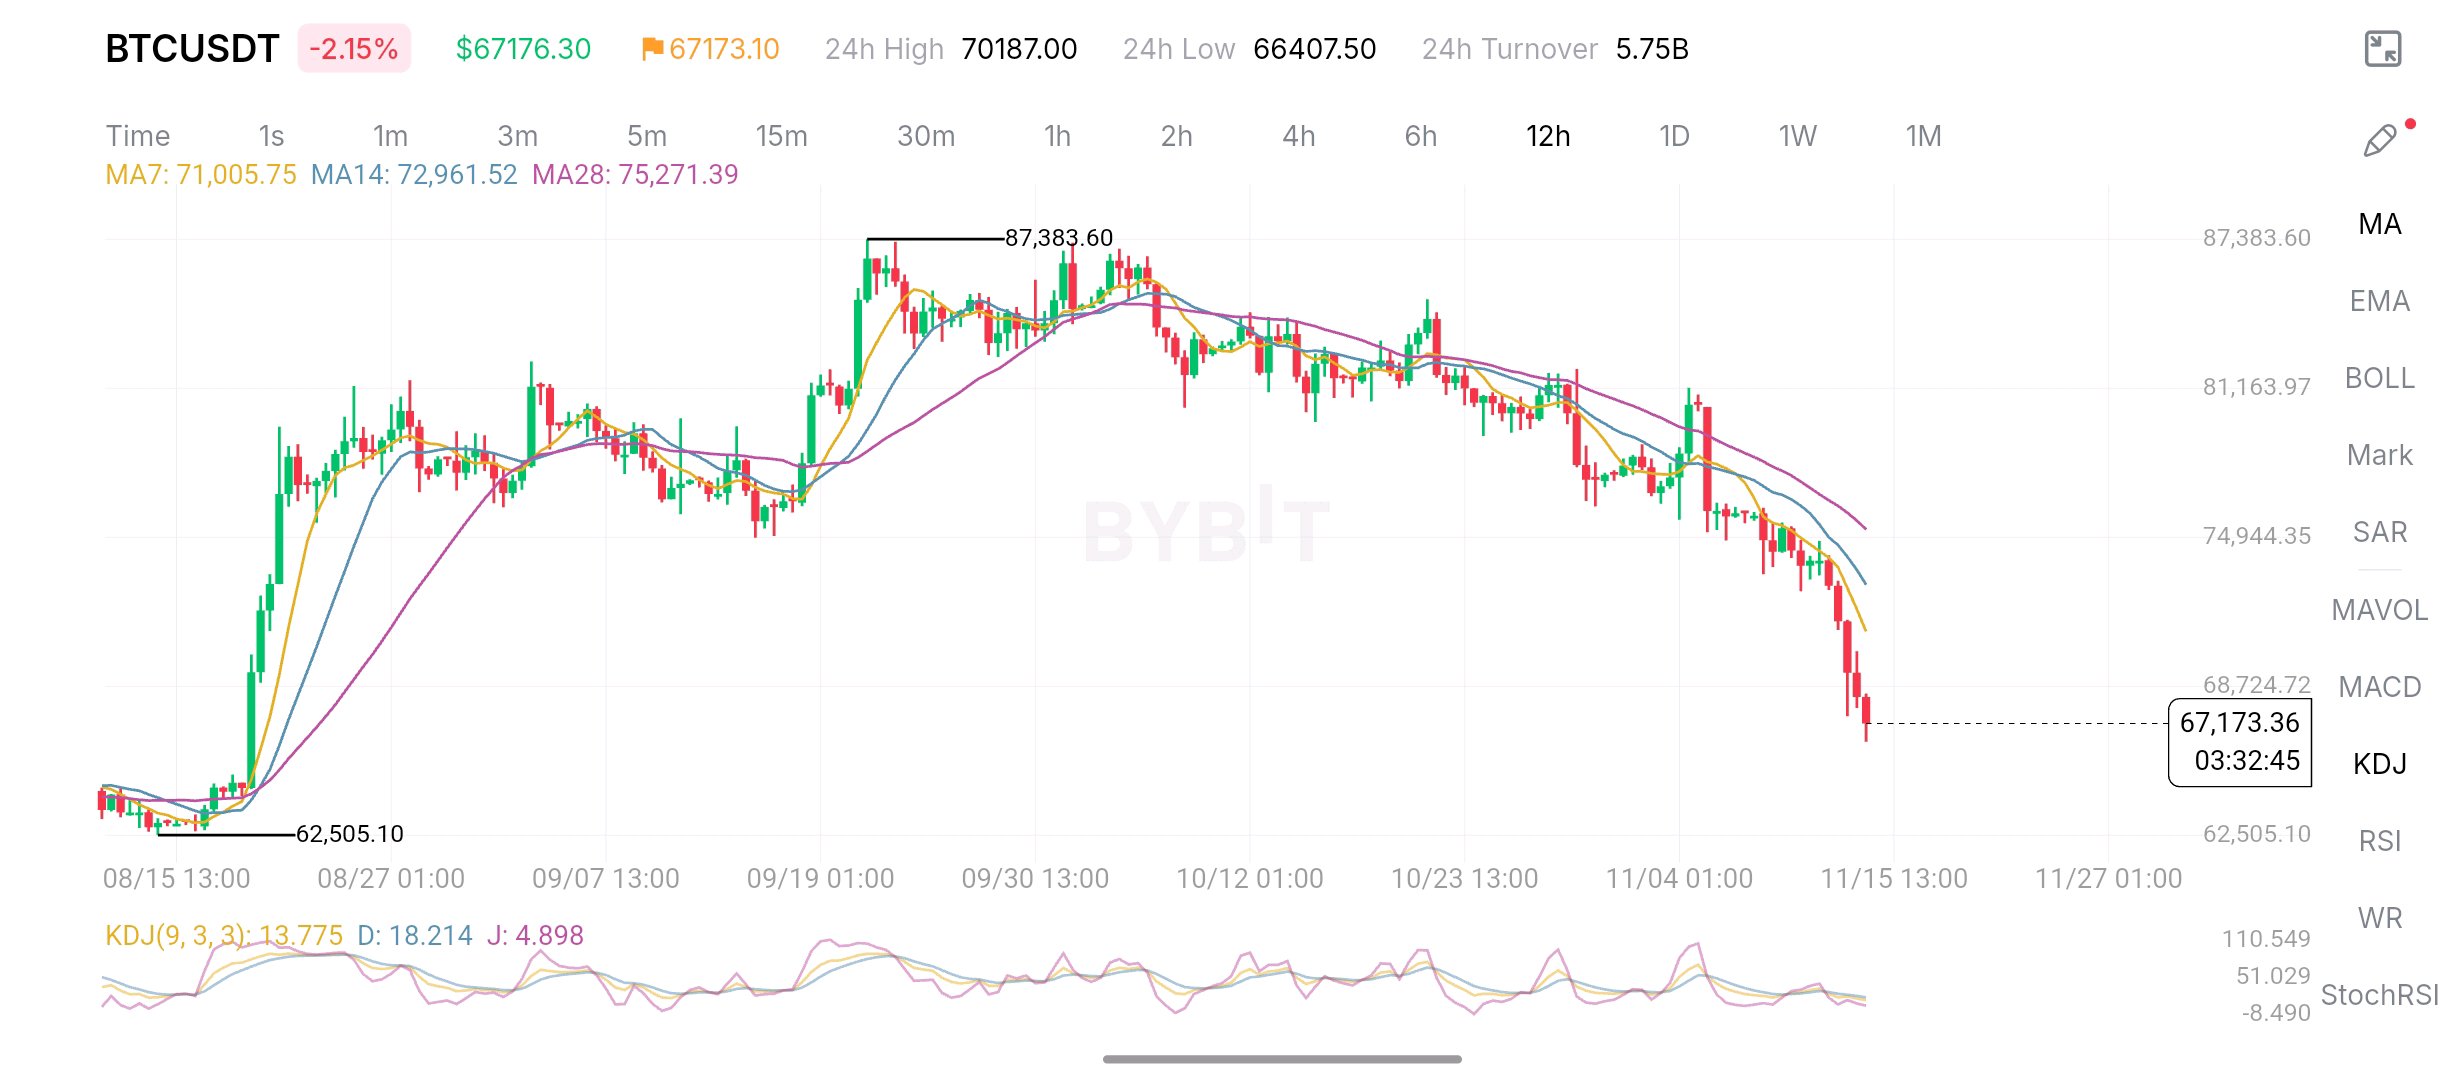
$BTCUSDT : The bears are taking control, and Bitcoin needs to prove otherwise. Looking at the 12H chart, the market structure is becoming increasingly bearish. BTC has been forming lower highs, and the recent selling pressure has pushed price below the major moving averages. What concerns me most is that buyers had several opportunities to regain momentum, but none of those recovery attempts produced a convincing breakout. Now we're seeing another strong wave of selling. My trader's viewpoint: I'm leaning bearish on BTC until the chart gives a genuine reason to change that view. Here's what I'm watching: Support: The 66,400k–66,500k region is an important area to watch. Losing this zone could expose BTC to further downside. Resistance: BTC needs to recover above the nearby resistance and reclaim its moving averages before bulls can start building a stronger case. Bearish confirmation: A sustained break below recent support, followed by continued selling pressure. Bullish confirmation: A strong recovery candle, increasing buying volume, and a confirmed break above the descending moving averages. Personally, I'm not interested in calling a bottom just because Bitcoin has dropped significantly. The trend is still pointing down, and buyers need to demonstrate real strength before I reconsider. Let's hear your opinion: Is Bitcoin preparing for another major correction, or are we getting close to a strong recovery? #ByXIMPACT
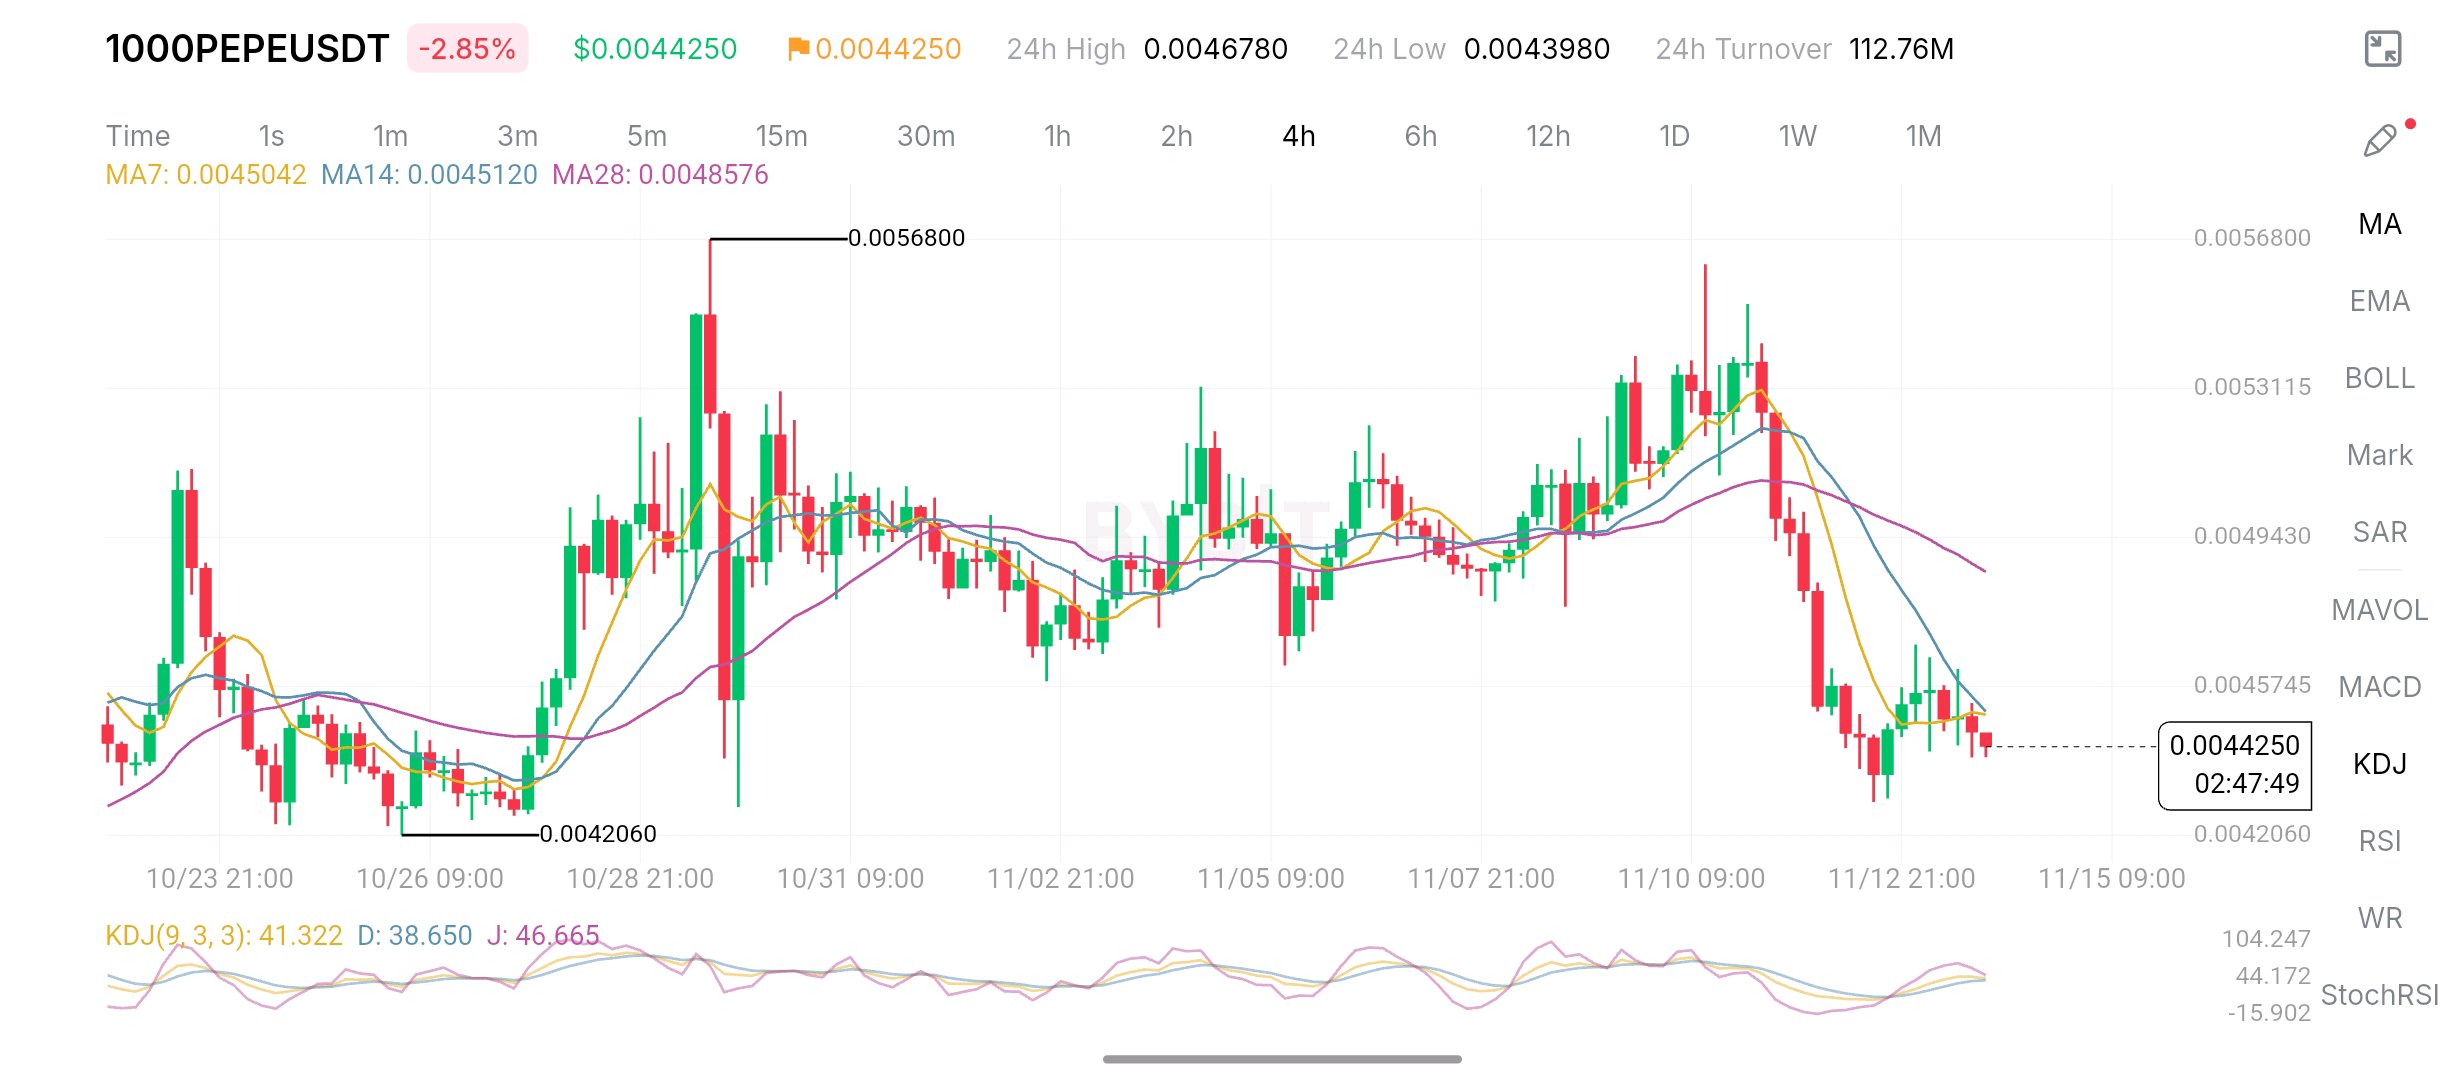
$PEPEUSDT : Los compradores están tratando de mantener el terreno, pero los osos siguen llevando la batuta. Mirando la gráfica de 4H, PEPE ha pasado de un movimiento lateral a una clara tendencia bajista. Tras no lograr mantener su empuje hacia los máximos anteriores, los vendedores entraron agresivamente y empujaron el precio hacia abajo. Lo interesante ahora es que el precio está intentando estabilizarse alrededor de $0.00442, pero la recuperación sigue siendo débil. Las medias móviles están por encima del precio actual, lo que sugiere que la presión vendedora no ha desaparecido por completo. Mi punto de vista como trader: Me mantengo cauteloso y ligeramente bajista respecto a PEPE en este momento. No veo suficiente confirmación para llamar a esto un suelo. Esto es lo que estoy observando: - Soporte: La zona de $0.00420 es un nivel importante a vigilar a la baja. - Resistencia: Una recuperación hacia $0.00455–$0.00465 podría enfrentar presión de venta. - Confirmación alcista: PEPE necesita una recuperación fuerte en 4H, con un aumento en el volumen de compra y recuperar las medias móviles. - Continuación bajista: Perder los mínimos recientes podría abrir la puerta a otro movimiento a la baja. Personalmente, quiero ver a los compradores defender esta zona antes de considerar una configuración alcista. Atrapar precios que caen sin confirmación no es una estrategia. ¿Cuál es tu opinión sobre PEPE? ¿Es solo un retroceso temporal antes de otro rally, o nos estamos preparando para otra caída? #PEPE #1000PEPE #AnalisisCrypto #AnalisisTecnico #Bybit#ByXIMPACT
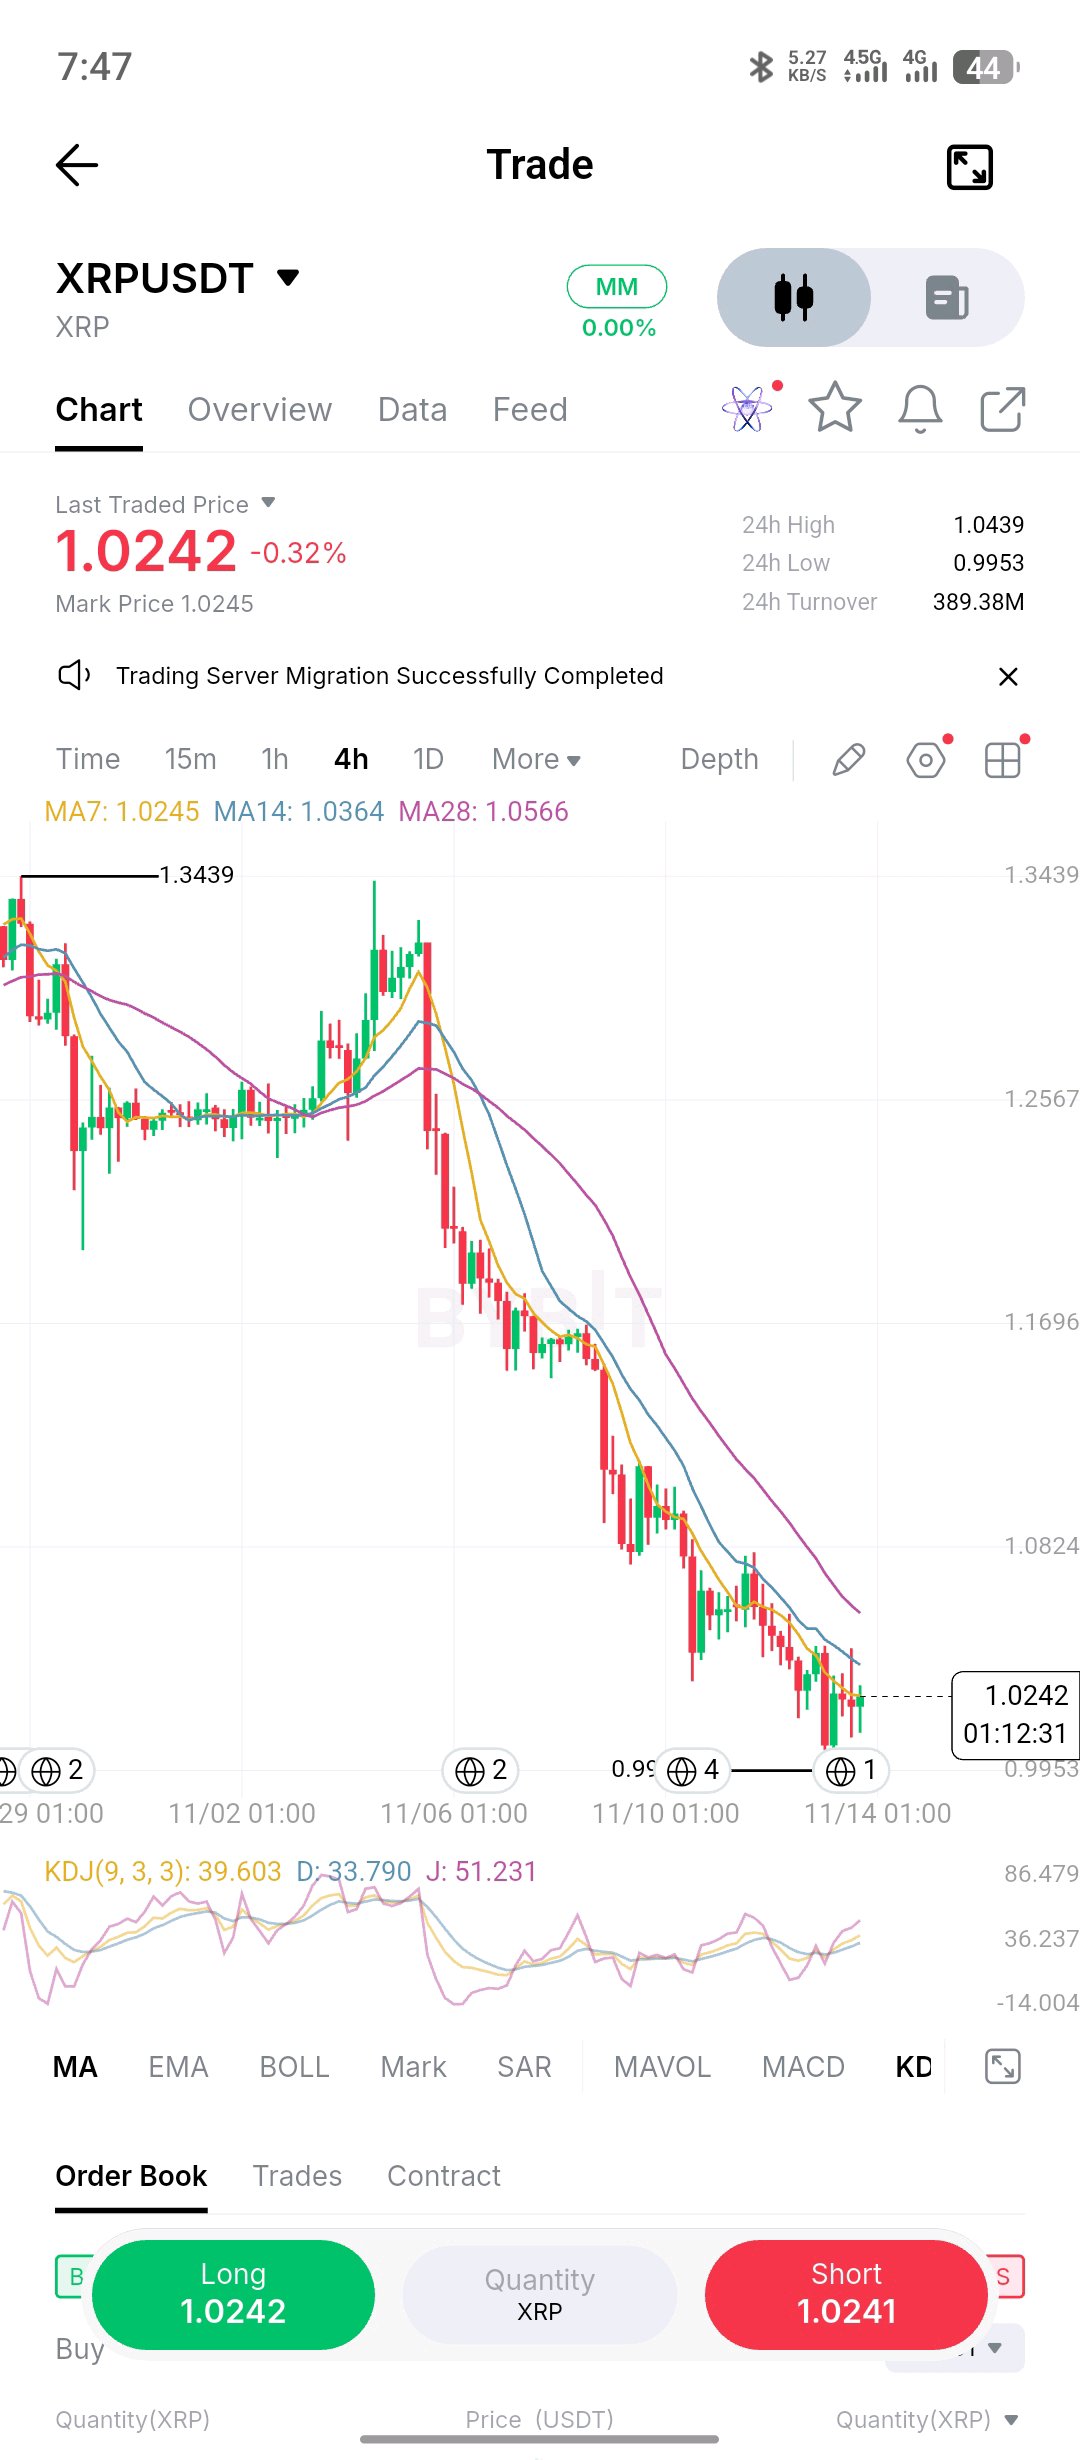
$XRPUSDT is still struggling to find its footing, and honestly, the chart doesn't give me a strong reason to turn bullish just yet. Look at the structure: XRP has been making lower highs and lower lows after that sharp breakdown. Every recovery attempt has been met with selling pressure, and price is still trading below the major moving averages. My trader's viewpoint: I'm leaning bearish until XRP proves otherwise. The current movement looks more like a weak consolidation after a heavy sell-off than a confirmed reversal. Here's what would change my mind: - A strong break above the descending moving averages. - A higher high followed by a higher low. - Increasing buying volume to support the recovery. Until those conditions appear, I wouldn't chase a long position. The key question is: Are we watching XRP prepare for another leg down, or is this the quiet accumulation before a recovery? What's your take? #XRP #XRPUSDT #CryptoTrading #TechnicalAnalysis #Bybit #WSOT2026 #ByXIMPACT
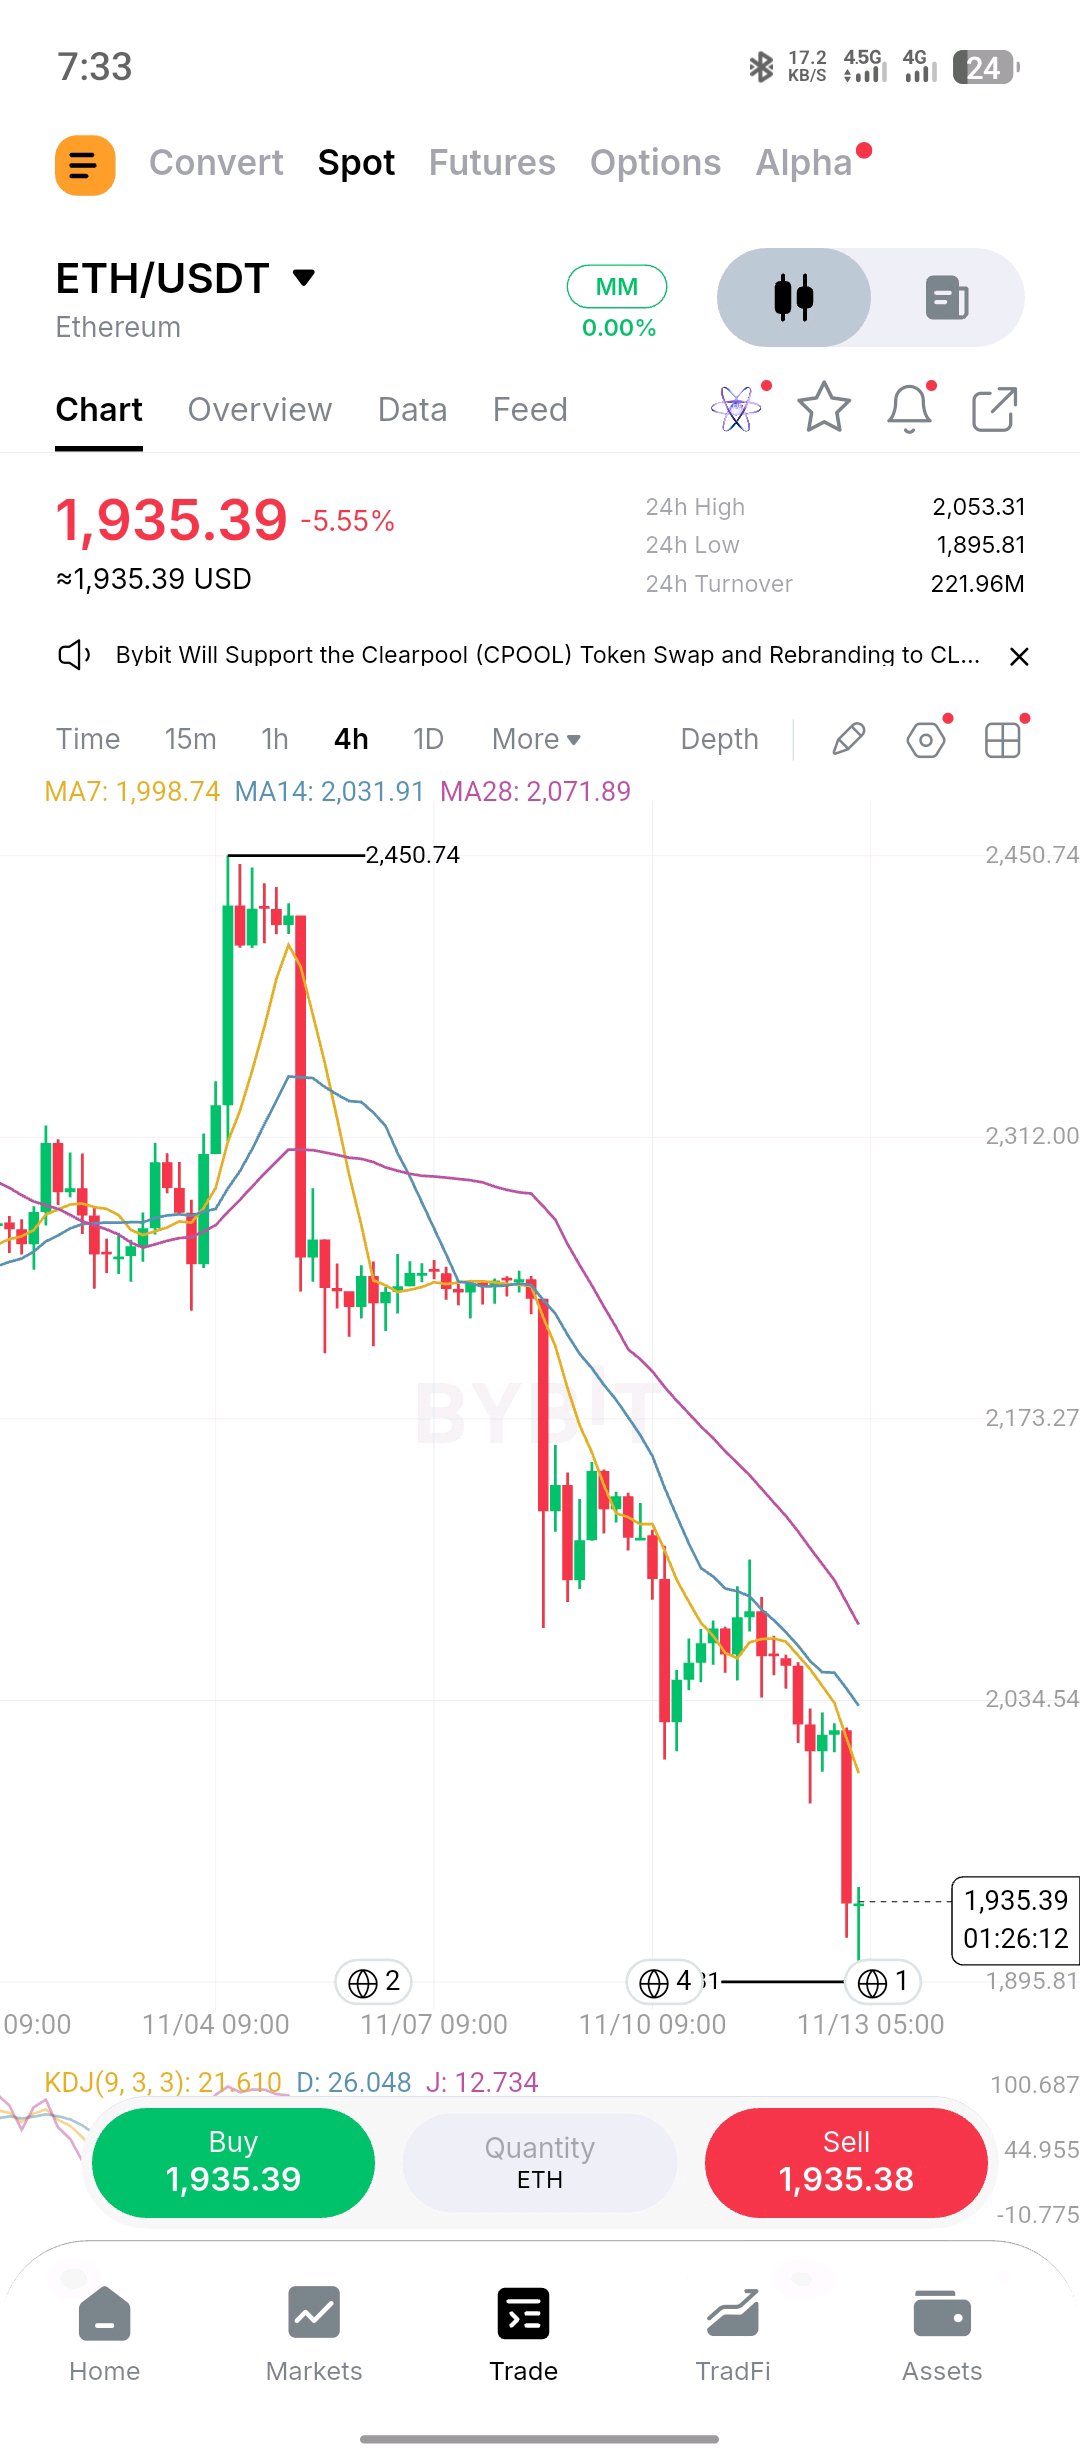
$ETHUSDT | BEARS MAINTAIN MARKET CONTROL Ethereum continues to experience significant selling pressure, with ETH/USDT trading around $1,935.39. Looking at the 4H chart, the overall market structure remains bearish. Price action is consistently printing lower highs and lower lows, indicating that sellers currently have the upper hand. MARKET STRUCTURE & PRICE ACTION The recent bearish impulse has pushed ETH below the psychological $2,000 level, suggesting that buyers are struggling to maintain upward momentum. Price is also trading below the major moving averages, reinforcing the current bearish market structure. The latest downward movement suggests that sellers remain aggressive, although a short-term relief bounce cannot be ruled out. KEY TECHNICAL LEVELS Resistance zones: • $2,000 – Immediate psychological resistance. • $2,035 – Potential supply zone. • $2,060–$2,075 – Major resistance area. Support zones: • $1,900 – Immediate support. • $1,870 – Secondary support. • $1,850 – Potential downside target. BEARISH SCENARIO If ETH fails to reclaim the $2,000 resistance and selling pressure continues, a confirmed breakdown below $1,900 could expose the $1,870–$1,850 support region. BULLISH SCENARIO For buyers to regain control, ETH needs to reclaim $2,000 and establish acceptance above $2,035. A sustained move above $2,075 would provide stronger evidence of a potential market structure shift. MY MARKET PERSPECTIVE My current bias remains bearish until price demonstrates a convincing reversal. However, I am not interested in chasing the downside after an extended selling move. I would rather wait for a retracement, observe the reaction around resistance, and look for confirmation before considering a position. The next move will depend on how ETH reacts around $1,900 and whether buyers can reclaim $2,000. Patience and confirmation remain more important than prediction. What is your perspective? Is ETH preparing for another bearish continuation, or could buyers defend the $1,900 region? #ETH #Ethereum #TechnicalAnalysis #CryptoMarket #TradingStrategy #ByXIMPACT
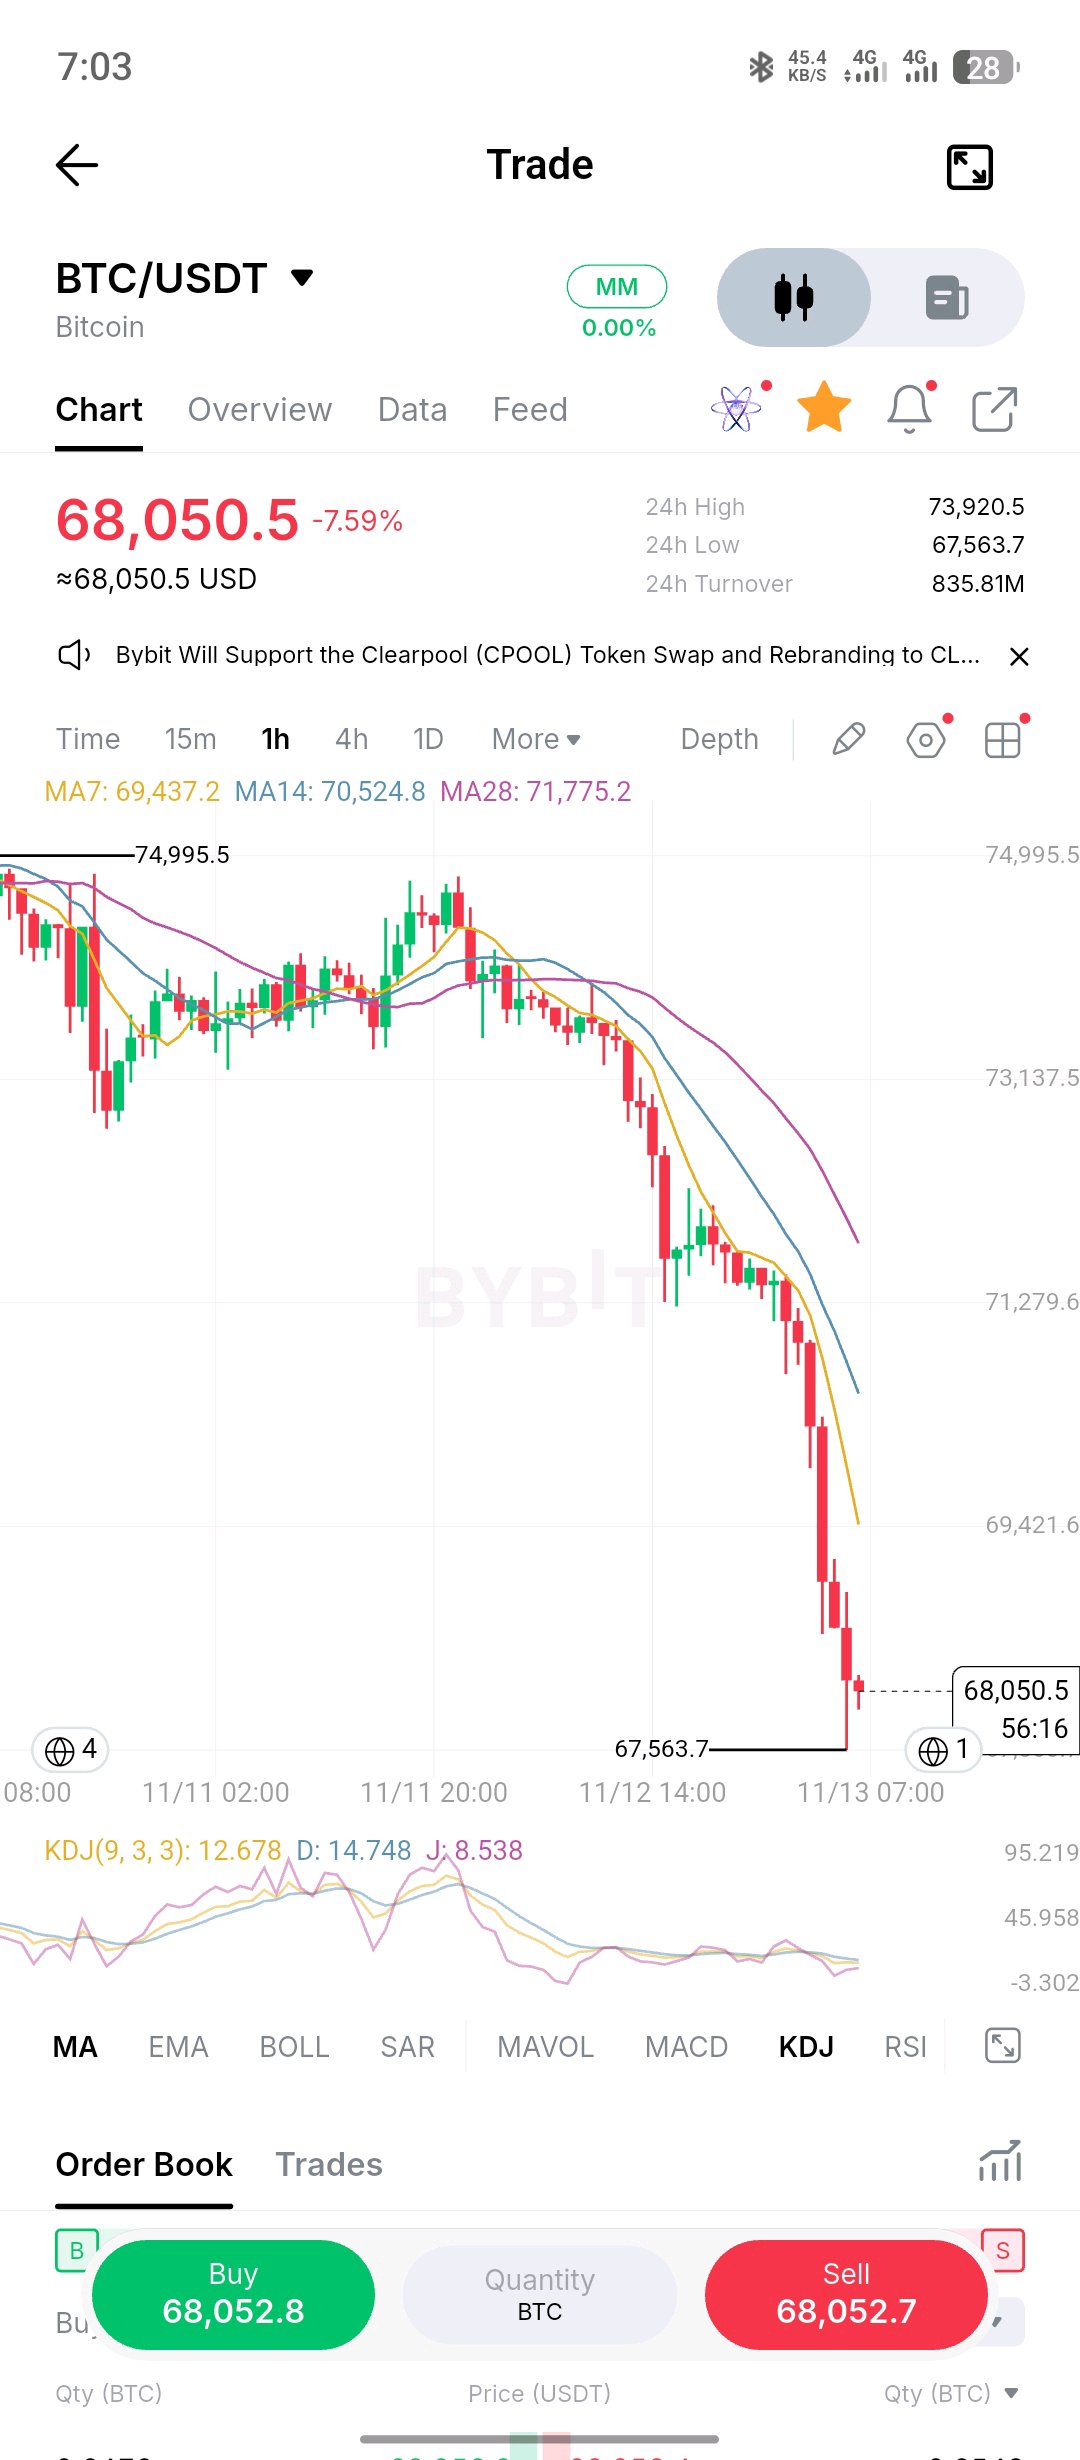
$BTCUSDT The sell-off is accelerating. Who is willing to buy this dip? Bitcoin is trading around $68,050 after a sharp breakdown that has pushed price significantly lower. What stands out on this chart isn't just the red candles. It's the lack of meaningful recovery between selling waves. The structure is heavily bearish: Sellers are dictating the direction. Price continues to print lower highs and lower lows, while the moving averages remain sharply tilted downward. Buyers haven't demonstrated enough strength to challenge that structure. But here's where things get interesting. After such an aggressive decline, chasing shorts becomes increasingly risky. Late sellers could find themselves entering just as the market begins looking for liquidity to fuel a temporary rebound. Three things I'm watching: 1. Whether BTC can establish a base around the current lows. 2. Whether a relief rally gets rejected at the broken structure. 3. Whether buyers can reclaim resistance and produce an actual change in market structure. My trading perspective: I'm respecting the bearish momentum, but I'm not blindly selling into an extended move. A weak recovery followed by rejection could offer a more structured short opportunity. A strong reclaim, on the other hand, would force me to reconsider the bearish thesis. The important distinction is that a bounce doesn't automatically mean a reversal. Question for the community: At these levels, are you waiting for a relief rally to sell, or do you think Bitcoin is approaching an area where buyers could finally step in? Let's discuss the price action, not just the direction. #BTC #Bitcoin #CryptoTrading#ByXIMPACT
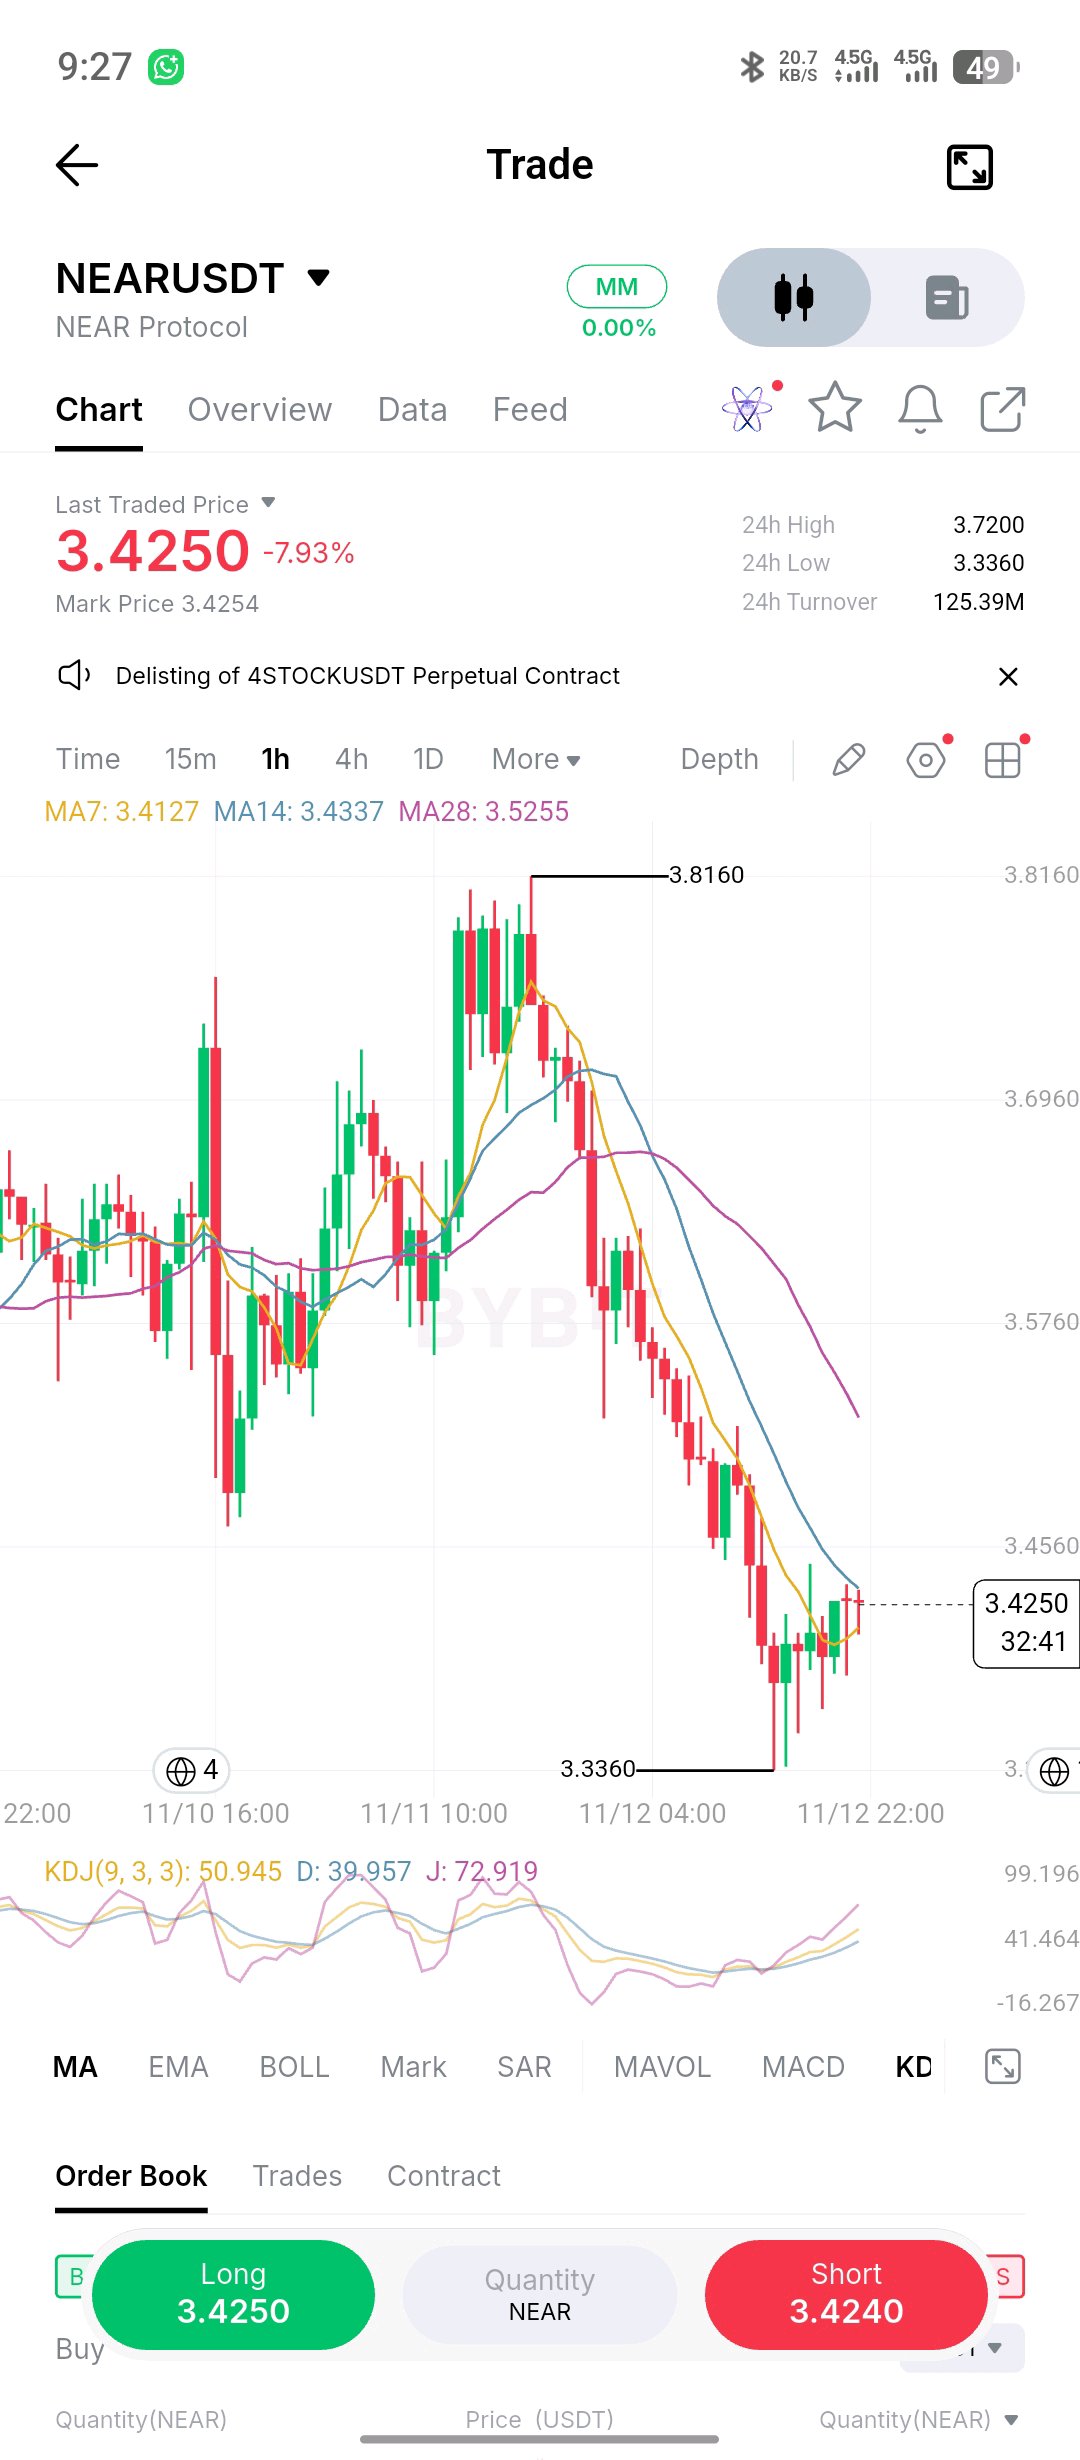
$NEARUSDT | La recuperación se enfrenta a su primera prueba real. NEAR se está cotizando alrededor de $3.425 tras una venta sostenida en el gráfico de 15 minutos. Lo que vale la pena observar aquí es el comportamiento de los compradores después de esa caída agresiva. El precio está intentando estabilizarse, pero la estructura más amplia aún no ha cambiado. Los promedios móviles siguen inclinados hacia abajo, lo que sugiere que los vendedores aún tienen el control de la tendencia a corto plazo. Este es el nivel que estoy vigilando: $3.45–$3.47: La primera zona de resistencia importante. Si los compradores no logran recuperar esta área, la recuperación actual podría convertirse simplemente en otro máximo más bajo antes de que los vendedores intenten empujar el precio hacia abajo de nuevo. Sin embargo, hay otra posibilidad. Una ruptura convincente por encima de los $3.47, seguida de una nueva prueba exitosa, sugeriría que los compradores finalmente están ganando algo de control. Mi enfoque: No me interesa perseguir ninguna dirección. Quiero ver cómo reacciona el precio en la resistencia antes de comprometerme con una posición. Una cosa que los traders deben recordar: después de una fuerte venta masiva, no toda vela verde señala una reversión. Pregunta para los traders de NEAR: ¿Estamos viendo el comienzo de una recuperación genuina, o es solo un rebote de alivio antes de otro tramo hacia abajo? #NEAR #CryptoTrading#ByXIMPACT
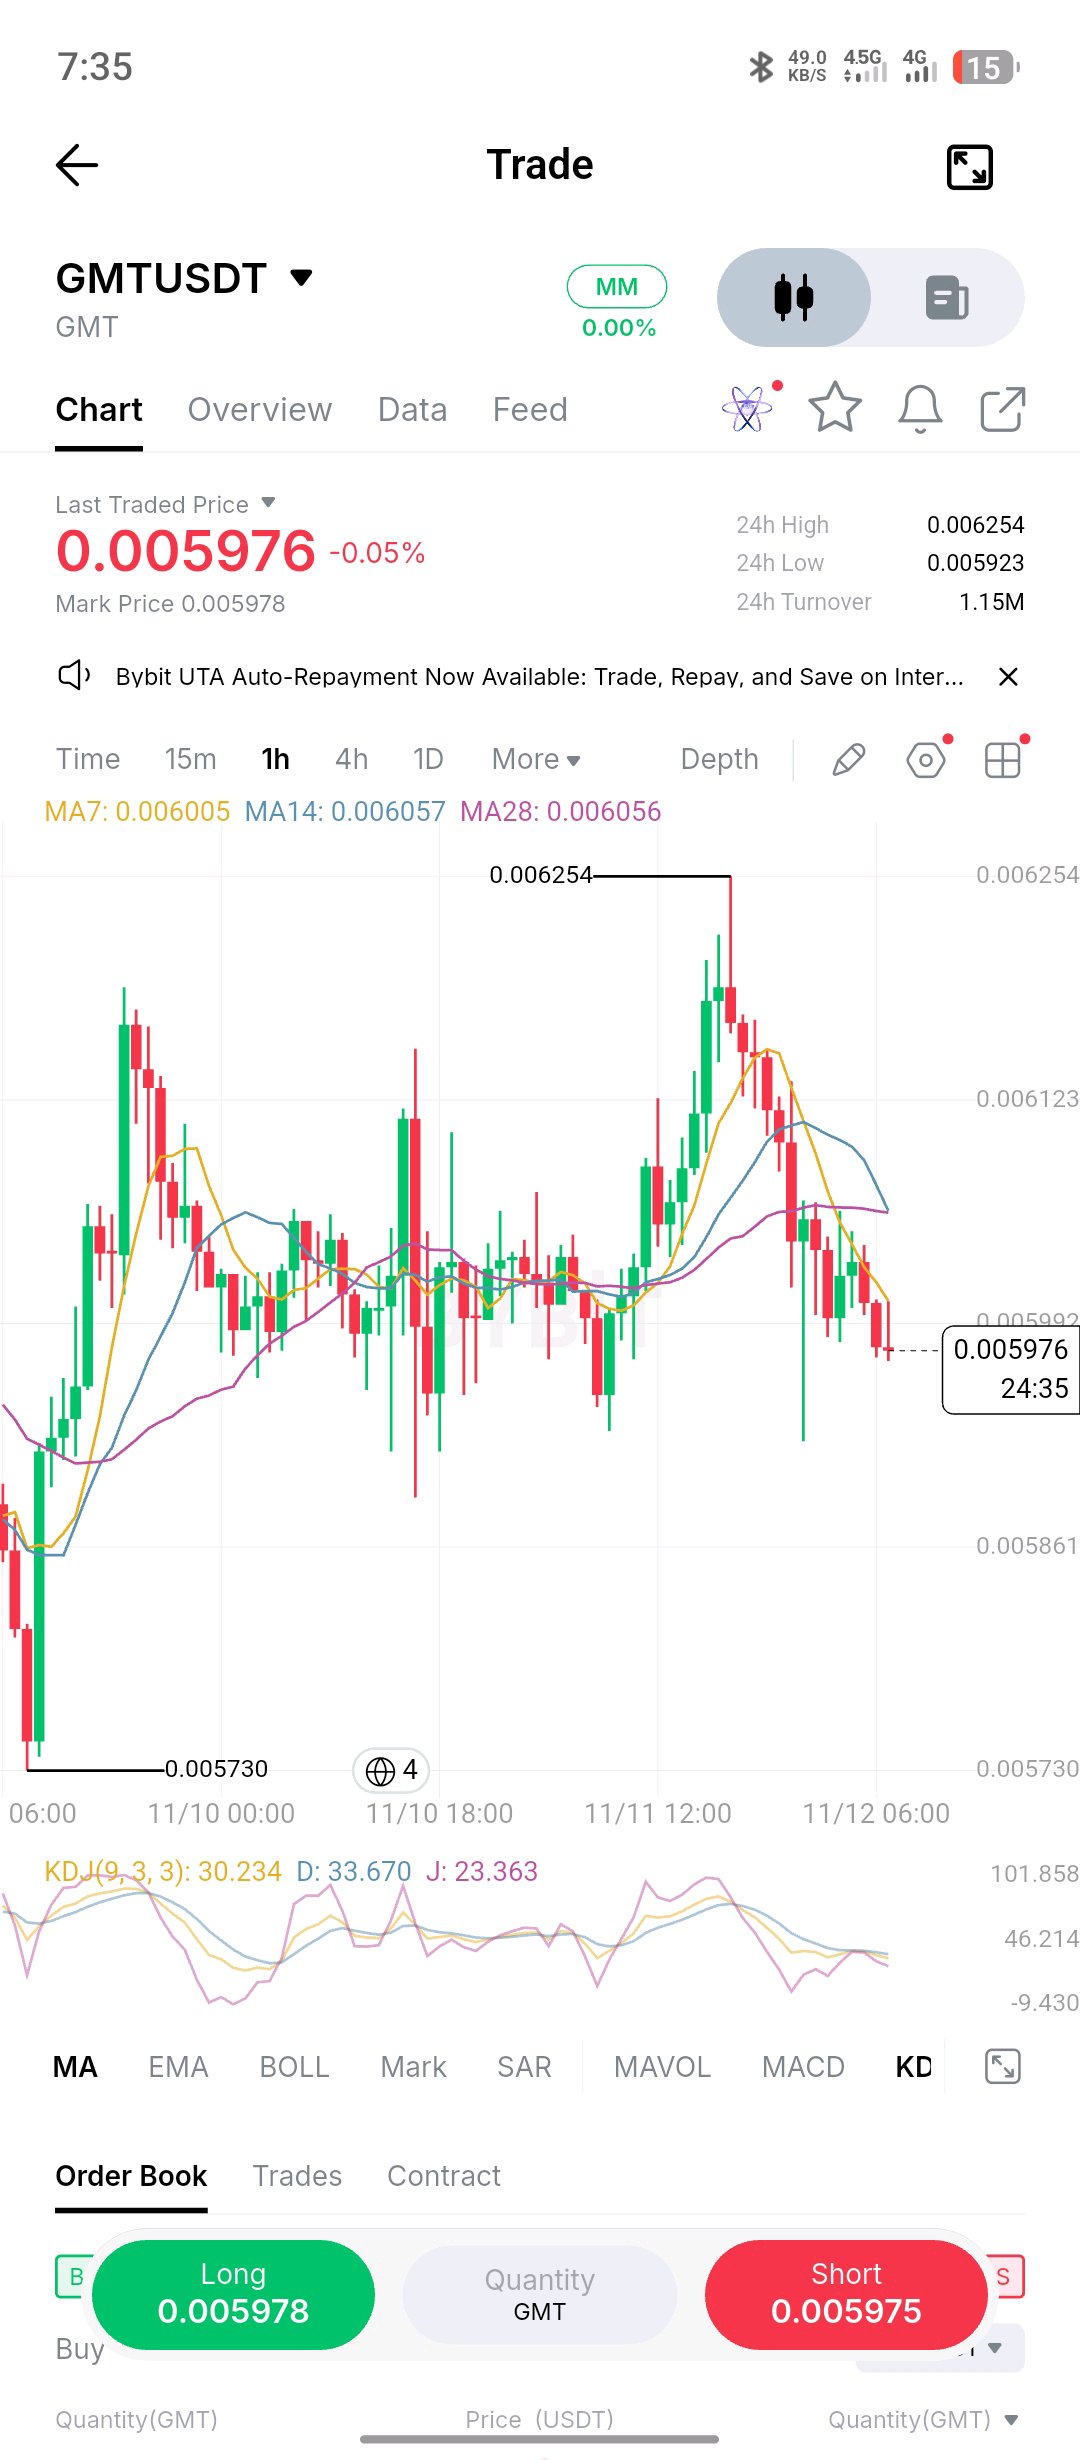
$GMTUSDT HAD A STRONG MOVE UP, BUT SELLERS ARE STARTING TO TAKE BACK CONTROL. GMT is trading around $0.005976, and the latest price action is worth watching. We had a decent push toward the recent high, but buyers couldn't sustain the momentum. Since that rejection, price has been moving lower, with sellers repeatedly stepping in during recovery attempts. What's concerning is that GMT has slipped below its moving averages. The short-term momentum has weakened, and buyers haven't shown enough strength to reverse the current direction. My bias is bearish for now. I'm more interested in seeing how sellers react if GMT attempts another bounce. If price continues getting rejected below the moving averages, I expect further downside pressure. For bulls to change my mind, I want to see a strong reclaim of the moving averages, followed by a higher high and convincing buying volume. I'm not buying simply because GMT has already dropped. I'd rather follow the market's direction than fight it. GMT traders, are you seeing an opportunity to buy this dip, or is the recent rally already losing its strength? #ByXIMPACT
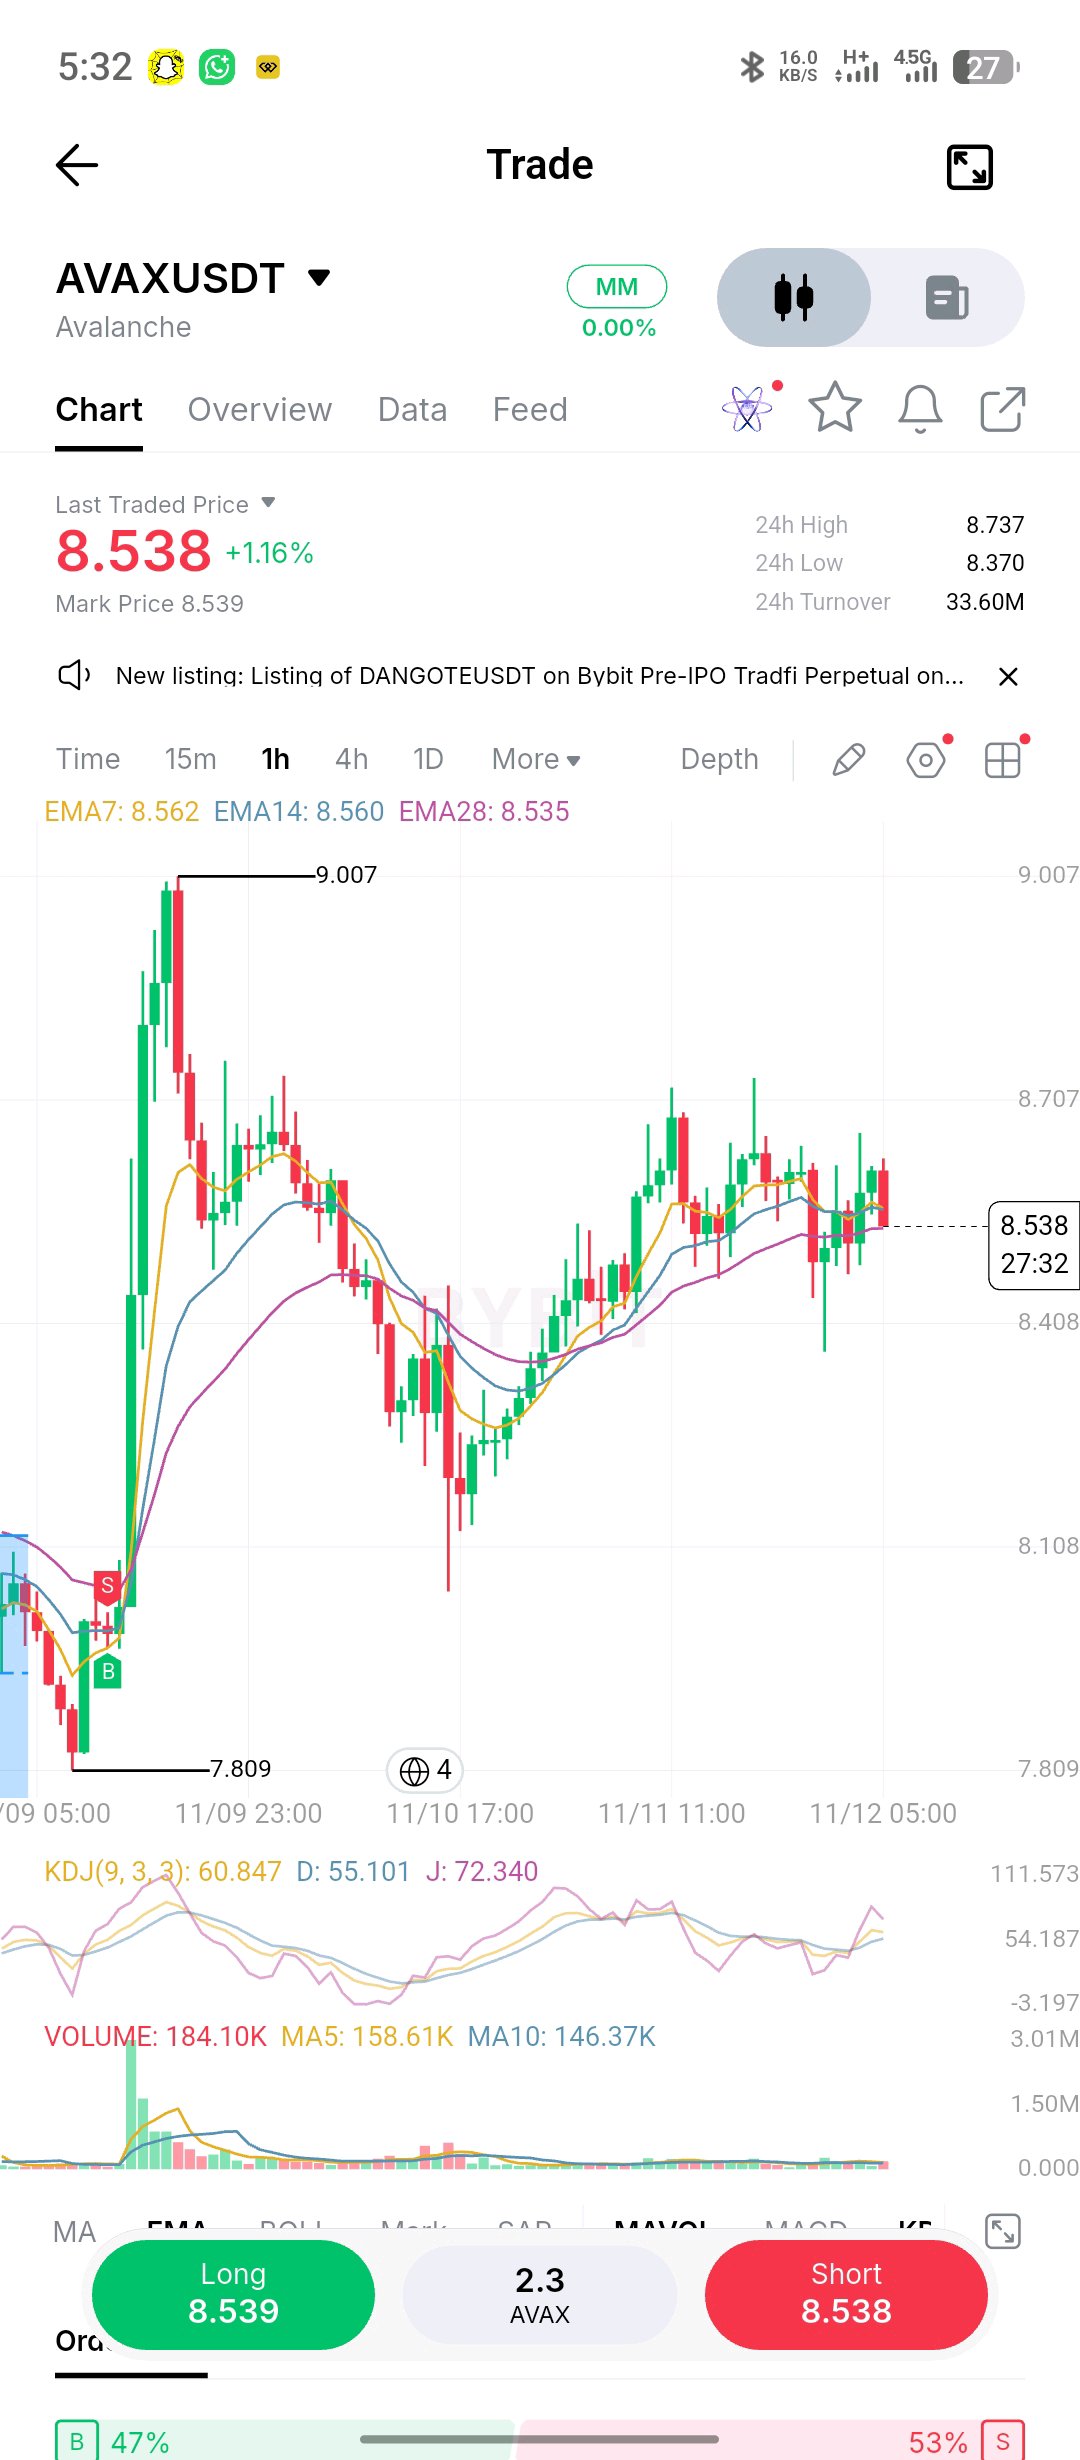
$AVAXUSDT Is No Longer in Expansion Mode. The Market Is Negotiating Its Next Direction. One thing I find interesting about AVAX right now is the transition from aggressive price expansion into a much tighter trading environment. After reaching $9.007, buyers couldn't maintain control. The subsequent correction brought price back toward the $8.10 region, where demand eventually emerged. But the recovery hasn't produced another convincing breakout. Instead, AVAX is building a battleground around $8.50. Here's where the next important decisions could happen: The $8.70–$8.74 region represents the immediate upside obstacle. If buyers can absorb the available supply and establish acceptance above this zone, the market could begin challenging $8.85 and $9.00 again. On the other hand, repeated rejection combined with a loss of $8.37 would suggest that the recovery is becoming vulnerable. Something else deserves attention: the short-term moving averages are converging, indicating that directional momentum has compressed. I'm not treating this compression as an automatic breakout signal. My approach is simple: Let price reveal where genuine demand or supply is strongest. A confirmed move outside the current range offers a more interesting opportunity than trading every fluctuation inside it. Sometimes the best trade is the one you wait for. #ByXIMPACT
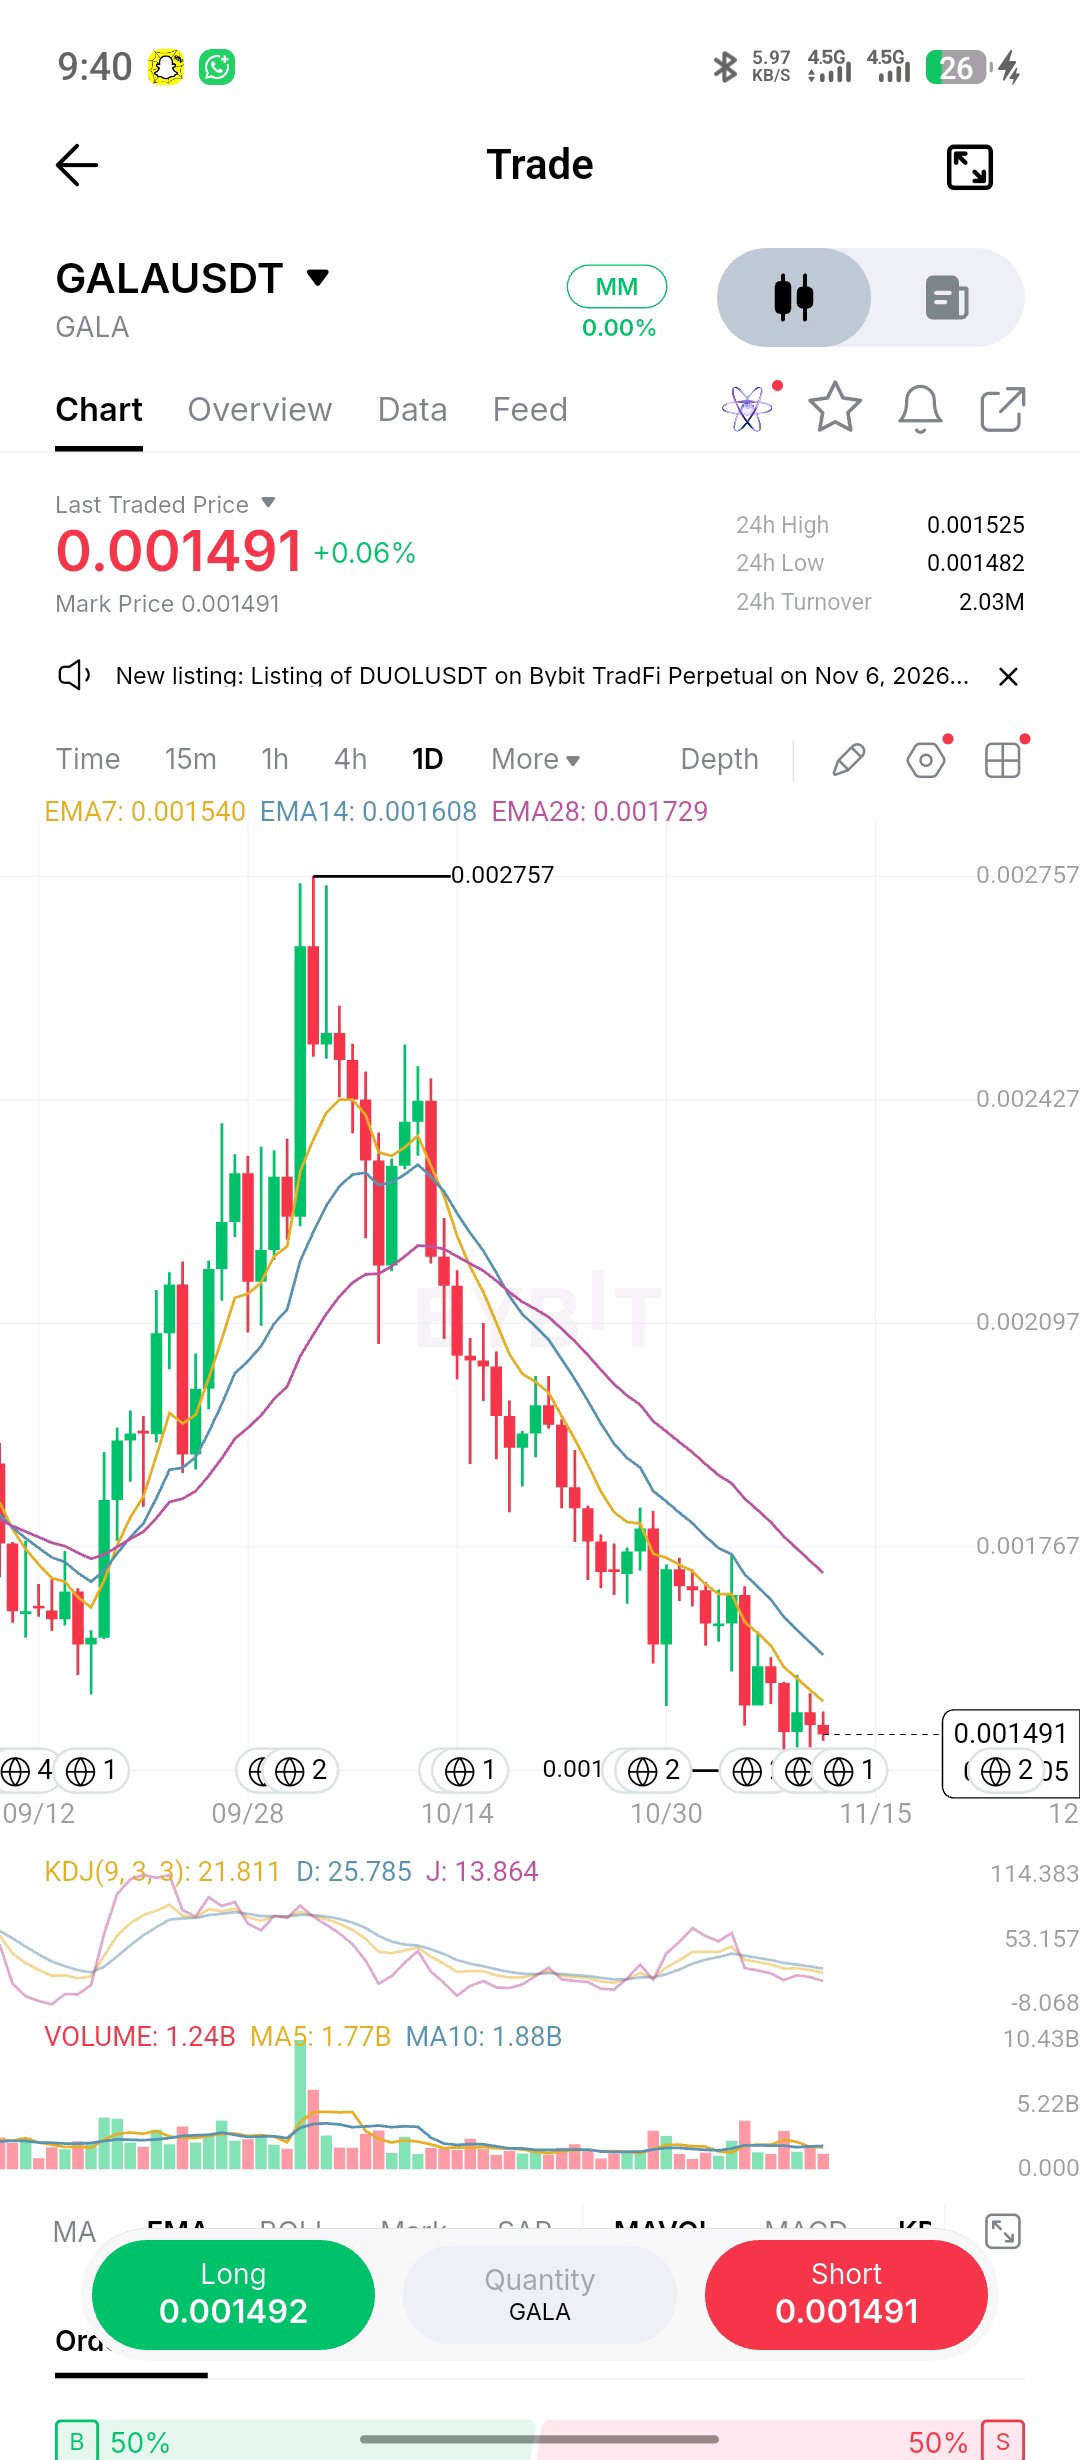
$GALAUSDT is entering a very critical zone on the daily timeframe. After topping out at 0.002757, price has experienced a sustained corrective phase, currently trading near $0.001491. The daily chart shows a clear macro downtrend where price remains pressed well below the moving average resistance stack—specifically EMA7 (0.001540), EMA14 (0.001608), and EMA28 (0.001729). What stands out technically is the compression near the lows. The KDJ indicator shows the J-line down at 13.8, deeply oversold and hovering near historical exhaustion levels. However, oversold conditions alone do not equal a reversal; they simply indicate that selling momentum has been heavy and prolonged. The level I'm watching is the local support floor around the current price area. For any meaningful bullish thesis to form, we need to see stabilization, a decrease in selling volume, and a reclamation of the EMA7 and EMA14 cluster. My take: I am staying patient and neutral on for now. Catching a falling knife in a macro downtrend without structural confirmation is a high-risk trap. I want to see a confirmed higher low and a strong volume breakout above the 0.001600 zone before considering any long exposure. If the current support fails to hold, the path of least resistance remains lower. community, are you seeing signs of accumulation down here, or are you waiting for a definitive trend reversal before stepping in? #GALA #GALAUSDT #CryptoTrading #TechnicalAnalysis #RiskManagement #ByXIMPACT
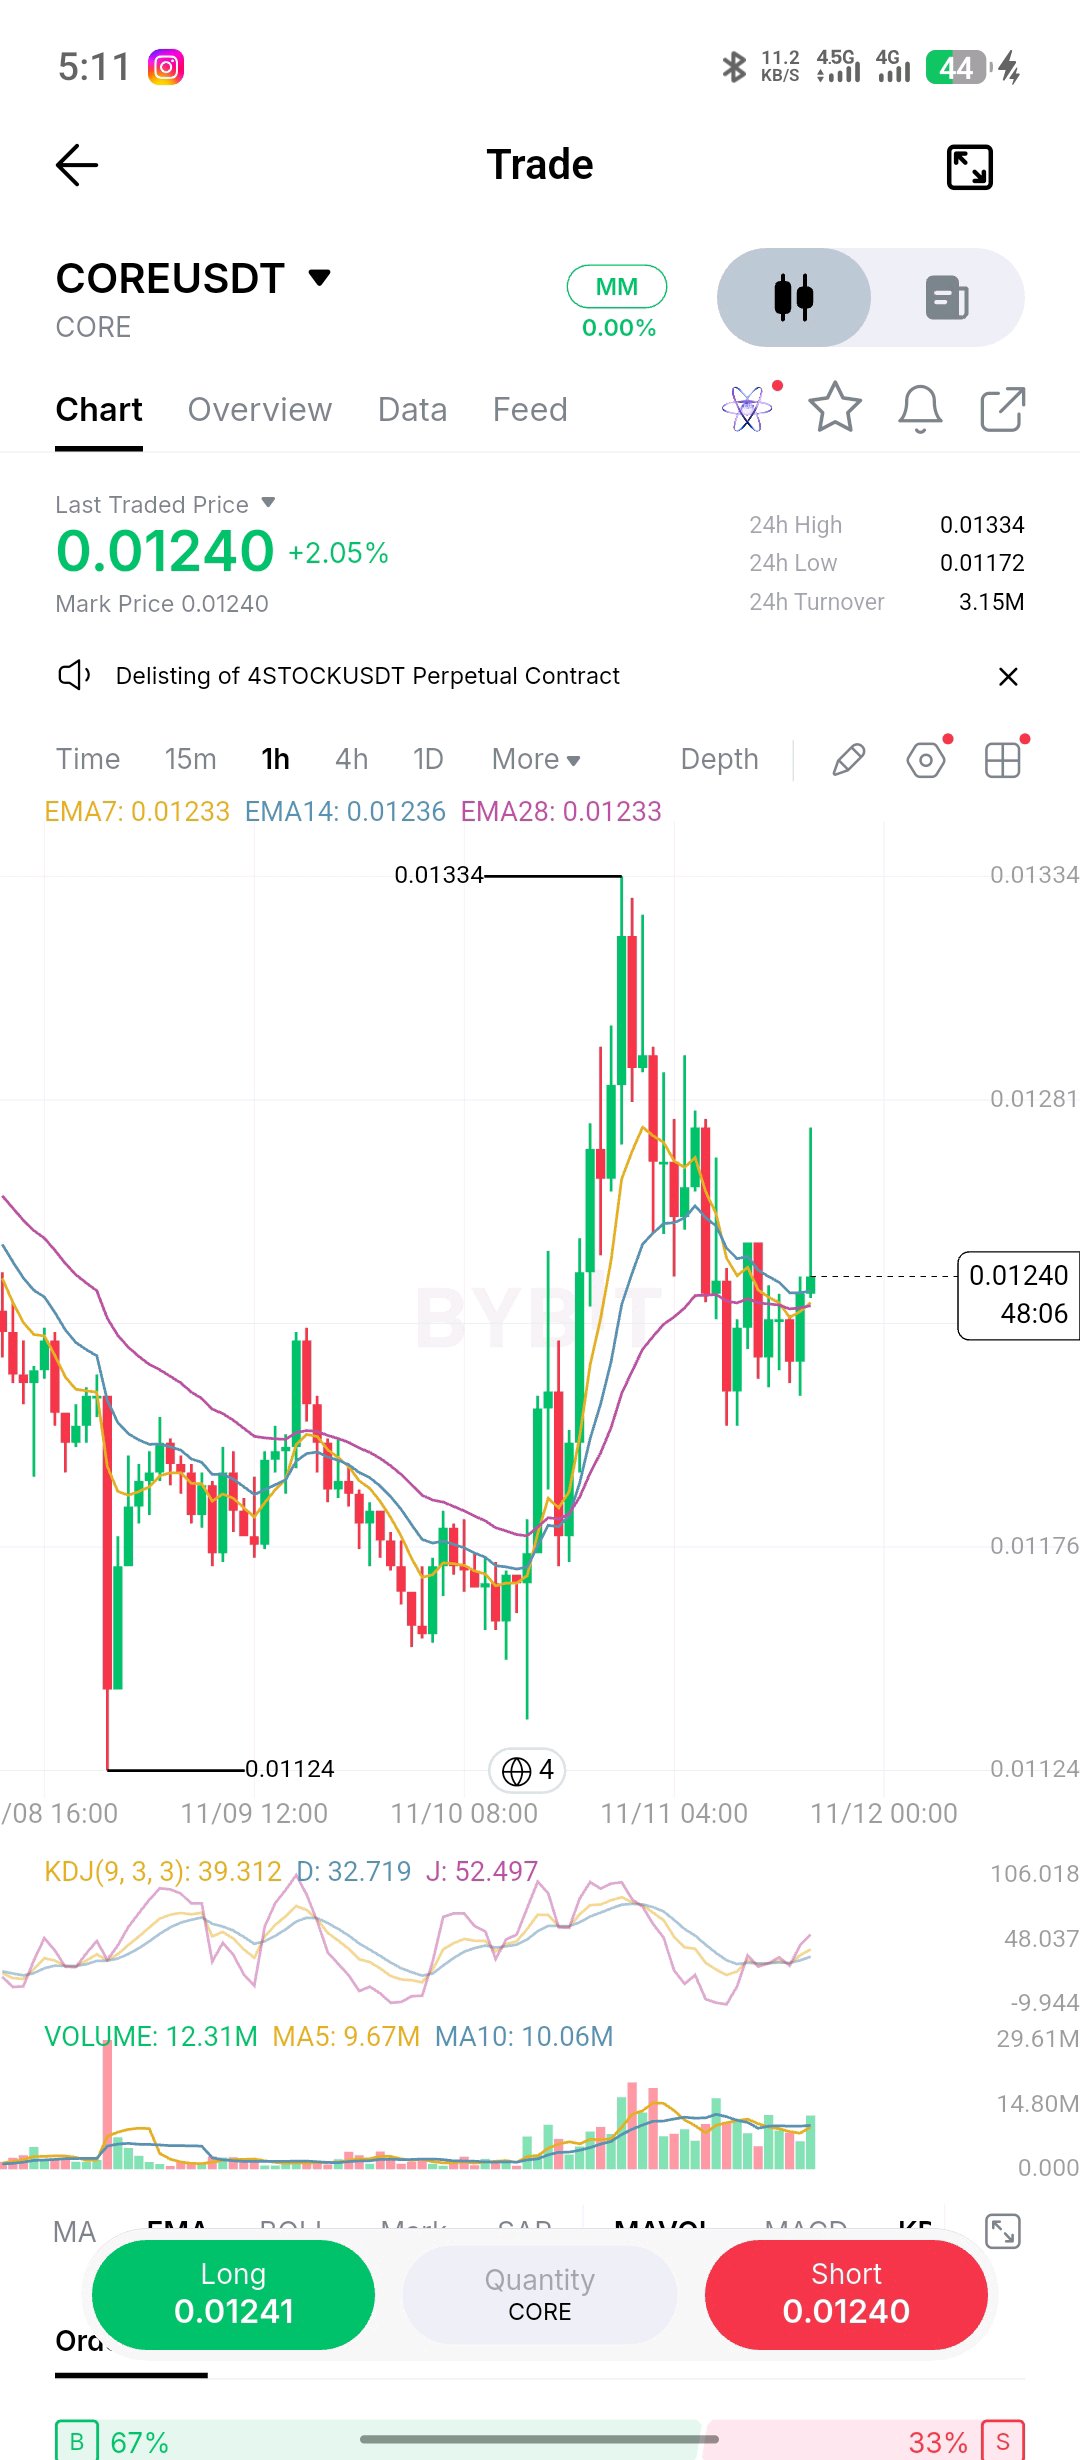
$COREUSDT is starting to look interesting again. After that strong upward move, price pulled back quite sharply, but buyers haven't completely disappeared. We're now seeing some consolidation around $0.01240 as the market tries to find its next direction. What caught my attention is that price hasn't completely given back the gains from the initial rally. Buyers are still trying to defend the recent consolidation area, which gives the bullish side something to work with. The previous high around $0.0133 is the level I'm watching. A clean break above it, preferably supported by stronger buying volume, would be a much better indication that bulls are regaining control. My take: I'm leaning bullish, but I still want confirmation before getting too confident. For me, that means CORE holding its recent support, forming a higher low and eventually breaking above $0.0133 with convincing volume. That would strengthen my bullish outlook. If price loses its current base instead, I'll have to reconsider that bias. I'm watching this one closely. The next move could be interesting. CORE holders, do you think buyers have enough strength to push through the previous high, or will sellers step in again? #ByXIMPACT
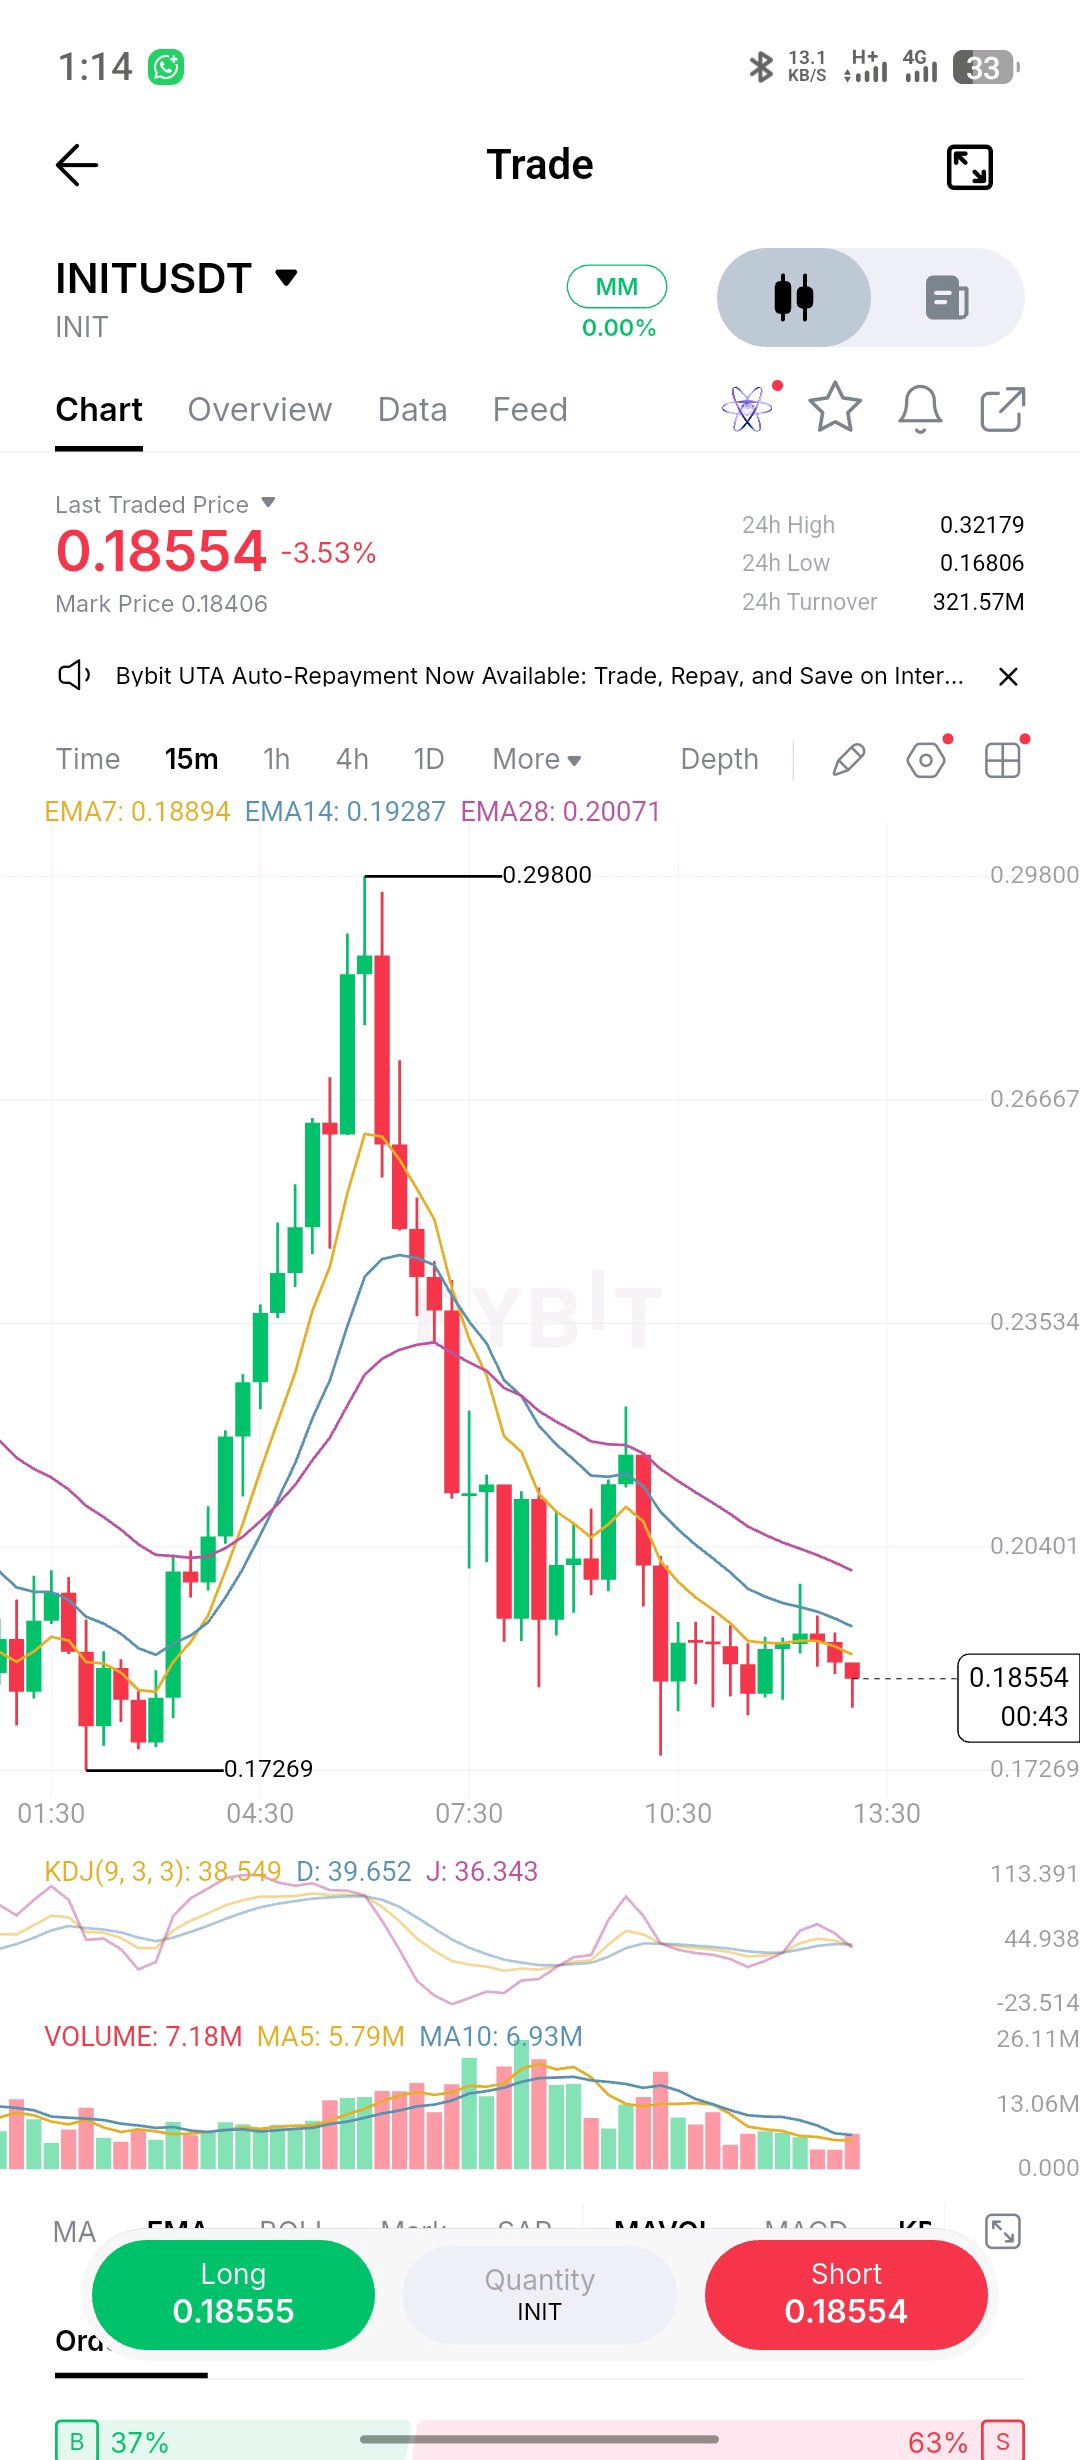
$INITUSDT had an impressive run, but the momentum has clearly cooled off. After pushing up toward $0.235, price faced heavy selling and gave back a large part of that move. It's now hovering around $0.185, and buyers haven't really convinced me that they're ready to take control again. One thing I noticed is that the recent attempts to bounce have been pretty weak. Price is still trading below the moving averages, which tells me sellers haven't completely stepped aside. For now, I'm watching how INJ behaves around $0.18. If buyers manage to defend this area and build some momentum, we could see another recovery attempt. But if that support gives way, things could get uncomfortable for bulls. Personally, I wouldn't rush into anything here. Let the chart give a clearer signal first. What's your take on INJ? Is this just a cooldown after the pump, or are we about to see another leg down? #INJ #Injective #CryptoTrading#ByXIMPACT