JamilaKhatun
2164Me gusta0Compartir en el chat45Aficionados1Seguir
🌊You Only Charge Your self..✅
🌊You Only Charge Your self..✅
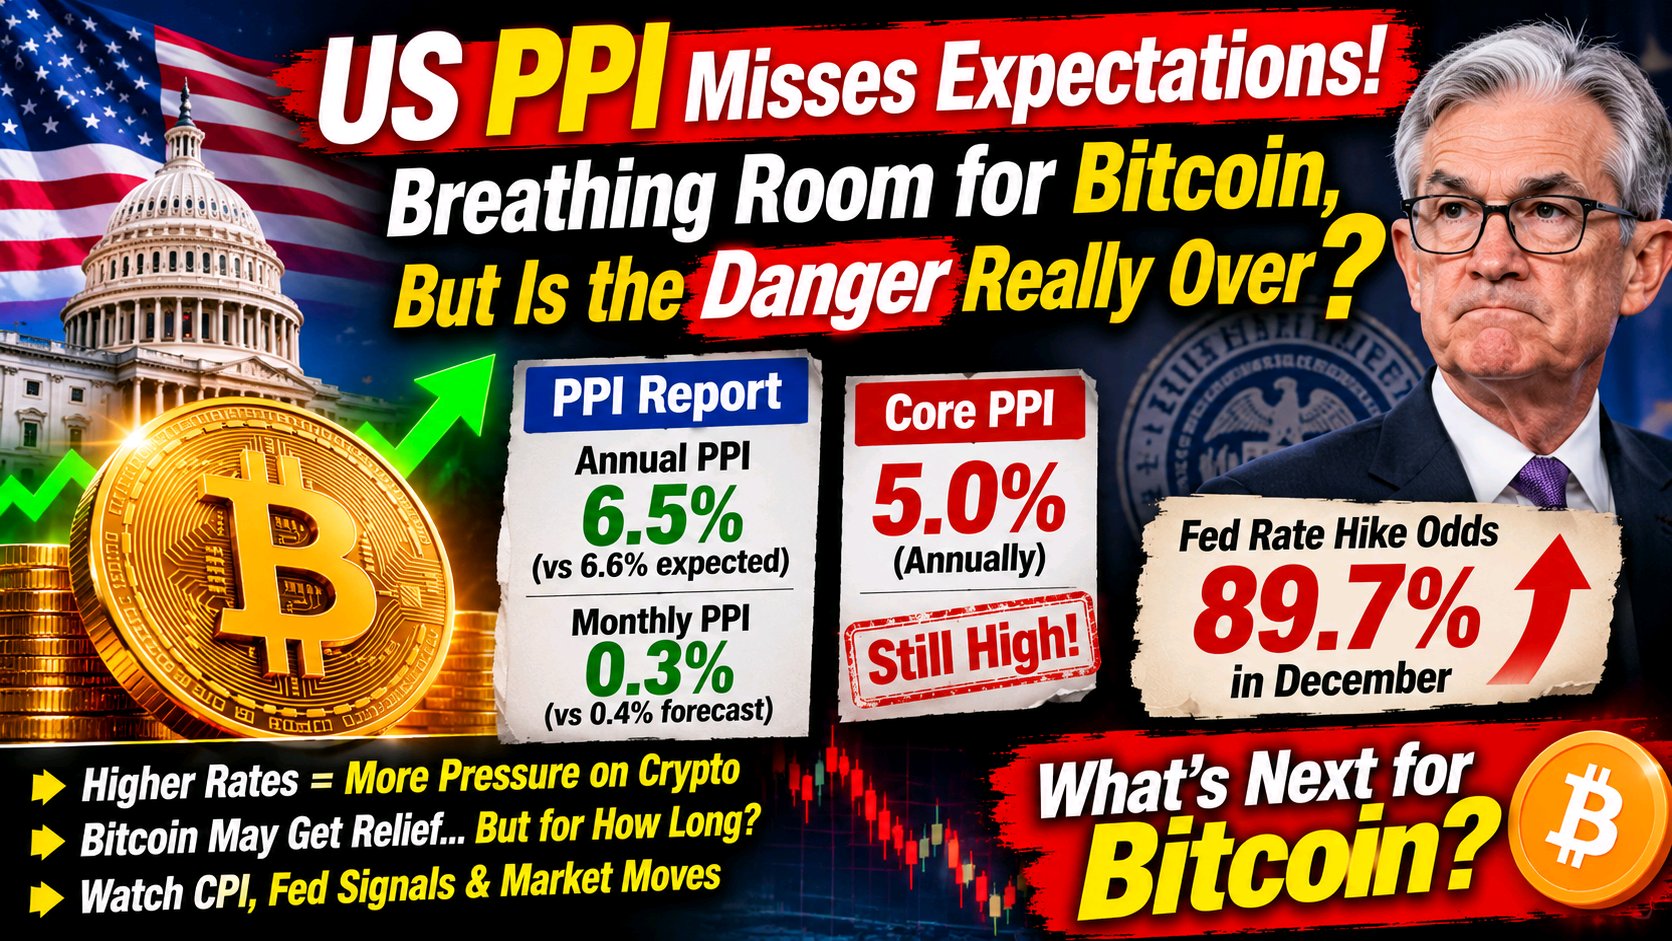
🚨 **US PPI Misses Expectations:
Breathing Room for Bitcoin, But Is the Danger Really Over?** 🚨 📊 The latest US Producer Price Index (PPI) report came in slightly below forecasts, bringing a little relief to the crypto market. For traders watching every macro data point, this was a small but welcome surprise for **Bitcoin**. 🔍 **The Numbers** - 📈 **Annual PPI:** 6.5%, against an expected 6.6% - 📅 **Monthly PPI:** up 0.3%, against a forecast of 0.4% The miss is small, but in a market this sensitive to inflation, even a 0.1% difference can change sentiment. Softer producer prices suggest that cost pressures at the wholesale level may be cooling slightly. ⚠️ **But There Is Still a Problem** **Core PPI**, which strips out food and energy, remains elevated at **5.0% annually**. This shows that underlying inflation pressure has not disappeared. It is the kind of stubborn data that can make the **Federal Reserve** think twice before easing its monetary policy. 🏦 **The Fed Is Still the Biggest Question** Markets are reportedly pricing in an **89.7% probability of a 0.25% rate hike in December**. This matters because: - 💵 Higher rates make borrowing more expensive - 📉 Risk assets like **Bitcoin** and **Ethereum** tend to struggle when liquidity tightens - 🏛️ Investors often shift toward safer yields when rates rise - 😟 Rate hike expectations can keep market sentiment cautious If this expectation holds, crypto could face more pressure despite the slightly softer PPI print. 🪙 **What Does This Mean for Crypto?** The PPI miss is a **short-term positive**, but it does not change the bigger picture. Bitcoin may get some relief and a chance to stabilize, but with a rate hike heavily priced in and core inflation still high, the macro backdrop remains challenging. Crypto continues to trade closely with US economic data and Fed expectations. 🛡️ **What Should Traders Keep in Mind?** 1. 👀 **Watch upcoming inflation data.** CPI and other reports will shape Fed expectations. 2. 🎤 **Follow Fed commentary.** Any shift in tone can move markets quickly. 3. 🧠 **Don't overreact to one data point.** One small miss does not make a trend. 4. 💼 **Manage risk carefully.** Use position sizing and stop-losses in volatile conditions. 5. 🔎 **Do your own research (DYOR).** Rely on verified data, not hype. 🔮 **What's Next?** The key question is whether further data will confirm that inflation is cooling, or whether sticky core pressure keeps the Fed on a tightening path. Until then, expect volatility around every major economic release. ⚠️ *This article is for informational purposes only and is not financial advice.* --- #Bitcoin #BTC #USPPI #CryptoNews #FedRateHike --- #DeutscheBankLaunchesDigitalAssetCustody #AITechSelloffErases2Point5TrillionFromNasdaq100 #BitcoinHitsTwoMonthLowAfterUSMidterms #AnthropicIPOTestsTheAIBoom #SanDiskAnnounces8For1StockSplit $BTCUSDT $ETHUSDT @jalekhakhatun
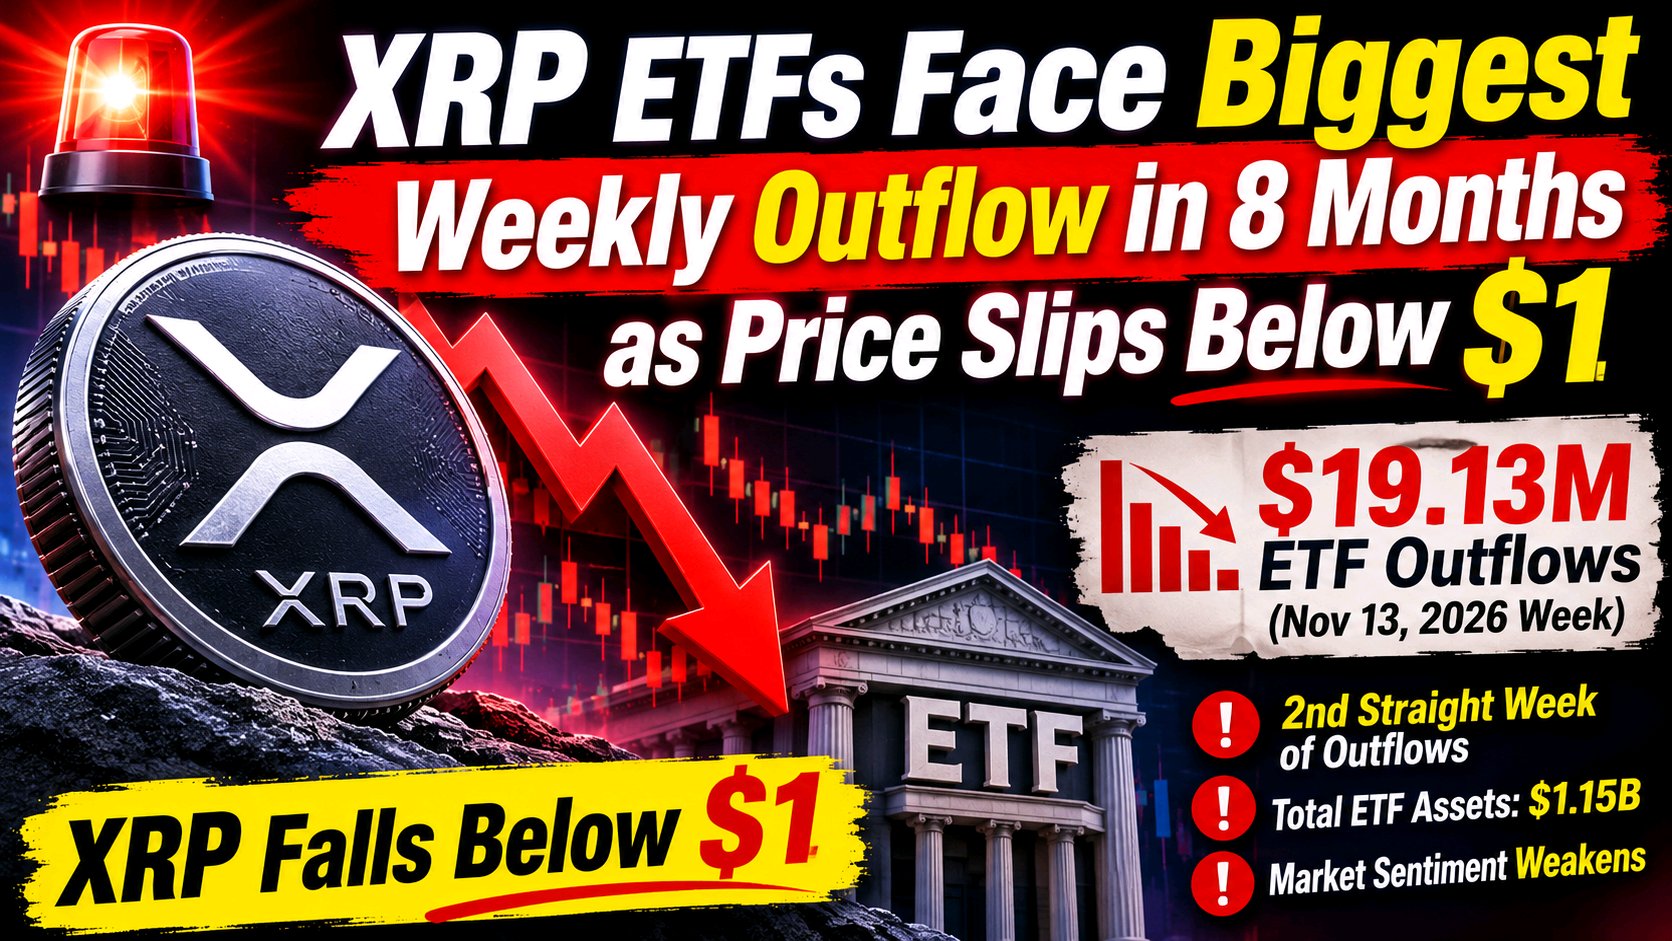
$1** 🚨
🚨 **XRP ETFs Face Biggest Weekly Outflow in 8 Months as Price Slips Below 📉 Institutional appetite for **XRP** is showing clear signs of cooling. U.S. spot XRP ETFs recorded roughly **$19.13 million in net outflows** during the week ending **November 13, 2026**, the largest weekly withdrawal in eight months. 🔍 **A Second Straight Week of Outflows** This was not a one-off. It was the **second consecutive week of net outflows**, which suggests the selling pressure is building rather than fading. When investors pull money out week after week, it often signals a shift in sentiment among larger, longer-term players. 🔥 **What's Driving the Concern?** A closer look at the daily data shows where the pressure came from: - 📅 **November 9:** $10.42 million in withdrawals - 📅 **November 10:** another $7.62 million in outflows - 💔 **XRP slipped below the psychological $1 level**, a threshold many traders watch closely - 🏦 **Total ETF net assets fell to about $1.15 billion** 💡 **Why the $1 Level Matters** Round-number price levels carry heavy psychological weight in crypto. Falling below **$1** can shake retail confidence, trigger stop-losses, and attract more selling. A drop below such a level, combined with ETF outflows, creates a double layer of pressure on the market. 📊 **Why ETF Flows Matter** ETF flows are one of the clearest indicators of **investor demand**, especially from institutions and traditional finance. Consistent inflows usually show growing confidence, while persistent withdrawals can: - 😟 Weaken overall market confidence - 📉 Add selling pressure to the price - 🏦 Reduce liquidity and momentum - 📰 Fuel negative headlines and fear 🌍 **A Challenging Market Environment** These outflows are happening in an already difficult market backdrop. With risk appetite low and uncertainty high, investors are becoming more cautious, and products like ETFs are often the first place where that caution shows up in the data. 🛡️ **What Should Traders Keep in Mind?** 1. 👀 **Watch the weekly ETF flows.** A return to inflows could signal recovering demand. 2. 📍 **Track key price levels.** Whether XRP can reclaim $1 will be important. 3. 🧠 **Avoid emotional decisions.** Fear can lead to panic selling at the worst moment. 4. 💼 **Manage risk carefully.** Use position sizing and stop-losses. 5. 🔎 **Do your own research (DYOR).** Rely on verified data, not rumors. 🔮 **What's Next?** The coming weeks will show whether this is a short-term pause or the start of a deeper trend. If outflows continue and XRP stays under $1, pressure could build further. A reversal in flows, on the other hand, could help restore confidence. ⚠️ *This article is for informational purposes only and is not financial advice.* --- #XRP #XRPETF #CryptoNews #ETFOutflows #CryptoMarket --- #JensenHuangExitTestsNvidiasAILeadership #WSOTShowYourAITradeToEarn10USDT #USPPITestsTheHigherForLongerTrade #USInflationRunsHotAndRateHikeBetsRise #SanDiskAnnounces8For1StockSplit $XRPUSDT @jalekhakhatun
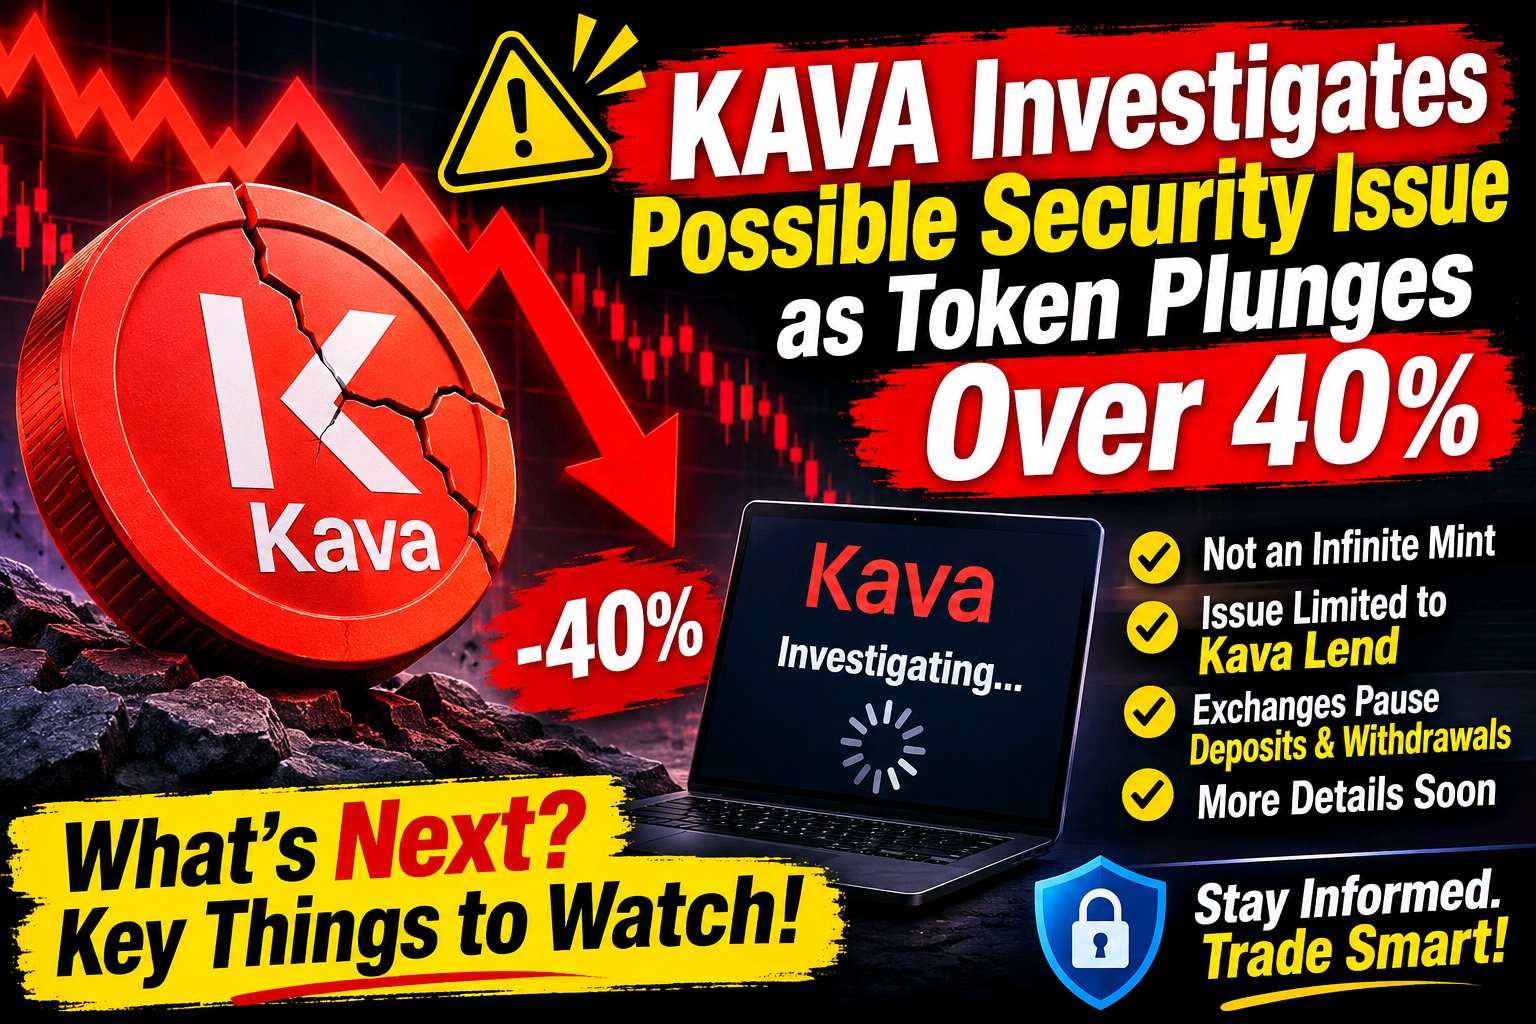
KAVA.....👇
🚨 **KAVA Investigates Possible Security Issue as Token Plunges Over 40%** 🚨 📉 The crypto market was shaken when **$KAVA** lost more than 40% of its value in a short window. The sell-off followed reports that a dApp in the Kava ecosystem had displayed unexpected behavior, raising immediate concerns about a possible security issue. 🔍 **What Happened?** The Kava team says it is investigating the incident. According to the update, the event is linked to activity involving **bridging and selling tokens on the BNB Smart Chain**. The unusual behavior was traced to one dApp rather than the entire network. ✅ **Not an Infinite Mint** The most important clarification is that this was **not an infinite mint**. An infinite mint, where an attacker creates unlimited tokens, is one of the most feared exploits in crypto because it can destroy a token's value and trust in the project. Kava says that is not what occurred here. 🏦 **Contained Within Kava Lend** The team states the abnormal activity was **isolated and limited to Kava Lend**, the lending platform in its ecosystem. In other words, the rest of the Kava chain was not reported to be affected. The community rallied around the hashtag **#KavaSaysAbnormalActivityLimitedToKavaLend**. ⏸️ **Exchanges Pause Deposits and Withdrawals** As a precaution, **partner exchanges paused deposits and withdrawals** related to the token. This is a standard response to potential exploits. It stops further movement of affected assets while the investigation continues, and it usually makes any losses easier to contain. ⏳ **More Details Expected Soon** Kava has said further information will follow. Until the team publishes a full post-mortem, the cause, the scale of any losses, and the plan for affected users remain unclear. 📊 **Why the Price Dropped So Sharply** A drop of more than 40% shows how quickly fear can spread in crypto: - 😨 Uncertainty about the exploit's size triggered panic selling - 🌉 Bridge-related news makes traders nervous about cross-chain risk - 🔒 Paused deposits and withdrawals reduce liquidity and confidence - 📢 Social media amplifies every rumor within minutes 🛡️ **Lessons for Traders and Investors** 1. 📰 **Wait for official updates.** Early reports are often incomplete. 2. 🧠 **Don't panic sell or FOMO buy.** Volatile moments punish emotional decisions. 3. 🌐 **Understand bridge and DeFi risks.** Smart contracts and cross-chain bridges are common targets. 4. 💼 **Diversify and manage risk.** Never put more than you can afford to lose into one project. 5. 🔎 **Do your own research (DYOR).** Check official channels and verified sources. 🔮 **What's Next?** The key things to watch are the official post-mortem, how users of Kava Lend are treated, when exchanges resume deposits and withdrawals, and whether $KAVA recovers some confidence. Incidents like this test how transparent and quick a team is, and clear communication often decides how fast trust returns. ⚠️ --- #KAVA #CryptoNews #KavaLend #DeFiSecurity #BNBSmartChain #JensenHuangExitTestsNvidiasAILeadership @jalekhakhatun --- #WSOTShowYourAITradeToEarn10USDT
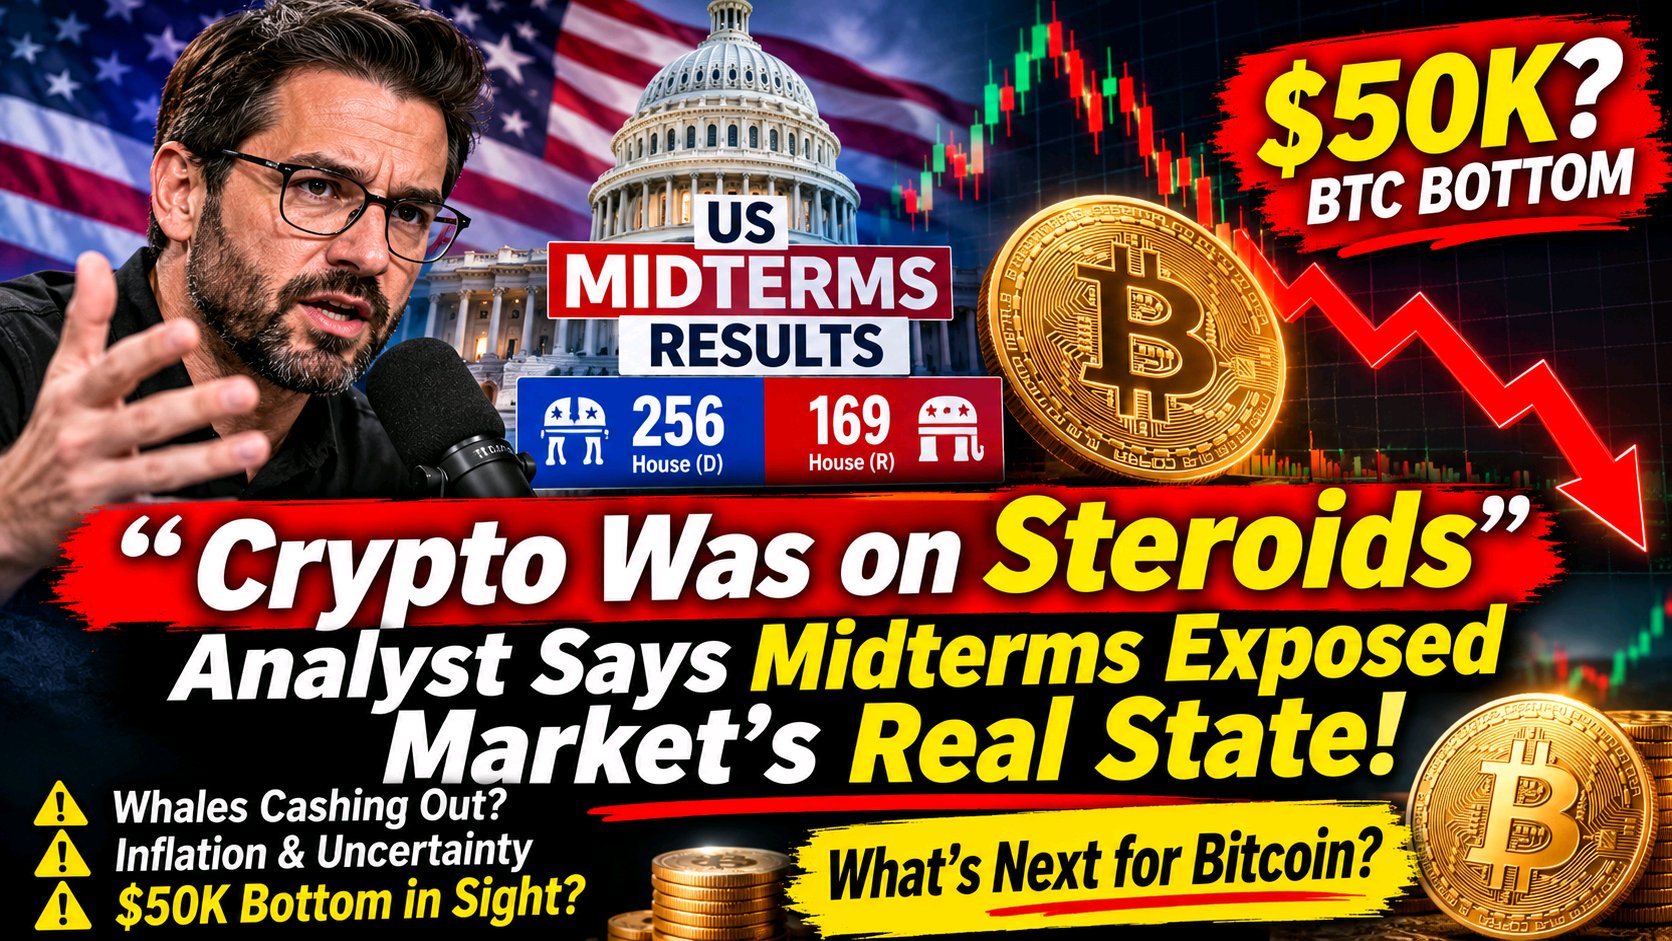
🚨 **"Crypto Was on Steroids":
Analyst Says the Midterms Exposed the Market's Real State and Eyes a $50K Bitcoin Bottom** 🚨 📉 A crypto commentator is arguing that the latest weakness in the market is **not a crash**. In his view, it is simply the market showing its true condition **without the steroids**. 💉 **The Core Argument** - 🐂 The previous rally was **not a natural bull run**, he says. It was pumped up by **buybacks and ETFs**. - 🗳️ He points out that he had warned the **midterms** were coming. - 🐋 With the midterms over, he says **whales are cashing out**, leaving believers in disbelief. - 🌍 With **inflation up** and **geopolitical uncertainty**, he thinks the market can only go further down. - 🎯 He would give **$BTC a $50K bottom**. 🗳️ **What Do the Election Results Show?** - 🏛️ As of Nov 15, 8:18am (GMT+5:45), AP's count shows Democrats with 256 House seats won and Republicans with 169. - 🏛️ As of Nov 15, 8:17am (GMT+5:45), AP's count shows Democrats with a total of 55 Senate seats (21 won plus 34 holdovers, including 2 others who caucus with them) and Republicans with a total of 44. These counts may have changed since then. The labels "Majority reached" (House) and "Control reached" (Senate) beside the Democrats are not calls by AP. Also, 10 House seats and 1 Senate seat are counted as won (or held over) for no party in the AP results I have, and those results don't say why or which way they will go. ⚖️ **How to Read the Claim** The election numbers are one thing, but the link between the midterms and whale selling is the commentator's **interpretation**, not something the results prove. Crypto prices also react to inflation, Fed expectations, ETF flows and global risk sentiment, so one cause rarely explains a whole move. 🧭 **What He Suggests** - 📥 He would **start accumulating again** - 🎯 He would **narrow down to a few coins** - 🗑️ He would **drop coins with no chance of recovering** He also states that this is not financial advice and that readers should do their own due diligence. 🛡️ **What Should Traders Keep in Mind?** 1. 🧠 **One opinion is not a forecast.** A $50K target is a view, not a certainty. 2. 📊 **Check the data yourself.** Watch ETF flows, Fed expectations and key support levels. 3. 💼 **Manage risk.** Use position sizing and stop-losses. 4. 🪙 **Be selective.** Strong projects usually hold up better than weak ones in downturns. 5. 🔎 **Do your own research (DYOR).** Rely on verified sources, not hype. 🔮 **What's Next?** Watch whether Bitcoin holds its support zones, how ETF flows behave, and what the Fed signals about rates. These will matter more than any single prediction. ⚠️ * --- #Bitcoin #BTC #Ethereum #CryptoMarket #Midterms --- #JensenHuangExitTestsNvidiasAILeadership #WSOTShowYourAITradeToEarn10USDT #USPPITestsTheHigherForLongerTrade #USInflationRunsHotAndRateHikeBetsRise #SanDiskAnnounces8For1StockSplit $ETHUSDT $BTCUSDT @jalekhakhatun
📚 **Crypto Bros Meet Wall Street:
TradFi Is Not a New Trade!** 🏦 🚀 Many crypto traders hear the hashtag **#TradFiForBeginners** and assume it is a brand-new trend. In reality, **traditional finance (TradFi)**, meaning banking, securities and markets, existed long before the first **BTC** block was ever mined. As more crypto users explore stocks, bonds and ETFs, learning this "ancient" language has become a real advantage. 🔍 **What Is TradFi?** TradFi covers the older financial system: banks, stock exchanges, bond markets, brokers and regulated products. Crypto did not replace these ideas. In many ways, it borrowed from them and gave them new names. 🧠 **A Quick Decode of "Ancient" Terminology** - 💰 **Dividends:** Profits distributed to shareholders, similar to a *hold reward* in crypto. - 📈 **Yield:** The return you earn on an investment, the original version of *staking*. - 🔐 **Collateral:** Pledging an asset to borrow, just like *margin* in crypto trading. - ↔️ **Spread:** The difference between the buying price and the selling price. - ⚡ **Spot price:** Buying or selling at the current market price. 🔄 **Why the Comparison Helps** If you already understand staking, margin and spot trading, you are closer to TradFi than you think. The concepts are the same, only the labels and the platforms differ. Seeing this connection makes stocks and bonds far less intimidating. ⚠️ **Don't Bring Your All-In x100 Habits Here** Crypto culture often rewards high leverage and fast, risky bets. Traditional markets usually work differently: - 🐢 Moves are often slower and more driven by fundamentals - 🏛️ Regulation and reporting rules are stricter - 📉 Over-leveraging can still wipe out your capital quickly - 🧘 Patience and discipline matter more than hype 💡 **What Should Beginners and Traders Do?** 1. 📘 **Learn stocks and bonds.** Understand how earnings, interest rates and yields work. 2. 📅 **Watch the macro calendar.** Fed meetings and CPI reports move both TradFi and crypto. 3. 💼 **Manage capital carefully.** Use position sizing and never risk more than you can afford to lose. 4. 🛑 **Use stop-losses.** Protect yourself from sudden drops. 5. 🔎 **Do your own research (DYOR).** Rely on verified data and official sources. 🌐 **Why This Matters Now** Crypto and traditional finance are connecting more closely through ETFs, tokenized assets, stablecoins and institutional adoption. Traders who understand both worlds can read the market better, since Fed decisions, inflation data and bond yields often affect Bitcoin as much as they affect stocks. 🔮 **What's Next?** Expect more crossover between crypto and TradFi in the coming years. Beginners who build a solid foundation in both will be better prepared for whichever market comes next. ⚠️ * --- #TradFi #TradFiForBeginners #Crypto #Bitcoin #FinancialEducation @jalekhakhatun --- #WSOTShowYourAITradeToEarn10USDT

Profit Falls Below 45%** 📉
⚠️ **Bitcoin Holders Under Pressure as Active Supply in 🔍 A worrying on-chain signal is emerging in the **Bitcoin** market. According to **CryptoQuant contributor Darkfost**, the share of Bitcoin's active supply currently sitting in profit has dropped **below 45%**. In simple terms, **more than half of the active supply analyzed is underwater**. 🧠 **What Does "Supply in Profit" Mean?** This metric tracks how many Bitcoins that have recently moved on-chain are worth more now than when they were last transferred. Because it focuses on **active supply**, it shows the condition of coins that are actually being traded, not coins that have been sitting untouched for years. When the number falls, it means most active holders are sitting on paper losses. 🔥 **Why Does This Matter?** When fewer holders remain in profit: - 😟 Market sentiment can weaken - 📉 Selling pressure may increase as investors try to limit their losses - 💔 Confidence can drop, especially among newer buyers - 🌊 Rising stress can lead to panic selling ⚖️ **But There Is Another Side to the Signal** Historically, when Bitcoin's profit supply approaches the **40% zone**, major market corrections have **sometimes** moved closer to their bottoms. Extreme pain in the market can mean that weaker holders have already sold, leaving fewer sellers behind. This is a pattern seen in the past, not a guarantee. 🔮 **What Comes Next?** - 🔴 **Bear case:** More downside could trigger additional panic selling, pushing the profit supply even lower and deepening the stress. - 🟢 **Bull case:** A recovery could create an attractive accumulation opportunity if demand returns and buyers step back in. 📊 **How to Read This Data** On-chain metrics are useful, but they work best alongside other signals such as price support levels, ETF flows, Fed expectations and overall market sentiment. A single indicator should never be used on its own to decide a trade. 🛡️ **What Should Traders and Investors Keep in Mind?** 1. 🧠 **Don't panic sell.** Fear is highest near uncertain moments. 2. 📍 **Watch key price levels.** Support and resistance zones give context to on-chain data. 3. 💼 **Manage risk.** Use position sizing and stop-losses. 4. 🪜 **Consider scaling in slowly.** If you plan to buy, dollar-cost averaging reduces timing risk. 5. 🔎 **Do your own research (DYOR).** Use verified data, not hype. ⚠️ *This article is for informational purposes only and is not financial advice.* --- #Bitcoin #BTC #OnChain #CryptoQuant #CryptoMarket --- #JensenHuangExitTestsNvidiasAILeadership #DeutscheBankLaunchesDigitalAssetCustody #AITechSelloffErases2Point5TrillionFromNasdaq100 #BitcoinHitsTwoMonthLowAfterUSMidterms #AnthropicIPOTestsTheAIBoom $ETHUSDT @jalekhakhatun

🚨 CUENTA REGRESIVA PARA EL IPO DE ANTHROPIC:
6 VECES MÁS DEMANDA, UN OBJETIVO DE 1.4 BILLONES DE DÓLARES Y UN DEBUT EN EL NASDAQ EL 19 DE NOVIEMBRE 🚀📈 Uno de los debuts bursátiles más importantes de la historia ya casi está aquí. Anthropic, la empresa de IA detrás de Claude, comenzará a cotizar en el Nasdaq la próxima semana y la demanda reportada por los inversores es enorme. Aquí tienes el cronograma completo, las cifras y lo que hay que vigilar. 👇 📅 EL CRONOGRAMA 🗓️ 10 de nov: Comienza el 'roadshow'. Anthropic inició su gira de inversores y presentó un rango de precios. 🎤 13 de nov: Transmisión en vivo para inversores. El CEO Dario Amodei habló con Jamie Dimon, CEO de JPMorgan, en la sede del banco en Manhattan. 💵 18 de nov: Fecha esperada de fijación de precios. El precio final de la acción se establece la noche anterior al inicio de la cotización. 🔔 19 de nov: Debut en el Nasdaq. Se espera que las acciones coticen bajo el ticker ANT en el Nasdaq Global Select Market. 💰 EL ACUERDO EN CIFRAS • Acciones ofrecidas: 825 millones de acciones de Clase A • Rango de precio: de 70 a 78 dólares por acción • Quién vende: Anthropic vende cerca de 801 millones, mientras que los accionistas existentes venden alrededor de 23.6 millones • Tamaño de la OPI: hasta unos 64.35 mil millones de dólares en el tope del rango • Colocación privada: 26 mil millones de dólares adicionales • Recaudación combinada: hasta 90.4 mil millones de dólares, lo que superaría la salida a bolsa de SpaceX en junio de 86.2 mil millones de dólares 🏆 • Objetivo de valoración: aproximadamente 1.4 billones de dólares totalmente diluidos, por debajo de lo que esperaban algunos inversores • Bancos líderes: Goldman Sachs y Morgan Stanley Para comparar, la ronda de financiación privada más reciente de Anthropic la valoró en 965 mil millones de dólares. 📊 🔥 ¿QUÉ ESTÁ IMPULSANDO LA DEMANDA? Bloomberg reportó que la OPI tiene una sobresuscripción de seis veces. Según se informa, los banqueros dijeron a los inversores que se daría prioridad a los patrocinadores existentes y que algunos compradores podrían recibir asignaciones más pequeñas de las que solicitaron. Los detalles aún podrían cambiar. ⚡ Razones por las que los inversores están haciendo fila: • 🤖 El auge de la IA sigue atrayendo un capital enorme • 🏢 Grandes nombres de la tecnología están comprando. Nvidia, Microsoft, Google, AMD, Broadcom, Micron y TSMC acordaron comprar 26 mil millones de dólares en acciones sin derecho a voto al precio de la OPI • 📈 El tráfico de Claude aumentó un 24% en octubre según los reportes • 🎯 El objetivo de 1.4 billones de dólares se considera conservador, y las empresas a menudo establecen los términos con cautela cuando comienzan a comercializar El Financial Times reportó que los suscriptores esperan que el precio final se sitúe por encima del rango de 70 a 78 dólares. Hasta la noche del viernes, no se había presentado ningún precio final ante la SEC, por lo que cualquier afirmación de que las acciones ya tienen precio es prematura. ⏳ 🎙️ ¿QUÉ LE DIJO AMODEI A LOS INVERSORES? En la transmisión en vivo, Amodei dijo que decidir cuánto poder de cómputo comprar es el "dilema comercial más profundo" de la empresa, porque los ingresos a uno o dos años son difíciles de predecir. También presentó a los inversores argumentos sobre la seguridad de la IA y una cultura de contratación estricta. 🧠$MANTRAUSDT #La salida de Jensen Huang pone a prueba el liderazgo de IA de Nvidia #Las pruebas del IPP de EE. UU. para la operación de tasas más altas por más tiempo #LaInflaciónEnEUAseDisparaYLasaApuestasDeAumentoDeTasasSuben #SanDisk anuncia un desdoblamiento accionario de 8 por 1 #AnthropicIPOValuationTest @jalekhakhatun

🚨 **ALTO. MIRA CON ATENCIÓN:✋
**¡BTC HACE UN SWEEP DE LIQUIDEZ A LOS $69K! ¿SE ACERCA LA PRÓXIMA REVERSIÓN?** 📊 Bitcoin finalmente ha tocado el nivel que muchos traders habían estado observando durante semanas. Un analista comenta que ha estado prediciendo un **sweep de los $69K** desde hace tiempo, y ahora que BTC ha tomado esa liquidez, todos los ojos están puestos en qué sucederá a continuación. 👀 --- 🧲 **¿QUÉ ES UN SWEEP DE LIQUIDEZ?** Un sweep de liquidez ocurre cuando el precio empuja hacia una zona llena de stop-losses y órdenes pendientes, captura esa liquidez y, a menudo, reacciona bruscamente. 💡 • Los stops de los traders en largo se ubican por debajo de los niveles clave de soporte • Los grandes jugadores pueden usar estos grupos de órdenes para llenar posiciones grandes • Después del sweep, el precio se revierte o continúa bajando, y la reacción define cuál de los dos sucederá Es por eso que el movimiento **después** del sweep importa más que el sweep mismo. ⚡ --- 🔍 **LA VISIÓN DEL ANALISTA** Según el analista, el movimiento aún no termina, pero el precio se está acercando a la zona donde puede comenzar la próxima reversión importante. Dice que está observando el nivel de los $69K muy de cerca. 🎯 Lo clave que quiere ver es a los **compradores entrando al mercado** y convirtiendo esta caída en un **movimiento bajista fallido**. Esa configuración es lo que ha estado esperando. 🧠 --- 🗺️ **EL PLAN A PARTIR DE AQUÍ** ➡️ **Paso 1: Liquidez de $69K capturada (sweep)** ✅ La primera parte del escenario se ha desarrollado. ➡️ **Paso 2: Estar atentos a una recuperación fuerte y una trampa para osos** 🪤 Si BTC vuelve a subir rápidamente por encima del nivel barrido con fuerza, los vendedores en corto que entraron durante la caída podrían quedar atrapados, y sus compras forzadas pueden impulsar un rebote. ➡️ **Paso 3: Recuperación por encima de los $80K** 📈 Un movimiento sostenido por encima de esta zona mostraría que los compradores están recuperando el control de la tendencia. ➡️ **Paso 4: La liquidez de $96K se convierte en el próximo objetivo** 🚀 Si la recuperación genera impulso, el siguiente gran grupo de liquidez se sitúa cerca de los $96K. --- 🟢 **ESCENARIO ALCISTA** BTC recupera el nivel barrido con un volumen fuerte, los compradores defienden la caída y la ruptura se convierte en una trampa para osos. Esto abriría la puerta a un rally de recuperación hacia los objetivos más altos. 🔥 🔴 **ESCENARIO BAJISTA** BTC no logra recuperar el nivel, rebota débilmente y luego es rechazado. En ese caso, la ruptura se confirmaría como real y el precio podría continuar bajando en lugar de revertirse. 📉 ⚪ **ESCENARIO NEUTRAL** El precio puede lateralizarse después del sweep mientras el mercado espera un catalizador. Esto es común después de una volatilidad aguda. 😴 --- 🧠 **LO QUE ESTÁN HACIENDO LOS TRADERS INTELIGENTES** ✅ Esperar la confirmación en lugar de adivinar el suelo exacto ✅ Observar cómo reacciona el precio justo después del sweep ✅ Usar stop-losses y tamaños de posición sensatos ✅ Evitar entradas emocionales impulsadas por FOMO ✅ Recordar que la predicción de un trader es un plan, no una promesa --- ⚠️ **RECORDATORIO IMPORTANTE** Predecir un movimiento por adelantado se siente genial cuando funciona, pero los mercados pueden cambiar rápidamente. Los objetivos de $80K y $96K dependen de que los compradores realmente entren, y nada está garantizado. Una recuperación debe ser fuerte y confirmada; de lo contrario, la idea de la "trampa para osos" no se sostiene. 🛡️ --- 🏁 **REFLEXIONES FINALES** El sweep de los $69K puede ser un punto de inflexión importante, o puede ser solo un paso más hacia abajo. Las próximas velas mostrarán qué lado tiene el control. La paciencia, la confirmación y la gestión del riesgo importan más que cualquier predicción. 💪 *Esto no es un consejo financiero. Siempre investiga por tu cuenta antes de operar.* 📌 --- #Bitcoin #BTC #CryptoTrading #Liquidez #CryptoNoticias --- #La venta masiva de acciones tecnológicas borra 2.5 billones del Nasdaq 100 #DeutscheBankLanzaCustodiaDeActivosDigitales #BitcoinAlcanzaMinimoDeDosMesesDespuesDeLasEleccionesDeMedioTerminoEnEEUU #AnthropicIPOValuationTest #SanDisk anuncia un desdoblamiento accionario de 8 por 1 $BTCUSDT @jalekhakhatun
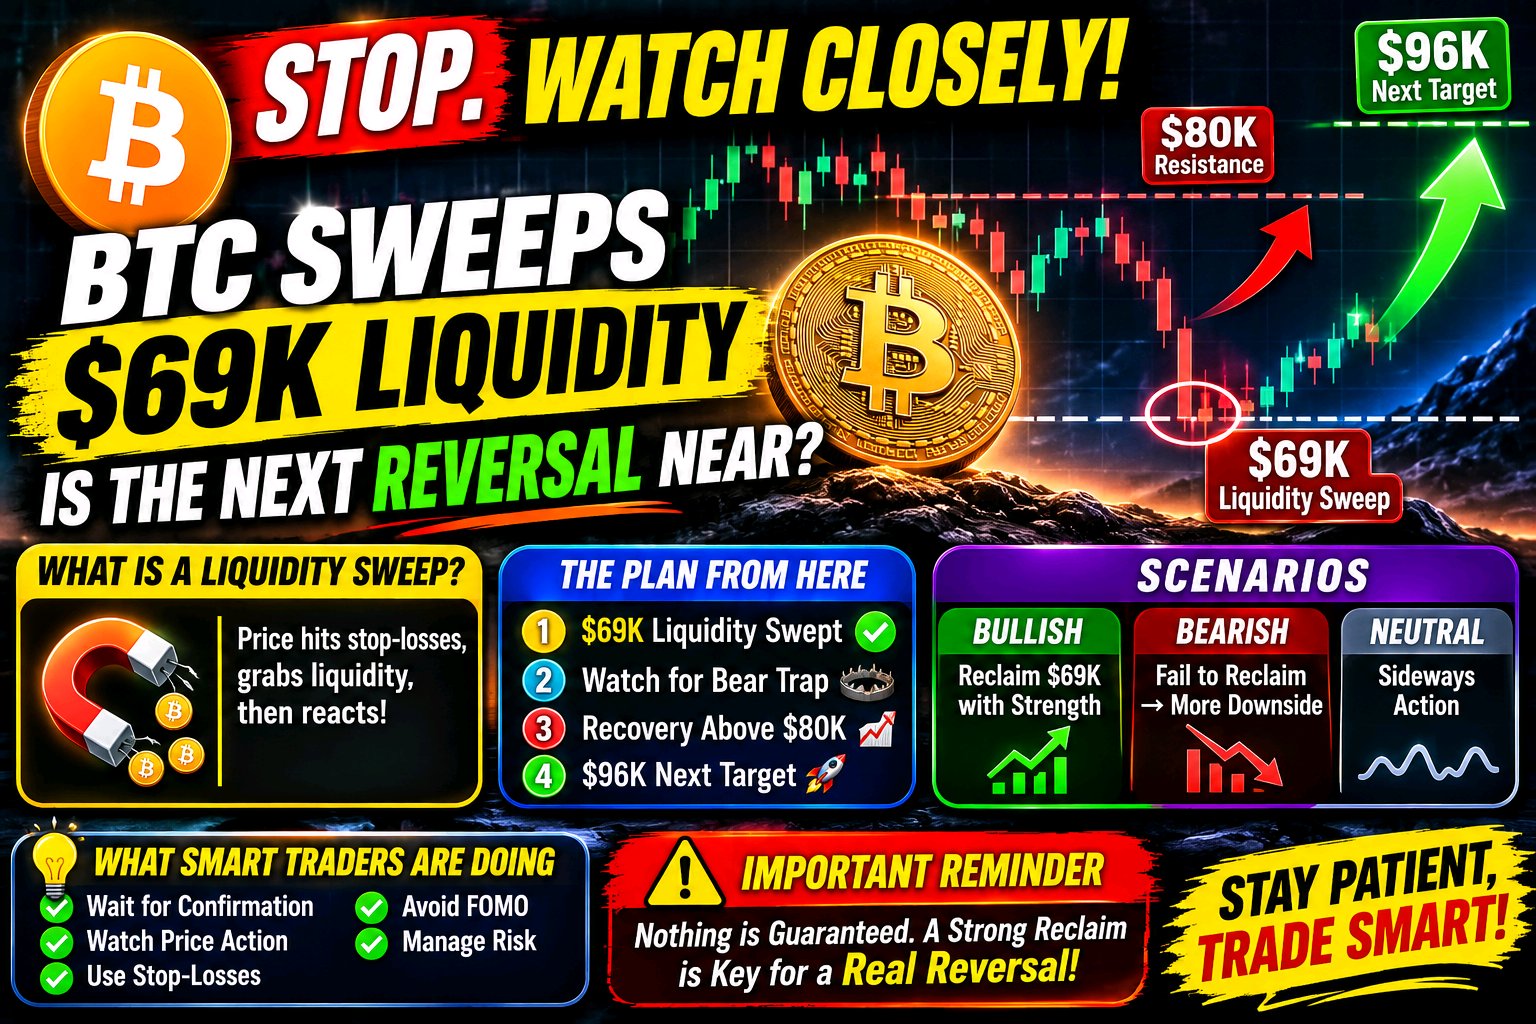
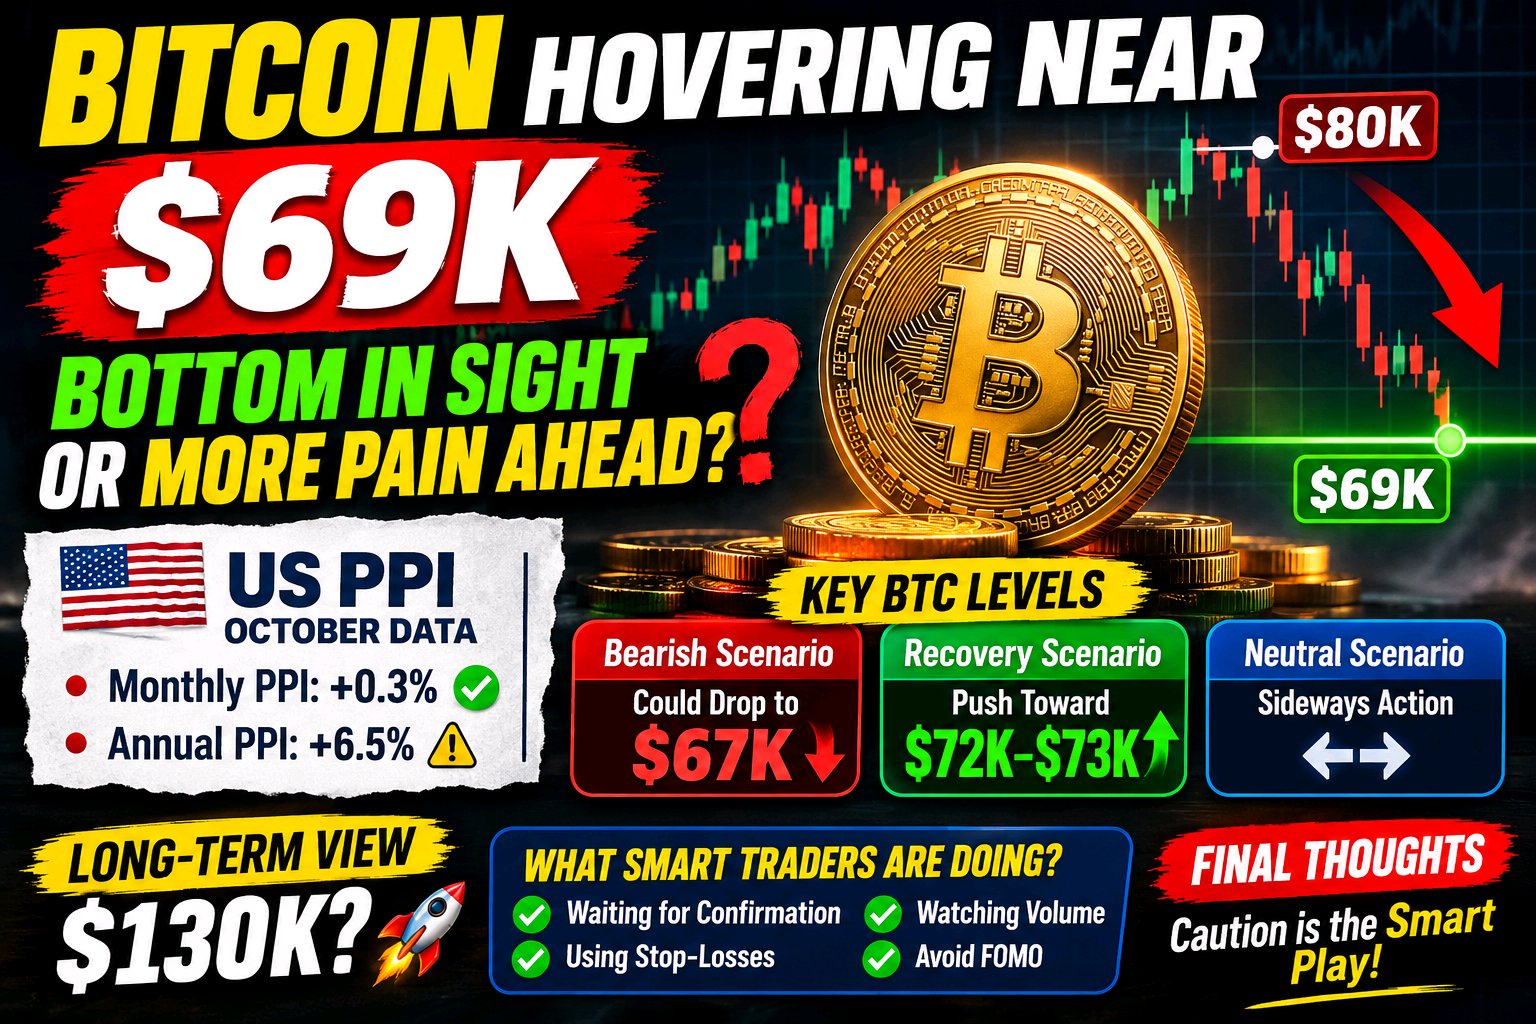
¿YA TOCAMOS FONDO O AÚN FALTA MÁS DOLOR?** 📉
🚨 **BITCOIN OSCILANDO CERCA DE LOS $69K: Bitcoin ha pasado por una corrección brusca, cayendo desde la zona de los **$80K** hasta cerca de los **$69K**. La gran pregunta en la mente de cada trader: ¿es este el fondo o el mercado se prepara para otra caída? 🤔 --- 📊 **PPI DE EE. UU.: DATOS DE OCTUBRE** • **PPI mensual:** +0.3%, por debajo del pronóstico de +0.4% ✅ • **PPI anual:** +6.5%, arriba del 6.3% de septiembre ⚠️ El dato mensual resultó más moderado de lo esperado, lo cual es un pequeño punto positivo para los activos de riesgo. Pero la cifra anual sigue subiendo, lo que nos indica que la presión inflacionaria en la cadena de suministro no ha desaparecido. Este panorama mixto mantiene al mercado cauteloso. 🧐 --- 💡 **POR QUÉ EL PPI ES IMPORTANTE PARA BITCOIN** El PPI mide los precios que reciben los productores y a menudo actúa como una señal temprana de la inflación al consumidor. Una mayor inflación puede mantener las tasas de interés elevadas por más tiempo, lo que tiende a presionar a los activos de riesgo como las criptomonedas. Un dato mensual más suave puede aliviar ese temor, pero solo si la tendencia continúa. 📈 --- 🔍 **NIVELES CLAVE DE BTC A VIGILAR** 🔴 **Escenario bajista:** Si la presión de venta continúa y el soporte se rompe, BTC podría deslizarse hacia los **$67K**. Un rebote débil seguido de un rechazo fortalecería esta hipótesis. 🟢 **Escenario de recuperación:** Si Bitcoin mantiene el soporte y recupera los **$70K**, podría intentar un impulso hacia los **$72K–$73K**. Recuperar los $70K con un volumen fuerte sería la primera señal de que los compradores están regresando. ⚪ **Escenario neutral:** El precio podría moverse lateralmente entre el soporte y la resistencia mientras el mercado espera un catalizador claro. Esto es común después de una caída pronunciada. 😴 --- 🚀 **VISIÓN A LARGO PLAZO** Algunas predicciones del mercado todavía apuntan tan alto como a los **$130K**, pero esto es altamente especulativo. Probablemente requeriría una recuperación más amplia del mercado, una mejora en la liquidez y una renovada confianza de los inversores. Las predicciones no son garantías. 🎯 --- 🧠 **QUÉ ESTÁN HACIENDO LOS TRADERS INTELIGENTES** ✅ Esperar confirmación en lugar de adivinar el fondo ✅ Gestionar el tamaño de las posiciones y usar stop-losses ✅ Observar el volumen y los niveles clave de soporte y resistencia ✅ Evitar entradas emocionales impulsadas por el FOMO --- ⚠️ **REFLEXIONES FINALES** Un PPI mensual más moderado **no** garantiza un repunte de Bitcoin. El mercado aún necesita confirmación mediante la acción del precio. Hasta que BTC recupere la resistencia clave, la cautela es la jugada inteligente. La paciencia y la gestión de riesgos importan más que las predicciones. 💪 *Esto no es asesoramiento financiero. Siempre haz tu propia investigación antes de operar.* 📌 --- #Bitcoin #BTC #NoticiasCrypto #PPI #TradingCrypto --- #DeutscheBankLanzaCustodiaDeActivosDigitales #La venta masiva de acciones tecnológicas borra 2.5 billones del Nasdaq 100 #BitcoinAlcanzaMinimoDeDosMesesDespuesDeLasEleccionesDeMedioTerminoEnEEUU #SanDisk anuncia un desdoblamiento accionario de 8 por 1 @jalekhakhatun
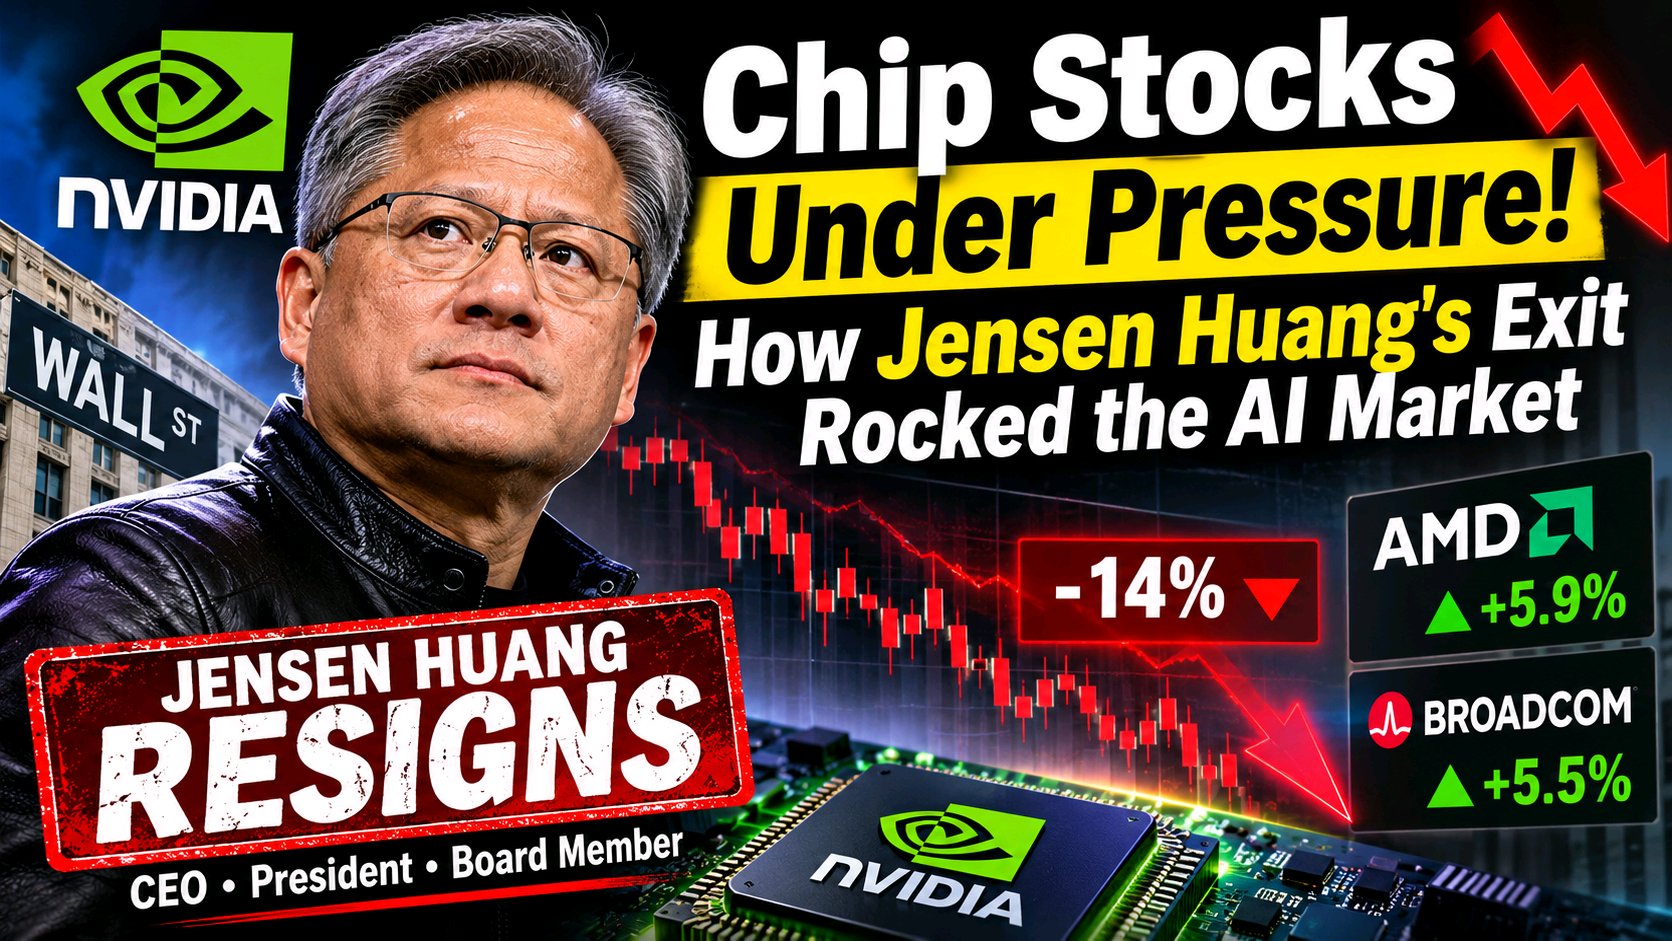
🚨 Chip Stocks Under Pressure:
How Jensen Huang's Exit Rocked the AI Market 📉 ⚡ The semiconductor world is in shock. NVIDIA co-founder Jensen Huang has resigned as president, CEO, and board member after 33 years, effective immediately. CFO Colette Kress is interim CEO while the board searches for a permanent successor. 🔍 The news hit a sector that was already nervous. Here is how the market reacted and what could come next. 👇 💥 The Market Reaction 📉 NVIDIA fell as much as 14% at the open on Thursday, then recovered part of that to close down about 4.3%. Even so, it has lost nearly $490 billion in market value since last week's close. 😱 🔻 The Philadelphia Semiconductor Index fell as much as 3.7% during the session before recovering to a smaller loss. 📊 🏭 Supplier and partner stocks were hit unevenly: 🖥️ Super Micro Computer dropped about 12% after a report of a possible Department of Justice probe linked to the scandal. 💾 Micron slipped about 1.6% on worries that a slowdown at NVIDIA could hurt its sales. 🔧 Marvell fell about 2.5%, and Oracle about 1.2% at one point. 🇨🇳 Chinese tech companies that rely on NVIDIA chips also suffered losses. 🏆 The Winners: AMD and Broadcom 🔥 Not everyone lost. AMD rose about 5.9% and Broadcom about 5.5% on hopes that they could win share if NVIDIA stumbles. 🚀 🧠 This suggests many investors see the AI business broadening to more players rather than depending on a single company. 🌐 🫧 The Sector Was Already Fragile ⚠️ According to State Street, global chip stocks were already in a roughly 20% drawdown before this news, and the Nasdaq fell 5.5% on Nov. 5. So this scandal landed on top of existing worries about AI funding and regulation. 😬 📌 That is why some people call this a "shockwave" while others call it just one more push in a correction that had already started. 🛒 Dip Buyers Show Up 💪 Retail investors reportedly bought the NVIDIA drop in large numbers, and some analysts said bargain hunting helped the recovery. The thinking is that NVIDIA's technology, customer relationships, and AI demand will survive a leadership change. 🧱 🤝 NVIDIA's board chair said he expects operations, customer commitments, and the product roadmap to continue without interruption. 📋 🤔 Temporary Panic or Deeper Correction? 🐂 The "panic" view: The chip business is built on products, software, and supply chains, not one person. The market already recovered about two-thirds of the early losses, and the broader indexes finished only slightly lower. 📈 🐻 The "deeper correction" view: Huang was seen as the "visionary" behind NVIDIA's strategy, and investors do not yet know who can replace him. Investigations and political pressure could add headlines. The AI trade also depends on huge spending plans that investors are now questioning. 🌊 🔮 Honestly, nobody knows yet. The answer will depend on a few things below. #SanDiskAnnounces8For1StockSplit #AnthropicIPOTestsTheAIBoom #BitcoinHitsTwoMonthLowAfterUSMidterms #AITechSelloffErases2Point5TrillionFromNasdaq100 @jalekhakhatun
TradFi for Beginners
: The Basics Every Crypto Learner Should Know 📚 💡 Traditional Finance (TradFi) can look complicated from the outside. But if you want to understand crypto, DeFi, and where digital finance is heading, you first need to know the system it is trying to improve, or sometimes replace. 🌍 Let's break it down in simple language. 👇 🤔 What Is TradFi? 🏛️ TradFi means the established financial system: banks, stock exchanges, insurance companies, asset managers, and government-regulated institutions. It is the system most people have used all their lives, whether they realize it or not. 💳 🔑 Its key feature is that trusted intermediaries sit in the middle. Banks hold your money, brokers place your trades, and clearing houses settle transactions. 🤝 📈 1. Stocks: Owning a Piece of a Company 🏢 A stock (or share) represents part ownership in a company. If the company grows, the value of your share may rise. If it struggles, the value may fall. 🎢 💰 How people may earn: price appreciation and, in some cases, dividends (a share of profits paid to shareholders). ⚠️ Main risk: prices can fall sharply, and you can lose money. 🏟️ Stocks trade on exchanges such as the NYSE and Nasdaq. Regular trading happens during set market hours, unlike crypto, which trades 24/7. 🕘 📜 2. Bonds: Lending Money for Interest 🏦 A bond is basically a loan. You lend money to a government or company, and they promise to pay you interest and return the principal at maturity. 🗓️ 🛡️ Bonds are often seen as lower-risk than stocks, but they are not risk-free. Risks include: 📉 Interest-rate risk: when rates rise, existing bond prices usually fall. 🚫 Credit risk: the issuer might fail to pay. 🎈 Inflation risk: rising prices can eat into your returns. 🏧 3. Banking Fundamentals 💵 Banks do a few basic jobs: 1️⃣ Hold deposits and keep your money accessible. 🔐 2️⃣ Lend money to people and businesses. 🏠 3️⃣ Move money through payments, transfers, and cards. 🔄 🧮 Banks earn money mostly from the difference between the interest they charge on loans and what they pay on deposits. 📊 🏛️ Most banks are regulated, and many countries have deposit protection schemes, though the rules and limits vary by country. 🛟 🏦 4. Central Banks and Interest Rates 🌐 Central banks, like the US Federal Reserve, manage a country's money supply and set key interest rates. Their decisions affect: 🏠 Loan and mortgage costs 📈 Stock and bond prices 💲 Currency values 🪙 Even crypto market sentiment 📌 Many crypto traders watch central bank announcements closely, because interest rates and liquidity can move all risk assets. 👀 🧺 5. Other Key Concepts 🪙 Inflation: the general rise in prices over time, which reduces what your money can buy. 💧 Liquidity: how easily an asset can be converted to cash. 🧩 Diversification: spreading money across different assets to reduce risk. 📦 ETFs: funds that trade like a stock and hold a basket of assets. 🏛️ Regulation: rules from authorities that protect investors and maintain market order. 📋 ⚔️ TradFi vs. Crypto and DeFi 🏦 TradFi 🪙 Crypto / DeFi Intermediaries (banks, brokers) Smart contracts and blockchains Limited market hours Open 24/7 Heavily regulated Regulation still evolving Slower settlement (often days) Often near-instant Access can need accounts and approval Often open to anyone with a wallet #SanDiskAnnounces8For1StockSplit #USInflationRunsHotAndRateHikeBetsRise #AnthropicIPOTestsTheAIBoom #AITechSelloffErases2Point5TrillionFromNasdaq100 @jalekhakhatun

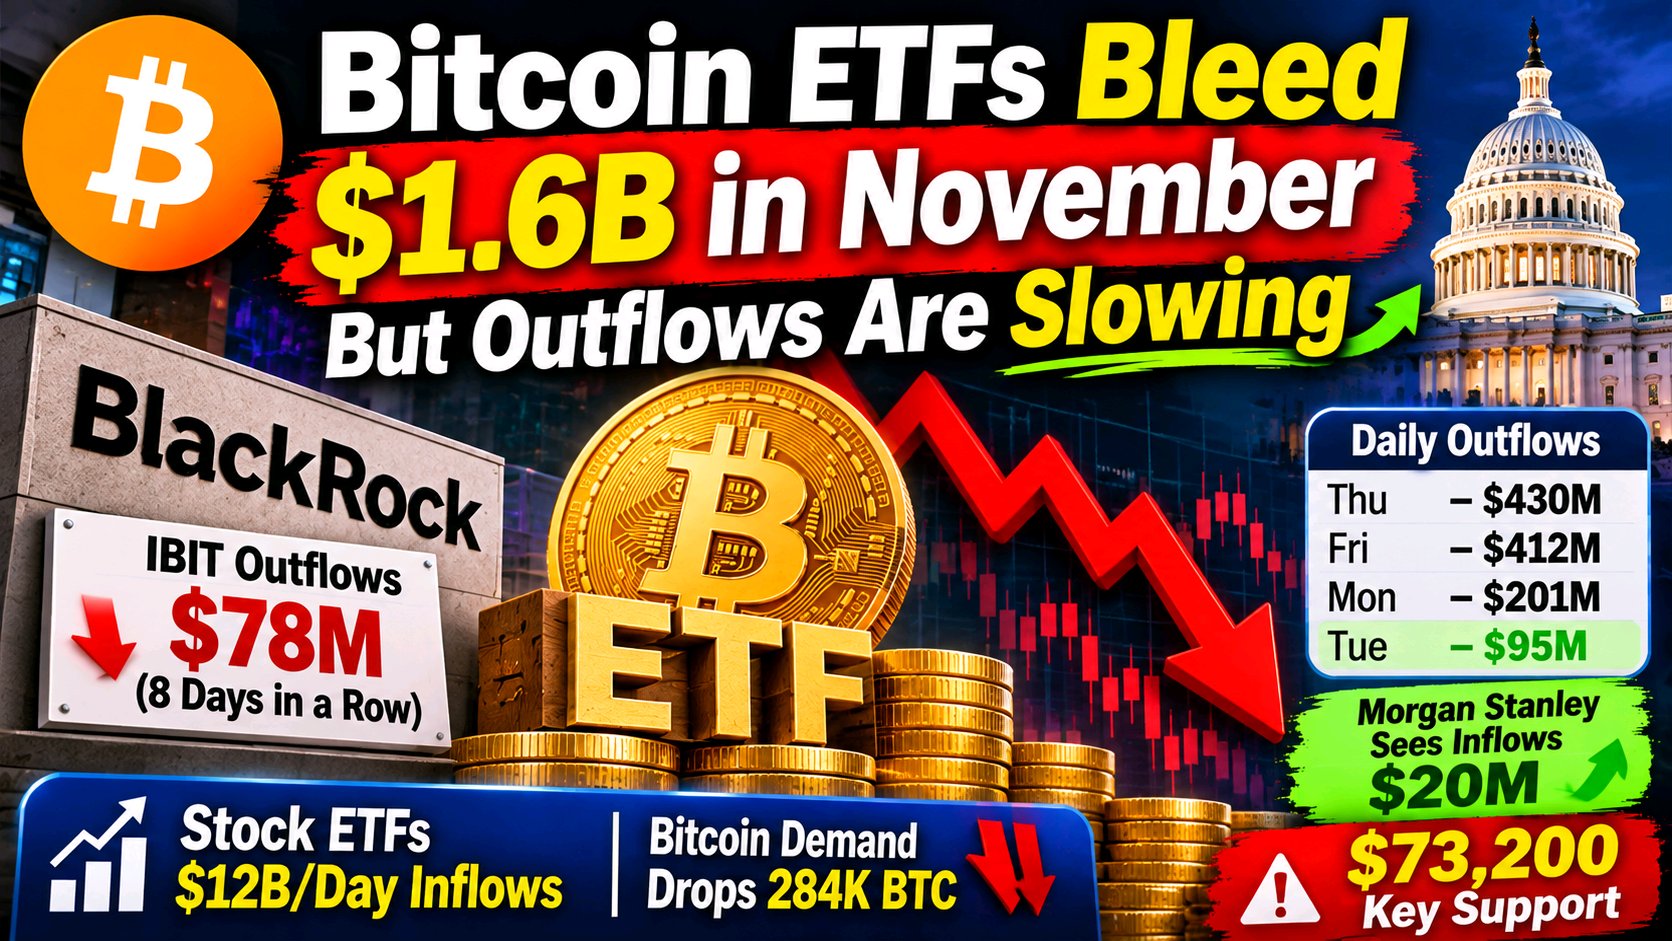
pero las salidas se están desacelerando 📉
# 💸 Los ETF de Bitcoin pierden $1,600 millones en noviembre, Los ETF de Bitcoin al contado en EE. UU. están teniendo un mes difícil, aunque los datos más recientes sugieren un posible cambio. 👀 # 🔍 Introducción: Un comienzo difícil para noviembre Los ETF de Bitcoin al contado fueron alguna vez la mayor historia de éxito en el mundo cripto. 🚀 Le dieron a los inversores de Wall Street una forma fácil y regulada de poseer Bitcoin. Noviembre ha puesto a prueba esa historia. 😬 Los ETF de Bitcoin al contado de EE. UU. han registrado alrededor de **$1,600 millones en salidas netas** desde el comienzo del mes. Esto empuja los flujos netos totales de los fondos para 2026 a **territorio negativo**. 📉 Para un producto que pasó su etapa inicial atrayendo entradas constantes, este es un punto de inflexión notable. 🔄 *Nota: Las cifras a continuación provienen de la actualización de mercado que compartiste, así que por favor verifícalas con los rastreadores de flujo de ETF en vivo antes de publicar.* ✅ ## 📉 El ritmo de las salidas se está desacelerando La cifra general parece sombría, pero la tendencia diaria cuenta una historia más esperanzadora. 🌤️ | Día | Salida neta | |---|---| | 📅 Jueves | $430 millones | | 📅 Viernes | $412 millones | | 📅 Lunes | $201 millones | | 📅 Martes | $95 millones | La salida del martes de **$95 millones** fue la más baja de las últimas cuatro sesiones. 📊 Las salidas diarias han disminuido más de un 75% desde el nivel del jueves. Eso no significa que las ventas hayan terminado, pero sugiere que el pánico podría estar disminuyendo. 😮💨 ## 🏦 BlackRock lidera las salidas El nombre más grande en el mercado de ETF de Bitcoin también está sintiendo la presión. 🧱 - 🔴 **iShares Bitcoin Trust (IBIT) de BlackRock** perdió **$78 millones** el martes. - 🔴 Esa fue su **octava jornada consecutiva** de salidas. - 🔴 El total de salidas durante esa racha alcanzó los **$1,730 millones**. IBIT es el ETF de Bitcoin al contado más grande, por lo que sus flujos a menudo reflejan el estado de ánimo de los inversores institucionales. 🏛️ Una racha de pérdidas tan larga sugiere que muchos grandes tenedores están reduciendo su exposición. 🧊 ## 🌟 Un punto brillante: el Bitcoin Trust de Morgan Stanley No todos los fondos están perdiendo dinero. 🟢 El **Bitcoin Trust (MSBT) de Morgan Stanley** atrajo **$20 millones en entradas** el martes. 💰 Es una cifra pequeña comparada con las salidas en otros lugares, pero demuestra que algunos inversores siguen aumentando su exposición a Bitcoin ante la debilidad. Otra señal de que los grandes nombres de Wall Street siguen creando productos cripto. 🏗️ ## 📈 La fiebre por los ETF de acciones Mientras que los fondos de Bitcoin perdían dinero, los ETF de acciones tradicionales tuvieron compras fuertes. 🛒 Según el analista de ETF de Bloomberg, Eric Balchunas, los inversores trataron la caída del mercado como una **oportunidad de compra**. - 💵 Un promedio de **$12,000 millones diarios** fluyeron hacia los ETF que cotizan en EE. UU. durante los últimos cinco días hábiles. - 🏆 Los **17 fondos con las mayores entradas** fueron fondos de acciones. - 📌 Nombres como **VOO, QQQ y IVV** lideraron el camino. Esto demuestra que los inversores no están abandonando el mercado. Están eligiendo dónde poner su dinero. 🔄 En este momento, muchos prefieren el S&P 500 y el Nasdaq antes que el Bitcoin. 🆚 ## 🛡️ Perspectiva del mercado y soporte crítico Los datos en cadena (on-chain) añaden otra capa de precaución. ⚠️ Según CryptoQuant, **la demanda visible de Bitcoin en 30 días se contrajo en 284,000 BTC**, la caída más pronunciada desde marzo de 2025. 📉 Bitcoin cotizaba alrededor de **$73,998**, y los traders observaban los **$73,200** como un nivel de soporte crítico. 🎯 *(El texto que compartiste se corta en este punto, así que solo incluí lo que era visible.)* Si esa zona se mantiene, podría ayudar a estabilizar el sentimiento. Si se rompe, la presión de venta podría regresar. 🔻 ## 🤔 ¿Qué significa todo esto? Hay varias formas de interpretar los datos: 1. 🐻 **Visión bajista:** Ocho días seguidos de salidas en IBIT y la caída en la demanda demuestran que el apetito institucional es débil. 2. 🐂 **Visión alcista:** Las salidas se están desacelerando rápidamente y las entradas en MSBT sugieren que los compradores que aprovechan las caídas están regresando. 3. ⚖️ **Visión neutral:** El dinero está rotando hacia los ETF de acciones, por lo que podría ser un cambio a corto plazo en lugar de una salida duradera del mundo cripto. ## 👁️ Qué deberían observar los traders a continuación - 📌 Si los flujos diarios de los ETF se vuelven positivos - 📌 La racha de salidas de IBIT y si finalmente termina - 📌 La reacción de Bitcoin alrededor del área de soporte de $73,200 - 📌 Los datos de demanda de CryptoQuant para ver señales de recuperación - 📌 Si las entradas en los ETF de acciones siguen superando a las de cripto ## ✅ Conclusión Noviembre ha sido doloroso para los inversores de los ETF de Bitcoin, con $1,600 millones saliendo de los fondos y los flujos de 2026 ahora en terreno negativo. 😓 Pero las salidas diarias han caído drásticamente y algunos fondos aún ven entradas. 🌱 Las próximas sesiones mostrarán si este es el final de las ventas o solo una pausa. Los traders inteligentes observan juntos los flujos de los ETF, la demanda en cadena y los niveles clave de precios. 📈🔥 *⚠️ Descargo de responsabilidad: Este artículo es solo para fines informativos y no es asesoramiento financiero. Siempre investiga por tu cuenta antes de operar.* ## 🏷️ #LaInflaciónEnEUAseDisparaYLasaApuestasDeAumentoDeTasasSuben #La volatilidad del petróleo sigue las conversaciones de paz con Irán #BybitIAEvolucionando @jalekhakhatun **#BitcoinETF #IBIT #NoticiasBitcoin #MercadoCripto #FlujosETF**
🏦 Finanzas Tradicionales (TradFi) para principiantes:
# Entendiendo las Finanzas Tradicionales en la Era Cripto 📚 Antes de adentrarte en el DeFi, es útil entender el sistema que existió primero. 🌍 ## 🔍 ¿Qué es TradFi? **TradFi**, abreviatura de **Finanzas Tradicionales** (Traditional Finance), es el sistema financiero clásico que el mundo ha utilizado durante siglos. 🏛️ Incluye: - 🏦 **Bancos**, que resguardan tus ahorros y otorgan préstamos - 📈 **Mercados bursátiles**, donde se compran y venden acciones de empresas - 🏢 **Casas de bolsa y firmas de inversión**, que gestionan las inversiones de sus clientes - 🛡️ **Compañías de seguros y fondos de pensiones**, que protegen y hacen crecer la riqueza a largo plazo - 🏛️ **Bancos centrales y reguladores**, que supervisan el sistema y establecen las reglas La característica clave de TradFi es que está **centralizado**. 🎯 Una institución de confianza se interpone entre tú y tu dinero. ## 🤝 Cómo funciona TradFi: El rol de los intermediarios En TradFi, casi cada acción financiera pasa por un intermediario. 🔗 1. 💵 **Guardar dinero:** Depositas efectivo en un banco y el banco lleva el registro de tu saldo. 2. 🏠 **Pedir préstamos:** Un banco verifica tu crédito e ingresos, y luego decide si otorgarte el préstamo. 3. 💳 **Realizar pagos:** Las redes de tarjetas y los procesadores de pagos mueven tu dinero entre cuentas. 4. 📊 **Invertir:** Compras acciones a través de un corredor autorizado, no directamente del mercado. Esta configuración es más lenta y a menudo más costosa, pero conlleva beneficios reales. ✅ ## 🛡️ ¿Por qué TradFi ofrece estabilidad y protección? TradFi se basa en regulaciones y marcos legales. ⚖️ Eso trae varias ventajas: - 🔐 **Protección legal:** Si algo sale mal, puedes acudir a los reguladores y tribunales. - 🏦 **Seguro de depósitos:** En muchos países, los depósitos bancarios están asegurados hasta cierto límite. - 📜 **Reglas de transparencia:** Las empresas públicas deben publicar informes financieros para los inversores. - 🧑⚖️ **Resolución de disputas:** El fraude y los errores a menudo pueden revertirse o investigarse. - 🧱 **Confianza establecida:** Décadas de historia brindan a muchas personas confianza en el sistema. Para un principiante, esta red de seguridad es una gran razón por la que TradFi sigue siendo popular. 🙌 ## 📈 Un vistazo rápido a las acciones: El ejemplo de $NVDA En TradFi, puedes ser dueño de una pequeña parte de una empresa comprando sus acciones. 🏢 Un ejemplo es **NVIDIA ($NVDA)**, una conocida empresa de chips e IA. 🤖 Cuando compras una acción, te conviertes en copropietario de la empresa. 💼 Si la empresa crece, el precio de la acción puede subir. Si tiene dificultades, el precio puede caer. 📉📈 Las acciones se negocian en bolsas reguladas durante horarios establecidos, a través de corredores autorizados. Los precios pueden fluctuar mucho, por lo que la investigación es importante. 🔎 *Este es un ejemplo educativo, no una recomendación de compra o venta.* ⚠️ # ⚔️ TradFi vs. Cripto: ¿Cuál es la diferencia? | Característica | 🏦 TradFi | 🪙 Cripto | |---|---|---| | **Control** | Instituciones centralizadas | Redes descentralizadas | | **Horario de acceso** | Horarios de mercado limitados | Operaciones 24/7 | | **Intermediarios** | Se requieren bancos y corredores | Posible entre pares (P2P) | | **Regulación** | Fuertemente regulado | Evolucionando y varía por país | | **Velocidad de transferencias** | Puede tomar días | A menudo minutos | | **Protección** | Salvaguardas legales y seguros | Mayormente autocustodia y riesgo | Ningún sistema es "mejor" en todos los aspectos. Cada uno tiene sus fortalezas y debilidades. 🧠 ## 🌉 Donde se encuentran TradFi y Cripto La línea entre ambos mundos se está volviendo más delgada. 🔄 - 🪙 Grandes firmas financieras ahora ofrecen productos relacionados con cripto. - 🏦 Bancos y administradores de activos están explorando **activos tokenizados**, como versiones en cadena (on-chain) de bonos y fondos. - 💵 Las **monedas estables (stablecoins)** conectan el sistema del dólar con las redes blockchain. - 📱 Muchos inversores ahora tienen tanto acciones como cripto en una misma cartera. Esta mezcla a menudo se llama la **convergencia de TradFi y DeFi**. 🤝 ## 🚀 Consejos para principiantes 1. 📖 **Aprende primero los conceptos básicos.** Entiende cómo funcionan los bancos, las acciones y los bonos. 2. 🎯 **Establece objetivos claros.** Decide si estás ahorrando, invirtiendo o haciendo trading. 3. 🧩 **Diversifica.** No pongas todo en un solo activo. 4. 🛑 **Gestiona el riesgo.** Nunca inviertas dinero que no puedas permitirte perder. 5. 🔎 **Haz tu propia investigación.** Revisa los informes de las empresas y fuentes confiables. 6. 🌱 **Piensa a largo plazo.** La riqueza generalmente se construye a lo largo de los años, no de los días. ## ✅ Conclusión TradFi es la base de la economía global. 🌐 Te brinda estructura, protección legal y estabilidad, razón por la cual es el mejor punto de partida para los principiantes. 📚 Al mismo tiempo, entender cripto y DeFi te da una imagen más completa de hacia dónde se dirigen las finanzas. 🔮 Los inversores más inteligentes aprenden sobre ambos mundos y comienzan por los conceptos básicos. 💡🔥 *⚠️ Descargo de responsabilidad: Este artículo es solo para fines educativos y no constituye asesoramiento financiero.* ## 🏷️ #LaInflaciónEnEUAseDisparaYLasaApuestasDeAumentoDeTasasSuben #BitcoinAlcanzaMinimoDeDosMesesDespuesDeLasEleccionesDeMedioTerminoEnEEUU #La venta masiva de acciones tecnológicas borra 2.5 billones del Nasdaq 100 @jalekhakhatun $BTCUSDT **#TradFiParaPrincipiantes #FinanzasTradicionales #MercadoBursatil #NVDA #CriptoVsTradFi**

🏭 Who Is Reportedly Investing?**
⚠️ **Anthropic's IPO Backers Read Like an AI Supply-Chain Checklist** 🤖 Anthropic's IPO plans are drawing attention, and not only for the size of the offering. The list of reported backers covers nearly every layer of the AI stack. 📊 **🏭 Who Is Reportedly Investing?** According to reports, Google, Nvidia, AMD, Broadcom, Micron, Microsoft and TSMC plan to invest a combined $26B through a private placement at the IPO price. 💰 That puts chipmakers, memory suppliers, cloud providers and a leading foundry on the same cap table. 🧩 **🔗 More Than a Bet on Claude** These companies aren't only backing a product. They are backing a customer. 🛒 As Anthropic grows, it needs more of everything these suppliers sell: - 🧠 **Chips:** GPUs and custom accelerators to train and run models - 💾 **Memory:** High-bandwidth memory for AI workloads - ☁️ **Cloud capacity:** Data center space and compute at scale - 🏗️ **Manufacturing:** Advanced chip fabrication For suppliers, equity in Anthropic is partly a way to secure long-term demand for their own products. 🔄 **💵 The Valuation Question** Anthropic is reportedly targeting an IPO valuation of roughly $1T, or $1.4T on a fully diluted basis. 🚀 That is an enormous number, and it raises the key question for public investors: how much growth is already built into the price? 🤔 **⚖️ Who Gets What?** - 🏢 **Suppliers** get equity and a stake in a fast-growing customer. - 🧪 **Anthropic** gets funding to expand its compute and capacity. - 📈 **Public investors** get to decide how much this relationship is worth. **⚠️ Risks to Consider** Circular financing is a real concern. 🔁 When suppliers invest in a customer who then spends that money back with them, demand can look stronger than it is. Investors should also watch spending commitments, competition, and how the market reacts to such a large valuation. 🔍 **🎯 Final Takeaway** The IPO is a test of how the market values the AI supply chain as a whole, not just one company. Treat reported figures with care until official filings confirm them. 📑 *This is not financial advice. Always do your own research.* 🙏 **:** #AnthropicIPO 🚀 #AIStocks 🤖 #Nvidia 💚 #TechInvesting 📊 #IPONews 🔔 --- #NovUSCPIWatch #Oracle20BFundingPlanTestsTheAITrade #MidtermsMarketWatch #AnthropicIPOTestsTheAIBoom #BOERateDecision

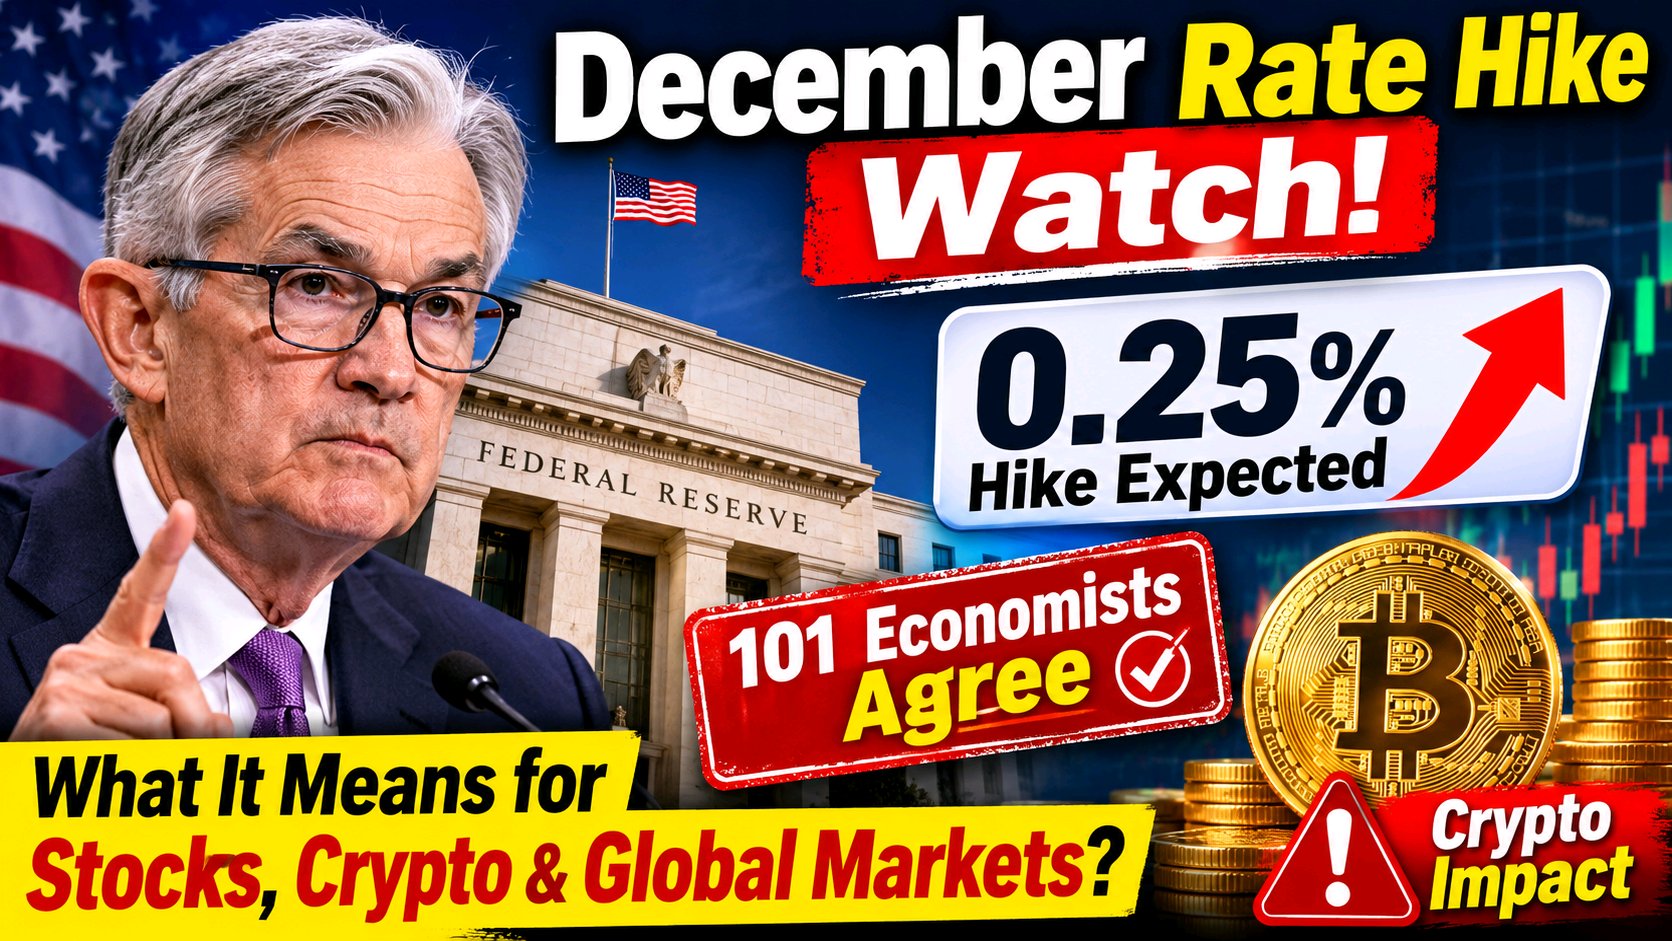
📢 **December Rate Hike Watch:
What 101 Economists Are Telling Global Markets** 📊 According to a Reuters poll of 101 economists, conducted between November 6 and 10, every respondent expects the US Federal Reserve to raise interest rates by 0.25 percentage points in December. A 101-out of-101 consensus is rare in economics, where forecasters usually split between "hike," "hold," and "cut." 🧐 **🏦 What the Poll Suggests** If the Fed follows the forecast, the federal funds rate would move to 4.00%–4.25%. A move of 25 basis points is the Fed's standard step, which tells us economists see a gradual, controlled tightening rather than an emergency response. 📈 **🌍 Why It Matters for Global Markets** The Fed's rate is the benchmark for global borrowing costs, so a hike has ripple effects: - 💵 **US Dollar:** Higher rates usually strengthen the dollar, putting pressure on emerging-market currencies and commodities. - 📉 **Stocks:** Growth and tech stocks tend to be sensitive, because higher rates reduce the present value of future earnings. - 🏠 **Borrowing costs:** Mortgages, business loans, and credit cards all become more expensive. - 🌏 **Emerging economies:** Capital can flow back to the US for safer, higher yields, creating stress elsewhere. **₿ What It Means for Crypto** Crypto has historically been sensitive to liquidity. When rates rise, cash and bonds become more attractive, and risk assets like Bitcoin and altcoins can see outflows or higher volatility. 🎢 Traders often watch these signals: - 🔍 US inflation data (CPI) and the Fed's reaction to it - 🗣️ Fed commentary and the language in meeting statements - 📊 The US Dollar Index (DXY) and Treasury yields - 💰 Bitcoin's reaction to key support and resistance levels Smaller-cap tokens such as $RED, $RARE, and $RIVER can be hit harder in tightening cycles, because they typically have lower liquidity and amplified swings. ⚠️ **🤔 Is the Hike Already Priced In?** This is the key question. When a forecast is nearly unanimous, markets often move in advance, a phenomenon summed up as "buy the rumor, sell the news." 📰 If traders have already positioned for a hike, the actual announcement may cause little reaction, and the real market mover could be the Fed's **forward guidance**: whether it signals more hikes, a pause, or a pivot. 🎯 **⚠️ A Word of Caution** Economists' forecasts are not official Fed decisions. The Fed can change course if inflation cools faster than expected, if jobs data weakens, or if financial conditions tighten sharply. Polls have been wrong before, so smart traders plan for several scenarios rather than one. 🛡️ **✅ Final Takeaway** The poll sends a strong signal, but it is only one input. Manage your risk, avoid over-leveraging around major announcements, and watch the Fed's tone as closely as its numbers. 💡 *This is not financial advice. Always do your own research.* 🙏 **:** #FedRateHike 🏦 #USInflation 📈 #CryptoNews 🪙 #Bitcoin ₿ #FederalReserve 🇺🇸 --- #NovUSCPIWatch #WSOTPicktoEarn10U #WSOT2026 #USPayrollsAndRateDecisionsDriveMacroWeek #OilVolatilityTracksIranPeaceTalks @jalekhakhatun $ETHUSDT $BTCUSDT
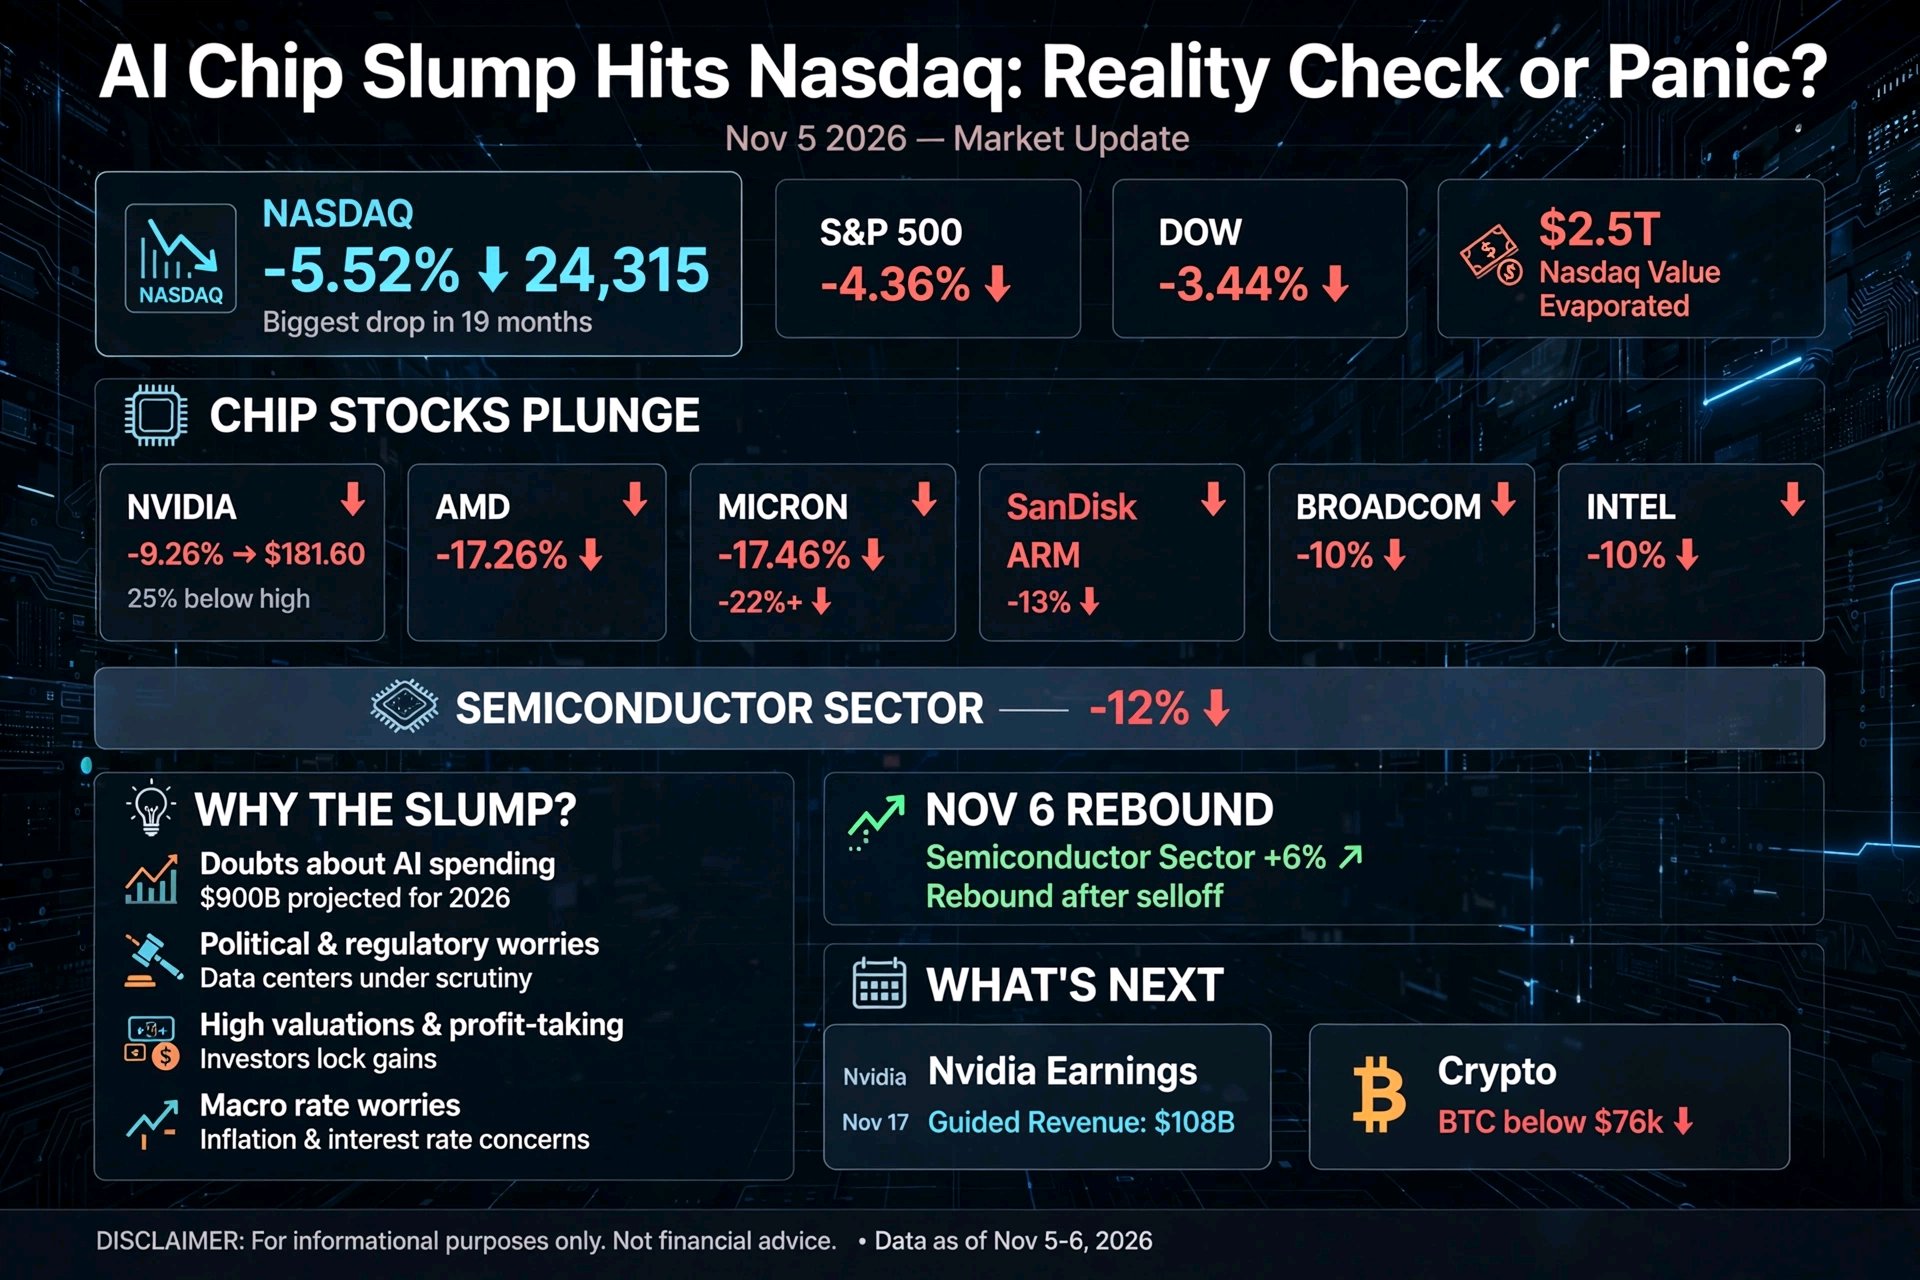
AI Chip Slump Hits the Nasdaq
: Reality Check or Panic? 🚨 The Day Wall Street Flinched On Thursday, November 5, 2026, the Nasdaq Composite fell 5.52% to 24,315, its biggest daily drop in 19 months. 😱 The S&P 500 fell 4.36% and the Dow fell 3.44%. The sell-off pushed the Nasdaq into correction territory, more than 10% below its peak. 📉 Reuters estimated roughly $2.5 trillion in Nasdaq market value evaporated in a single session. 💸 🔥 Chip Stocks Led the Fall The damage was heaviest in AI and semiconductor names: 👇 🟢➡️🔴 Nvidia: −9.26% to $181.60, about 25% below its 52-week high 🔻 AMD: −17.26% 🔻 Micron: −17.46% 🔻 SanDisk: over −22% 🔻 Arm: −13%, Broadcom: −10%, Intel: −10% The semiconductor sector fell about 12% in a day, one of its worst sell-offs in years. 😳 🧠 Why Did It Happen? 💰 1. Doubts About AI Spending Investors questioned the pace, cost and financing of the AI boom. 🏗️ One analysis noted that JPMorgan expects about $900 billion of AI spending worldwide in 2026, and investors want to know when that money pays back. 🤔 🏛️ 2. Political and Regulatory Worries Some coverage linked the fall to worries about US data-center policies after the midterm elections. 🗳️ One outlet argued the market was pricing political risk on land, energy and permits for AI infrastructure, not just on valuations. ⚡ 📊 3. High Valuations and Profit-Taking Stocks had run up for months, so even small bad news could trigger heavy selling. 🎢 Analysts say investors want clear proof of long-term profits before paying today's prices. 🧾 🏦 4. Macro Pressure Rate worries remain in the background, with markets watching the Fed and today's CPI report. 📅 That makes expensive growth stocks more sensitive to bad news. ⚠️ 🔄 The Partial Rebound The next day, November 6, chip stocks bounced. 📈 The broader semiconductor index rose over 6%, and AMD, Intel and Micron were up roughly 7% to 13%. A Jefferies strategist called the sell-off reactionary, not a fundamental reset, according to Reuters. 🧐 But analysts warned that volatility may continue, and a bounce is not a verdict. 🎯 ⚠️ A Reality Check One report stressed that these moves reflect a repricing of share prices, not cash leaving company bank accounts or a collapse in chip shipments or data-center orders. 📌 So this looks like a valuation reset, not proof that AI demand has vanished. Still, if spending flattens, comparisons with the 2022 chip slump may return. 😬 🗓️ The Next Big Test: Nvidia Earnings Nvidia reports on Tuesday, November 17. 📣 It guided revenue to about $108 billion this quarter. Markets will watch for strong results and confident guidance. A beat may calm nerves, while a miss could deepen the slump. 🎯 ₿ What This Means for Crypto ($BTC $SOL $ARB) Crypto has been trading closely with tech lately. 🔗 Bitcoin slid below $76,000 around the sell-off, so it offered no safe haven. 😬 In general, altcoins like SOL and ARB tend to move harder than BTC in both directions, so a weak Nasdaq can hit them more. ⚖️ If tech stabilizes, crypto may find relief, but if the AI sell-off returns, expect more volatility. 🎢 🧭 What Traders Can Do 📌 Avoid panic and FOMO. Wild swings trap both buyers and sellers. 🪤 📌 Watch key dates. Today's CPI and Nvidia's November 17 earnings can move markets. 📅 📌 Spread entries. Don't go all-in on one day's move. 🪜 📌 Mind leverage. Fast drops can liquidate over-leveraged positions. 🛡️ 📌 Follow the proof. Earnings and spending data matter more than headlines. 🔍 🎯 Final Thought The AI boom is moving from hype to proof. 💡 Big winners can fall fast when expectations are high, and rebounds can be just as sharp. Whether this is a healthy reset or the start of something bigger, the next few weeks will tell. 🌍 #Oracle20BFundingPlanTestsTheAITrade #MidtermsMarketWatch #BOERateDecision #AnthropicIPOTestsTheAIBoom #OilVolatilityTracksIranPeaceTalks $BTCUSDT @jalekhakhatun
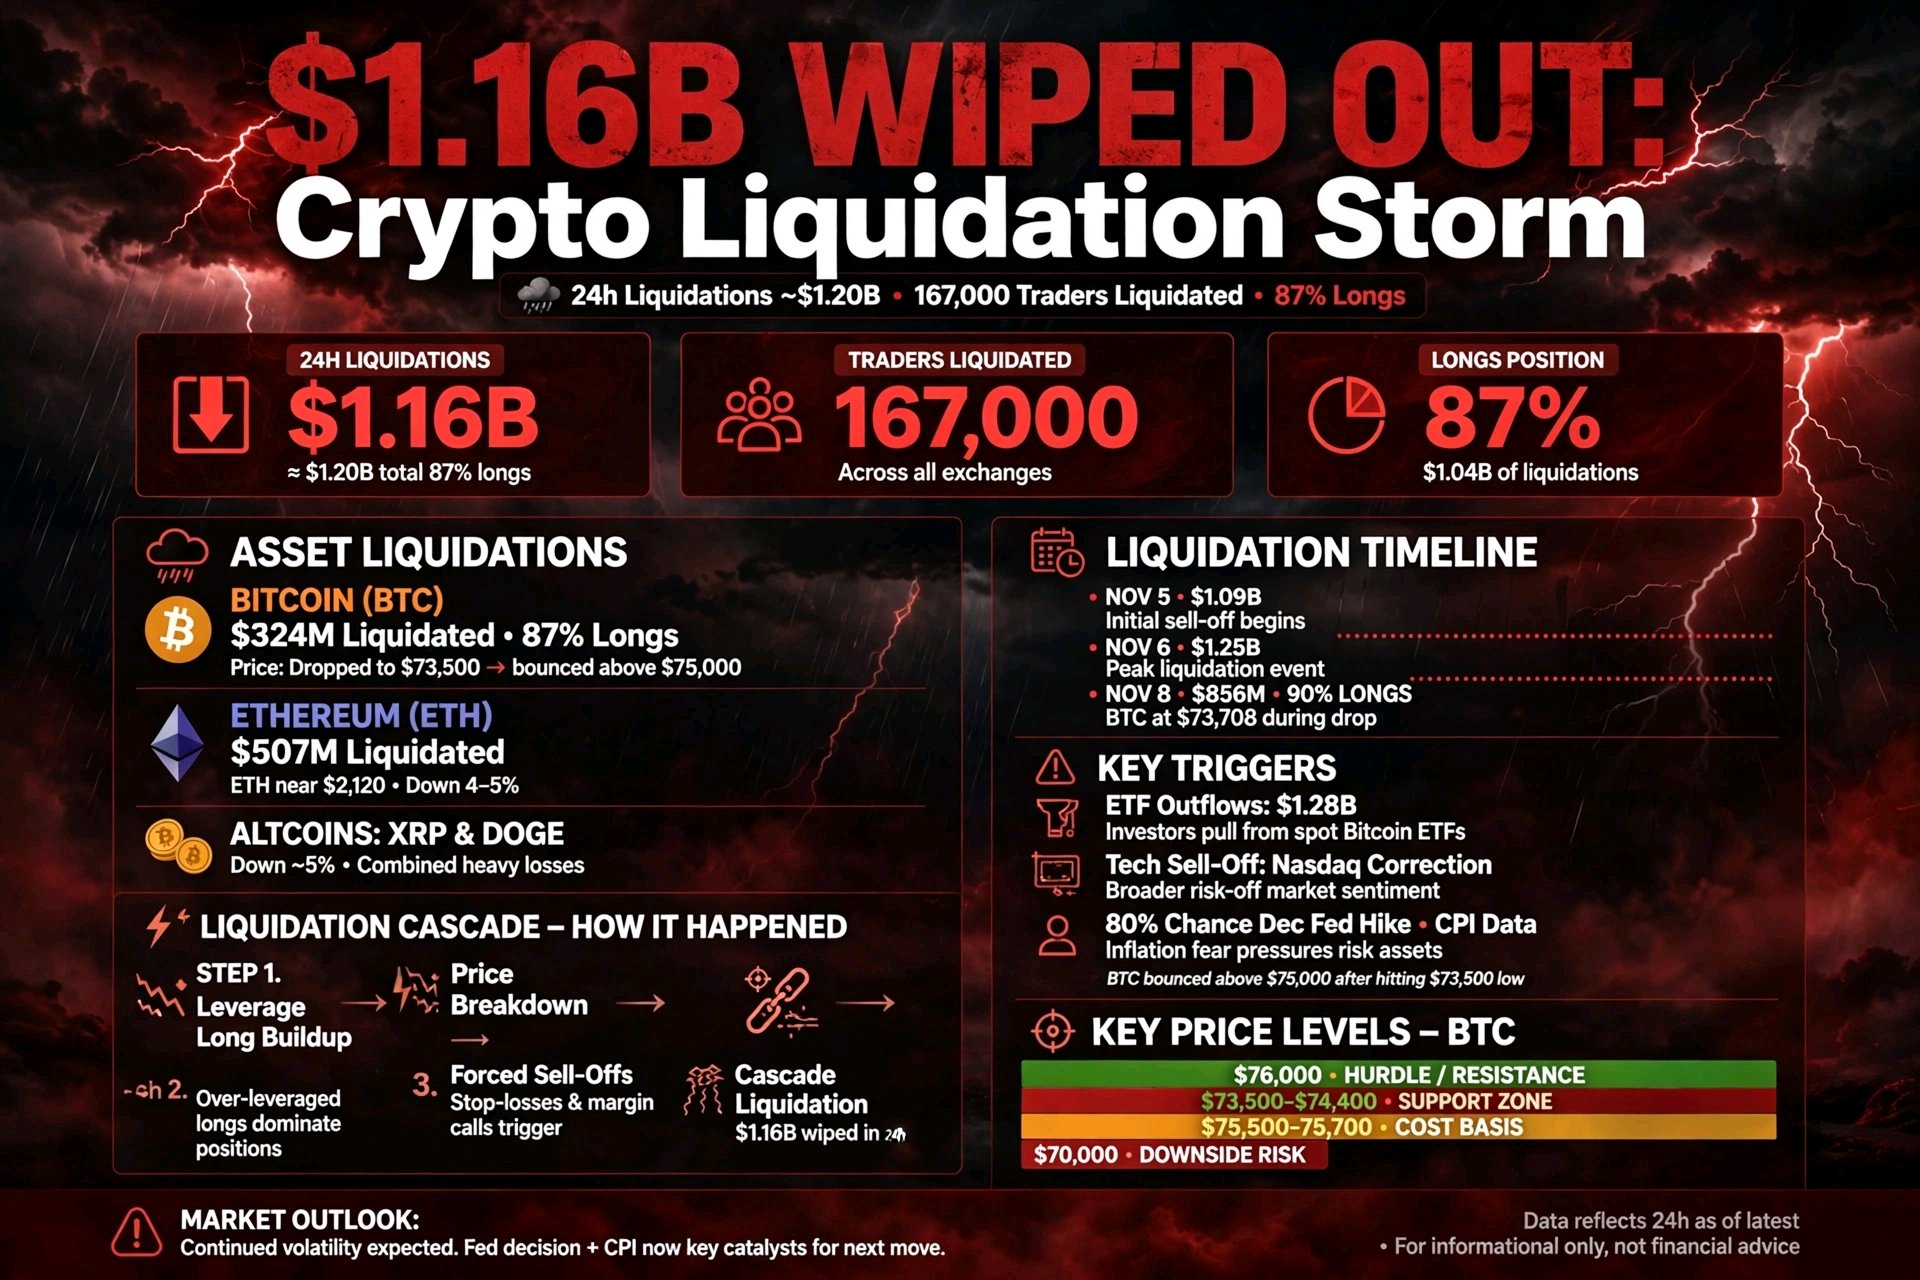
1.16 Billion Wiped Out:
Crypto's Liquidation Storm Hits Leveraged Traders ⚡🩸 🚨 A Brutal 24 Hours The crypto market just delivered a painful lesson in leverage. 😬 Within 24 hours, more than $1 billion in leveraged positions were wiped out. Coinglass data showed about $1.2 billion in liquidations, and $1.04 billion of that came from long positions, meaning bets on higher prices. 📉 Roughly 167,000 traders were liquidated. 😱 ⚙️ What Is a Liquidation? A quick refresher for newer traders. 👇 When you trade with leverage, you borrow to open a bigger position. If the price moves against you and your collateral can no longer cover the loss, the exchange automatically closes your trade. That forced selling can push prices down further, which triggers more liquidations. This chain reaction is called a liquidation cascade. 🌊 📊 Who Got Hit Hardest? ₿ Bitcoin: about $324 million liquidated, nearly 87% of it longs. BTC briefly dropped to about $73,500 before bouncing above $75,000. Ξ Ethereum: over $507 million liquidated, more than Bitcoin. ETH is trading near $2,120 and fell about 4–5% on the day. 🔻 Other majors: XRP, Dogecoin and others also dropped about 5%. The pain was one-sided. 🎯 Longs were crushed while shorts barely mattered. That tells us traders were heavily positioned for a bounce that never came. 🪤 📅 This Is Not the First Wave This week has been rough. 😮💨 📆 November 5: about $1.09 billion liquidated, as Bitcoin fell roughly 6% from above $80,000 to about $75,700. 📆 November 6: about $1.25 billion liquidated. 📆 November 8: about $856 million liquidated, about 90% longs, as Bitcoin hit $73,708, its lowest since August. 📆 Now: another $1B+ wave. Repeated flushes show that over-leveraged longs keep getting cleared out. 🧹 🧠 What Triggered the Selling? 🏦 1. Heavy ETF Outflows US spot Bitcoin ETFs lost $1.28 billion last week, their worst week since late June. 📤 That removed a major source of steady buying. 📉 2. Tech Stock Sell-Off A sharp AI and chip-stock sell-off pushed the Nasdaq into correction territory, and crypto has been trading like a high-risk tech asset. 🤖⛈️ 🗳️ 3. Macro and Political Pressure Traders are also pricing in rate worries. Markets see roughly an 80% chance of a December Fed rate hike, so today's CPI report could shake things again. 📊⚠️ 🔓 4. Exchange Security Worries One report mentioned a Binance hack among the pressures on sentiment. I couldn't verify details, so treat that with caution until Binance or other reliable sources confirm what happened. 🔍 🔍 Key Levels Traders Are Watching 📍 $73,500–$74,400: recent lows and weekly support. 📍 ~$75,500–$75,700: short-term holder cost basis and Strategy's average buy price. Bitcoin is trading just below it, so many recent buyers are underwater. 😬 📍 ~$76,000: the first upside hurdle. 📍 ~$70,000: a level some analysts flagged as a downside target if support fails. 🔻 ⚖️ Is This Bullish or Bearish? Both views exist. 🤔 🐂 Bull case: Big liquidation flushes can clear excess leverage and help set a bottom. 🐻 Bear case: ETF outflows, weak equities and rate-hike risk could keep pressure on prices. Remember that a liquidation event shows the damage already done. It does not tell you what comes next. 🎯 🛡️ Lessons for Traders 📌 Respect leverage. High leverage turns normal swings into account-killers. 💀 📌 Use stop-losses and small sizes. Never risk more than you can lose. 🧯 📌 Avoid chasing. Don't buy every dip or short every bounce blindly. 🪤 #Oracle20BFundingPlanTestsTheAITrade #MidtermsMarketWatch #BOERateDecision #AnthropicIPOTestsTheAIBoom #OilVolatilityTracksIranPeaceTalks $BTCUSDT @jalekhakhatun
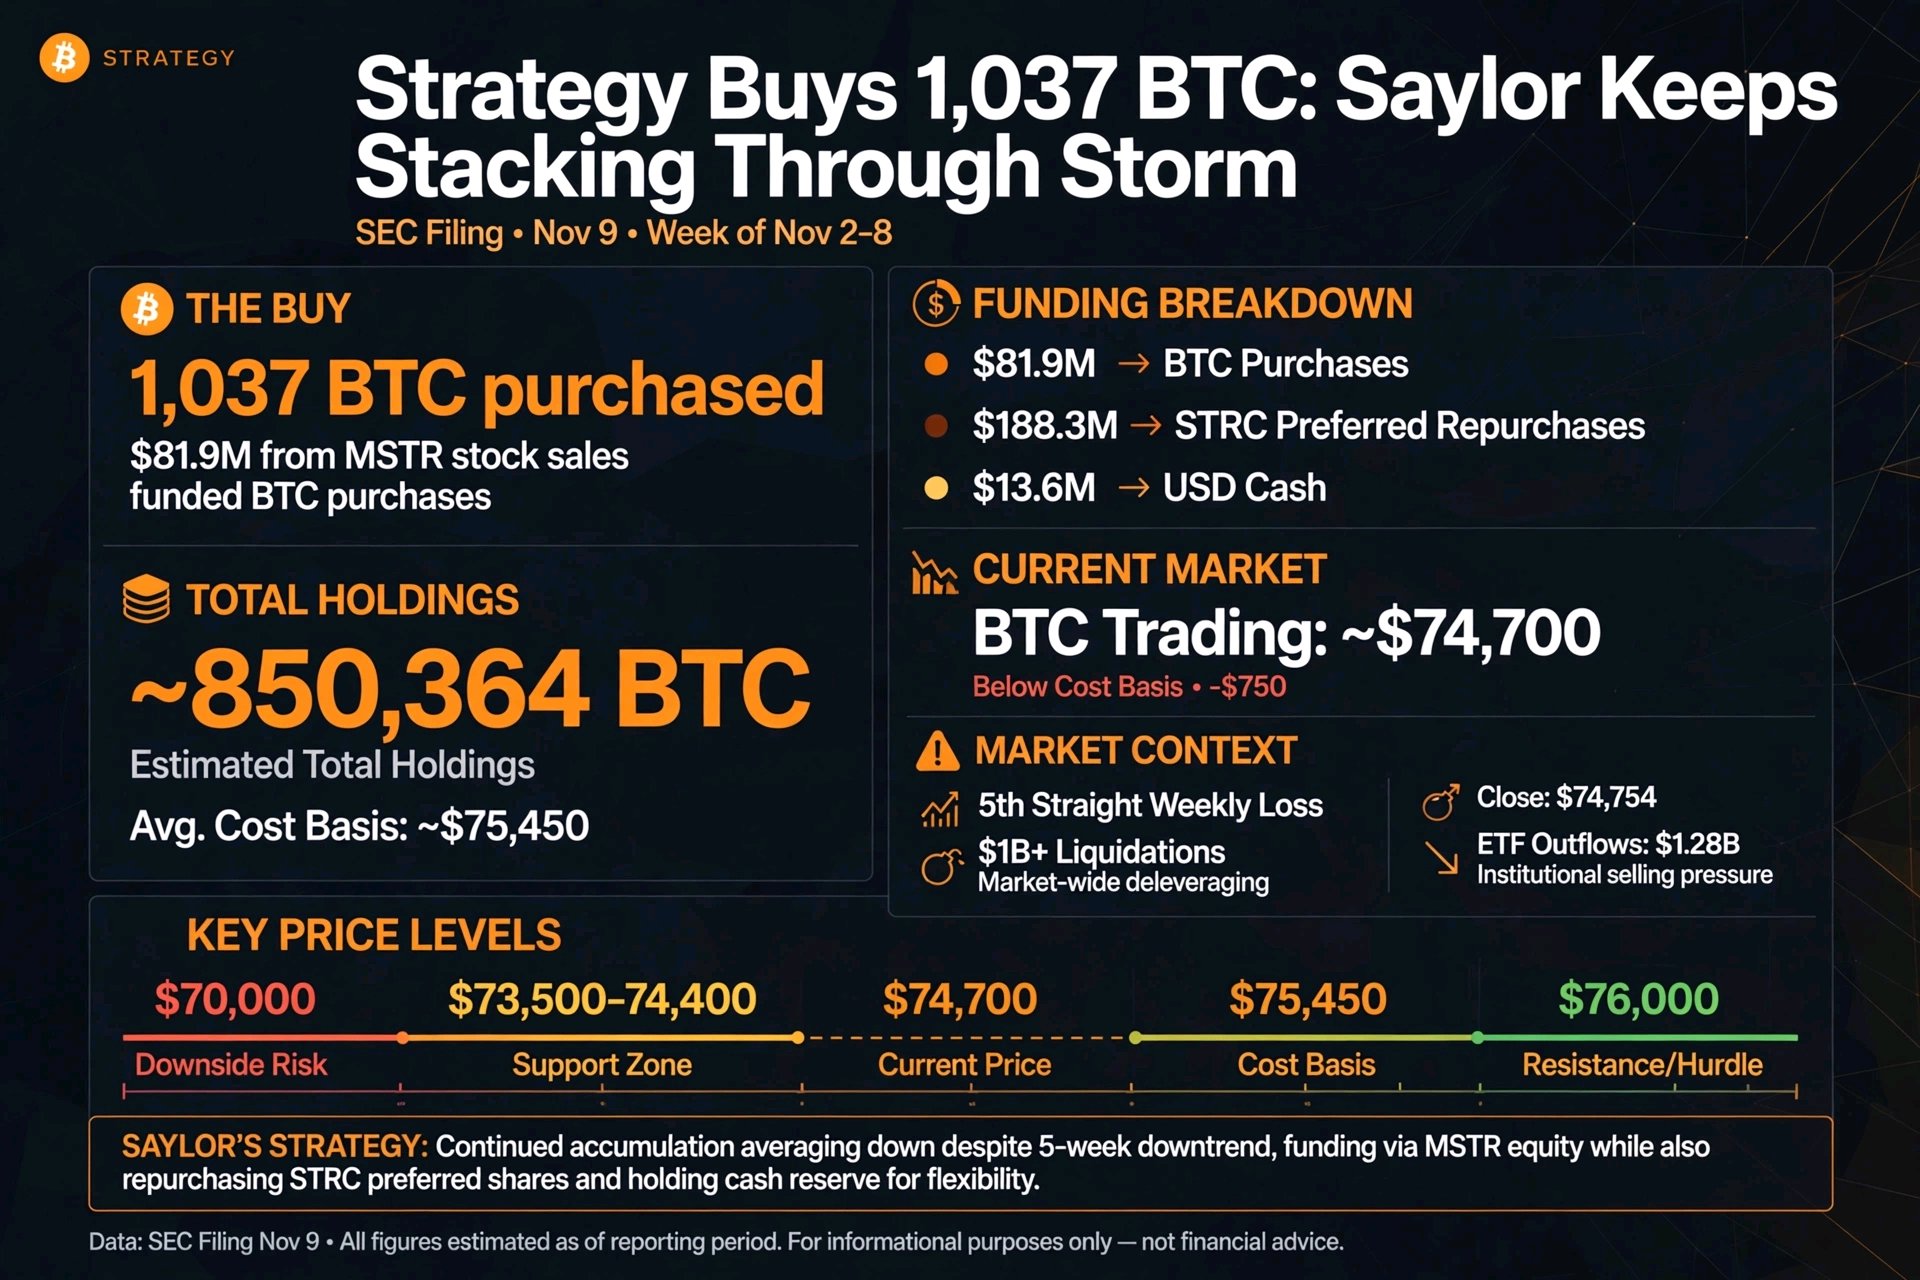
Strategy Buys 1,037 BTC:
Saylor Keeps Stacking Through the Storm ⚡₿ 📰 The Headline Strategy (MSTR), the world's largest corporate bitcoin holder, added about 1,037 BTC last week. 🏢 Its SEC filing dated November 9 covers November 2 to November 8 and shows that $81.9 million from MSTR stock sales went into bitcoin purchases. 💰 The buy was modest in size, but the timing is the story. 👇 🩸 Buying Into Weakness That same week, Bitcoin posted its fifth straight weekly loss, closing near $74,754. 📉 Over $1 billion in leveraged positions were liquidated, and US spot Bitcoin ETFs bled $1.28 billion in outflows. 😬 While many investors were selling, Strategy was still buying. 🛒 📊 Where Its Holdings Stand 🏦 848,517 BTC as of October 25, according to its Q3 report 🏦 849,327 BTC as of November 1, per its November 2 update, bought at an average of about $75,451 🧮 Adding 1,037 BTC implies about 850,364 BTC (my estimate) 🧮 The average cost basis stays near $75,450–$75,460 (my estimate) Bitcoin is trading around $74,700, which is slightly below Strategy's average cost. 😮 That means its stack is roughly breakeven to a little underwater right now, though the loss is small compared with the size of the holding. ⚖️ 🔍 The Interesting Detail: Not All the Money Went to Bitcoin This is the part many headlines miss. 🧐 Of the MSTR stock proceeds that week: ₿ $81.9 million funded bitcoin purchases 🔄 $188.3 million funded repurchases of STRC preferred stock 💵 $13.6 million went to USD cash So more than twice as much went to buying back STRC as to buying bitcoin. 🤔 That shows Strategy is managing its capital structure and dividend-paying products, not just maximizing BTC purchases. 🏗️ 📅 A Changing Playbook in 2026 Strategy's approach has evolved this year. 📈 🚀 It grew holdings about 26% year-to-date through October 25 and raised about $21 billion in equity in 2026, according to its Q3 report. 🔁 It set up a "BTC Monetization Program" and sold some bitcoin earlier this year to fund repurchases of its preferred stock. 💳 It leans heavily on its STRC "digital credit" product, which moved to daily dividends starting November 1. 🗣️ Leadership has said it believes we're at the beginning of the next bitcoin bull market. 🤔 Why Should Traders Care? 🐂 The Bullish View A big, persistent buyer can support sentiment during a sell-off. 💪 Strategy's continued purchases signal conviction, even if the size is smaller than in past weeks. 🧡 🐻 The Bearish View 📉 Bitcoin trading near or below Strategy's cost basis raises questions about pressure on the company. 😬 🏦 Heavy reliance on equity and preferred markets means its buying depends on investor demand for its securities, which can weaken when markets fall. ⚠️ 🔢 1,037 BTC is small against ETF outflows and heavy liquidations, so it won't reverse the trend alone. 🌊 🔑 Levels to Watch 📍 ~$75,450: Strategy's approximate average cost, a closely watched line for sentiment. 📍 $73,500–$74,400: recent lows and support. 📍 ~$76,000: the first upside hurdle. 📍 ~$70,000: a downside level analysts flagged if support breaks. 🔻 🗓️ What's Next Today's US CPI report (8:30 AM ET) and Nvidia's November 17 earnings can move risk assets. 📅 Strategy's next weekly filing, usually on Mondays, will show whether it keeps buying or shifts more money to its preferred stock. 👀 #NovUSCPIWatch #Oracle20BFundingPlanTestsTheAITrade #AnthropicIPOTestsTheAIBoom #MidtermsMarketWatch #BybitAIEvolving $BTCUSDT @jalekhakhatun
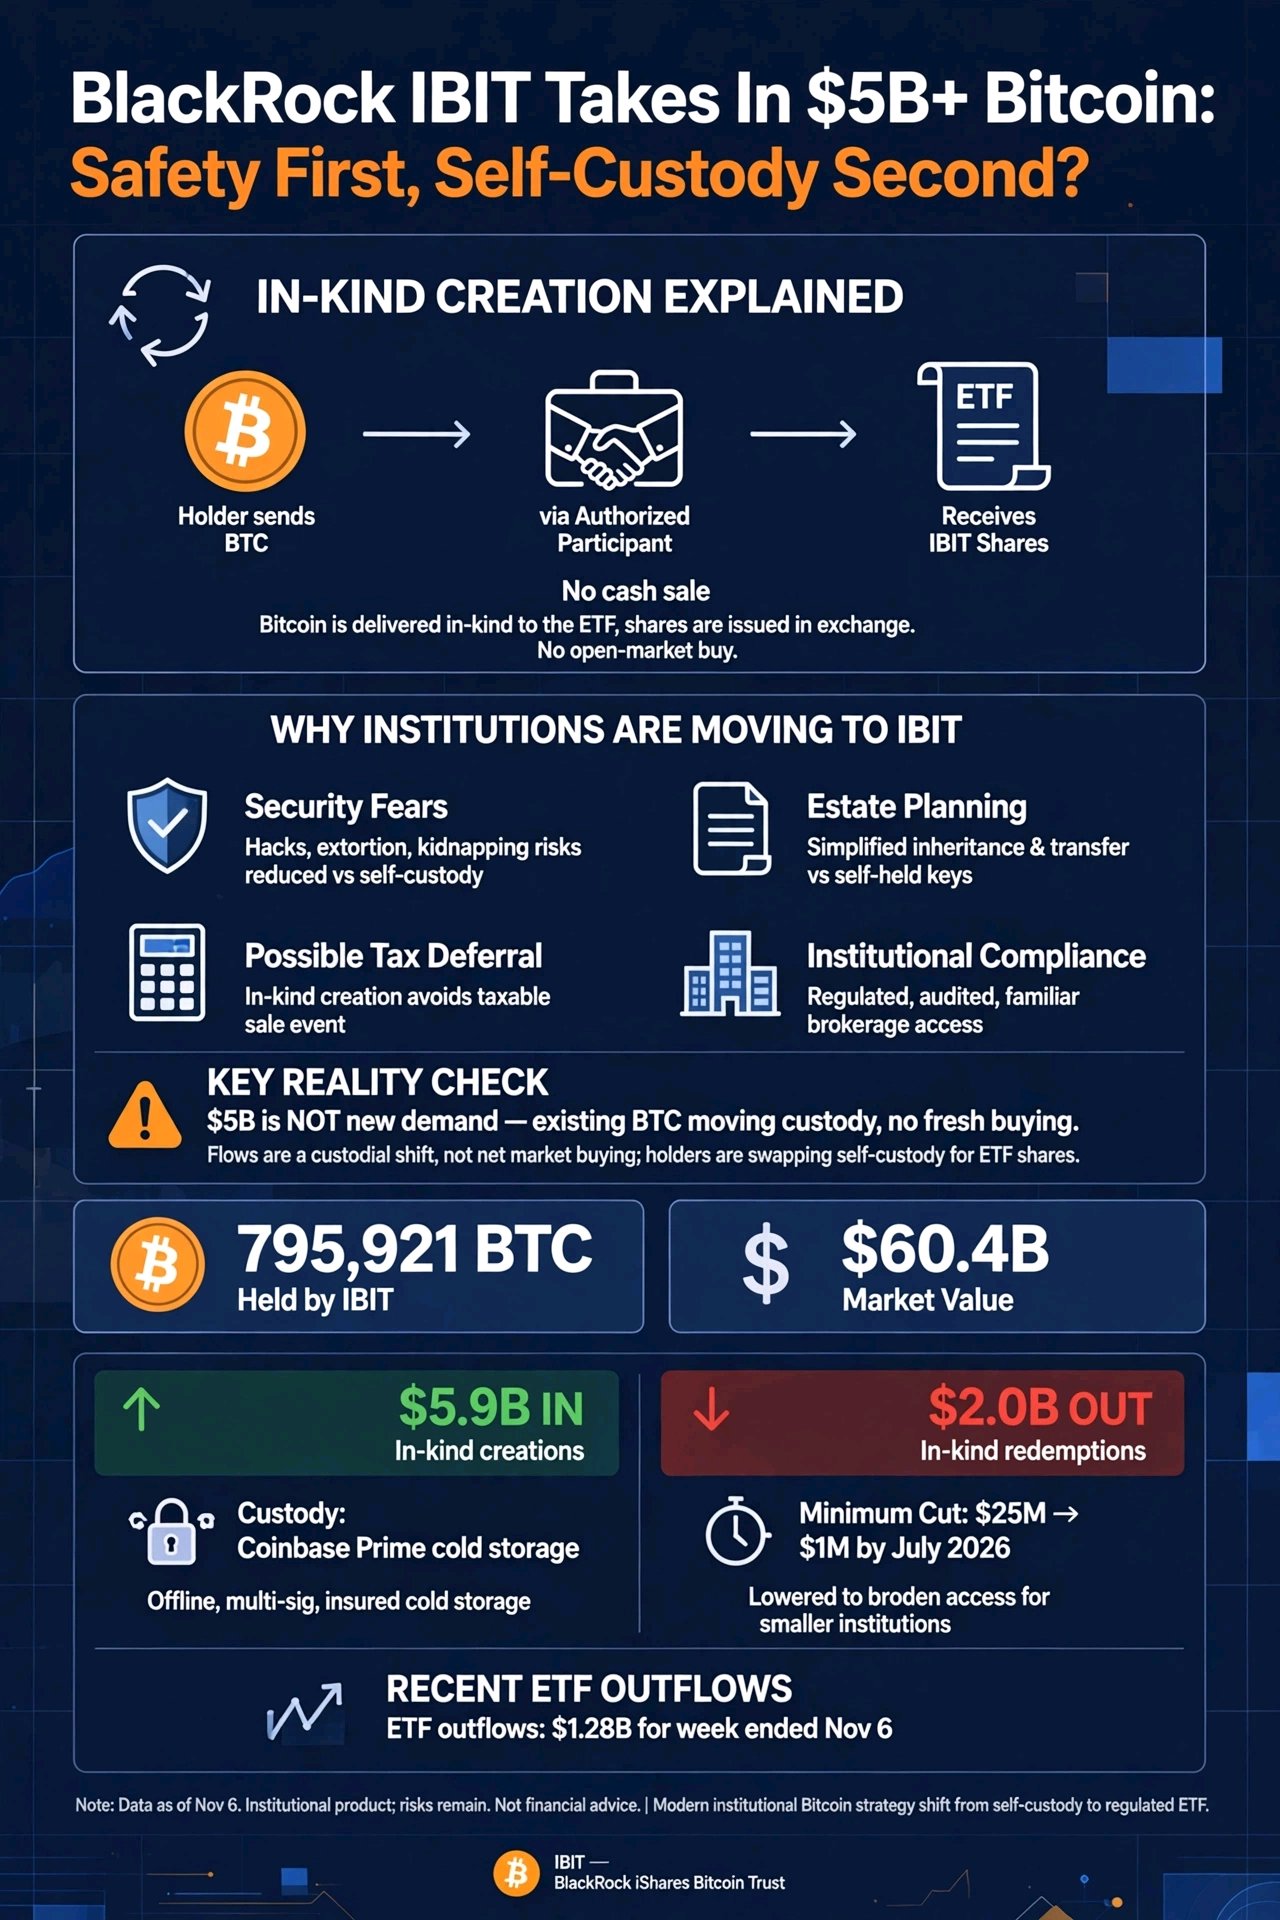
Safety First, Self-Custody Second? 🔐
BlackRock's IBIT Takes In $5B+ of Holders' Bitcoin: 📰 The Headline Big bitcoin holders have swapped more than $5 billion worth of coins for shares of BlackRock's iShares Bitcoin Trust (IBIT). 😮 BlackRock's head of digital assets, Robbie Mitchnick, said the volume has grown from over $3 billion in October 2025. 📈 The story is attracting attention again because it was re-reported on November 9, right as Bitcoin struggles near $75,000. 👀 🔄 How Does the Swap Work? It's called an in-kind creation. 🧩 🪙 A holder sends bitcoin to the fund through an authorized participant. 📄 They receive newly created IBIT shares in return. 🚫 They never sell the BTC for cash. US regulators approved in-kind creations and redemptions for crypto ETFs in July 2025. 🏛️ BlackRock then cut the minimum conversion size from $25 million to $1 million in July 2026, opening the door to many more holders. 🚪 🔐 Why Are Holders Doing It? 😨 1. Security Fears BlackRock says concerns about hacks, extortion, kidnappings and custody failures are driving the move. 🛡️ Large self-custody holders can become targets, and some prefer to hand that risk to an institution. 🏢 📜 2. Easier Estate Planning Passing on ETF shares can be simpler than passing on private keys. 👨👩👧 Reports also cite this as a motivation. 💰 3. Possible Tax Deferral Because the coins are exchanged instead of sold, the swap may defer an immediate capital-gains bill in many cases. ⚖️ But tax treatment depends on each person's situation and IRS guidance isn't definitive, so holders should check with a tax professional. 🧾 ⚠️ The Key Reality Check This is the part many headlines skip. 👇 The $5 billion is not new demand. 🙅 It is existing Bitcoin moving from private wallets into a regulated structure. No fresh cash enters the market, and the price doesn't get new buying pressure from these swaps. 📉 That matters right now because US spot Bitcoin ETFs just lost $1.28 billion in the week ended November 6, and they are negative for 2026 overall. 😬 📊 IBIT by the Numbers 🏦 795,921 BTC held as of November 6, worth about $60.4 billion 🏦 About 801,033 BTC at the end of September, per its 10-Q filing 📥 In Q3, IBIT recorded about $5.9 billion of bitcoin received in-kind for share creations 📤 It also paid out about $2.0 billion in-kind for redemptions 🧮 Holdings fell by roughly 5,100 BTC between September 30 and November 6 (my arithmetic), consistent with recent ETF outflows ❄️ Custody sits with a Coinbase Prime affiliate in cold storage Barron's put the volume BlackRock has seen at $3.6 billion and noted the true figure could be higher, since BlackRock doesn't process every conversion itself. 🧐 So the exact total depends on the source. 🤔 Is This Good or Bad for Bitcoin? 🐂 The Bullish View 🏛️ Institutions are becoming the home for large Bitcoin holdings. 🔒 Better custody may attract cautious investors. 🌍 It shows wealthy holders trust Wall Street rails. 🐻 The Bearish and Cautionary View 🎯 Concentration risk: more coins sit with one big custody chain. ⚠️ 🧬 It cuts against Bitcoin's self-sovereign ethos of holding your own keys. 🔑 🚫 No new buying power enters the market. 📉 🔄 Coins can come back out through redemptions, as the data above shows. 🔁 🔑 What Traders Should Watch 📍 ETF flows: cash inflows and outflows matter more for price than in-kind swaps. 📊 📍 Key levels: $73,500–$74,400 support and about $75,500 resistance. 🎯 📍 Today's CPI: it can shift rate expectations and move risk assets. 📅 📍 IBIT holdings: a steady decline would suggest institutional demand is cooling. 👀 🎯 Final Thought BlackRock's $5 billion milestone shows how much Bitcoin custody is moving toward Wall Street. 🏦 But custody shifts are not the same as fresh demand. For Bitcoin's price, the real signals remain ETF flows, the Fed and market risk appetite. 🧠🌍 #NovUSCPIWatch #USPayrollsAndRateDecisionsDriveMacroWeek #OilVolatilityTracksIranPeaceTalks #BybitAIEvolving @jalekhakhatun
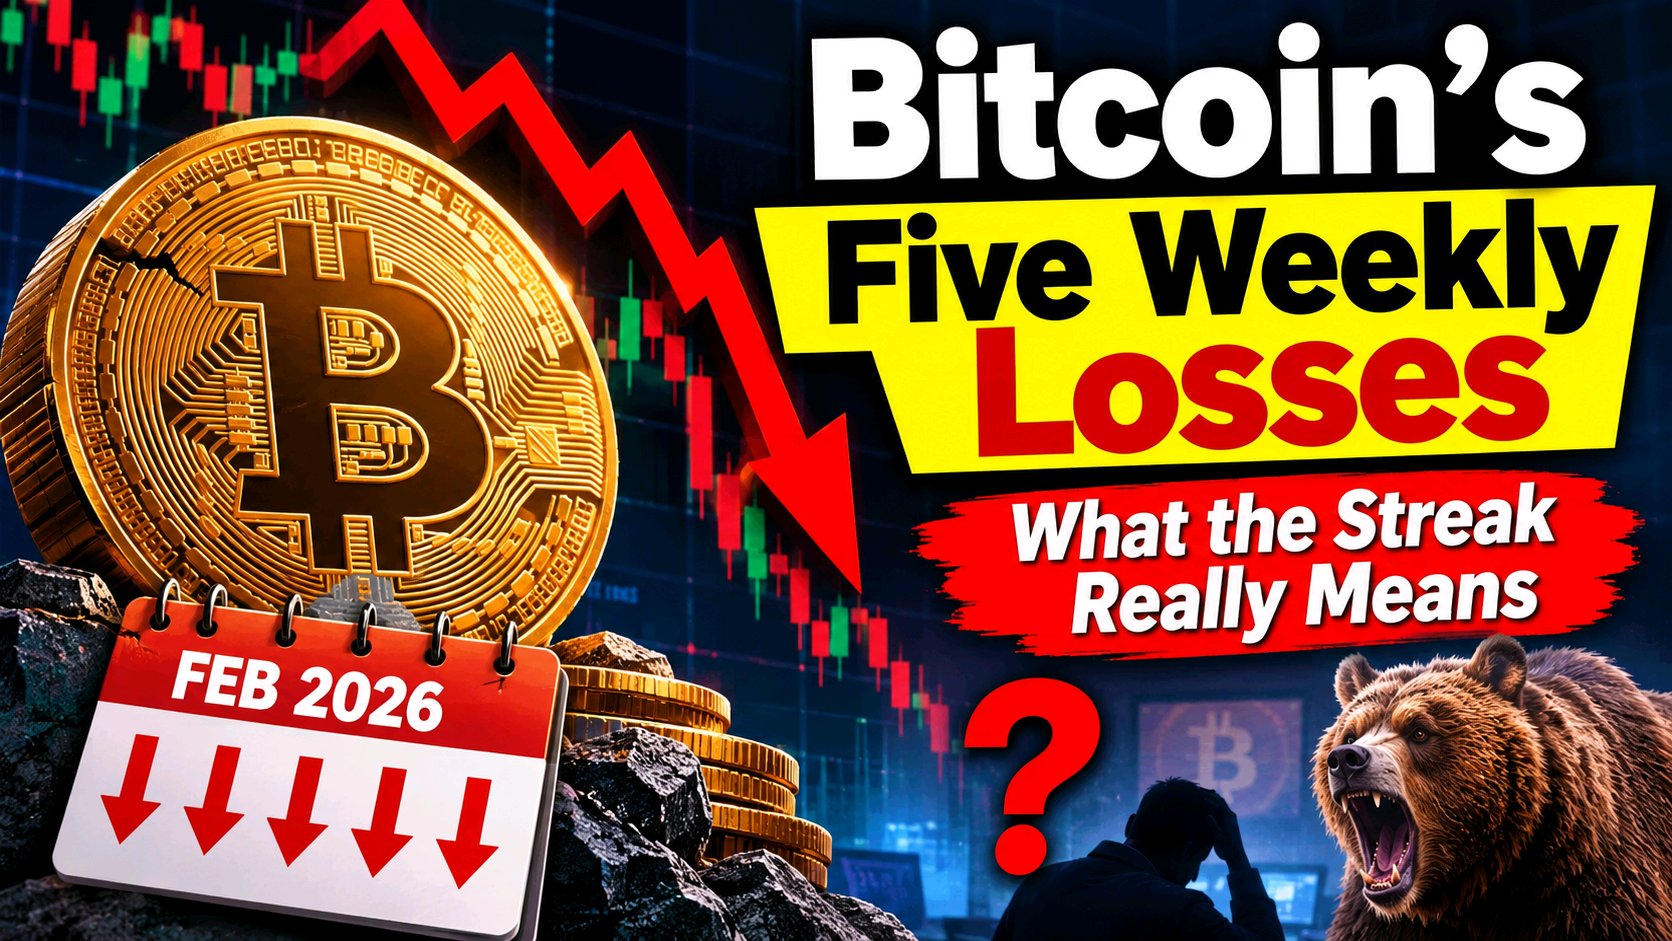
Bitcoin's Five Weekly Losses
: What the Streak Really Means 🪙 🔍 Introduction In crypto, a single red candle rarely causes panic. A string of them is different. When Bitcoin closed five consecutive weekly candles in the red, traders around the world started asking the same question: is this a healthy pause or the start of something deeper? 🤔 Bitcoin was on track for its fifth straight weekly decline in February 2026, the first streak of this kind since March to May 2022. That alone made it a headline event. Let's look at what happened, why it matters, and what traders can learn from it. 💡 (publish0x) 📊 What Exactly Happened? A weekly losing streak means Bitcoin closed lower than it opened for several weeks in a row. Five in a row is rare. Bitcoin had already posted its fourth consecutive weekly loss in mid-February 2026 and struggled to find direction after a weekend rally fizzled. One more red week then completed the five. 😬 (Bloomberg) The pain was not limited to weekly charts. Bitcoin also recorded five consecutive monthly declines by the end of February 2026, a first in its history, with February alone down about 14.8%. Weekly and monthly weakness together showed that the pressure was broad, not a short-term blip. 📆 (mexc) 🧠 Why Did Bitcoin Keep Falling? No single reason explains a streak like this. Several forces tend to stack up: 🌍 Macro pressure: When investors move into risk-off mode, speculative assets like crypto are often sold first. 💸 Realized losses: Roughly $8.7 billion in Bitcoin losses were realized in a single week, the second-largest loss event on record after the Three Arrows Capital collapse. That shows how many holders gave up and sold. (publish0x) 📉 Falling volume: Trading volume dropped about 61% week over week during the worst of the selloff. Thin volume means fewer buyers are willing to step in. (publish0x) 😨 Weak sentiment: After a big rally, confidence turns to fear quickly once support levels break. 🕰️ How Does This Compare to History? Five weeks is painful, but it is not the worst Bitcoin has seen. 🐻 In 2022, Bitcoin had a much longer run of weekly losses. Some reports count nine consecutive weeks between March and May. (mexc) 📅 In 2021, a five-week losing streak from May to June cut the price roughly in half, from about $58,000 to about $29,000. That was a 50% correction. (pages) 🐂 Streaks also happen in bull markets. Bitcoin has had multi-week losing streaks during every bull market in its history. (pages) So a streak by itself does not prove a bear market. What matters is what the price does next, and how deep the drop goes. 🧩 🎯 What Did Analysts Watch? During the decline, traders focused on key levels. Bitcoin was trading below $67,000 and was down about 50% from its peak. Some technical analysts pointed to the $50,000 to $56,000 zone as a possible target based on larger weekly and monthly patterns. Others noted that Bitcoin has bounced from deep drawdowns before. 🔄 (publish0x) Another point from the analysis: shrinking weekly losses can signal that sellers are running out, which is often a precondition for a reversal. In other words, if each red week is smaller than the last, the selling pressure may be fading. 🌱 (pages) 🛡️ Lessons for Traders and Investors 🧘 Stay calm. Emotional selling at the lows is how most people lose money. 📏 Use risk management. Position size and stop-losses matter more in a downtrend than any prediction. 🗓️ Think in time frames. A weekly streak tells you about the medium term, not tomorrow's move. 🔎 Watch volume and levels. A bounce on weak volume is less trustworthy than one with strong buying. 💰 Avoid leverage. Streaks like this are when over-leveraged traders get liquidated first. 🔮 What Comes Next? Nobody can say for sure. A losing streak can end with a sharp rebound, or it can be one chapter of a longer slide. 🎢 The reasonable approach is to track the weekly close, key support and resistance, and the broader macro picture, rather than bet on a single outcome. #NovUSCPIWatch #WSOT2026 #USPayrollsAndRateDecisionsDriveMacroWeek @jalekhakhatun