Sambojr10
2481Me gusta0Compartir en el chat51Aficionados48Seguir
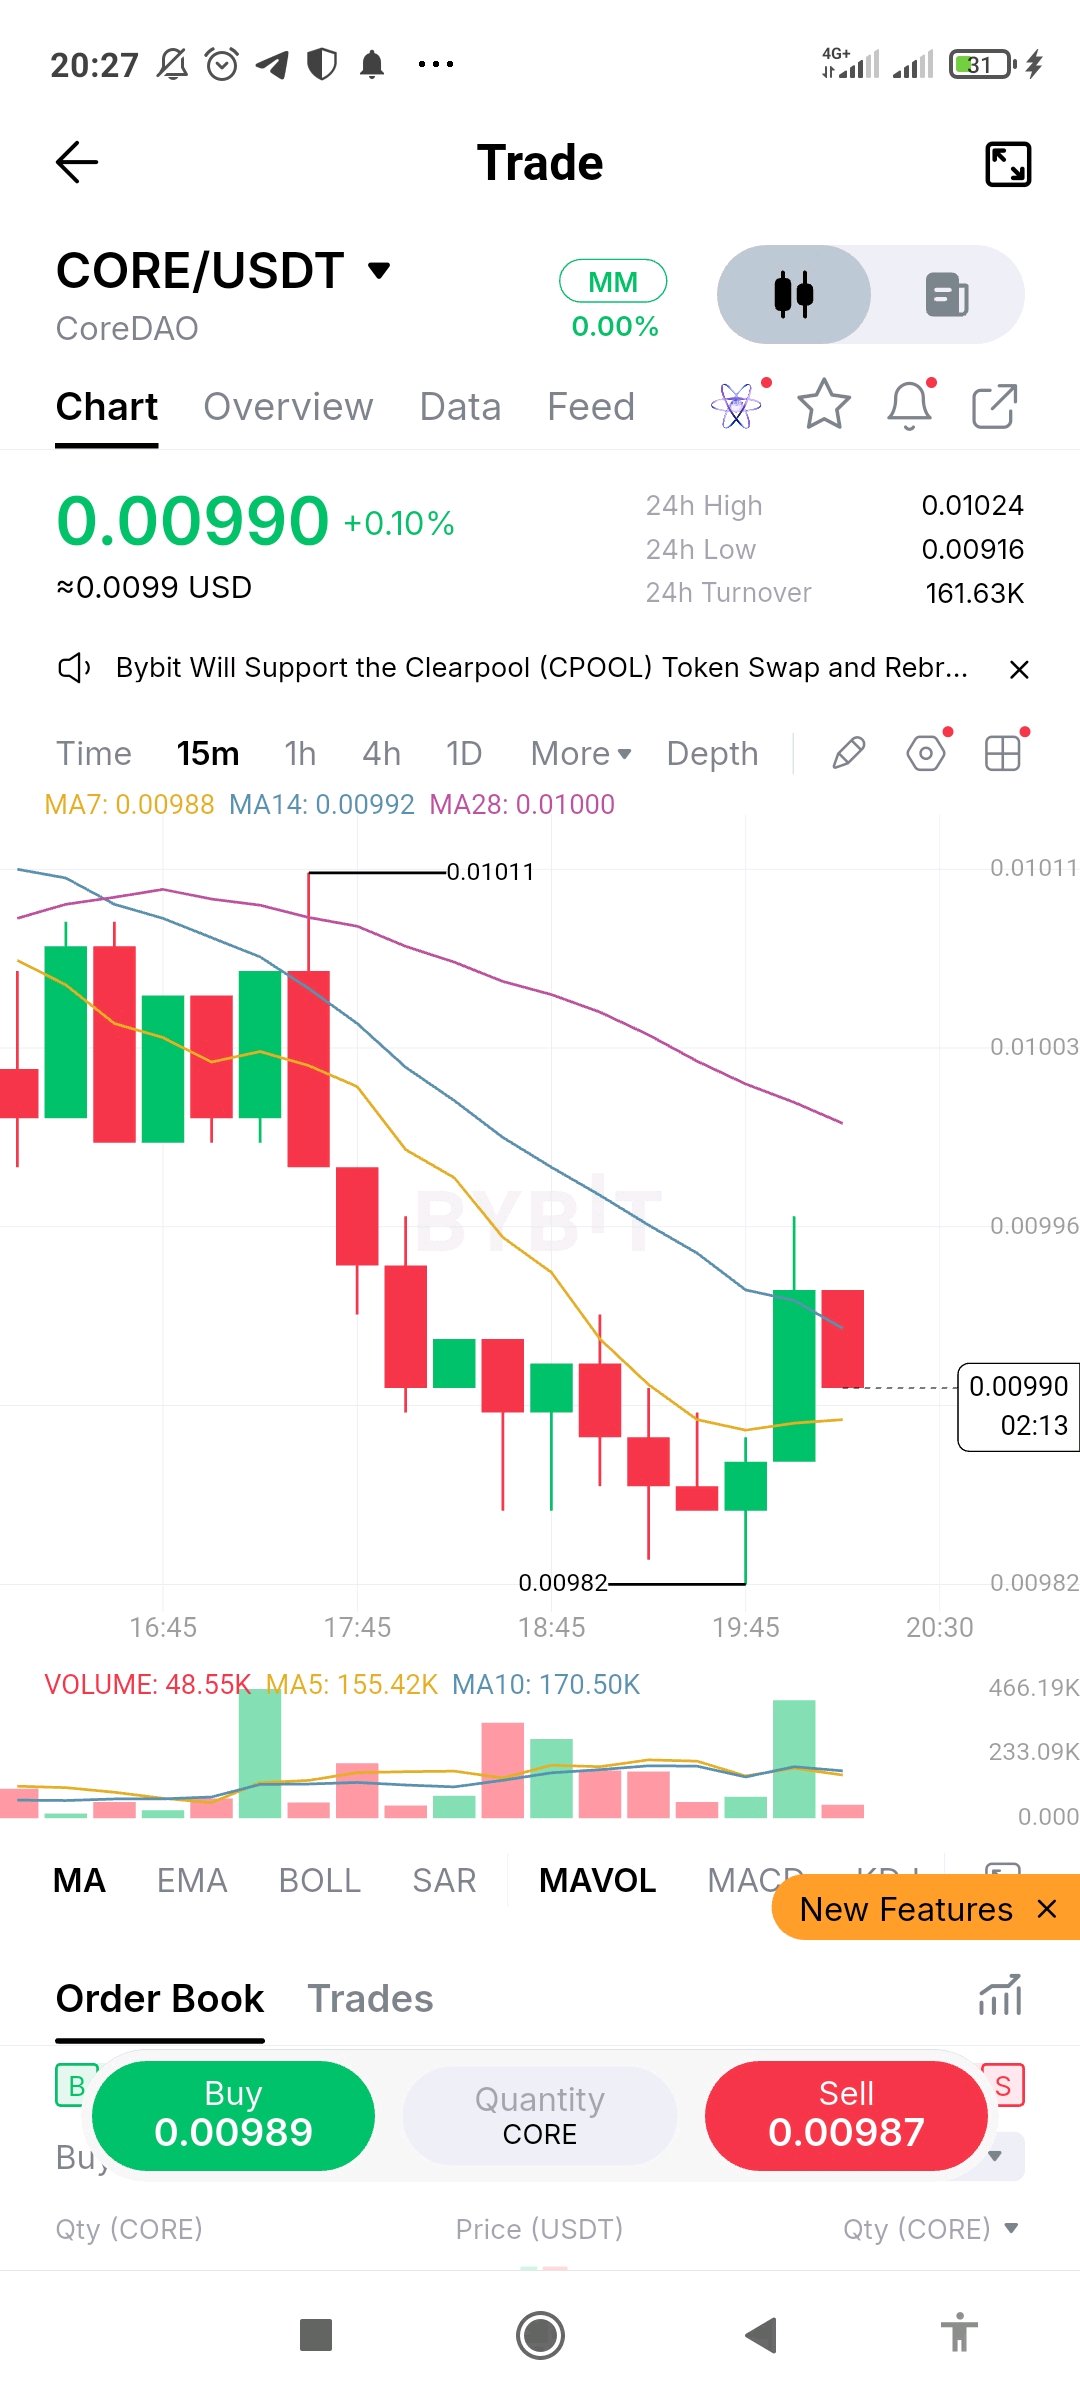
$COREUSDT está en 0.00990 en la gráfica de 15m, arriba solo un 0.1% en el día, pero la tendencia a corto plazo es a la baja. El precio se deslizó desde el área de 0.01011 hasta un mínimo de 0.00982, rebotó con una vela verde fuerte, luego imprimió una vela roja justo debajo de los promedios móviles que caen. MA7 (0.00988), MA14 (0.00992) y MA28 (0.01000) están apilados en orden bajista y con pendiente negativa. El mínimo de 0.00982 es el nivel a vigilar. Una ruptura por debajo mostraría que los vendedores siguen teniendo el control, mientras que un cierre por encima de la MA14 cerca de 0.00992 sería la primera señal de que el rebote tiene fuerza. El volumen subió en la vela del rebote pero se desvaneció en la vela roja posterior, así que los compradores aún no le han dado seguimiento. Nada aquí está confirmado. Lección: un porcentaje diario plano puede esconder una gráfica que sigue marcando máximos más bajos. Una sola vela verde dentro de una tendencia bajista es un intento de rebote, no una reversión, así que espera a un mínimo más alto y mantén tu posición pequeña. #IMPACTbyTrade $COREUSDT $BTCUSDT
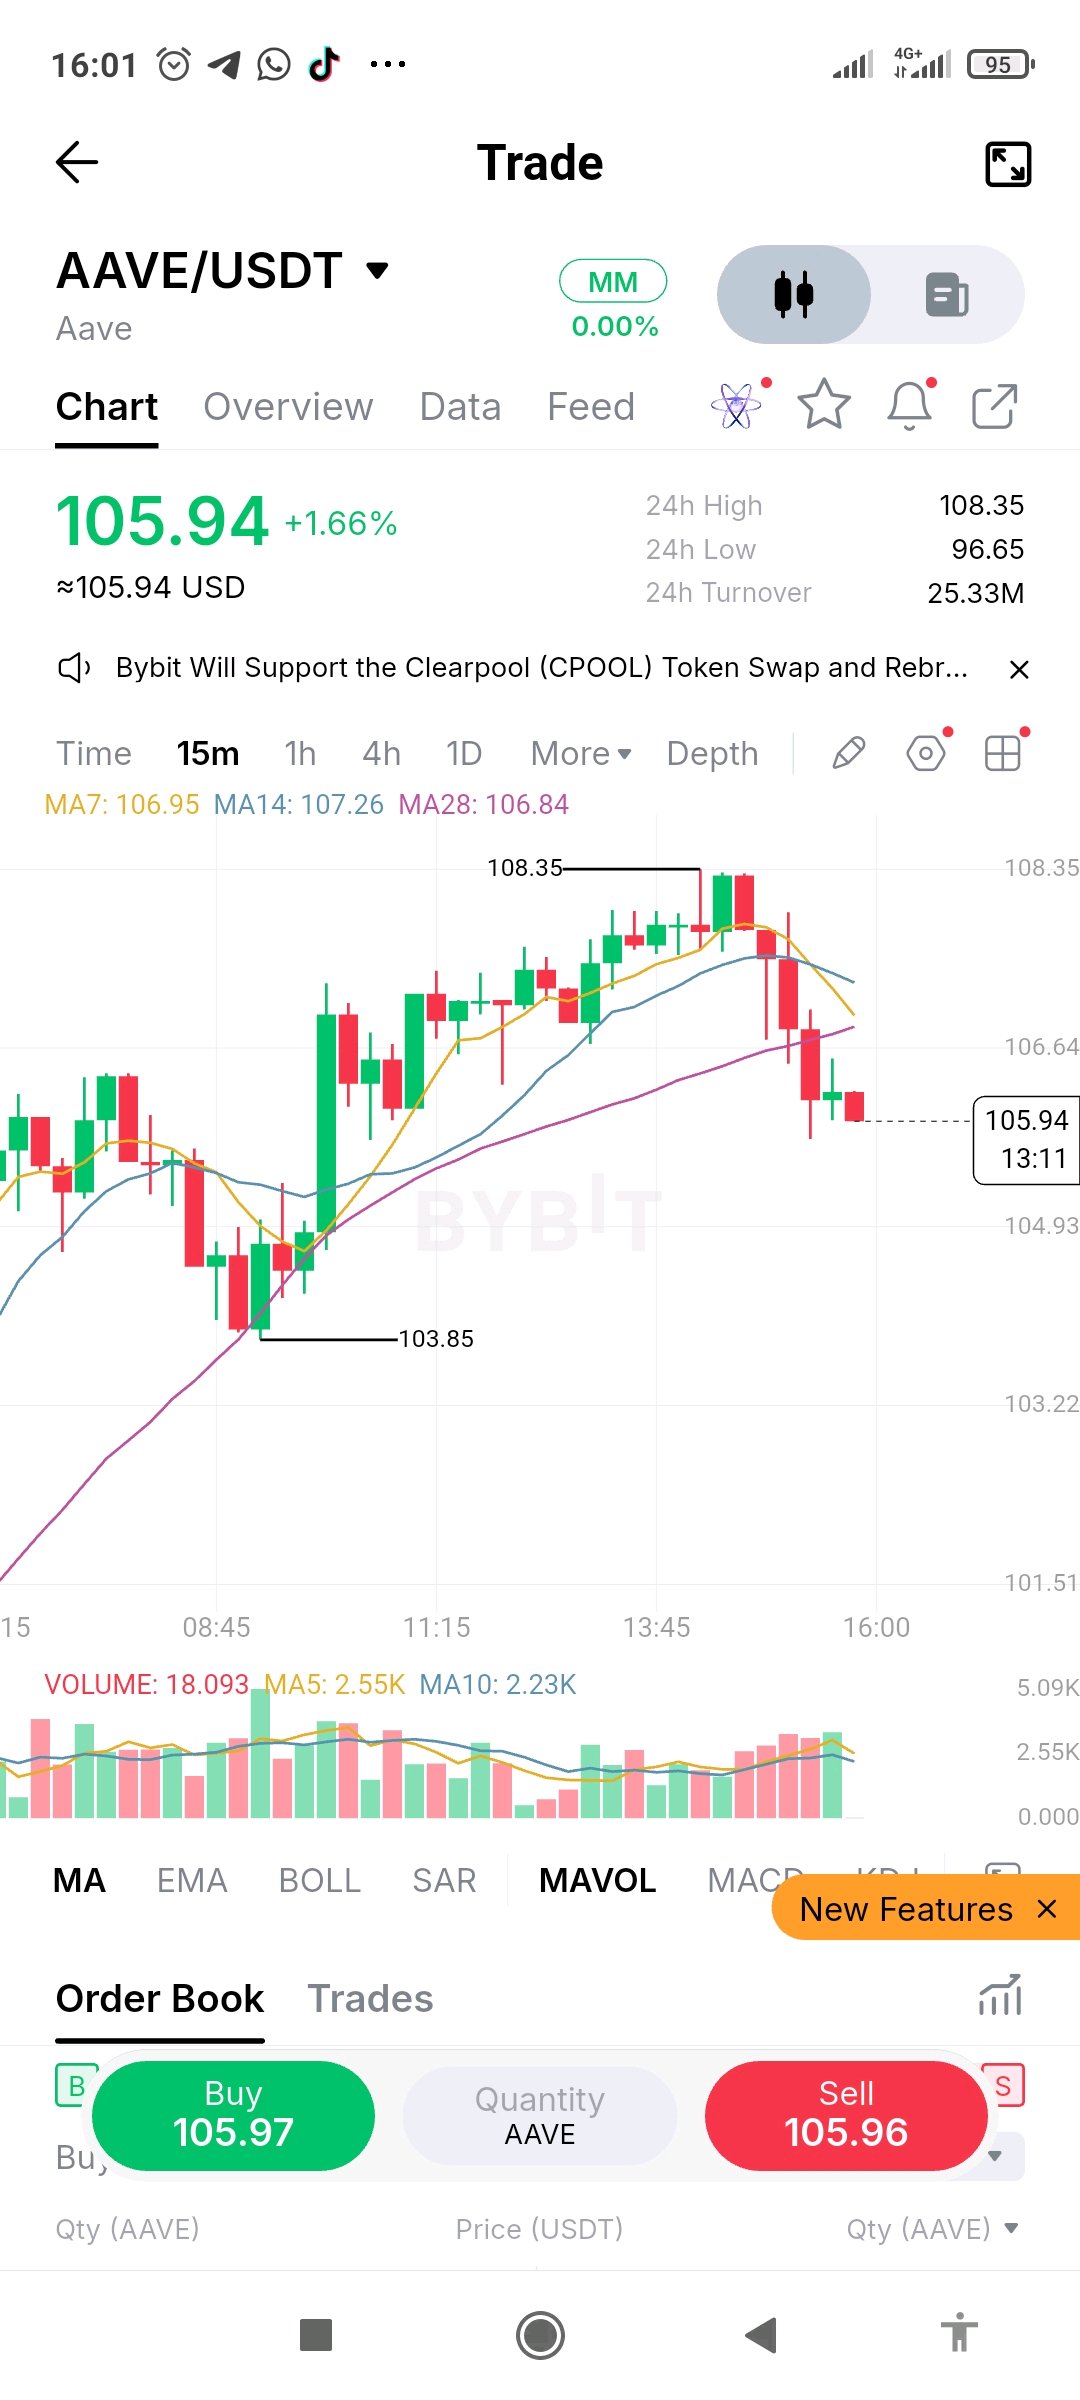
$AAVEUSDT is at 105.94 on the 15m chart, up about 1.7% on the day, but the short-term picture has turned down. Price climbed from the 103.85 area to a high of 108.35, then rolled over with a rejection and a run of red candles. It has dropped through MA7 (106.95), MA14 (107.26) and MA28 (106.84), and MA7 and MA14 are now curling down above price. The next reference points are the 105 area, close to the 104.93 gridline, and the 103.85 low. A bounce would likely meet resistance near MA28 around 106.84, and a close back above it would show sellers losing control. Volume on the drop is steady rather than heavy, so conviction is moderate. Nothing here is confirmed. Lesson: when price falls back through all its moving averages after a rejection at the high, the short-term structure has changed, even inside a green day. Wait for a higher low or a reclaim before acting, and keep your size small enough to survive being wrong. #IMPACTbyTrade $AAVEUSDT $BTCUSDT
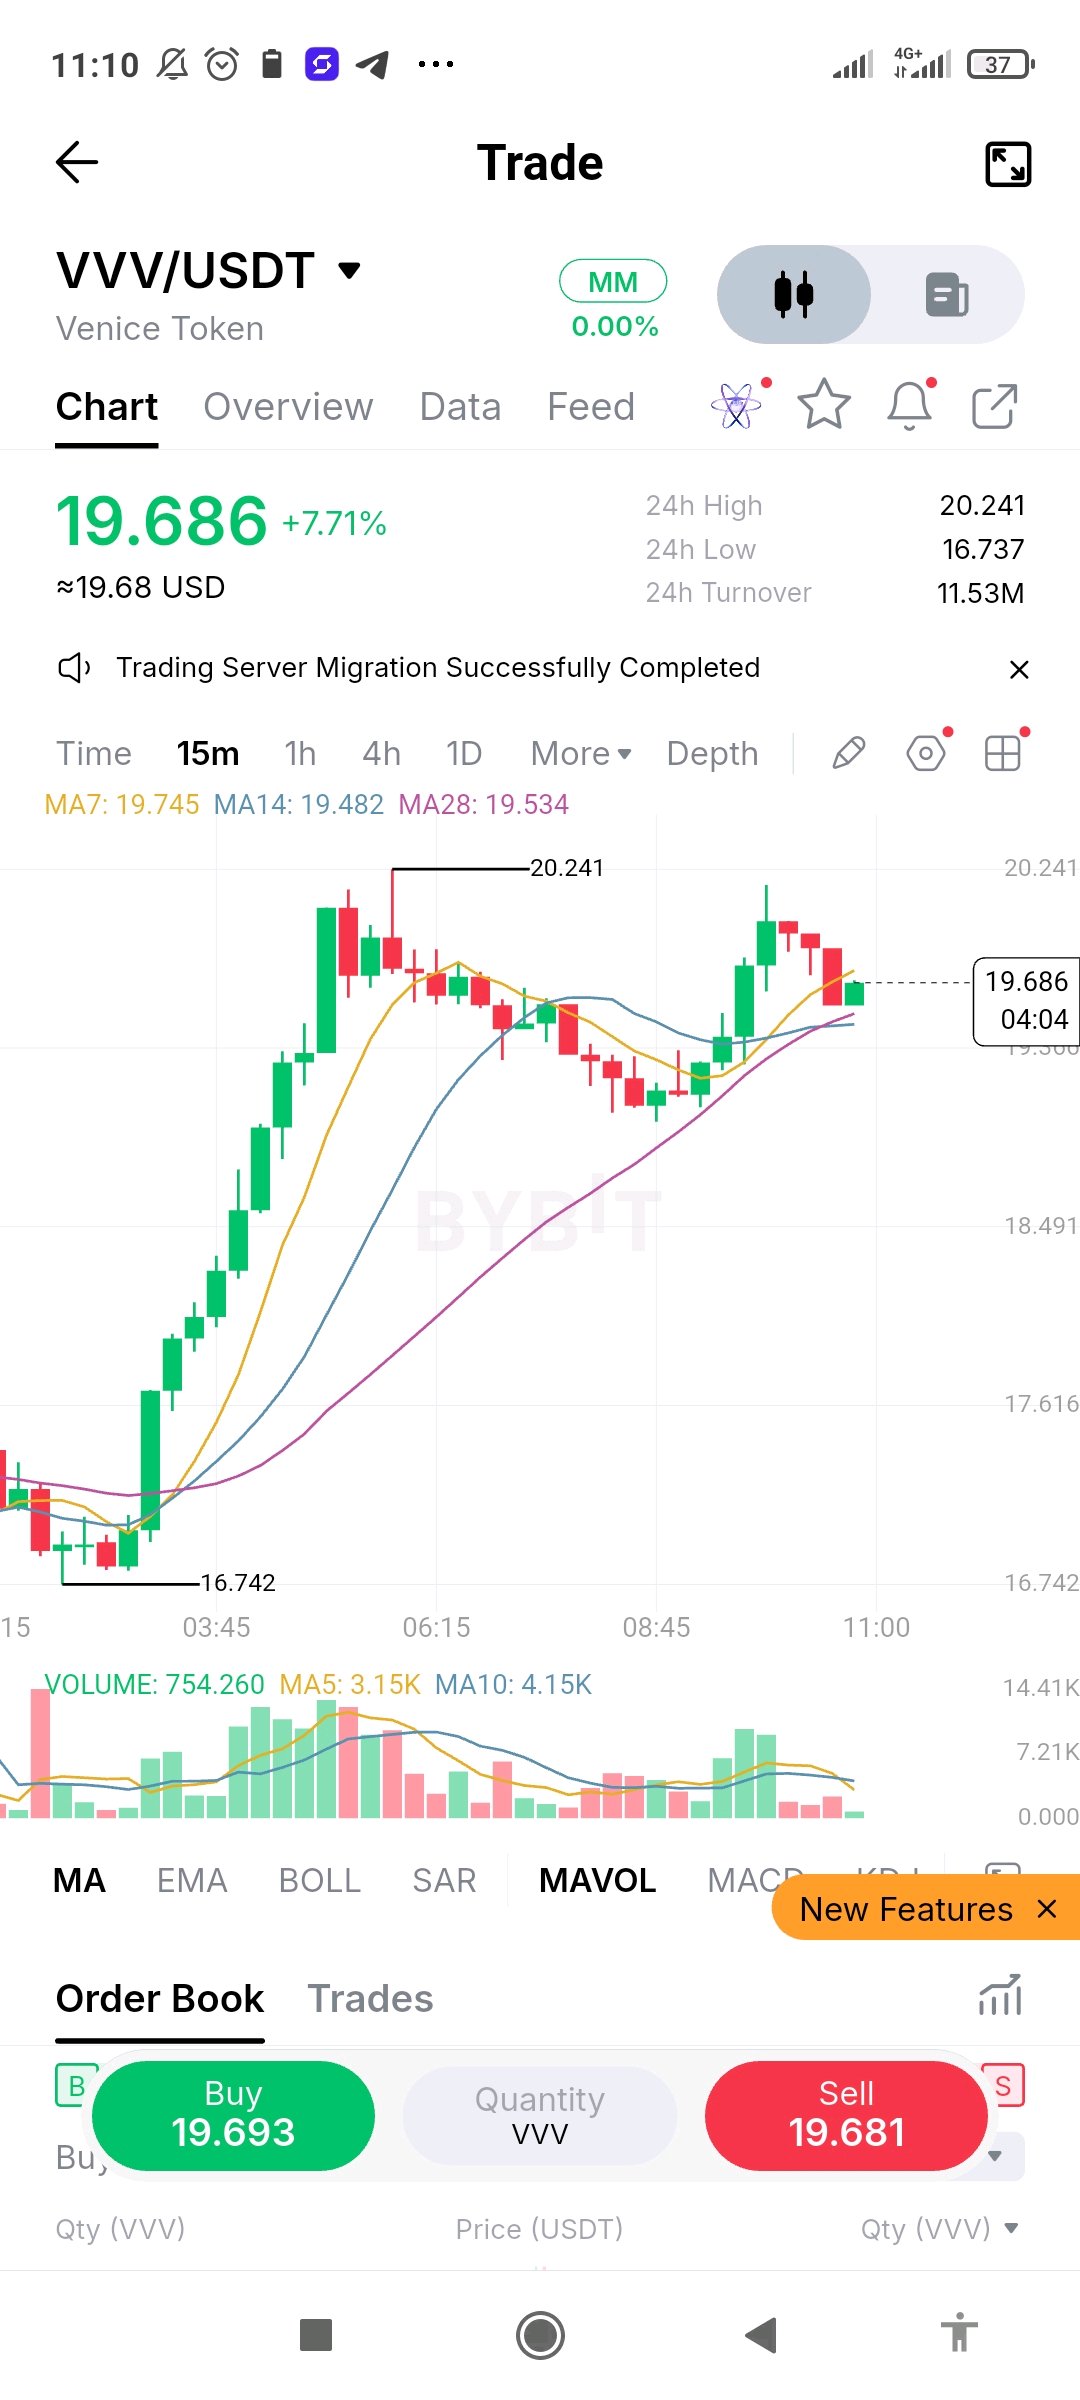
$VVVUSDT is at 19.686 on the 15m chart, up about 7.7% on the day after a strong climb from the 16.742 area to a high of 20.241. Price pulled back, made a second push, and is now cooling again just above the moving averages. MA7 (19.745), MA14 (19.482) and MA28 (19.534) are bunched together, with price sitting right on them. The earlier trend is intact, but the averages are tangling, which shows the move is pausing. Volume was strongest during the first rally and has faded on both pullbacks, so buyers are not adding fresh pressure. A hold above the MA cluster near 19.5 would keep the higher low alive, while a drop below it would put the pullback lows in focus. A close above 20.241 would favor buyers. Nothing here is confirmed. Lesson: a second push that fails to beat the first high on lower volume is a warning, not a signal. Wait for a close above resistance, and keep your size small enough that a failed breakout stays affordable. #IMPACTbyTrade $VVVUSDT $BTCUSDT
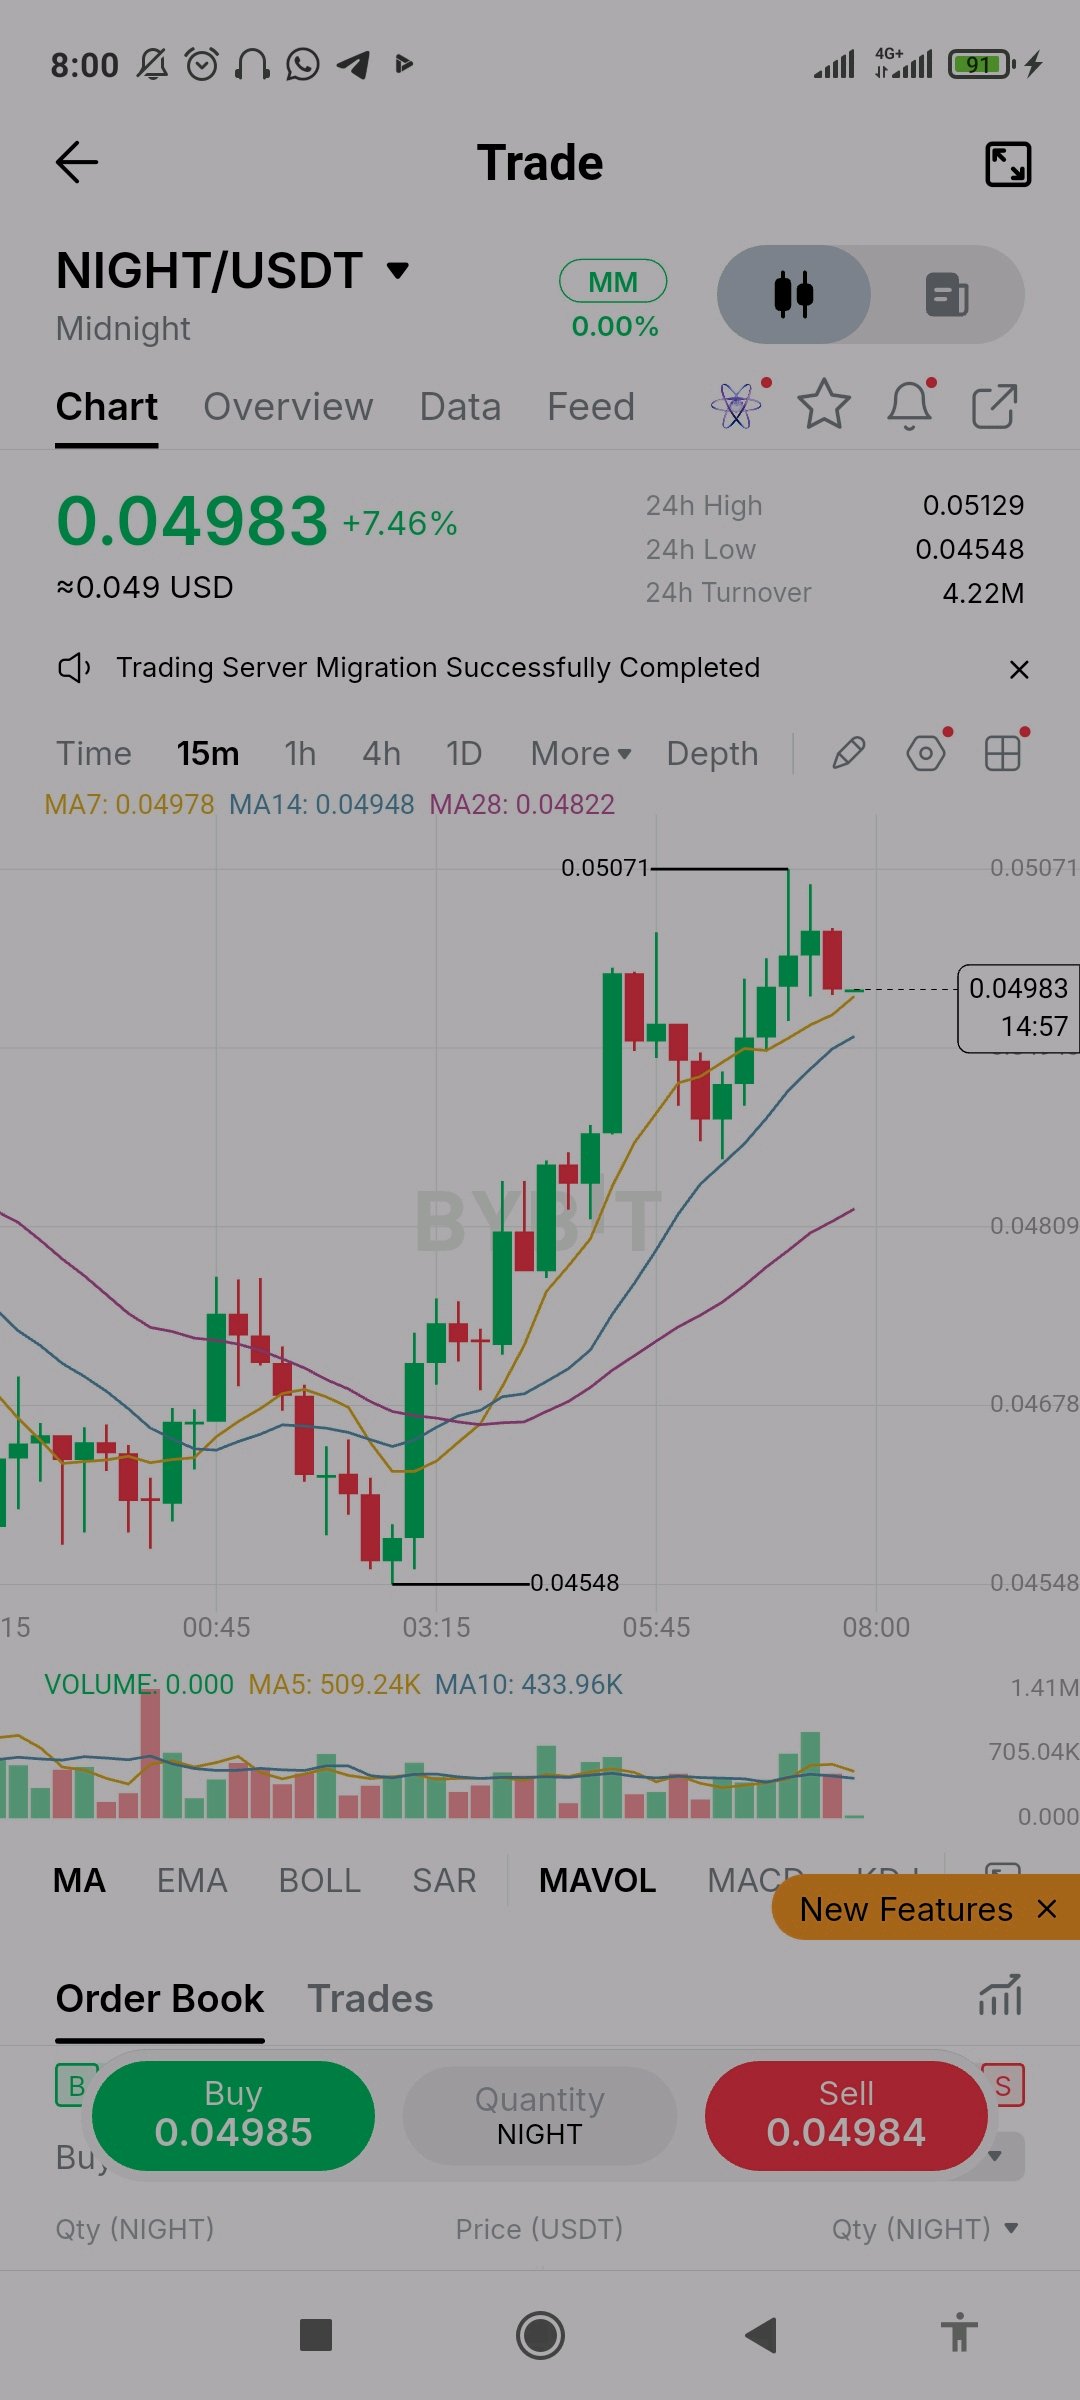
$NIGHTUSDT is at 0.04983 on the 15m chart, up about 7.5% on the day after a steady climb from the 0.04548 low to a high of 0.05071. MA7 (0.04978), MA14 (0.04948) and MA28 (0.04822) are stacked in bullish order and sloping up, with price sitting right on MA7 after a red pullback candle under the high. The trend is constructive, but momentum is pausing just below 0.05071. Volume was strongest during the main push and has been mixed on the latest candles, so buyers are active without a fresh surge. A close above 0.05071 would favor bulls, while a drop below MA7 would be the first warning and a pullback toward MA14 near 0.0495 would not be unusual. Nothing here is confirmed. Lesson: a healthy uptrend can still stall just under a recent high. Entering right at resistance leaves little room for error, so wait for a close above it or a pullback, and keep your size small. #IMPACTbyTrade $NIGHTUSDT $BTCUSDT
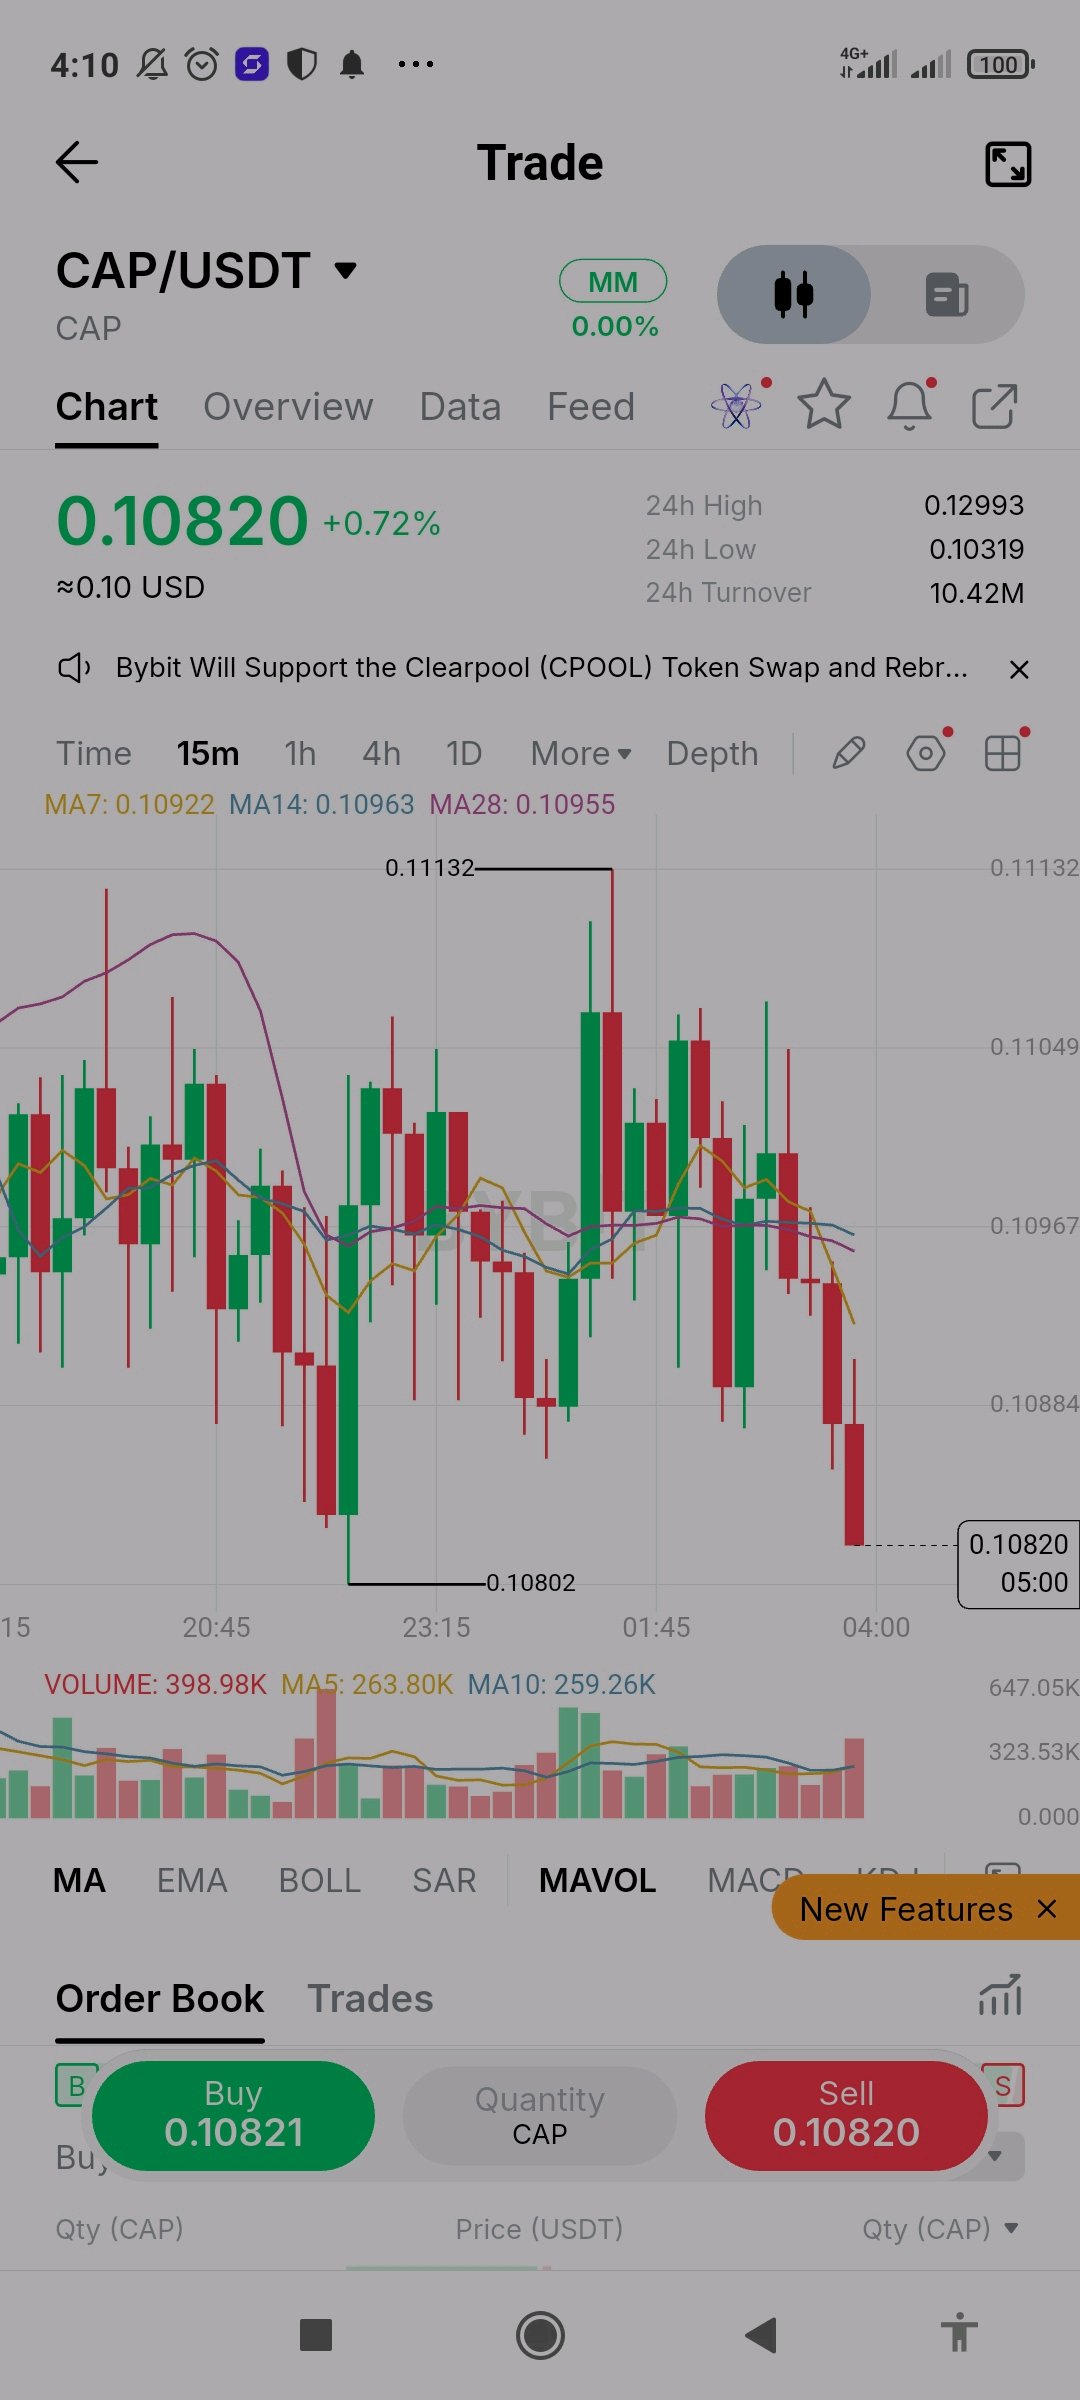
$CAPUSDT is at 0.10820 on the 15m chart, up about 0.7% on the day, but the short-term picture has weakened. Price spent hours chopping between 0.10802 and 0.11132, then dropped on a large red candle that pushed it right down to the bottom of that range. MA7 (0.10922), MA14 (0.10963) and MA28 (0.10955) are bunched together above price and starting to slope down. The 0.10802 low is the level to watch. A break below it would show sellers taking control of the range, while a bounce would likely meet resistance near the MA cluster around 0.1092 to 0.1096. Volume on the latest candle is the highest of the recent bars, so the drop has real participation behind it, though one candle does not confirm a trend. Nothing here is confirmed. Lesson: when price sits in a range for hours and then breaks toward the edge on rising volume, take the warning seriously. Wait for a close below support or a reclaim of the averages before acting, and keep your size small enough that being wrong stays affordable. #IMPACTbyTrade $CAPUSDT $BTCUSDT
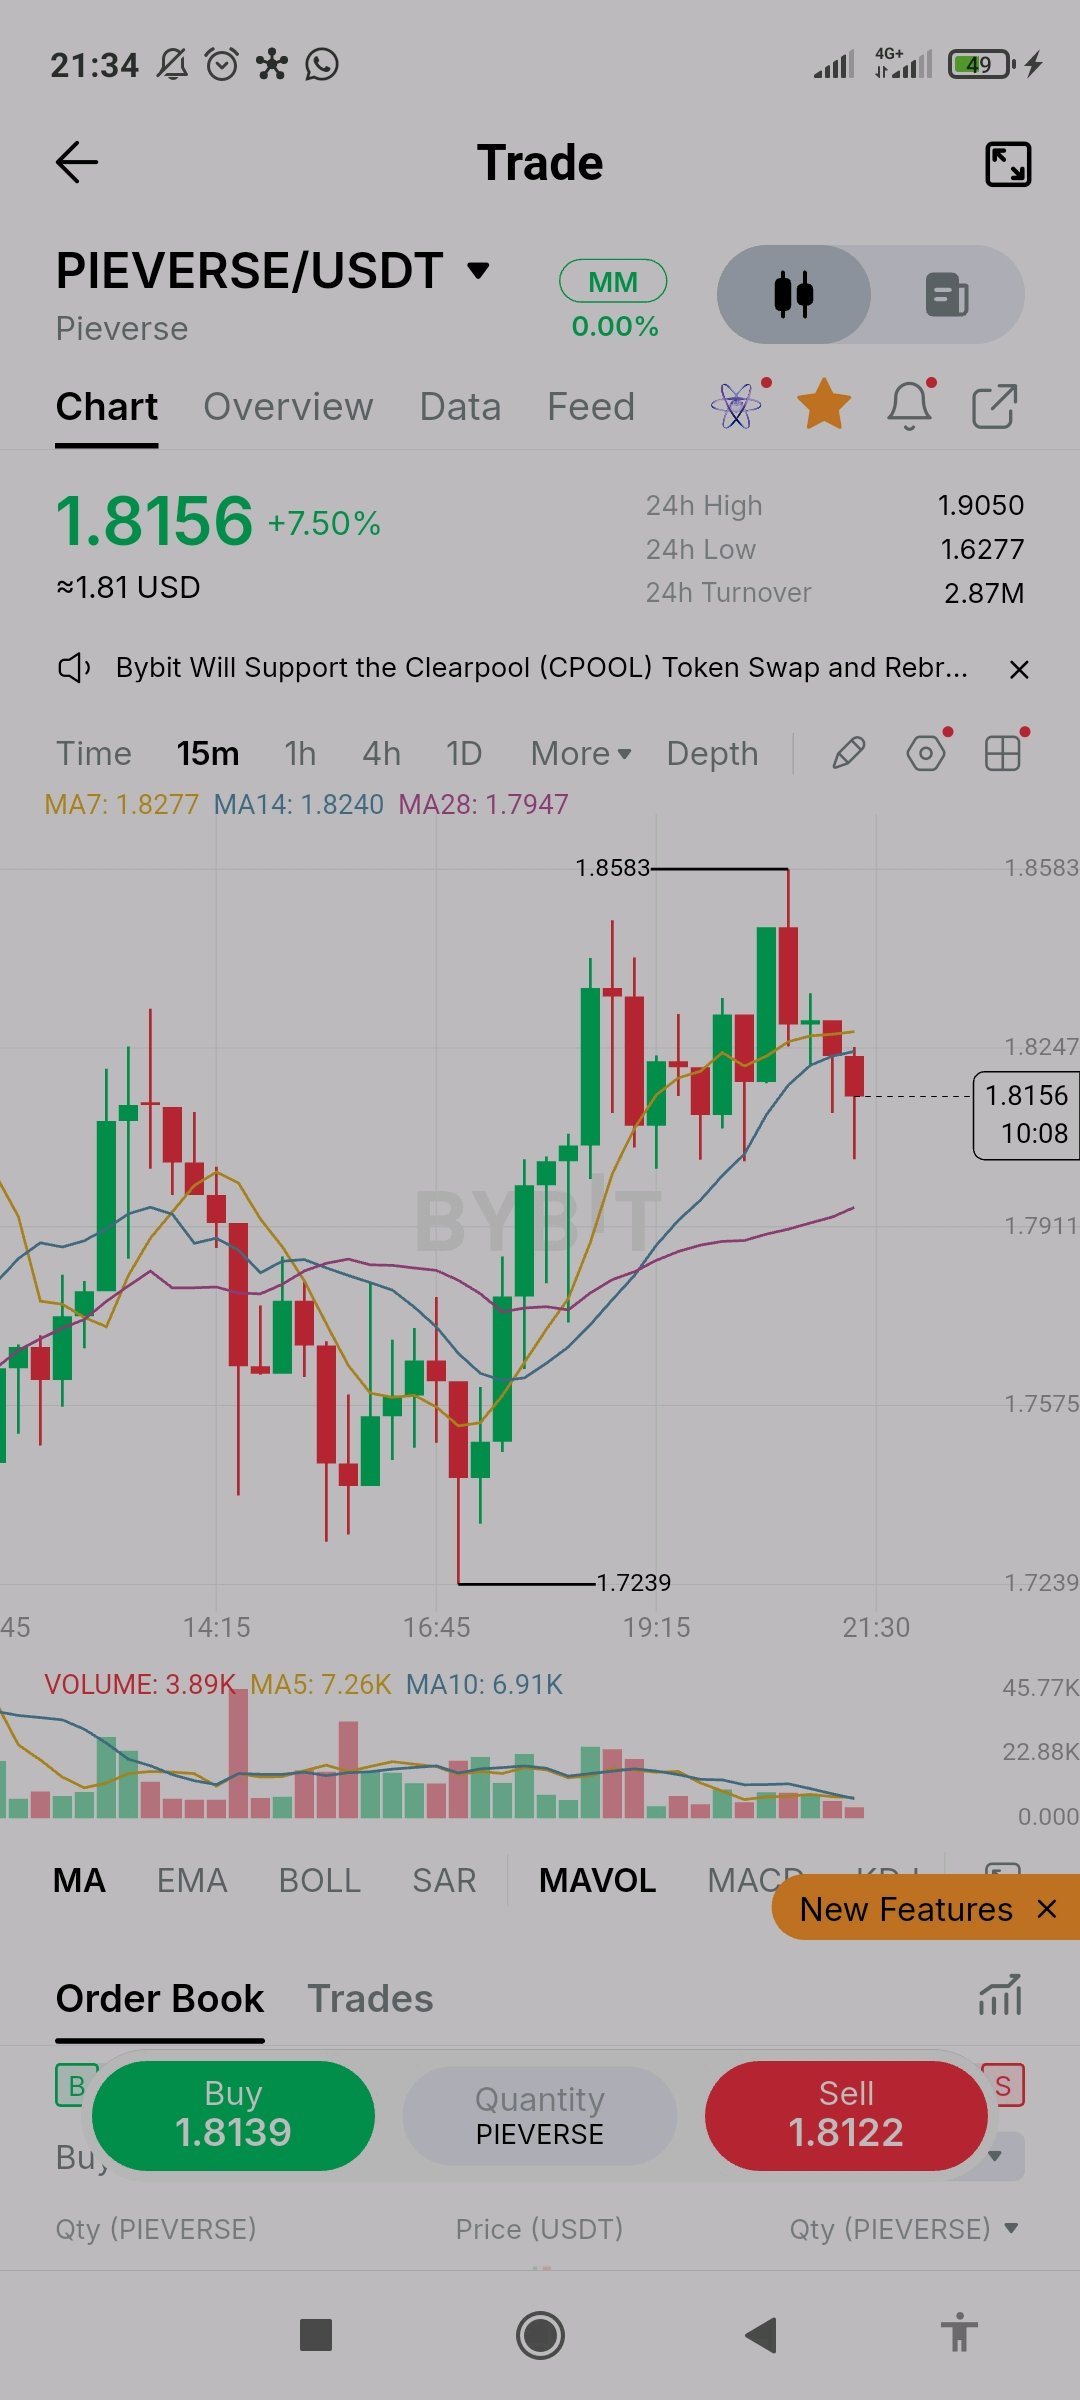
$PIEVERSEUSDT is at 1.8156 on the 15m chart, up about 7.5% on the day and pulling back from a high of 1.8583. Price recovered from the 1.7239 low with higher lows, then rolled over with a rejection wick at the top. It now sits just under MA7 (1.8277) and right on MA14 (1.8240), while MA28 (1.7947) is rising below as the next support. The structure is still constructive, but the last few candles show momentum cooling and volume is light on the pullback. That may be a pause, though it does not confirm anything. A hold above MA28 would keep the higher lows intact, while a drop below it would put the 1.7239 low back in focus. A close above 1.8583 would favor buyers. Nothing here is confirmed. Lesson: a pullback to the moving averages is a test, not a guarantee of a bounce. Let the candle close before reacting, and size your trade so a failed support stays small. #IMPACTbyTrade $PIEVERSEUSDT $BTCUSDT
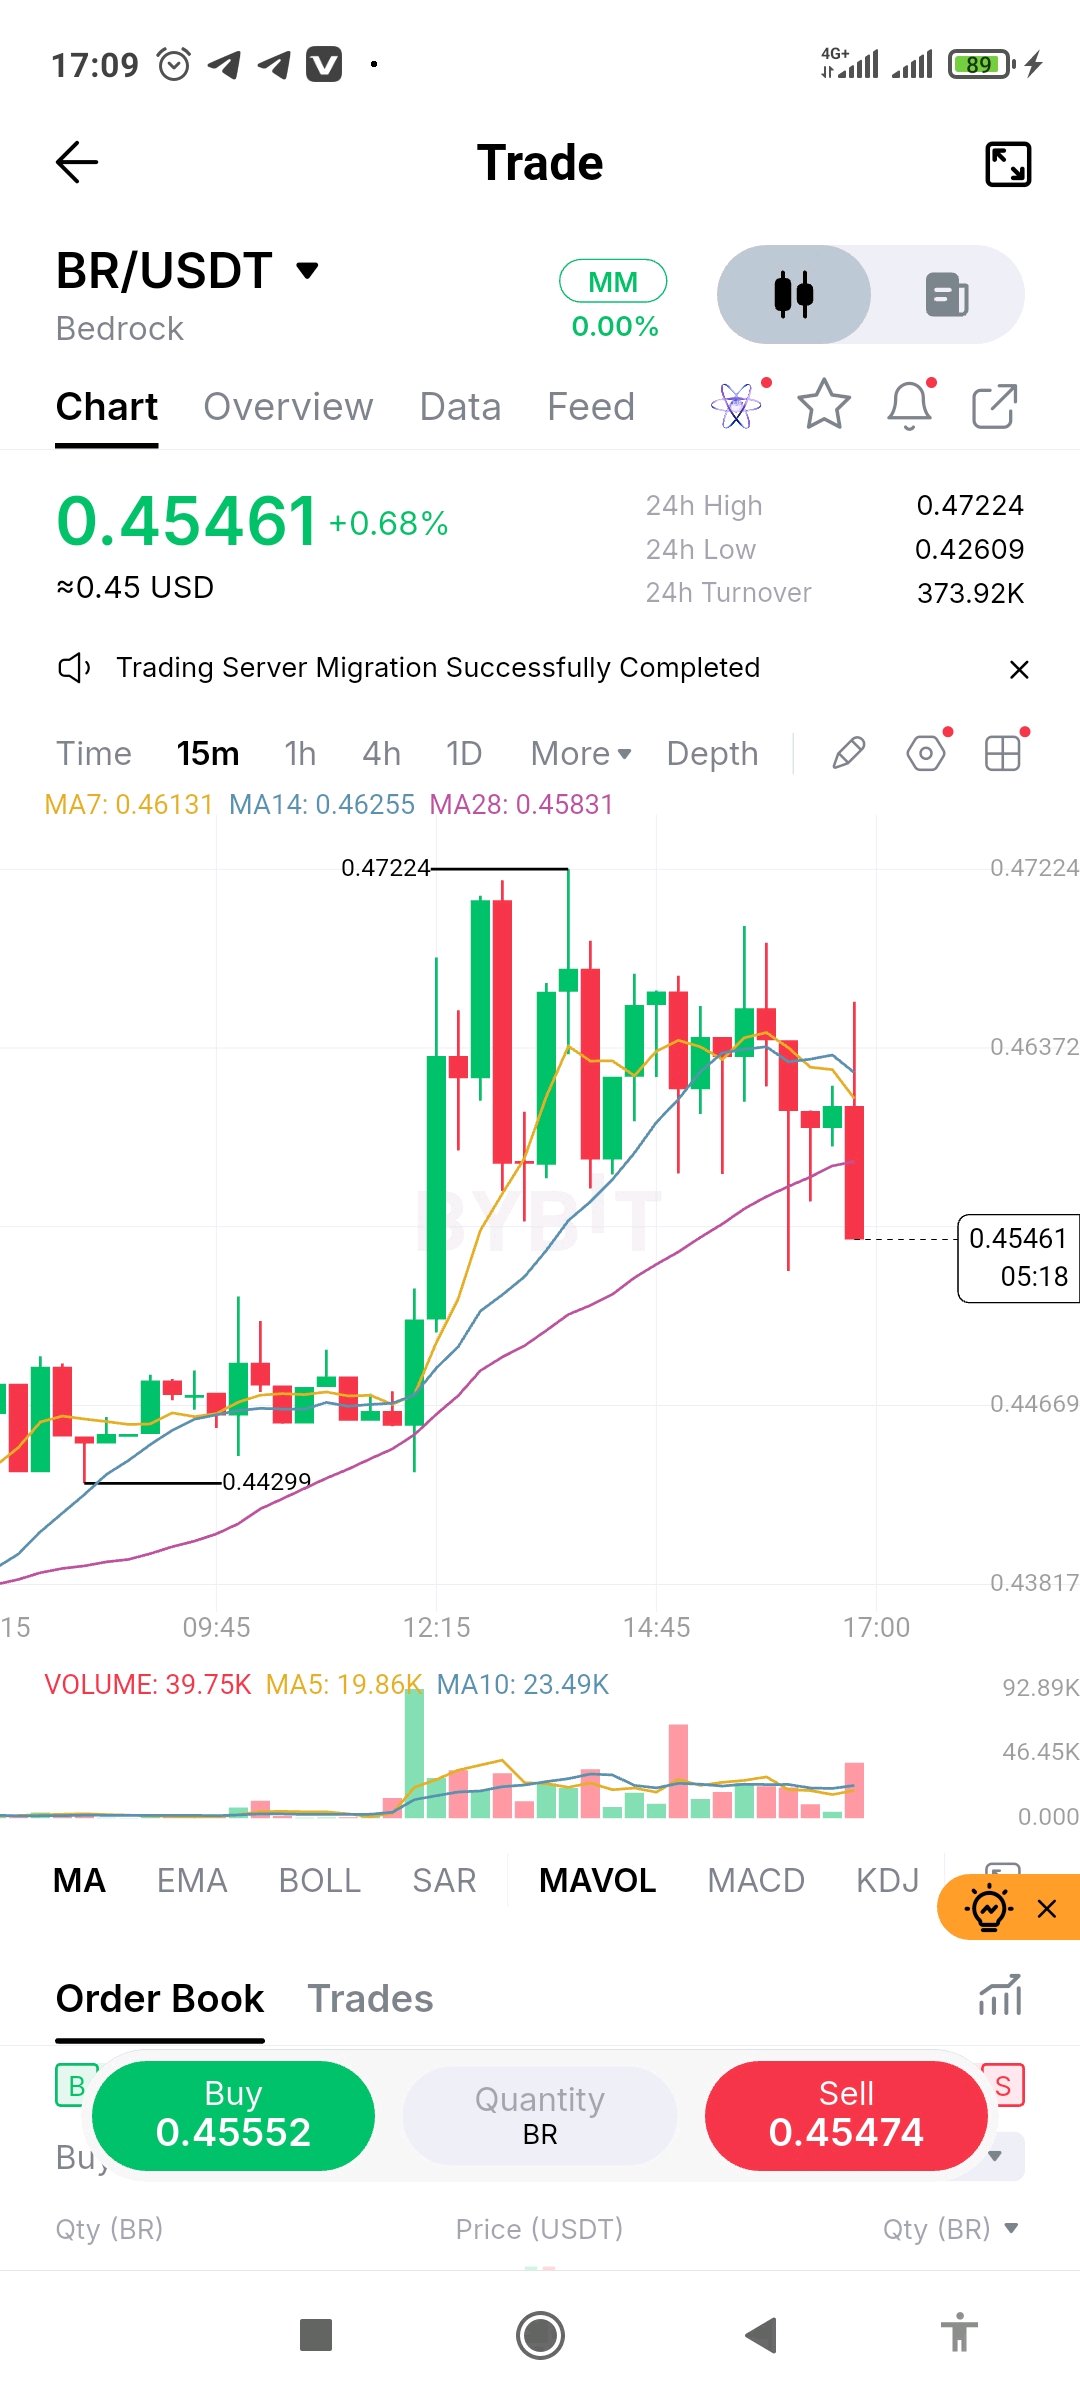
$BRUSDT is at 0.45461 on the 15m chart, up about 0.7% on the day after a breakout from the 0.44299 area to a high of 0.47224. Price then spent hours chopping in a wide, choppy range and has just dropped on a large red candle, falling below MA7 (0.46131) and MA14 (0.46255) and now sitting close to MA28 (0.45831). MA28 is the level to watch. Losing it would put the 0.443 to 0.444 base back in focus, while a reclaim of MA14 would show buyers defending the move. Volume was strongest on the original breakout and has been uneven since, so the latest drop has only moderate selling behind it. Nothing here is confirmed. Lesson: when a breakout fails to hold and price slips back through its averages, the structure has weakened. Wait for a higher low or a clear reclaim before trusting a bounce, and keep your size small enough that being wrong stays affordable. #IMPACTbyTrade $BRUSDT $BTCUSDT
$BMTUSDT is at 0.02312 on the 15m chart, up about 4% on the day after a drop from the 0.02465 area to a low of 0.02153, followed by a recovery. MA7 (0.02278), MA14 (0.02268) and MA28 (0.02272) are bunched together and flattening, and price has just pushed above all three with a run of green candles. The bounce is constructive, but the averages are tangled, so a clean trend has not formed yet. Volume was heavy during the earlier selloff and is much lighter on this recovery, so buyers are not showing strong conviction. A hold above the MA cluster near 0.0227 would support the move, while a drop back under it would suggest the bounce is failing. A close above 0.02465 would be a stronger sign for buyers. Nothing here is confirmed. Lesson: a recovery that reclaims the moving averages on light volume is a test, not a trend change. Wait for follow-through candles, and size your trade so a failed bounce stays small. #IMPACTbyTrade $BMTUSDT $BTCUSDC
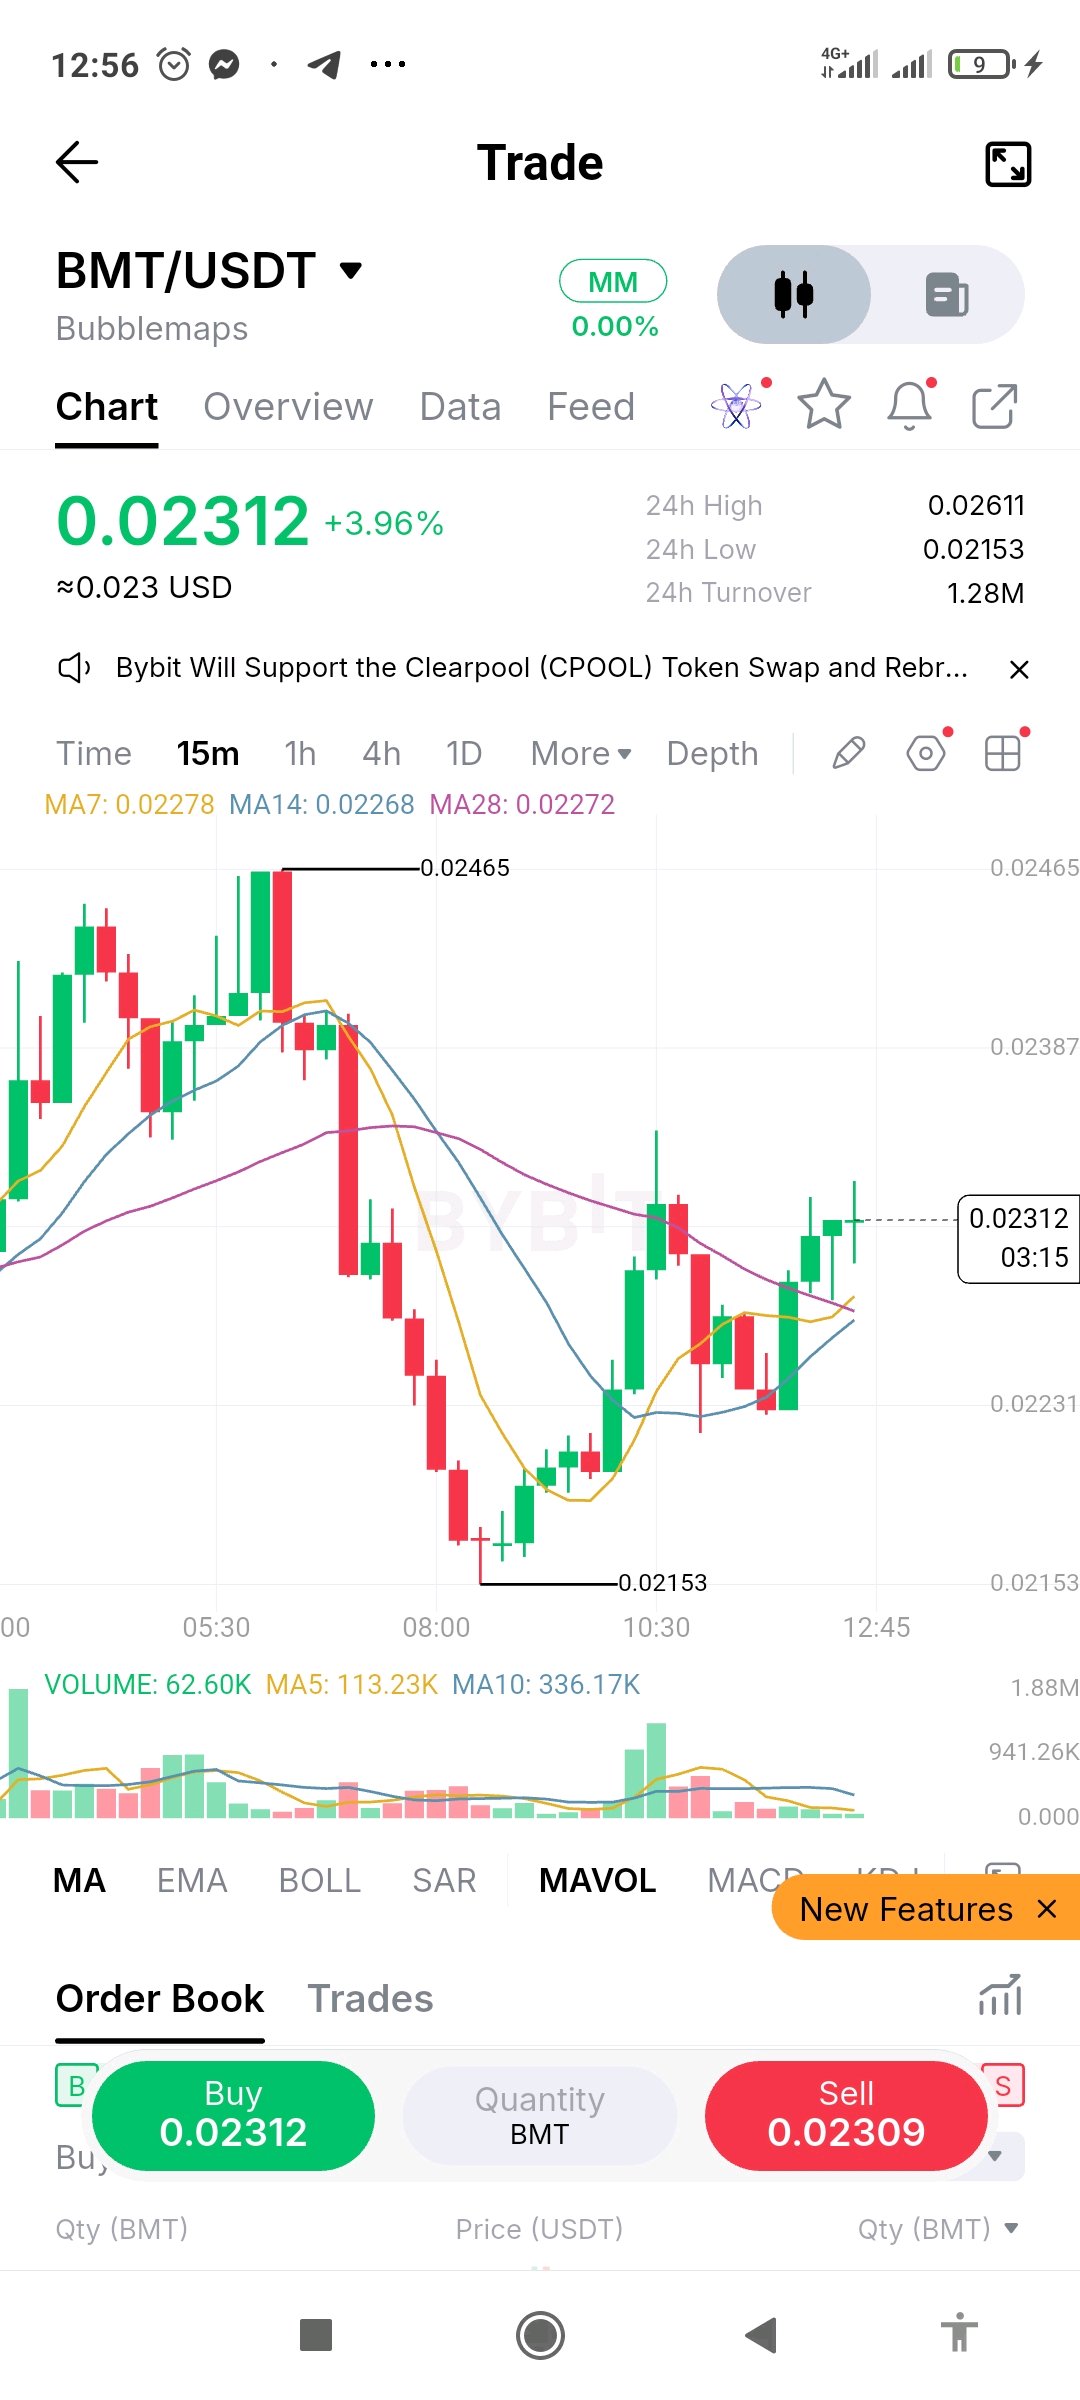
$TRXUSDT is at 0.3132 on the 15m chart, up about 0.9% on the day after a V-shaped recovery from the 0.3109 low to a high of 0.3134. MA7 (0.3129), MA14 (0.3125) and MA28 (0.3119) have turned up and are stacked in bullish order, with price riding just above MA7 after a small pullback and a fresh green push. The recovery is constructive, but the whole move is tiny. The 24h range is only 0.3103 to 0.3136, so price is now pressing right against the top of it. Volume was strongest during the middle of the climb and has softened on the latest candles, so buyers are not adding fresh pressure at the high. A close above 0.3134 would favor bulls, while a drop below MA7 would be the first warning and a pullback toward MA14 near 0.3125 would not be unusual. Nothing here is confirmed. Lesson: a clean bounce can stall right at the top of a narrow range. Entering at the high leaves little room for error, so wait for a close above resistance or a pullback, and keep your size small. #IMPACTbyTrade $TRXUSDT $BTCUSDT
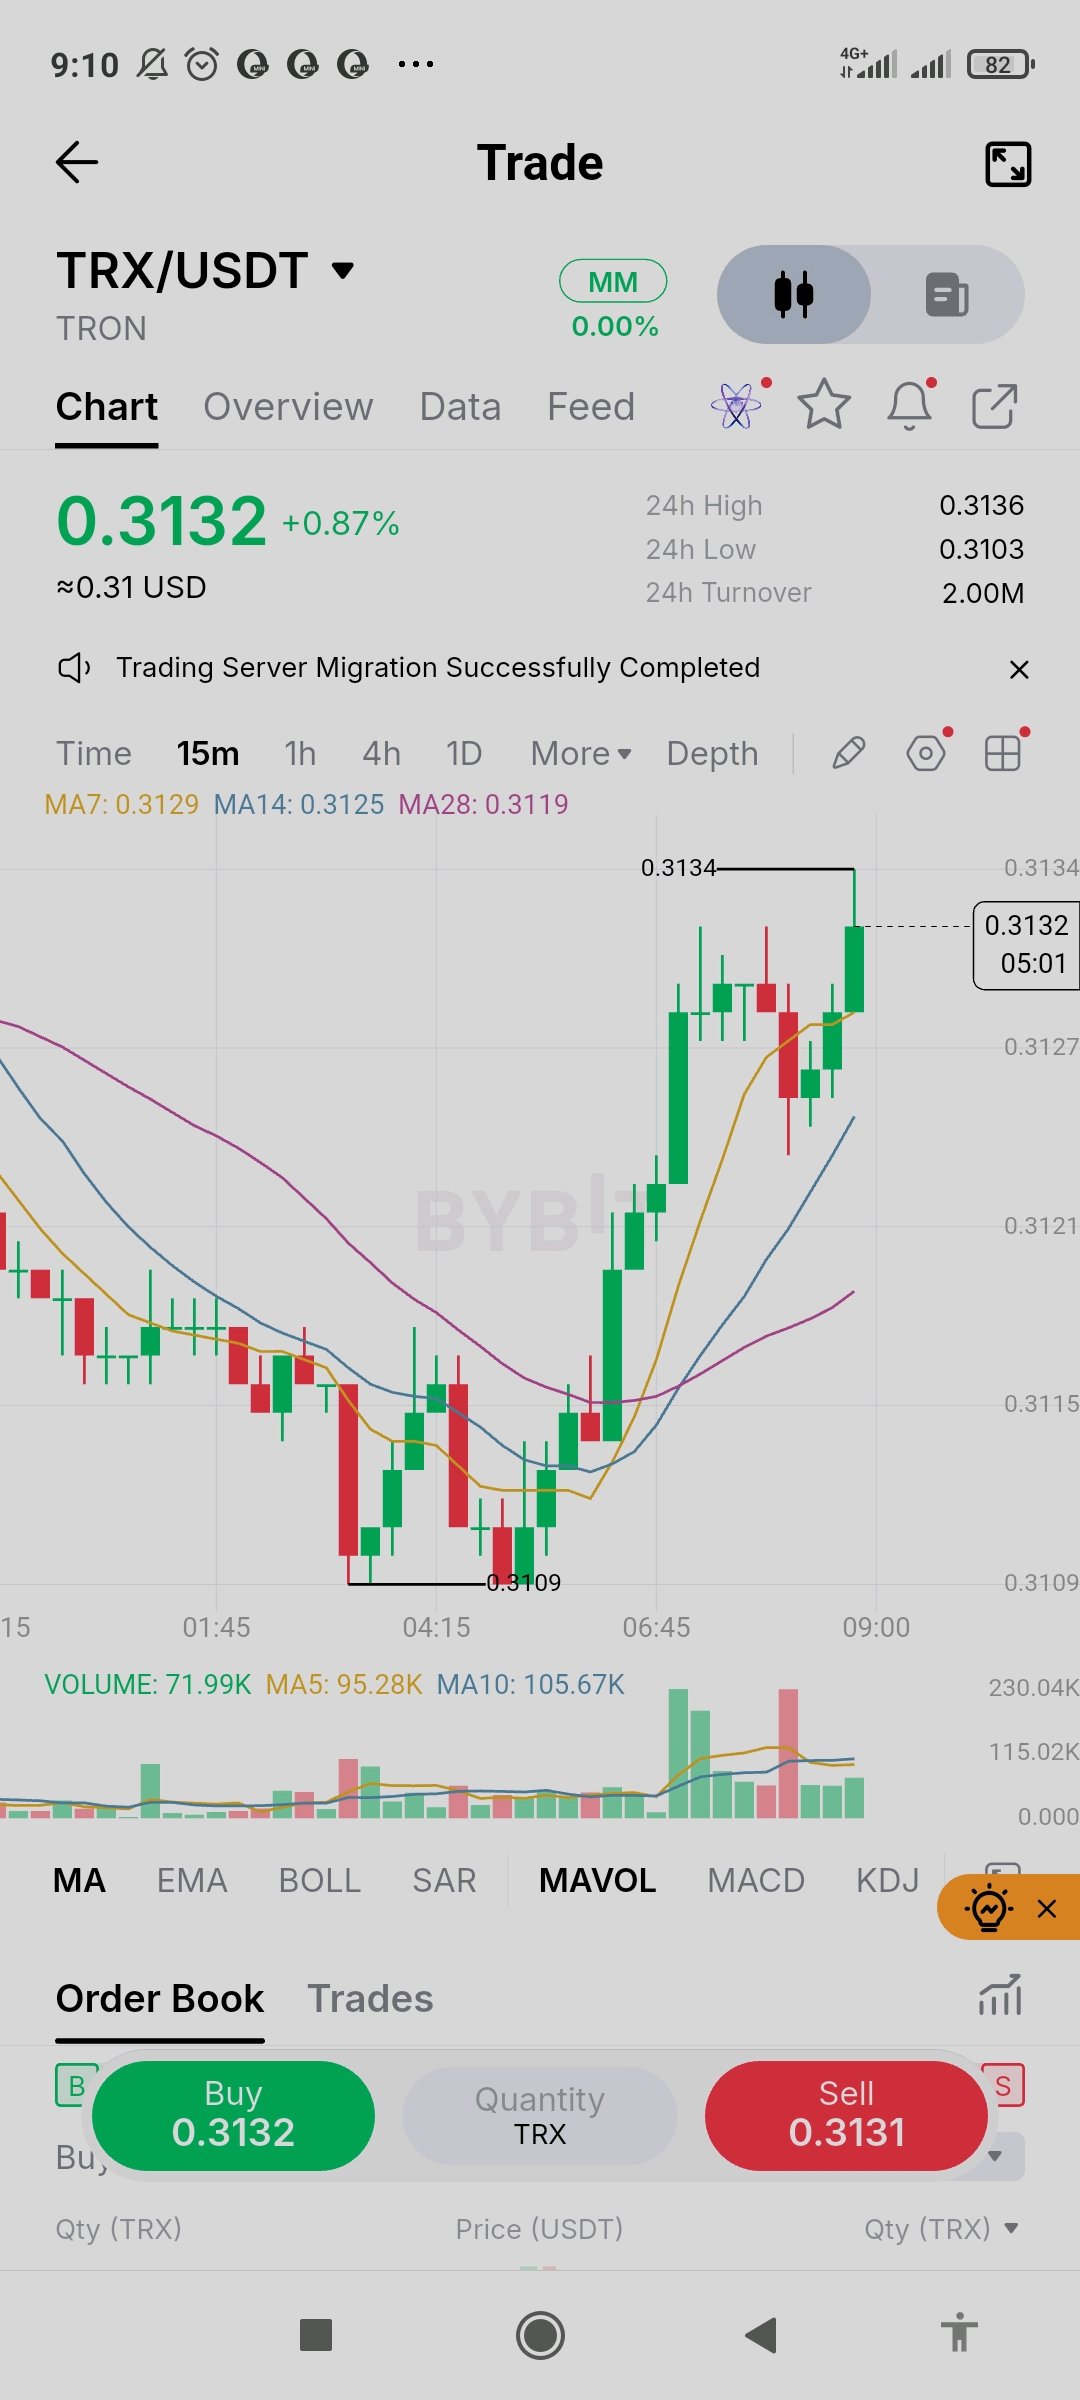
$INJUSDT is at 8.002 on the 15m chart, up about 7.6% on the day, but the short-term trend has turned lower. Price spiked to 8.382, then slid in a series of lower highs toward the 7.888 low. MA7 (8.017), MA14 (8.056) and MA28 (8.056) sit just above price and are sloping down, with the latest candle stalling right under MA7. The 7.888 low is the level to watch. A bounce would likely meet resistance near the falling MA7 and the MA14/MA28 zone around 8.05, while a clean break below 7.888 would show sellers still in control. Volume has been light on the recent moves, so conviction is low either way. Nothing here is confirmed. Lesson: a strong daily percentage can hide a chart that keeps making lower highs. Wait for a higher low or a reclaim of the moving averages before acting, and keep your size small enough that being wrong stays affordable. #IMPACTbyTrade $INJUSDT $BTCUSDT
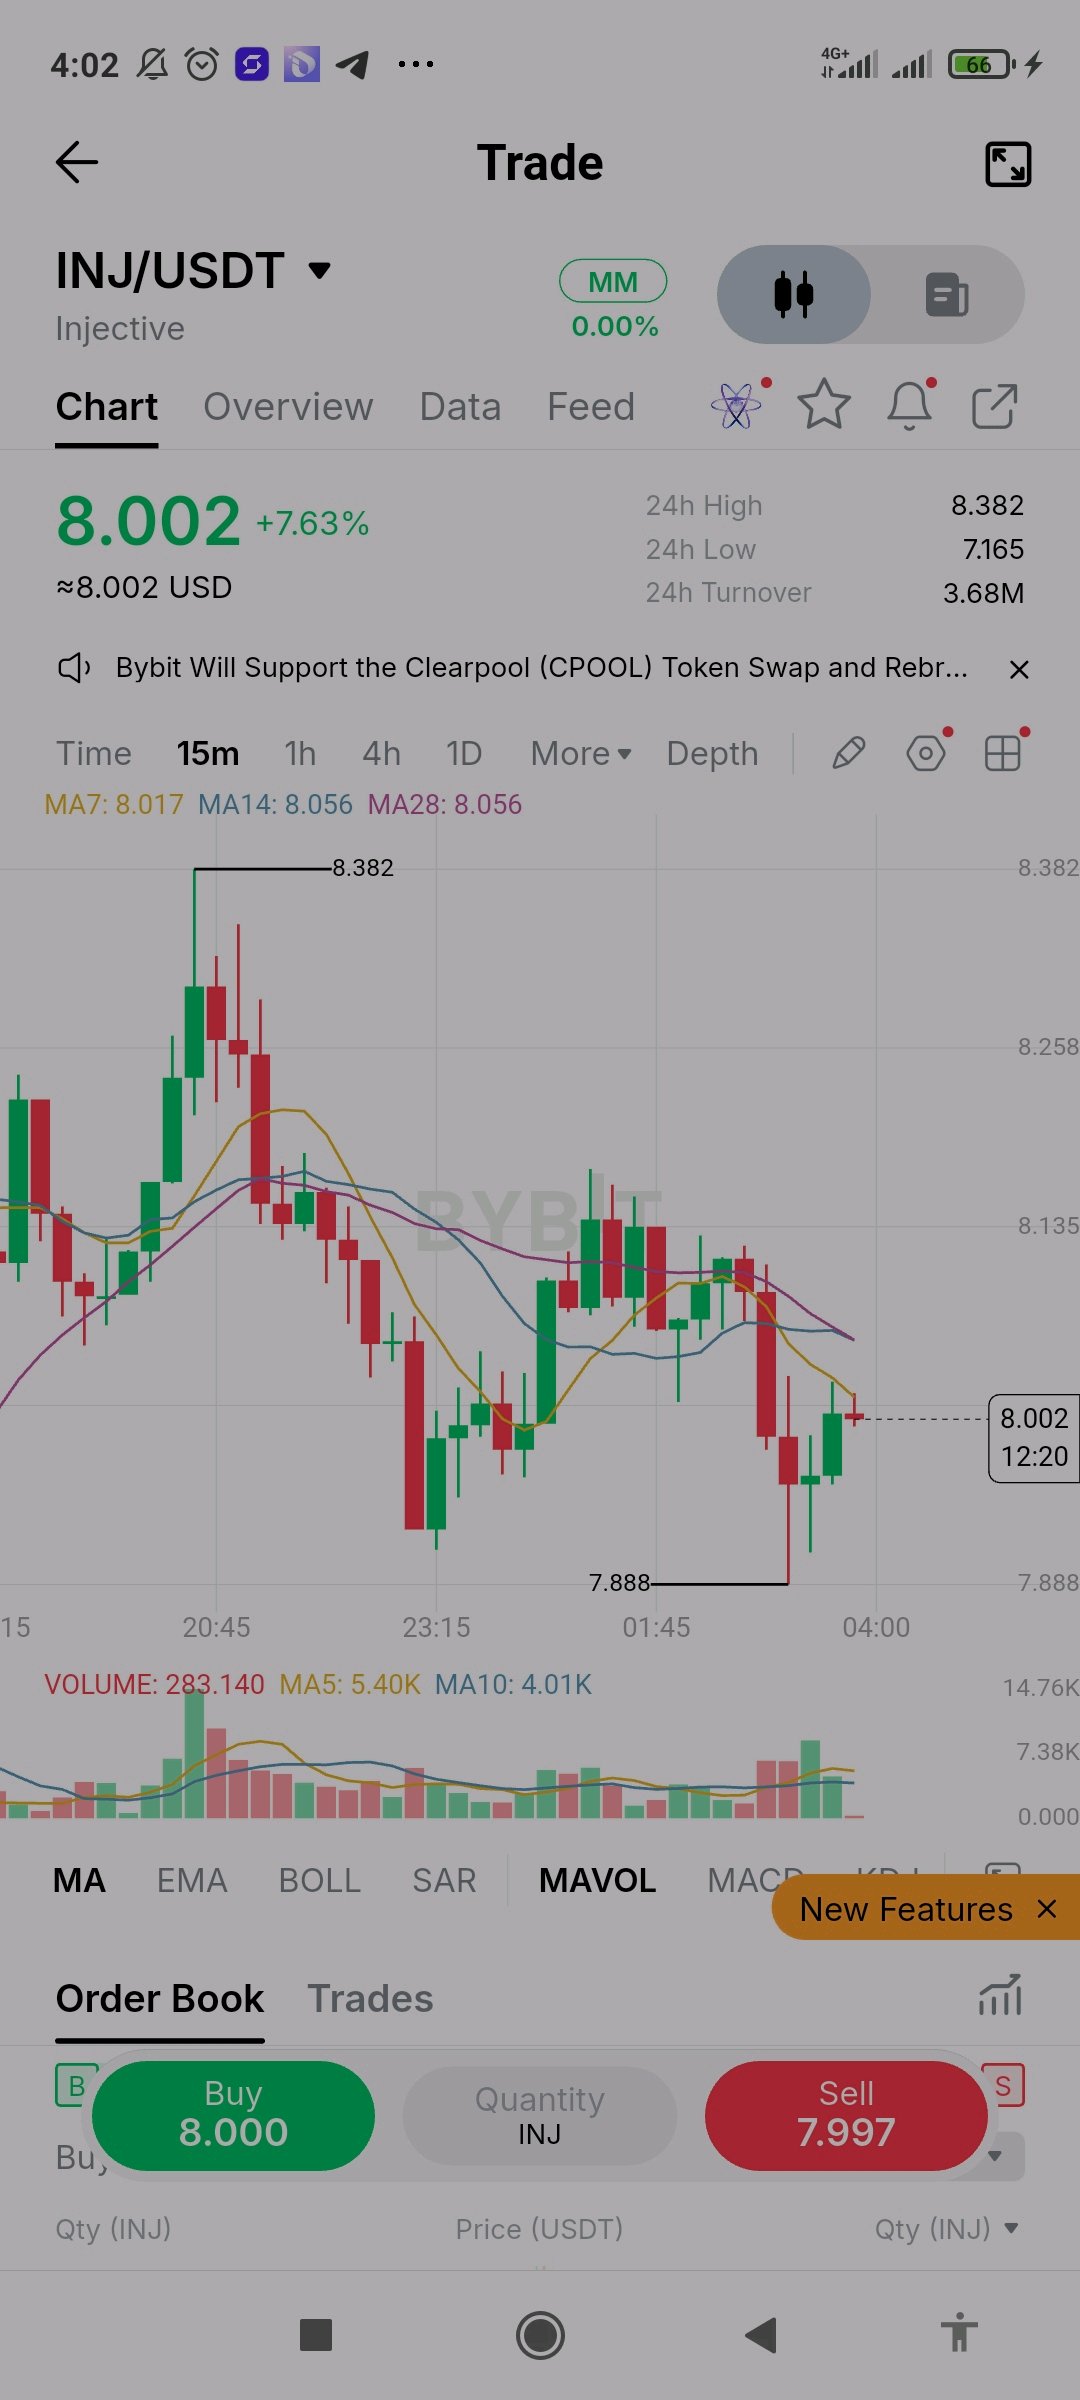
$NEARUSDT está en 3.549 en el gráfico de 15m, arriba un 3.4% en el día y recuperándose tras una caída a 3.444. El precio tocó un máximo de 3.638 temprano, sufrió una venta masiva y luego formó una serie de mínimos más altos. Las medias móviles MA7 (3.536), MA14 (3.521) y MA28 (3.526) están muy juntas, y el precio ahora se sitúa por encima de las tres tras una racha de velas verdes. La recuperación es constructiva, pero las medias siguen planas y enredadas, por lo que aún no se ha formado una tendencia clara. El volumen se ha mantenido bajo desde el pico inicial, lo que significa que los compradores no están mostrando una convicción fuerte. Un cierre por encima de 3.638 favorecería a los toros, mientras que una caída de vuelta por debajo del grupo de medias cerca de 3.52 sugeriría que el rebote está fallando. Aquí no hay nada confirmado. Lección: una recuperación con poco volumen es una prueba, no una tendencia. Espera a que el precio supere la resistencia con el cierre de una vela y ajusta el tamaño de tu operación para que una ruptura fallida se mantenga pequeña. #IMPACTbyTrade $NEARUSDT $BTCUSDT
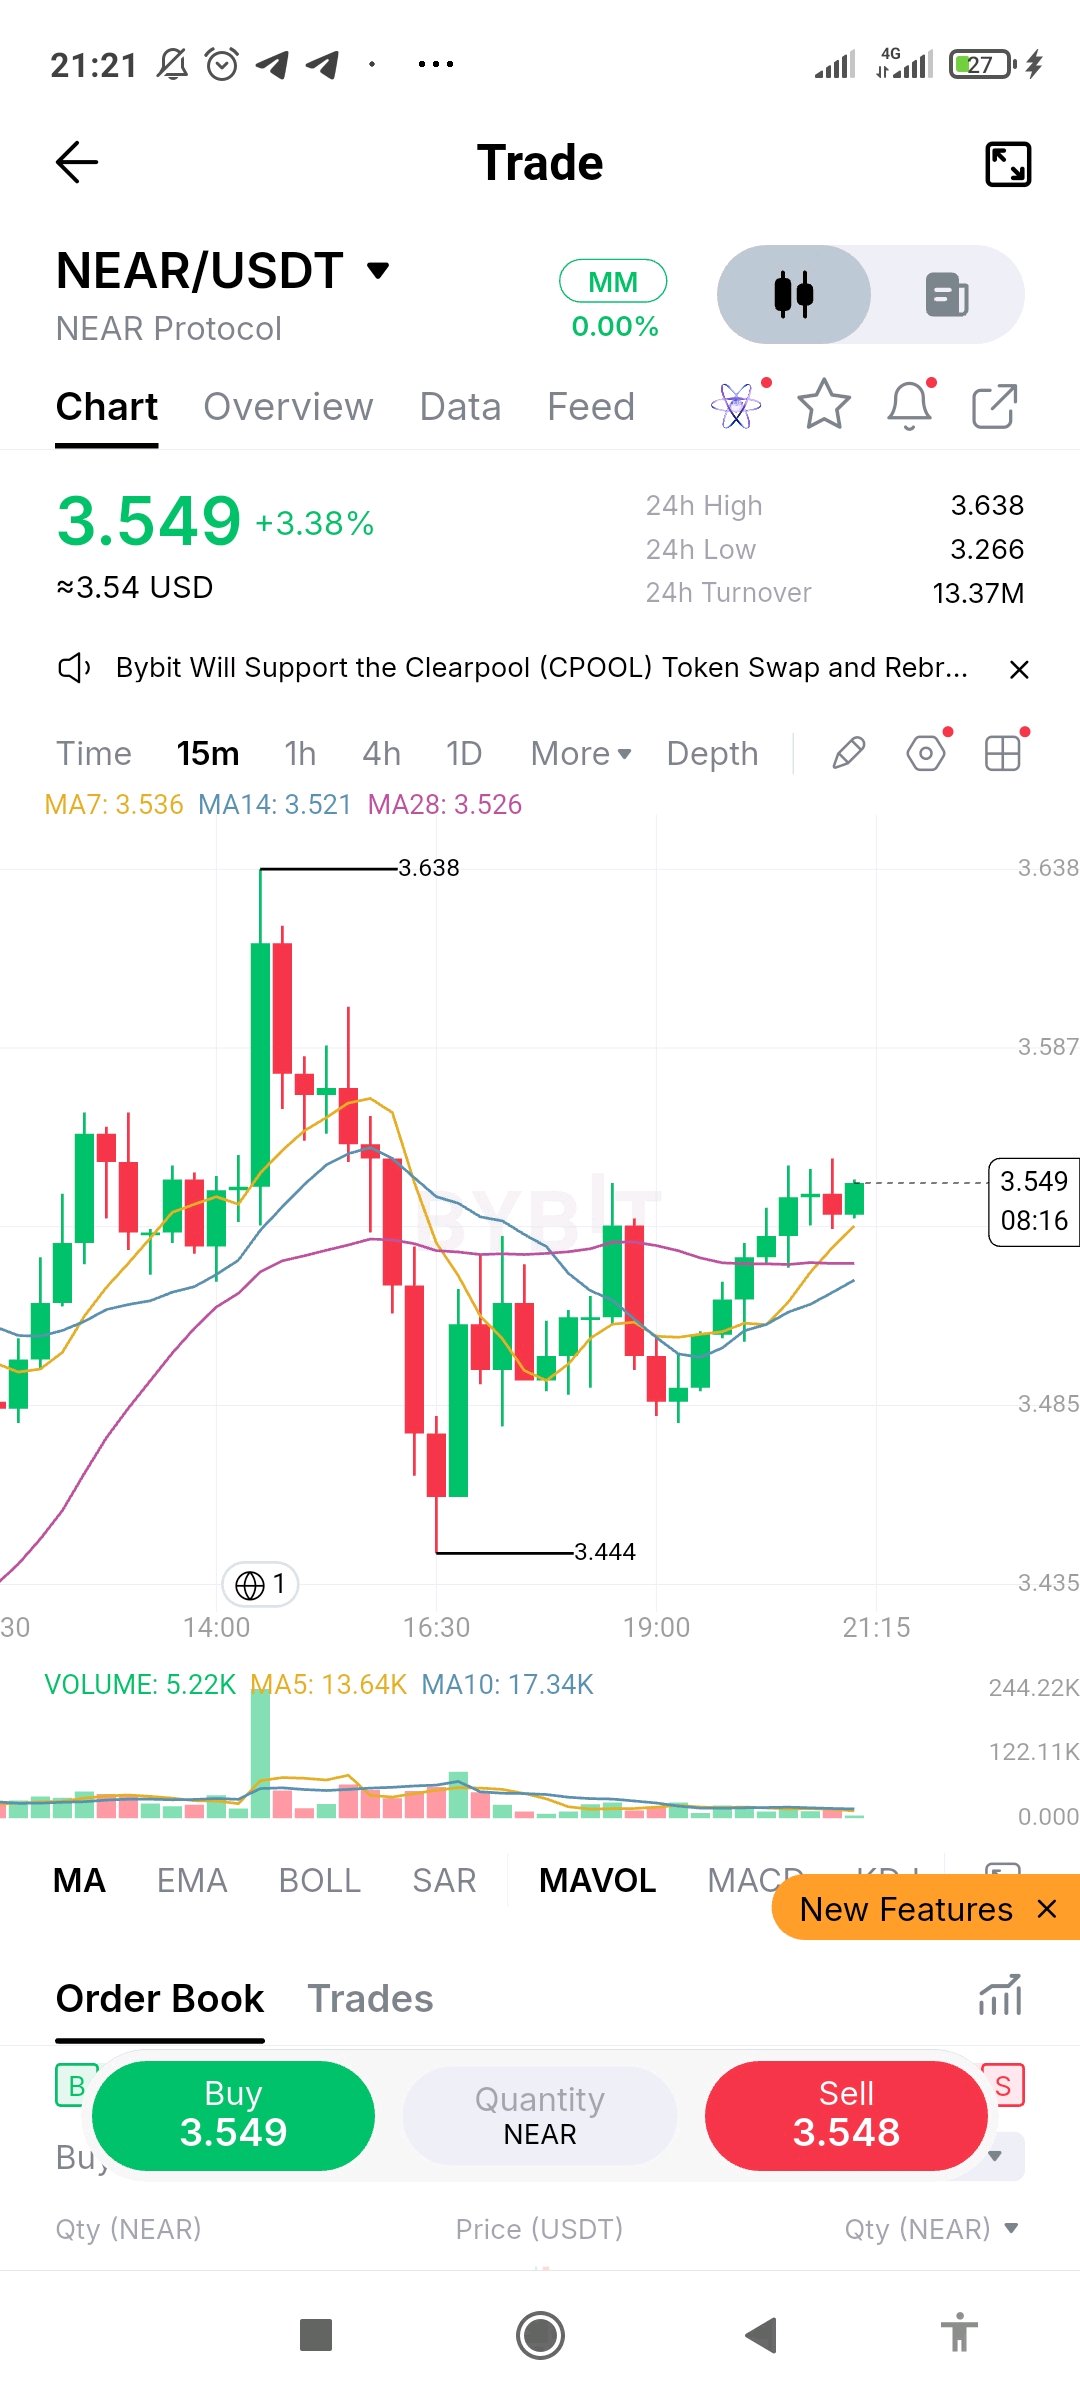
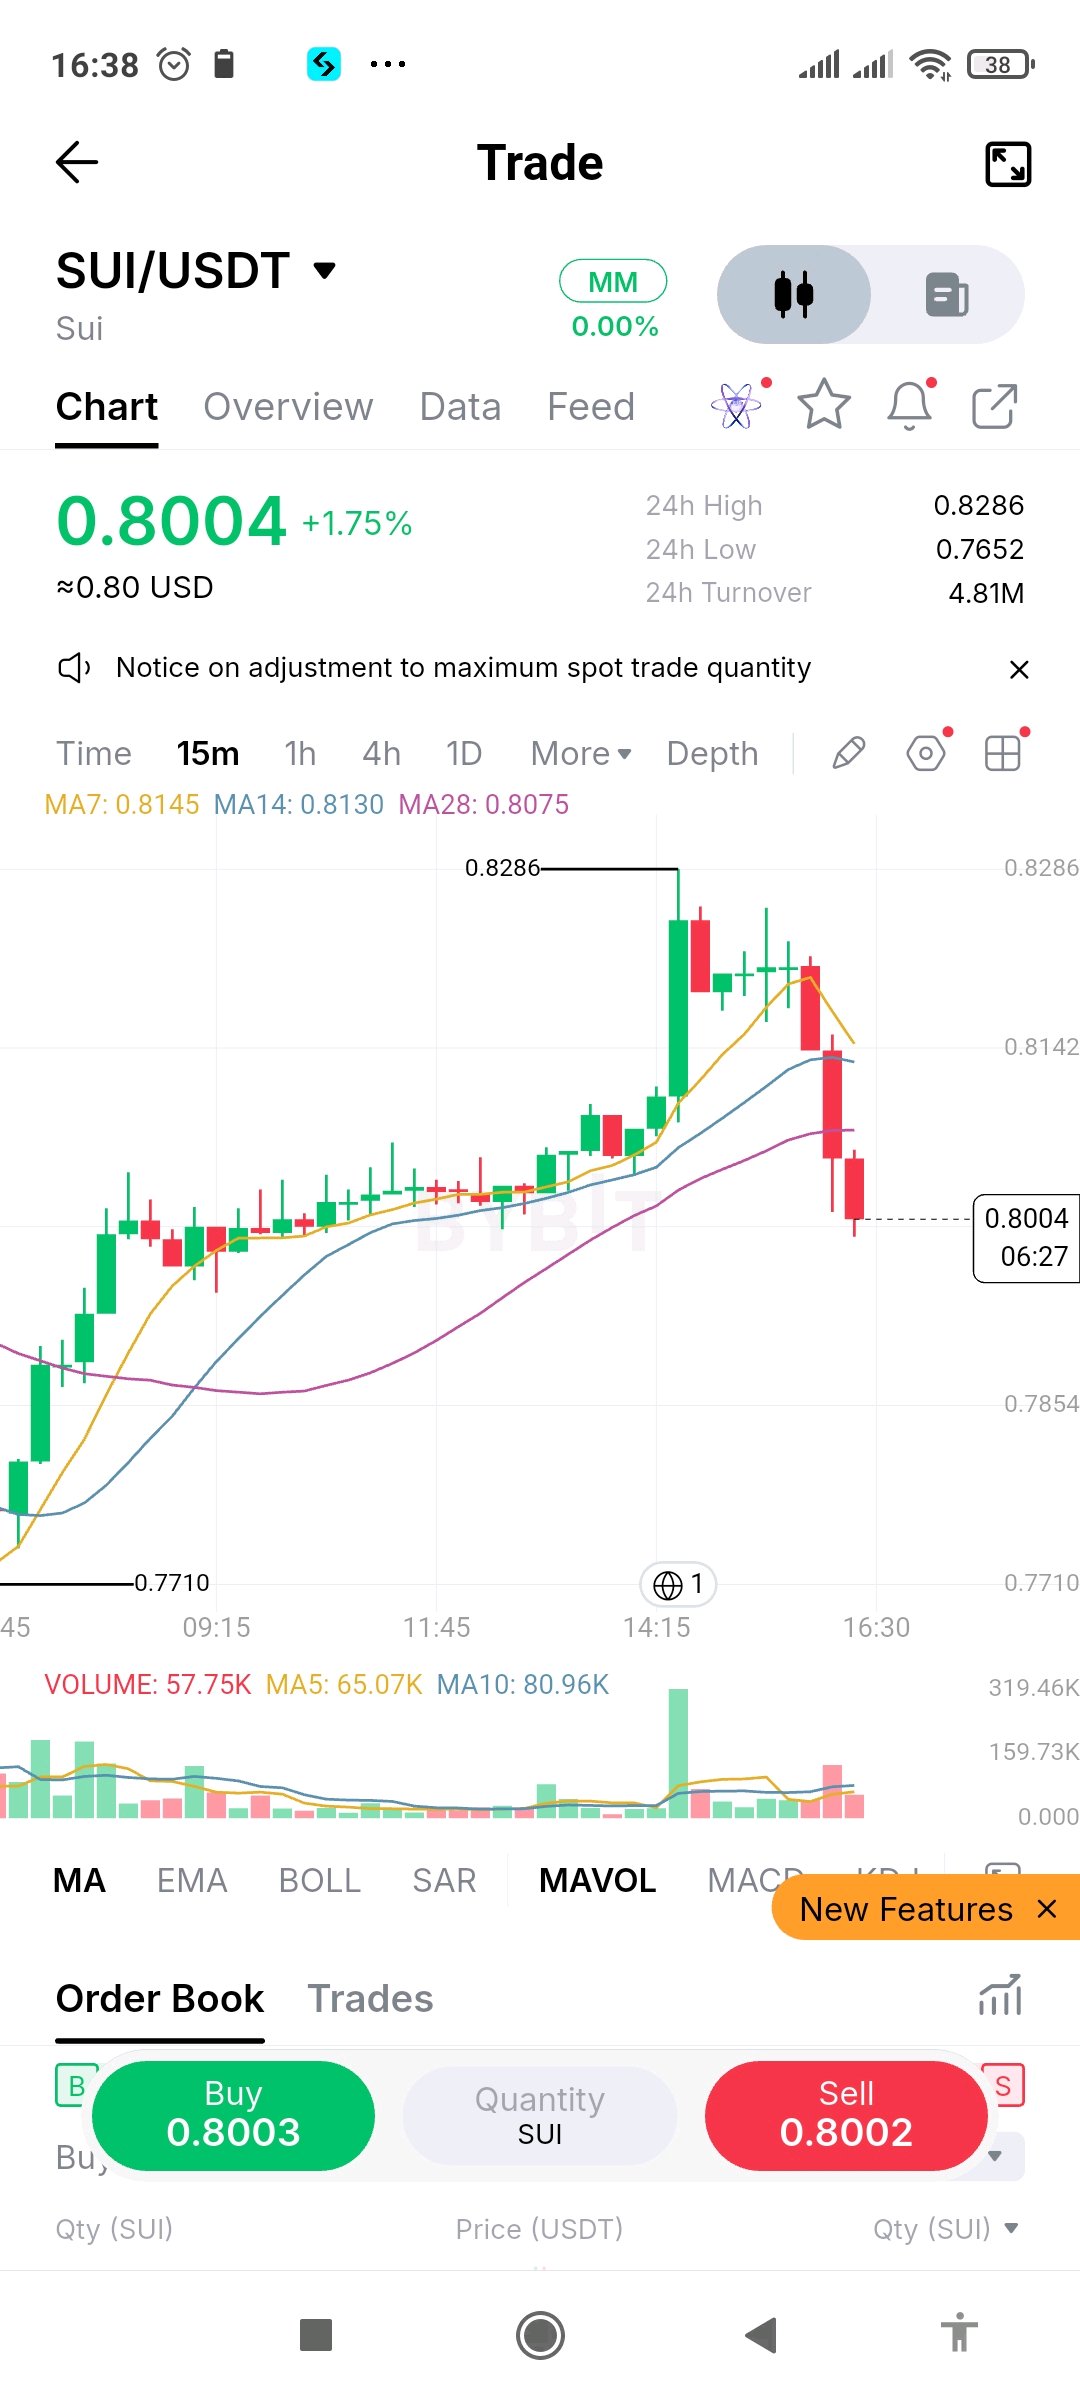
$SUIUSDT is at 0.8004 on the 15m chart, up about 1.8% on the day, but the short-term picture has turned sharply. Price climbed from the 0.7710 area to a high of 0.8286, then dropped through MA7 (0.8145), MA14 (0.8130) and MA28 (0.8075) in a run of red candles. All three averages are now above price, and MA7 has started to curl down. The 0.7710 low and the 0.7854 gridline are the next reference levels if selling continues. A bounce would likely meet resistance near MA28 around 0.8075, and a close back above it would show sellers losing control. Volume on the drop is moderate and well below the spike at the top, so conviction looks limited. Nothing here is confirmed. Lesson: when price falls through all its moving averages at once, the structure has changed, even inside a green day. Don't catch the drop blindly. Wait for a higher low, and keep your size small enough that being wrong stays affordable. #IMPACTbyTrade $SUIUSDT $BTCUSDT
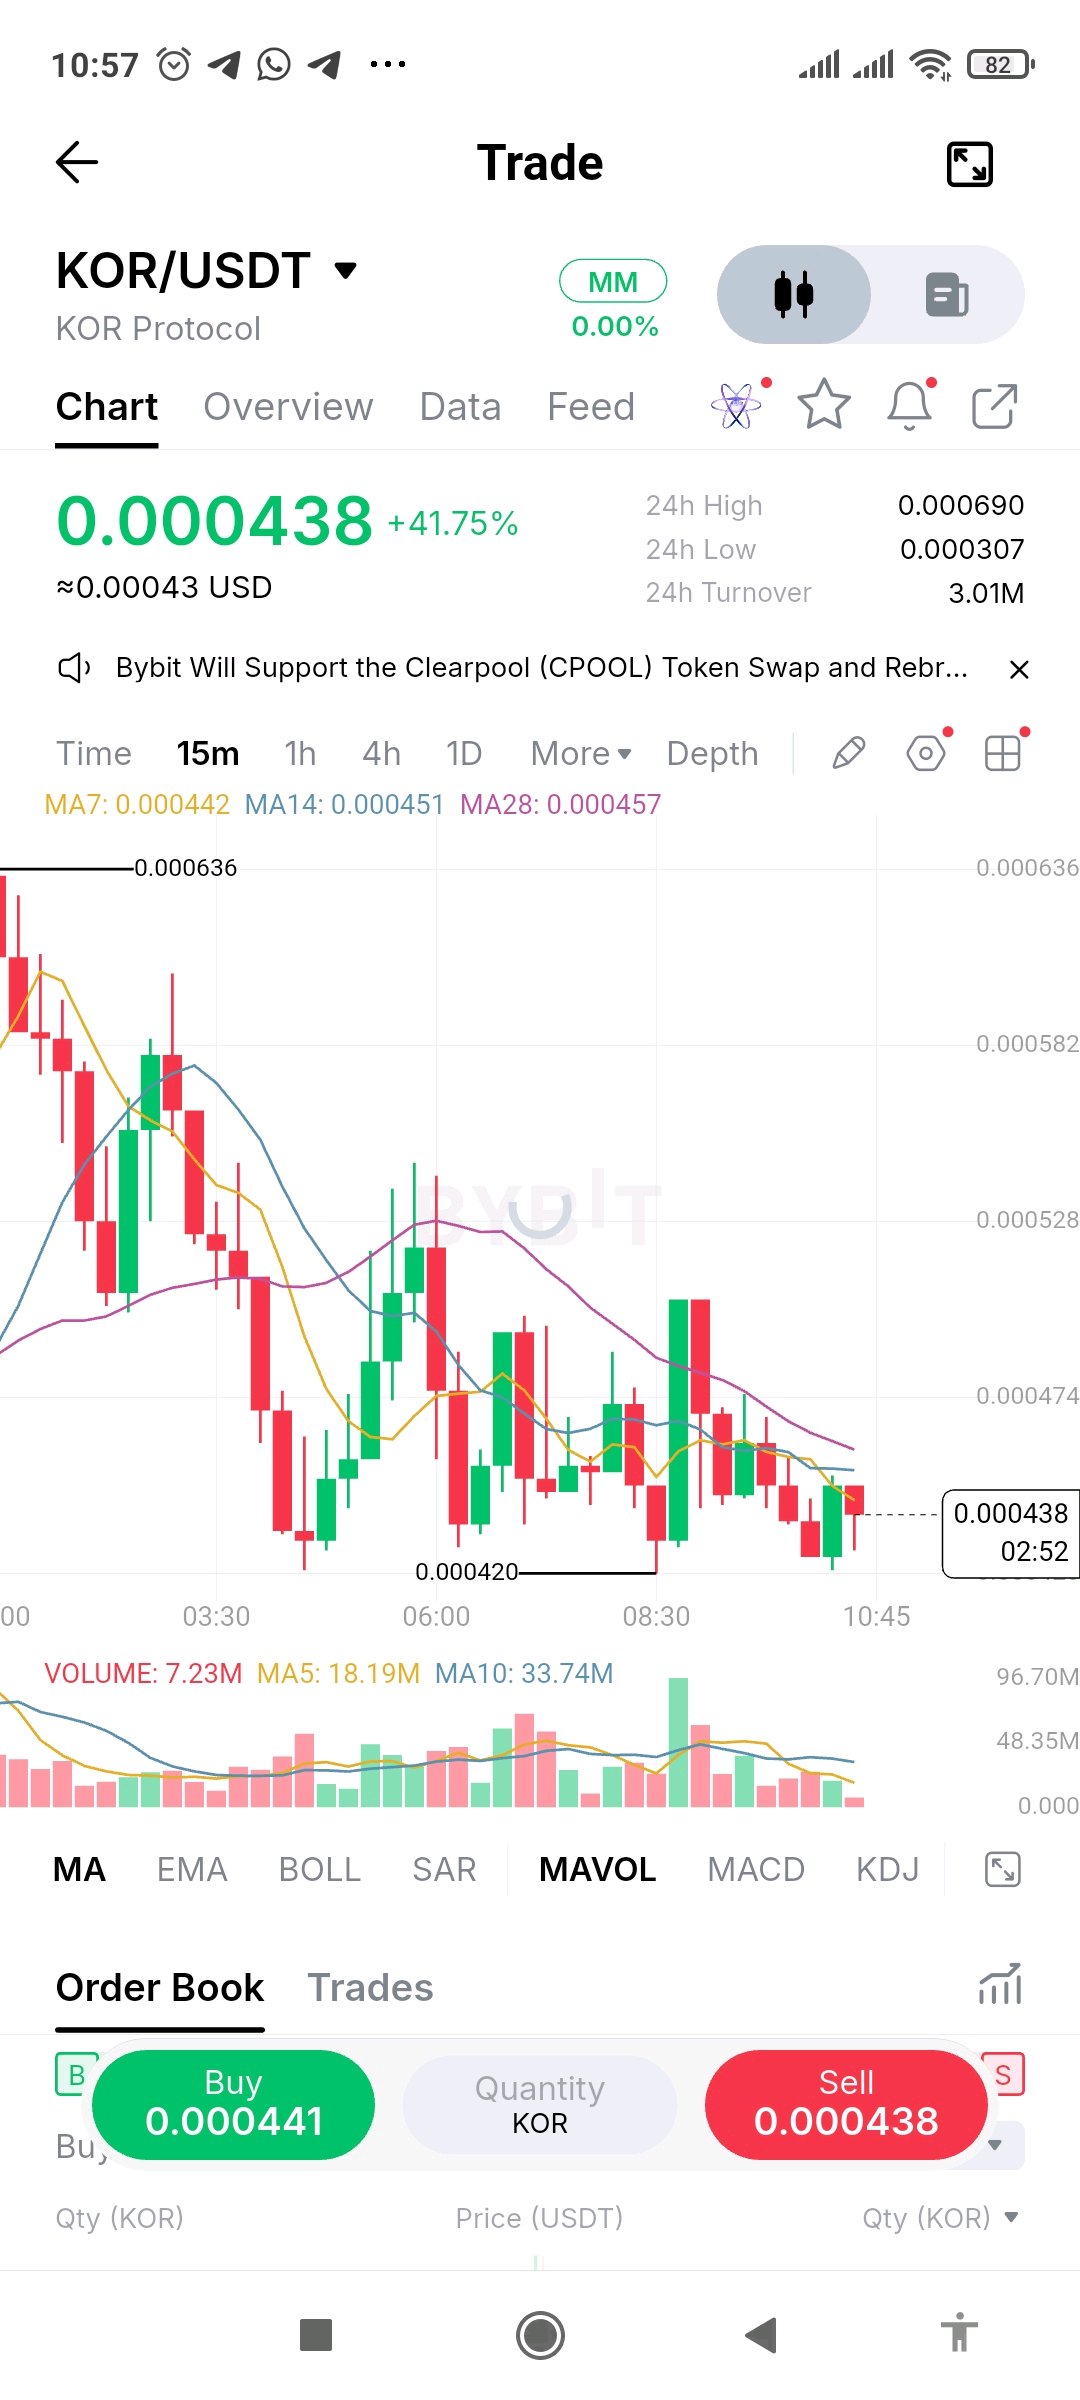
$KORUSDT is at 0.000438 on the 15m chart, up about 42% on the day, but the short-term picture is weak. The 24h range is huge (0.000307 to 0.000690), and price has since slid from the 0.000636 area in a series of lower highs. MA7 (0.000442), MA14 (0.000451) and MA28 (0.000457) are stacked in bearish order and sloping down, with price trading below all three. The 0.000420 low is the level to watch. Holding it could lead to a bounce toward MA7, but a clean break below would suggest sellers are still in control. Volume has faded a lot from the earlier bursts, so the recent drift lower is happening on thinner participation. Nothing here is confirmed. Lesson: a big green daily percentage can hide a chart that is already falling. After a wild 24-hour range, swings can be sharp and stops can fill worse than planned. Judge the trade by where price is now, wait for a higher low, and keep your size small. #IMPACTbyTrade $KORUSDT $BTCUSDT
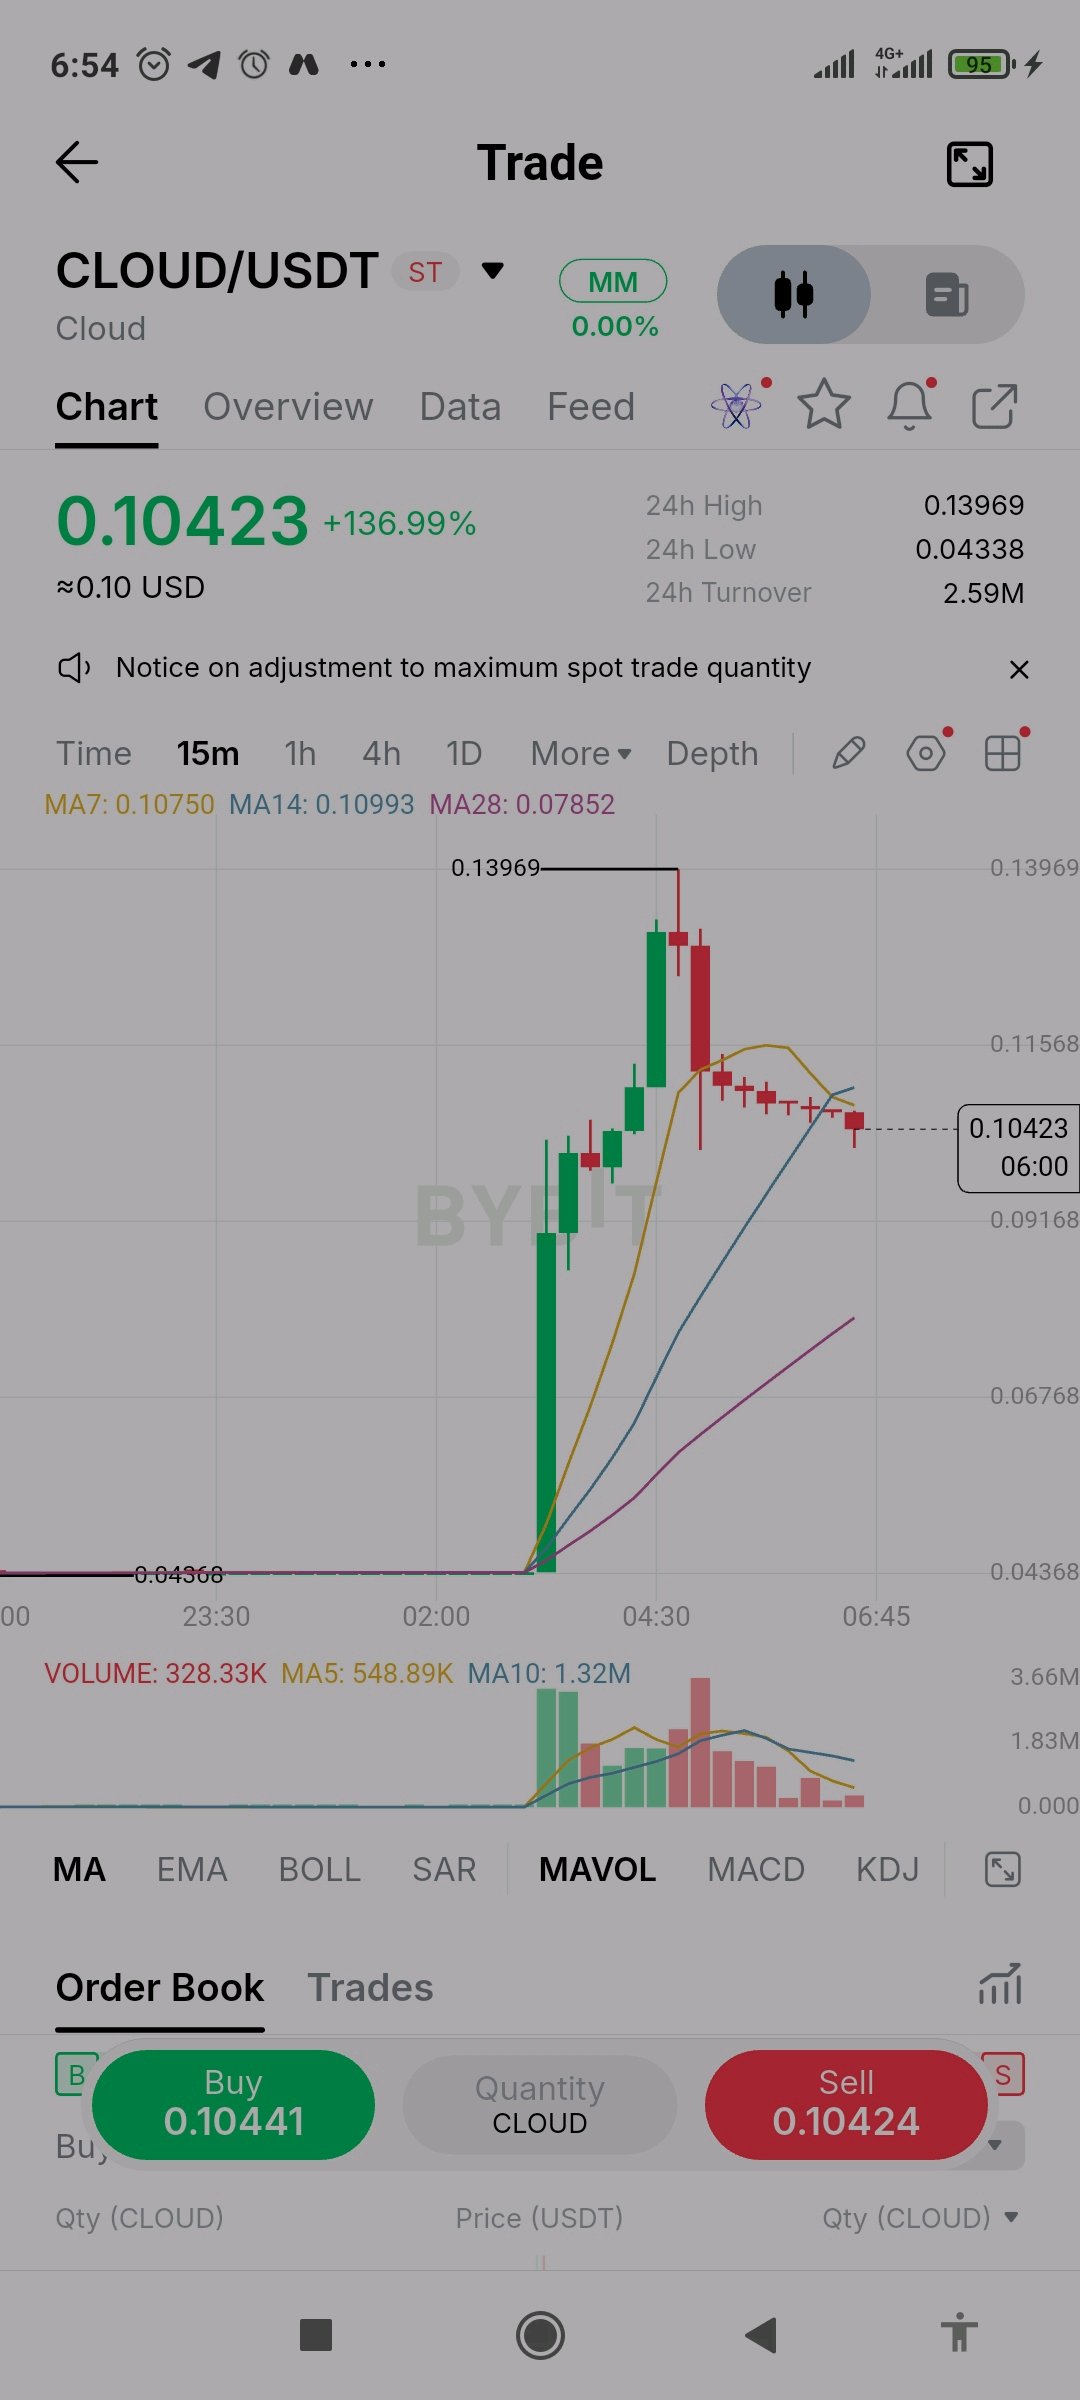
$CLOUDUSDT is at 0.10423 on the 15m chart, up about 137% on the day after a vertical move from a flat base near 0.04368 to a high of 0.13969. Price has since rolled over into a run of small red candles and is now slipping under MA7 (0.10750) and MA14 (0.10993), with MA28 (0.07852) still far below. Volume exploded on the breakout and has faded steadily during the pullback, so selling is calm rather than panicked, but that is only a possibility. The wide gap down to MA28 shows how stretched the move is, and a drop below the MA cluster would put that gap in play. Reclaiming MA14 would show buyers returning. Nothing here is confirmed. Lesson: after a 137% day, risk is at its highest even when the chart looks strong. Moves this fast can reverse just as fast, and thin liquidity can make stops fill worse than planned. Avoid chasing, keep your size very small, and never risk more than you can afford to lose. #IMPACTbyTrade $CLOUDUSDT $BTCUSDT
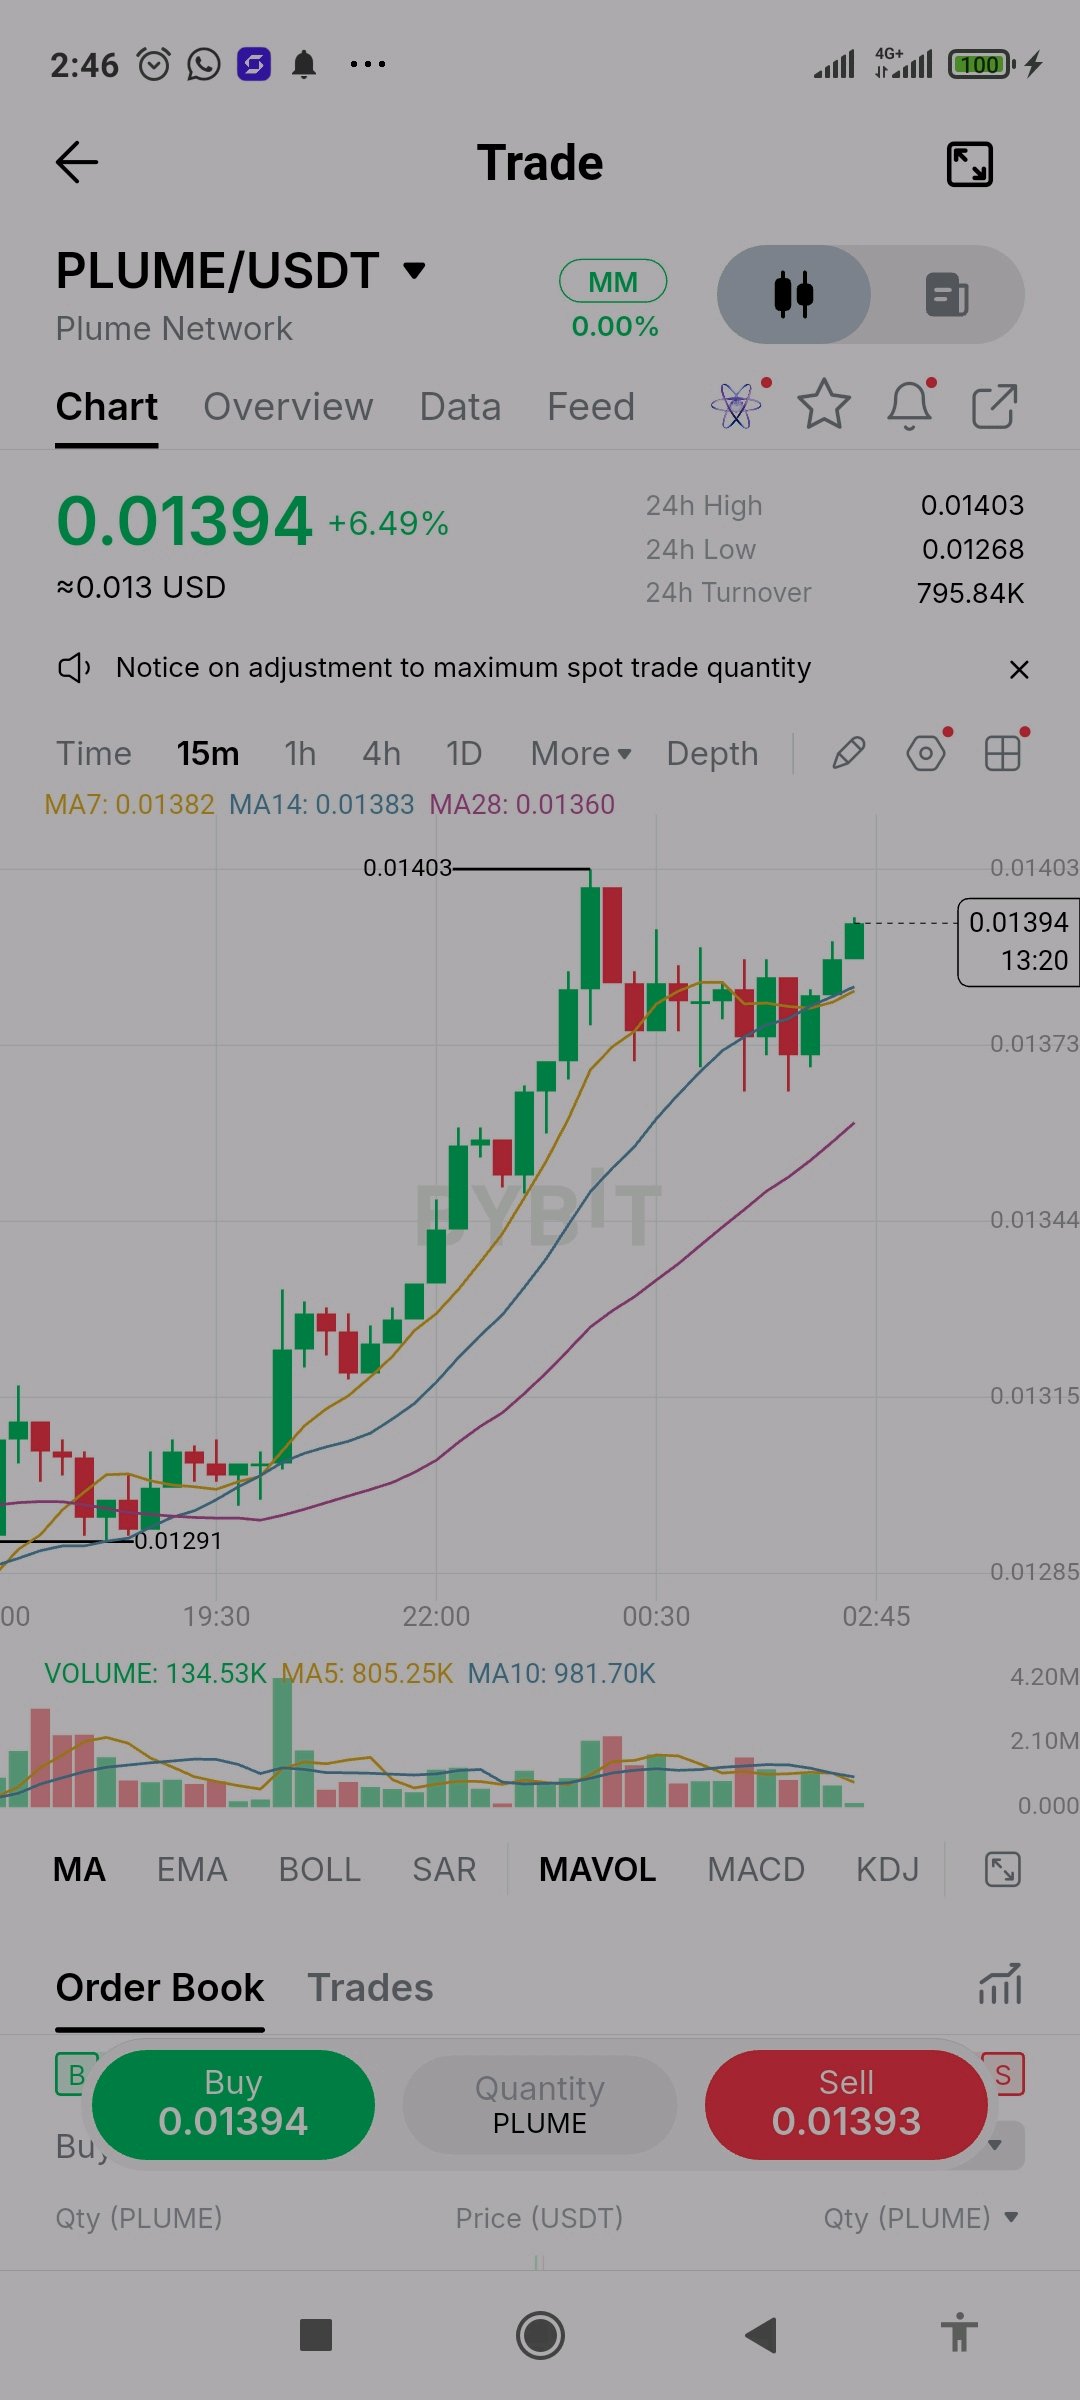
$PLUMEUSDT está en 0.01394 en la gráfica de 15m, subiendo cerca de un 6.5% en el día tras una escalada constante desde el área de 0.01291 hasta un máximo de 0.01403. Las MA7 (0.01382), MA14 (0.01383) y MA28 (0.01360) están subiendo, con la MA7 y la MA14 casi fusionadas justo debajo del precio. Después del pico, el precio retrocedió y se consolidó lateralmente antes de que la última vela verde lo empujara de nuevo hacia el máximo. La estructura es constructiva, pero el precio ahora está presionando justo debajo de la resistencia de 0.01403, la cual ya fue rechazada una vez. El volumen ha disminuido desde la subida principal, por lo que este segundo empuje tiene poco respaldo hasta ahora. Un cierre por encima de 0.01403 favorecería a los compradores, mientras que una caída por debajo de la zona de la MA7/MA14 cerca de 0.0138 sería la primera advertencia. Aquí no hay nada confirmado. Lección: una segunda prueba de resistencia con volumen decreciente puede fallar tan fácilmente como puede romperla. Espera a que la vela cierre por encima del nivel y ajusta el tamaño de tu operación para que un rompimiento fallido no te afecte demasiado. #IMPACTbyTrade $PLUMEUSDT $BTCUSDT
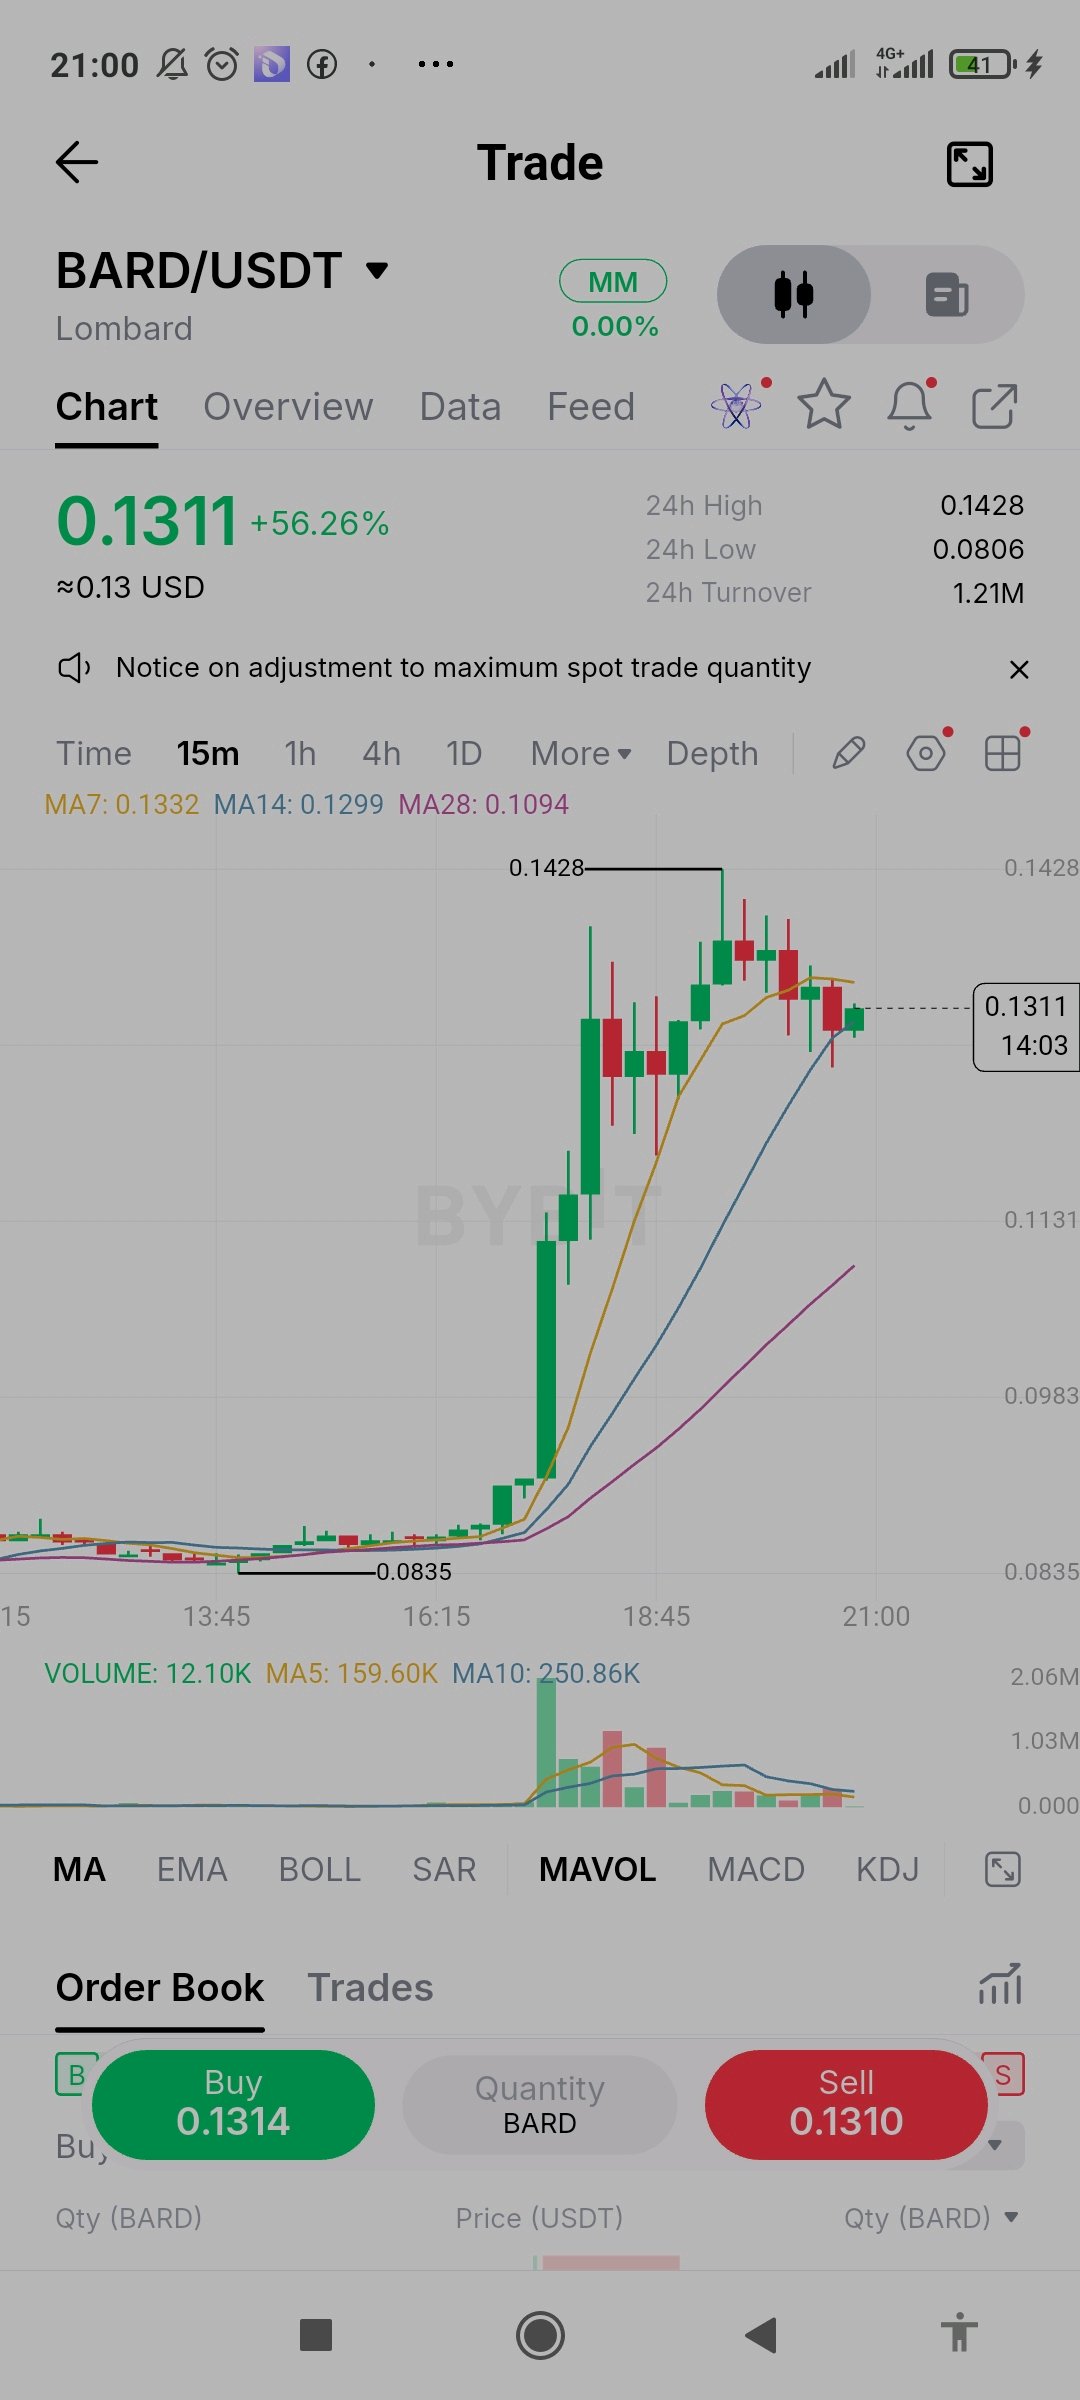
$BARDUSDT is at 0.1311 on the 15m chart, up about 56% on the day after a near-vertical move from a flat base around 0.0835 to a high of 0.1428. MA7 (0.1332), MA14 (0.1299) and MA28 (0.1094) are in bullish order and sloping up, but MA28 is far below price, which shows how stretched the move is. Price is now pulling back and sitting right between MA7 and MA14. Volume exploded during the breakout and has faded a lot since, so the pullback is happening on much lighter participation. That may be profit-taking, but it is only a possibility. A close back above 0.1428 would favor buyers, while a drop below MA14 near 0.1299 would be the first sign the move is cooling and would put the wide gap down to MA28 in play. Nothing here is confirmed. Lesson: after a 56% day, risk is at its highest even when the chart looks strong. The further price is from its averages, the more a pullback can cost late buyers. Avoid chasing, keep your size small, and set your exit before you enter. #IMPACTbyTrade $BARDUSDT $BTCUSDT
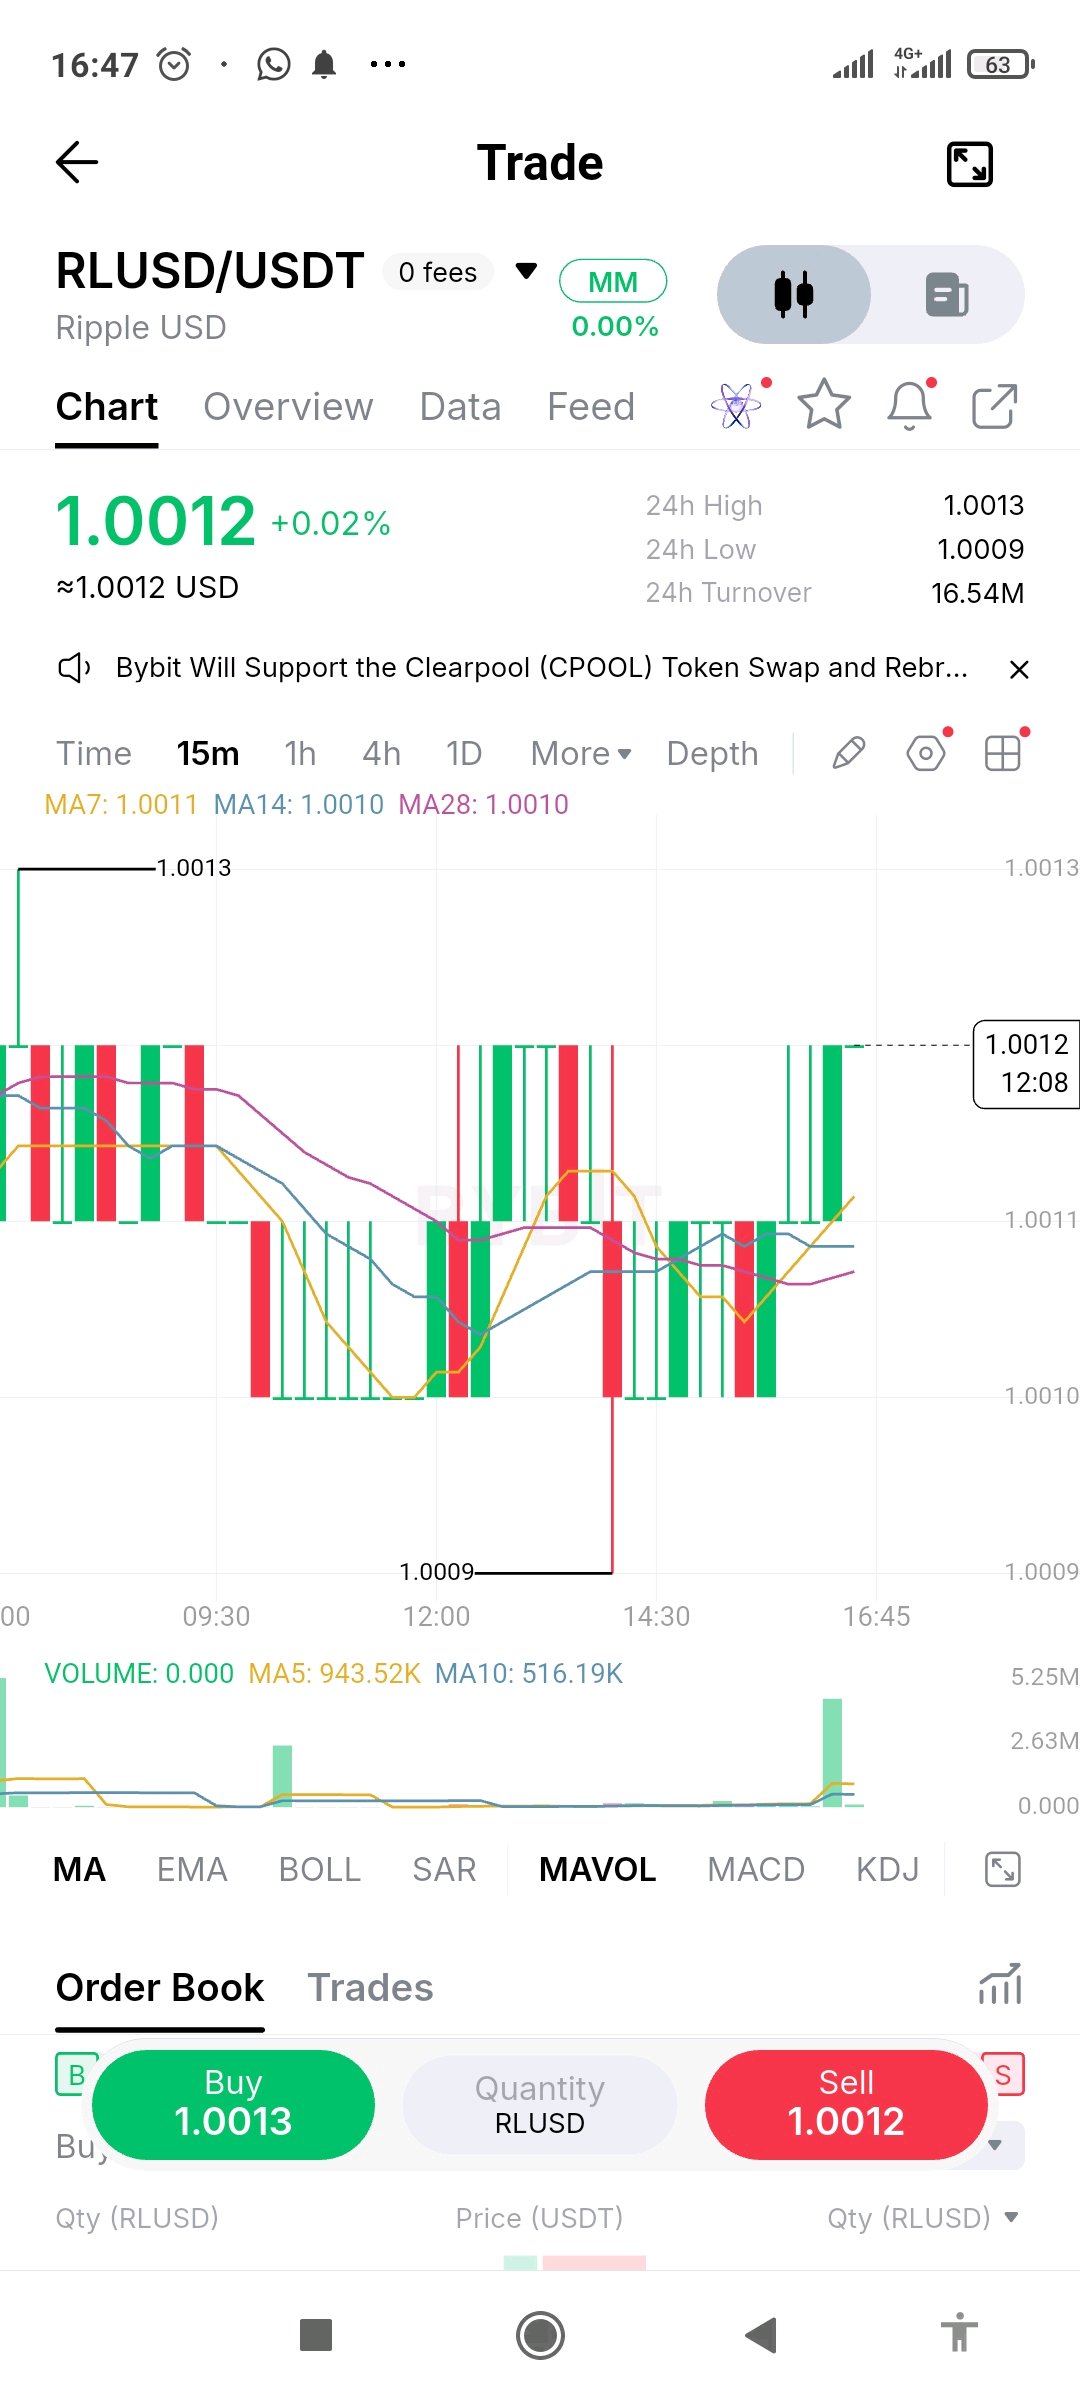
$RLUSDUSDT is at 1.0012 on the 15m chart, up just 0.02% on the day and moving in a razor-thin band between 1.0009 and 1.0013. This is a stablecoin-style pair, so the blocky candles and sharp-looking swings are only a result of the zoomed-in price axis. MA7 (1.0011), MA14 (1.0010) and MA28 (1.0010) are almost identical, and price is bouncing between roughly 1.0010 and 1.0012. The one brief dip to 1.0009 recovered quickly. Volume is near zero on most candles apart from a couple of isolated bars, so this is thin, quiet trading rather than a trend. A move of a hundredth of a percent is noise here, not a signal. Any real warning would be a large, sustained move away from 1.00, and nothing on this chart shows that. Lesson: always check the scale of the price axis before reading a chart. On stable pairs, fees and spread can easily exceed any gain from these tiny moves, so don't mistake dramatic candles for opportunity. #IMPACTbyTrade $RLUSDUSDT $BTCUSDT
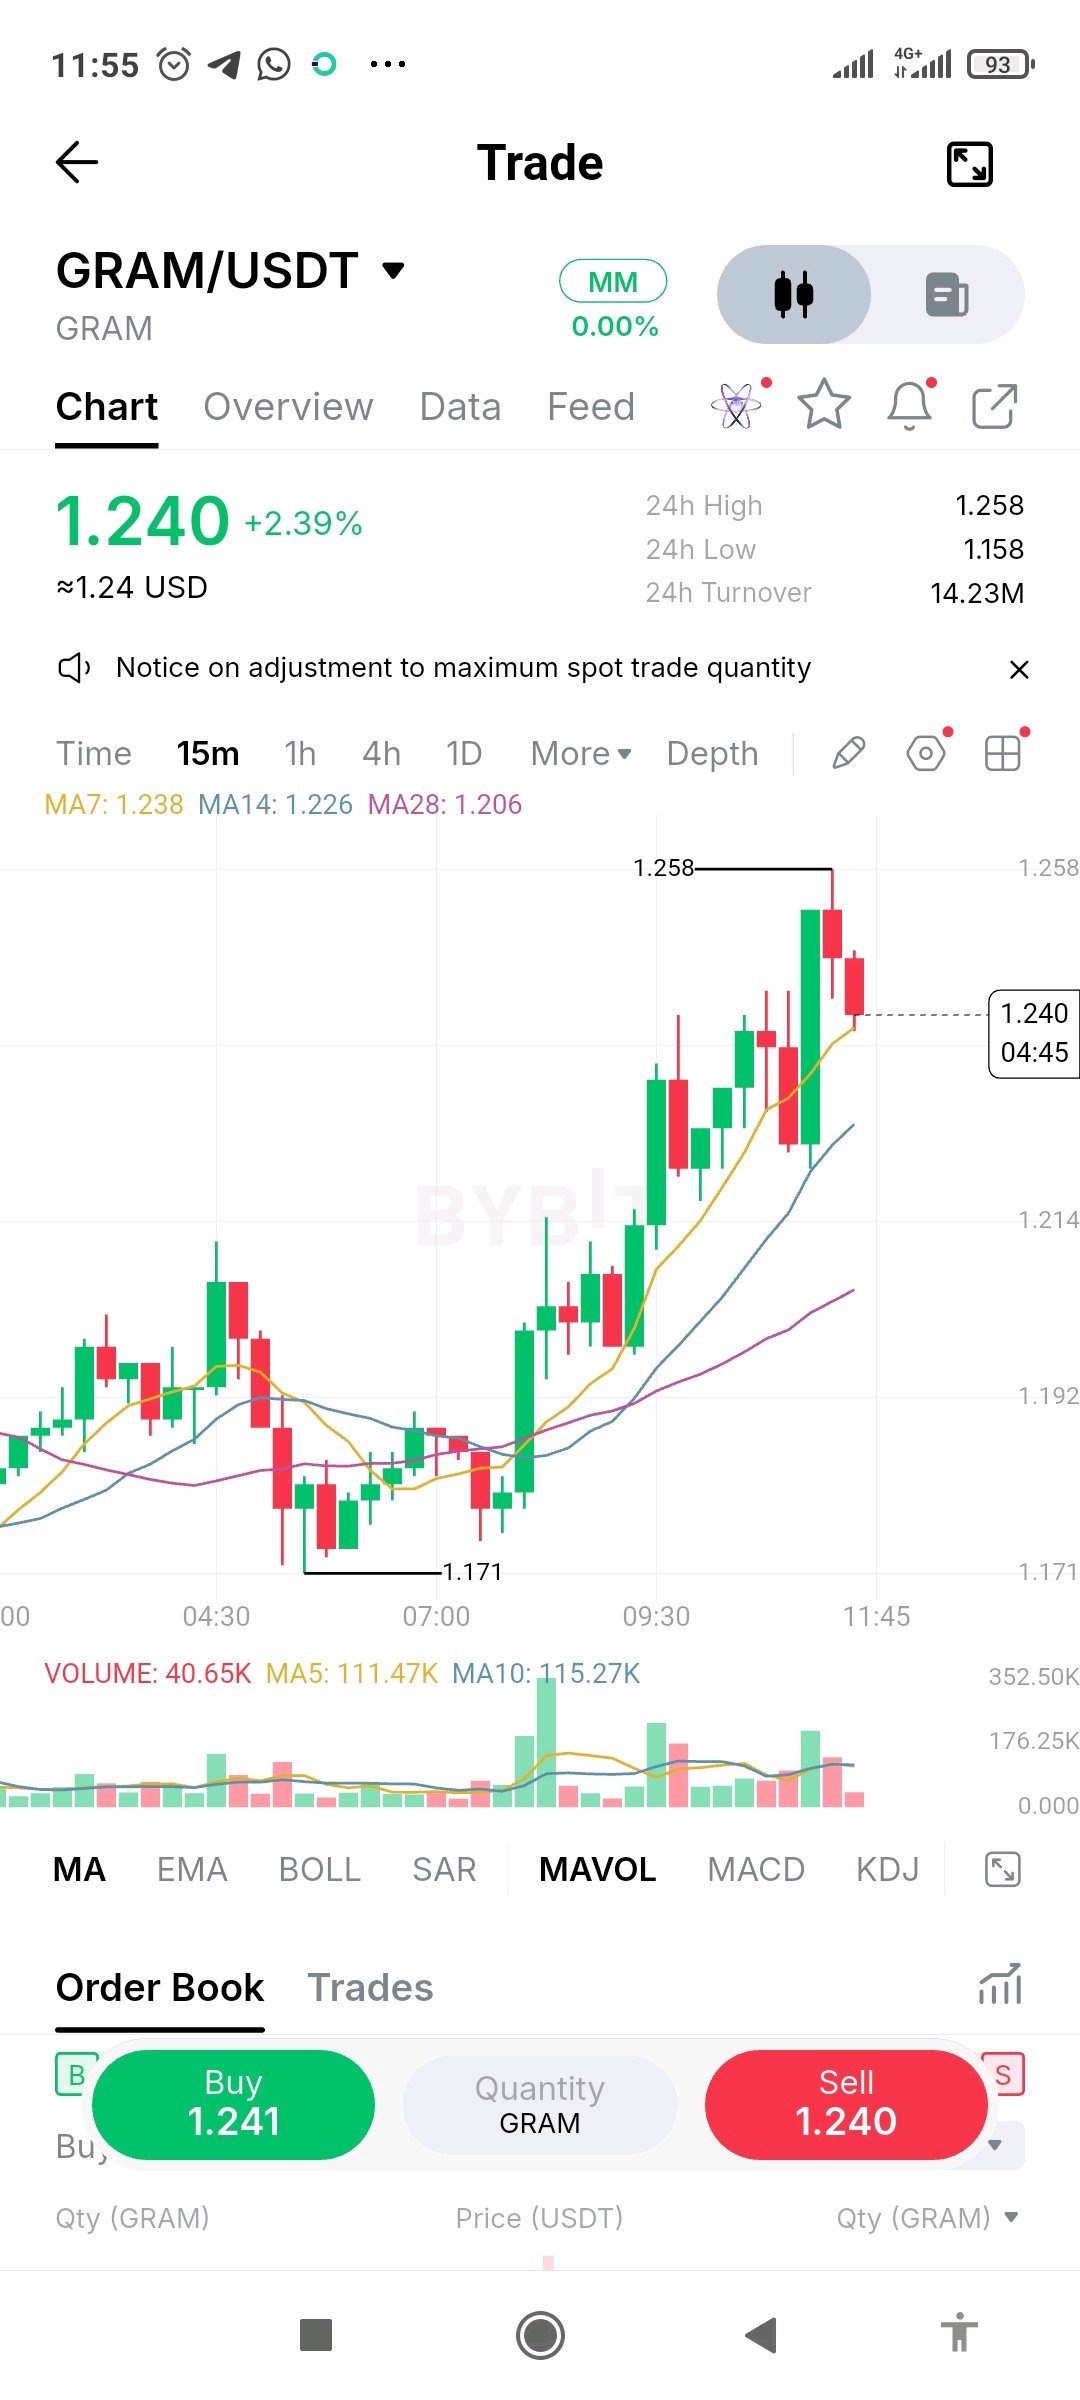
$GRAMUSDT is at 1.240 on the 15m chart, up about 2.4% on the day after a clean climb from the 1.171 area to a high of 1.258. MA7 (1.238), MA14 (1.226) and MA28 (1.206) are stacked in bullish order and fanning upward, with price sitting right on MA7 after two red candles and a rejection wick near the high. The trend is constructive, but momentum is cooling. Volume was strongest during the mid-chart push and has been fading on the last few candles, so buyers are not adding fresh pressure at the top. A close above 1.258 would favor bulls, while a drop below MA7 would be the first warning and a pullback toward MA14 near 1.226 would not be unusual. Nothing here is confirmed. Lesson: when price stalls at a high on fading volume, entering late leaves little room for error. Let the pullback show you where buyers defend, set your exit before you enter, and keep your size small. #IMPACTbyTrade $GRAMUSDT $BTCUSDT
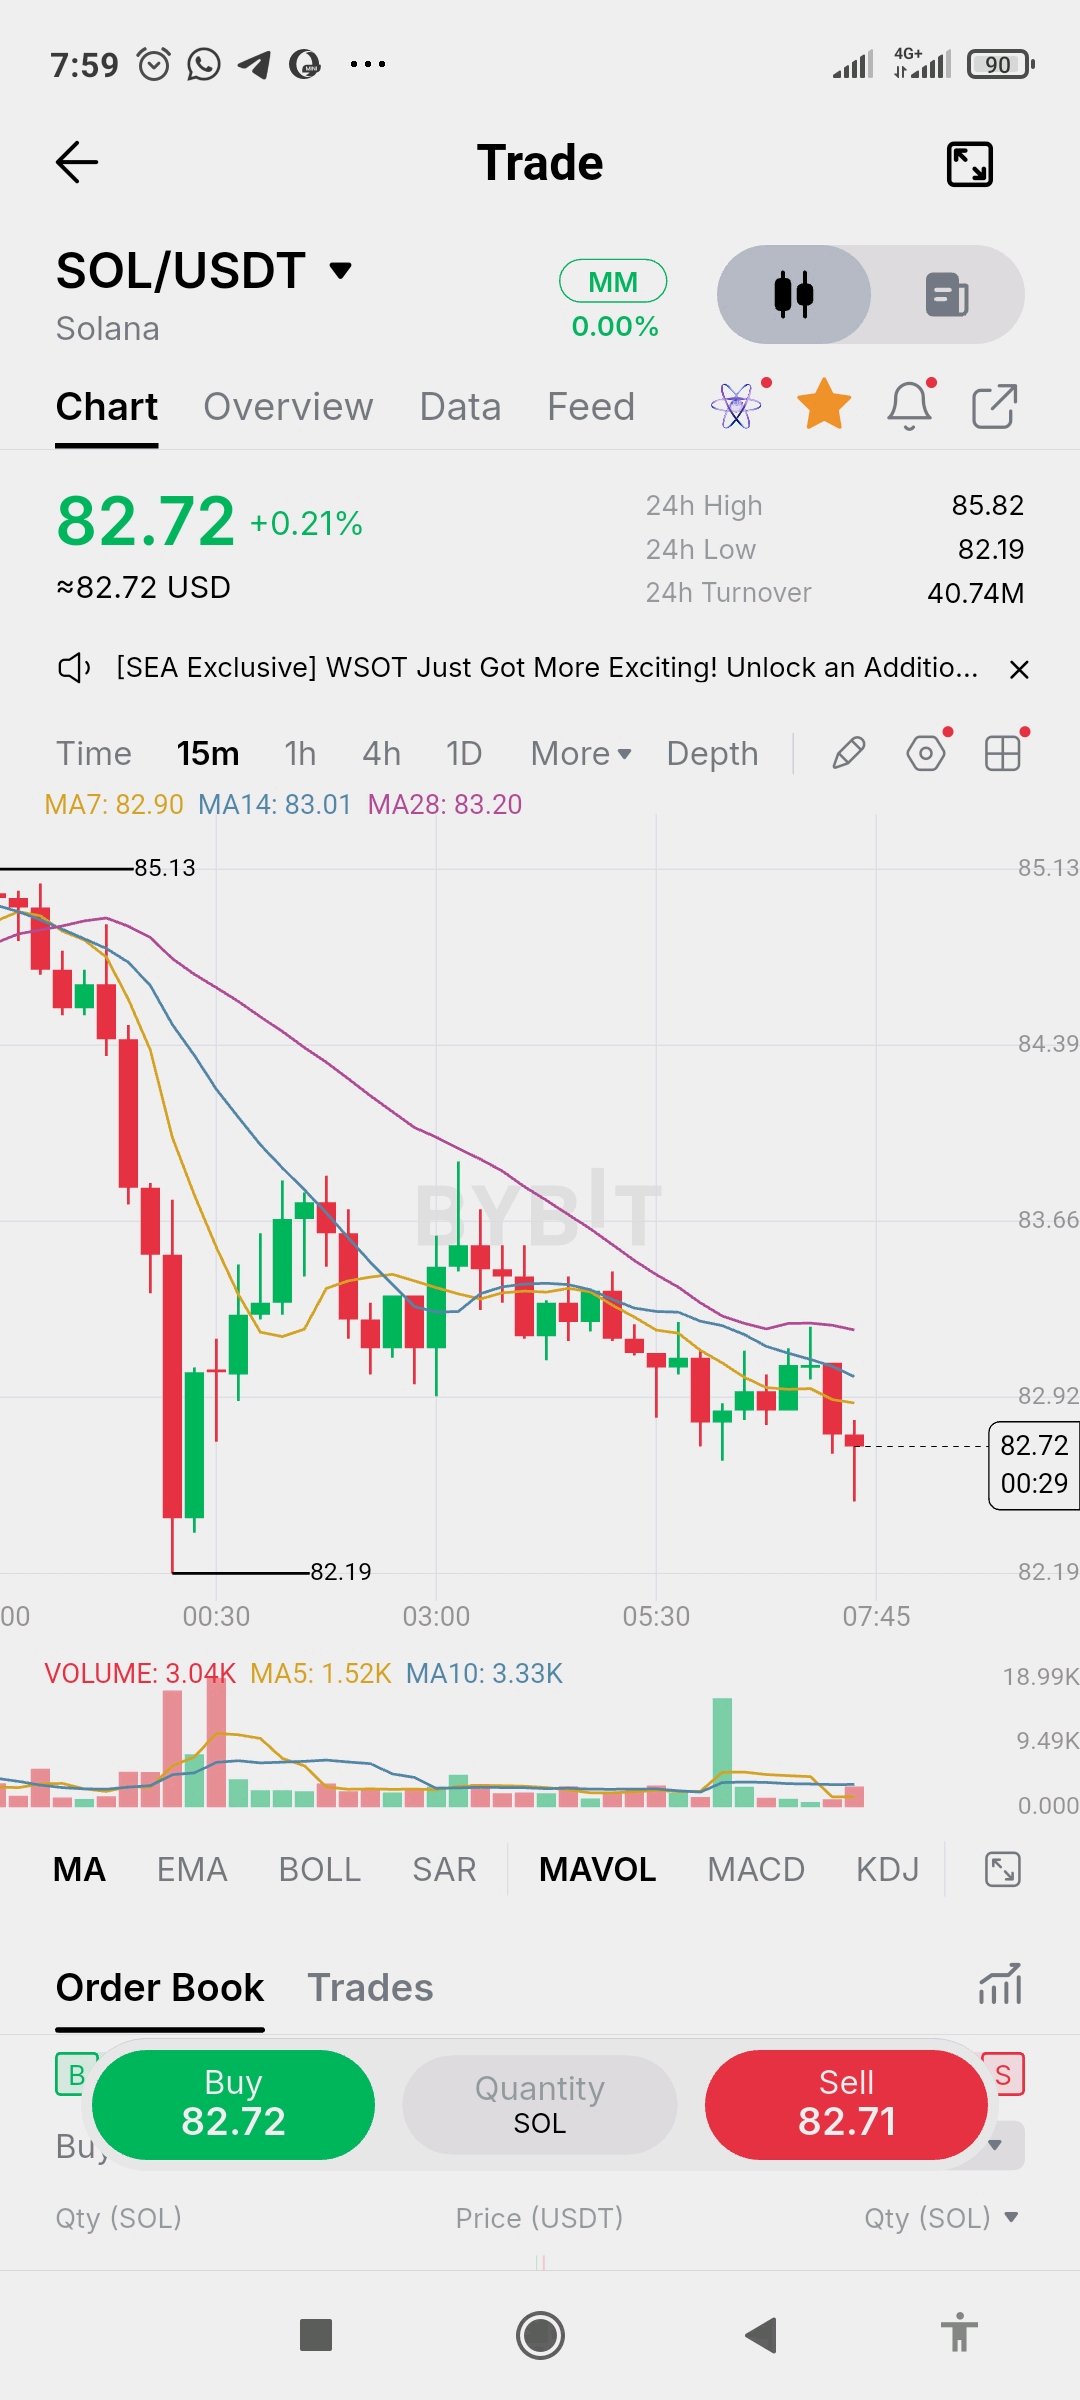
$SOLUSDT is at 82.72 on the 15m chart, up about 0.2% on the day, but the short-term trend is clearly down. Price slid from the 85.13 area to a low of 82.19, bounced, then rolled over again into lower highs. MA7 (82.90), MA14 (83.01) and MA28 (83.20) are stacked in bearish order and all sloping down, with price trading below every one of them. The 82.19 low is the level to watch. A break below it would show sellers still in control, while a bounce would likely meet resistance near the falling MA7 around 82.90. Volume has been light on the recent drift lower, so conviction is low either way. Nothing here is confirmed. Lesson: a flat or green daily percentage can hide a chart that keeps making lower highs. Wait for a higher low or a reclaim of the moving averages before acting, and size your position so one wrong guess stays small. #IMPACTbyTrade $SOLUSDT $BTCUSDT
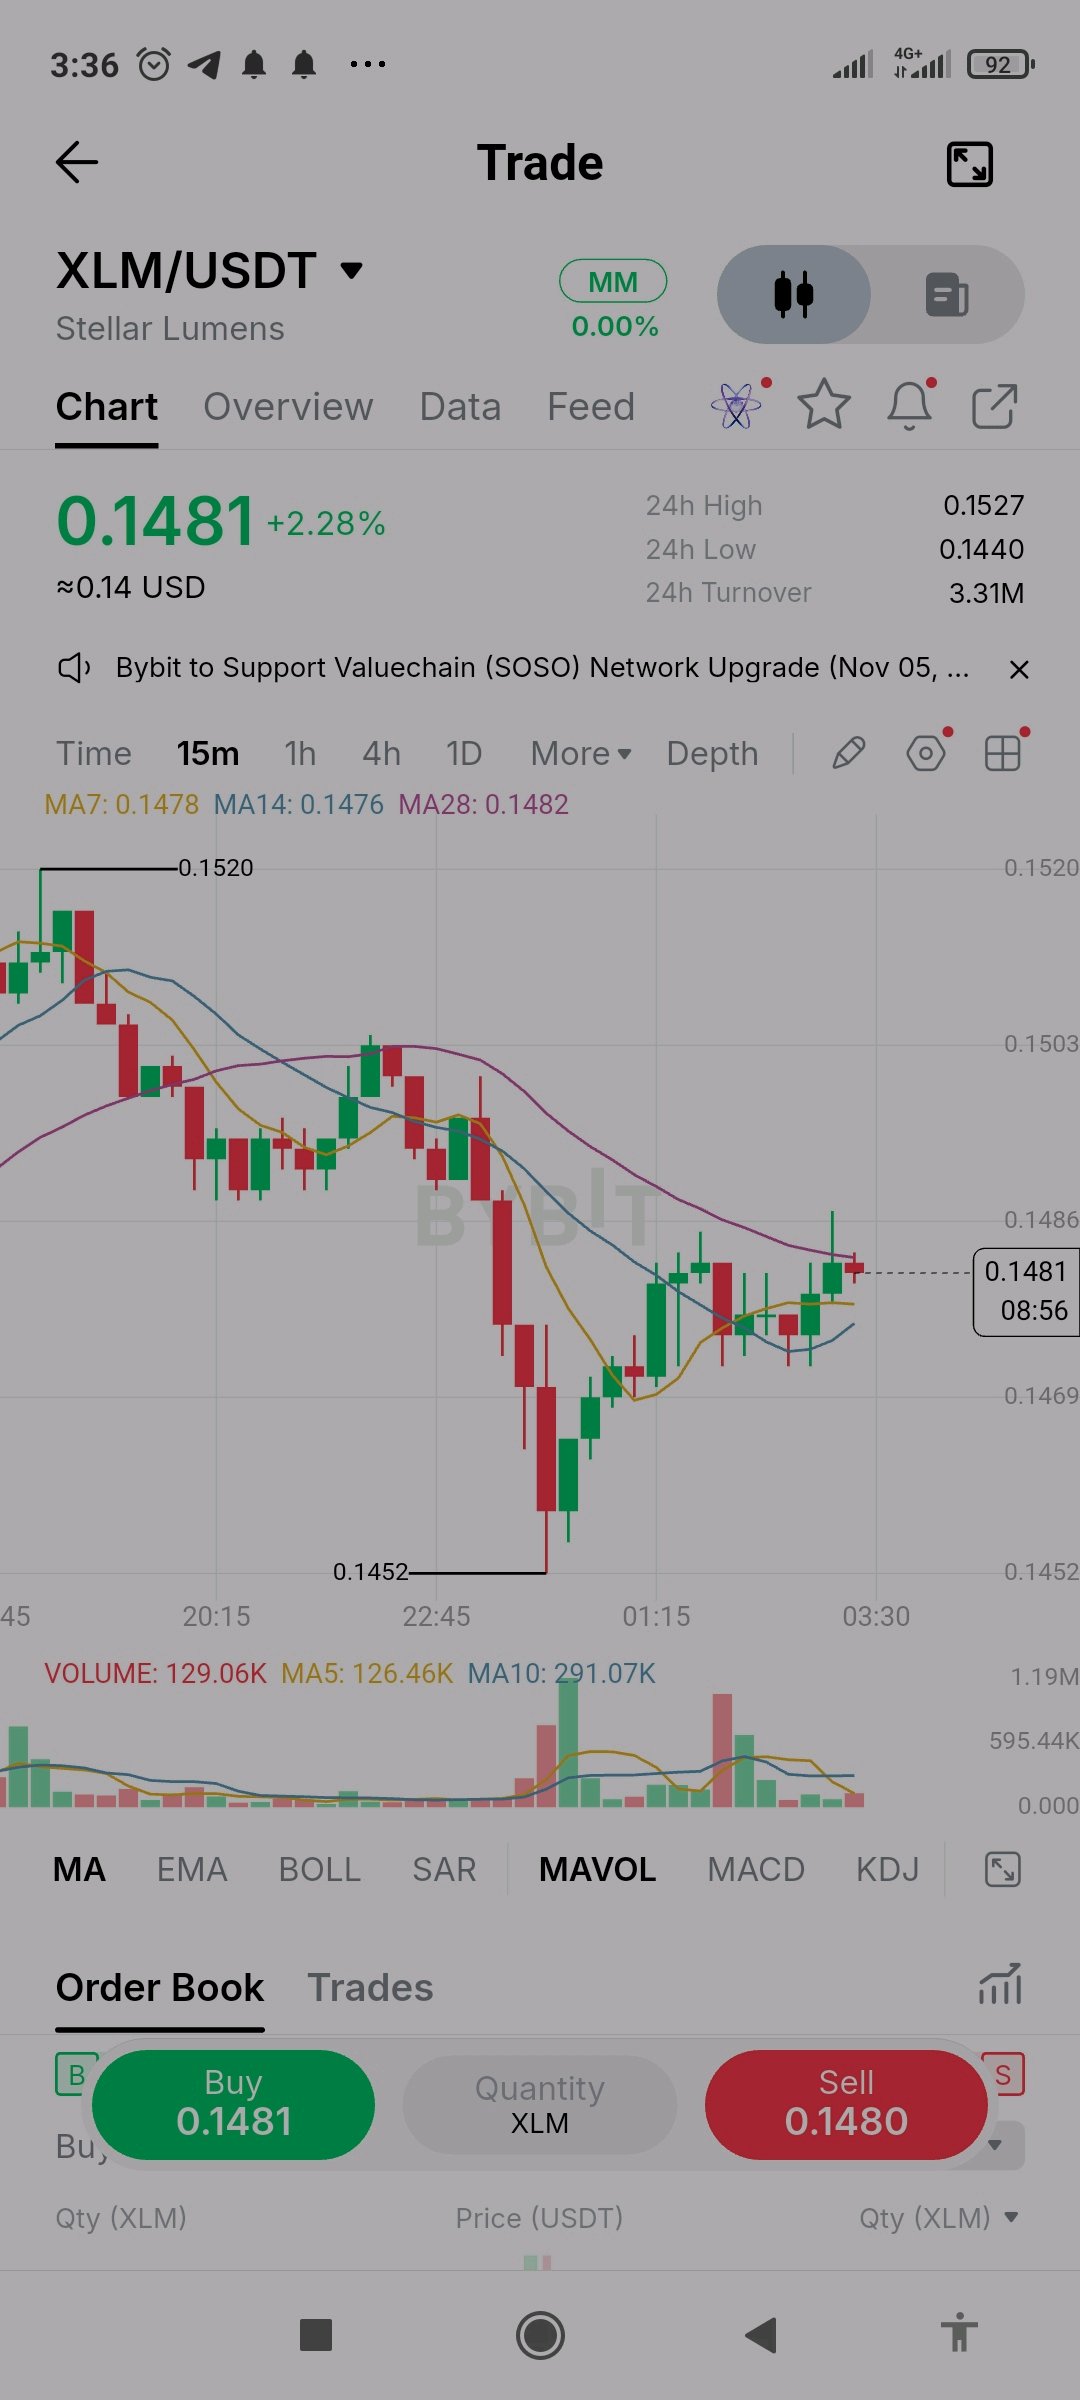
$XLMUSDT está en 0.1481 en la gráfica de 15 minutos, con un alza de alrededor del 2.3% en el día, pero la tendencia anterior era bajista. El precio se deslizó desde la zona de 0.1520 hasta un mínimo de 0.1452, luego se recuperó y ahora está justo sobre la MA7 (0.1478), MA14 (0.1476) y MA28 (0.1482), que están agrupadas. La MA28 sigue inclinada hacia abajo y está actuando como la resistencia más cercana. El rebote es real, pero aún no ha cambiado la tendencia. El precio necesita un cierre por encima de la MA28 para mostrar que los vendedores están perdiendo el control, mientras que una caída de regreso bajo el grupo de MA pondría el mínimo de 0.1452 en foco de nuevo. El volumen fue pesado durante la venta masiva y se ha desvanecido en la recuperación, por lo que los compradores no están mostrando una convicción fuerte. Aquí no hay nada confirmado. Lección: una recuperación que se topa con una resistencia en caída es una prueba, no una reversión. Espera un cierre por encima de ella y ajusta el tamaño de tu operación para que un rebote fallido te cueste poco. #IMPACTbyTrade $XLMUSDT $BTCUSDT