BlockWaveX0
4472Me gusta0Compartir en el chat346Aficionados2346Seguir
Crypto Content Creator | Web3 Researcher Insights Over Hype. Value Over Noise.
Crypto Content Creator | Web3 Researcher Insights Over Hype. Value Over Noise.
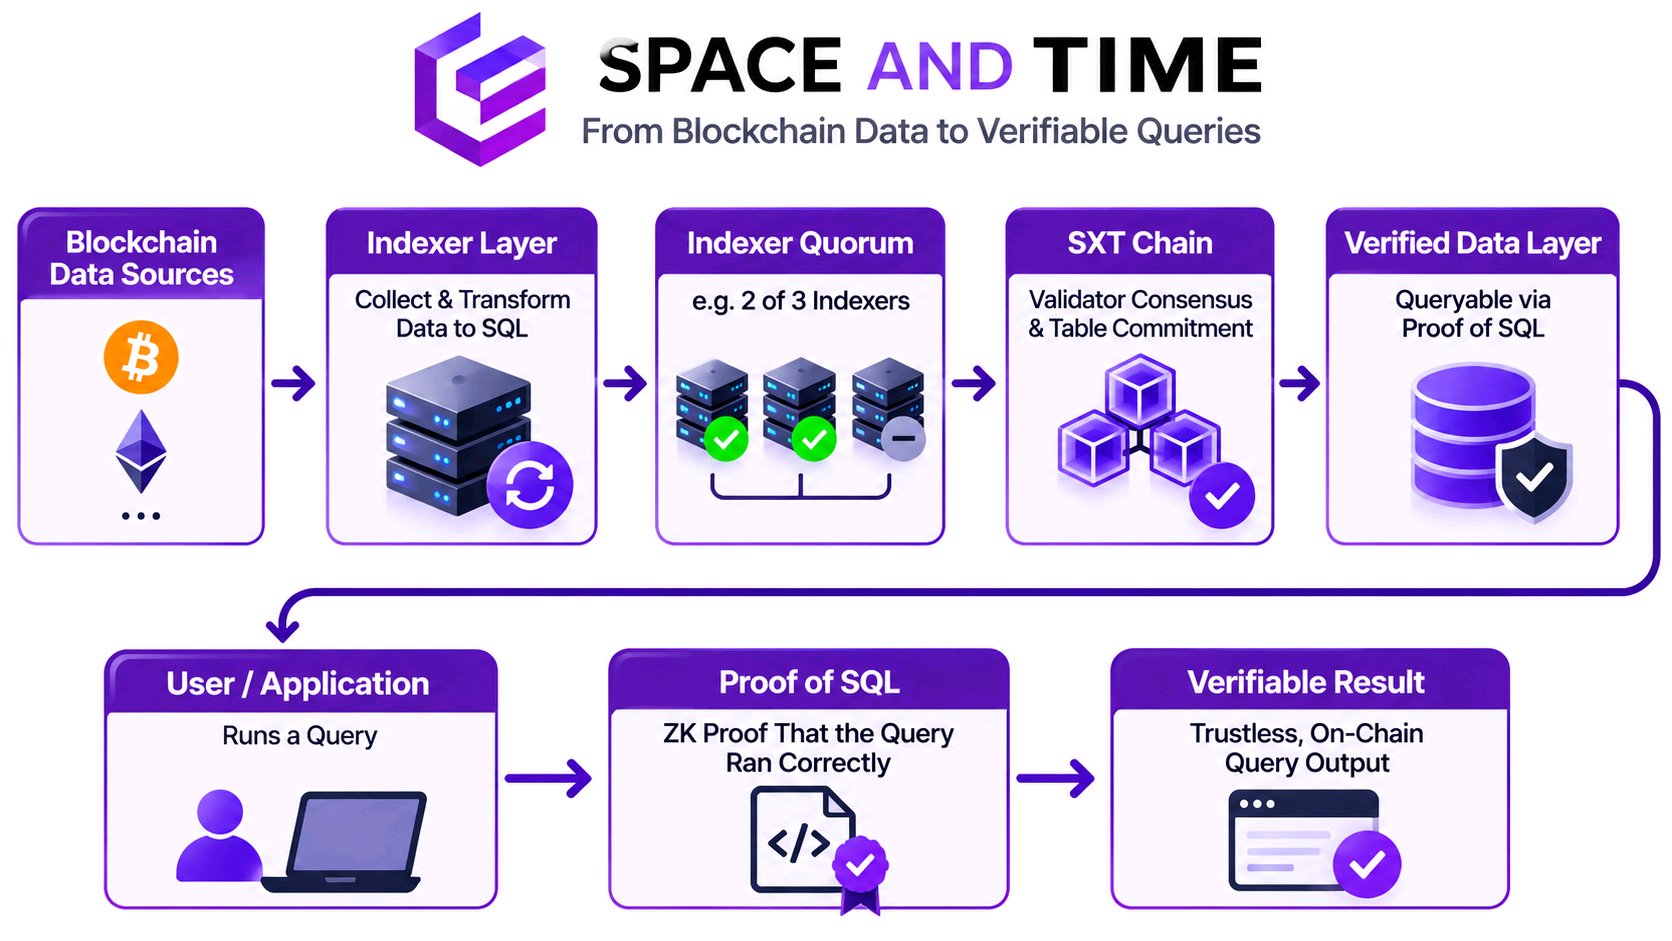
I started reading Space and Time’s docs expecting the interesting part to be Proof of SQL: a ZK proof that a query ran correctly against data that hasn’t been altered. Then I followed the data one step earlier. Hold up… the proof is not the first trust checkpoint. The docs say blockchain data is collected by indexers, converted into SQL rows, and submitted to SXT Chain. Validators compare the submissions; for chain-indexed tables, the docs give 2-of-3 as an example of the indexer quorum required before validators sign a new table commitment. That finalized commitment is what later query proofs rely on. That distinction matters. Proof of SQL can verify that the committed table was not manipulated and that the SQL computation was performed correctly. But the proof alone does not establish that the upstream pipeline captured every source-chain event, or that the indexers are operationally independent. Those are ingestion questions, handled by a separate layer of indexer redundancy and validator checks. To be fair, this layered design is sensible. Redundant indexers and BFT validators are meant to reduce reliance on one data feed; they are not evidence of a flaw. SXT is used to pay for network queries and related operations, so the quality of that data pipeline is central to what users are paying for. Can users independently inspect the operators and data sources behind that quorum, not just the proof produced at the end? #IMPACTbyTrade $SXTUSDT
A $4 billion RWA market looks impressive on a dashboard. The harder test is whether those assets can become useful financial building blocks. Allium’s onchain research puts Stellar’s tokenized asset market at $4.12 billion on September 30, 2026, up 6.1 times in twelve months. Spiko, Realiz, Tradable and Ondo each crossed $500 million in Stellar assets. Stellar also held 42% of tokenized non-US government debt. Spiko’s euro Treasury-bill fund led that category. Built-in approvals, freezes and clawbacks suit regulated issuers; Allium counted 7,050 issuer approval or removal actions. Chainlink’s Data Feeds and Data Streams are live on Stellar mainnet, adding reference prices and signed, on-demand data for smart-contract applications. The initial feed list covered nine assets, not every tokenized fund. CCIP was announced separately, but should not be described as live on Stellar. Those tools can improve collateral checks and liquidations, but reliable data does not create buyers, lenders or deep liquidity. Capital must still arrive. DeFiLlama’s November 15 snapshot showed about $4.05 billion in Stellar RWA onchain assets, but only around $1.15 million in tracked RWA DeFi TVL. These figures track different things: onchain assets versus assets deployed in tracked DeFi. The gap shows how early asset-to-finance conversion remains. That does not mean Stellar is idle. Allium recorded $1.95 billion in stablecoin payment volume over the twelve months through September. Business-to-business transfers accounted for $1.34 billion of that total, suggesting payment use already exists alongside tokenized funds. Protocol 30, called Bell, has a proposed November 23 mainnet vote. Its customer-specific smart-contract addresses could let one contract serve many customers. For issuers, this can lower operational friction, though integration work and wallet support still determine whether users benefit. Bell also enables ML-DSA post-quantum signature verification inside smart contracts. It does not make every Stellar transaction quantum-safe; network signatures remain Ed25519. A millisecond ledger clock clears a technical barrier to future faster closes, not an instant speed increase. XLM benefits only if usage endures. The milestone now is not another asset total. It is proving tokenized value can circulate, support credit and settle real economic activity on Stellar. #IMPACTbyTrade $XLMUSDT

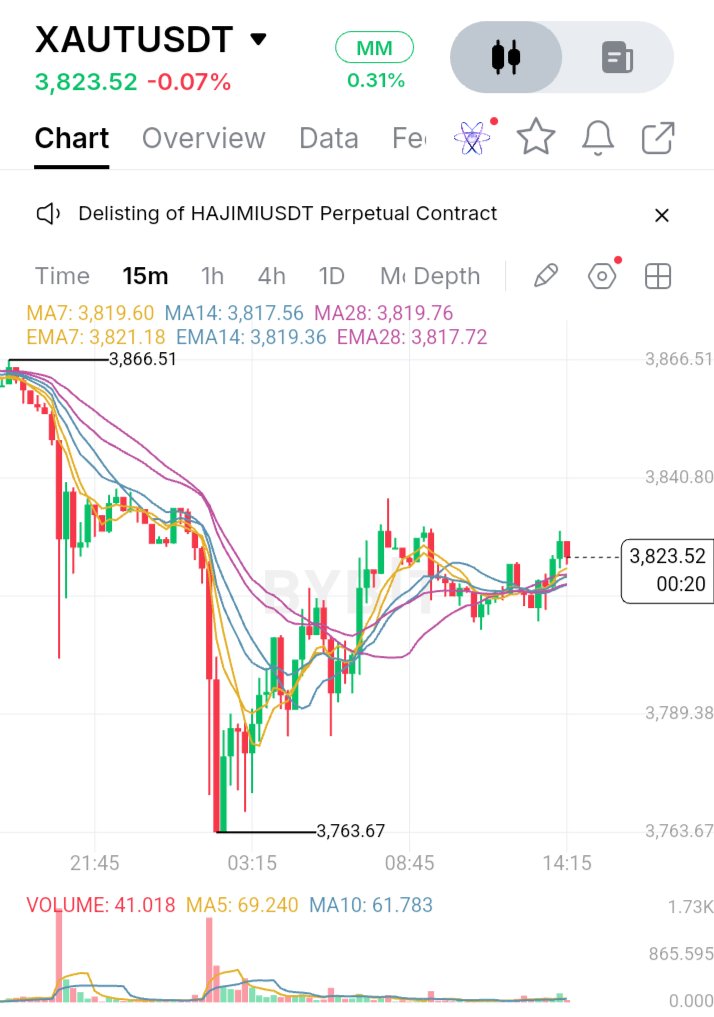
XAUT’s test is not putting gold on a blockchain. It is making gold easier to own without obscuring what holders own. Each token represents one fine troy ounce of gold on a London Good Delivery bar held in Switzerland; holders have an undivided interest in specified bars. That makes XAUT different from a growth token. It offers gold-price exposure, not a claim on Tether’s revenue or built-in yield. Tether’s September 30, 2026 report recorded 827,417.630 XAUT against 827,417.630 fine troy ounces, around 25.7 tonnes, valued at $3.44 billion. Verification has improved, but dates matter. On November 12, Tether announced KPMG’s unqualified audit opinion on the issuer’s 2025 financial statements, including physical inspection of every backing bar. Separately, BDO gave reasonable assurance on the September 30, 2026 reserve report. Its work included inventory checks and reconciliation against blockchain liabilities, but covered that date only. The less-discussed issue is redemption. Tether’s terms list a 50-token minimum purchase, while physical bullion redemption is generally arranged in 430-token increments, with delivery costs and fees. A token moves between wallets, yet converting it into physical bullion takes more work. Transferability and access are not the same thing. The World Gold Council and BCG put digital gold at $45–55 billion. Tokenized gold spot volume exceeded $90 billion in Q1 2026, more than during all of 2025; the $700 billion latent-demand estimate is conditional, not a forecast. On the supplied 15-minute chart, XAUT trades at $3,823.52 after falling from $3,866.51 to $3,763.67. Price has recovered above the MA/EMA cluster around $3,817–$3,821. But volume is 41.018, below MA5 at 69.240 and MA10 at 61.783. The rebound improves structure, but volume has not confirmed a reversal. A hold above the moving-average cluster would support recovery. The $3,840.80 area and $3,866.51 swing high remain overhead; losing the cluster puts $3,763.67 back in focus. XAUT’s appeal is clear: gold exposure with blockchain portability. Its limits remain: custody, issuer dependence, redemption conditions, fees and market liquidity. Tokenized gold will earn trust through more than matching token and ounce totals. Holders need clear ownership rights, verifiable reserves and redemption that works in practice. #IMPACTbyTrade $XAUTUSDT

I've been looking beyond HYPE's decline because the bigger story is the gap between Hyperliquid's trading activity and ecosystem capital, not simply its falling price. HYPE fell from its September 23 all-time peak near $98 into the $60s, leaving it roughly one-third below its record. Your chart shows RSI near 22, while price remains below the EMA200 around $69.8. Selling looks stretched, not reversed. The $63.2 area and $60 remain key technical supports. A sustained reclaim of $70 would improve the technical picture. A November 15 CoinGlass snapshot showed $4.53 billion in 24-hour futures volume, versus roughly $447 million spot volume. That difference suggests derivatives heavily influence price action, increasing sensitivity to sentiment and positioning. CoinGlass also showed around $2.93 billion in open interest and $86 million in 24-hour liquidations, predominantly from longs. These figures cannot predict direction. They show how crowded positions can intensify volatility during sudden market moves. Hyperliquid is more than a token narrative. Its on-chain trading infrastructure has developed a substantial derivatives business. DefiLlama reported approximately $90.5 million in fees and $69.3 million in protocol revenue over the 30 days to November 14. Yet TVL stood near $7.39 billion, down about 12.3% over the same period. That contrast deserves attention. The platform can generate fees while ecosystem capital declines. These metrics are connected, but measure different things. HYPE's Assistance Fund links protocol activity to token demand: 99% of protocol fees are allocated to open-market HYPE purchases. An SEC filing reported that 47.1 million HYPE had been acquired and permanently removed from circulation by September 8, 2026. Burns matter, but do not guarantee price support; 38.9% remains reserved for community emissions, 23.8% for core contributors. The central question is whether recurring protocol activity and fee-funded purchases can offset softer capital and ongoing distribution. Hyperliquid's clearest strength is its fee-generating product. Its uncertainty is whether activity creates lasting capital and token demand. An oversold reading deserves attention, but recovery needs more than a bounce: improving structure and healthier ecosystem metrics. A durable recovery means more than a green candle: consistent earnings alongside returning capital and sustained real usage. #IMPACTbyTrade $HYPEUSDT

I wouldn't treat BTC and NVDAX as the same trade, even though both are facing selling pressure. Bitcoin fell below $64,000 on November 14, reaching around $63,403. The bigger concern was the amount of forced selling behind the move. Around $1.47 billion in crypto positions were liquidated over 24 hours, with $1.31 billion coming from long positions. U.S. spot Bitcoin ETFs also recorded $185.45 million in outflows on Friday. That tells me buyers are still having difficulty absorbing the selling pressure. A quick bounce after a move like this is not enough to confirm that the market has found a bottom. NVDAX is a different story. It represents exposure to NVIDIA through Bybit's xStocks market. NVIDIA shares closed at $162.85 on Friday, down 2.01%, after trading between $158.39 and $170.00. There is one detail traders should not overlook: NVDAX trades around the clock, while NVIDIA shares follow U.S. stock-market hours. Its price can move when the traditional market is closed, and it may temporarily differ from the underlying share price. For BTC, I would want to see selling pressure ease and price hold a recovery rather than immediately fall back. For NVDAX, I would watch NVIDIA's next regular trading session and check whether the token's price remains close to the underlying share value. I don't see a good reason to rush into either market without confirmation. Both can move further down before a convincing recovery develops. The interesting question is whether Bitcoin can recover without stronger ETF demand, and whether NVDAX can hold up when NVIDIA's stock market opens again. Which one do you think has a clearer recovery ahead? #IMPACTbyTrade $BTCUSDT $NVDAXUSDT


XRP enfrenta una prueba crítica. Tras una fuerte caída, los compradores están tratando de estabilizar el mercado, pero la recuperación sigue sin confirmarse. El área de $0.90 es clave: ¿podrán los compradores defenderla o los vendedores empujarán el precio aún más abajo? En la instantánea citada, XRP cotizaba cerca de los $0.907, con una caída de alrededor del 10.31% en 24 horas. Su rango osciló aproximadamente entre $0.9042 y $1.017. La zona de los $0.9042 es el soporte inmediato. Una ruptura por debajo de los $0.90 podría extender las pérdidas. Recuperar el nivel de $1.00 sería la primera señal de una mejora en el impulso, mientras que un movimiento por encima de $1.017 fortalecería el caso de recuperación. CoinGlass registró cerca de $46.61 millones en liquidaciones de XRP en 24 horas, de los cuales aproximadamente el 98% provino de posiciones largas (longs). Esto subraya la presión sobre los traders alcistas apalancados. La caída en el interés abierto y el financiamiento negativo sugieren que el posicionamiento está cambiando, pero ninguna de estas señales garantiza una reversión. Un rebote de alivio se vuelve más creíble si las ventas forzadas disminuyen y los compradores al contado (spot) comienzan a entrar. Hasta entonces, no se debe confundir una pausa con un suelo de mercado. XRP es el activo nativo del XRP Ledger y puede servir como moneda puente. El ledger también admite activos tokenizados. El 12 de octubre de 2026, Standard Chartered anunció que el soporte de custodia institucional para Ripple USD (RLUSD) en el XRP Ledger ya estaba activo. El trabajo planificado con Ripple y LMAX Group también involucra a RLUSD como garantía de trading elegible. Aun así, la adopción de RLUSD no genera automáticamente una demanda equivalente para XRP. XRP tiene un suministro máximo de 100 mil millones, con aproximadamente 63.52 mil millones en circulación según los datos citados. Las liberaciones de depósitos en garantía (escrow) afectan la dinámica de la oferta. Las tarifas de transacción se queman, pero los montos son demasiado pequeños como para ser un factor importante de escasez. El valor a largo plazo depende de si los pagos, la liquidación de stablecoins y la tokenización generan una demanda sostenida de XRP. Por ahora, observe si los $0.90 se mantienen y si el precio recupera el nivel de $1.00. ¿Está comenzando la recuperación o es solo una pausa antes de otra caída en las próximas sesiones? #IMPACTbyTrade $XRPUSDT
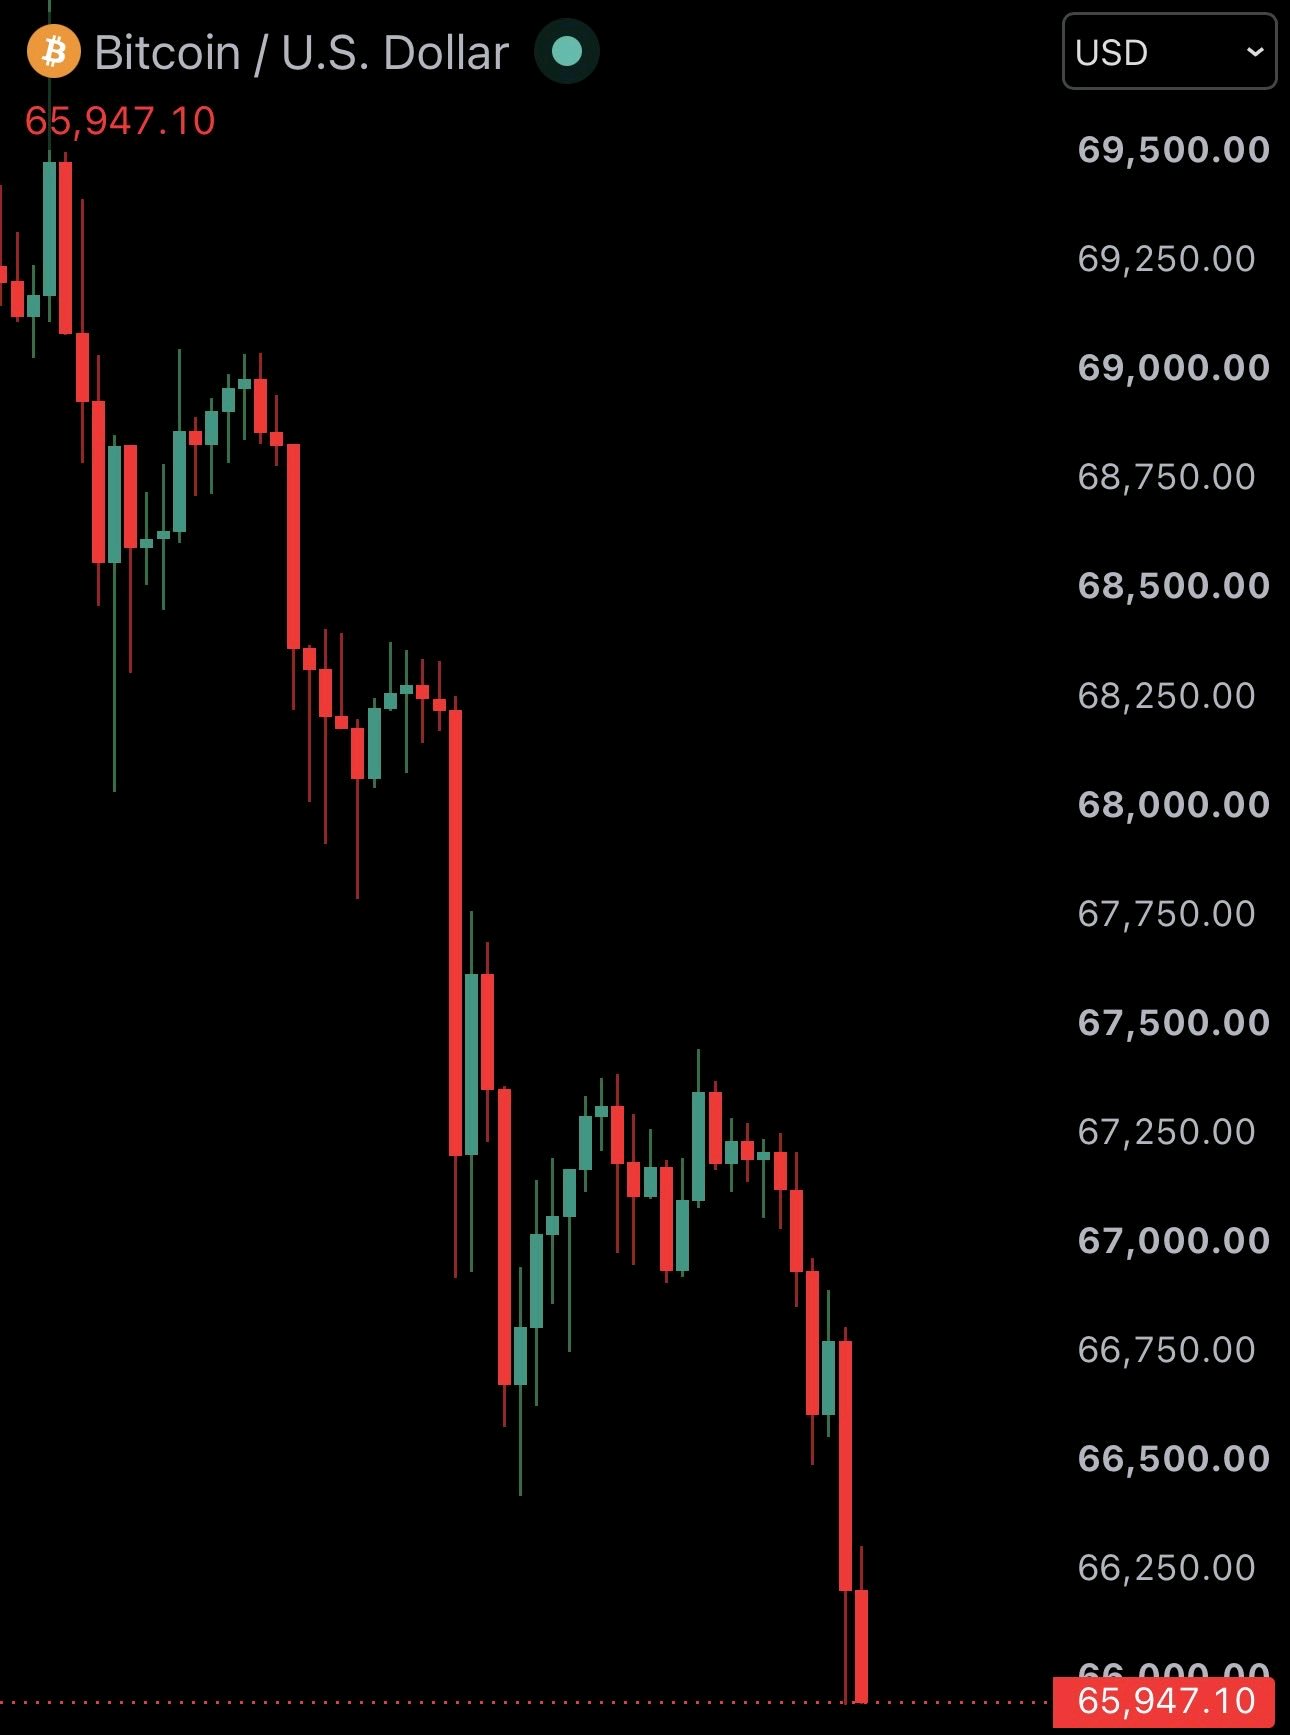
Bitcoin has crashed below $66,000, and the $205 million liquidation headline shows how quickly pressure in the crypto market can turn into a much larger sell-off. $BTCUSDT is sitting around $65,947 in the supplied chart, and the bigger concern is not just the price decline. It is the weakness behind every recovery attempt. The first thing that stands out is the market structure. Bitcoin has moved from the $69,000 region toward $66,000 through a sequence of lower highs and lower lows. Buyers have attempted several recoveries, but none has produced a convincing reversal on the displayed chart. The reported $205 million in liquidations across the crypto market adds another dimension to this move. Forced position closures can increase selling pressure when prices fall, creating a chain reaction in an already weak market. However, liquidations are an effect of leveraged positioning, not proof that every market participant is selling. What makes this situation interesting is the distinction between spot selling and forced futures closures. Spot selling reflects actual asset sales, while liquidations happen when leveraged positions no longer meet margin requirements. Both can push prices lower, but they tell different stories about market participation. The $66,000 level now deserves attention because Bitcoin has moved below this important psychological price zone. A temporary move back above it would not automatically confirm a recovery. Buyers would need to demonstrate that they can defend the reclaimed area rather than allowing sellers to reject the rebound. There is also a potential opportunity hidden inside liquidation events. When excessive leverage gets flushed out, the market can become less vulnerable to additional forced closures. But that does not guarantee an immediate bottom. A leverage reset and a genuine recovery in demand are two different things. The bearish argument remains straightforward: if BTC continues producing lower highs and fails to reclaim broken price territory, selling pressure could remain dominant. Another failed recovery would suggest that buyers are still struggling to regain control. On the other hand, a bullish recovery would require more than one green candle. I would look for sustained acceptance above $66,000, stronger buying participation, and a higher low on the chart. Those developments would provide better evidence that sellers are losing momentum. One important detail that often gets overlooked is that liquidation figures describe activity within a specific time window. The reported $205 million covers the broader crypto market, not Bitcoin alone. It should not be confused with BTC-specific liquidation totals or 24-hour figures. The distinction matters when evaluating the actual scale of market stress. For now, Bitcoin is showing a clear short-term bearish structure, but the next meaningful development will be whether demand returns after this wave of forced selling. Is this simply a major leverage reset, or are we witnessing the beginning of a deeper weakness in Bitcoin's market demand? #IMPACTbyTrade
He estado observando a $HYPEUSDT rondando los $68.60, y algo llamó mi atención. El precio está batallando, pero los números detrás de Hyperliquid cuentan una historia diferente. Los ingresos del protocolo en el Q3 alcanzaron los $190.9M, un 21.7% más que en el Q2. El interés abierto también subió un 79.9% hasta los $16.7B, llegando a $16.7B. Es una gran cantidad de capital en el mercado, aunque un mayor interés abierto por sí solo no garantiza más presión de compra. Otro detalle que vale la pena vigilar es el Fondo de Asistencia. Gastó aproximadamente $148.7M comprando HYPE durante el Q3. Dado que estas compras se basan en dólares, los precios más bajos permiten al fondo adquirir más tokens. Se ha reportado que alrededor de 50.47M de HYPE han sido quemados hasta ahora. También hay algunos desarrollos que vale la pena seguir de cerca. Upbit y Bithumb abrieron el trading de HYPE el 10 de noviembre, mientras que Elysium se lanzó el 9 de noviembre con HYPE utilizado para el gas. Pero no ignoraría la gráfica. A $68.60, el precio está probando el nivel Fibonacci de $68.68 y el área de la EMA de 200 días. El soporte se sitúa alrededor de los $67.05, con resistencias en $69.10, $71.18 y $73.09. El problema es que el precio diario permanece por debajo de las EMAs de 20, 50 y 100. El impulso sigue siendo débil, y aproximadamente 14.2M de HYPE están programados para desbloquearse el 29 de noviembre. Estoy vigilando de cerca los $67. Mantener esta área podría dar a los compradores otra oportunidad, pero perderla debilitaría seriamente la configuración de compra (long). ¿Crees que HYPE se está preparando para una recuperación, o el mercado sigue subestimando la presión de venta? #IMPACTbyTrade

$VVVUSDT Is Bouncing Back, But I'm Not Ready to Call It a Reversal I used to think that a sharp recovery after a major sell-off was enough to suggest buyers were returning. But VVV is a good reminder that a bounce and a trend reversal are two very different things. VVV is trading around $18.263, down 5.26%, after dropping from $19.717 to $17.589. Buyers have responded near the lows, pushing price back above $18, but the recovery still needs to prove itself. What caught my attention is the moving average structure. Price is sitting above MA14 at $18.136, while MA7 is around $18.267. That's a modest improvement in short-term momentum. However, MA28 remains near $18.397, with EMA28 around $18.393. This area could become an important test if buyers try to extend the recovery. Volume also deserves attention. The latest reading is 2.13K, below both the 5-period average of 4.21K and the 10-period average of 5.14K. Personally, I want to see stronger participation and a sustained move above $18.40 before changing my outlook. The recent recovery is interesting, but confirmation matters more than excitement. Can VVV build on this bounce, or will sellers regain control?

$DOTUSDT DOT Is Trying to Stabilize, But I'm Not Seeing a Strong Reversal Yet I used to think that once a coin starts holding above its recent low, the worst of the selling might already be over. But DOT's current price action reminds me why I don't like making that assumption too early. DOT is trading around $0.7870, down 5.02%, after falling from the $0.8326 area to approximately $0.7786. There has been some recovery from that low, but the broader short-term structure remains under pressure. One detail I find interesting is the moving average setup. Price is currently above the MA7 at $0.7851 and MA14 at $0.7848. That's encouraging for short-term buyers. However, the MA28 remains around $0.7896, while EMA28 is near $0.7907. This creates an important resistance zone that DOT still needs to overcome. Volume is another concern. Current displayed volume is 2.05K, considerably below the 5-period and 10-period average volumes. So the recent recovery hasn't yet demonstrated convincing participation. Personally, I'd rather see DOT reclaim the $0.7900–$0.7910 area and hold it before becoming more optimistic. For now, I'm watching rather than assuming. Can DOT turn this stabilization into a genuine recovery, or is another rejection still possible?

$PYTHUSDT is facing an interesting contradiction: its underlying business is developing a stronger commercial model, but its short-term market structure is still showing weakness. Pyth Network is more than a crypto price oracle. It connects financial data publishers directly with blockchain applications, allowing developers to access market prices across different asset classes. Its pull-based architecture lets applications request updates when needed instead of constantly pushing every update to every blockchain. This is an important design choice for applications that require timely financial data. The bigger development is Pyth's transition toward paid institutional data services. In September 2026, Pyth reported $11.5 million in annual recurring revenue, representing 86% quarter-over-quarter growth. This is a promising business indicator, although reported ARR should not be confused with net profit or actual token-holder income. There is also a meaningful change in PYTH's economic model. Under OP-PIP-136, approved in September and announced on October 8, the DAO committed 100% of the funds it receives from Pyth products to accumulating PYTH in its reserve. However, this applies to the DAO's revenue share, not all gross product sales. The accumulated tokens are not automatically distributed to holders or permanently burned. Supply remains another important consideration. PYTH has a maximum supply of 10 billion tokens, and DefiLlama lists a further scheduled unlock for May 19, 2027. Growing business revenue and token demand must eventually be evaluated alongside potential supply dilution. Looking at the 1H chart snapshot, PYTH is trading at $0.06411, down 1.95%, and remains below the 0.0650–0.0654 MA/EMA cluster. The immediate support is $0.06316. An hourly close below that level could expose $0.06195, while reclaiming $0.0654 with convincing volume would improve the short-term structure. Above that, $0.0661 and $0.0682 remain important resistance levels. The interesting part is the difference between fundamental progress and market behaviour. Pyth is building a revenue-generating data business and linking part of its commercial success to PYTH accumulation, but that does not guarantee immediate price strength. My key question is whether growing institutional demand and DAO reserve accumulation can eventually outweigh supply pressure and improve PYTH's market structure? #IMPACTbyTrade

The reported SpaceX and Tesla merger could become one of the biggest corporate developments in history, but the most interesting part for crypto investors may be hiding behind the $3.4 trillion valuation. Bloomberg reports that an announcement could come as early as December, although discussions may extend into early 2027. The estimated combined valuation puts the two companies among the largest businesses in the world. However, this figure should not be confused with a confirmed merger price or finalized agreement. SpaceX brings rocket technology, Starlink connectivity and ambitions beyond Earth. Tesla contributes electric vehicles, energy storage, artificial intelligence and robotics. Together, their businesses could create a powerful technology ecosystem with enormous infrastructure potential. But there is another connection worth watching: Bitcoin. According to their disclosed holdings, SpaceX holds approximately 18,712 BTC, while Tesla holds around 11,509 BTC. That represents a combined 30,221 BTC, making their existing Bitcoin exposure particularly interesting. However, a corporate merger would not automatically mean that these holdings become one investment strategy or that additional Bitcoin purchases are planned. The bigger question is whether the combined organization could eventually approach Bitcoin as a strategic corporate asset rather than simply holding it as part of its treasury. There are also serious challenges. Regulatory oversight, corporate governance, financial transparency and SpaceX's government-related contracts could complicate the process. For crypto markets, the merger is not automatically bullish. Its real significance depends on what happens to the companies' Bitcoin policies after any agreement. A larger corporate structure does not guarantee stronger Bitcoin demand. I would watch the official merger terms, financial disclosures and any changes in BTC holdings before drawing conclusions. Could this become another major step toward Bitcoin adoption by large corporations, or is the crypto connection being overestimated? #IMPACTbyTrade $TSLAXUSDT $SPCXXUSDT


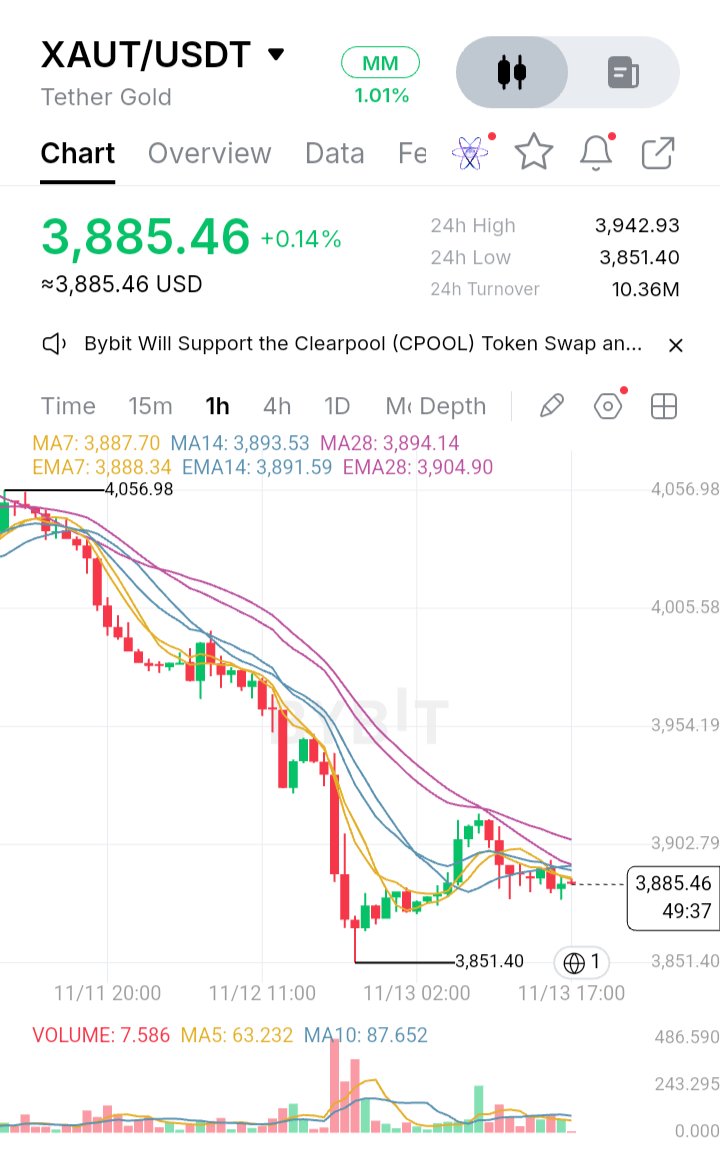
$XAUTUSDT is facing a test that goes beyond a simple technical correction. The price is struggling to recover $3,900, the rejection at the 1.0 Fibonacci level has weakened the recovery attempt, and the fading MACD suggests that bullish momentum is losing strength. The $3,851 area is now particularly important because buyers need to demonstrate that they are still willing to defend the recent low. Market data places XAUT around $3,880–$3,900, with the recent trading range extending towards $3,850. This weakness is not happening in isolation. Spot gold also suffered a sharp decline this week, losing nearly 4% before attempting a modest recovery on November 13. Reuters reported that higher oil prices, inflation concerns and changing Federal Reserve rate expectations were putting pressure on bullion. In other words, XAUT is reflecting the weakness of its underlying asset rather than simply following the usual movements of the cryptocurrency market. There is an important distinction here that often gets overlooked. Tether Gold is not a conventional cryptocurrency whose value depends primarily on speculative demand for a blockchain ecosystem. Each XAUT represents an ownership interest in one fine troy ounce of physical gold held in Swiss vaults. Tether's September 2026 reserve disclosure reported approximately 827,418 ounces of gold against an equivalent number of tokens in circulation. There was also a meaningful development on November 12. Tether announced that KPMG had completed an independent audit of the issuer's 2025 financial statements, including physical inspection and counting of the individual gold bars backing XAUT. This is an important credibility development, although the audit covered the financial year ending December 31, 2025, not a new real-time guarantee against market volatility. Technically, the immediate picture remains cautious. The $3,900 level is the first psychological barrier, while the EMA200 near $3,957 represents a more significant recovery test. A move above $3,900 without sustained strength would not necessarily signal a trend reversal. Buyers would need to reclaim the EMA200 and demonstrate that former resistance is becoming support. The fading MACD also deserves attention because a weakening indicator can signal reduced buying pressure even before a clear bearish crossover appears. On the downside, $3,851 is the level worth watching. Holding above it could give XAUT room to stabilize and attempt another recovery. However, a convincing breakdown followed by failed attempts to reclaim that level would strengthen the bearish structure. The next downside target should depend on actual price discovery rather than an invented chart level. What makes this situation interesting is the contrast between improving confidence in XAUT's physical backing and weakening demand for gold itself. Better reserve transparency can strengthen confidence in the product, but it cannot prevent the underlying metal from declining when macroeconomic conditions turn unfavourable. I am watching one question more closely than any single indicator: will buyers defend $3,851 and reclaim $3,957, or will gold's broader weakness keep XAUT trapped below its major recovery levels? #IMPACTbyTrade

I've been looking at HYPE beyond its price, and the part I find most interesting is how Hyperliquid tries to turn real protocol activity into demand for its native token. Hyperliquid is not just a trading app. It is a Layer 1 built around on-chain financial markets. Its HyperCore handles spot and perpetual order books, while HyperEVM gives developers an EVM-compatible environment to build other applications around that liquidity. The important distinction is that orders, trades and liquidations are processed on-chain, rather than only being recorded after the fact. The activity is substantial. DeFiLlama’s latest displayed rolling 30-day figures show about $228.7 billion in perpetual volume, $82.6 million in fees and $64.9 million in protocol revenue. Those numbers suggest genuine market usage, although volume alone cannot tell us how much activity is organic or how durable it will be. Here is the part I think deserves more attention: the token has a direct connection to protocol fees. A September 2026 SEC filing says 99% of protocol fees are allocated to the Assistance Fund, which uses them to buy HYPE on the open market. The filing reported that 47.1 million HYPE had been acquired and permanently removed by September 8. That creates a clearer value link than a token whose only purpose is governance. But it is not a promise of price appreciation, and buybacks should not be confused with cash distributions to holders. There is also a supply-side question. HYPE has a maximum supply of 1 billion. The same filing lists 23.8% for core contributors, with monthly vesting continuing through 2027–2028, while 38.9% is reserved for future emissions and community rewards. For me, the bigger test is whether Hyperliquid can keep attracting repeat users and fee-generating activity while new supply continues to enter circulation. The product has traction, but competition, market cycles and token distribution still matter. Do you think HYPE’s fee-linked demand can outpace future supply, or is that the key risk the market may be underestimating? #IMPACTbyTrade $HYPEUSDT

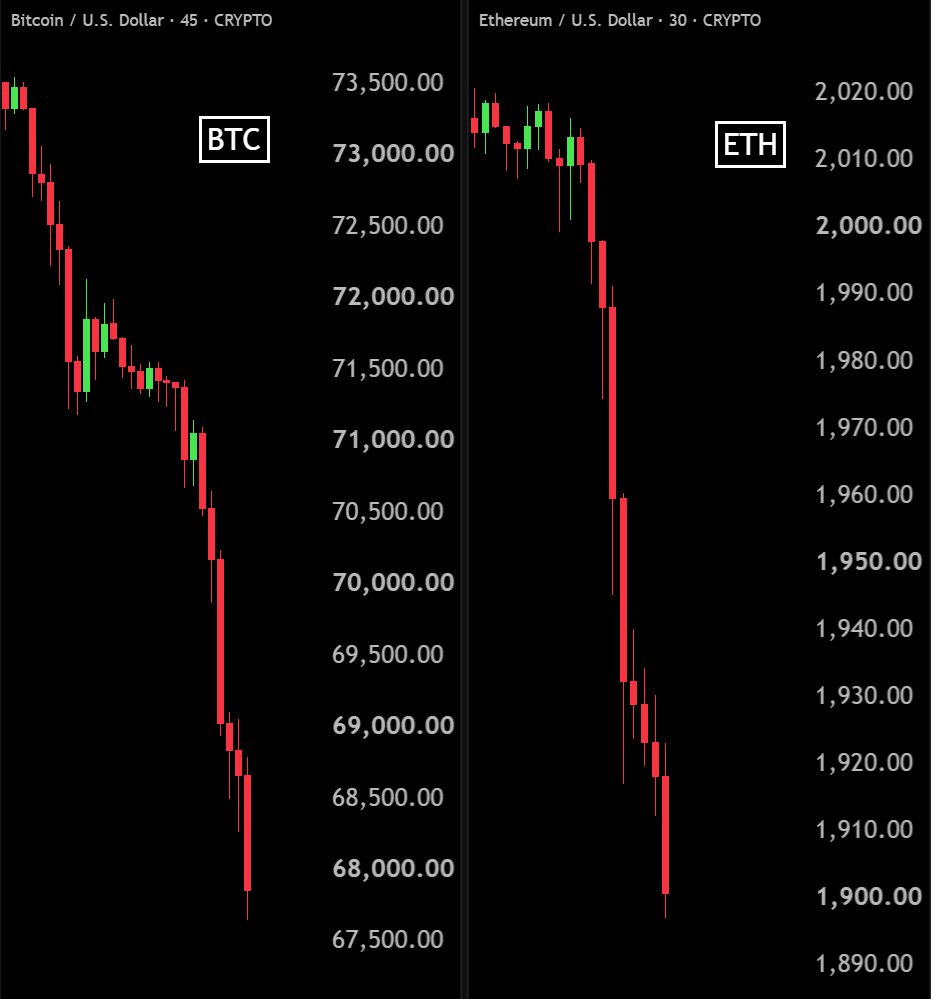
I've been watching the crypto market closely, and one thing about this sell-off really stands out: the amount of leverage that has been wiped out in just 24 hours. Around $1.41 billion in crypto positions were liquidated, according to a CoinGlass market snapshot reported on November 13. More than 172,900 traders were affected. What caught my attention was the imbalance between long and short liquidations. Nearly 89% came from long positions, representing approximately $1.26 billion. Bitcoin accounted for around $742 million, while Ethereum contributed approximately $250 million. I've seen similar situations where traders become too confident in one market direction. When prices suddenly move against heavily leveraged positions, forced liquidations can create additional selling pressure and accelerate the decline. But I don't think heavy liquidations automatically mean the market has reached its bottom. There are several things worth watching now: Bitcoin's ability to hold important support levels, whether spot buying demand returns, and whether futures open interest begins to stabilize. A market recovery needs more than a temporary price bounce. It needs real demand and stronger market structure. One thing I've learned from observing crypto markets is that extreme fear can create opportunities, but entering too early can be just as risky as chasing a rally. Do you think this sell-off is resetting the market for another recovery, or is more downside still possible? #IMPACTbyTrade $BTCUSDT

Ripple is growing fast, but I keep coming back to one question: how much of that growth actually benefits XRP? The company is moving deeper into payments, custody, stablecoins and institutional finance. Ripple says it is approaching a $900 million annualized product-revenue run rate, works with more than 1,700 institutions and enterprises, and holds over 85 licenses. Its progress with RLUSD and the OCC's approval for its national trust bank also shows that Ripple is serious about building a place in traditional finance. But here's where things get interesting. Ripple's business can grow without every transaction needing XRP. RLUSD is becoming part of its payments and financial services offering, and it can operate on different blockchains. That gives Ripple more ways to attract institutions, but it also means some of that activity may never create direct demand for XRP. XRP still has an important role. It is the native asset of XRPL, is used to pay network fees, and can act as a bridge currency in Ripple's On-Demand Liquidity service. But there's a difference between being useful and capturing the financial value created by a growing business. That's the part investors should pay attention to. A successful Ripple does not automatically mean a more valuable XRP. What matters is whether more real payment flows actually need XRP, rather than simply using Ripple's other products. So, are we watching XRP become the backbone of Ripple's financial network, or could Ripple build a successful business while XRP captures only part of the upside? #IMPACTbyTrade $XRPUSDT
ASTER: Protocol Revenue Is Growing, But Can Its Buyback Model Outrun Token Dilution? ASTER has something many DeFi tokens struggle to demonstrate: a direct connection between platform activity and token economics. But there is a bigger question here. Can protocol-generated fees create sustainable ASTER demand while most of its maximum supply is still outside circulation? Aster is building a multi-chain trading ecosystem covering perpetuals, spot markets, and yield-bearing collateral. Its product expansion gives the protocol multiple sources of activity, but ecosystem growth does not automatically translate into value for token holders. As of November 12, ASTER trades around $0.65. DefiLlama estimates its circulating supply at approximately 2.57 billion tokens against an 8 billion maximum supply. That puts circulating supply at roughly 32% of the maximum. Its market capitalization is around $1.68 billion, while FDV sits near $5.09 billion. In other words, fully diluted valuation is approximately three times the circulating market cap. That supply gap deserves attention. The underlying activity is still worth examining. DefiLlama reports approximately $792 million in TVL, $4.12 million in fees over 30 days, around $47.9 billion in perpetual trading volume, and roughly $1.34 billion in open interest. These figures indicate meaningful platform activity. However, derivatives volume is not the same as organic spot demand, and high trading activity alone does not prove sustainable token demand. The most interesting part is Aster's buyback-and-burn mechanism. On June 17, Aster introduced a framework directing 99% of daily platform fees toward automatic ASTER buybacks. The mechanism has two separate effects: First, purchased ASTER is distributed to veASTER participants according to their locking weight. Second, an equivalent amount of ASTER is burned from protocol reserves, with the stated objective of reducing total supply toward 3 billion tokens. This creates an interesting economic loop: trading activity generates fees, fees finance market purchases, and reserve burns reduce total supply. But there is an important distinction. The buyback distribution directly rewards veASTER participants. Regular holders do not receive those distributions unless they participate in the locking mechanism. They may benefit indirectly from market purchases and supply reduction, but that is not the same as receiving the rewards themselves. Then comes the dilution question. Aster's original token allocation assigns 53.5% to airdrops, 30% to ecosystem and community, 7% to treasury, 5% to the team, and 4.5% to liquidity and listings. The team allocation consists of 400 million ASTER. Its cliff was extended from September 2026 to September 17, 2027, keeping those tokens locked for longer. However, delaying an unlock does not eliminate the eventual supply obligation. The bullish argument is straightforward: sustained trading activity could generate recurring fees, support daily buybacks, and gradually reduce total supply. The bearish argument is less complicated but equally important: FDV remains substantially above circulating market capitalization, future token distributions continue to matter, and buyback rewards are not equally distributed across all holders. ASTER is also still approximately 73% below its $2.41 all-time high. Personally, I would focus on three metrics rather than just daily trading volume: 1. Whether monthly protocol fees continue growing. 2. Whether veASTER participation and buyback distributions remain sustainable. 3. Whether actual supply reductions outpace new token emissions and unlocks. ASTER has built a measurable link between platform activity and token economics. But the real test is whether that mechanism can create lasting value beyond temporary market demand. What do you think matters more for ASTER's long-term sustainability: growing protocol revenue or reducing the circulating supply? #IMPACTbyTrade $ASTERUSDT

ETH
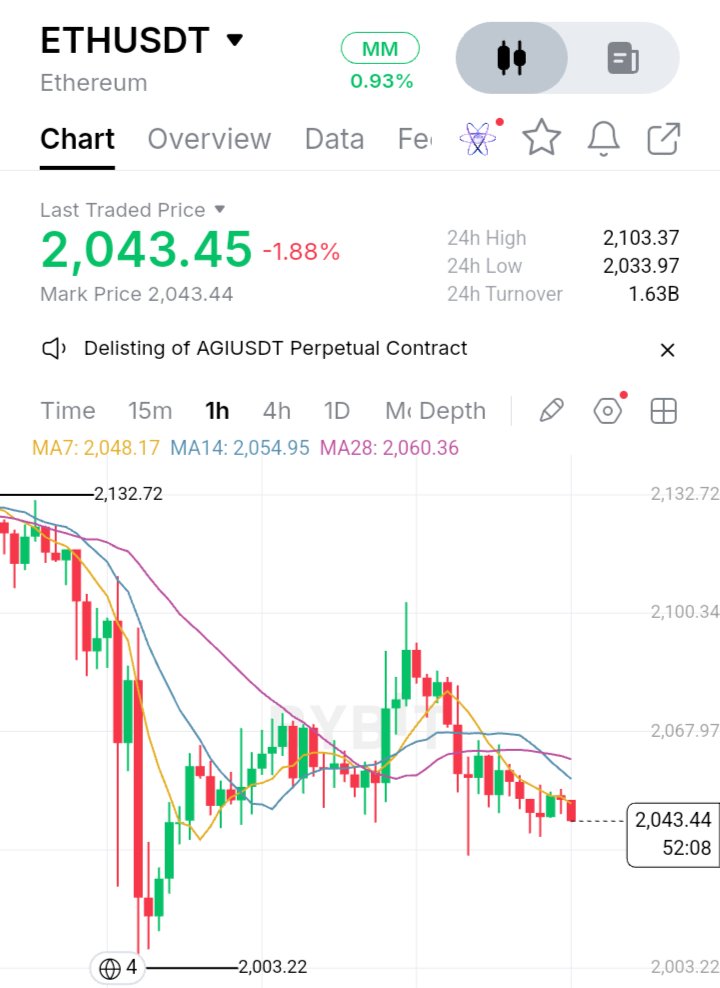
$ETHUSDT Ethereum Is at a Turning Point, and I’m Not Rushing to Pick a Side I used to think that every major Ethereum dip was an opportunity waiting to be taken. A sharp drop followed by a small recovery often looked like the beginning of a reversal. But experience has taught me that recovering lost ground and actually changing market direction are two completely different things. Right now, ETH is struggling to regain short-term strength. What concerns me is that the recent recovery has not produced a convincing continuation. Sellers still appear comfortable defending higher price levels, while buyers have yet to demonstrate consistent momentum. I’m paying particular attention to the $2,033–$2,003 support area. If buyers manage to defend this region, Ethereum could have another opportunity to recover. But if that support breaks, I wouldn't ignore the possibility of further downside. On the other side, reclaiming $2,050–$2,060 would be an encouraging first step. It wouldn't automatically confirm a bullish reversal, but it would show that buyers are starting to regain control. Personally, I don't want to predict the bottom just to be early. I'd rather miss the first part of a recovery than enter a position without confirmation. Ethereum doesn't need another optimistic prediction. It needs buyers to prove their strength.

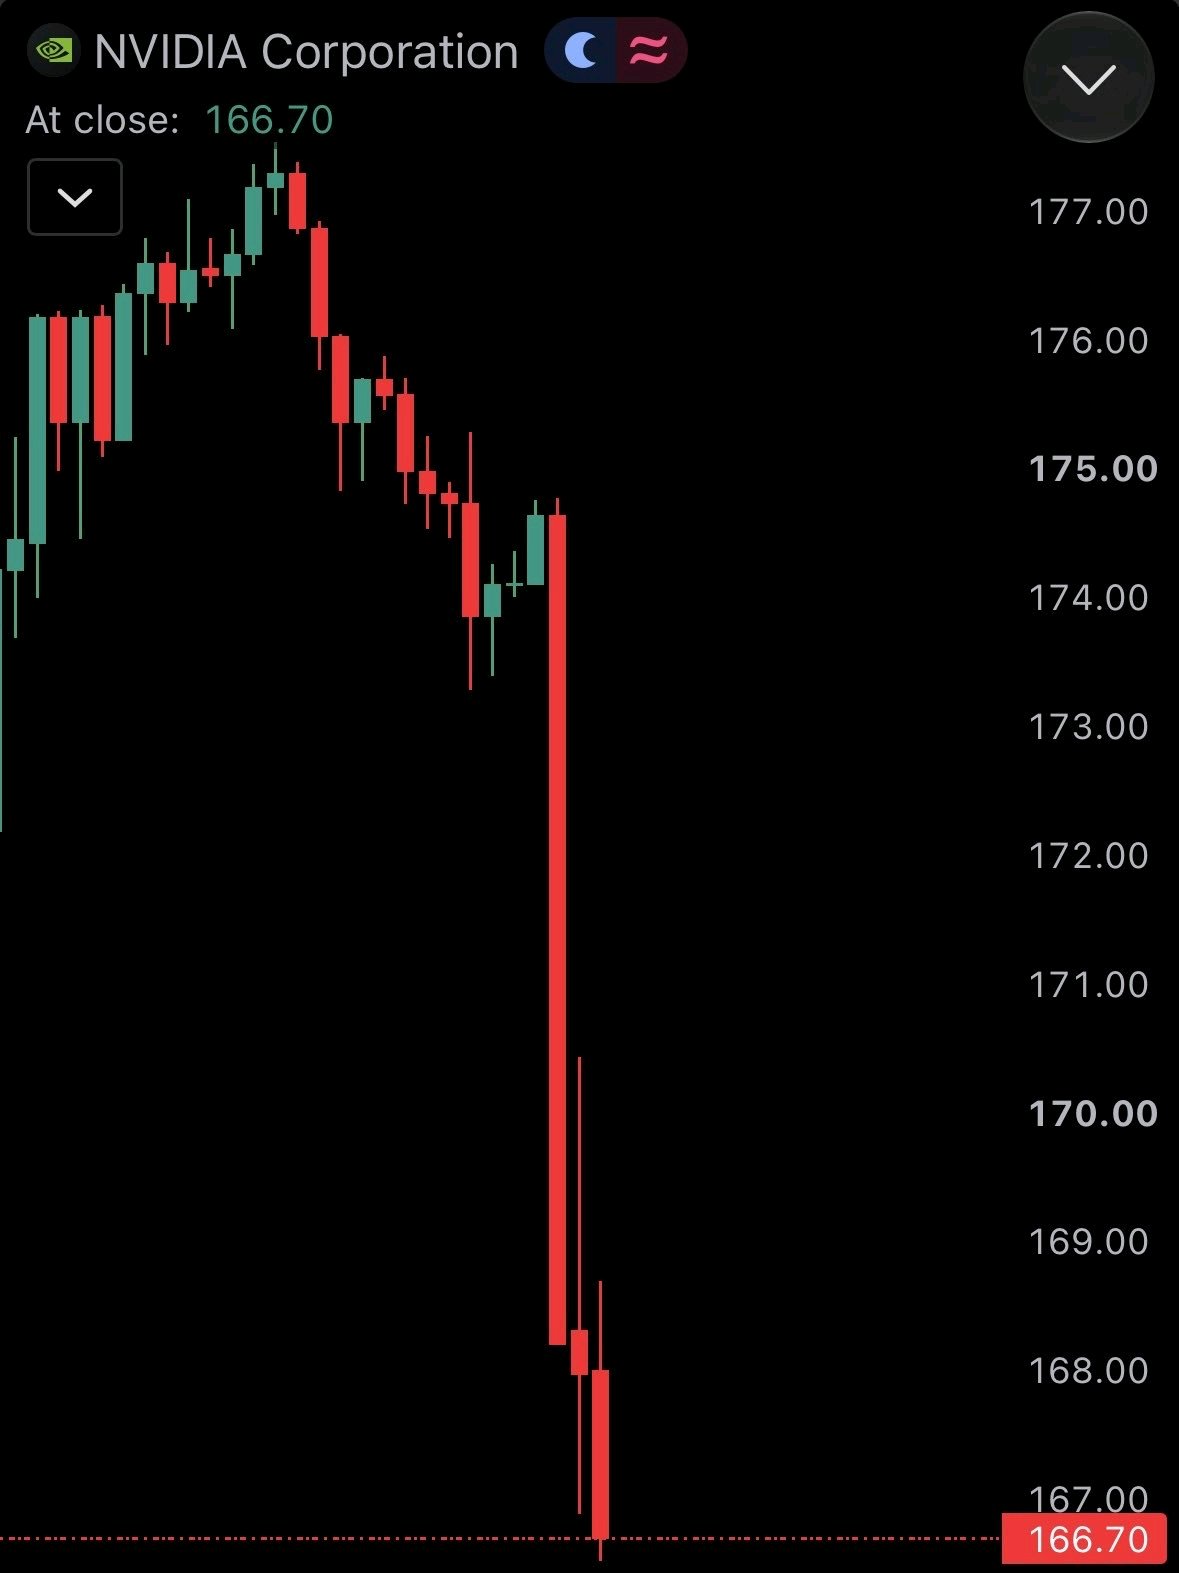
La venta masiva de Nvidia expone un riesgo mayor que un escándalo de un CEO El desplome de Nvidia fuera del horario de mercado está poniendo a prueba cuánto riesgo han concentrado los inversores en una sola persona. El 11 de noviembre, The New York Times informó que el CEO Jensen Huang tuvo una presunta relación con un ejecutivo senior de Nvidia que reportaba directamente a él. Reuters no pudo verificar la información de forma independiente; Nvidia y el ejecutivo no respondieron de inmediato. El informe siguió a la admisión de Huang en un memorando para los empleados de que había sido infiel, en medio de una controversia por separado que involucraba a una mujer de quien, según se informa, las autoridades estadounidenses sospechan que tiene vínculos con la inteligencia china. La venta masiva se aceleró después de que The Wall Street Journal informara que la junta directiva de Nvidia se estaba preparando para destituir a Huang. Reuters, citando una fuente familiarizada con el asunto, dijo que los directores se estaban reuniendo para decidir su futuro. Nvidia no ha confirmado públicamente una decisión de destitución. Su investigación formal, anunciada el 8 de noviembre, se centra en si Huang fue blanco de un esfuerzo de inteligencia extranjera. Inicialmente, la junta expresó su confianza en él y dijo que no tenía motivos para creer que se hubieran comprometido secretos de la empresa o la seguridad nacional. Los 166.70 dólares de la captura de pantalla implican una caída de aproximadamente el 4% desde el cierre del 11 de noviembre de 173.73 dólares. Informes posteriores situaron la caída fuera del horario de mercado cerca del 7-8%, después de que surgiera la historia de la junta. El riesgo pasado por alto es la sucesión. Reuters dice que Huang no tiene un sucesor obvio y controla estrechamente una empresa fundamental para el auge de la IA. La demanda de chips de Nvidia puede perdurar; el descuento por gobernanza podría durar más tiempo. ¿Puede Nvidia demostrar que es más grande que su fundador? #IMPACTbyTrade $NVDAXUSDT

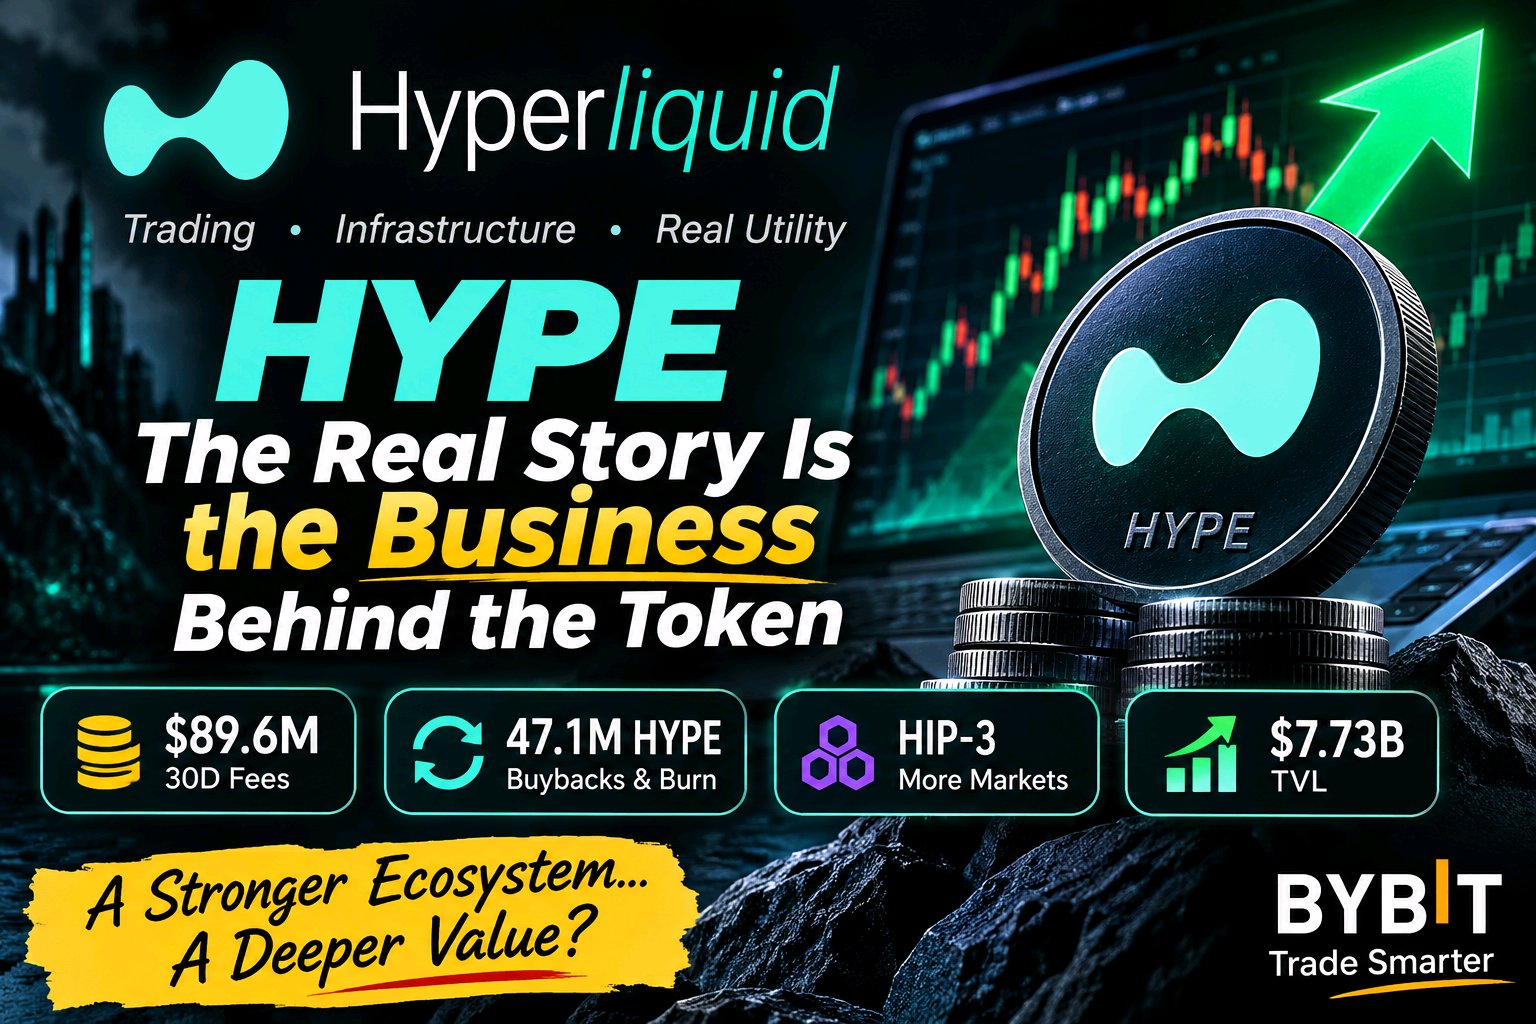
$HYPEUSDT La verdadera historia es el negocio detrás del token Creo que lo más interesante de HYPE no es su vela diaria. Es cómo Hyperliquid está tratando de conectar la actividad comercial, la infraestructura y la demanda de tokens en un solo sistema económico. Los números importan. La instantánea de DeFiLlama del 11 de noviembre muestra que Hyperliquid generó alrededor de $89.6 millones en tarifas durante los 30 días anteriores, incluyendo aproximadamente $69 millones en ingresos del protocolo. Eso apunta a que los usuarios están pagando por usar el producto, no solo por una retención impulsada por la narrativa. El diseño del token también importa. El Fondo de Asistencia de Hyperliquid utiliza las tarifas del protocolo para comprar HYPE en el mercado abierto, y su declaración de registro presentada ante la SEC dice que el 99% de las tarifas del protocolo se asignan al fondo. La presentación informó que 47.1 millones de HYPE habían sido adquiridos y eliminados permanentemente de la circulación para el 8 de septiembre de 2026. Eso crea un vínculo más claro entre la actividad del lugar y el token de lo que ofrecen muchos modelos de tokens de intercambio. Pero yo no lo llamaría un piso de precio garantizado. Las recompras pueden respaldar la demanda; no pueden anular el riesgo de valoración, las condiciones cambiantes del mercado o la presión de venta. Esa distinción es lo que más importa cuando el sentimiento se vuelve negativo. La hoja de ruta del producto importa. HIP-3 permite que los constructores calificados desplieguen sus propios mercados perpetuos en Hyperliquid, con el diseño y la operación del mercado manejados por el implementador. Esto es más que otro par comercial: brinda a los equipos externos un camino para crear mercados especializados utilizando la infraestructura comercial de la red. Podría ampliar la plataforma más allá de los mercados que su equipo central decide listar. Una señal contradictoria importa: DeFiLlama mostró un TVL (valor total bloqueado) de alrededor de $7.73 mil millones el 11 de noviembre, una caída de aproximadamente 10.5% en 30 días. Las tarifas fuertes y la caída del TVL pueden coexistir, pero esa divergencia merece atención. La próxima prueba es si la actividad se amplía y el capital se vuelve más permanente, en lugar de depender solo del comercio intenso. Mi opinión: HYPE tiene un mecanismo convincente de actividad a token, pero el caso de inversión depende del uso sostenido, la profundidad saludable del mercado y una gestión de riesgos disciplinada. Estoy observando si los nuevos mercados atraen usuarios recurrentes y liquidez duradera, no solo un titular de mayor volumen. ¿Qué es lo que más te importa al juzgar a HYPE: la generación de tarifas, la captura de valor del token o el crecimiento en los mercados creados por equipos independientes? #IMPACTbyTrade