yusuf
4223Me gusta0Compartir en el chat155Aficionados344Seguir
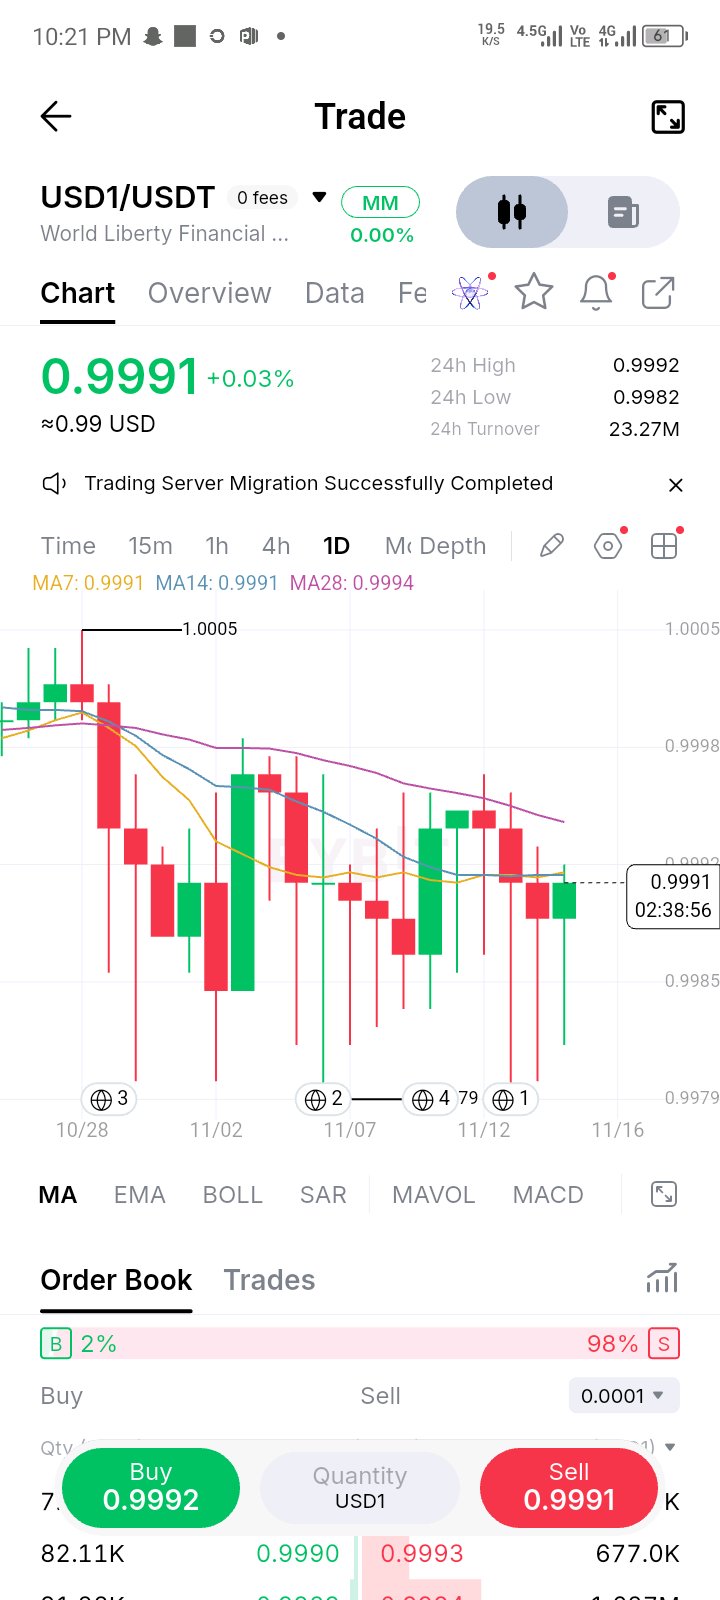
USD1 SIGUE CAYENDO A 0.998 FRENTE A USDT Y LO COMPRAN. LOS CIERRES NUNCA SALEN DE LA BANDA En el gráfico diario, $USD1 lleva tres semanas justo por debajo de la par frente a USDT, con cierres mayormente entre 0.9985 y 0.9998. Hoy está en 0.9991, y las medias móviles (MA) de 7, 14 y 28 están apiladas entre 0.9991 y 0.9994, así que el promedio y el precio son básicamente lo mismo. La acción está en las mechas. Varias velas han hecho movimientos bruscos hacia abajo hasta 0.998 y han sido compradas de vuelta dentro del mismo día, con el registro más bajo en este gráfico en 0.9979. Los compradores han defendido esa zona cada vez, y los vendedores no han logrado un cierre por debajo de ella. El único viaje por encima de 1.0000 fue una sola mecha hasta 1.0005 a finales de octubre. Esto es un spread, no un trade, así que no hay una entrada que buscar. Lo que yo vigilaría es un cierre diario por debajo de 0.9979, porque ese es el único resultado que este rango de tres semanas no ha producido. Cualquier cosa dentro de eso es ruido. ¿En qué confías más en una stablecoin: en cómo cierra o en qué tan rápido compran las mechas? $USD1USDT$NOTUSDT #ByXIMPACT
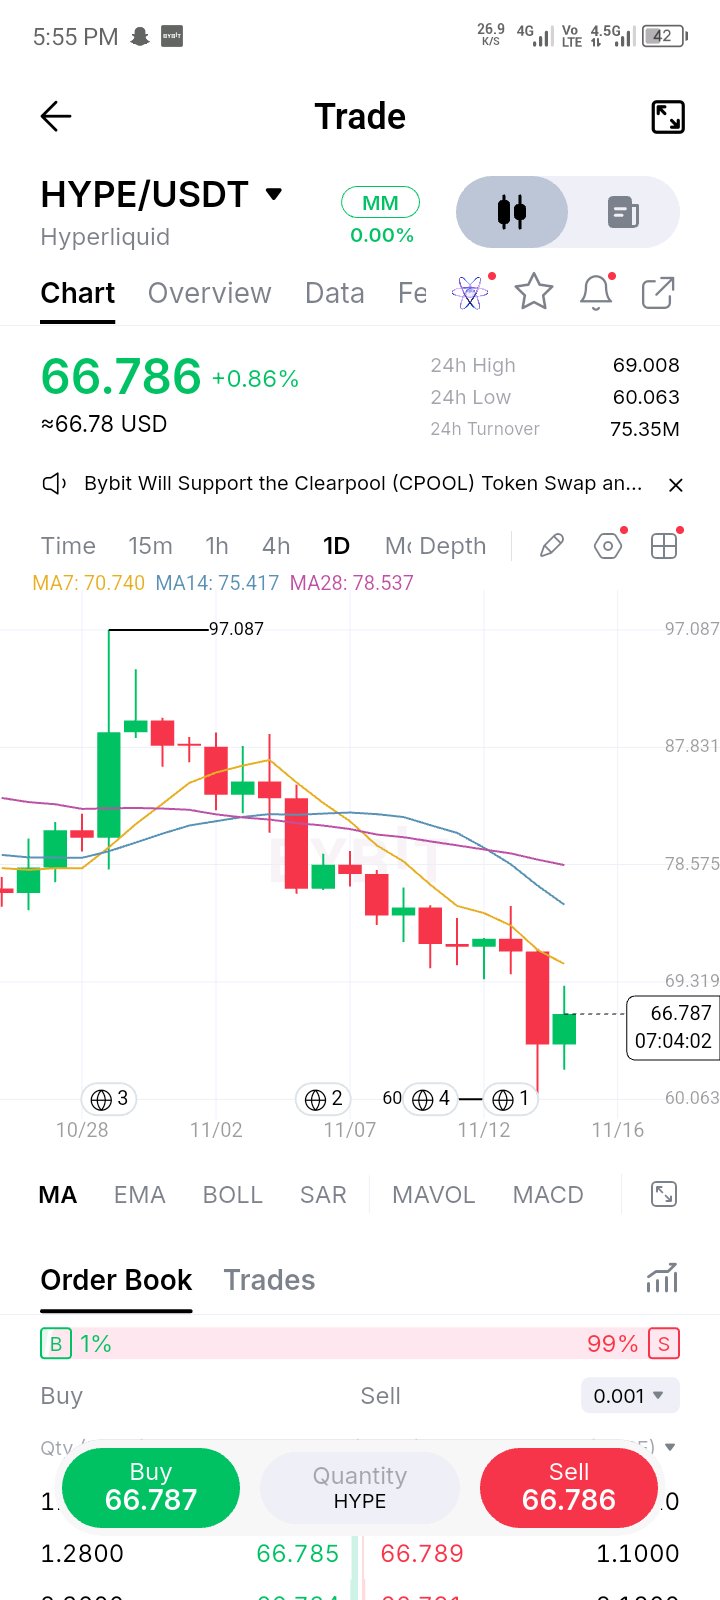
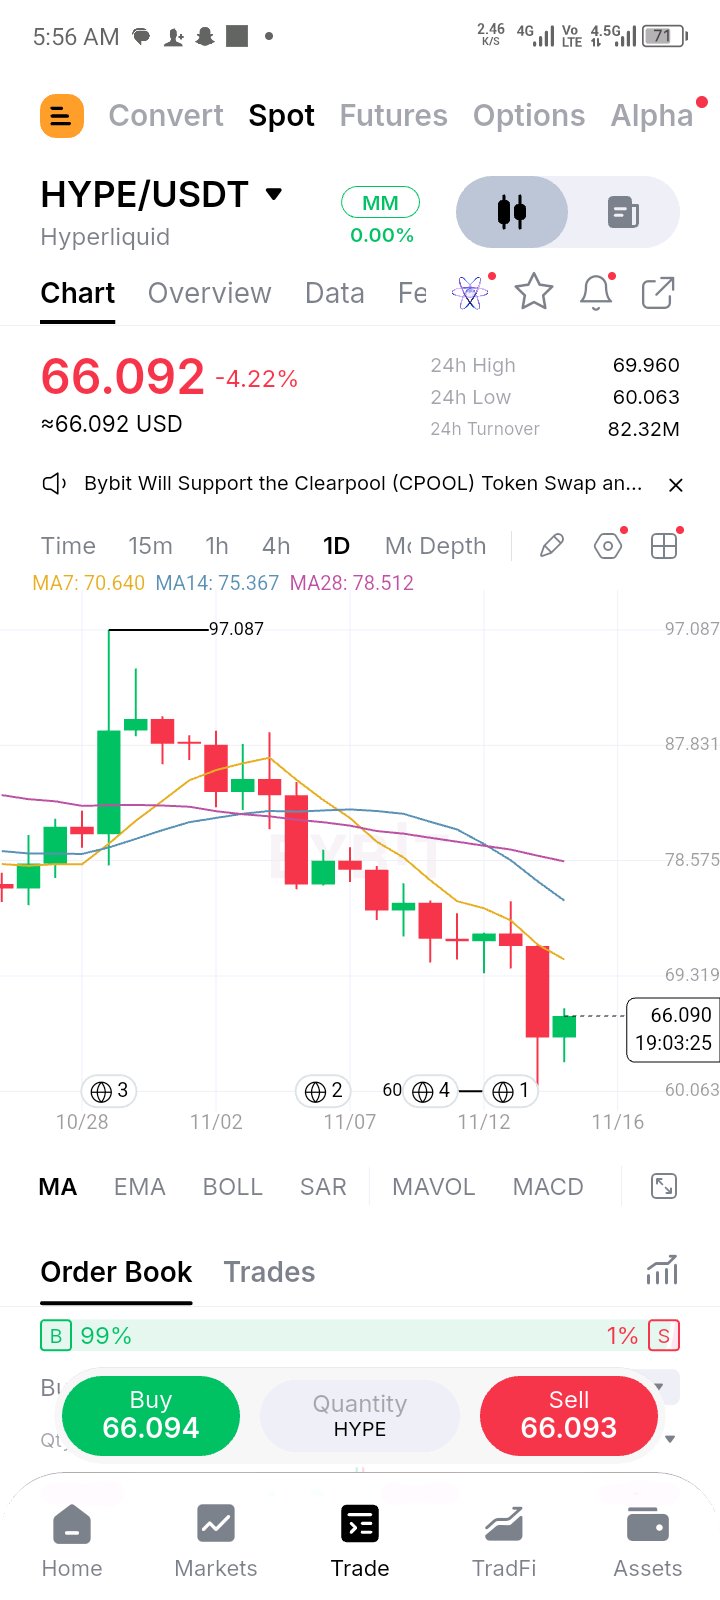
HYPE HAS RECOVERED MORE THAN HALF OF ITS -10% CANDLE IN ONE DAY. THE 7 MA IS THE NEXT EXAM $HYPE crashed about 10% on 11/14 and wicked to 60.063. Today it has climbed back to 66.8, roughly 58% of that candle's drop, measured from its open near 71.6 down to the low. The candle is green with a clean body, and the low of the day, around 62, is above yesterday's. The test is right overhead. The 24h high of 69.0 stalled under the 7 MA at 70.74, and the crash candle's open near 71.6 sits just above it. That 69-71.6 band is where the market decides whether yesterday was a flush or the start of a bigger leg. Holding above 64, yesterday's close, keeps the higher low intact. A daily close above 71.6 would erase the crash candle and say the whole thing was a shakeout. Context: price is still about 6% under the 7 MA, 11% under the 14 at 75.4 and 15% under the 28 at 78.5, all falling, and the move is 31% off the 97.087 high. Recoveries inside a downtrend often stall into falling averages, so I'd want the close, not the intraday spike. Below, about 62 is today's low, then 60.063. A close under 60 would undo all of it. Today's candle still has about seven hours left. Do you give this bounce credit for the 58% recovery, or only for a reclaim of the 7 MA? $HYPEUSDT$SUIUSDT #ByXIMPACT
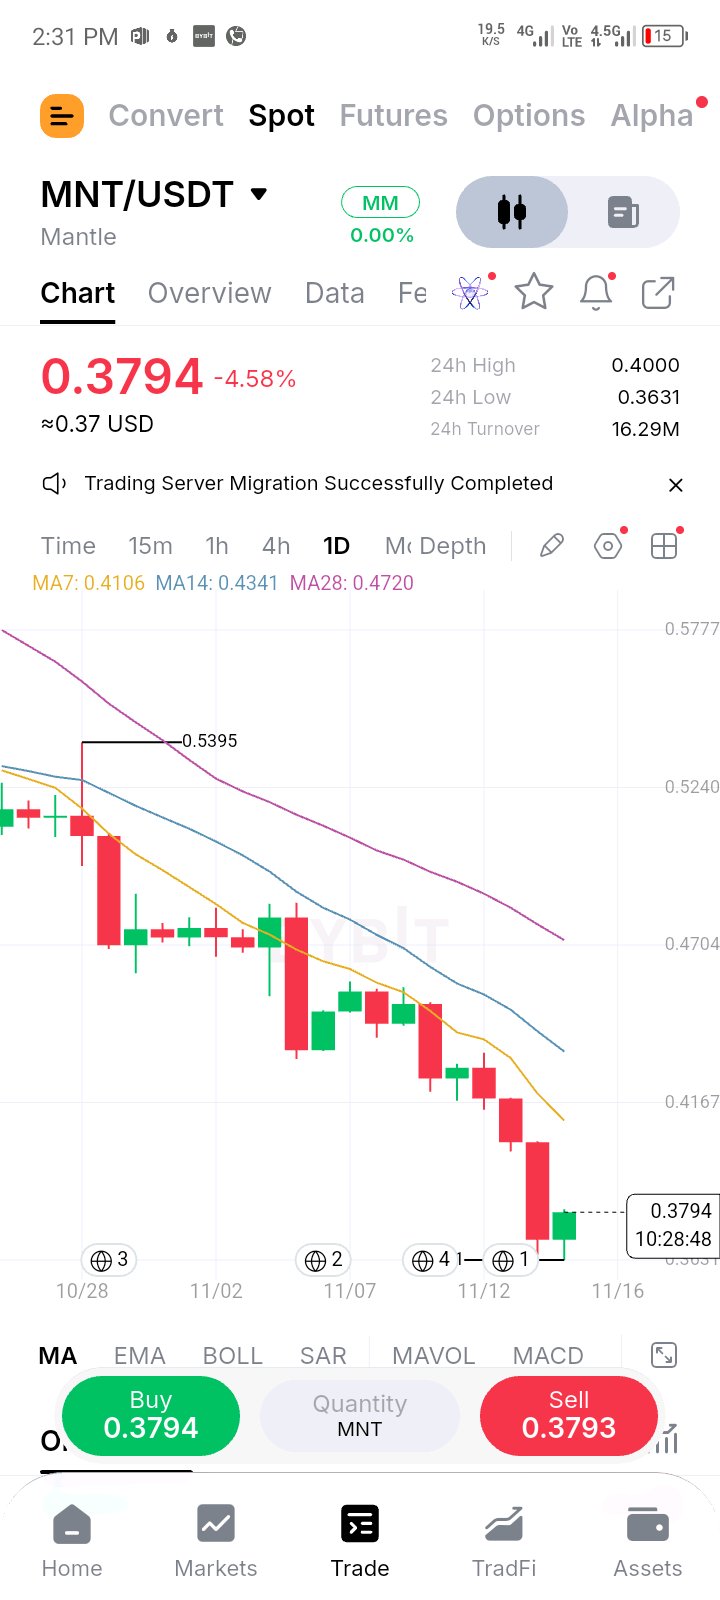
MNT LOST THE ROUND 0.40 AND HASN'T BEEN ABOVE IT SINCE. THREE THINGS STACK RIGHT OVER PRICE $MNT is down about 30% from the 0.5395 high, and yesterday's roughly -8% candle took out the round 0.40. In the 24 hours since, the highest print has been exactly 0.4000, so the number was touched from below and turned back. Today is a small bounce: price is about 4.5% above the 0.3631 low, at 0.3794. Here's what stacks overhead: the round 0.40, about 0.402 where yesterday's candle opened, and the 7 MA at 0.4106. That's three reference points inside roughly a 3% band, which is why I'd treat 0.40-0.41 as one zone instead of three levels. A daily close above it would be the first real signal. Anything less is a bounce under a lid. The bigger picture hasn't changed. Price is about 8% under the 7 MA, 13% under the 14 at 0.4341 and 20% under the 28 at 0.4720, and all three are falling. Below, 0.3694, yesterday's close, is the first support, then the 0.3631 low. Under that there's nothing on this chart. Today's candle still has about ten hours left. Which matters more here: the round 0.40 or the 7 MA? $MNTUSDT$GRAMUSDT #ByXIMPACT
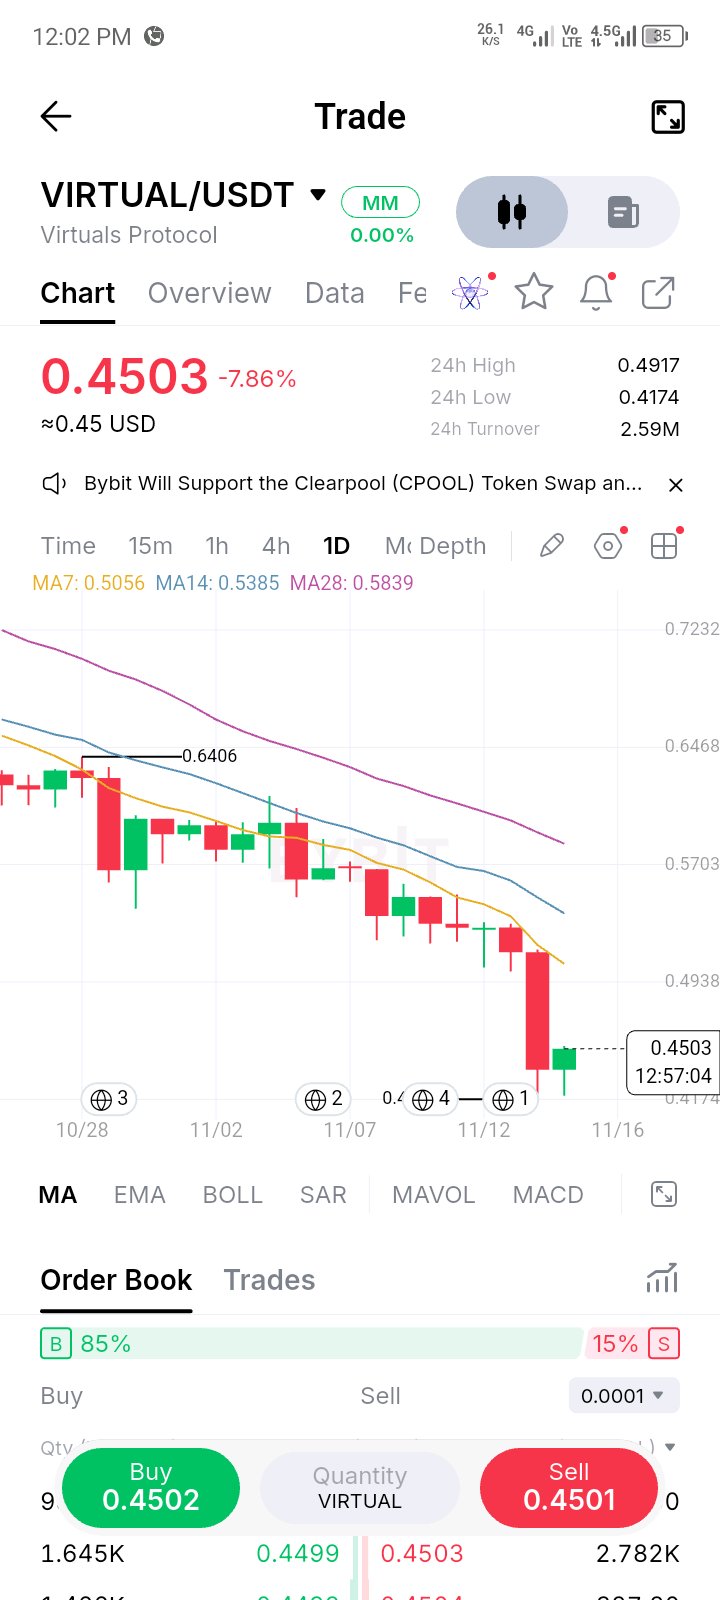
VIRTUAL LOST 15% IN A DAY AND HAS CLAWED BACK A THIRD OF IT. THE NEXT THREE LEVELS ARE EASY TO MARK $VIRTUAL printed the biggest daily candle of this slide on 11/14, roughly -15%, then tagged 0.4174 and has bounced about 8% to 0.4503. Measured against that candle's drop, from roughly 0.51 down to the 0.4174 low, price has recovered about 35% of it. The ladder: about 38% of the drop sits near 0.454, the halfway point near 0.465, and 62% near 0.476. The full give-back is the roughly 0.51 open of yesterday's candle. Those percentages are just widely watched reference points, but plenty of traders use them, which is why bounces so often stall at one. Where this one stalls will say a lot. Stopping around 0.454-0.465 is the standard dead-cat shape. Getting through 0.476 would start to look like a real recovery. Overhead, price is about 11% under the 7 MA at 0.5056 and 16% under the 14 at 0.5385, both falling. Below, 0.4174 is the low, and there's nothing else on this chart under it. Today's candle still has about 13 hours left. Where do you expect this bounce to stall: 0.454, or the halfway mark? $VIRTUALUSDT$XAUTUSDT #ByXIMPACT
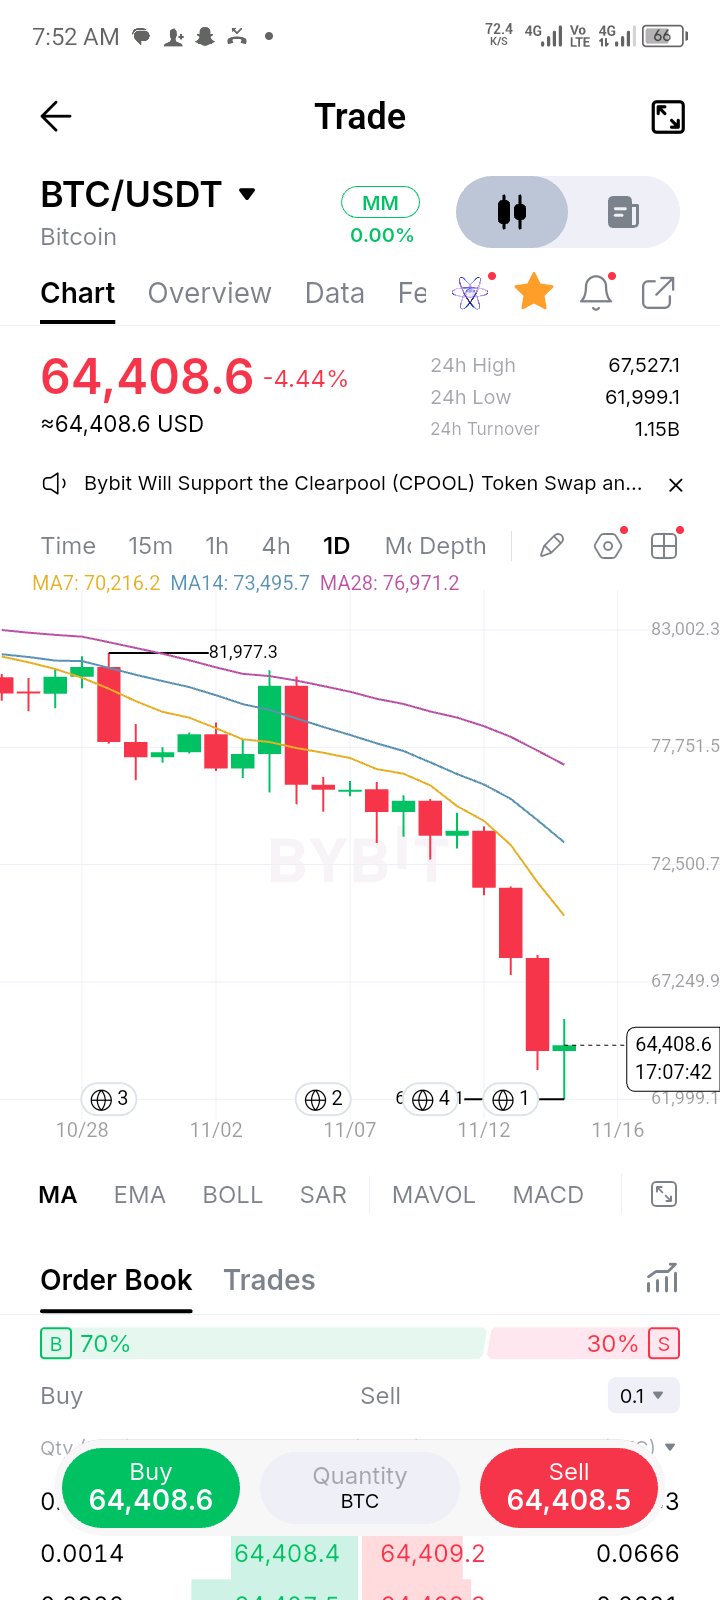
BTC FINALLY HAS A LOWER WICK: 61,999 BACK TO 64.4K. AFTER THREE DAYS OF CLOSING AT THE LOWS, THAT'S NEW $BTC closed at or near its low three days in a row, and every candle was bigger than the last: roughly -3.4%, -4.5% and -6.0%. Today broke the pattern. Price dipped to 61,999, almost exactly the round 62k, and has bounced about 4% to 64,400, leaving the first real lower wick since the slide accelerated on 11/12. That matters, but it's still just a wick. The day has about 17 hours left, and a hammer only counts if it closes like one. Price is also 8% under the 7 MA at 70.2k, 12% under the 14 at 73.5k and 16% under the 28 at 77.0k, and about 21% off the 82k high. What I'd watch: today's high near 65.5k is the first lid, then the 67.5k area, the 24h high, and yesterday's open at 68.2k, where the last big red candle started. A daily close above 68.2k would be the first real shift. If 61,999 fails on a close, the round 60k is the next number, with nothing else to reference on this chart. I'd rather see a second day of buyers than trust one wick. Would you rather see a second green day first, or a higher low? $BTCUSDT$XRPUSDT #ByXIMPACT
$HYPE MANTUVO EL NIVEL REDONDO DE 60 Y TIENE SU PRIMER MÍNIMO MÁS ALTO DESPUÉS DE UN DÍA DE -10% $HYPE cayó alrededor de un 10% el 14/11, pero la vela no cerró en el mínimo. Tocó fondo en 60.063, casi exactamente el número redondo de 60, y cerró alrededor de 64, dejando una mecha inferior de cerca del 6% de longitud. Hoy el día va en verde hasta ahora, y el mínimo del día, aproximadamente 62.3, se sitúa por encima del mínimo de ayer. El precio ha subido cerca de un 10% desde el fondo. Esa es la forma que quieres ver después de una purga: una mecha inferior larga en la vela de capitulación, seguida de un mínimo más alto. Aunque, sigue siendo solo cuestión de dos velas. Los obstáculos se acumulan. El precio está cerca de un 6% por debajo de la media móvil (MA) de 7 en 70.64, un 12% por debajo de la de 14 en 75.37 y un 16% por debajo de la de 28 en 78.51, todas cayendo. El cuerpo de la vela de ayer, desde cerca de 71.6 hasta 64, es zona de oferta, y el máximo de 24 horas en 69.96 se ubica justo debajo de la MA de 7. Eso crea una banda de resistencia gruesa entre 70 y 71.6. Lo que esperaría ahora: que el mínimo más alto de 62.3 se mantenga, y luego un cierre diario por encima de la MA de 7. El soporte por debajo es el cierre de ayer cerca de 64, luego 62.3, y finalmente el mínimo de 60.063. Un cierre diario por debajo de 60 arruinaría todo. A la vela de hoy todavía le quedan unas 19 horas. ¿Para ti vale algo una defensa de un número redondo como el 60, o es pura coincidencia hasta que se recupere la MA de 7? $HYPEUSDT$NIGHTUSDT #ByXIMPACT
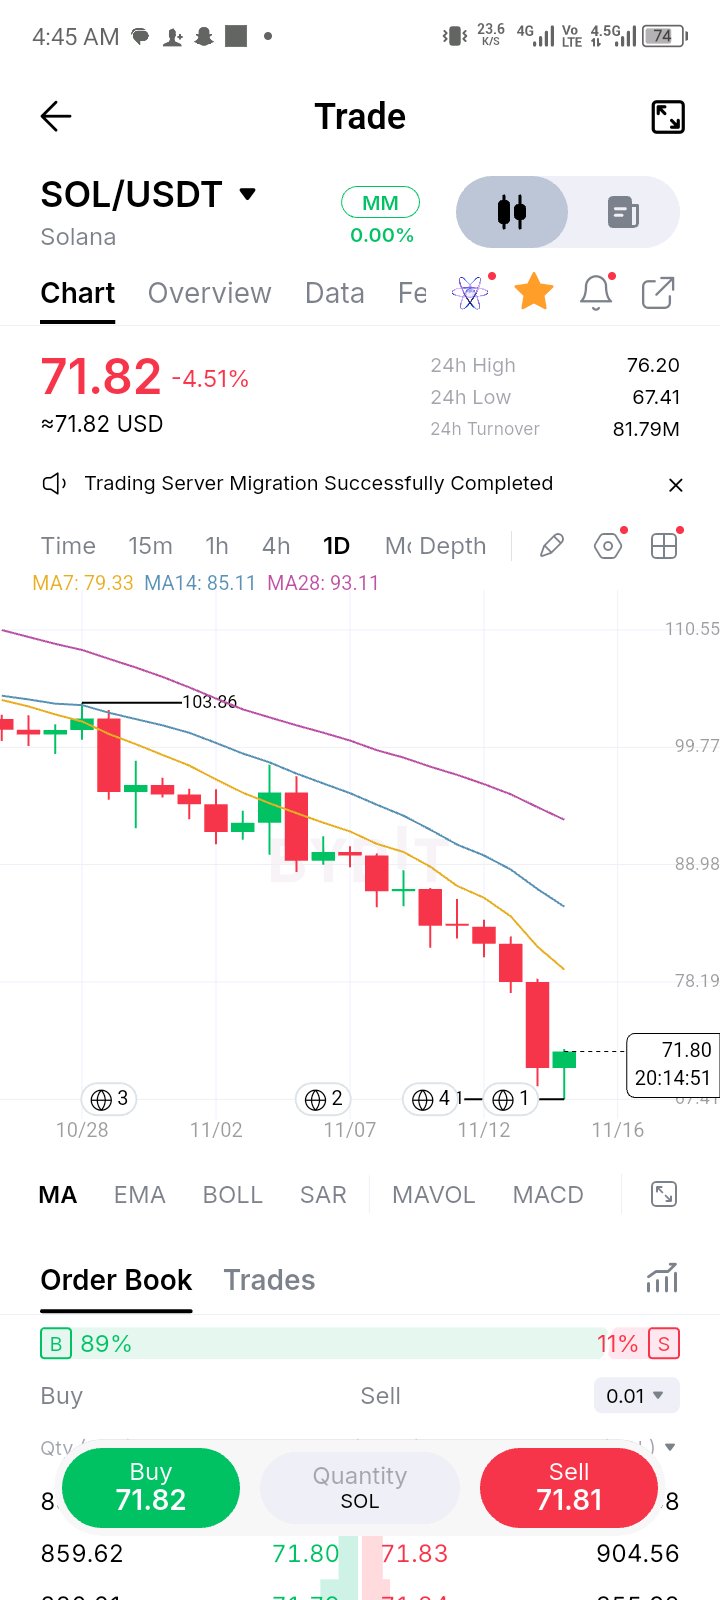
SOL SPRANG BACK 6.5% FROM 67.41 AFTER ITS BIGGEST RED DAY. A HAMMER IS A QUESTION, NOT AN ANSWER $SOL just had the biggest daily candle of this whole slide, about -10% on 11/14. The next candle opened near that close, dipped to 67.41 and has bounced roughly 6.5% off the low, leaving a long lower wick. We're only about four hours into the day, but it's the first picture of real dip-buying after a candle like that. What it isn't yet is a bottom. The 7 MA is at 79.33, about 10% above, with the 14 at 85.11 and the 28 at 93.11, all still falling, and price is about 31% off the 103.86 high. Yesterday's candle body, from roughly 78 down to 70.2, is now a block of supply sitting right above price. What I'd need to see: price holding above 70.2, yesterday's close, then pushing through the 75-76 area where it traded before the drop. A daily close above 78 and then the 7 MA would be the first real change. Lose 67.41 and there's nothing underneath on this chart. Today's candle still has about 20 hours left, so a wick like this can fill in either way. How much of yesterday's -10% would you want to see recovered before calling it a bottom? $SOLUSDT$BTCUSDT #ByXIMPACT
LAS VELAS ROJAS DE BTC SON CADA VEZ MÁS GRANDES Y LA DE HOY NO TIENE MECHA INFERIOR $BTC ha formado tres velas diarias rojas seguidas y cada una ha sido más grande que la anterior: aproximadamente -3.4% el 12/11, -4.4% el 13/11 y cerca de -5.8% hoy, con el precio cotizando a menos del 0.5% del mínimo de 63,946. Es una caída que se está acelerando, no desacelerando. La capitulación suele dejar huella: una mecha inferior larga donde los compradores finalmente entran y una vela que cierra lejos de su mínimo. Hoy no hay ninguna de las dos cosas. Todavía no hay señales en este gráfico de que la venta se haya agotado. Eso no quiere decir que la próxima vela sea roja. Solo dice que nadie ha defendido estos niveles hasta ahora. Niveles perdidos en el camino a la baja: el nivel redondo de 65k y el mínimo de esta mañana de 66,449 ahora están por encima, y el área de 68.2k, la apertura de hoy, es la primera resistencia significativa después de esos. El precio también está un 10% por debajo de la media móvil de 7 períodos en 71.7k, un 14% por debajo de la de 14 en 74.5k y un 17% por debajo de la de 28 en 77.6k, a un 22% del máximo de 82k. Más abajo, 63,946 es el mínimo y el nivel redondo de 64k ya ha sido tocado. Más allá de eso no hay nada en este gráfico, y 60k es la cifra que todos tendrán en mente. A la vela le quedan unas dos horas, así que lo que cuenta es el cierre. ¿Esperas a una vela diaria con mecha larga antes de buscar un suelo, o cuenta primero un cierre por encima de 65k? . $BTCUSDT $COREUSDT #ByXIMPACT
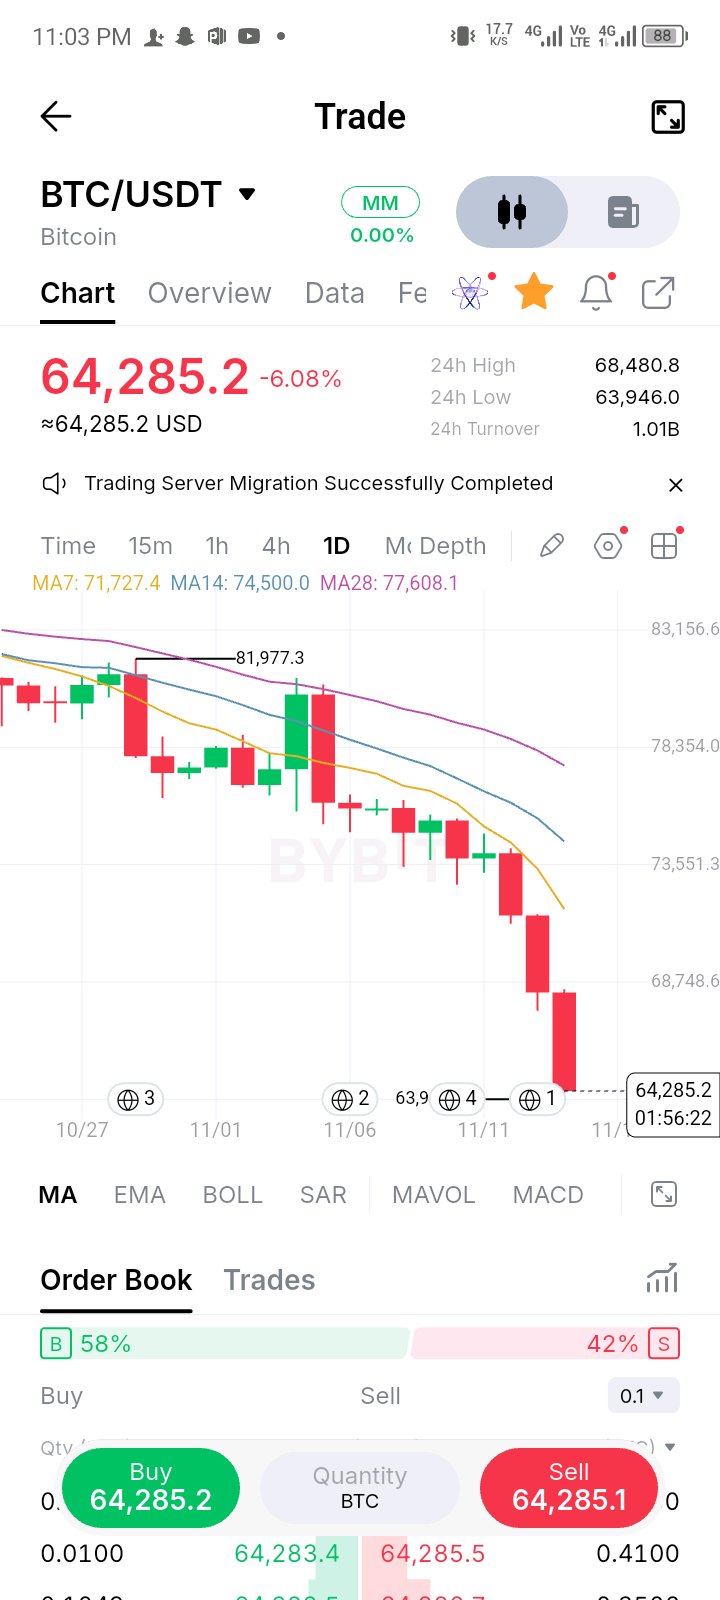
CAP HAS BEEN REJECTED AT 0.13 TWICE IN FOUR DAYS, BUT IT KEEPS CLOSING HIGHER $CAP has spiked to about 0.13 twice, on 11/10 and again today, and both times the wick didn't stay. Today's high is close to 19% above where price is now, at 0.1094, and the 11/10 spike sold back into the low 0.10s the same way. The other half of the story is that the closes keep climbing. Three green dailies in a row, each finishing above the last, with the 7 MA at 0.103 supporting price on the dips. All three MAs are rising and stacked in the right order (0.103, 0.096, 0.087), and price is up about 65% from the 0.0665 low on 11/01. That's a tension, not a verdict. Two failed pokes at the same level say there's a lot of supply sitting at 0.13. Closes that keep stepping higher say that supply is being absorbed. A daily close above 0.13 would be a clean break. A daily close under the 7 MA at 0.103 would say the dip-buyers are done and bring the 14 MA at 0.096 into play. One caution: price is about 14% above the 14 MA and 25% above the 28 MA, so pullbacks can be sharp even inside an uptrend. Today's candle still has about six hours left. Do you treat repeated long upper wicks as a warning, or as supply being eaten? $CAPUSDT$SOLUSDT #ByXIMPACT
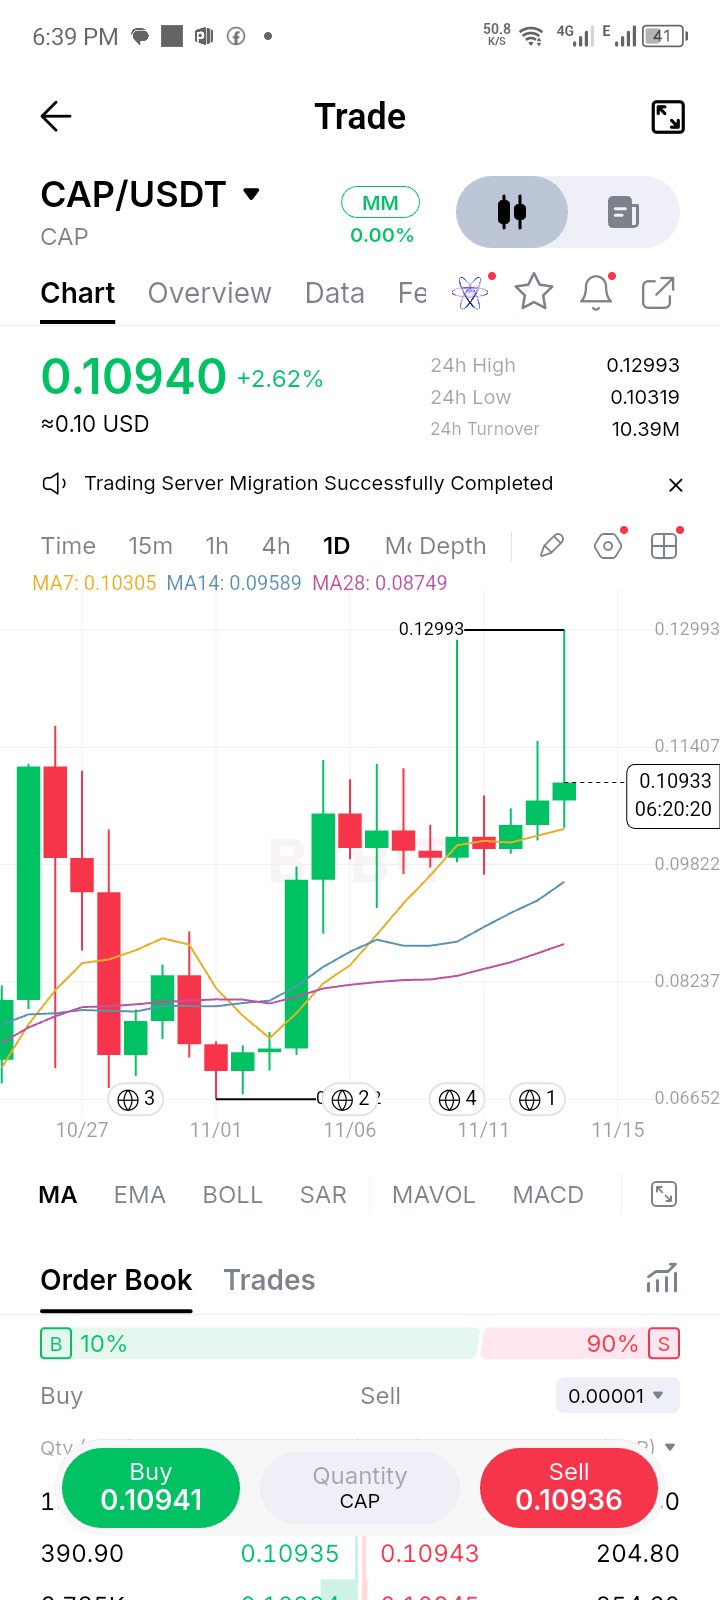
HYPE HA DEVUELTO TODO EL BREAKOUT DEL 29/10, Y HOY ROMPIÓ LA ÚLTIMA PAUSA HYPE subió de unos 80 a un máximo de 97 el 29/10, cerró ese día cerca de 89 y desde entonces ha devuelto todo eso y más. A 67.4, el precio está aproximadamente un 31% por debajo del máximo y cerca de un 16% por debajo de donde abrió la vela del breakout. Es un viaje de ida y vuelta completo en unas dos semanas. Las últimas cuatro sesiones fueron una pausa estrecha entre aproximadamente 72 y 75, y hoy ese rango se rompió. La vela roja es de alrededor del 6% y está justo en su mínimo, con un nuevo mínimo de 67.113 y casi sin mecha inferior. Todavía no hay rebote. La estructura: el precio está cerca de un 7% por debajo de la media móvil de 7 períodos en 72.3, 13% por debajo de la de 14 en 77.1 y 15% debajo de la de 28 en 79.1. Todo se está desplomando, y la media móvil de 7 ahora se sitúa justo dentro del antiguo rango de pausa. Niveles: 72-75 ahora es zona de oferta, y un rebote que se detiene ahí es el patrón normal. Recuperar 75 en un cierre diario sería la primera señal de cambio. Por debajo de 67.1 no hay nada de referencia en este gráfico. A la vela de hoy todavía le quedan unas diez horas. Después de un pico y un colapso como este, ¿buscas una base por debajo del nivel de breakout o esperas a que se recupere la media móvil de 7? $HYPEUSDT$NIGHTUSDT #ByXIMPACT
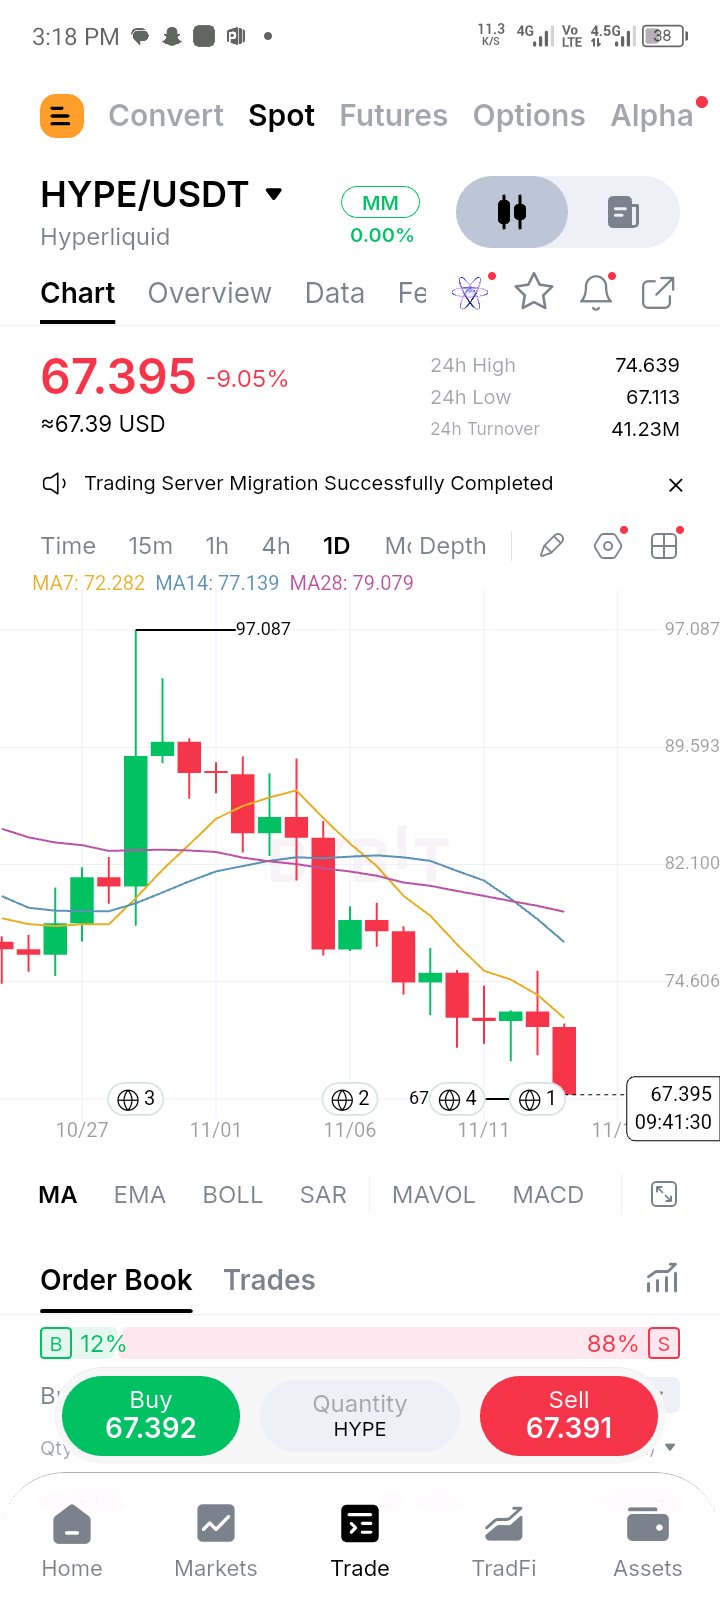
ETH LOST THE ROUND 2,000 AND PRINTED A NEW LOW AT 1,878. THE OLD FLOOR IS NOW THE CEILING $ETH spent a couple of sessions stalling around 2,040-2,100 after the last flush, and that pause resolved lower. A red candle of roughly 4-5% yesterday took out the round 2,000 and the 2,005 low, and a new low printed at 1,878 in the last 24 hours, about 1.4% under today's 1,903. How I read it: the old floor becomes the ceiling. The 2,000-2,036 zone is now supply, and a bounce into it that fails would confirm sellers are still defending it. Reclaiming 2,000 on a daily close would be the first sign this was a one-day undercut instead of a real breakdown. On the stretch: price is about 6% under the 7 MA at 2,032, 12% under the 14 at 2,155 and 16% under the 28 at 2,256, and about 22% off the 2,450 high from early November. That distance makes a sharp bounce possible, but distance alone doesn't mean the trend has turned. Below, 1,878 is the low, and there's nothing under it to reference on this chart. Today's candle still has about 15 hours left. Is 2,000 a ceiling for you now, or just a level price passes through on the way back up? $ETHUSDT$BTCUSDT #ByXIMPACT
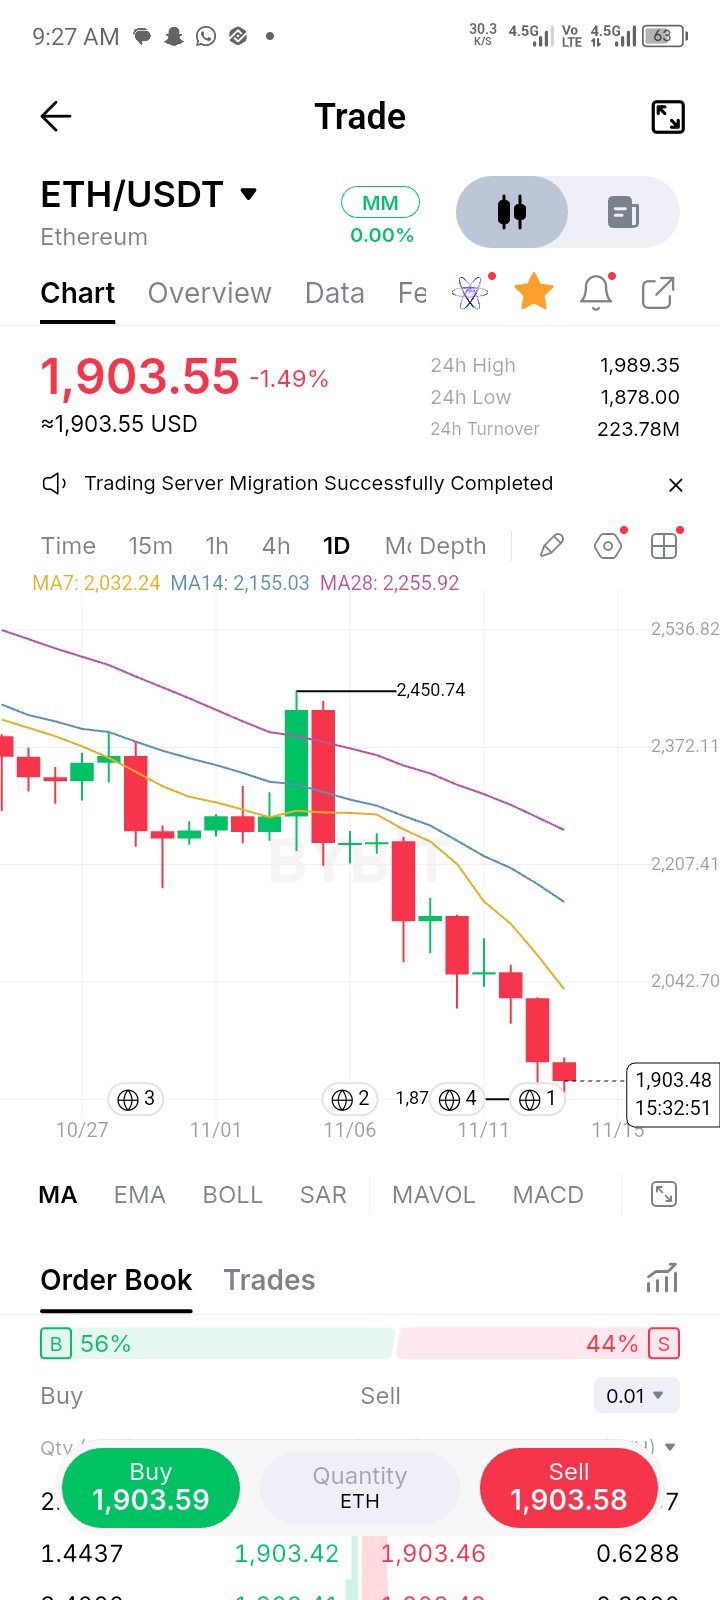
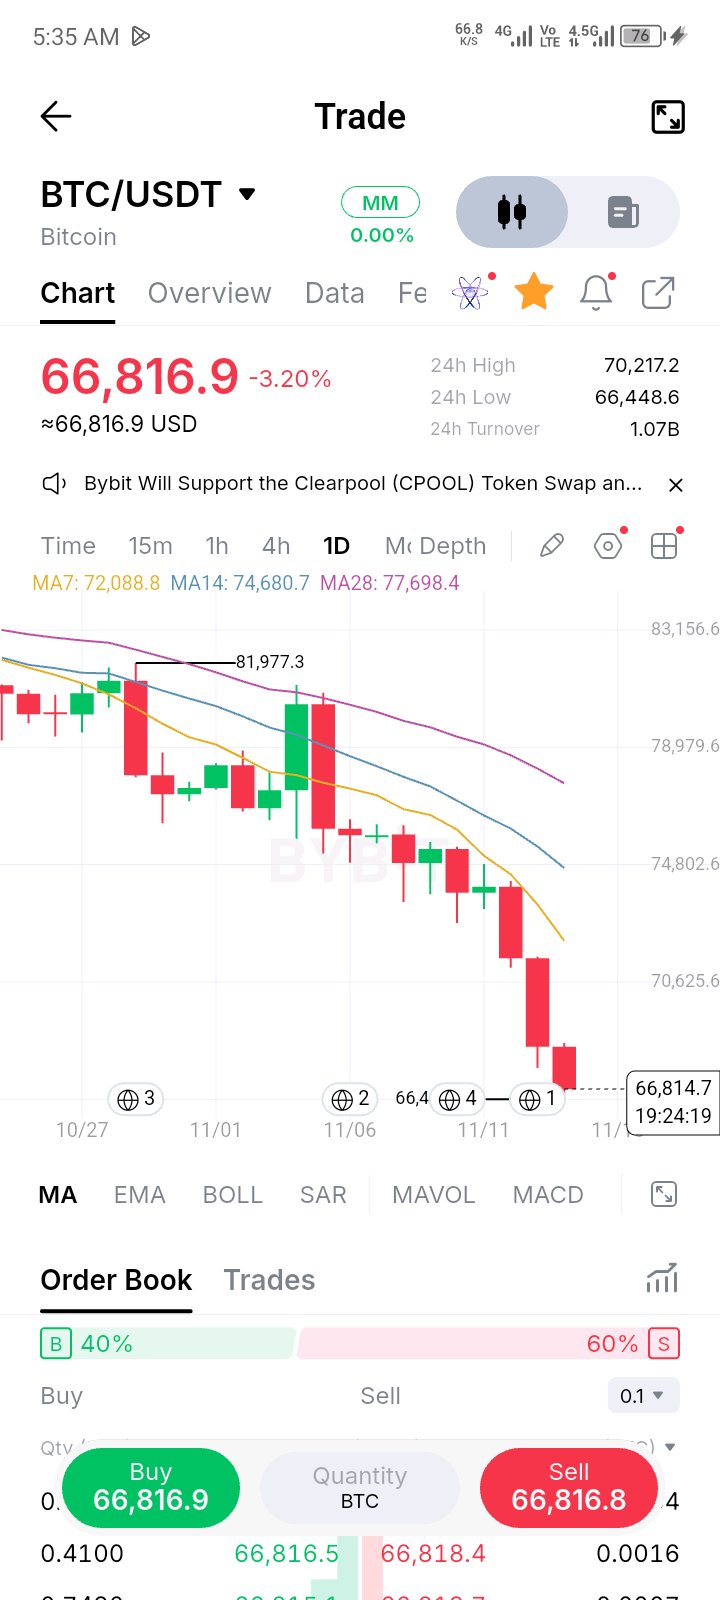
BTC IS DOWN 10% IN THREE DAYS AND EVERY DAILY CANDLE IS CLOSING NEAR ITS LOW $BTC has gone from 74.0k to 66.8k in three daily candles, and each one has finished near its low. The day before yesterday closed near 71.4k, yesterday closed around 68.3k after a low near 67.5k, and today is sitting about 0.5% above a fresh low at 66,449. Closing near the low means buyers aren't stepping in late in the day. That's what persistent selling looks like. The averages are nowhere close. Price is about 7% under the 7 MA at 72.1k, 10% under the 14 at 74.7k and 14% under the 28 at 77.7k, all still falling, and it's about 18.5% off the 82k high on this chart. That's stretched, so a sharp bounce can come at any time, but stretch alone doesn't end a trend. It just raises the odds of volatility in both directions. Levels: first resistance is 68.3k, yesterday's close and today's open. Above that, the round 70k and the 24h high at 70.2k, then 71.4k and the 7 MA near 72.1k. A daily close back above 70k is the minimum I'd need to say the selling has paused. Underneath, 66,449 is today's low and the round 65k is the next number people will watch. There's nothing else to reference on this chart. Today's candle still has about 19 hours left, so none of this is final. Do you wait for a daily close above 70k, or does the first higher low count for you? $BTCUSDT$HYPEUSDT #ByXIMPACT
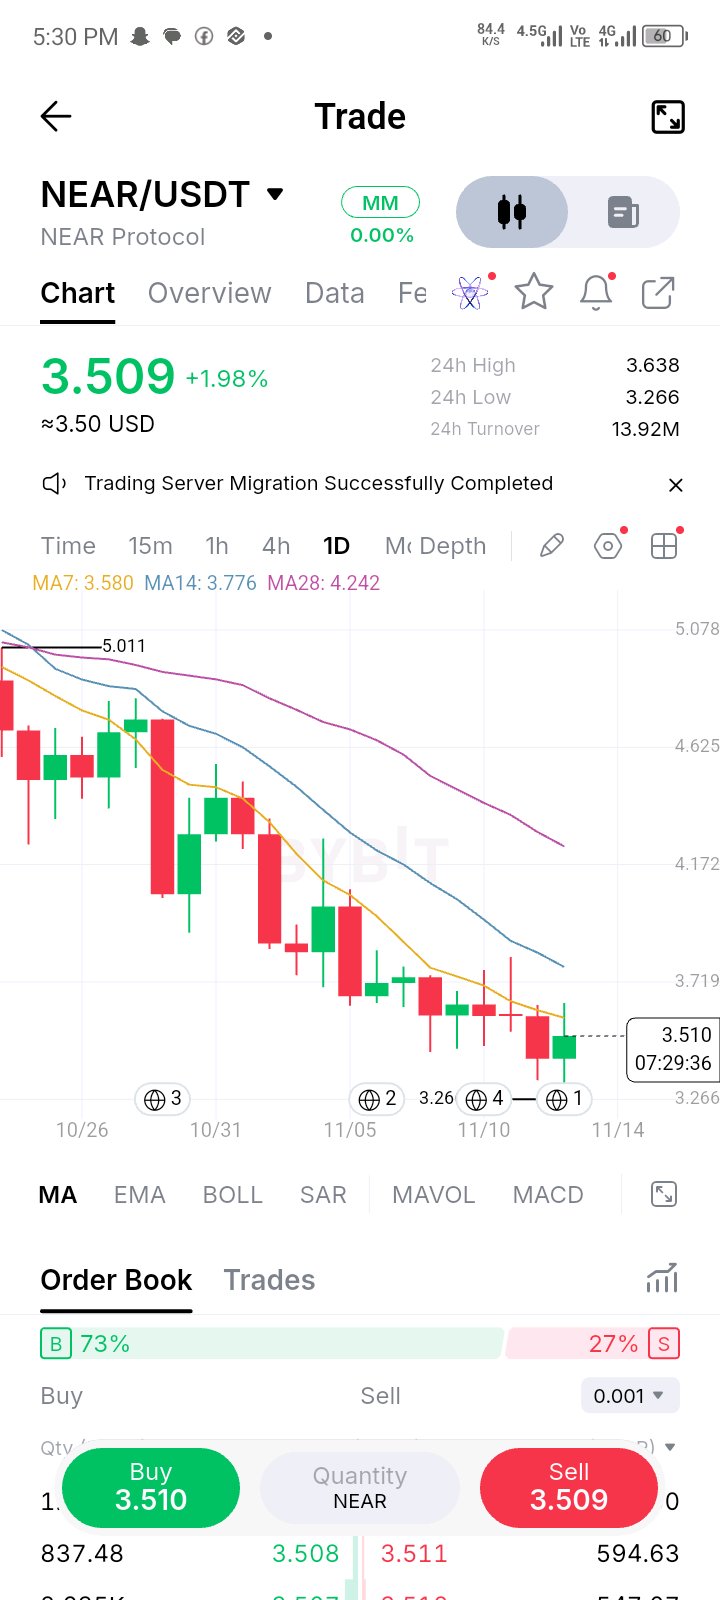
NEAR TRIED TO TAKE BACK ITS BROKEN FLOOR AND WAS REJECTED AT 3.638 $NEAR is down about 30% from the 5.01 high, and today is the first real bounce attempt. It spiked from the lows around 3.3 up to 3.638, poked above the 7 MA at 3.58, and has since slid back to 3.509. Long wicks at both ends and a small body: indecision after a heavy slide. The wick up matters most. The 3.57-3.64 area is where price was trading until yesterday's breakdown, and the 7 MA sits right on it. A failed reclaim of a broken level is the standard sign that sellers are still defending it. Buyers did show up on the dip, defending the 3.27 low, so this is a contest, not a rout. The map: 3.58-3.64 first, then the 14 MA at 3.776, about 8% above price, and the falling 28 MA at 4.242 far above that. Below, 3.27 is the low. Lose it on a daily close and there's no reference left on this chart. I'd want a daily close above 3.64 before treating this as anything more than a bounce inside a downtrend. Today's candle still has about seven hours left. Does the long upper wick at the 7 MA change your read, or is the lower wick the bigger story? $NEARUSDT$BTCUSDT #ByXIMPACT
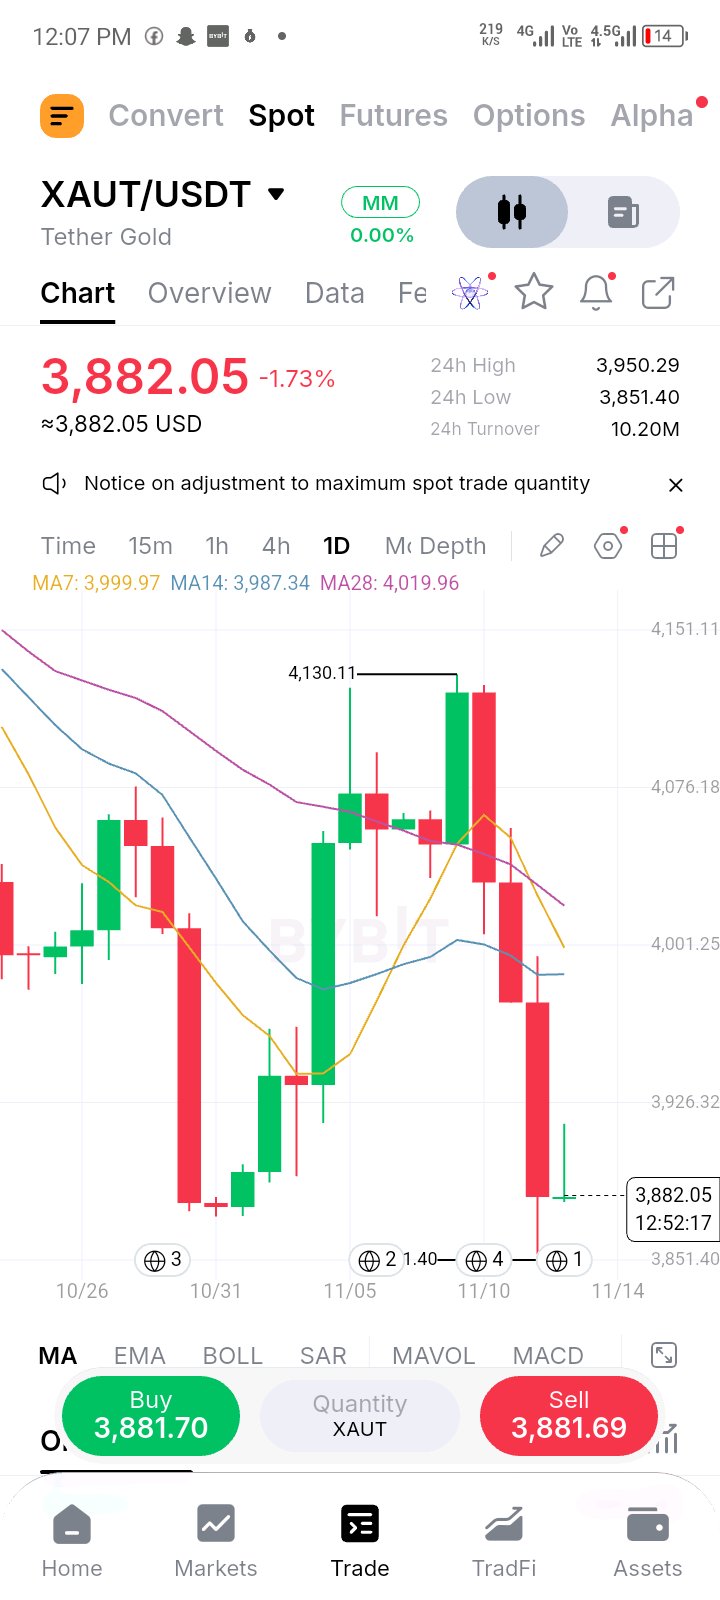
GOLD UNDERCUT ITS PRIOR SWING LOW BY 20 POINTS AND CLOSED BACK ABOVE IT. SPRING OR JUST A PAUSE? $XAUT has now given back essentially all of its rebound. Three red dailies in a row took it from the 4,130 high to 3,851, and yesterday's candle pushed under the 3,872 swing low by about 20 points before closing back above it, near 3,881. An undercut that closes back inside the old range is the textbook shape of a failed breakdown, which is why this level matters. But one candle isn't confirmation. Today so far is a small doji with an upper wick, a bounce attempt that got sold, so buyers haven't shown up in size yet. Overhead is a lid. The 7, 14 and 28 MAs are all packed between about 3,987 and 4,020, with the round 4,000 right in the middle. That's the first place a recovery has to prove itself, and the 3,950 area, the 24h high, is the speed bump on the way there. If 3,851, yesterday's low, breaks on a daily close, the undercut was a breakdown after all, and there's no reference below it on this chart. Today's candle still has about 13 hours left. Does a one-candle undercut count as a failed breakdown for you, or do you need 4,000 back? $XAUTUSDT$HYPEUSDT #ByXIMPACT
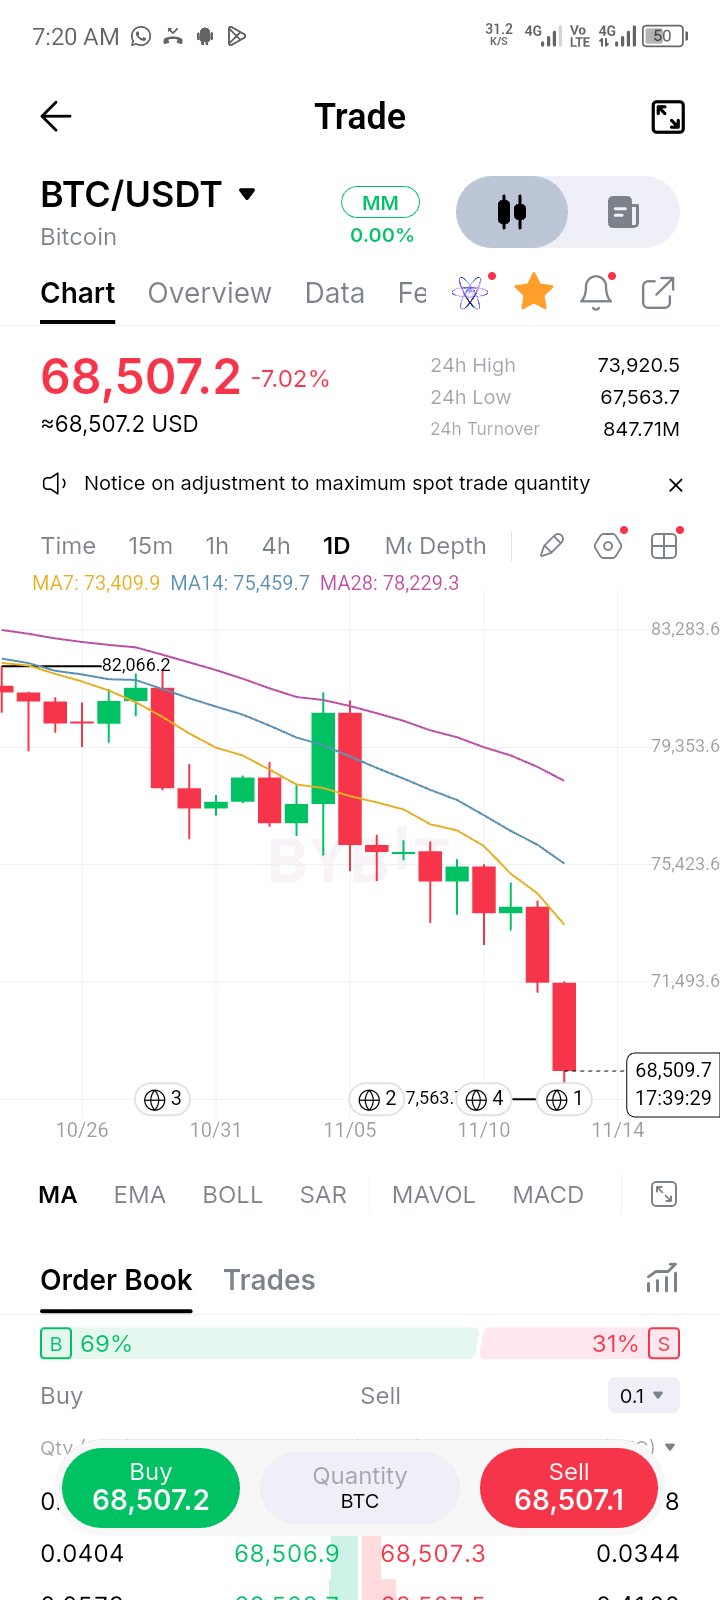
BTC LOST THE 72.7K FLOOR. NOW 70K IS OVERHEAD, NOT UNDERFOOT $BTC spent days chopping above 72.7k, and the floor gave way. After a roughly 3.5% red daily yesterday, today's candle has taken price to 68.5k, about 4% lower on the day and within 1.5% of the 67,564 low. Price is down about 7% in 24 hours and about 16% from the 82k high on this chart. Closing near the lows is how continuation candles look, though the day isn't finished. Three things on the chart. There's no base: the range right before the break was small candles under falling MAs. Every MA is above price and pointing down, with price about 7% under the 7 MA at 73.4k, 9% under the 14 at 75.5k and 12% under the 28 at 78.2k. And the zone that just broke, from 72.7k up to the 73.9k high of the last 24 hours, is now supply. So the first bounce has a map: the round 70k, then yesterday's close near 71.4k, then the old 72.7k floor. A daily close back above 72.7k is what I'd need before calling this a fakeout. Below, 67,564 is the low to watch, and once it goes there's no reference left on this chart. Where do you expect the first bounce to stall: 70k or 71.4k? $BTCUSDT$ETHUSDT #ByXIMPACT
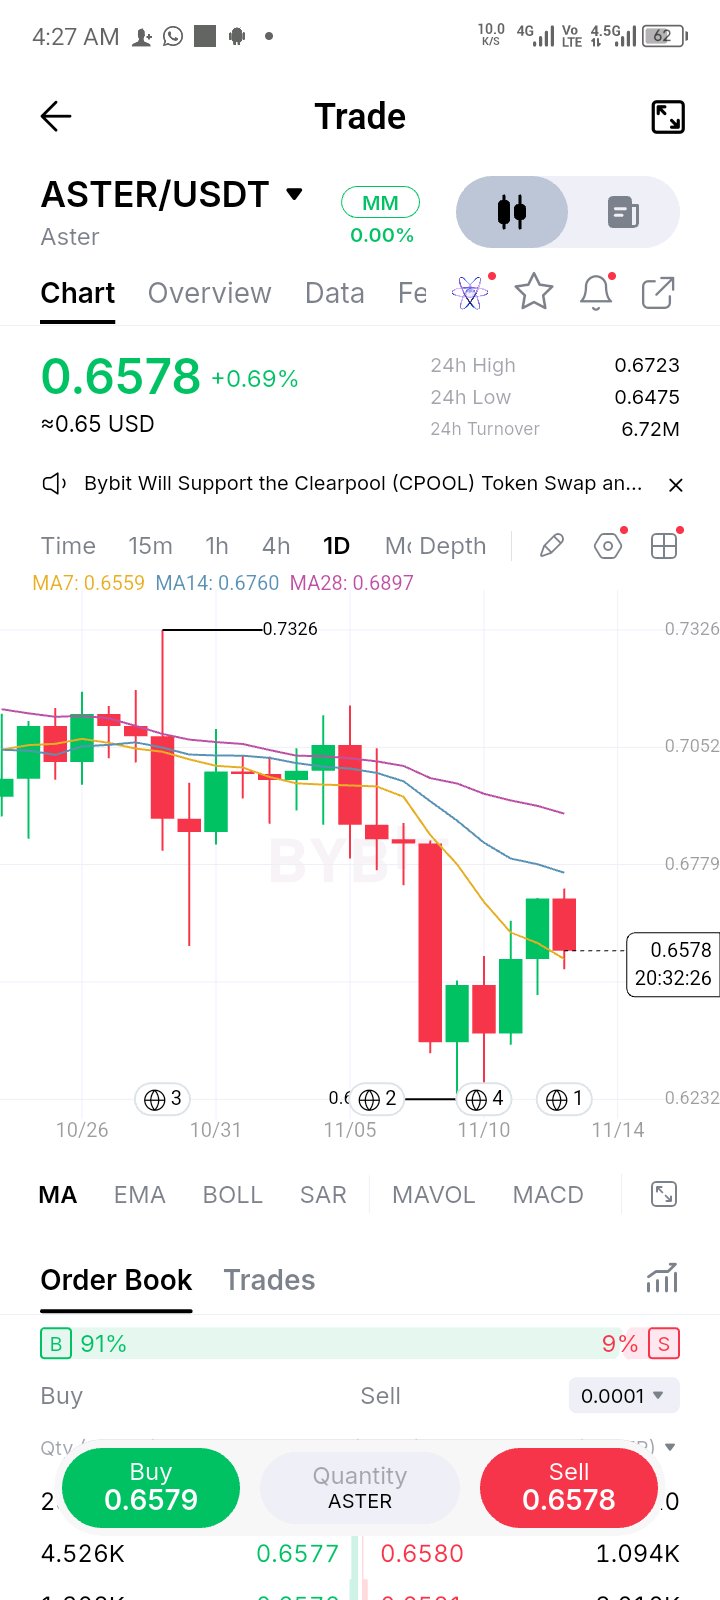
ASTER HAS MADE HIGHER LOWS FOR FOUR DAYS. TODAY'S PULLBACK TO THE 7 MA IS THE FIRST REAL TEST $ASTER flushed on a big red candle on 11/08 and has been building a staircase of higher lows ever since, from about 0.623 up to 0.6475. That's four sessions of buyers stepping in a little earlier each time, and it took price back through the 7 MA. Today it's pulling back to that average. Price is 0.6578 against a 7 MA of 0.6559, and it's also sitting near the midpoint of the 11/08 flush candle, around 0.659. Two reference points stacked in the same spot make this the place where a reclaimed level either holds or doesn't. Holding keeps the staircase intact and puts the 0.672 high back in play. The ceiling is still heavy. The 14 MA at 0.676 and the 28 MA at 0.690 are both falling, and the flush started near 0.682, so there's supply parked across 0.676-0.69. A daily close above 0.69 would be the first thing to change my read on the trend. If 0.6475 gives way, the staircase breaks, and 0.623 becomes the level that matters. Today's candle is only about three and a half hours old. Do you buy a first retest of a reclaimed MA, or wait for the higher high? $ASTERUSDT$BIRBUSDT #ByXIMPACT
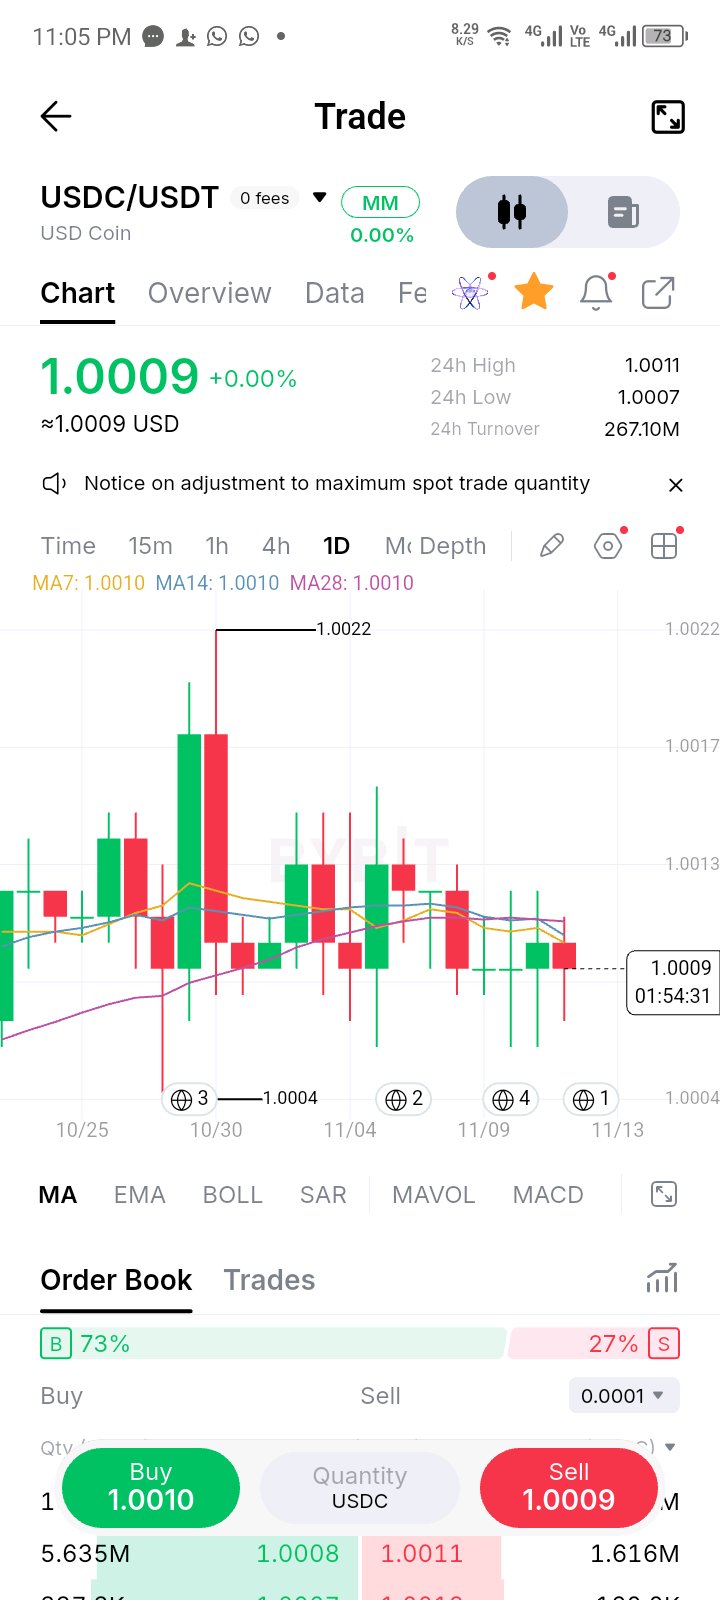
USDC HASN'T TRADED BELOW 1.0000 AGAINST USDT ONCE SINCE MID-OCTOBER. ONE DAY STANDS OUT On the daily,$USDC against USDT has lived between 1.0004 and 1.0022 for the whole window. Translation: USDT has been the slightly cheaper dollar every single day, by roughly 0.04% to 0.22%. Today it's 1.0009 and every MA is flat at 1.0010, so there's nothing happening. The exception is 10/30, a wick all the way up to 1.0022, the widest premium of the month. It's the same day USDe dipped to 0.9989 against USDT. I can't tell you why from a chart, but when two dollar pairs flinch on the same day, it's rarely a glitch in just one of them. This is a spread, not a trade, so I'm not looking for entries. What I'd watch is the daily close: anything outside roughly 1.0000-1.0025 would be new information about one of the two coins. Inside that band, it's noise. Which of the two dollar pairs would you trust to flinch first? $USDCUSDT$XAUTUSDT #ByXIMPACT
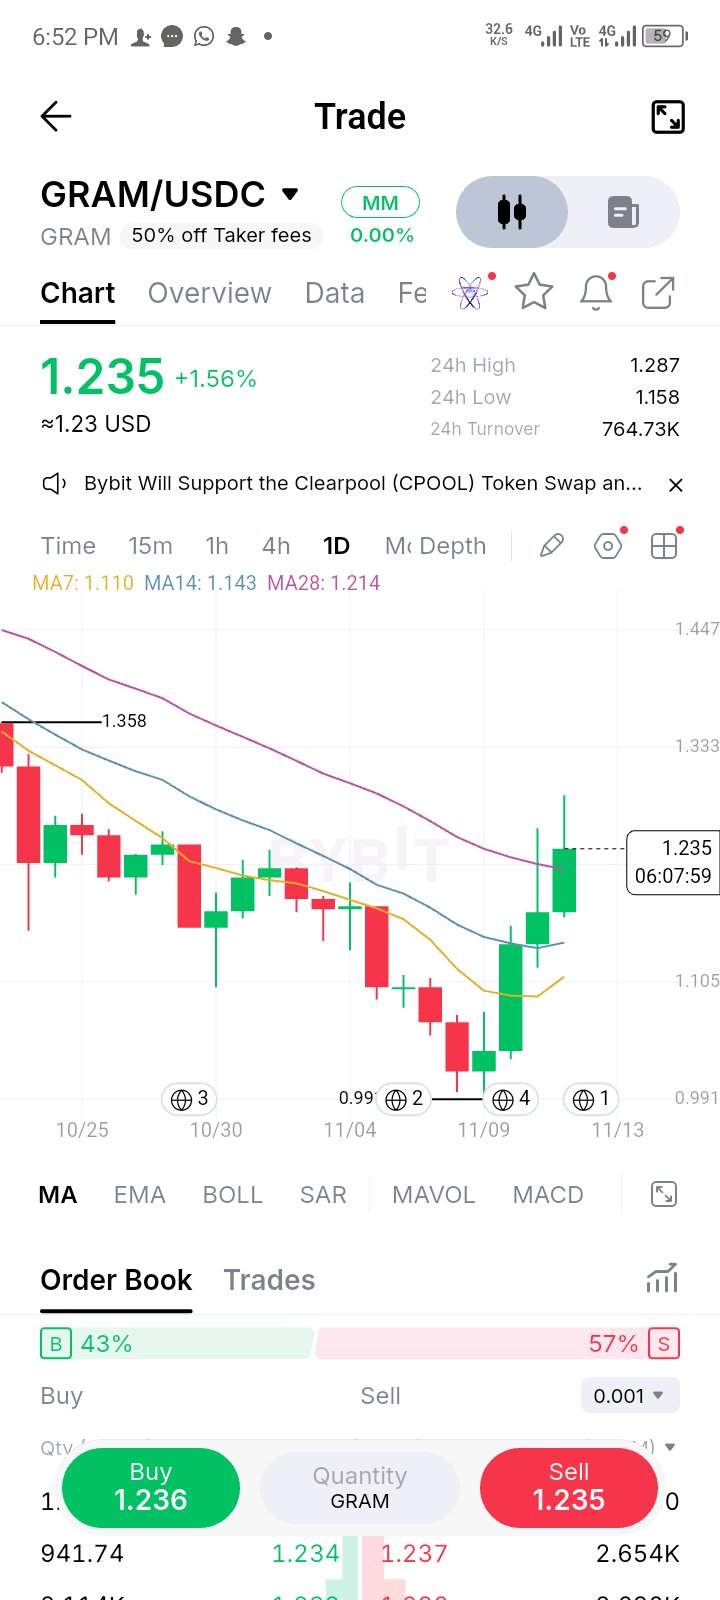
GRAM IS UP 20% IN FOUR DAYS AND SITTING ON THE 28 MA. THE 1.287 WICK SAYS SELLERS ARE STILL ACTIVE $GRAM has strung together four green dailies, from about 1.03 to 1.235, reclaimed the 7 and 14 MAs and is now just above the 28 MA at 1.214. The 7 MA has turned up, and the 14 at 1.143 is the next thing underneath. But the candles tell two stories. Yesterday and today both carry long upper wicks, today's reaching 1.287, so buyers are paying up while sellers keep absorbing near the top. And the zone it's pushing through, roughly 1.17-1.22, is where price spent the days before the breakdown, which means trapped sellers from that range have a break-even exit right here. How I'd read the next move: a daily close above 1.287 clears today's wick and puts the 1.358 high in view. If the wicks keep winning, the 14 MA at 1.143 is where I'd want to see buyers hold, with the 7 MA at 1.110 as the last line before the whole bounce is in question. This is the thinner USDC book, so a wick like 1.287 prints bigger than it would on USDT. Does a long upper wick on a +5% day worry you, or is it just a market digesting? $GRAMUSDT$KORUSDT #ByXIMPACT
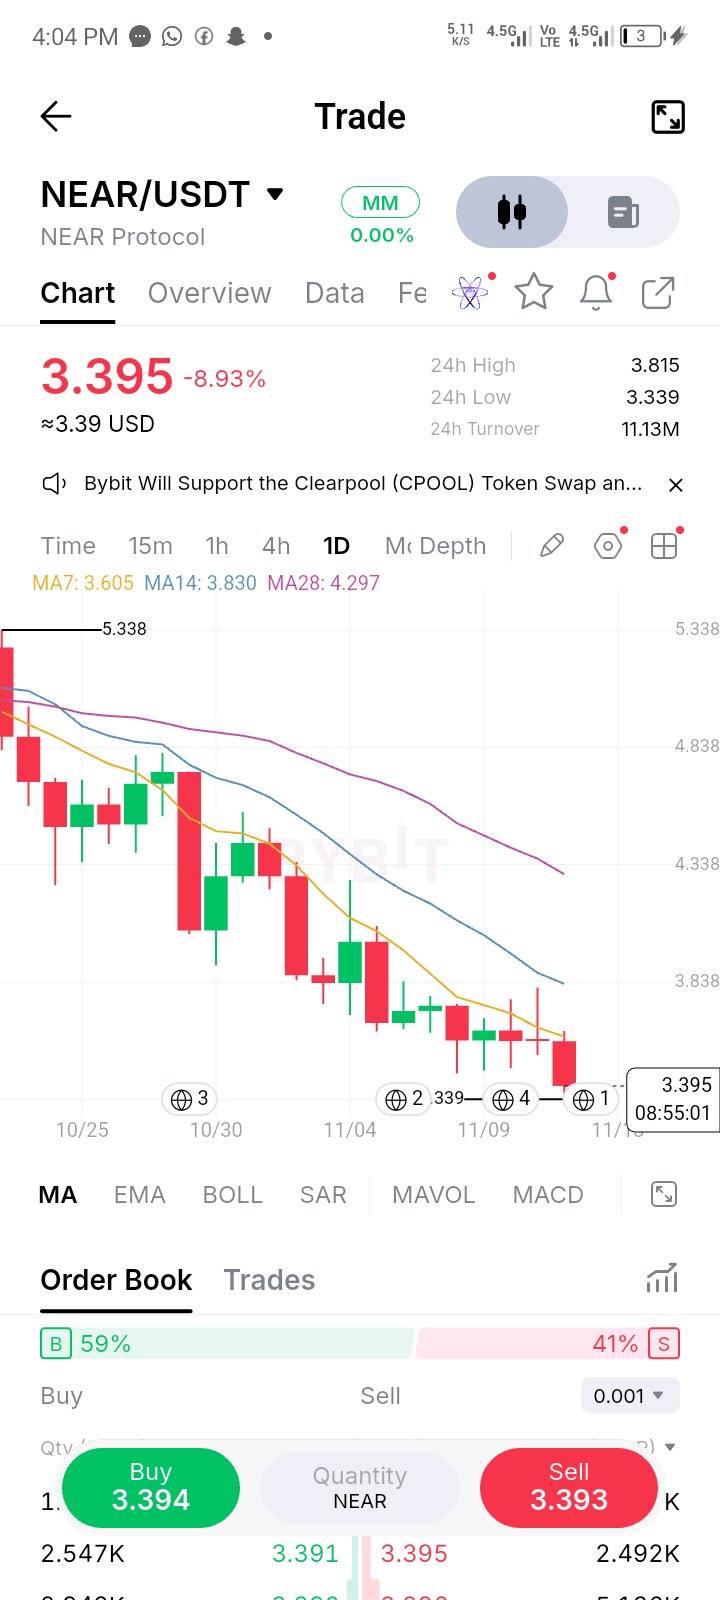
NEAR JUST BROKE THE FLOOR OF A FOUR-DAY COIL. YESTERDAY'S UPPER WICK WAS THE WARNING $NEAR spent four sessions chopping in a tight 3.58-3.80 range, small bodies under falling MAs, and today it gave way. The red candle is about 5%, with price at 3.395, close to the day's low of 3.339, which is also a new low for this chart. The tell was yesterday. That candle pushed up to about 3.80, just under the 14 MA at 3.83, then slid back to where it opened, leaving a long upper wick. A failed push into the average is a common way coils like this resolve. Now the coil's floor around 3.57-3.62, where the 7 MA at 3.605 also sits, flips from support to resistance. The damage so far is about 36% from the 5.34 high, with price 6% under the 7 MA, 11% under the 14 and 21% under the 28. That's stretched, but nothing on this chart says it's finished. A hammer or a green daily with real volume would start to say so. A bounce into 3.57-3.60 that fails would say the opposite. Below, 3.339 is the level to watch. Lose it on a daily close and there's no reference left under it. Today's candle still has about nine hours left. Is it too early to start looking for a bounce here? $NEARUSDT$BTCUSDT #ByXIMPACT
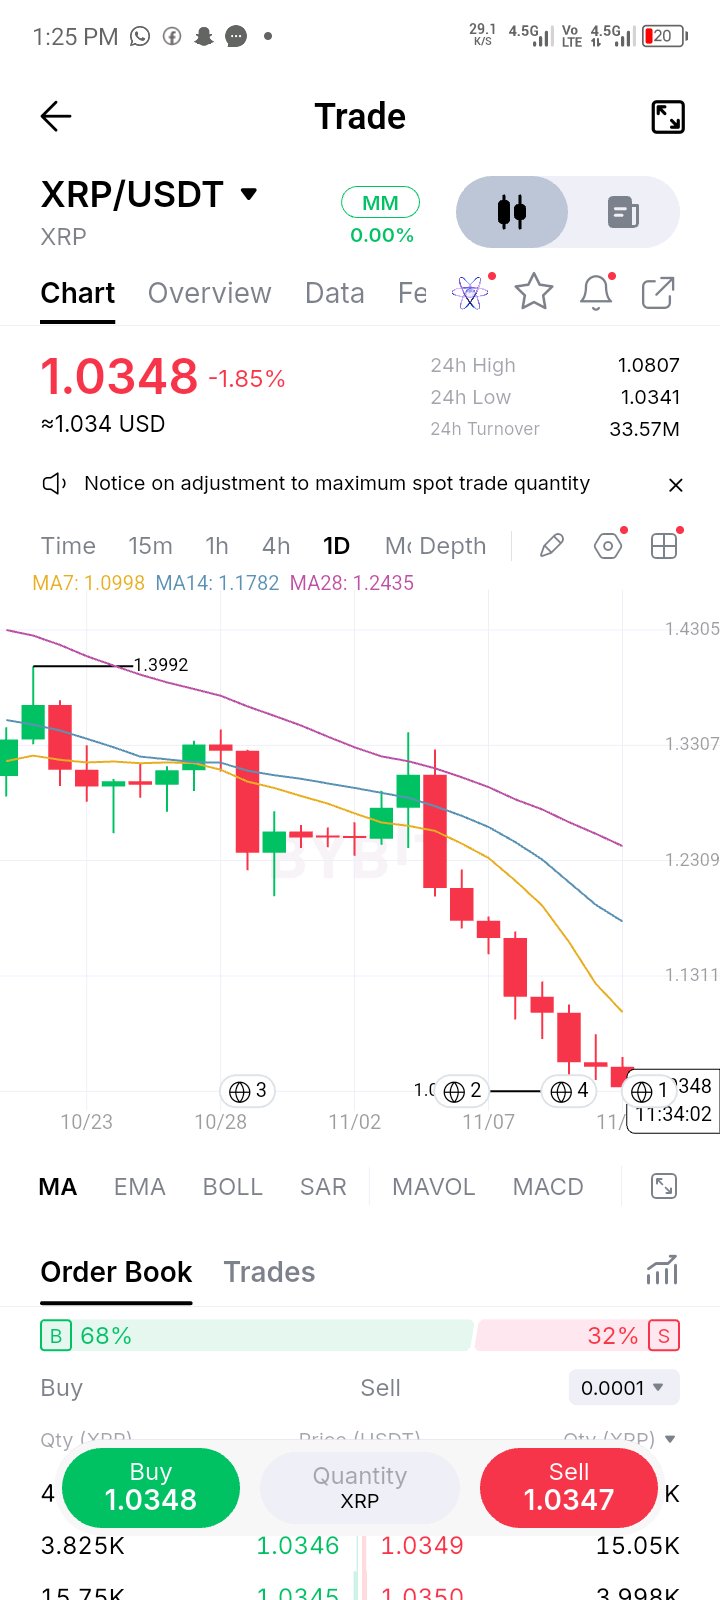
XRP IS 26% OFF THE HIGH WITH EIGHT RED DAILIES IN A ROW. OVERSOLD ISN'T A BUY SIGNAL $XRP lost its recent floor at 1.0765 on a daily close and is now at 1.0348, pressed against a fresh low for this chart. Every daily since 11/05 has been red, today's candle is still in progress, and price sits about 6% under the 7 MA, 12% under the 14 and 17% under the 28. That's stretched, but stretched isn't the same as turning. In a one-way market the MAs act as ceilings, not targets. A real reversal looks like a different kind of candle: a green daily close, ideally with a long lower wick and volume behind it, not just distance from the average. Levels: the old floor has become a ceiling at 1.0765-1.08, and yesterday's bounce stalled right there. Above it, the 7 MA at 1.10. Below, the round 1.00 is the obvious magnet and the first place I'd expect a real reaction, with nothing else to reference on this chart. I'm not trying to guess the bottom. I'd rather see price close back above 1.08 and let that prove it. Do you wait for a green daily close, or for 1.08 to flip? $XRPUSDT$HYPEUSDT #ByXIMPACT