RISK AND RICHES
24529Me gusta18Compartir en el chat405Aficionados264Seguir
Without risk a man is nothing
Without risk a man is nothing
En el momento en que abrí Bybit y vi a SPCXX subiendo de nuevo hacia los $140, mi primer instinto fue emocionarme. Después de ver cómo este gráfico caía desde la región de los $147.56 hacia los $133.51, ver a los compradores regresar se sintió como un posible punto de inflexión. Pero la experiencia me ha enseñado a separar la emoción de la evidencia. Esto es lo que llamó mi atención: $SPCXXUSDT se está cotizando en $139.35, con un alza del 2.85%. En el gráfico de 1H, el precio ha recuperado las tres medias móviles: MA7 en $139.31, MA14 en $138.98 y MA28 en $137.74. El MACD también es positivo, lo que sugiere una mejora en el impulso a corto plazo. Sin embargo, todavía no llamaría a esto una reversión de tendencia confirmada. La resistencia de $140.53 es la prueba inmediata. Una ruptura convincente con mayor volumen podría abrir la puerta hacia niveles más altos. Un rechazo podría enviar el precio de vuelta hacia los $138 o incluso los $137. ¿Mi enfoque? Observar la confirmación, gestionar el riesgo y evitar perseguir velas verdes. He sobrevivido a suficientes ciclos para saber que una recuperación no es lo mismo que una reversión. #ByXIMPACT $DOGEUSDT


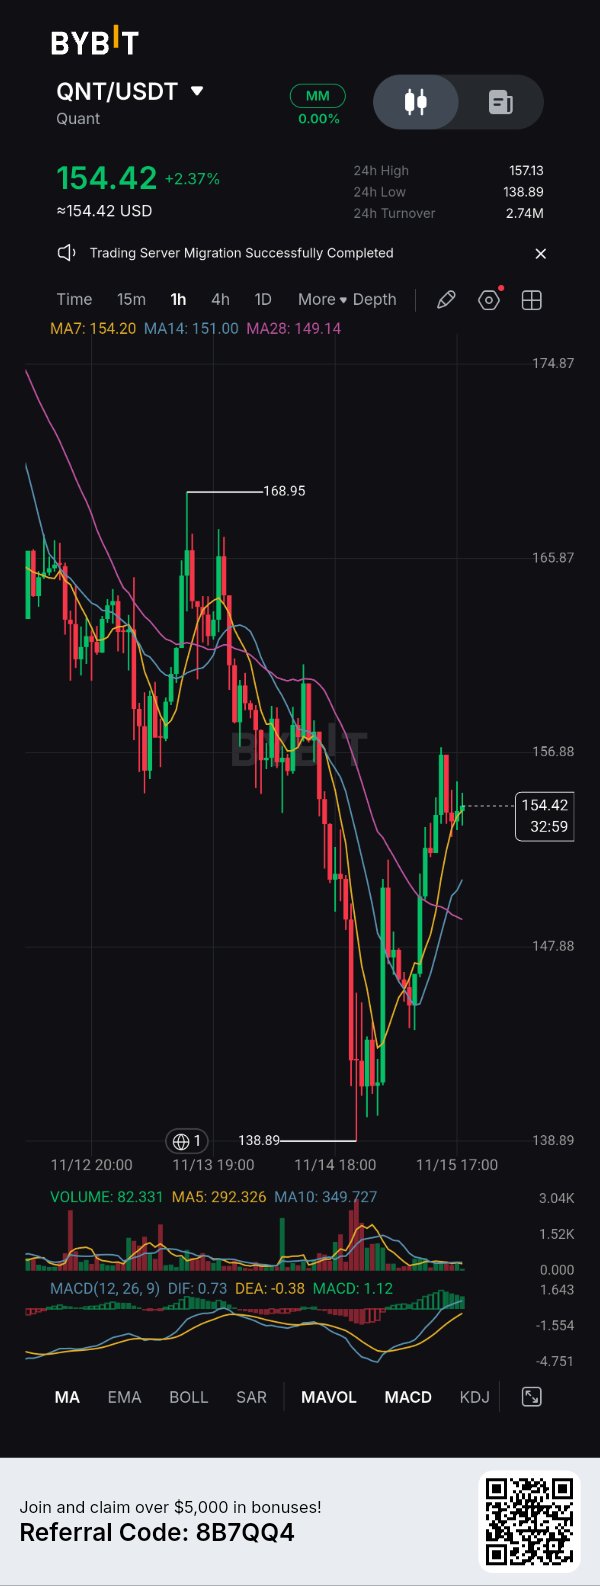
$QNTUSDT caught my attention after its sharp drop to $138.89. The rebound to $154.42 is significant, but I'm more interested in whether buyers can sustain the move. Here's what I'm watching: 1. TREND: Price has climbed above MA7 ($154.20), MA14 ($151.00), and MA28 ($149.14). Short-term momentum is improving. 2. RESISTANCE: The $156.88 area is the immediate obstacle. Breaking it convincingly could attract fresh buyers. 3. MOMENTUM: MACD is positive at 1.12, but volume has declined considerably. That's something I won't ignore. 4. RISK: Losing the $149–$151 support zone would make me question the recovery. My approach is simple: I won't chase QNT at $154.42. I'll wait for either a confirmed breakout above $156.88 or a controlled pullback that holds support. A recovery deserves attention, not blind trust. Trade the confirmation, not the excitement. #ByXIMPACT #WSOT2026 #WSOTShowYourAITradeToEarn10USDT
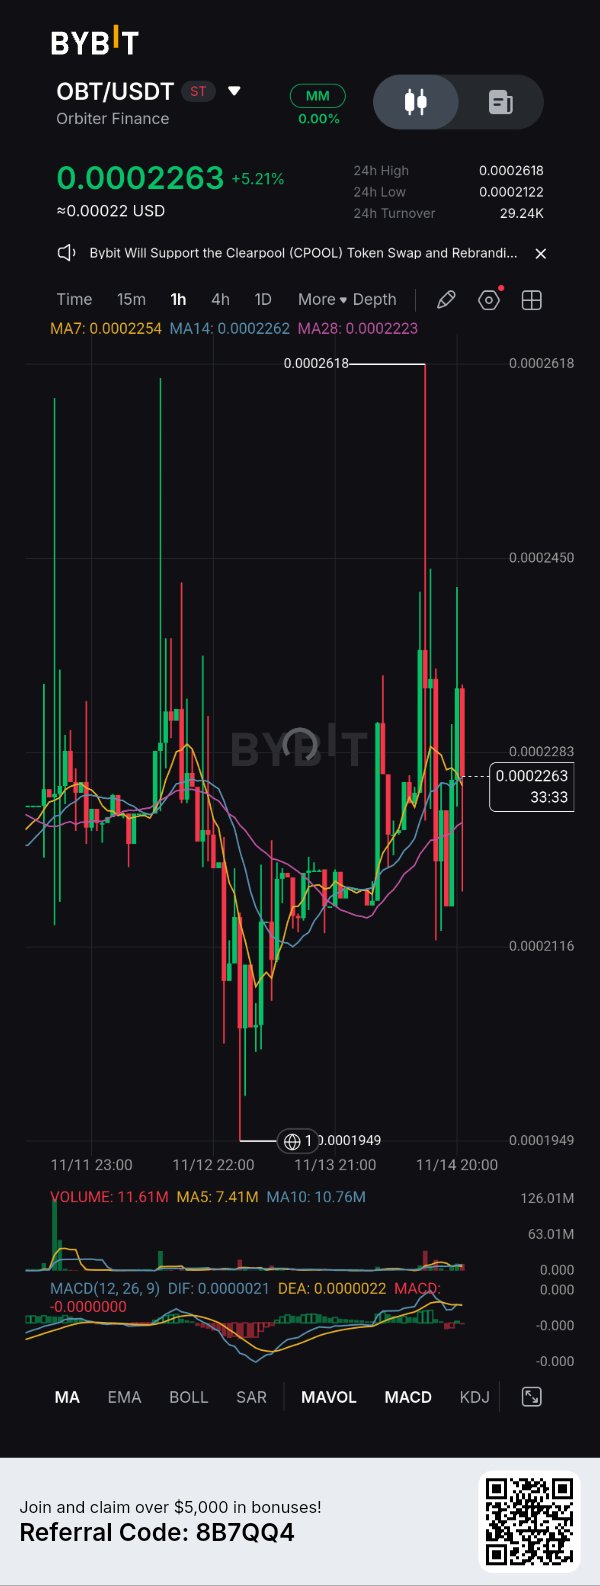
I learned one of crypto's most expensive lessons during the 2022 market crash: being right about a token means nothing if your risk management is wrong. Watching profits disappear and positions sink taught me something I never forgot. Never let conviction become an excuse to ignore the chart. That's exactly how I'm approaching $OBTUSDT today. At $0.0002263, OBT is showing signs of recovery, but I'm not confusing a 5.21% bounce with a confirmed breakout. Here's what I'm watching on the 1H chart: - Immediate support: $0.0002223–$0.0002254. - Critical downside level: $0.0002122. - Major resistance: $0.0002283, followed by $0.0002450. - Key invalidation zone: $0.0001949. My strategy is simple: wait for confirmation, size positions responsibly, and define my exit before entering. If buyers reclaim resistance with convincing volume, I'll consider the bullish continuation. If support fails, I won't fight the market. I've learned that protecting capital is also a trading victory. The market will humble you, but good risk management keeps you in the game. #ByXIMPACT #WSOT2026
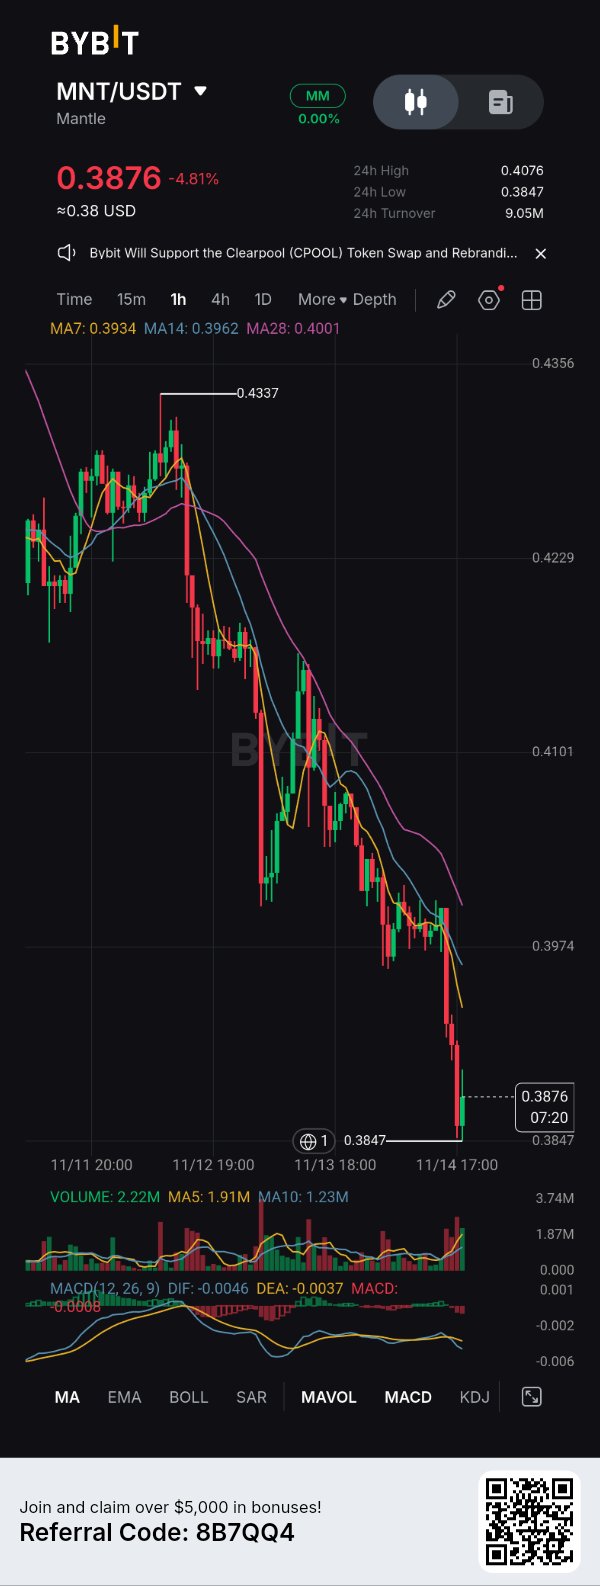
Everyone is either a maxi or a hater when it comes to $MNTUSDT . Both are wrong. I don't think Mantle deserves blind confidence, but I also don't think one ugly price movement tells the entire story. Here's where I stand. The bulls have a point: MNT is showing signs of buying interest around $0.3847, with volume reaching 2.22M. That suggests traders are still reacting to this support zone. But the bears aren't imagining things either. MNT currently trades at $0.3876, down 4.81%. More importantly, price sits below all three moving averages: MA7 ($0.3934), MA14 ($0.3962), and MA28 ($0.4001). MACD remains negative, confirming bearish momentum. My thesis? The short-term trend is bearish, but $0.3847 is the level I'm watching. A breakdown could invite further downside. A sustained recovery above $0.4001 would make me reconsider. I'm watching confirmation, not narratives. #ByXIMPACT$MNTUSDC
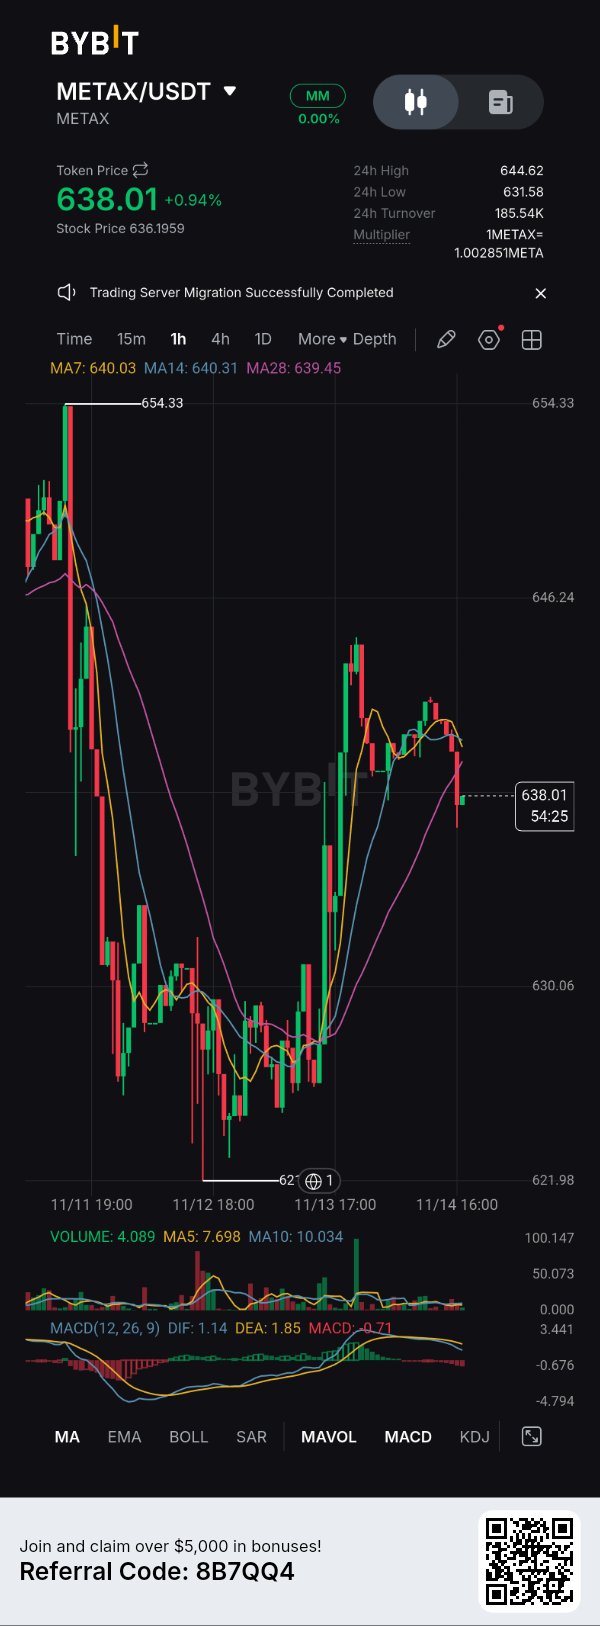
$METAXUSDT When I first looked at METAX, my thesis was that the recovery from its lower consolidation zone could develop into a stronger bullish move. That part played out. What I underestimated was how aggressively sellers would defend higher prices. The 1H chart now gives us an interesting picture. METAX recovered from approximately $621.98, rallied toward $654.33, and is currently trading around $638.01. That's a meaningful recovery, but the recent rejection shows buyers haven't fully secured control. I'm seeing another important detail: the 7, 14 and 28-period moving averages are clustered around $639–$640, while MACD has turned negative, suggesting short-term momentum is cooling. There's some satisfaction in seeing the recovery thesis materialize, but also humility in recognizing that timing and resistance matter just as much as direction. My current approach: I'm not adding at $638. I'm waiting for a convincing reclaim of $644.62 before considering additional exposure. A break below $631.58 would make me reassess the bullish setup. The market rewards updated thinking, not stubborn predictions. #ByXIMPACT #WSOT2026 $NVDAXUSDT
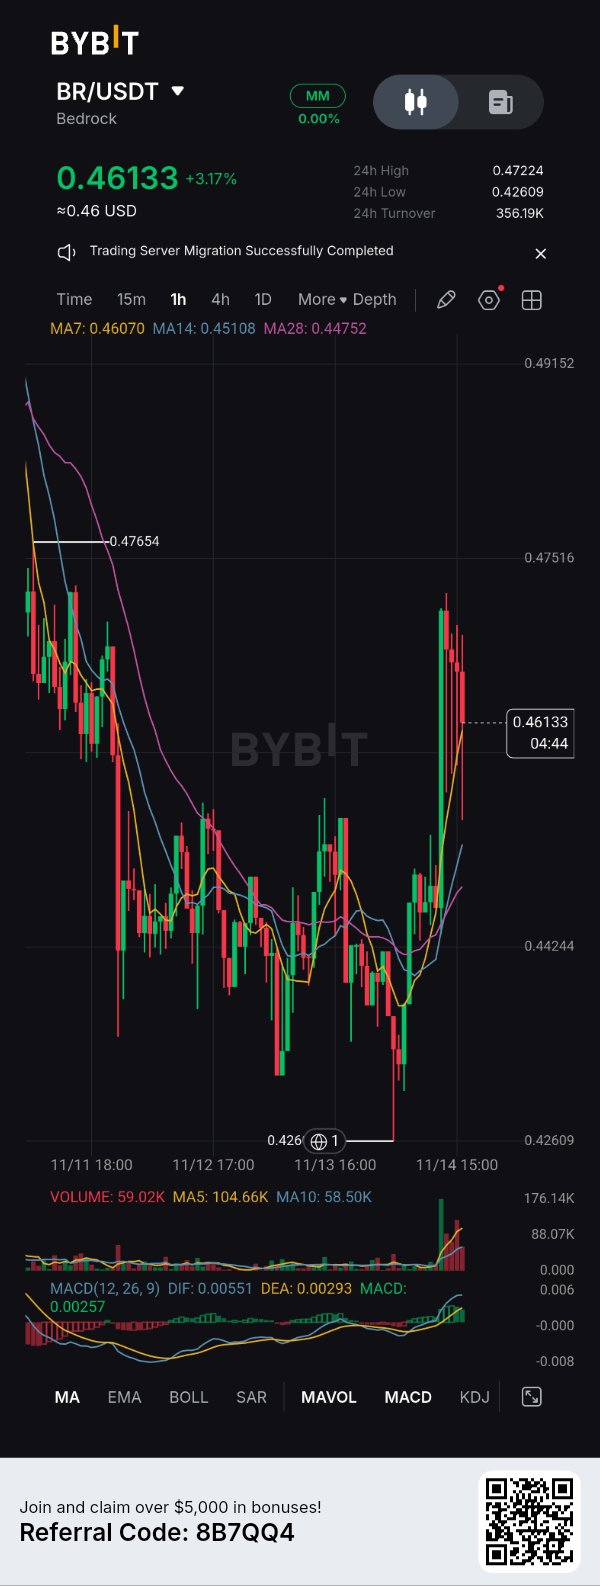
BR/USDT: I Had This One Completely Wrong.
I used to dismiss $BRUSDT as another hype-driven token. Whenever I saw it gaining attention, my first instinct was to look for reasons to short it. I thought the excitement would eventually fade. Then the chart forced me to reconsider. On the 1H timeframe, BR broke out of its prolonged consolidation around $0.4424 and surged to $0.47224. What caught my attention wasn't just the price movement; it was the sudden expansion in trading volume accompanying the breakout. MACD also turned bullish, with DIF crossing above DEA. Honestly, watching that initial move without a position was frustrating. I had spent too much time defending my original opinion instead of responding to what the market was actually showing me. My bias has changed. I'm now watching for a potential continuation toward $0.4765, provided buyers defend the breakout structure. My bullish thesis becomes invalid if BR loses $0.4424 on a confirmed 1H closing basis. I've learned something important: the market doesn't reward stubborn opinions. It rewards traders who know when to update them. Sometimes the biggest trading mistake isn't entering late. It's refusing to admit you were wrong. #IMPACTbyTrade #WSOT2026 #WSOTShowYourAITradeToEarn10USDT $BERAUSDT

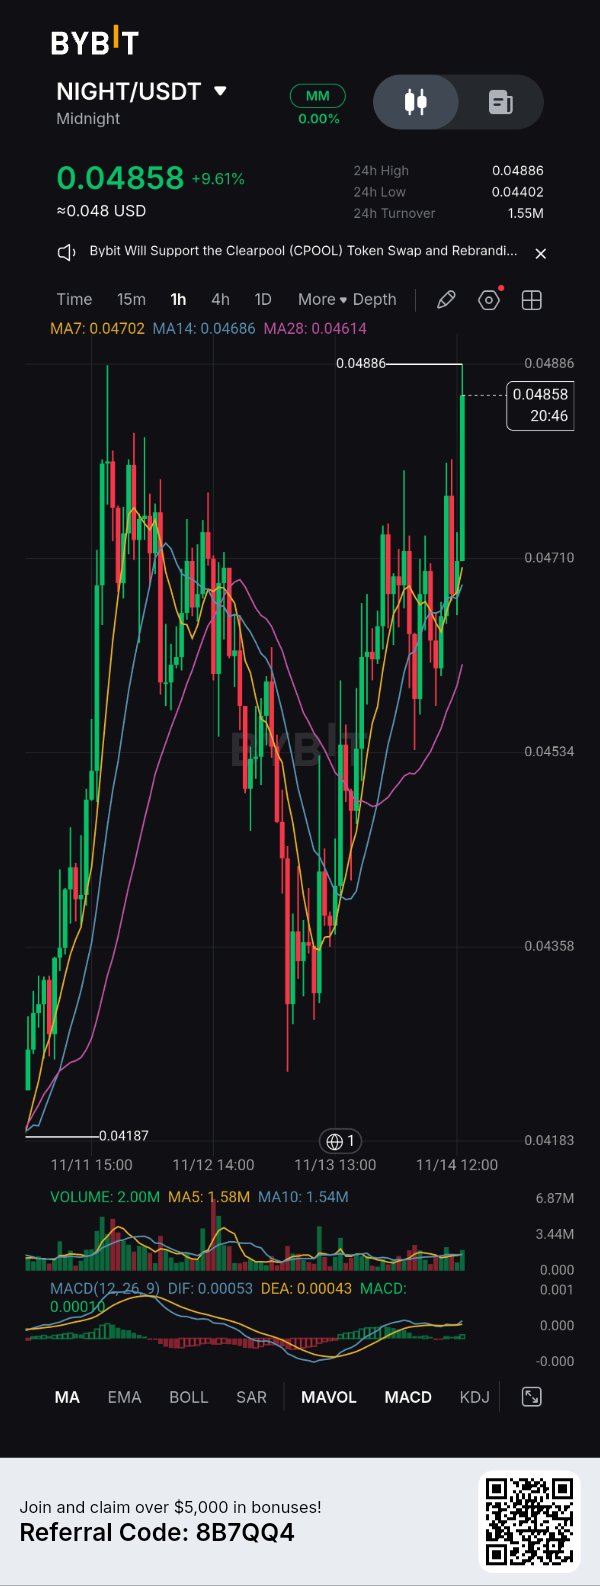
$NIGHTUSDT - I don’t shill often, but I’ve been quietly using Clearpool, and their rebrand to NIGHT on Bybit just hit my radar. If I could explain this token swap to my 2021 beginner self, I’d say it’s like your favorite restaurant changing its name but keeping the exact same chefs. Past me would have panic-sold the news and made the mistake of thinking a ticker change meant starting from zero. Honestly, I’m feeling a bit of frustration for missing the 0.04187 bottom, but pure excitement watching this breakout. My base case for the next few days is a test of new local highs. The 15m chart shows NIGHT up +9.61% at 0.04858, smashing through the 0.04886 resistance with volume confirming the move (2.00M vs the 1.58M MA5). My honest caveat? Token migrations can cause temporary liquidity confusion. My thesis is invalidated if we lose the MA7 support at 0.04702. Takeaway: Don't let past migration anxiety blind you to strong momentum. (NFA, always DYOR!) #ByXIMPACT
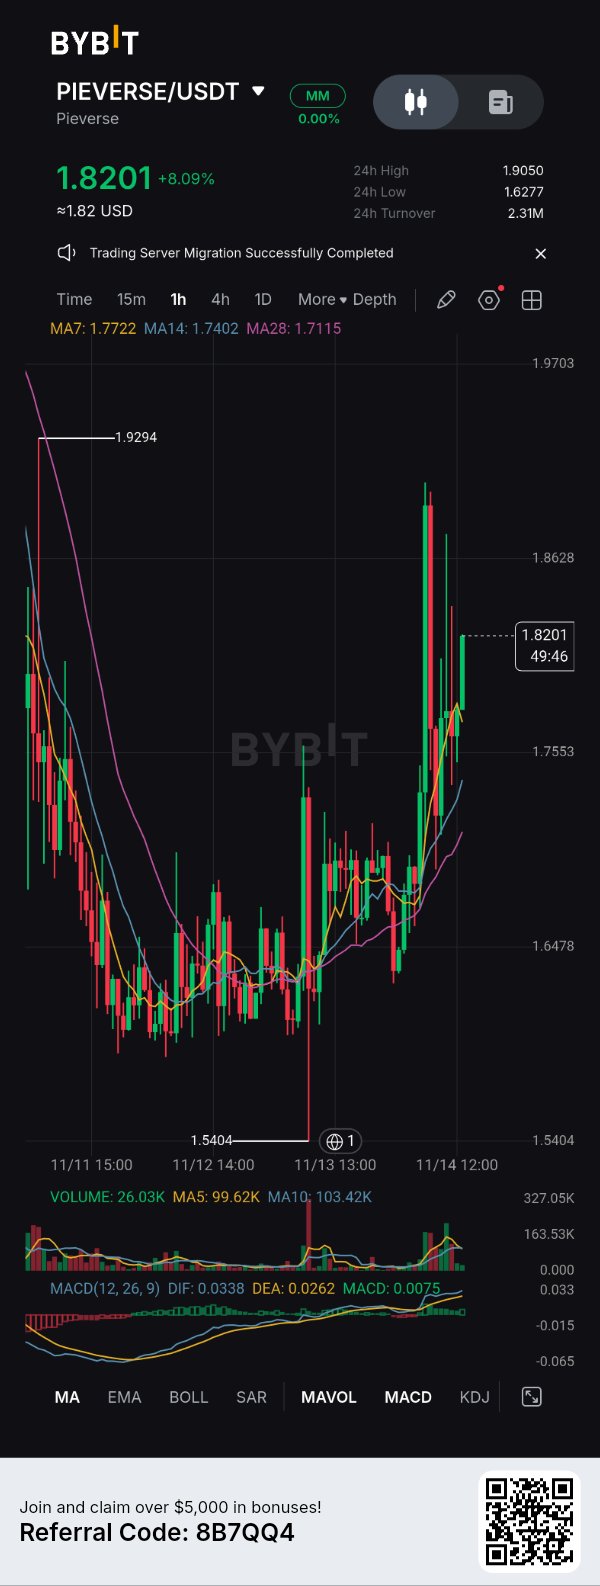
$PIEVERSEUSDT -I didn't get into crypto just to chase green candles or celebrate every time a token pumps. I'm here because I believe in financial opportunity, understanding emerging technology, and learning how markets actually work. But I have three values I refuse to compromise: 1. Discipline Over Emotions. I won't let FOMO push me into trades. A missed opportunity is better than a poorly planned entry. 2. Knowledge Over Hype. I want to understand what I'm buying, why the market is moving, where liquidity sits, and what could invalidate my thesis. 3. Patience Over Quick Profits. Not every candle deserves a position. Sometimes the smartest trade is waiting for confirmation. MY BIGGEST BOUNDARY? I refuse to gamble with money simply because everyone on social media is shouting that a token will go to the moon. No blind entries. No revenge trading. No pretending every prediction will be right. Why am I here? Because I want to build something meaningful through knowledge, consistency, and better financial decisions. I know the journey won't always be profitable, but every experience should make me a better market participant. PIEVERSE moving +8% is interesting, but one green candle doesn't define a good trader. My goal isn't to catch every pump. It's to develop the discipline to recognize quality opportunities and survive long enough to take advantage of them. I don't trade for excitement. I trade with a plan. The market doesn't owe me profits. I owe myself discipline. #CryptoTrading #TradingPsychology #Bybit #CryptoMindset #IMPACTbyTrade #WSOT2026 #WSOTShowYourAITradeToEarn10USDT
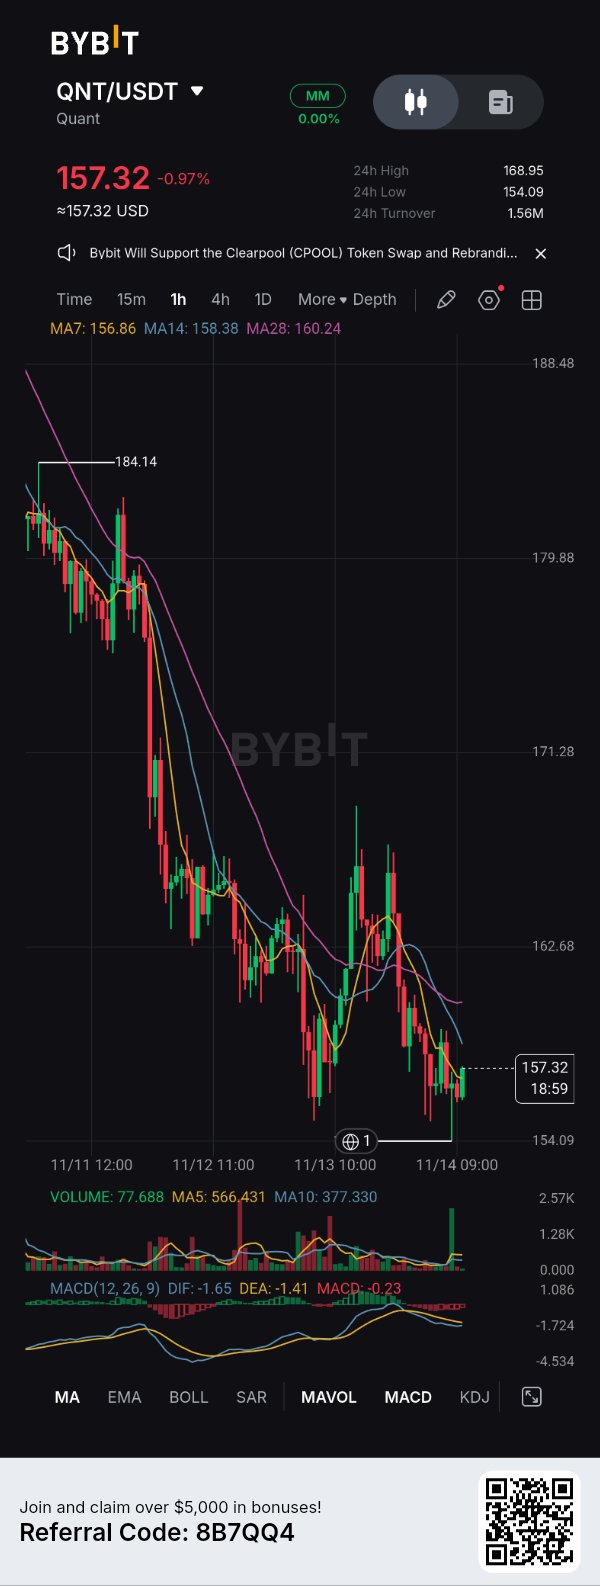
$QNTUSDT — A Conversation I Wish I Had With My Past Self. 🧠 Me in 2024: Why are you hesitating? QNT is already at $157.32. It has dropped significantly. This is obviously the perfect opportunity to buy the dip. The bounce is coming! Me now: That's exactly how I used to lose money. A falling price doesn't automatically mean a buying opportunity. Me in 2024: But look! It bounced from $154.09. Surely that's confirmation? Me now: Not yet. Look at the 1H chart. Price is still below MA14 ($158.38) and MA28 ($160.24). The broader structure remains bearish, and MACD is still negative. Me in 2024: So you're not buying? Me now: I'm watching. $154.09 is the immediate support I'm monitoring. If buyers defend it and price reclaims $158.38–$160.24 with convincing momentum, I'll reconsider a long position. If support breaks, I'll watch for further downside rather than trying to catch a falling knife. Me in 2024: You've become too cautious. Me now: No. I've become more disciplined. I no longer trade because I want the market to move in my direction. I trade when the market gives me evidence. THE ONE RULE I FOLLOW NOW: Never confuse a price drop with a trading opportunity. Let confirmation come before commitment. Sometimes the most profitable trade is the one you have the discipline not to take. #QNT #QNTUSDT #CryptoTrading #TradingPsychology #Bybit #ByXIMPACT

SUI— The Moment I Stopped Fighting the Trend. 📉
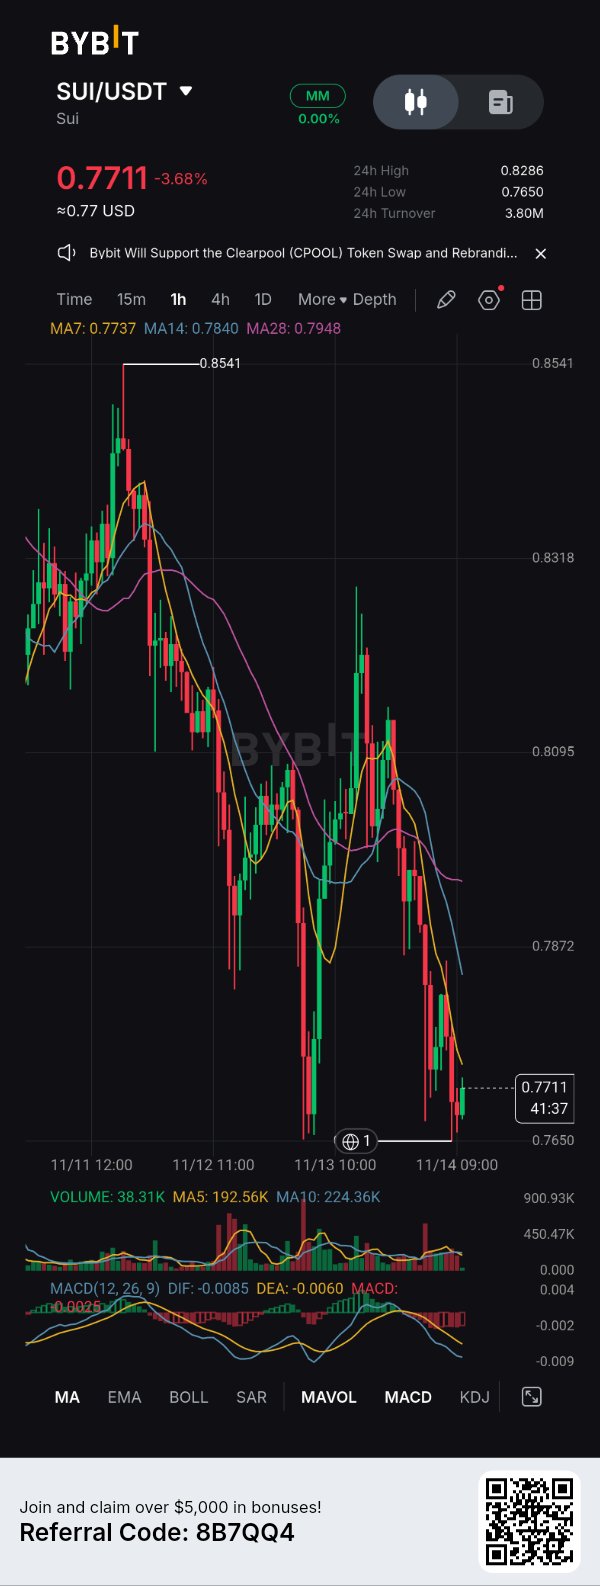
I used to believe that whenever a coin dropped significantly, the best opportunity was to buy the dip before everyone else noticed the reversal. $SUIUSDT recently reminded me why that thinking can be expensive. Looking at the 1H chart, I noticed something important. Price was trading around $0.7711, down 3.68%, after falling from the $0.85 region. But what caught my attention wasn't just the decline. It was the structure. The 7, 14 and 28 moving averages were all positioned above price, showing that sellers still had control. MACD was also sitting in negative territory. My turning point? Watching SUI approach the $0.7650 support area without seeing convincing evidence of a bullish reversal. I felt the temptation to anticipate a bounce, but I reminded myself that cheap doesn't automatically mean undervalued. Here's how I'm approaching SUI now: - Support: $0.7650 - Immediate resistance: $0.7737–$0.7840 - Stronger resistance: $0.7948 - Bullish confirmation: Reclaiming resistance with strong buying volume. - Bearish continuation: Losing $0.7650 convincingly. I've changed one thing about how I trade: I no longer enter simply because a price looks attractive. I wait for the market to give me a reason. My biggest lesson: Protecting capital is also a trading victory. Sometimes the smartest trade is the one you patiently wait for. What's your approach to SUI right now — buying the dip or waiting for confirmation? #ByXIMPACT #WSOT2026 #WSOTShowYourAITradeToEarn10USDT #JensenHuangExitTestsNvidiasAILeadership
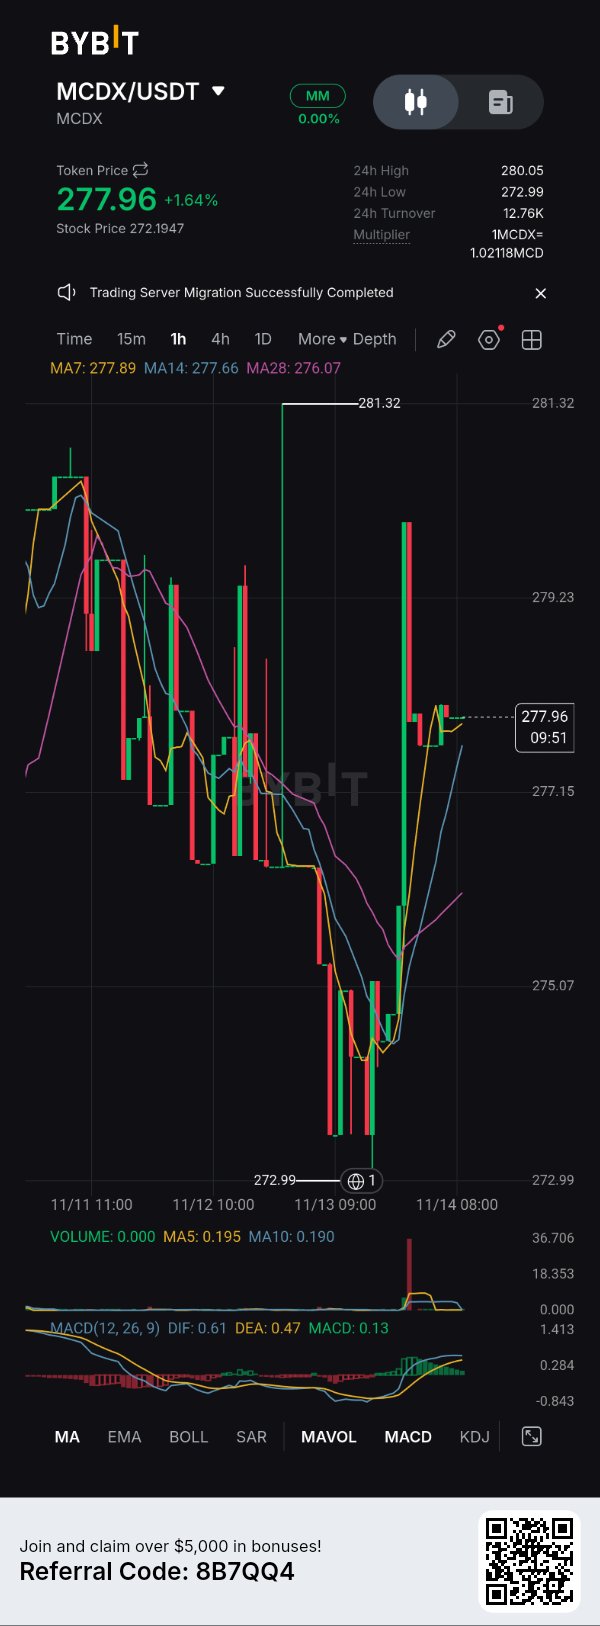
I used to believe that whenever a token printed a massive green candle after a heavy decline, it was confirmation that a bullish reversal had started. But watching $MCDXUSDT on the 1H chart reminded me why that assumption can be dangerous. Here's what I observed: 1. A sharp recovery isn't automatically a trend reversal. MCDX dropped towards $273 before recovering to $277.96. That's a strong bounce, but it doesn't automatically erase the previous selling pressure. 2. Volume needs context. A sudden volume spike can indicate aggressive buying, but traders still need to establish whether buyers can sustain that momentum. 3. Indicators need confirmation. The MACD has moved into positive territory, while the moving averages are beginning to recover. Encouraging signs, but not a guaranteed bullish continuation. The misconception: A big green candle tells you the market has reversed. The reality: It tells you that buying pressure has increased. Whether that pressure can sustain a new trend is a different question. My practical takeaway? I no longer chase a green candle simply because it looks impressive. I wait for confirmation, watch how price reacts around resistance, and pay attention to volume. Remember: A bounce is an opportunity to investigate, not an invitation to enter blindly. What's more dangerous in trading: missing a rally or entering a fake reversal? #ByXIMPACT $METAXUSDT #WSOT2026 #WSOTShowYourAITradeToEarn10USDT #JensenHuangExitTestsNvidiasAILeadership
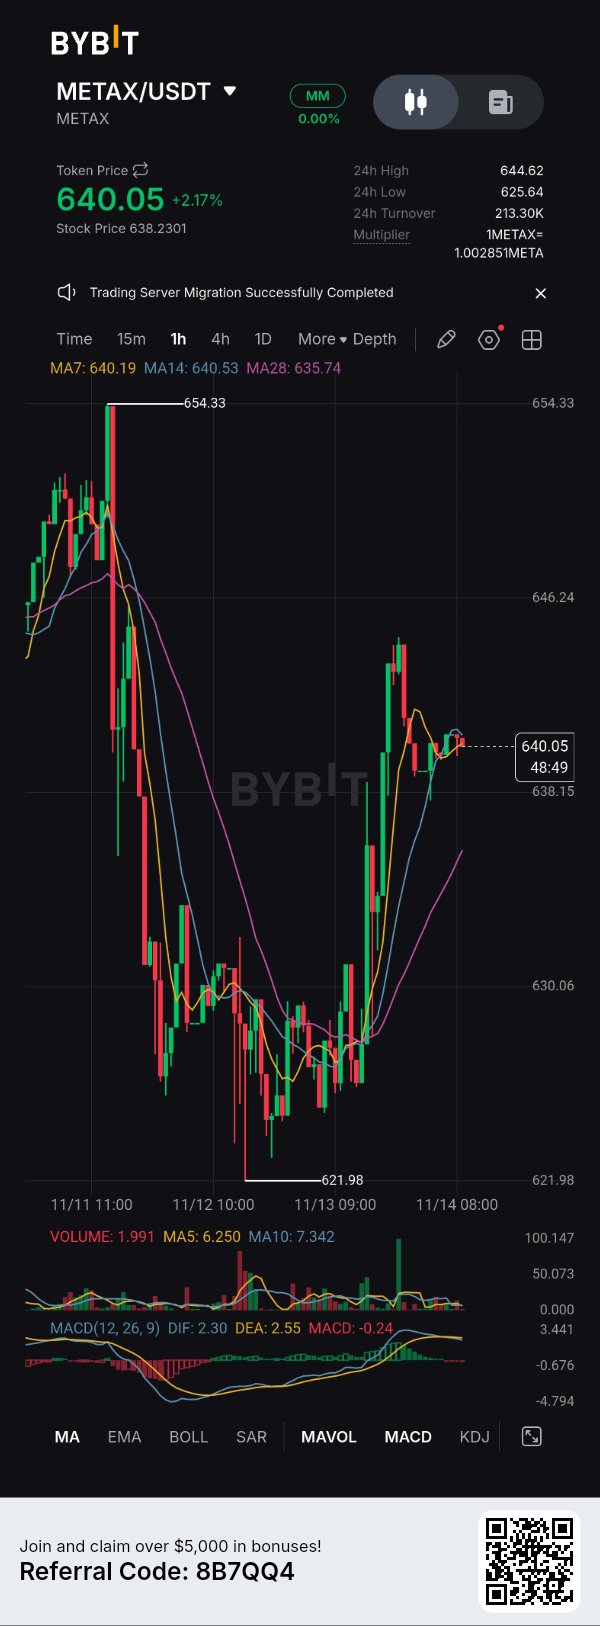
Everyone on Crypto is looking at this $METAXUSDT 15m chart and screaming the same thing: "The consensus is that the massive V-shaped bounce from 621.98 back to 640 proves the bulls are fully back in control. The dip was just a liquidity sweep, and we are heading back to 654!" I’m here to tell you that view is only half true. Yes, the bounce was aggressive. But my view is that this is a classic lower-high setup designed to trap retail longs before another leg down. We are looking at a textbook bull trap, not a trend reversal. Here are 3 reasons why I’m fading this rally: 1. The MA Pinch: Look at the moving averages. The MA7 (640.19), MA14 (640.53), and MA28 (635.74) are completely bunched up right at current price. This isn't bullish momentum; this is extreme indecision and heavy dynamic resistance. Price is struggling to break cleanly above the MA14. 2. MACD is Lethargic: Despite the massive price spike, the MACD (12, 26, 9) is completely flat. We have a bearish DIF (2.30) and DEA (2.55) with the histogram remaining in the red. The momentum is diverging negatively from the price action. 3. Market Structure: The local top was 654.33. The recent bottom was 621.98. The current bounce to 640 leaves us in the middle of a massive chop zone. The "V-shape" is just shorts taking profit; there is no real structural break of the downtrend yet. The Strongest Counterpoint: To play devil's advocate, the buying volume on the way up from 621 wasn't weak. The volume bars at the bottom show some aggressive green spikes, suggesting real spot buying interest defending the 620 level. If that volume continues to compound, it could overwhelm the moving averages. What would change my mind? I will flip fully bullish and eat my words if we get a confirmed 15m candle close above the 646.24 resistance zone, accompanied by a bullish MACD crossover and rising volume. Until then, I'm scalping shorts into these local pumps. Trade safe. Don't get chopped up in the middle. #IMPACTbyTrade

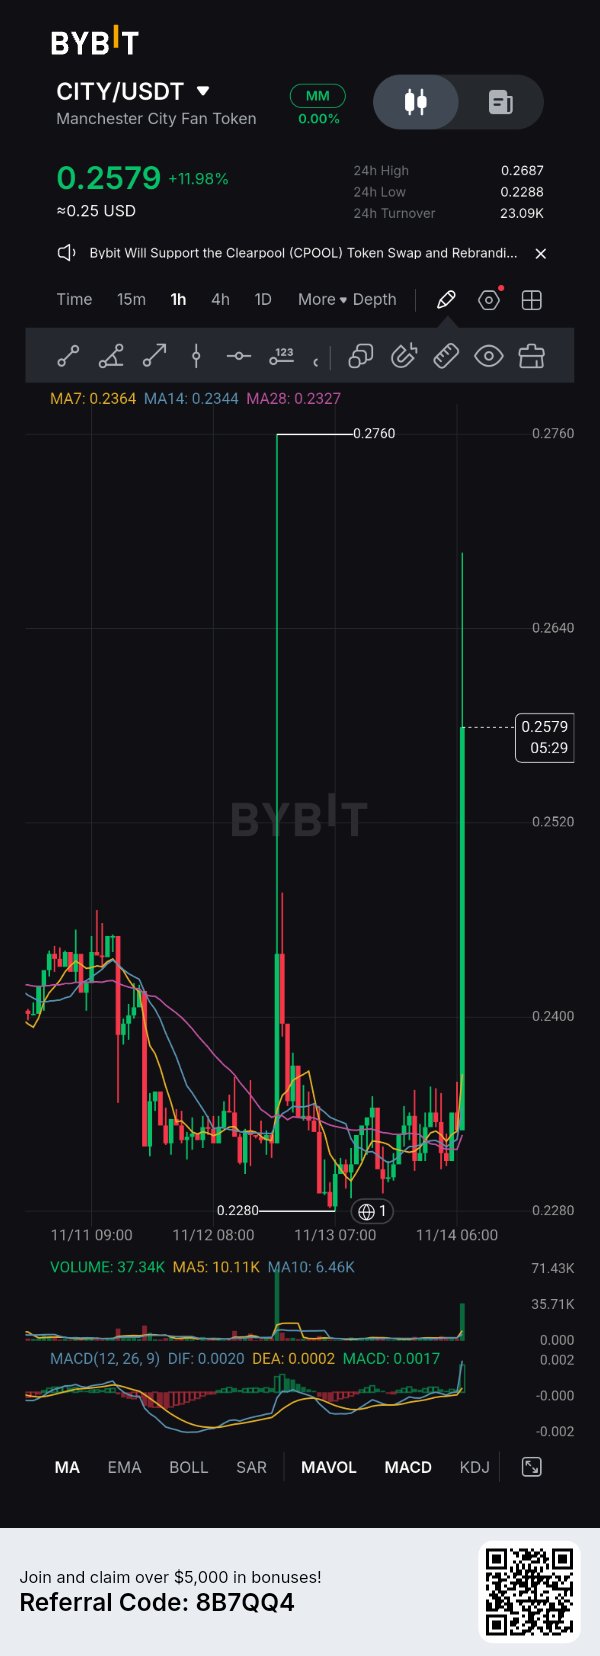
I've been paying closer attention to $CITYUSDT , and today's market activity gave me something interesting to work with. Here's what I'm seeing from the builder's perspective. 1. What I Shipped I completed another round of market observation around CITY/USDT, focusing on price behaviour, momentum, and trading activity. The numbers caught my attention: - Current price: $0.2579 - 24-hour gain: +11.98% - 24-hour high: $0.2687 - 24-hour low: $0.2288 That's a significant move after a period of relatively tight consolidation. 2. What Broke My biggest challenge was separating genuine momentum from short-lived excitement. CITY printed a massive bullish candle, but the upper wick approaching $0.2760 shows that buyers haven't had a completely smooth ride. A breakout is interesting. Sustaining it is the real challenge. 3. What I Learned One lesson stood out: volume matters. The displayed candle volume reached 37.34K, compared with a 5-period average of 10.11K. That's a substantial increase in activity. However, increased activity doesn't automatically guarantee continuation. I want to see whether buyers can defend the breakout rather than immediately surrendering the move. 4. What's Next? My next step is to monitor the $0.2520–$0.2400 region. If CITY holds above this area and builds acceptance, I'll be watching for another attempt towards $0.2687 and potentially $0.2760. If momentum fades, I'll reassess rather than force a bullish narrative. My biggest takeaway: Building conviction requires more than celebrating green candles. It means documenting what works, admitting what doesn't, and staying curious when the market challenges your assumptions. I'm still learning, still observing, and still building. The goal isn't to predict every move. It's to understand the market better with every move. What's your biggest concern with CITY right now: sustaining this breakout or overcoming the $0.2687 resistance? Market observations, not financial advice. #ByXIMPACT #WSOT2026 #WSOTShowYourAITradeToEarn10USDT #JensenHuangExitTestsNvidiasAILeadership #USPPITestsTheHigherForLongerTrade $GOOGLXUSDT
I Stopped Fighting the Downtrend. Here's Why. 📉
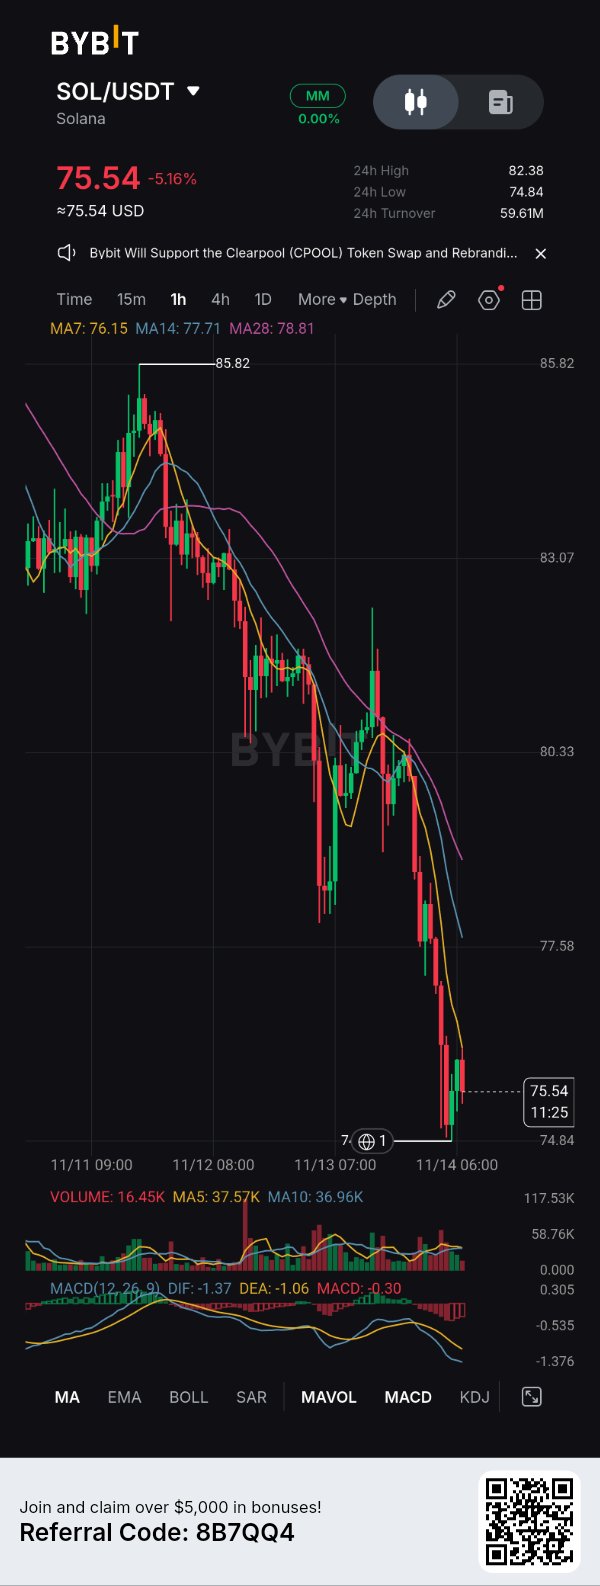
I was watching $SOLUSDT closely, and one thing became increasingly difficult to ignore: the sellers were controlling the market. My bearish thesis wasn't based on one red candle. It was built around the bigger picture. SOL was trading at $75.54, down 5.16%, after falling from the $85.82 region. The 1H structure continued printing lower highs and lower lows. 1. My Market Thesis Three things caught my attention: - Price was trading below MA7 ($76.15), MA14 ($77.71), and MA28 ($78.81). - MACD remained negative, confirming bearish momentum. - The $77.58 region had become an important resistance area after the breakdown. For me, there was no convincing reason to fight the sellers yet. 2. My Entry and Exit Logic My preferred approach was to wait for a relief bounce into resistance before considering a short position. - Potential entry zone: $76.15–$77.58. - First downside target: $74.84. - Extended target: Below $74.84, if selling pressure continued. - Invalidation: A convincing recovery above $78.81. These were planned levels, not confirmed executed fills. 3. How I Felt During the Setup Honestly, watching SOL drop this aggressively creates a temptation to chase the move. But I reminded myself that missing an entry is better than entering emotionally at the bottom of an extended move. 4. What I'd Repeat I'd repeat my patience, my focus on market structure, and my decision to wait for price to approach resistance instead of blindly chasing red candles. 5. The Risk I Underestimated A sudden relief rally. After such an aggressive decline, short sellers can become crowded. A sharp recovery could squeeze late sellers before the bearish trend resumes. My takeaway: The market doesn't reward impatience. Sometimes the best trading decision is waiting for price to come to your level rather than chasing where it has already been. What's more important to you when trading a breakdown: momentum confirmation or a retest of resistance? This is my personal trading journal, not financial advice. #ByXIMPACT $SOLUSDC

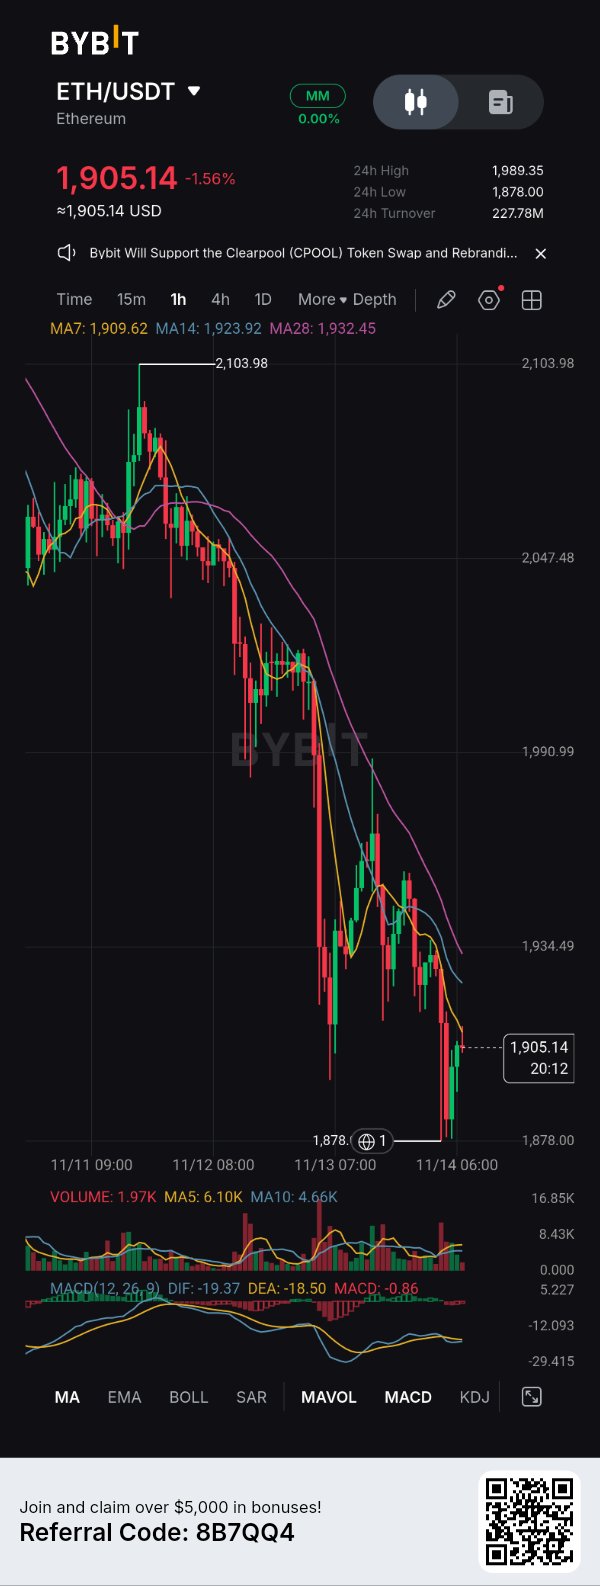
I initially thought $ETHUSDT had enough strength to defend the $1,930 region and attempt another recovery. I expected buyers to step in and turn the pullback into a continuation move. But the market had a different plan. Looking at the current ETH/USDT structure, a few things changed my mind: 1. The trend is still bearish: ETH is trading around $1,905, below MA7 ($1,909), MA14 ($1,923) and MA28 ($1,932). That's not the recovery structure I was expecting. 2. Sellers remain in control: The chart continues printing lower highs and lower lows. Previous recovery attempts have struggled to produce meaningful upside momentum. 3. $1,878 is the level I'm watching: This is the recent swing low. A decisive breakdown could expose ETH to another leg down. 4. MACD isn't convincing yet: Momentum remains negative, so I'm not rushing to call this a bullish reversal. I'll be watching two scenarios: - Bullish: ETH reclaims $1,923–$1,934 and establishes support above that zone. - Bearish: ETH loses $1,878, opening the possibility of further downside. Honestly, there's a certain frustration in watching a setup you believed in fail. But I'd rather admit I'm wrong than defend a bias the market has already invalidated. My biggest lesson: Never become emotionally attached to a direction. Let price action prove your analysis, and when the evidence changes, change your position. The market doesn't reward stubbornness. It rewards discipline. What's your current ETH bias: recovery or another breakdown? 👇 #ByXIMPACT
$BTCUSDT Loses $67,000, Over $1.3 Billion in Longs Liquidated, Yet Short-Term Holders Are Still "Holding the Line" According to Bybit market data, BTC is currently at 67,241.5 USDT, down 1.47% in 24 hours, with an intraday low of 66,448.6. Measured from the peak of 74,822.9, this pullback has already exceeded 11%. 📉 News Drivers: A Four-Fold Pressure Stack This decline is not driven by a single factor. Over the past 24 hours, roughly $1.3 billion** in crypto long positions were forcibly liquidated, triggering a cascade of selling. At the same time, institutional capital is retreating — BlackRock's IBIT saw over **$2 billion in net outflows across nine consecutive sessions through Wednesday, and on November 13 alone, IBIT bled $143.5 million** while Fidelity's FBTC saw **$41.9 million leave. On the macro front, hotter-than-expected CPI has reinforced expectations of another Fed rate hike, while Nvidia's post-CEO-resignation stock plunge has dampened risk appetite across tech and crypto alike. 📊 Technical Picture: Key Support Is Being Tested On the chart, BTC has broken below the multi-month 73,000–75,000 support zone and is now battling around 67,000. According to 21Shares strategist Matt Mena, a sustained drop below $69,000** opens the door to a test of **$65,000 support. To the upside, reclaiming $70,000** would be the first step toward recovery, but **$74,000 is the level needed for a sustained rebound. Momentum indicators show oversold conditions, but the MACD death cross remains in place, keeping selling pressure intact. 🔍 A Notable Detail Despite the sharp sell-off, the 1.48 million BTC held by short-term holders in the 73,000–86,000 range saw a net decrease of only 34,000 coins — roughly 2.3% — indicating most did not panic-sell. Absorption was concentrated mainly at $68,000, where about 42,200 BTC were added. If 65,000–66,000 holds, this stubbornly held supply could become the base for a subsequent bounce; conversely, a decisive break below 65,000 could force these "diamond hands" to capitulate, triggering another wave of cascading liquidations. ⚡ Key Levels to Watch Two things to watch next: whether ETF flows can turn positive again, and the battle for 65,000. Until institutional buying clearly returns, treat any bounce as a repair rally rather than a trend reversal. ⚠️ The above is personal market observation, not investment advice. Leverage cuts both ways — position management should always take priority over directional calls. #ByXIMPACT $BTCUSDC

$LTCUSDT is Recovering, BUT I'M NOT READY TO BUY THIS RECOVERY. HERE'S WHY. I've learned something important about trading: not every green candle deserves my money. LTC has recovered from the $47.71 region and is currently trading around $48.80. That's encouraging, but when I look at the 1H chart, I see a market that hasn't fully convinced me that buyers are back in control. And I'm not going to pretend otherwise. 🔍 WHAT I'M SEEING ON THE CHART LTC/USDT — 1H Current price: $48.80 24H change: +1.08% 24H high: $50.11 24H low: $47.87 My moving-average readings: - MA7: $49.03 - MA14: $49.27 - MA28: $49.12 Here's my concern: Price is trading below all three moving averages. That means the recovery is approaching a resistance cluster where sellers could become active again. I want buyers to reclaim this zone before I consider a serious bullish position. ⚠️ WHY I'M NOT CONVINCED YET My MACD readings are: - DIF: -0.15 - DEA: -0.08 - Histogram: -0.07 Momentum is still negative. Volume is also relatively quiet: - Current volume: 1.26K - MA5: 2.01K - MA10: 1.99K For me, this is not enough evidence to chase the recovery. I want stronger participation, not just another temporary bounce. 🎯 HERE'S HOW I'M PLANNING MY TRADE I'm watching two possible opportunities. 🔴 MY FIRST PLAN: SHORT THE REJECTION If LTC climbs toward $49.03–$49.27 and gets rejected, I'll consider a short position. $LTCUSDC Potential EP: $49.05–$49.25 SL: $49.75 TP1: $48.30 TP2: $47.87 I want to see an actual bearish reaction before entering. 🟢 MY SECOND PLAN: BUY THE CONFIRMED RECOVERY I'm not ruling out the bulls. If LTC reclaims $49.27 and successfully retests that level with stronger volume, I'll reconsider my bearish outlook. Potential EP: $49.30–$49.40 SL: $48.85 TP1: $49.72 TP2: $50.11 If neither setup confirms, I'm staying out. 🧠 WHAT WOULD MAKE ME CHANGE MY MIND? A strong 1H close above the moving-average cluster, followed by a successful retest, would make me more interested in buying. But if sellers defend that zone again, I'll respect the weakness. I don't need to predict every move. I just need to recognize a good opportunity when the market presents one. MY FINAL POSITION I'm cautiously bearish until LTC proves otherwise. The $49.03–$49.27 region is my decision zone. I would rather wait for confirmation than become another trader buying the top of a temporary recovery. 🔥 LET ME ASK YOU SOMETHING: If you were trading LTC right now, would you SHORT the moving-average rejection or BUY only after a confirmed reclaim of $49.27? #LTC #LTCUSDT #Litecoin #Bybit #CryptoTrading #TradingStrategy#ByXIMPACT #WSOT2026 #WSOTShowYourAITradeToEarn10USDT #JensenHuangExitTestsNvidiasAILeadership

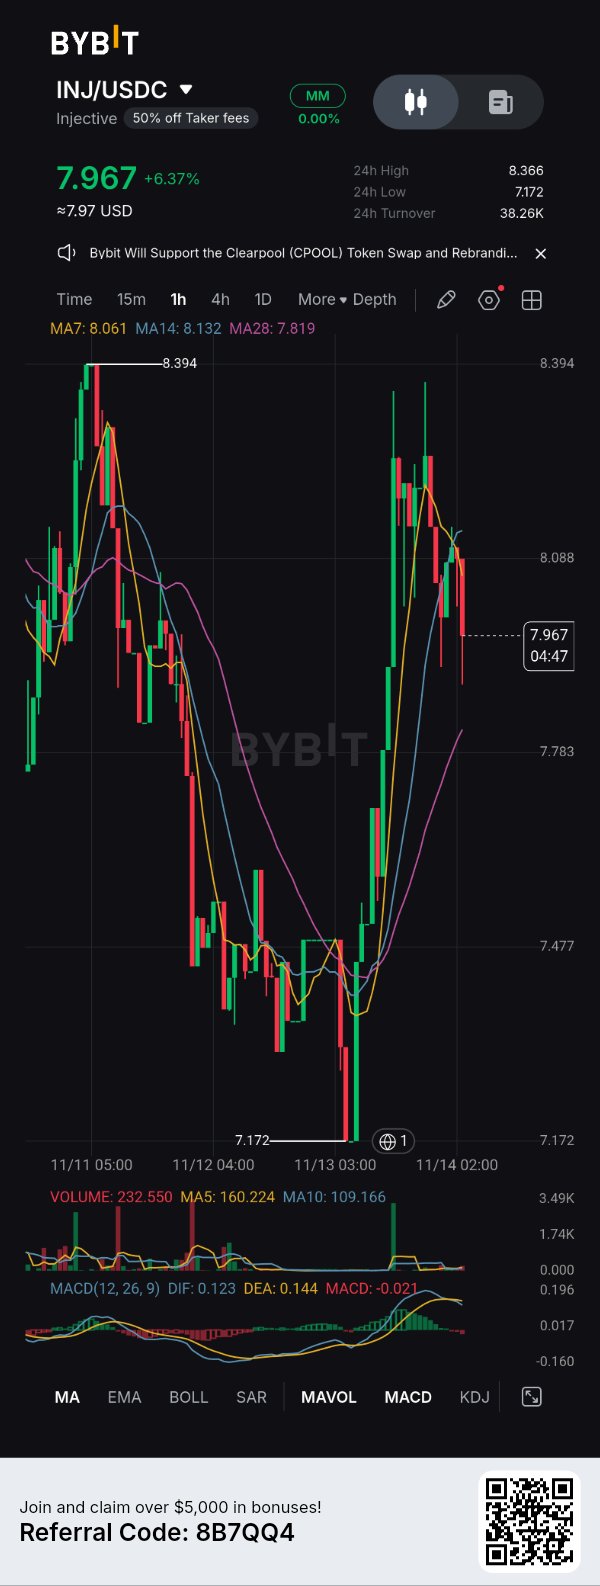
If you bought $INJUSDT at the absolute bottom at 7.172, congratulations. If you are looking at the chart right now and thinking about buying the green candles, you are the liquidity. INJ just printed a violent V-shaped recovery, ripping from 7.172 straight up to 8.10. But look closely at the 1H chart: the music just stopped. Here is why the immediate momentum is fading: 🔻 The Rejection: Price slammed into the 8.10–8.13 zone (the MA14) and was immediately rejected, forming a lower high relative to the 8.394 swing high. 🔻 MACD Rollover: The MACD line has crossed downward, and the histogram is printing red bars. The aggressive buying pressure is drying up. 🔻 MA Break: Price is currently trading below the 7 MA and 14 MA, drifting downward to test deeper support. This doesn't necessarily mean the bull run is dead. But it does mean the easy money on the long side has been made for this leg. Now, we wait for the market to show its hand. The Two Scenarios (Pick Your Side) 🟢 The Bullish Retest (The Higher Low): If this is a true trend reversal, buyers will step in at the 7.81–7.85 zone (the MA28). If we see a 1H bullish rejection candle there, it offers a fantastic risk-to-reward long entry for a push back to 8.10. 🔴 The Bearish Breakdown (The Dead Cat): If the 7.75 support crumbles, it means the V-bounce was just a liquidity grab to trap late longs. A breakdown here targets the previous consolidation zone down at 7.47. Bottom Line Do not FOMO into a 1H chart that is already losing momentum. Let the price come to a structural level. Wait for the MA28 retest or the breakdown to confirm your entry. Are you buying this dip for a higher low, or waiting for a breakdown below 7.75 to short it? 👇. #ByXIMPACT
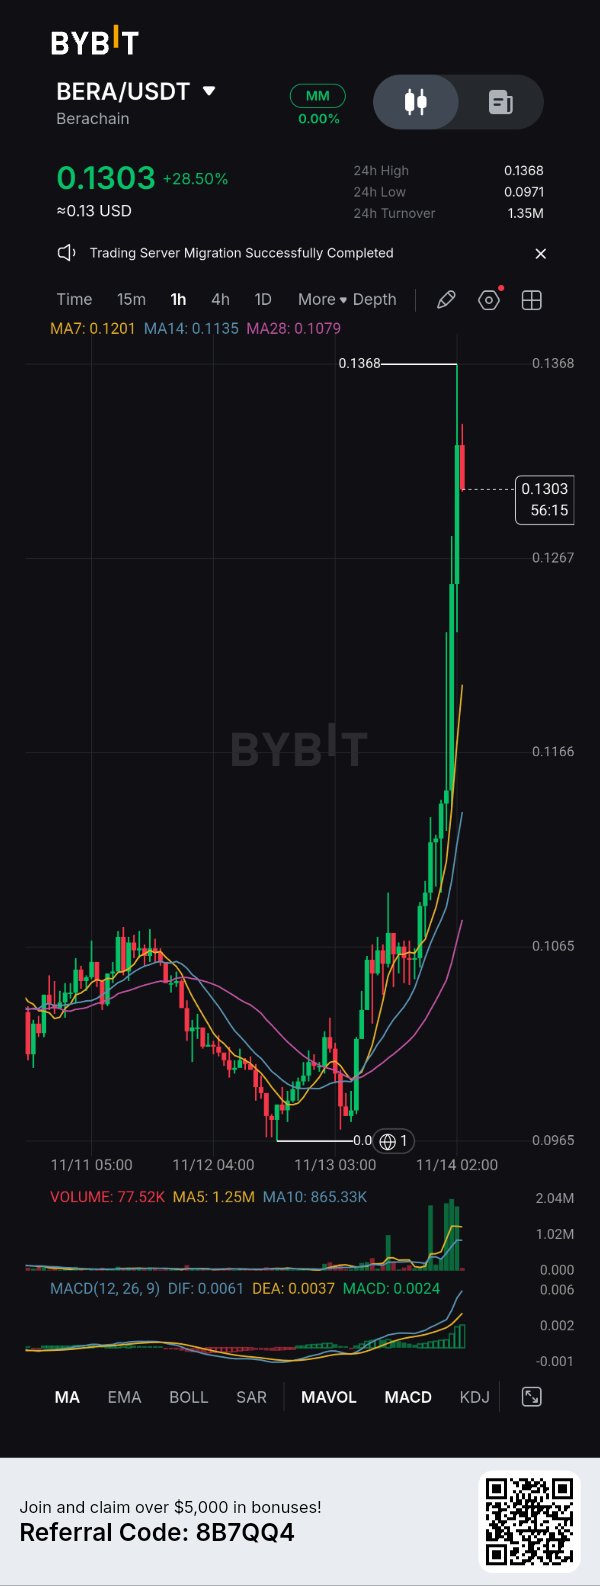
Some traders will see this$BERAUSDT chart and immediately look for a BUY button. I'm looking at the $0.1368 level. Why? Because BERA has made a powerful move from the $0.0971 region, but price is now approaching the high of the entire 24-hour session. This is where momentum traders need to distinguish between a genuine continuation and a late-entry trap. ⚡ WHAT THE CHART IS TELLING US BERA/USDT — 1H chart Current price: $0.1303 24H change: +28.50% 24H high: $0.1368 24H low: $0.0971 24H turnover: $1.35M Moving averages: - MA7: $0.1201 - MA14: $0.1135 - MA28: $0.1079 All three moving averages are positioned below price, with a bullish alignment. This confirms that the short-term structure has changed significantly. But there's a warning: price has moved considerably above its moving averages. A pullback would not necessarily mean the rally is over. 📊 THE MOMENTUM CHECK MACD: - DIF: 0.0061 - DEA: 0.0037 - Histogram: +0.0024 Momentum remains bullish, with DIF above DEA and a positive histogram. However, look at the volume readings: - Current volume: 77.52K - MA5 volume: 1.25M - MA10 volume: 865.33K The displayed current volume is considerably lower than both volume averages. This could reflect cooling participation after the explosive candles. I want to see fresh buying activity before trusting another immediate upward extension. 🎯 THE LEVELS THAT MATTER Resistance: - $0.1368 — 24H high - Above this level, watch for a confirmed breakout and new resistance formation. Support: - $0.1267 — First important chart area - $0.1201 — MA7 - $0.1166 — Additional chart support - $0.1135 — MA14 🔥 TWO SETUPS I'M WATCHING 🟢 SETUP 1: THE PULLBACK TRADE I would rather let BERA come to support than chase it at $0.1303. Potential EP: $0.1205–$0.1267, depending on the support reaction. SL: $0.1160 TP1: $0.1368 TP2: Only after a confirmed breakout, establish the next target from fresh price structure. Confirmation: A bullish reaction around the entry zone, preferably supported by renewed volume. 🔵 SETUP 2: THE BREAKOUT TRADE If buyers push through $0.1368 with strong volume and price successfully retests that level: EP: Above $0.1368 after confirmation. SL: Below the confirmed retest low. TP: Determine from the next resistance formed after the breakout. I won't invent a target where the chart provides none. INVALIDATION: A sustained breakdown below $0.1166 would significantly weaken this immediate bullish continuation thesis. ⚠️ THE MISTAKE I WANT TRADERS TO AVOID Don't confuse a strong token with a good entry. BERA has already delivered a substantial move. Buying simply because the candles are green can expose late entrants to a sharp correction. Sometimes waiting for a retest offers a better opportunity than chasing momentum. 🧠 MY VERDICT Bullish structure. Elevated entry risk. I'm interested in BERA, but I want buyers to prove that the $0.1368 resistance can be broken and defended. Until then, the pullback is the setup I'm watching. 🔥 BERA TRADERS, WHAT'S YOUR PLAN? Are you buying a controlled pullback toward $0.1267, or waiting for a confirmed breakout above $0.1368? #BERA #BERAUSDT #Berachain #Bybit #CryptoTrading #TechnicalAnalysis #ByXIMPACT #WSOT2026 #WSOTShowYourAITradeToEarn10USDT #JensenHuangExitTestsNvidiasAILeadership #USPPITestsTheHigherForLongerTrade
$HYPEUSDT — BUYERS MADE THEIR MOVE. NOW THE MARKET IS TESTING THEIR STRENGTH. 👀 I've been looking at HYPE, and one thing stands out: the rejection around $75.30. Price attempted a strong upward move, but sellers stepped in aggressively. Now HYPE is trading around $72.429, and I'm more interested in what happens next than in the initial rally. Here's how I'm reading the chart. 🔎 THREE THINGS I'M PAYING ATTENTION TO 1. The rejection wasn't insignificant. HYPE climbed toward $75.308 before experiencing a sharp pullback. That tells me the $75 region is an important resistance area. Buyers need to demonstrate that they can absorb selling pressure before I become confident in another breakout. 2. Momentum is cooling down. Look at the moving averages: - MA7: $73.264 - MA14: $72.712 - MA28: $72.220 Price has slipped below the MA7 and MA14 but remains above the MA28. For me, this is a short-term warning sign. The recovery structure hasn't completely disappeared, but buyers have lost some immediate momentum. 3. MACD is giving me another reason to be patient. DIF: 0.316 DEA: 0.324 MACD: -0.008 The slightly negative histogram suggests bullish momentum has weakened. I want to see whether this develops into a deeper correction or simply a temporary cooling-off period. 📍 THE LEVELS I'M WATCHING Rather than predicting one direction, I'm preparing for two possibilities. 🟢 BULLISH SCENARIO If HYPE reclaims $72.70–$73.30 and establishes support above that region, I'll start watching: - $73.86 - $74.50 - $75.30 A convincing break above $75.30 would be particularly interesting. 🔴 BEARISH SCENARIO If sellers push price below $72.20, I'll watch the $70.97 support area. A breakdown below that region could expose the previous swing low around $69.53. 🎯 MY TRADING APPROACH I'm not interested in buying simply because HYPE is showing a green 24-hour percentage. My preference is to wait for confirmation. - Potential long entry: $72.80–$73.30, after a confirmed reclaim and retest. - TP1: $73.86 - TP2: $74.50 - TP3: $75.30 - Invalidation: Sustained move below $72.20. These are conditional planning levels, not an active trade signal. The setup needs confirmation, and the first target offers limited upside relative to the proposed invalidation level, so I would reassess risk-to-reward before entering. 🧠 MY FINAL TAKE I'm cautiously neutral on HYPE in the immediate term. The rejection at $75.30 deserves attention, but I won't automatically interpret it as the beginning of a major decline. What I want to see is simple: can buyers reclaim the moving-average cluster, or will sellers force another test of lower support? The next reaction matters more than the previous rally. 👇 I WANT TO HEAR FROM OTHER TRADERS: If you were watching HYPE right now, which level would determine your next move: $73.30 or $70.97? And more importantly, what would make you change your bias? #HYPE #Hyperliquid #CryptoTrading #ByX #ByXIMPACT