Michael Leo
2623Me gusta0Compartir en el chat785Aficionados1218Seguir
on-chain analyst crypto lover
on-chain analyst crypto lover
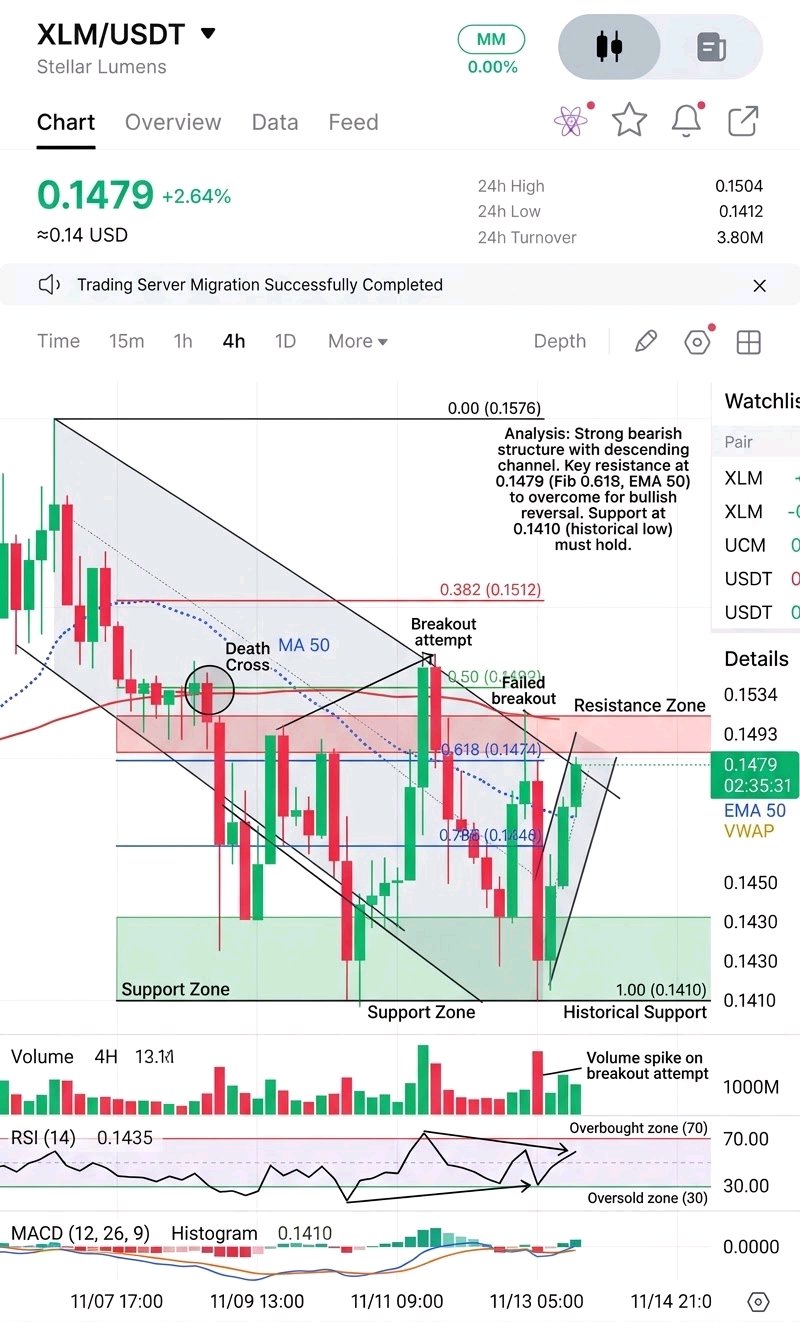
$XLMUSDT Stellar (XLM) is showing a notable improvement in its short-term market structure, with buyers stepping back in after defending the $0.1412 region. On the 1-hour chart, price has recovered from its recent downside move and reclaimed the $0.1484 resistance area. More importantly, XLM has moved back above its moving average ribbon, suggesting that short-term momentum is shifting in favor of buyers. Technical Breakdown Bullish Momentum: MACD is turning positive, supporting the recovery narrative. The Parabolic SAR remains below price near $0.1413, keeping the broader short-term setup constructive. Overbought Warning: RSI is hovering around 73.31, while price is approaching the upper Bollinger Band near $0.1506. This suggests buyers have strong momentum, but a temporary cooldown should not be ruled out. Key Support: The EMA cluster around $0.1463 is now an important area to watch. Holding above this zone could help establish a stronger foundation for another upward attempt. My Trading Strategy I am not interested in chasing an extended candle. The priority is to protect existing gains and let price confirm its next direction. For existing positions, I am watching whether XLM can maintain its reclaimed structure and establish acceptance above the recent breakout area. Key Levels to Watch - Resistance: $0.1504–$0.1506 - Upside objective: A confirmed breakout above $0.1506 - Support: $0.1463 - Major downside invalidation: $0.1380 Risk Management A sustained move below $0.1380 would invalidate my current bullish structural outlook. Until then, I will monitor the support reaction and look for confirmation before considering further exposure. The setup remains constructive, but the next move depends on whether buyers can turn reclaimed resistance into lasting support. Trade the confirmation, not the excitement. #WSOTShowYourAITradeToEarn10USDT
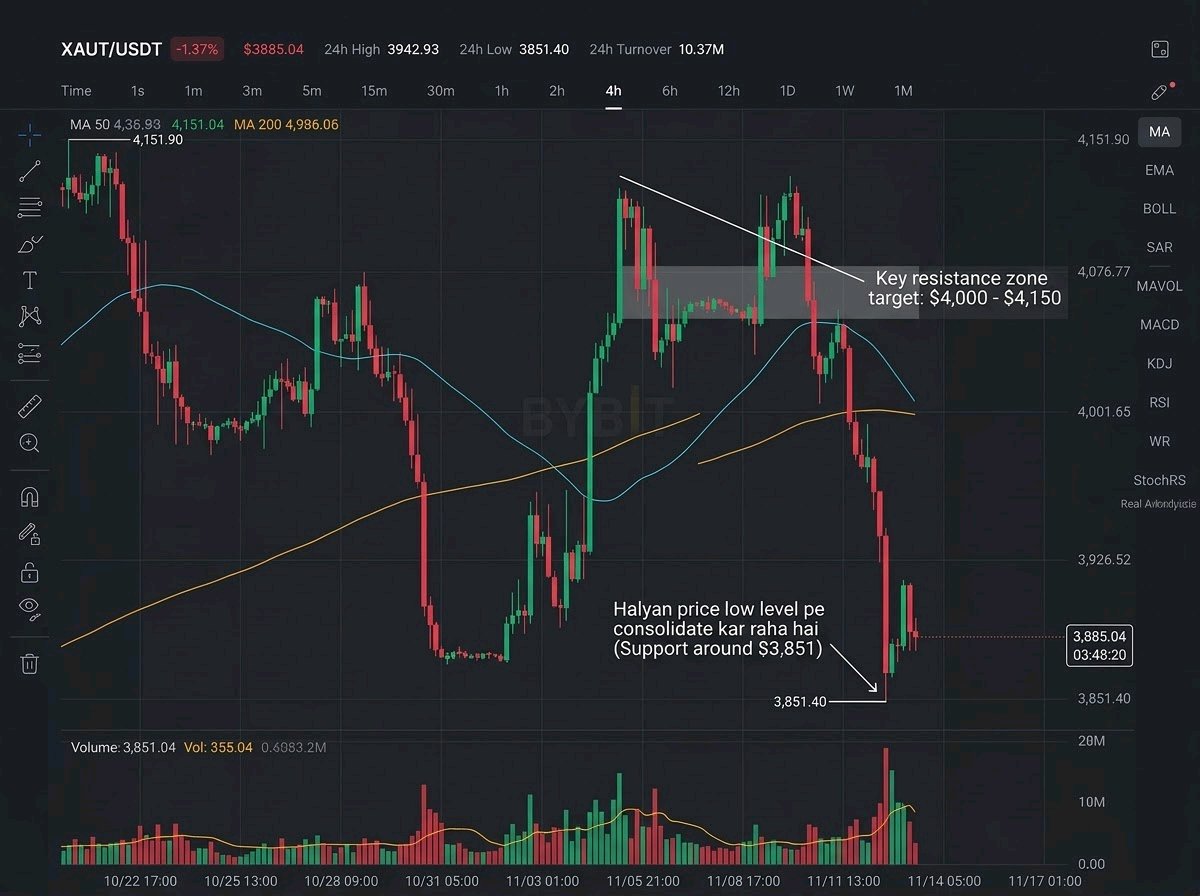
$XAUTUSDT USDT can sustain this v-shaped relief bounce to reverse the aggressive intraday sell-off, asset has moved beyond its simple safe haven identity, introducing intense volatility and complex trading dynamics however, token is still trading well below its recent local highs, creating a clear gap between macro adoption and immediate chart performance XAUT recently traded near $3,894.11, with a 24-hour turnover volume around 10.00M. Its latest reported 24-hour range is $3,851.40-$3,950.90. The $3,884 area, aligning with the 0.0 Fibonacci level, is the immediate support zone, while the $3,925 to $3,949 area is first major recovery resistance sustained reclaim of $3,950 would provide stronger evidence that buyers are returning. The broader structure remains weak after a steep decline of nearly 6% from $4,130.11 peak technical development worth watching is the underlying momentum shift on the hourly chart MACD is printing a bullish crossover with the histogram flipping green above zero. Meanwhile, the RSI has bounced sharply from oversold territory and is now hovering near the neutral 50 level these figures demonstrate localized capitulation and a potential trend reversal, but a technical bounce does not automatically translate into a full macro recovery important question is how much real spot demand actually requires XAUT at these discounted levels Market structure provides another important angle, especially regarding the projected path chart outlines a clear trajectory targeting the upper Fibonacci extensions, specifically the 4.236 level at $4,055 owever, price action is still suppressed below the EMA50 at $3,935 and the EMA200 at $4,001. Supply dynamics and physical backing also deserve attention, though short-term price action is currently dictated by derivative traders rather than physical accumulation liquidity is another concern, recent volume spikes confirm that market makers are highly active, making XAUT vulnerable to sharp whipsaws when buying or selling activity changes would focus on actual spot participation above the moving averages rather than assuming that a simple technical indicator crossover alone can create a sustained rally Key figures: $3,894.11 current price area $3,950.90 24h high $3,851.40 24h low $3,884.80 immediate support $3,925.07 first resistance $3,949.96 secondary resistance $4,055.41 macro target EMA50 at $3,935.65 EMA200 at $4,001.20 10.00M 24h turnover volume Bullish confirmation, reclaim $3,925.07 and hold above the EMA50 at $3,935.65 with stronger spot volume that would put the $3,949.96 and $3,990.24 levels in focus, with further recovery possible toward the $4,055.41 target Bearish confirmation, lose $3,884.80 and fail to recover it, would expose the recent low of $3,851.40, followed by lower price discovery if selling accelerates and liquidity remains weak Tether Gold has experienced a violent technical breakdown followed by a sharp relief bounce, but the market still needs evidence that this momentum is sustainable decisive signal is whether real ecosystem activity translates into stronger spot buying and whether buyers can establish acceptance above the EMA50 until then, projected move toward $4,055 remains a #WSOTShowYourAITradeToEarn10USDT #USPPITestsTheHigherForLongerTrade
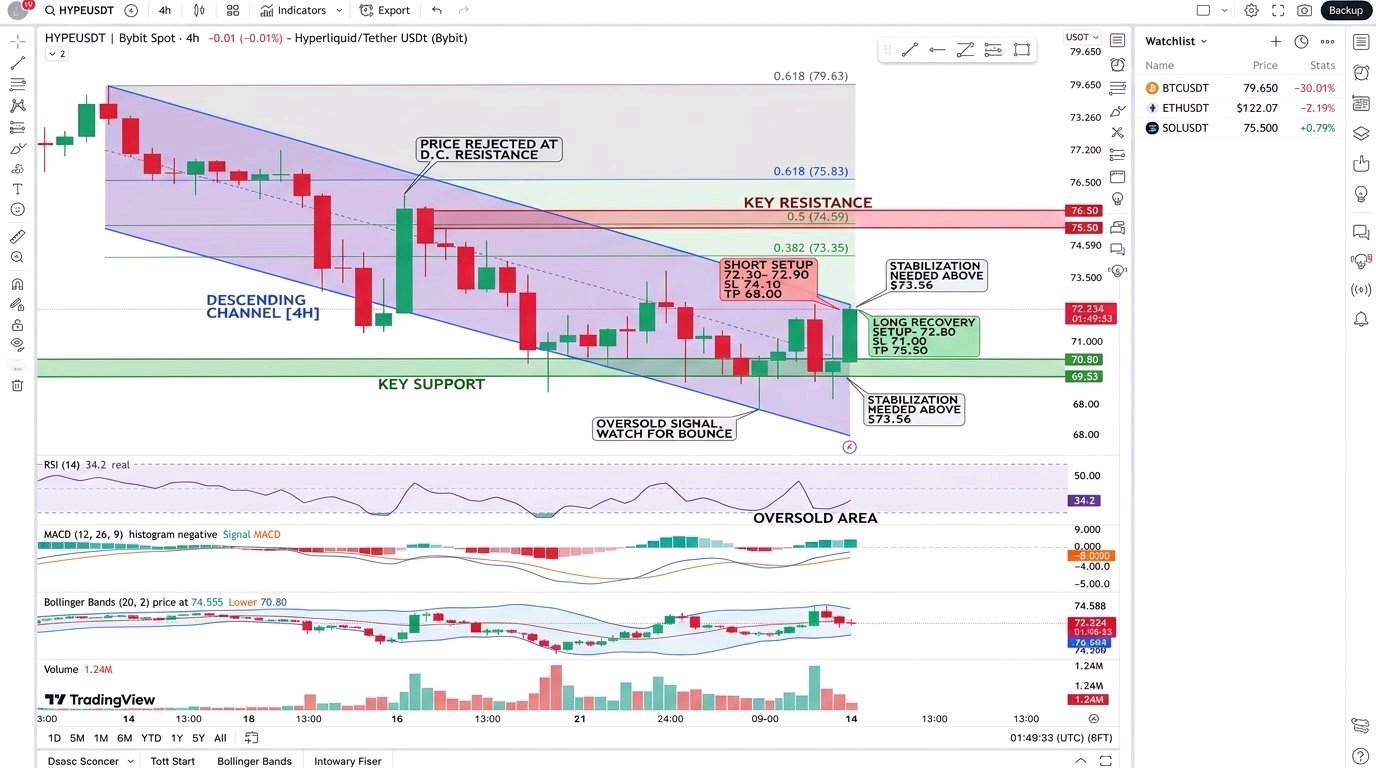
HYPE Weekly Structure Signals a Potential Major Recovery $HYPEUSDT is approaching a critical zone where the next weekly move could determine the direction of its broader market trend. While the short-term chart still shows signs of weakness, the higher-timeframe structure is giving me a reason to remain cautiously bullish. The Bigger Picture HYPE previously climbed from approximately $20 toward $75 before entering a correction. Buyers stepped in around $52, and that recovery eventually pushed price toward a new high near $98. Now the market is correcting again, with the latest weekly low reaching $69.45. The important question is whether this region can become another higher low. If buyers successfully defend this area, HYPE could maintain its broader bullish structure even while short-term momentum remains bearish. However, confirmation will depend on the weekly candle close. Key Resistance Levels to Watch The recovery needs to overcome several important barriers: - $78.31 – First resistance and recovery checkpoint. - $82–$87 – Major supply zone. - $95–$98 – Previous high and major breakout barrier. A convincing breakout above $98, followed by a successful retest, could open the door toward the next expansion zone. My Longer-Term Price Projection <escape>$115–$124</escape> From the $71.82 reference price, this represents approximately 60–73% potential upside. This is a higher-timeframe projection, not an immediate trading target. Buyers must first reclaim resistance and confirm the breakout structure. Trading Setup – Short-Term Perspective Previous 4H long setup: EP: $72.176 TP: $88.798 SL: $68.420 Risk-to-reward: Approximately 4.43:1. This short-term setup remains separate from the weekly bullish thesis. A longer-term target should never be used as an excuse to ignore a short-term stop loss. Risk Management & Invalidation - $65–$70: Important weekly recovery zone. - Below $65: Recovery structure becomes increasingly vulnerable. - Near $52: Losing this previous major swing low would significantly damage the higher-low thesis. My Trading View I'm watching HYPE closely because its weekly structure could be setting up for a much larger recovery. But I want confirmation, not anticipation. First, buyers must reclaim resistance. Then the market needs to prove that the breakout can hold. A potential $120 move is exciting, but protecting capital and respecting the current trade structure comes first. The bigger trend may offer a major opportunity, but patience will determine the quality of the entry. #HYPEUSDT #WSOT2026 #USInflationRunsHotAndRateHikeBetsRise
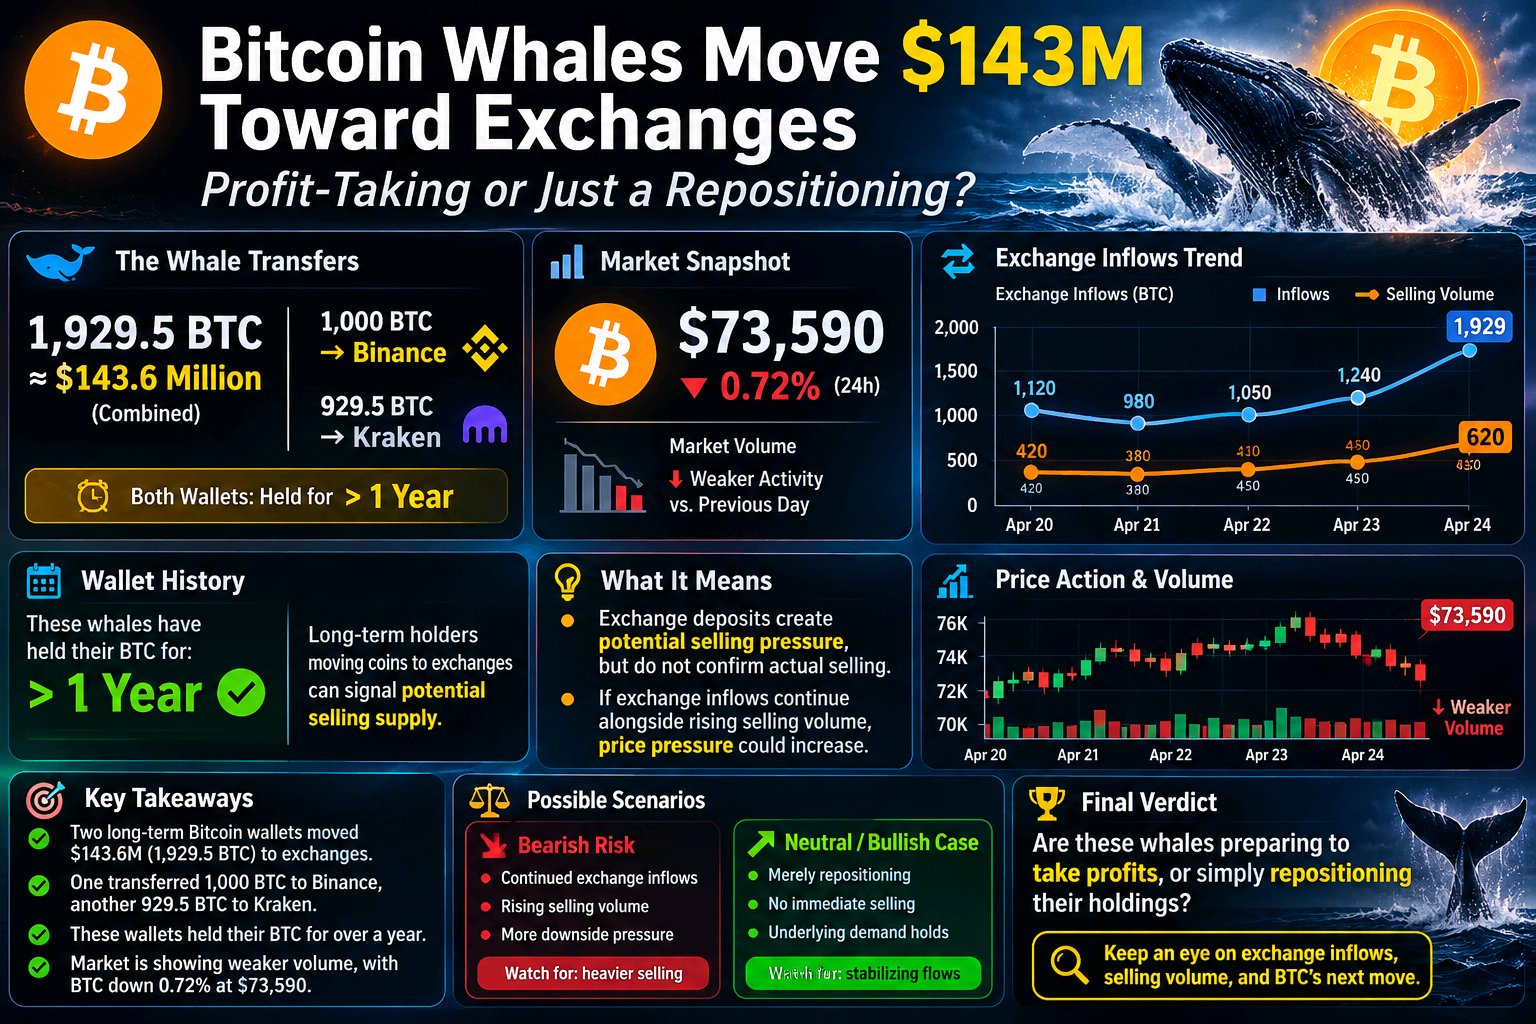
Bitcoin Whales Move $143M Toward Exchanges
$BTCUSDT whales are making moves that deserve attention. Two long-term Bitcoin wallets transferred a combined 1,929.5 BTC, worth approximately $143.6 million, to centralized exchanges. One sent 1,000 BTC to Binance, while another moved 929.5 BTC to Kraken. Meanwhile, Bitcoin was trading around $73,590, down approximately 0.72% over 24 hours. Market volume also showed weaker activity compared with the previous day. The overlooked detail: These wallets had held their Bitcoin for over a year. Their exchange deposits create potential selling supply, but do not confirm actual selling. If exchange inflows continue alongside rising selling volume, pressure could increase. Are these whales preparing to take profits, or simply repositioning their holdings? #WSOT2026 #SanDiskAnnounces8For1StockSplit #DeutscheBankLaunchesDigitalAssetCustody
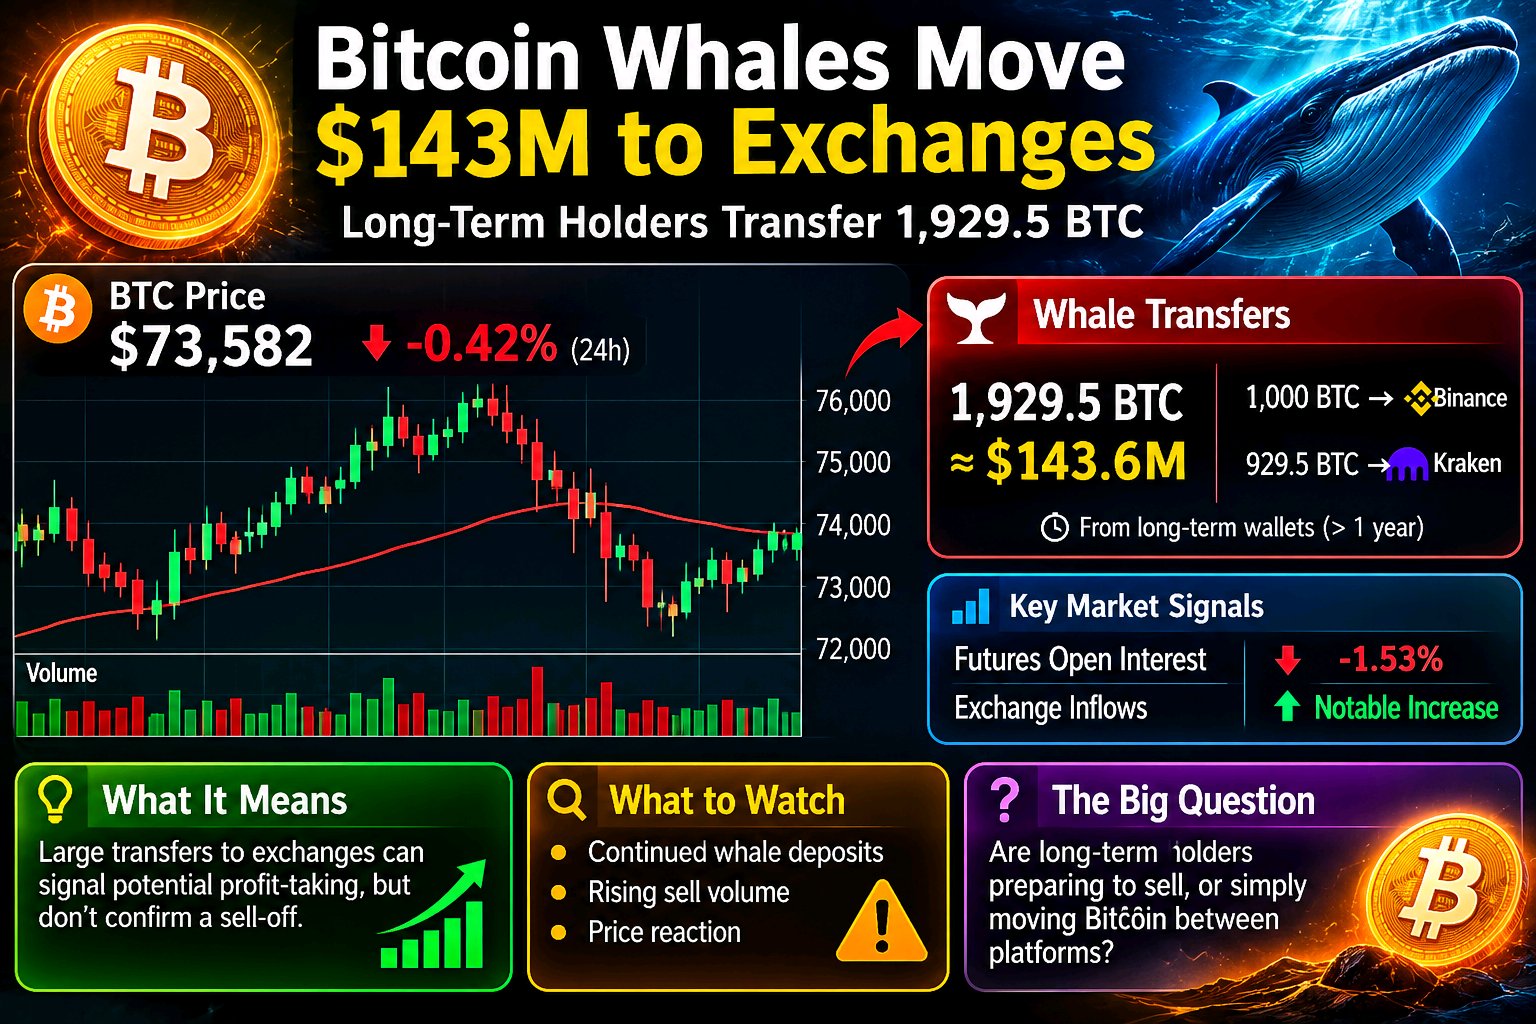
Bitcoin Whales Move $143M to Exchanges
$BTCUSDT Bitcoin whales are making moves, and the timing deserves attention. On November 12, two long-term wallets transferred a combined 1,929.5 BTC worth approximately $143.6 million to major exchanges. One wallet deposited 1,000 BTC, while another moved 929.5 BTC. The overlooked detail: Both wallets reportedly held their Bitcoin for more than a year. These transfers could indicate potential profit-taking, although exchange deposits do not automatically mean selling. Meanwhile, BTC traded near $73,582, down approximately 0.42% over 24 hours, while futures open interest declined around 1.53%. What to watch: Continued whale deposits alongside rising sell volume could strengthen bearish pressure. A slowdown in inflows may reduce that concern. Are long-term holders preparing to sell, or simply moving Bitcoin between platforms? #SanDiskAnnounces8For1StockSplit #USInflationRunsHotAndRateHikeBetsRise #WSOT2026 #BitcoinHitsTwoMonthLowAfterUSMidterms
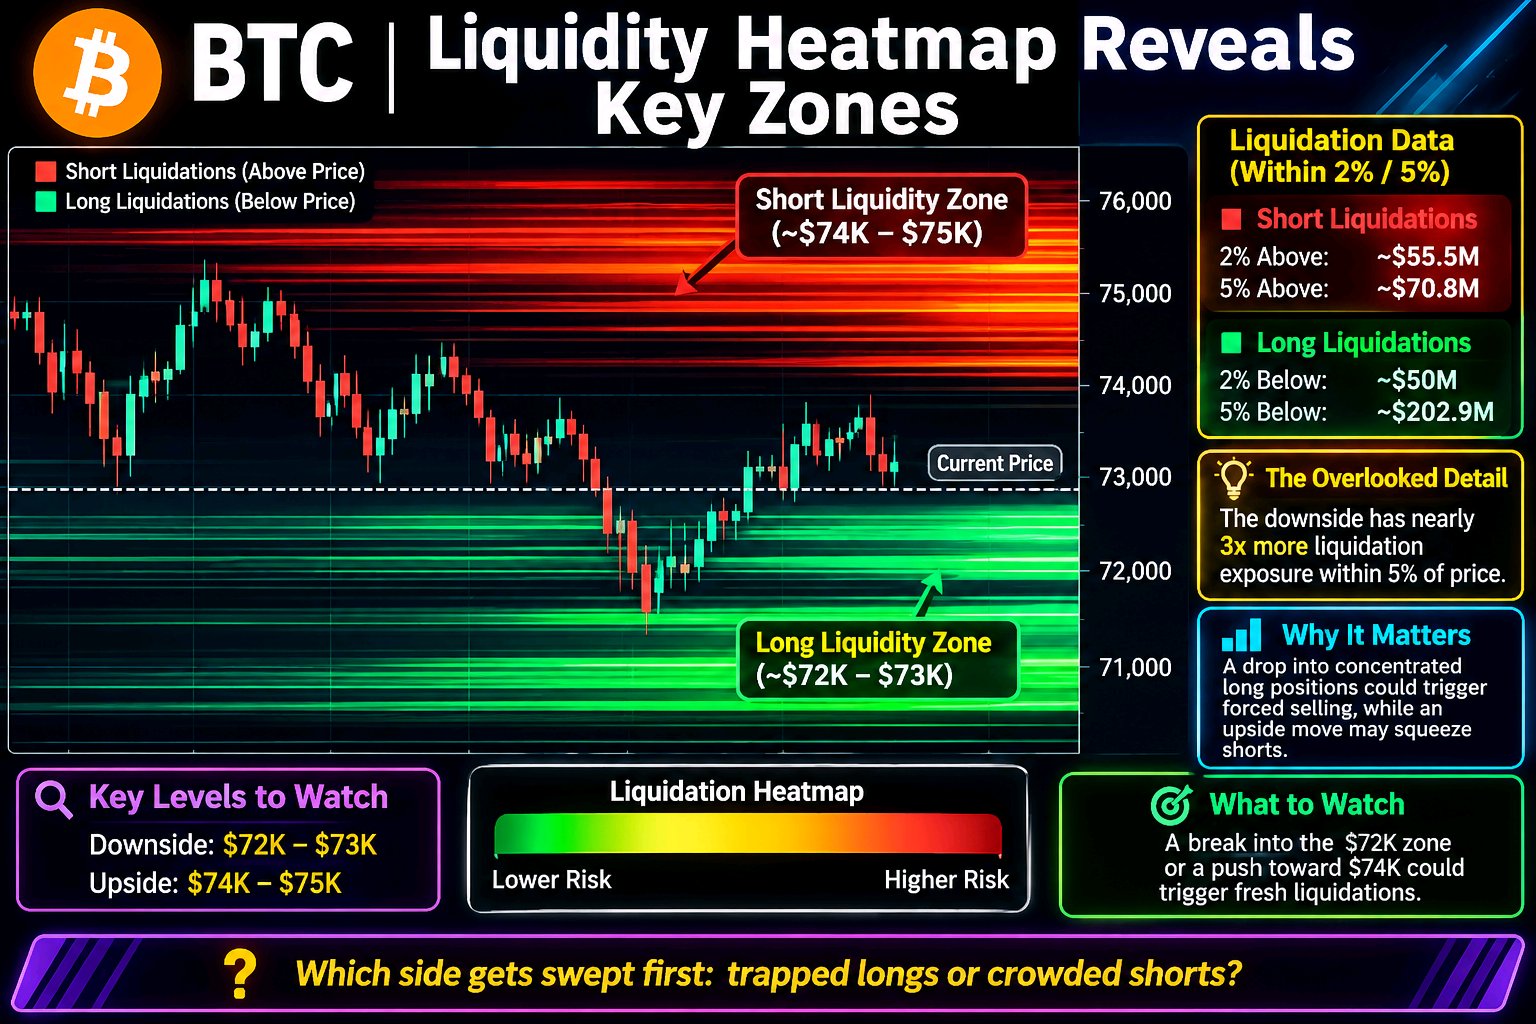
BTC Liquidity Clusters Reveal Two Key Zones
$BTCUSDT Bitcoin is approaching a liquidity battle on both sides, but the downside carries a much larger pool of potential liquidations. Market Observation — November 12 Around 05:26 UTC, BTC liquidation data showed: - Long liquidations within 2% below price: approximately $50M. - Short liquidations within 2% above price: approximately $55.5M. - Long liquidations within 5% below: approximately $202.9M. - Short liquidations within 5% above: approximately $70.8M. The Overlooked Detail The downside has nearly three times the estimated liquidation exposure within 5% of price. Why It Matters A drop into concentrated long positions could trigger forced selling and accelerate volatility. Meanwhile, an upside move could squeeze shorts near current levels. What to Watch Watch the $72K–$73K downside area and nearby $74K–$75K upside liquidity. These are estimated liquidation zones, not guaranteed price targets. Which side gets swept first: trapped longs or crowded shorts? #NovUSCPIWatch #AnthropicIPOTestsTheAIBoom #USPayrollsAndRateDecisionsDriveMacroWeek
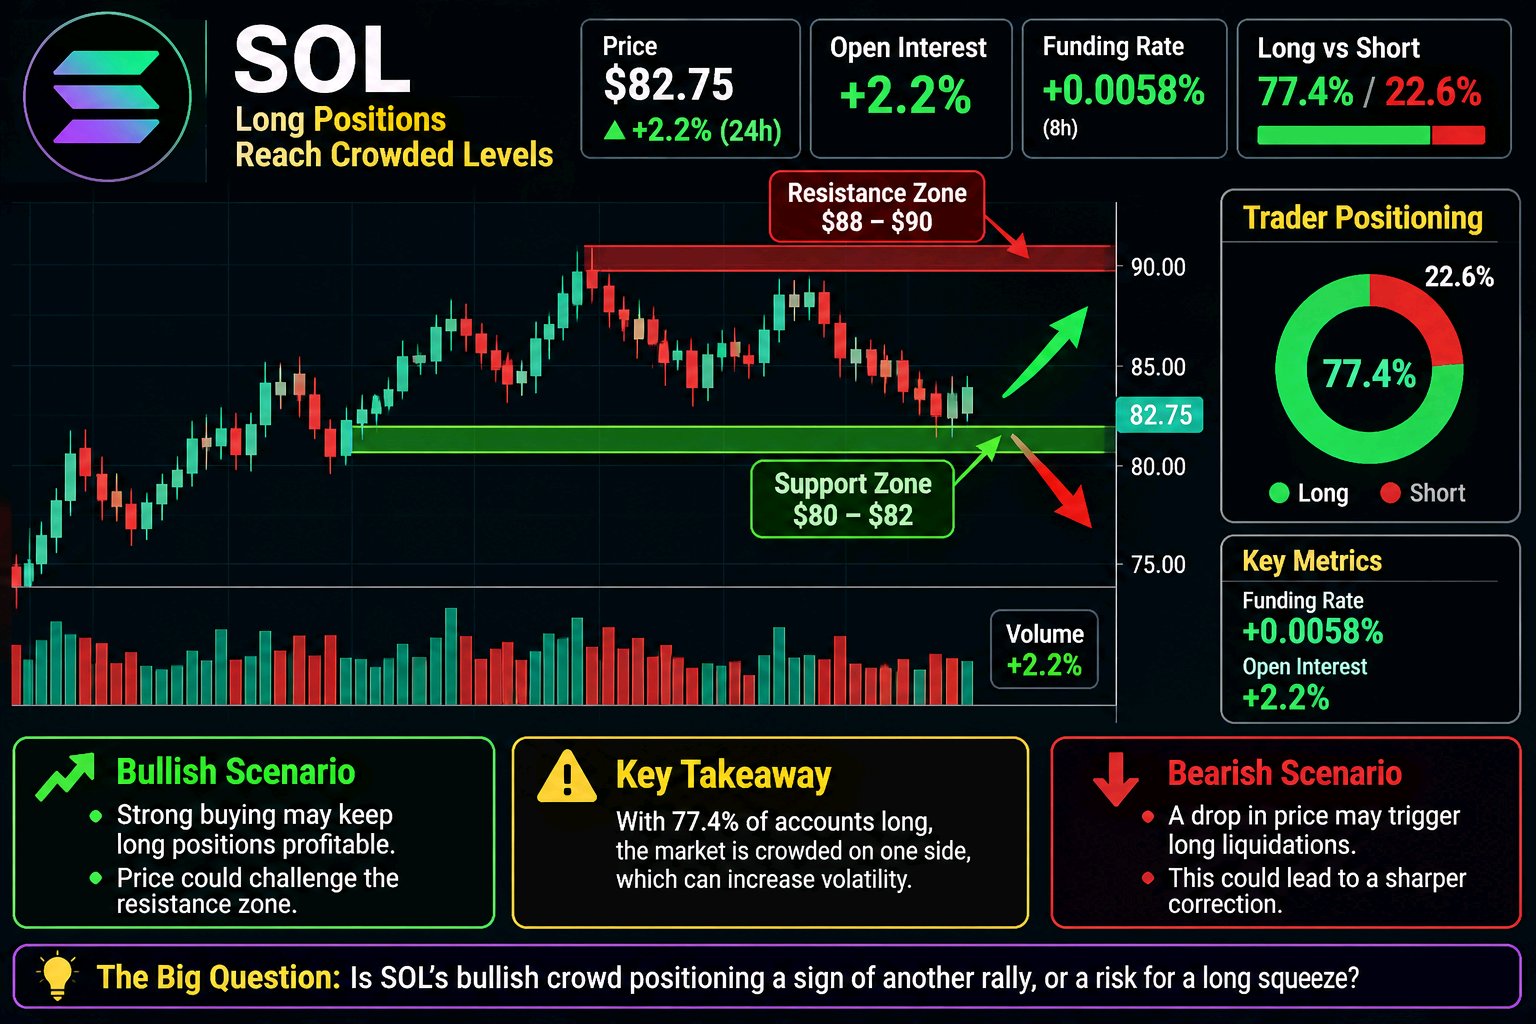
SOL Long Positions Reach Crowded Levels
$SOLUSDT Solana traders are heavily leaning toward the bullish side, but this positioning could become a risk if momentum reverses. On November 11, SOL traded near $82.75, while approximately 77.4% of tracked futures accounts held long positions and only 22.6% were short. Funding remained positive at +0.0058% per 8 hours, while Open Interest increased approximately 2.2% over 24 hours. The Overlooked Detail Nearly 4 out of 5 tracked accounts are positioned for upside. This imbalance suggests that bullish expectations are becoming crowded. Why It Matters If SOL loses momentum, overleveraged longs could face liquidations, potentially accelerating selling pressure. Key Signals to Watch - Long positioning: 77.4% - Short positioning: 22.6% - Funding Rate: +0.0058% - Open Interest: +2.2% - Reference Price: $82.75 Bullish Scenario: Sustained buying and rising price could reward existing long positions. Bearish Scenario: Weak price action combined with long liquidations could trigger a sharper correction. Is SOL's bullish crowd positioning for another rally, or becoming vulnerable to a long squeeze? Figures reflect the November 11 market observation, not independently verified live updates. #AnthropicIPOTestsTheAIBoom #NovUSCPIWatch
¡El interés abierto de AGT se dispara un 347%!
#BybitIAEvolucionando $AGT está atrayendo una atención especulativa masiva a medida que la actividad de trading apalancado se acelera. AGT ha registrado un aumento de precio aproximado del 193% en 24 horas, mientras que el Interés Abierto (Open Interest) ha subido casi un 347%, alcanzando alrededor de 67 millones de dólares. **El detalle clave:** El Interés Abierto está aumentando significativamente más rápido que el precio. Esto sugiere que están entrando al mercado nuevas posiciones apalancadas agresivas. Mientras tanto, aproximadamente 2.3 millones de dólares en liquidaciones de posiciones en corto indican que los traders bajistas han enfrentado una presión sustancial. **Por qué es importante:** El aumento del precio junto con el aumento del OI señala una participación de mercado en expansión. Sin embargo, una tasa de financiación elevada cercana al 0.13% cada 8 horas sugiere que las posiciones largas podrían estar saturándose. **Qué observar:** Si el precio continúa subiendo con un volumen fuerte, el impulso alcista podría mantenerse intacto. Pero una reversión del precio junto con una disminución del OI podría señalar el cierre de posiciones largas. ¿Está AGT construyendo un impulso sostenible o el apalancamiento excesivo está preparando el próximo shock de volatilidad? #Las nóminas de EE. UU. y las decisiones sobre tasas impulsan la semana macro #Observación del IPC de EE. UU. de nov.

AI Coins Show Strength as Altcoins Lag BTC
$BTCUSDT The altcoin market is showing an interesting split, and smart traders should pay attention. As of November 11, AI & Big Data is showing relative strength, with approximately 1.27% gains over 24 hours. Meanwhile, Privacy coins are facing pressure, declining around 3.39%. **Top performers to watch:** QNT, NEAR and ZEC have demonstrated notable outperformance against Bitcoin over the past 90 days. **The overlooked detail:** Despite individual winners, no tracked altcoin sector currently has more than 50% of its coins outperforming BTC over the 30-day period. This suggests capital is rotating selectively rather than entering the entire altcoin market. If sector breadth improves alongside rising volume and stronger BTC-relative performance, the rotation could become more convincing. **Are AI coins leading the next altcoin rotation, or is Bitcoin dominance still controlling the market?** #BybitAIEvolving #USPayrollsAndRateDecisionsDriveMacroWeek

XMR Longs Are Paying a Heavy Premium
#BybitAIEvolving #OilVolatilityTracksIranPeaceTalks #AnthropicIPOTestsTheAIBoom Monero is showing an unusual derivatives imbalance that traders shouldn't ignore. As of November 11, around 13:32 UTC, XMR traded near $580.40, with funding positive at +0.0090% per 8 hours. Open interest stood near $207M, down 2.4% over 24 hours. A separate multi-exchange snapshot recorded approximately $109.85M in 24-hour futures volume and funding as high as +0.0404%. The overlooked detail: Funding remains positive while open interest contracts. That suggests leveraged positioning is not expanding alongside the market. If OI starts rising with sustained volume, the move deserves closer attention. Otherwise, crowded longs could face pressure. Are XMR bulls losing conviction?
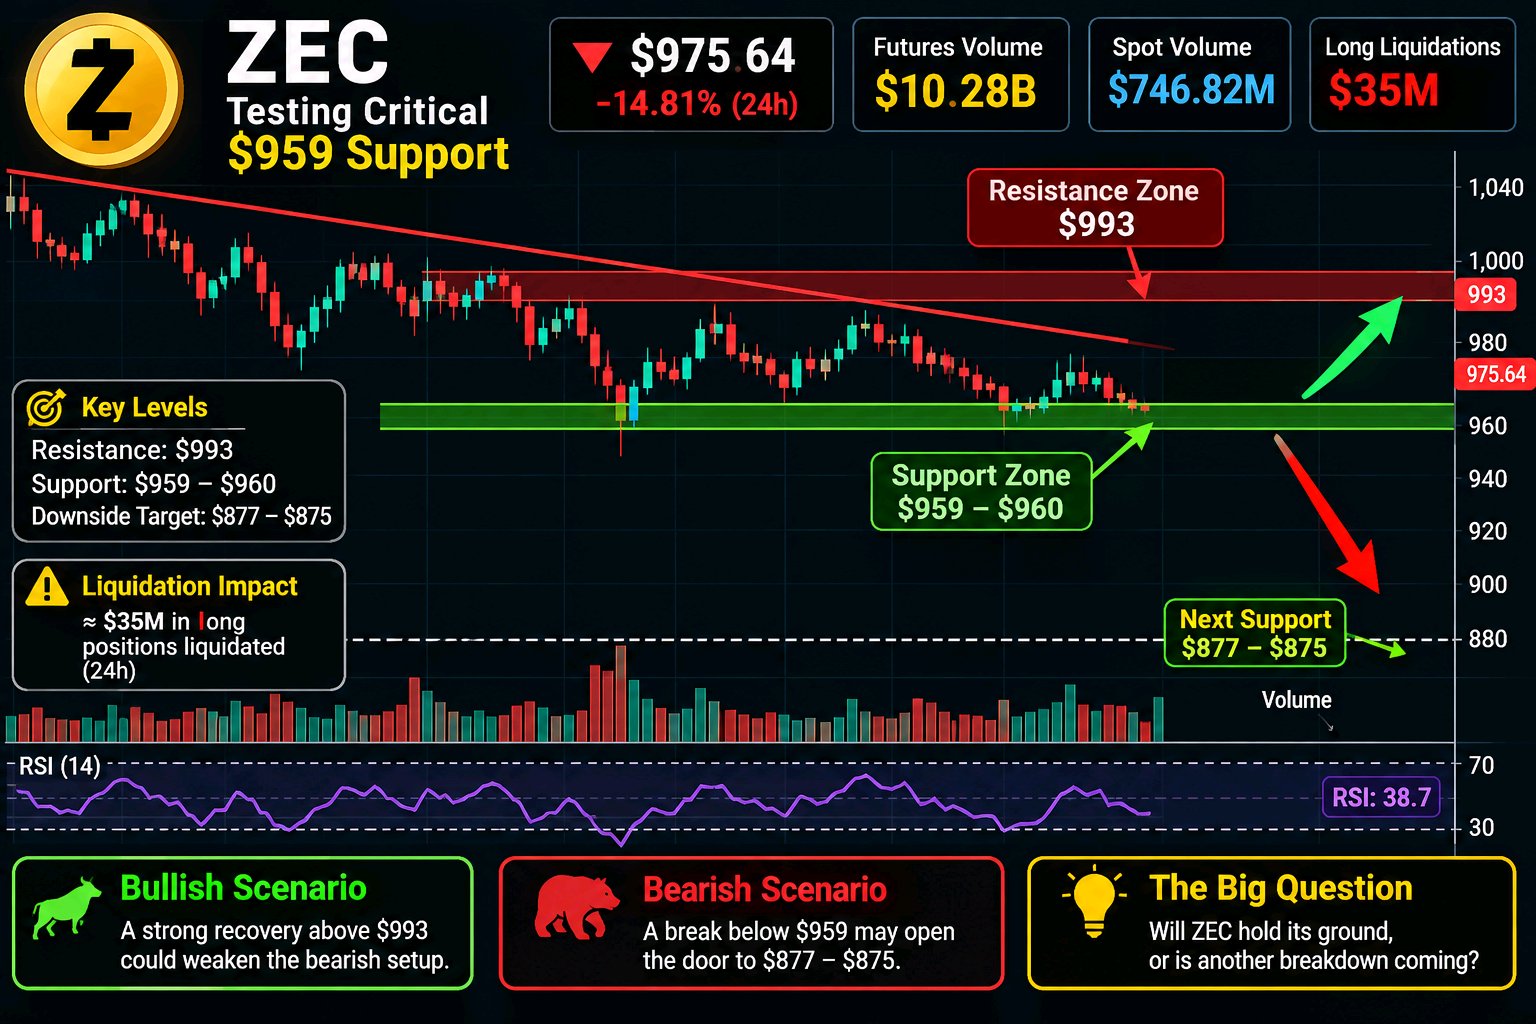
ZEC Faces Critical $959 Support Breakdown
Zcash is testing an important support zone as selling pressure continues to build. On November 11, ZEC traded near $975.64, declining approximately 14.81% over 24 hours. The immediate support zone stands around $959–$960, while the recent 24-hour low was approximately $965. **The Overlooked Detail** Futures trading volume reached approximately $10.28 billion, compared with $746.82 million in spot volume. Meanwhile, around $35 million in long positions were liquidated over 24 hours. **Why It Matters** Heavy derivatives activity and long liquidations suggest leveraged traders are under pressure. However, liquidation-driven selling can sometimes trigger a sharp recovery. **Key Levels to Watch** - Immediate Support: $959–$960 - Downside Target: $877–$875 - Recovery Level: $993 **Bearish Scenario:** A sustained breakdown below $959 could expose the lower support zone. **Bullish Scenario:** A strong recovery above $993 could weaken the immediate bearish structure. The next move depends on whether buyers can defend support or sellers maintain control. Will ZEC hold its ground, or is another breakdown approaching? *Market figures reflect the November 11 observation and are not verified live updates.* #WSOT2026 #USInflationRunsHotAndRateHikeBetsRise #NovUSCPIWatch #BybitAIEvolving
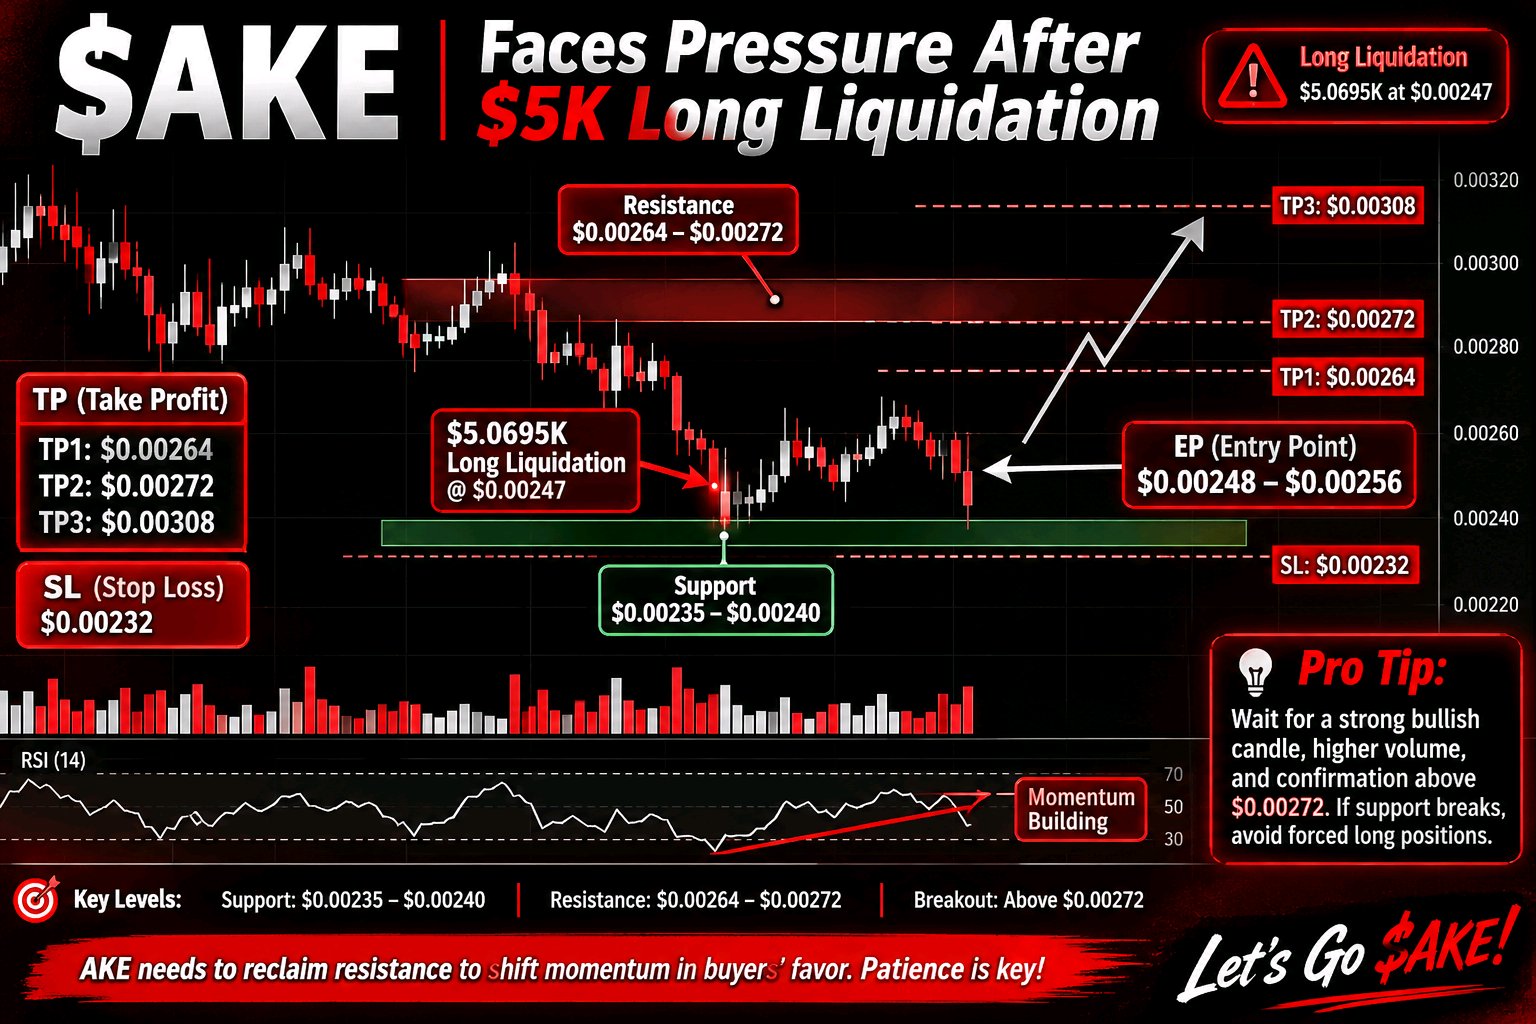
AKE Faces Pressure After $5K Long Liquidation
AKE recorded a $5.0695K long liquidation at $0.00247, highlighting pressure on leveraged buyers. This movement suggests that long positions are being forced out as sellers challenge the current market structure. The key focus is whether buyers can defend the nearby demand zone and restore bullish momentum. If AKE stabilizes and reclaims resistance, a short-term recovery could develop. However, continued selling pressure may push the price toward lower support levels. **EP (Entry Point)** $0.00248 – $0.00256 **TP (Take Profit)** TP1: $0.00264 TP2: $0.00272 TP3: $0.00308 **SL (Stop Loss)** $0.00232 **Key Levels** - Support: $0.00235 – $0.00240 - Resistance: $0.00264 – $0.00272 - Breakout confirmation: Above $0.00272 **Pro Tip:** Don't enter blindly after liquidation activity. Wait for a strong bullish candle, increasing volume, and confirmation above resistance. If support breaks, avoid forcing a long position. AKE needs to reclaim resistance to shift momentum in buyers' favor. Patience and proper risk management are essential. Let's go $AKE! #WSOT2026 #BitcoinHitsTwoMonthLowAfterUSMidterms #NovUSCPIWatch
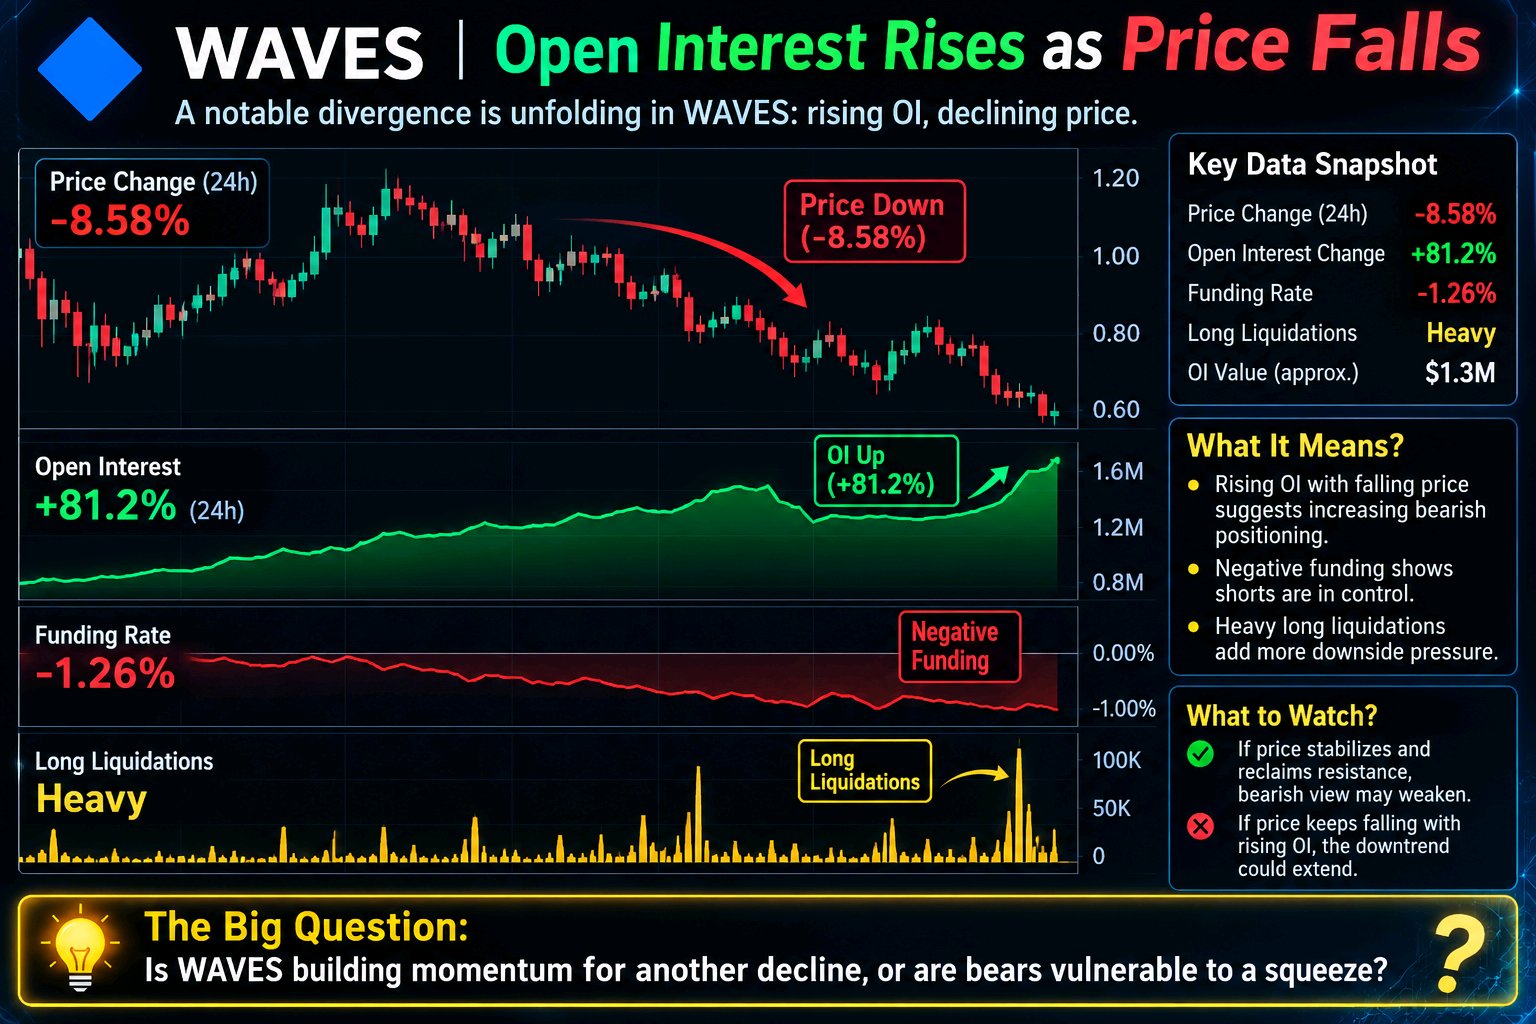
WAVES Open Interest Rises as Price Falls
$WAVESUSDT is showing an unusual shift in derivatives positioning, and traders should pay attention. Open interest reportedly increased by approximately 81.2% over 24 hours, while the token's price declined around 8.58%. This creates a notable divergence between futures positioning and spot price action. The overlooked detail is the combination of rising OI, negative funding and long liquidations. It suggests increasing bearish pressure and potentially crowded positioning, although rising OI alone does not confirm whether new positions are predominantly long or short. If price continues falling while OI expands, bearish positioning could strengthen. However, a recovery above nearby resistance could trigger short covering and a sharp reversal. The key question: Is WAVES building momentum for another decline, or are bears becoming vulnerable to a short squeeze? $MNTUSDT
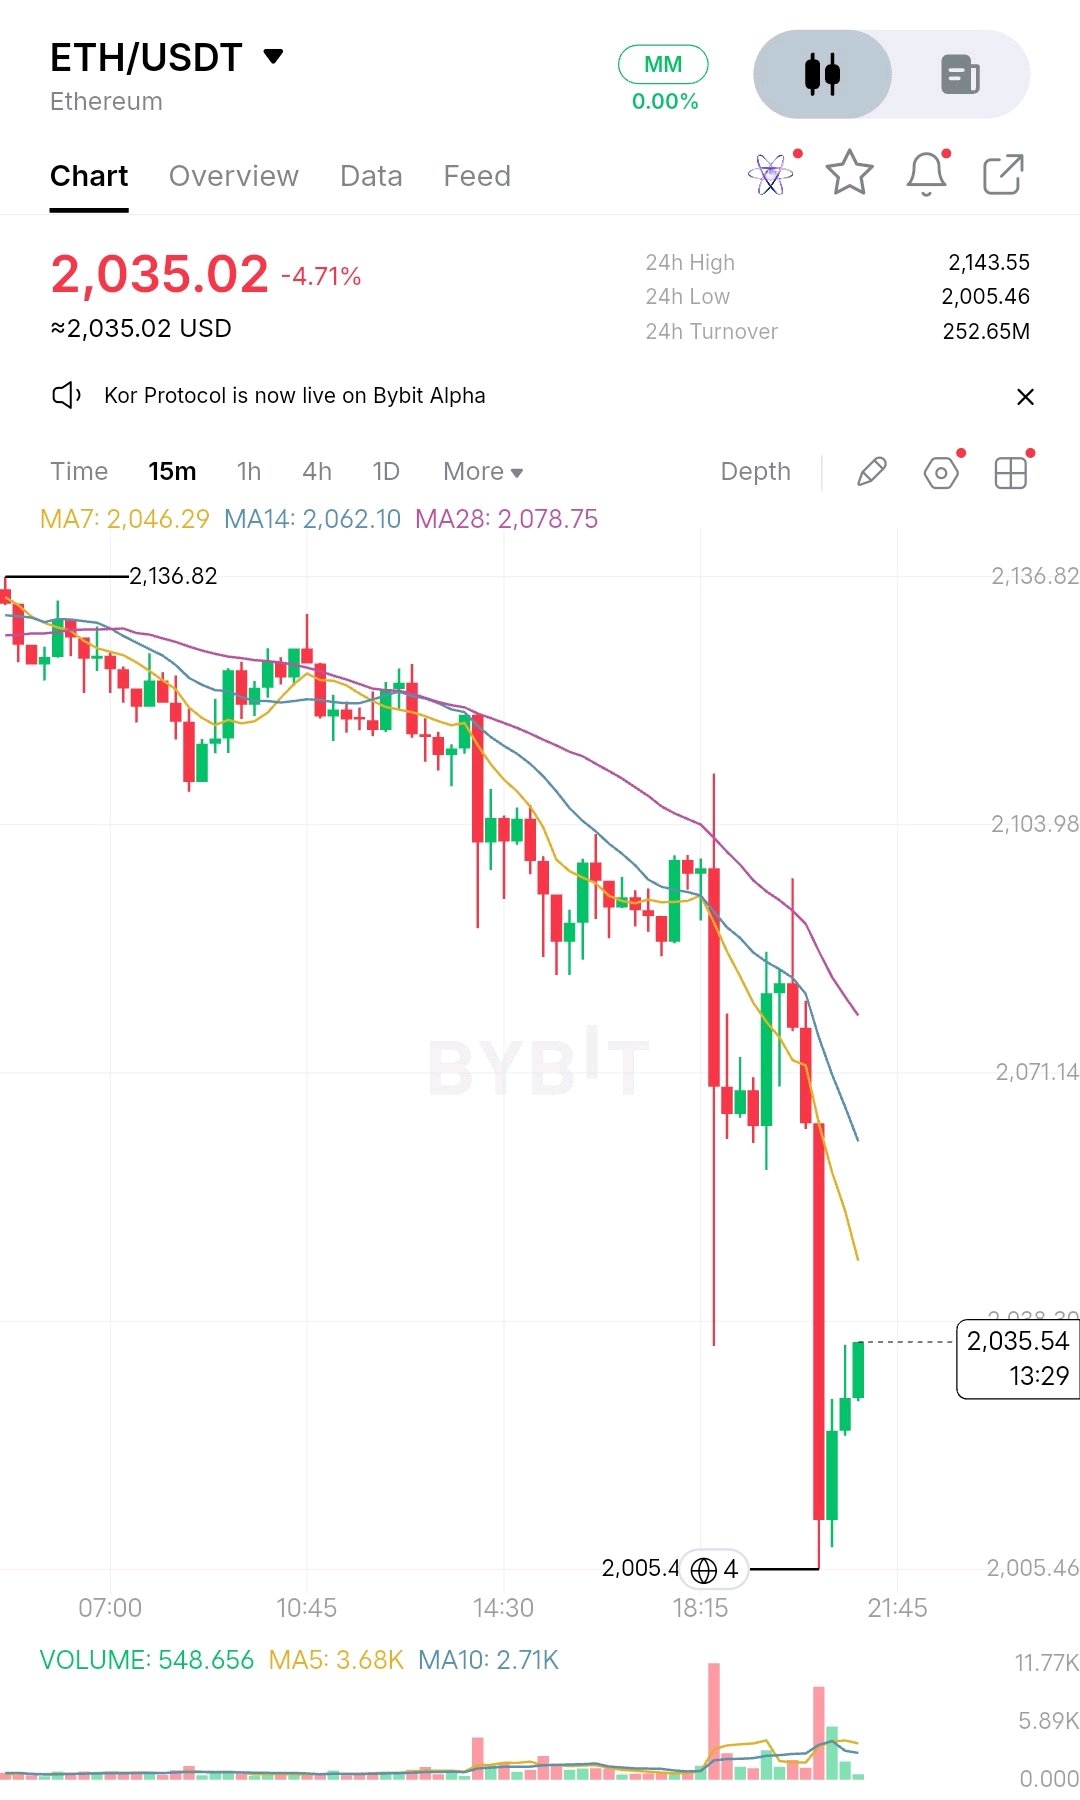
ETH Resistance Test
$ETHUSDT remains under pressure as sellers defend nearby resistance. The $2,046–$2,062 zone is the first major hurdle. EP $2,045–$2,060 Short TP $2,028 $2,015 $2,005 SL $2,072 Bearish momentum remains dominant unless ETH reclaims the resistance zone. Let’s go #WSOT2026 #WSOTPicktoEarn10U #USPayrollsAndRateDecisionsDriveMacroWeek #BybitAIEvolving
BTC Bulls Target $75,300 After Strong Recovery
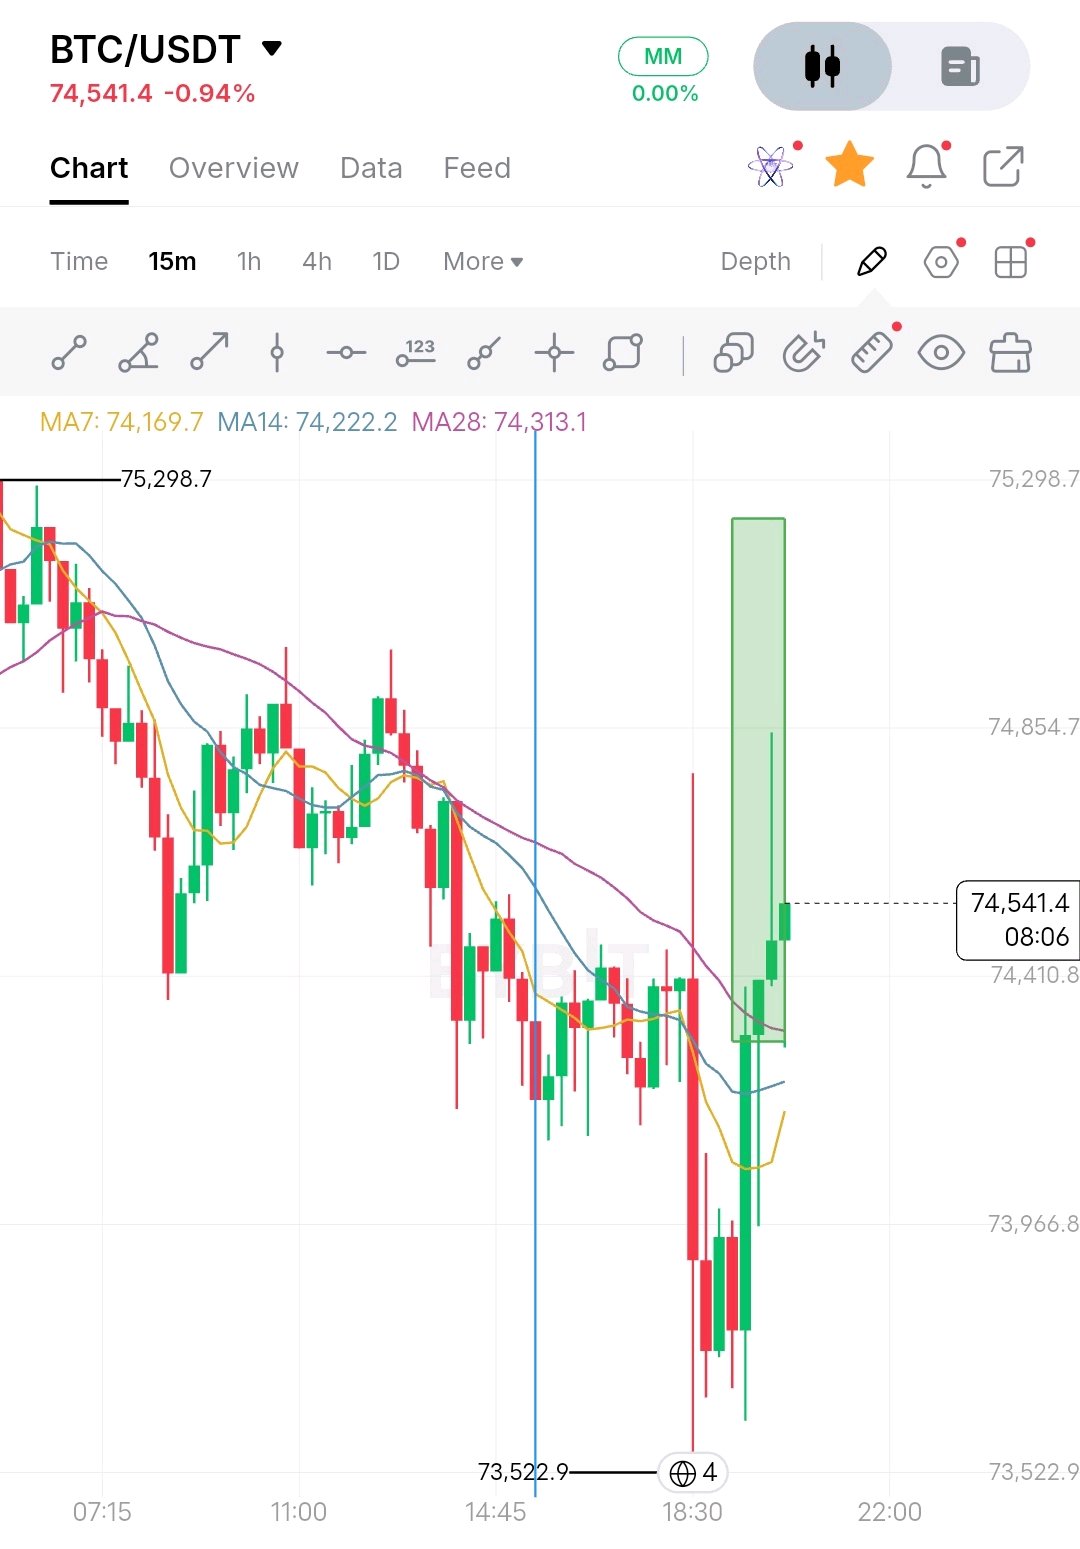
$BTCUSDT /USDT is showing a promising recovery on the 15-minute chart after a sharp downside move. Buyers have stepped in strongly from the $73,520 demand zone, producing consecutive bullish candles and pushing price back above the short-term moving averages. **EP** 74,400 – 74,550 **TP** 74,850 75,000 75,300 **SL** 73,950 **Support:** 74,100 – 73,950 **Resistance:** 74,850 – 75,000 **Demand Zone:** 73,520 – 73,700 BTC is now approaching an important resistance area. A confirmed breakout above $74,850 could strengthen bullish momentum and open the door toward $75,000 and $75,300. However, rejection at resistance could bring another consolidation phase. The key is whether buyers can sustain momentum and reclaim higher levels. Let’s go $BTCUSDC #WSOT2026 #BybitAIEvolving #NovUSCPIWatch
ARB Funding Signals Heavy Short Positioning
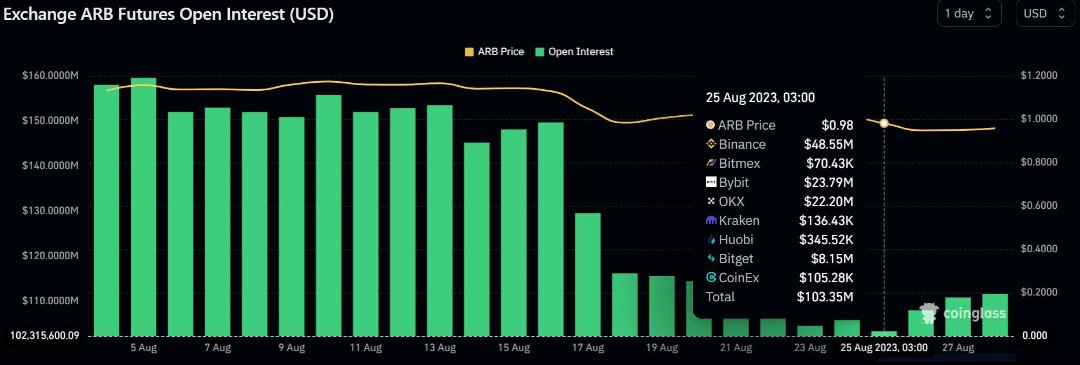
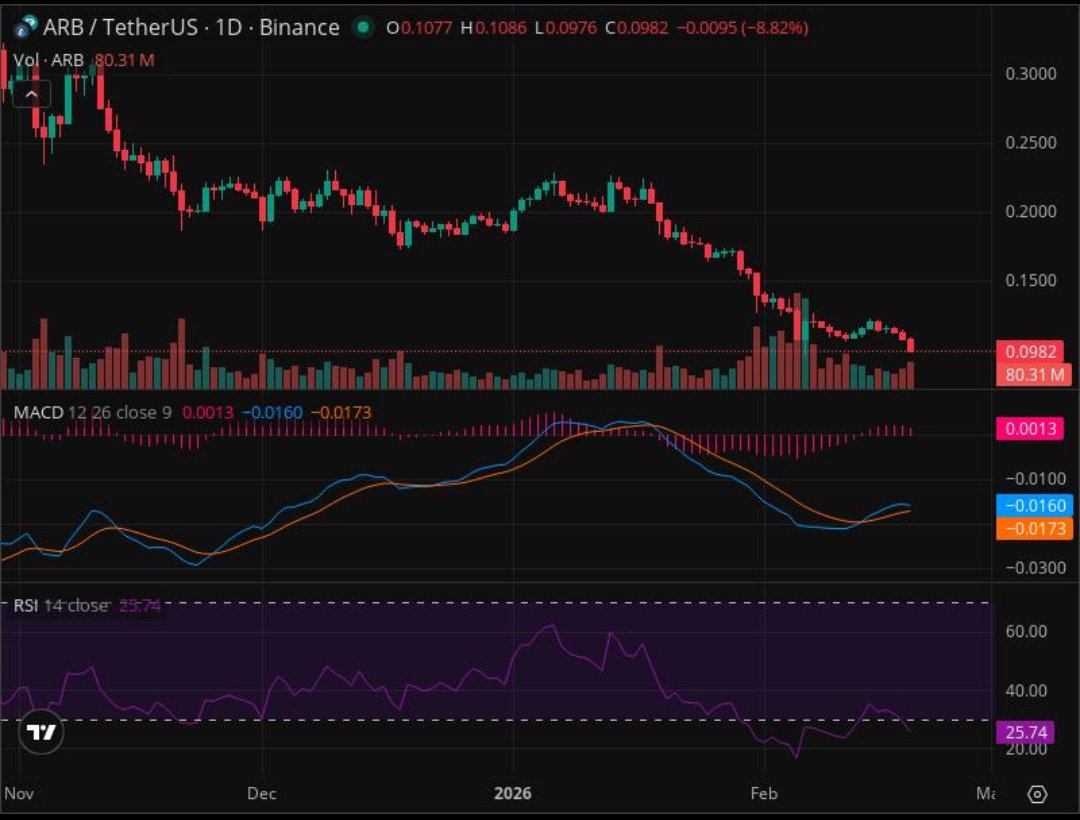
$ARBUSDT ARB is showing a bearish positioning signal in the perpetual futures market. Funding on Binance was approximately **−0.011% per 8 hours**, indicating that short-position holders were paying longs to maintain their positions. The interesting detail is that open interest also declined by 6.1% alongside a 9.7% drop in price over 24 hours. This suggests traders may be closing positions rather than aggressively opening new shorts. Negative funding can indicate crowded bearish positioning, but it does not automatically mean a reversal is coming. If open interest starts rising while funding remains negative, short pressure could intensify. A strong price recovery could put late short sellers under pressure. **Are traders becoming too bearish on ARB?*
ETH Long Liquidations Hit $57 Million
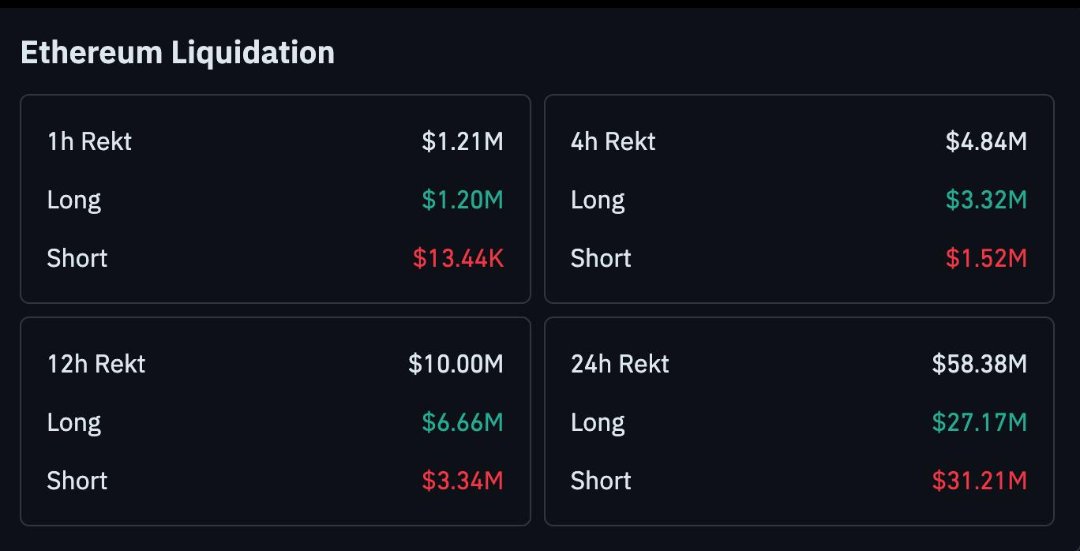
$ETHUSDT Ethereum recorded the largest liquidation volume among major cryptocurrencies in the latest 24-hour market snapshot. Total ETH liquidations reached approximately **$75.7 million**, with $57.1 million coming from long positions and $18.6 million from shorts. The most notable event was a single ETH long liquidation worth approximately **$9.06 million** on November 9 at 07:13 UTC. The interesting detail is that nearly 75% of ETH liquidations came from bullish traders. This suggests leveraged buyers were caught on the wrong side of the move. ETH was down approximately 0.8% during the observed period, adding pressure to long positions. The next important signal is whether ETH can recover its lost ground or whether continued weakness triggers another wave of long liquidations. **Are ETH bulls ready to regain control, or is more leverage about to get wiped out?** #WSOT2026 #WSOTPicktoEarn10U #USPayrollsAndRateDecisionsDriveMacroWeek
Bitcoin Whale Moves $129M Worth of BTC
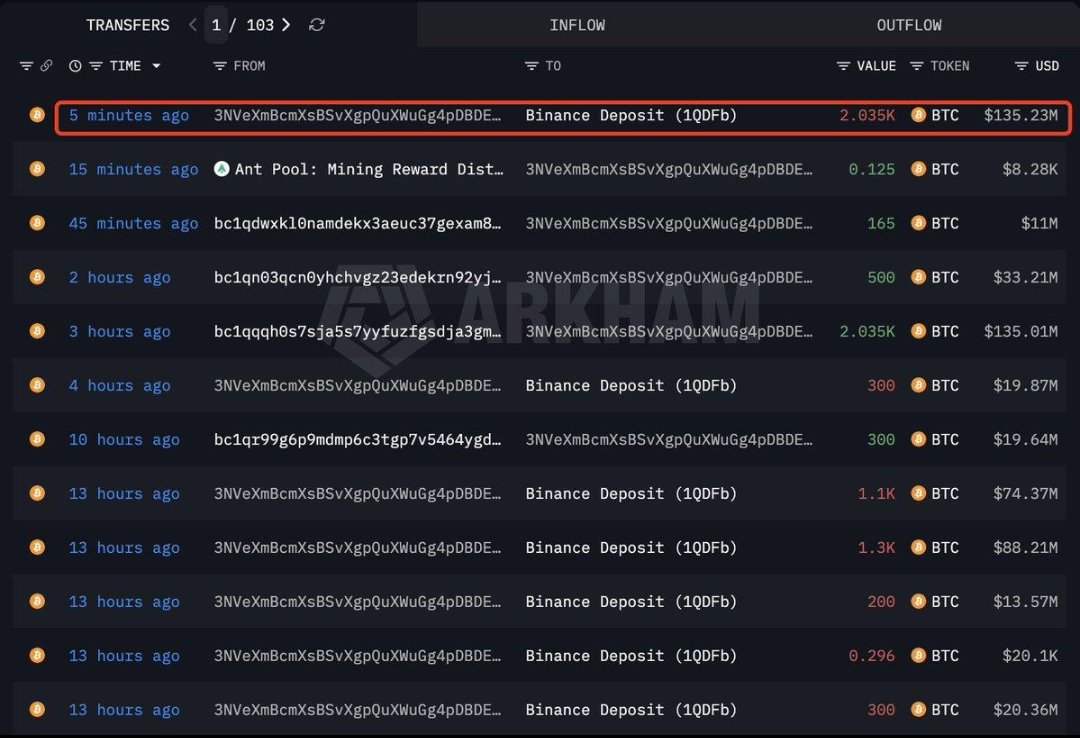
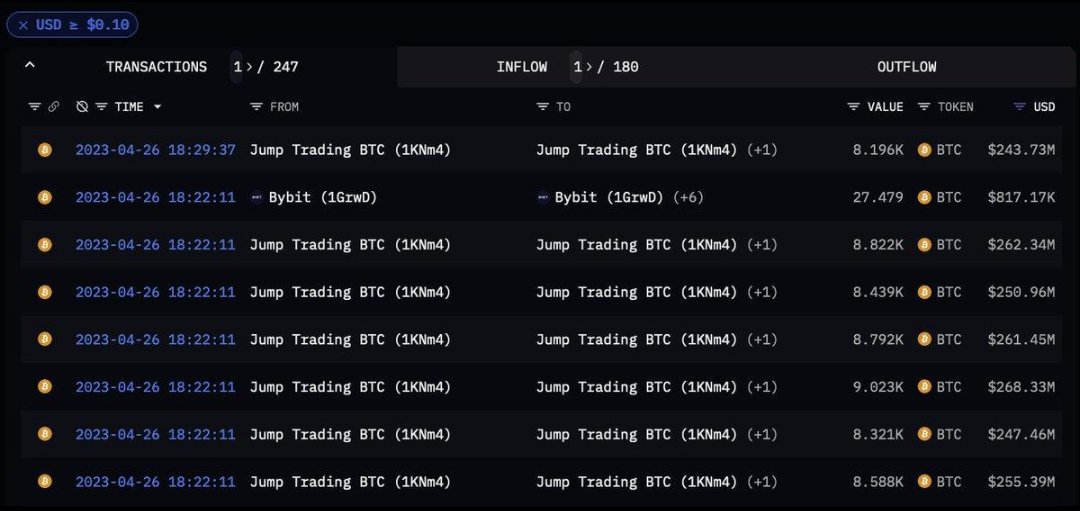
A massive Bitcoin transfer has caught the market's attention. On November 9, approximately 1,745 BTC worth $129.8 million moved into a cryptocurrency exchange. This is a significant amount of Bitcoin entering a platform where it could potentially be sold. The timing makes this movement especially interesting. Bitcoin was trading around $75,248, up approximately 0.7%, meaning the large deposit arrived while price action remained positive. Another detail traders should watch is the reported 24-hour net exchange inflow of approximately 1,738 BTC. This suggests increased potential selling supply. However, an exchange deposit does not automatically mean a sale is coming. If selling pressure increases and BTC struggles to hold support, the market could face additional downside pressure. Strong buying absorption would weaken the bearish interpretation. Is this whale preparing to sell, or simply moving funds for another reason? #WSOT2026 #WSOTPicktoEarn10U #USPayrollsAndRateDecisionsDriveMacroWeek
ETH Long Liquidations Hit $411M
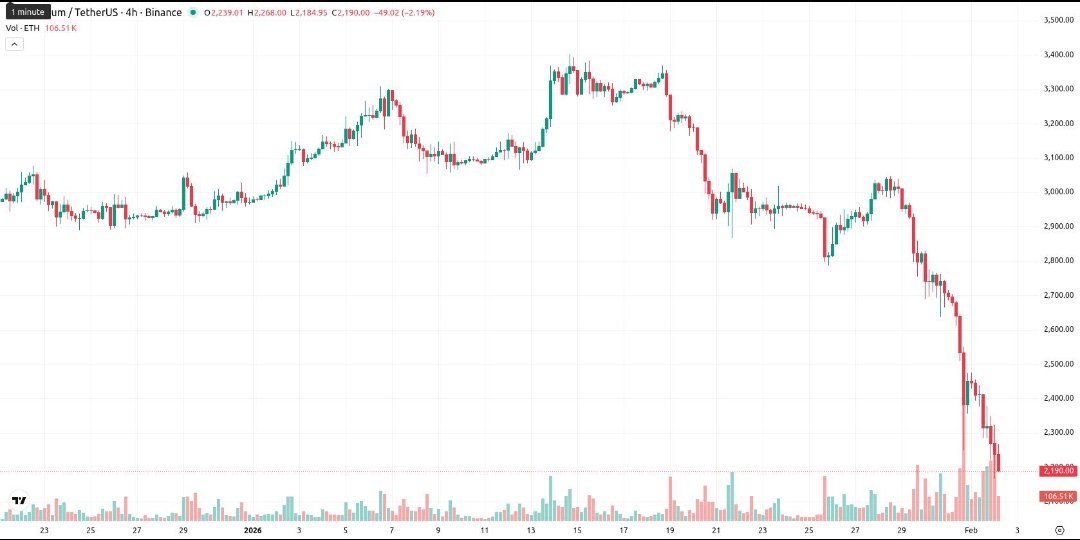
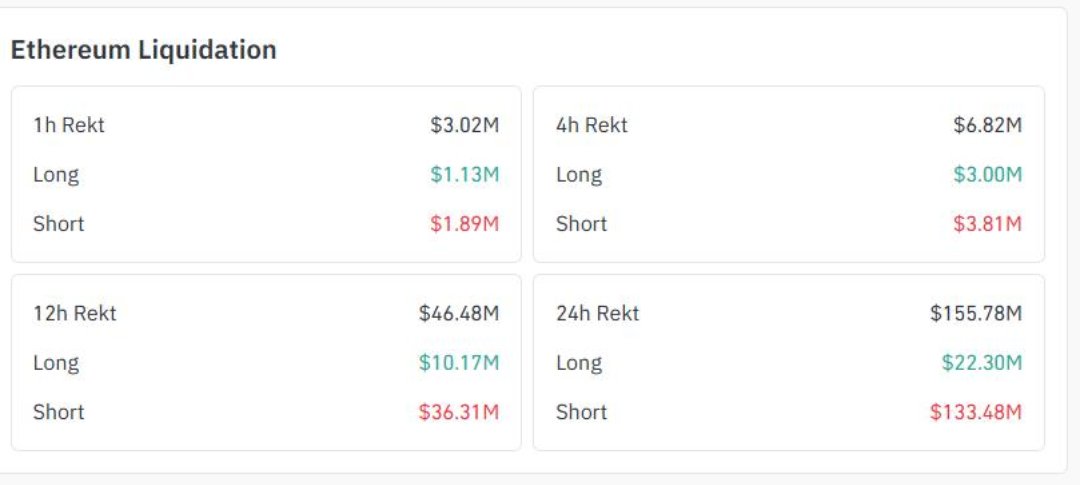
$ETHUSDT Ethereum has become the center of a major liquidation event, and leveraged buyers are taking the hardest hit. Over the 24-hour observation period on November 9, ETH recorded approximately **$445.4 million in total liquidations**, compared with $284.2 million for Bitcoin. The breakdown is even more interesting: - **Long liquidations:** $411.9 million - **Short liquidations:** $33.5 million - **Largest individual liquidation:** $48.2 million ETH long position - **Liquidation venue:** Binance The key detail is that long liquidations overwhelmingly dominated. This suggests excessive bullish leverage was forced out as ETH prices weakened around the $2,150–$2,100 region. Now traders should watch whether ETH can stabilize and reclaim nearby resistance. Continued weakness could expose more leveraged buyers to liquidation. **Is this a healthy leverage reset for Ethereum, or is another wave of selling still ahead?** Based on the previously retrieved market figures. No website names included. Figures are approximate. #WSOT2026 #NovUSCPIWatch
ON Open Interest Surges as Price Explodes
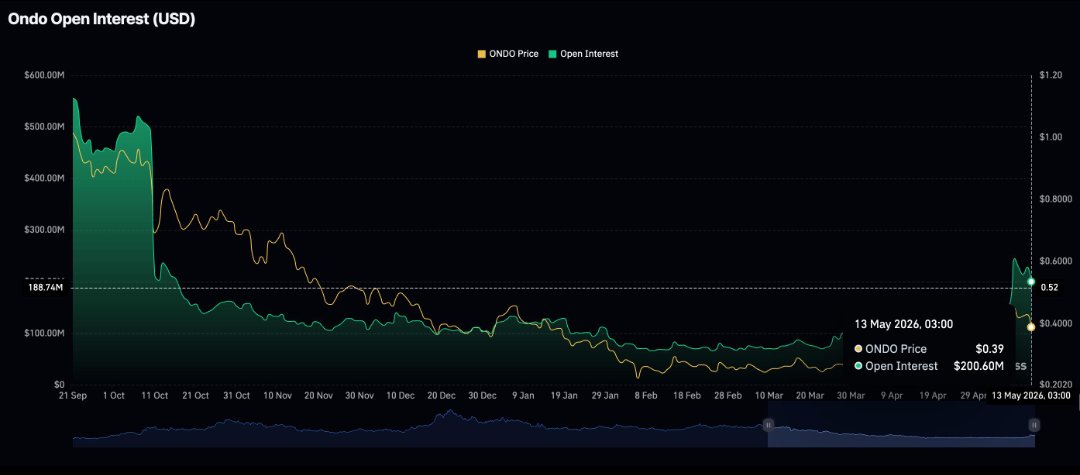
$ONDOUSDT ON is attracting serious attention as futures activity accelerates alongside a powerful price rally. As of November 9, ONUSDT recorded an approximately **35.2% increase in Open Interest over 24 hours**, while its price climbed around **83.86%**. The interesting detail is that both metrics are moving higher together. This suggests fresh leveraged positions are entering the market rather than the rally being driven solely by existing positions closing. However, positive funding of approximately **0.1052% per interval** indicates that long positioning may be getting crowded. If price maintains its strength while Open Interest remains elevated, bullish momentum could continue. But a sudden reversal with declining OI could trigger aggressive position unwinding. **Are traders building a stronger rally, or setting themselves up for a potential long squeeze?** #WSOT2026 #WSOTPicktoEarn10U #NovUSCPIWatch