xero_axc
8614Me gusta11Compartir en el chat438Aficionados66Seguir
crypto enthusiast| psychology first🧠 profit follows🙂 ~art of Trading
crypto enthusiast| psychology first🧠 profit follows🙂 ~art of Trading
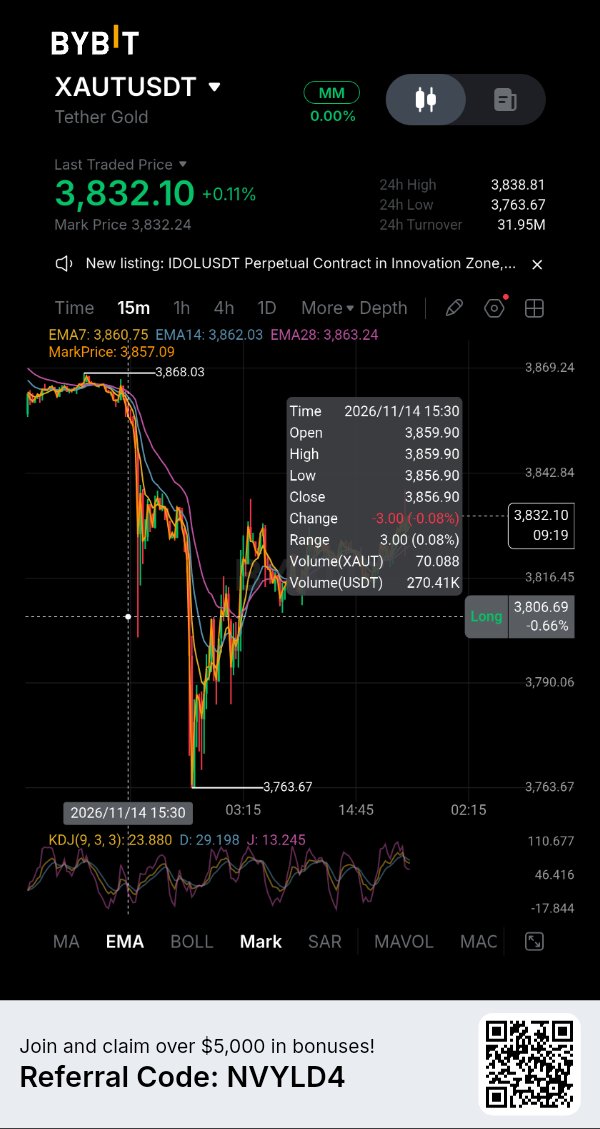
XAUT: La apuesta del oro como activo refugio está bajo presión
Tether Gold enfrenta una prueba mientras los inversionistas reevalúan las tasas de interés de EE. UU. El oro al contado cerró el viernes cerca de los $3,880 por onza tras caer alrededor de un 4.5% en la semana, su mayor descenso semanal desde principios de junio. Una breve recuperación tras una inflación al productor más moderada hizo poco por revertir la venta masiva del 3% del jueves. La presión proviene de la política monetaria. Los detalles de la inflación al consumidor y los precios al productor de EE. UU. han mantenido vivas las expectativas de alza de tasas, mientras que el rendimiento del Tesoro a 10 años ha superado el 5%. El funcionario de la Fed, Jeff Schmid, dijo el 15 de noviembre que la inflación se mantiene por encima del objetivo del 2%. Los rendimientos más altos aumentan el costo de oportunidad de mantener oro, que no paga intereses. Eso ayuda a explicar por qué la incertidumbre geopolítica no ha protegido al lingote de la venta. El perpetuo $XAUTUSDT de Bybit cotizaba cerca de los $3,823, una baja de aproximadamente el 1% en 24 horas según la última instantánea de datos de intercambio. Su volumen de contrato en 24 horas fue de alrededor de $43.36 millones, con una tasa de financiación del +0.0012% por período de cuatro horas. Una tasa de financiación positiva significa que los compradores (longs) están pagando a los vendedores (shorts), pero la tasa es modesta y no prueba una sobreexposición de posiciones largas. Los precios de los perpetuos también pueden diferir de las referencias del oro al contado debido a los horarios de negociación, la liquidez y la fijación de precios de los contratos. Hay un avance separado que vale la pena observar más allá del gráfico. El informe de reservas de Tether del 30 de septiembre indica que 827,417.63 XAUT estaban en circulación, respaldados por el mismo número de onzas troy finas bajo custodia. Eso representaba unas 25.7 toneladas de oro. El 11 de noviembre, Anchorage anunció servicios de custodia, trading y colateral institucional para clientes elegibles que posean XAUT. La expansión podría mejorar el acceso institucional, pero no hace que todos los poseedores de tokens sean elegibles para el canje directo con el emisor ni garantiza liquidez inmediata en efectivo. Por ahora, la dirección de XAUT sigue ligada a la respuesta del oro ante los rendimientos y el dólar. Un movimiento sostenido de vuelta por encima de los $3,900 en el lingote ayudaría a estabilizar el sentimiento; otra ruptura a la baja mantendría la presión sobre el token. La historia del acceso institucional está desarrollándose, pero no ha cancelado el riesgo macro. Preguntas clave: 1. ¿Puede el oro recuperar los $3,900 mientras los rendimientos del Tesoro se mantienen elevados? 2. ¿El acceso institucional se traducirá en una liquidez de XAUT más profunda y confiable? 3. ¿Es la caída actual una corrección o el comienzo de una revalorización más larga del oro? $IMPACTbyTrade

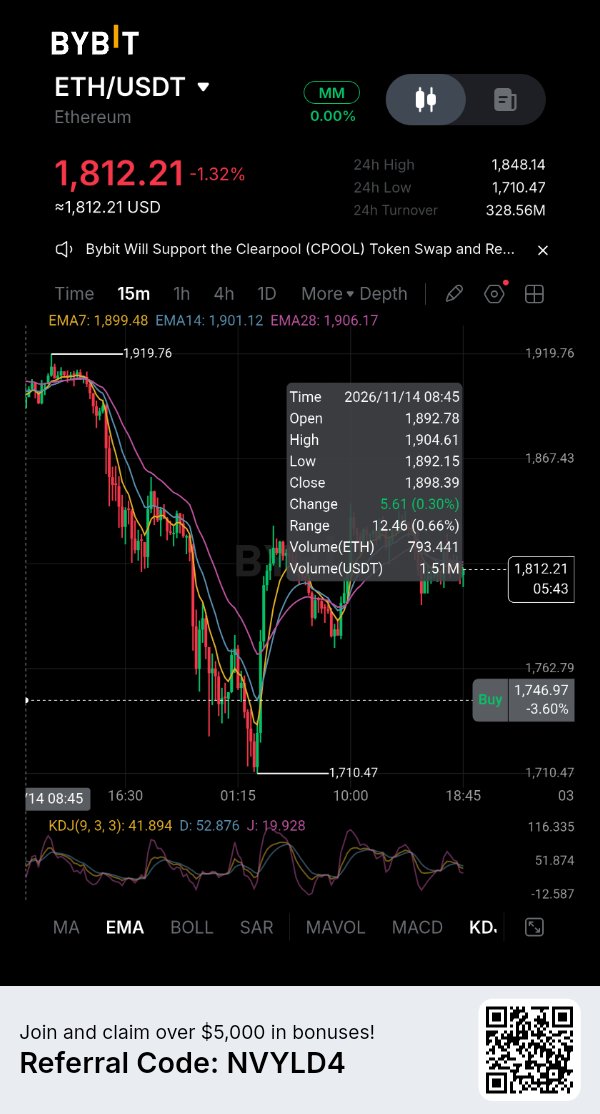
ETH: The Leverage Reset Is Incomplete
Ethereum is still trading under pressure after last week’s sharp liquidation cycle. The latest CoinGlass snapshot puts $ETHUSDT near $1,816.60, down 1.32% over 24 hours and 14.35% over seven days. The day’s range has stretched from $1,710 to $1,857.60. Buyers have defended the low, but have not reclaimed the upper end with conviction. Derivatives data show that some leverage has left, although the process is not finished. Aggregate ETH futures open interest stands near $21.90 billion, down 3.02% over 24 hours. At the same time, tracked liquidations reached about $360.82 million, with $279.74 million coming from long positions. Falling price alongside lower open interest points to positions being closed or liquidated, not necessarily new shorts entering. Bybit’s $ETHUSDC perpetual offers a useful cross-check. Its open interest is around $1.36 billion, down 2.55% over 24 hours, while the funding rate is approximately −0.0047% per eight-hour period. Negative funding means shorts are paying longs, suggesting the perpetual market is trading with a bearish premium. Bybit recorded roughly $37.13 million in ETH liquidations over the same 24-hour window, heavily skewed toward longs at $33.32 million versus $3.81 million in shorts. Exposure is falling, but longs are still being forced out. The imbalance between derivatives and spot activity is another warning. CoinGlass reports roughly $64.45 billion in ETH futures volume against $4.48 billion in spot volume, a ratio of about 14.4 to one. This suggests short-term moves may be driven more by leverage than durable spot accumulation. The latest US spot ETH ETF reading was a modest $2.30 million net inflow on November 13; too little to establish a sustained demand trend. For ETH to build a credible recovery, the evidence needs to improve beyond a bounce from the $1,710 area. Spot participation should strengthen, open interest should stabilise without funding becoming aggressively positive, and price should hold above the recent intraday recovery zone. If price slips back toward the low while long liquidations remain dominant, the reset may still be working through the market. Key questions: 1. Can ETH hold above the $1,710–$1,800 area after the latest liquidation wave? 2. Will spot volume expand enough to support a recovery beyond derivatives trading? 3. Does falling open interest signal a healthier reduction in leverage, or simply another stage of forced exits? #IMPACTbyTrade

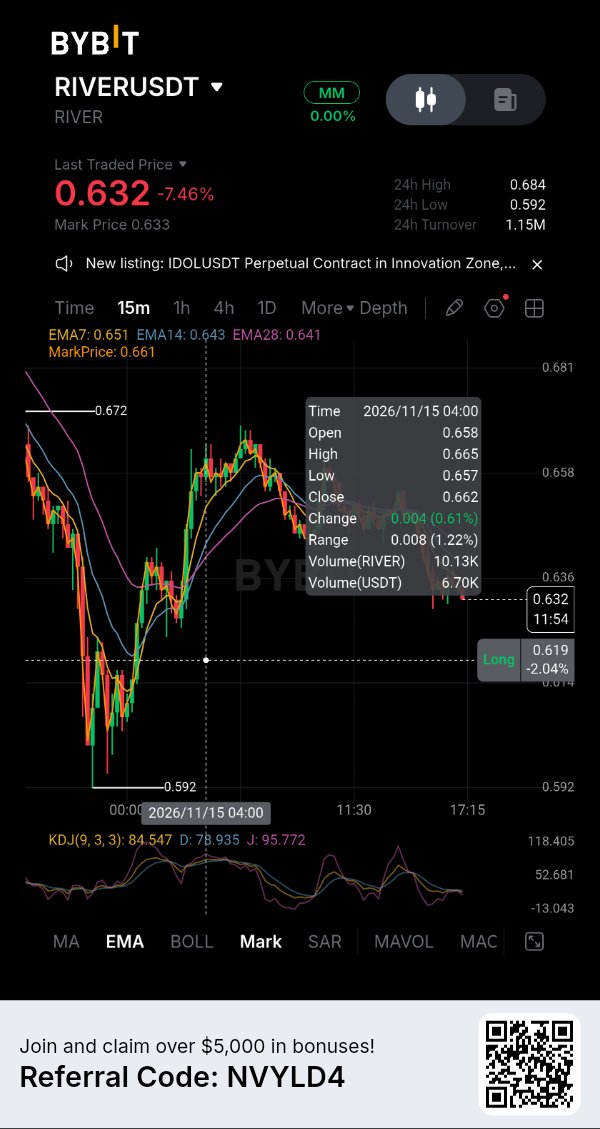
RIVER: A Thin Spot Market Meets Heavy Leverage
RIVER is experiencing a sharp decline, but the more concerning development is the gap between derivatives activity and actual spot demand. The token is attracting substantial futures turnover while its spot market remains relatively thin. That imbalance can amplify price movements in either direction, particularly when leveraged traders begin closing positions. RIVER trades near $0.65, down approximately 9% over 24 hours and 12.7% over seven days. Its market capitalisation is around $24.1 million, against a fully diluted valuation of approximately $65 million. Only 37.19 million of the maximum 100 million tokens are circulating. The token is also more than 99% below its January all-time high of $87.79. This decline makes valuation comparisons difficult, but the circulating supply figure remains important when assessing future distribution. CoinGlass records approximately $29 million in futures volume against just $568,000 in spot volume. Futures turnover is therefore about 51 times spot activity. Open interest stands near $11.9 million, equivalent to roughly 49% of market capitalisation, after falling 13.46% in 24 hours. Liquidations reached approximately $448,000, with longs accounting for 95%. The combination of falling price and falling open interest points to long unwinding rather than a straightforward increase in new short positions. Funding remains positive at approximately 0.0089% per eight hours. Longs are still paying shorts to maintain their positions, even as price declines. This does not prove that bullish traders are overcrowded, but it shows that positive funding has not prevented further selling. On Bybit, RIVER futures volume is around $1.46 million, while open interest is approximately $1.8 million in the latest exchange snapshot. Supply deserves attention as well. DefiLlama's unlock tracker shows no upcoming cliff unlock before March 23, 2027, when one million RIVER tokens are scheduled for release. However, the project has continuous weekly releases estimated at approximately 313,300 tokens. That is a recurring supply consideration, not a single imminent unlock event. RIVER's immediate challenge is attracting genuine spot demand while derivatives exposure contracts. A rebound driven mainly by futures positioning may struggle to hold. Until spot participation improves, the market remains vulnerable to another leveraged unwind. Key questions: 1. Can RIVER attract spot buyers while futures activity dominates? 2. Will declining open interest reduce liquidation risk or accompany further weakness? 3. How will continuous token releases affect demand as circulating supply expands? $DRIFTUSDT #IMPACTbyTrade

HYPE: Un 'short squeeze' no es una recuperación
$HYPEUSDT ha rebotado desde su mínimo del 14 de noviembre, pero la recuperación se enfrenta a una prueba más difícil: ¿pueden los compradores mantener el movimiento después de uno de los eventos de liquidación más grandes del mercado recientemente? El rebote inicial es alentador, sin embargo, la actividad de derivados sugiere que el mercado sigue dominado por el trading con apalancamiento en lugar de una acumulación al contado confirmada. CoinGlass sitúa a HYPE cerca de los $68.20, un alza del 0.63% en 24 horas, pero aún un 8.19% por debajo en siete días. El token permanece aproximadamente un 30.4% por debajo de su máximo histórico de septiembre de $97.98. Su último rango de 24 horas va de $60.01 a $69.00. Recuperarse desde el extremo inferior de ese rango muestra que los compradores han intervenido, pero recuperar terreno perdido es distinto a establecer una nueva tendencia alcista. Las cifras de liquidación explican la gravedad del descenso anterior. Aproximadamente $86.27 millones en posiciones de HYPE fueron liquidadas en 24 horas, incluidos $84 millones en posiciones largas. El interés abierto se mantiene alrededor de los $3.02 mil millones, una baja de apenas menos del 1% durante el mismo periodo. Esto indica que el shock de liquidación eliminó una exposición alcista sustancial, aunque persiste una considerable actividad de derivados. Un rebote de precio tras una venta forzosa puede reflejar el cierre de posiciones cortas, pero no significa necesariamente que esté entrando capital fresco al mercado. Un desequilibrio merece atención: el volumen de futuros alcanzó aproximadamente $4.62 mil millones, en comparación con los $464.1 millones en volumen al contado. El volumen de negociación de derivados fue aproximadamente diez veces la actividad al contado. Esa brecha hace que la recuperación sea más difícil de confiar porque los traders apalancados pueden mover los precios rápidamente sin una demanda equivalente del token subyacente. El 'funding' también cuenta dos historias distintas. La tasa ponderada agregada es positiva en 0.0071% cada ocho horas, mientras que el funding de Hyperliquid es negativo a una tasa anualizada del 5.7%. La tasa de Bybit es positiva en aproximadamente un 10.6% anualizado. Estas diferencias muestran que el posicionamiento no es uniforme en todos los exchanges. Un trader que solo lea el funding agregado podría pasar por alto la presión bajista que se está gestando en Hyperliquid. HYPE ahora necesita mantener el área de $64–65 y superar los $70–72 con una participación al contado más fuerte. Si no logra sostener el rebote, podría exponer al mercado a otro descenso impulsado por liquidaciones. La distinción es importante: un 'short squeeze' puede acelerar una recuperación, pero solo una compra persistente puede hacerla duradera. Preguntas clave: 1. ¿Puede HYPE reclamar los $72 con un volumen al contado que confirme el movimiento? 2. ¿Se reconstruirá el interés abierto a través de una demanda genuina o mediante nuevo apalancamiento? 3. ¿Es el rebote un cambio en la dirección del mercado o un alivio temporal tras liquidaciones forzosas? IMPACTbyTrade

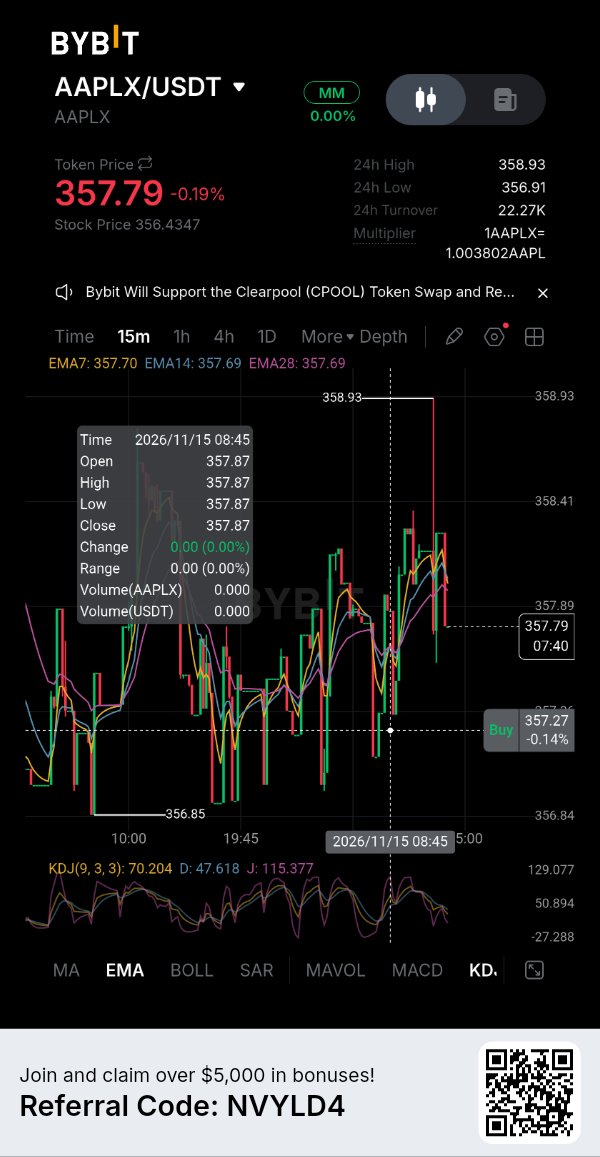
AAPLX: Apple Exposure Meets a Liquidity Test
Apple's latest stock-market performance looks relatively stable, but its tokenised counterpart raises a different question: how efficiently can crypto traders access that exposure when the underlying equity market is closed? $AAPLXUSDT was recently quoted around $357.24 on Bybit, while Apple's official November 13 Nasdaq closing price was $356.27. That is a difference of roughly 0.27%, suggesting close price alignment in this snapshot. Apple shares gained 0.39% during Friday's session, closing at $356.27 after reaching an intraday high of $360.83. The underlying stock remains near its 52-week high, which makes the quality of tokenised price tracking particularly relevant. The liquidity picture is less impressive. CoinGecko's Bybit market snapshot records approximately $37,853 in 24-hour AAPLX/USDT volume, with a 0.04% spread. Order-book depth within 2% of the market price stands near $190,694 on the bid side and $202,872 on the ask side. These figures suggest a relatively tight quoted market, but limited turnover compared with Apple's traditional equity market, where Friday's trading volume reached approximately 40 million shares. That difference matters when larger orders enter. A narrow quoted spread does not guarantee that substantial trades can execute without moving the price. Traders should distinguish displayed liquidity from actual trading activity, particularly when crypto-market volatility rises or the underlying Nasdaq market is unavailable. AAPLX is issued under the xStocks framework and designed to track Apple shares through a tokenised structure backed by underlying stock held through custodians. However, owning AAPLX is not equivalent to holding Apple shares directly. Token holders receive economic price exposure, not shareholder voting rights. Issuance, redemption and other product terms also introduce considerations that ordinary stock-market investors may not face. The next test is whether AAPLX can attract deeper, more consistent liquidity without losing alignment with AAPL. Its appeal is access to equity exposure through crypto infrastructure. Its weakness is that access means little if execution becomes expensive during volatile periods. Key questions: 1. Can AAPLX maintain close tracking when Nasdaq is closed? 2. Will Bybit's spot liquidity deepen as tokenised equity demand grows? 3. Does convenience justify the additional market-structure and execution risks? #IMPACTbyTrade

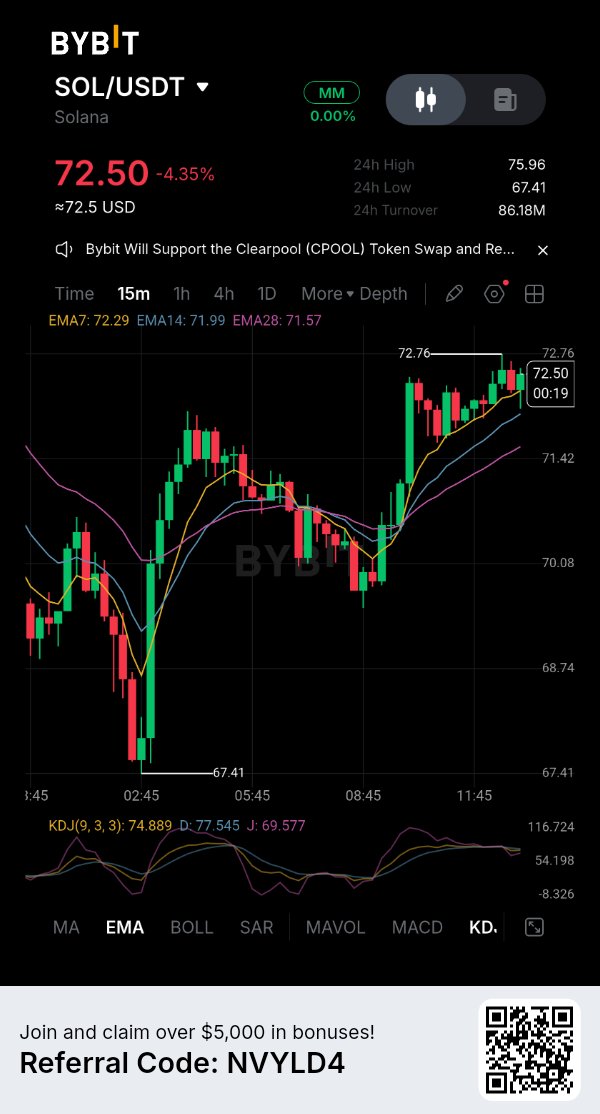
SOL: The Rebound Has a Positioning Problem
Solana is attempting to stabilise after a sharp decline, but derivatives data suggests the market has not completed its adjustment. The important question is whether buyers are returning to accumulate $SOLUSDT or simply trading short-term volatility while leveraged positions continue to unwind. SOL is trading near $71.81, down 5.29% over 24 hours. Its market capitalisation is approximately $42.71 billion, leaving it about 75.6% below its all-time high of $294.33. The 24-hour range stretches from $67.35 to $76.01, showing how much volatility remains. A recovery from the intraday low is encouraging, but it does not establish a reversal. The derivatives market provides a clearer picture of the pressure. Aggregate open interest has fallen 8.63% to approximately $4.12 billion, while futures volume has climbed nearly 60% to $10.95 billion. CoinGlass records $89.43 million in liquidations over 24 hours, with longs accounting for 89%. This combination points to substantial long-position unwinding. Traders are closing or losing leveraged exposure, but the reduction in open interest has not yet produced sustained price stability. Funding is also negative at approximately -0.0054% across exchanges. Bybit's SOLUSDT funding rate is around -0.0023% per eight hours. Negative funding means shorts are paying longs, indicating that bearish positioning has become more expensive. However, this alone does not guarantee a short squeeze. If spot demand remains weak, sellers can maintain control despite the cost of holding short positions. The spot-versus-futures divergence is particularly important. Futures recorded approximately $13.1 million in net taker buying over the latest 24-hour window, while spot registered roughly $9.1 million in net taker selling. That suggests derivatives traders are attempting to position for a bounce without equivalent buying pressure in the underlying asset. Over seven days, both markets still show net selling. A futures-led recovery therefore needs confirmation from spot activity. SOL's immediate test is whether it can hold the $67 area and reclaim $76 with stronger spot participation. Losing the recent low would expose the market to another round of forced selling. Until spot flows improve, declining open interest should be treated as evidence of deleveraging, not proof that the bottom is in. Key questions: 1. Can SOL reclaim $76 with genuine spot demand? 2. Will negative funding trigger short covering or reflect continued bearish conviction? 3. Has the latest liquidation wave removed enough leverage to stabilise the market? $SOLUSDC #IMPACTbyTrade

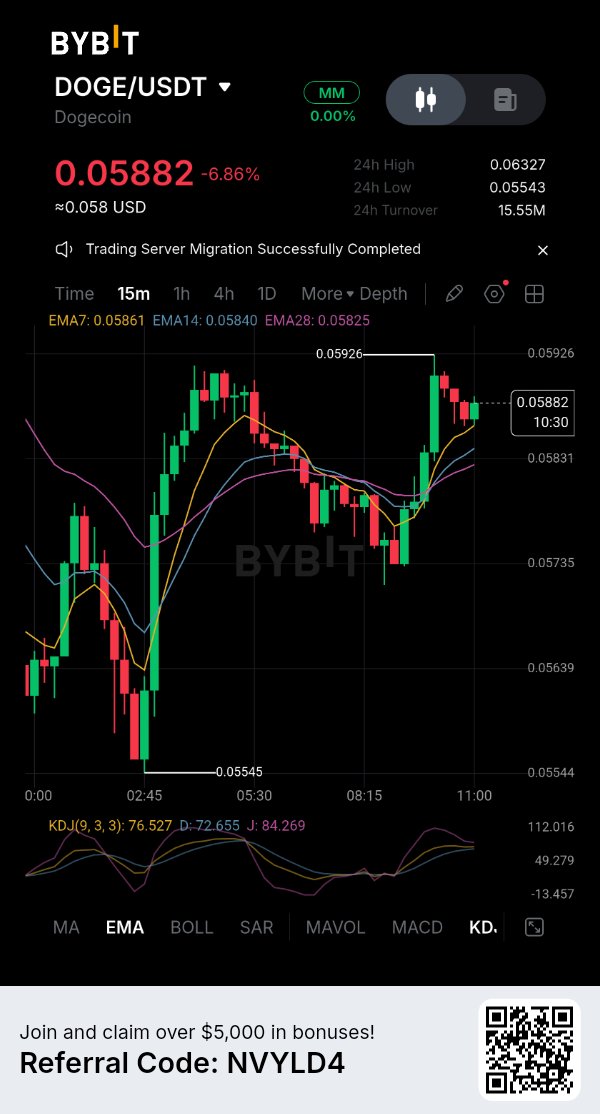
DOGE: Oversold Does Not Mean Ready to Recover
Dogecoin is showing one of the conditions traders often look for before a rebound: an extremely oversold daily RSI. But the derivatives market raises a different concern. Even after a steep decline and another round of long liquidations, Bybit positioning remains heavily tilted toward buyers. That leaves the recovery vulnerable if fresh demand does not arrive. $DOGEUSDT is trading near $0.0575, down 8.44% over 24 hours and 19.8% over seven days. Its market capitalisation is approximately $8.99 billion. The latest daily RSI reading is 19.6, while the 24-hour trading range extends from $0.0554 to $0.0633. An RSI this low signals intense selling momentum, but it does not establish that the price has reached a bottom. Oversold markets can remain oversold while sellers continue to dominate. Bybit's DOGEUSDT perpetual data shows approximately $72.73 million in open interest. Around 79.11% of accounts holding positions are long, compared with 20.89% short. This is an account ratio, not a measure of the actual capital on each side, but the imbalance is still worth monitoring. Over the latest reported 24-hour window, Bybit recorded about $2.73 million in DOGE liquidations, approximately $2.66 million of which came from longs. The market is removing bullish positions, yet the remaining account distribution is still crowded toward longs. Funding on Bybit is slightly positive at 0.001595%, meaning longs are paying shorts. The rate is not extreme by itself. The more important combination is the persistent long-account majority, recent long liquidations and a price still nearly 20% lower over seven days. If DOGE loses the $0.055 area, another wave of forced selling could follow. A sustained move back above $0.063 would be an early sign that buyers are regaining control, although volume and positioning would need to confirm it. The distinction is between a technical bounce and a change in market structure. DOGE may be oversold, but a durable recovery needs spot demand strong enough to absorb supply and prevent another leveraged unwind. Until that happens, low RSI is a warning about selling pressure, not a reliable buy signal. Key questions: 1. Can DOGE hold the $0.055 support area? 2. Will spot buyers confirm the oversold rebound? 3. Can long positioning decline without triggering another liquidation wave? $DOGEUSDC #IMPACTbyTrade

BTC: The Sell-Off Has Outlasted the Reset
Bitcoin's decline below $64,000 changes the conversation. The market has already absorbed substantial liquidations, yet selling pressure has continued. That raises a more important question than whether leveraged traders have been flushed: where is the spot demand needed to absorb the remaining supply? CoinGlass puts $BTCUSDT near $63,633 in its November 15 snapshot, down 6.71% over 24 hours and almost 50% below its October all-time high of $126,198. Market capitalisation has fallen to approximately $1.28 trillion. The 24-hour liquidation figure stands at $683.56 million, with longs accounting for 92%. Open interest has dropped 7.66% to $43.32 billion. Leverage is clearly being removed, but the price decline shows that this reduction has not yet produced a stable floor. The spot market offers little reassurance. CoinGlass records approximately $8.51 billion in spot volume against $95 billion in futures volume. Both markets show net taker selling over the latest 24-hour period: approximately $338 million in spot and $947 million in futures. The distinction matters because a futures-led rebound can develop without sustained accumulation of actual BTC. Buyers need to absorb available supply, not merely push derivatives prices higher. Institutional flows remain another source of pressure. US spot Bitcoin ETFs recorded $185.4 million in net outflows on November 13. Across November 9–13, withdrawals reached approximately $1.065 billion, marking seven consecutive trading sessions of outflows. The weekend has no new US ETF trading session, so Friday's figure remains the latest completed daily reading. Persistent redemptions do not guarantee further price declines, but they leave the market without a consistent institutional buying signal. There is also a warning in the open-interest figures. Falling open interest alongside falling prices suggests deleveraging, but it does not tell us that sellers are exhausted. Some positions have been closed while fresh selling continues. Bitcoin's next meaningful test is whether it can defend the recent $63,000 area and reclaim $65,000 with improving spot flows. A break lower would keep the market exposed to another round of forced liquidations. The leverage reset has happened in stages. What remains unproven is demand. Until spot buying strengthens and ETF flows turn positive, a recovery may be another temporary pause in a broader distribution phase. Key questions: 1. Can BTC defend $63,000 after another major liquidation wave? 2. When will spot demand begin absorbing the supply being sold? 3. Will ETF outflows reverse before Bitcoin attempts a sustained recovery? $BTCUSDC #IMPACTbyTrade
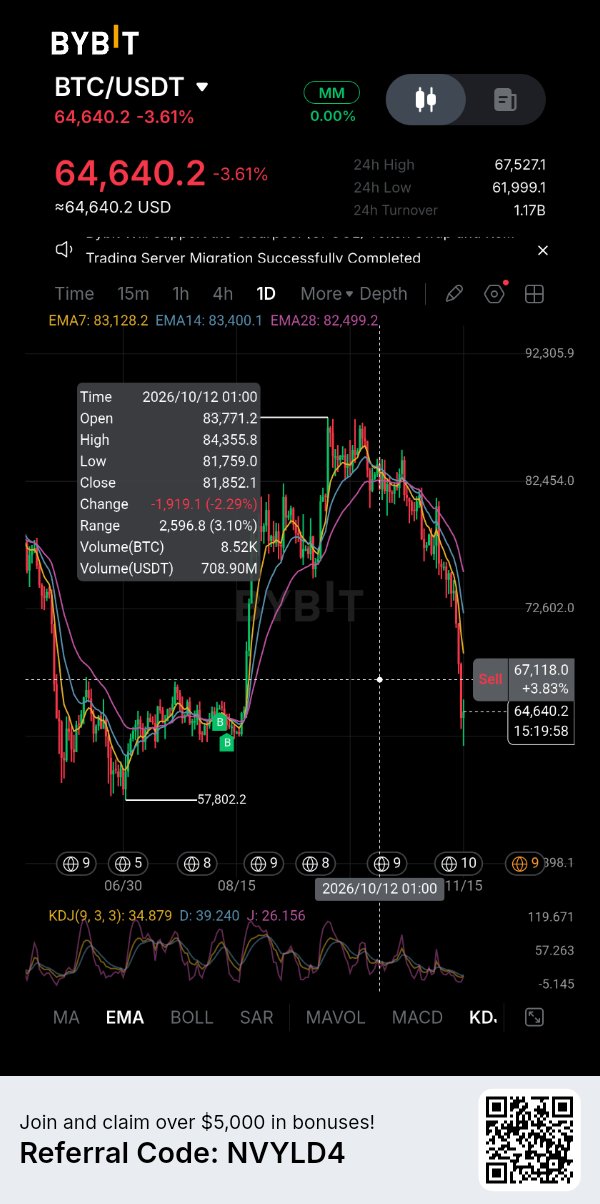
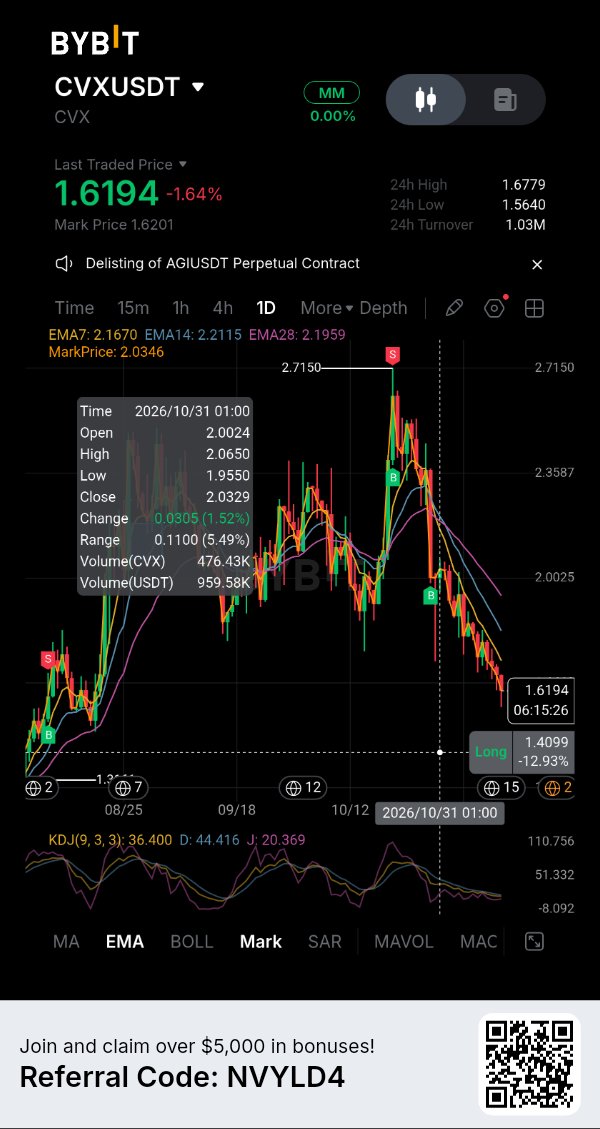
CVX: DeFi Influence Has a Token-Value Problem
Convex Finance still controls a meaningful position in DeFi, but CVX holders have a harder question to answer: how much of that protocol activity actually translates into demand for the token? CVX is trading around $1.59, down roughly 12.6% over seven days and more than 97% below its January 2022 peak. Its market capitalisation is approximately $158 million, with circulating supply already close to the 100 million maximum. This leaves little room for a future supply expansion narrative, but scarcity alone does not create buying pressure. The protocol's underlying figures are more substantial. DefiLlama reports approximately $460.45 million in total value locked, with $1.81 million in fees generated over the past 30 days. Reported protocol revenue over that period was about $598,604. These figures show that Convex continues to facilitate meaningful activity, although TVL is not equivalent to revenue and neither figure guarantees token appreciation. CVX's role is primarily governance and incentive coordination. Locking the token gives holders voting influence over emissions directed across Curve, Frax and other supported protocols. Convex's dashboard reports 45.8 million CVX locked and approximately $466,700 in emissions controlled over a 14-day period. That influence has economic relevance, but it is different from giving every CVX holder a direct claim on the protocol's entire revenue stream. Derivatives positioning adds another layer. CoinGlass puts aggregate futures volume near $5.2 million against $1.76 million in spot volume, while open interest sits around $7 million. Its latest snapshot shows price weakness alongside slightly rising open interest, a possible short build-up rather than evidence of a confirmed reversal. Funding readings vary across exchanges: the aggregate rate is slightly negative, while Bybit's reported rate is positive. These should not be treated as interchangeable signals. For CVX, a recovery needs more than a temporary short squeeze. Improving spot demand, sustained protocol revenue and evidence that governance influence creates stronger value capture would make the case more convincing. Until then, Convex's importance to DeFi and the market's willingness to pay for CVX remain two separate questions. Key questions: 1. Can Convex's protocol revenue translate into stronger value for CVX holders? 2. Will spot demand return while derivatives positioning remains elevated? 3. Is CVX undervalued infrastructure exposure, or is its governance utility already priced in? $SOLUSDT #IMPACTbyTrade
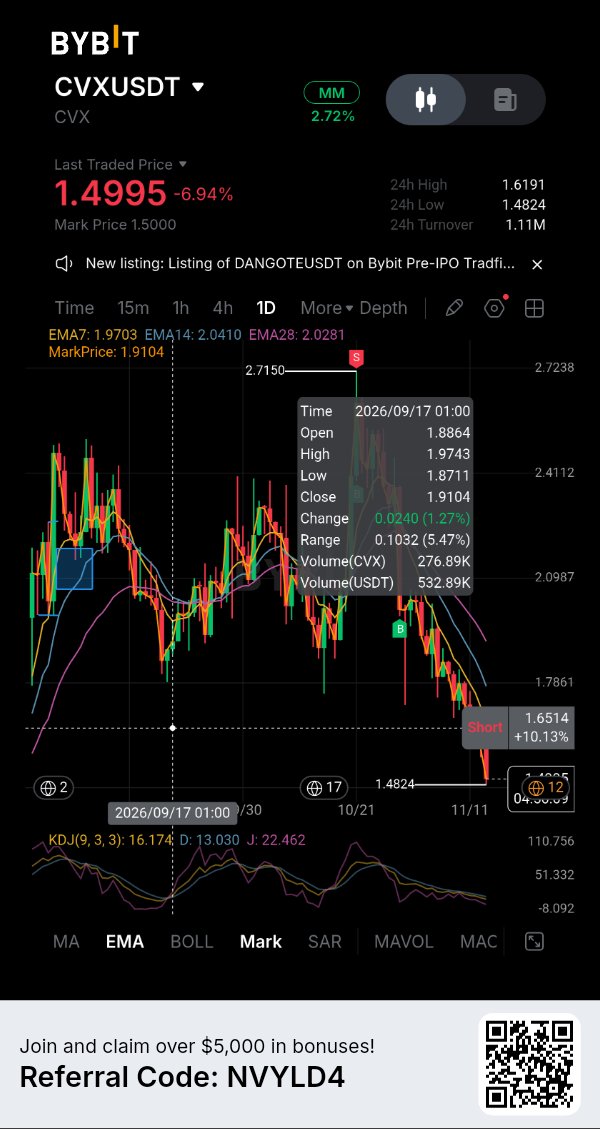

El reajuste del apalancamiento de Bitcoin tiene un problema de demanda
Bitcoin ha caído a alrededor de $66,800, aproximadamente un 47% por debajo de su máximo de octubre de 2025 cerca de los $126,000. La pregunta inmediata ya no es simplemente cuánto apalancamiento se ha eliminado. Es si los compradores están dispuestos a absorber la oferta después de las ventas forzadas. La liquidación del 13 de noviembre provocó alrededor de $1.64 mil millones en liquidaciones en los mercados de criptomonedas, con los futuros de Bitcoin representando aproximadamente $916 millones. Alrededor del 95% de las liquidaciones de $BTCUSDT fueron posiciones largas. El interés abierto cayó un 5.4% mientras que el precio de Bitcoin bajó un 5.9%, lo que sugiere que gran parte de la reducción reflejó el menor valor del contrato en lugar de una salida limpia de capital. Otra ola de liquidaciones siguió el 14 de noviembre. Estas son ventanas de reporte separadas, no totales para sumar. La demanda institucional ofrece poca confirmación de un piso. Los ETF de Bitcoin al contado en EE. UU. registraron $185.4 millones en salidas netas el 13 de noviembre, extendiendo la racha de retiros a siete sesiones. Las salidas liquidadas de la semana totalizaron alrededor de $1.065 mil millones, promediando $213.1 millones por sesión. Los flujos de los ETF no dictan el precio, pero los reembolsos persistentes debilitan una fuente de demanda marginal. El panorama de contado versus futuros también vale la pena observarlo. Los datos de CoinGlass muestran que los futuros se negocian a aproximadamente once veces el volumen al contado. Durante la última ventana de 24 horas, los futuros registraron compras netas de tomadores (taker buying) mientras que el mercado al contado registró ventas netas de tomadores. Esa divergencia puede producir un rebote, pero no es lo mismo que una acumulación amplia al contado. Durante siete días, ambos mercados permanecieron como vendedores netos. Los niveles de precios importan, pero la confirmación importa más. Bitcoin necesita recuperar los $70,000 y mantenerlos mientras mejora la compra al contado. Una ruptura por debajo del área reciente de $67,000 dejaría al mercado vulnerable a otra cascada de liquidaciones. Con el interés abierto aún cerca de los $45 mil millones, el apalancamiento no ha desaparecido. Una recuperación genuina se mostraría en una demanda sostenida al contado, flujos de ETF volviéndose positivos y una fortaleza de precio que no dependa principalmente del posicionamiento en futuros. Hasta entonces, un rebote podría ser un alivio por las ventas forzadas en lugar de evidencia de que el mercado ha encontrado un fondo duradero. Preguntas clave: 1. ¿Puede Bitcoin recuperar los $70,000 con volumen al contado apoyando el movimiento? 2. ¿Disminuirán las salidas de los ETF lo suficiente como para restaurar la demanda institucional? 3. ¿Es la última compra de futuros un giro temprano o simplemente otro rebote apalancado? $BTCUSDC #IMPACTbyTrade
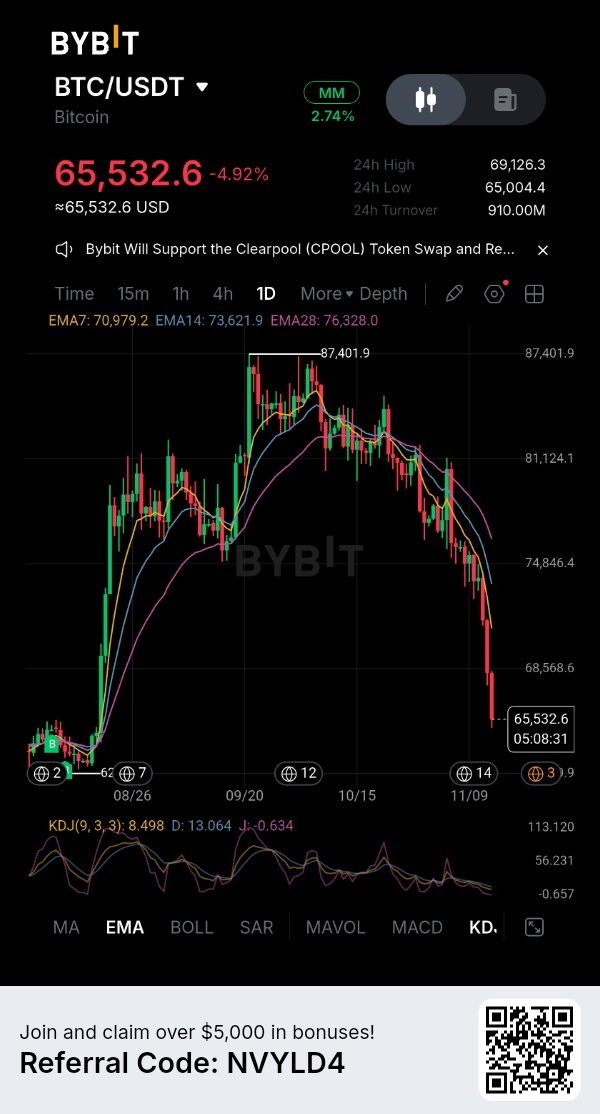
NVDAX: Nvidia’s Earnings Test AI Conviction
$NVDAXUSDT is approaching a major catalyst: Nvidia’s fiscal Q3 2027 results, scheduled for November 17. The question is whether hyperscaler spending is translating into revenue quickly enough to support expectations already embedded in Nvidia’s valuation. The latest snapshot puts NVDAX near $161.60, down 1.5% over 24 hours and about 33.5% below its October 6 high of $242.89. CoinGlass reports a market capitalisation near $94.6 million, $2.81 million in spot volume and $6.74 million in futures volume. Derivatives turnover is about 2.4 times spot activity. That imbalance matters: leveraged positioning can move the token sharply, including when the underlying share market is closed. Open interest has risen 11.5% to about $3.88 million while price has fallen. CoinGlass classifies that combination as a short build-up. Its reported funding rate is 0.138% per eight hours, or roughly 151% annualised. This is an aggregate market reading, not a confirmed Bybit-specific rate, so treat it cautiously. It does, however, point to expensive long exposure. If price weakens while open interest expands, further short positioning may build; a sharp rebound could then force some shorts to cover. There is another distinction traders should not overlook. NVDAX is a tokenised representation of Nvidia equity exposure, not direct ownership of NVDA shares. It trades on crypto venues around the clock, while the underlying US stock market has fixed hours. Crypto order flow can therefore move the token before the share market reopens. Bybit’s NVDAX/USDT spot market was recently around $160–163, with daily volume estimates ranging from roughly $1.3 million to $1.8 million across snapshots. The November 17 report and guidance will test the AI-demand narrative. Strong results may still fail to lift NVDAX if expectations are higher or leverage remains one-sided. Watch NVDA’s reaction, NVDAX’s premium or discount to the share price, spot volume and whether open interest contracts as price stabilises. Key questions: 1. Will Nvidia’s guidance confirm that AI infrastructure spending is still accelerating? 2. Can NVDAX recover without another build-up in leveraged positions? 3. Will it continue tracking NVDA closely during crypto-market hours? #IMPACTbyTrade

ONDO: Institutional Growth Meets a Supply Test
Ondo Finance is expanding its position in tokenized real-world assets, but the growth of its platform does not automatically translate into demand for $ONDOUSDT That distinction is becoming increasingly important as the project approaches another major token unlock. CoinGecko's November 14 snapshot placed ONDO around $0.3236, with a market capitalisation of approximately $1.58 billion and 24-hour trading volume near $85.9 million. Circulating supply stood at 4.87 billion tokens against a maximum supply of 10 billion. This means fewer than half of the eventual tokens are currently circulating, leaving substantial future supply to enter the market. Ondo's business expansion provides a compelling fundamental backdrop. Its platform distributes tokenized financial products, including US Treasury exposure through products such as OUSG and USDY, alongside tokenized stocks and exchange-traded funds through Ondo Global Markets. DefiLlama's protocol data places its total value locked near $968 million. However, assets held in tokenized products should not be confused with capital invested in ONDO itself. Investors buying a tokenized Treasury product are primarily seeking exposure to the underlying financial asset, not necessarily accumulating the governance token. That distinction is reinforced by ONDO's actual utility. According to the Ondo Foundation documentation, ONDO is a governance token for the Ondo DAO and Flux Finance. It gives holders a role in protocol governance, but it does not represent direct ownership of the Treasury securities, equities or other assets distributed through the platform. Consequently, growth in tokenized assets does not automatically create proportional buying pressure for ONDO. Supply is another challenge. DefiLlama's unlock schedule identifies January 17, 2027, as the next major cliff event. Approximately 1.71 billion ONDO tokens, valued at around $561 million using the current reference price, are scheduled for release. That represents 17.1% of the maximum supply and approximately 35.1% of the existing circulating float. An unlock does not mean every token will immediately be sold, but it substantially increases the amount of supply that could become available. The investment question is therefore not whether Ondo can attract institutional interest. Its product expansion already demonstrates that ambition. The harder question is whether governance utility, ecosystem growth and sustained demand can absorb a growing circulating supply. Until token demand catches up with the platform's expansion, ONDO risks remaining a case where the business grows faster than the asset designed to represent its governance. Key questions: 1. Can Ondo's institutional expansion create measurable demand for ONDO? 2. How much selling pressure could the January 2027 unlock introduce? 3. Will governance utility become sufficient to support the token's valuation? $ONDOUSDC #IMPACTbyTrade
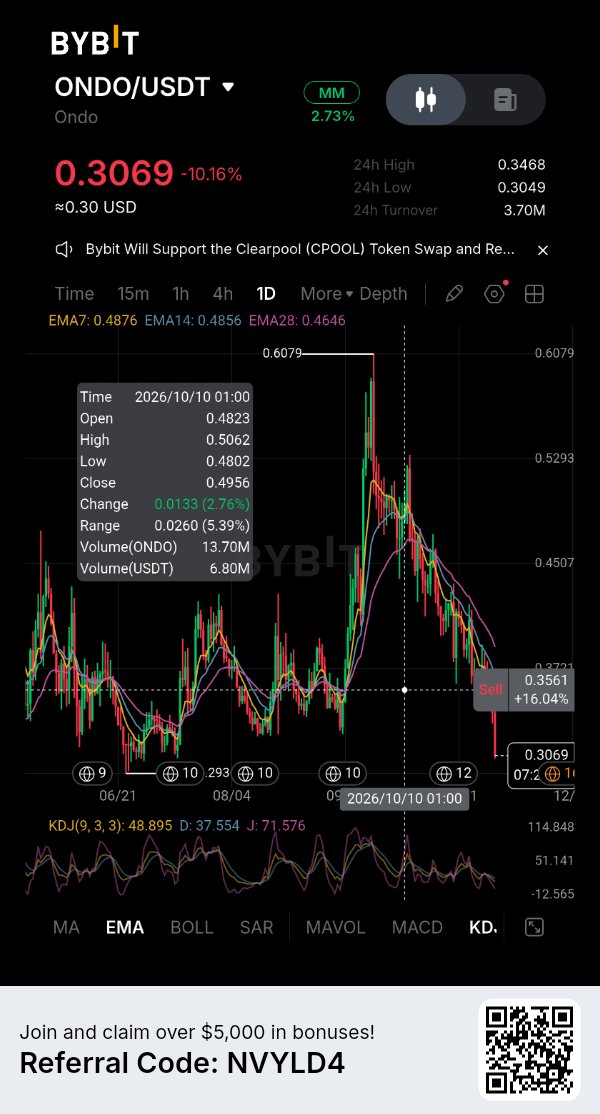

ADA: A Crowded Short Meets a Weak Market
Cardano is approaching a point where an oversold market could attract short-covering buyers, but the latest data does not yet confirm a reversal. On November 14, $ADAUSDT traded around $0.1645, down 4.36% over 24 hours and 9.41% over seven days. Its market capitalisation was approximately $6.05 billion, with circulating supply of 36.82 billion ADA against a maximum of 45 billion. The derivatives market is showing a clear reduction in exposure. CoinGlass recorded approximately $546 million in futures volume, up 34.5% over 24 hours, while open interest fell 7.23% to $348.8 million. Rising turnover alongside falling open interest suggests traders are actively closing positions as the price declines. This is consistent with a leverage reset, rather than a market building a fresh directional position. Liquidations reinforce the pressure on bullish traders. Around $2.5 million in ADA positions were liquidated over 24 hours, with approximately 97% coming from longs. Funding also turned negative at roughly -0.0065% per eight hours, meaning shorts were paying longs to maintain their positions. That reflects growing bearish positioning, although negative funding alone does not prove that a short squeeze is imminent. The spot market offers little confirmation of accumulation. ADA recorded approximately $69.9 million in spot volume, while spot taker flows showed a net outflow of $4.2 million. Futures volume was nearly eight times spot volume. This imbalance matters because derivatives traders can generate substantial turnover without creating sustained demand for the underlying token. There is a potential counterargument: negative funding, heavy long liquidations and declining open interest can eventually leave a market less vulnerable to another wave of forced selling. But that is a condition for stabilisation, not evidence that buyers have returned. ADA's immediate support area is around $0.162–$0.160, while the $0.166–$0.167 region presents nearby resistance from current order-book liquidity. Cardano needs more than an oversold reading to establish a recovery. Stabilising open interest, improving spot inflows and a sustained move above nearby resistance would provide stronger evidence. Until then, a bounce could simply be short covering inside a broader downtrend. Key questions: 1. Can ADA defend the $0.160–$0.162 support area? 2. Will negative funding trigger short covering or further downside? 3. Can spot demand return strongly enough to confirm a recovery? $ADAUSDC #IMPACTbyTrade
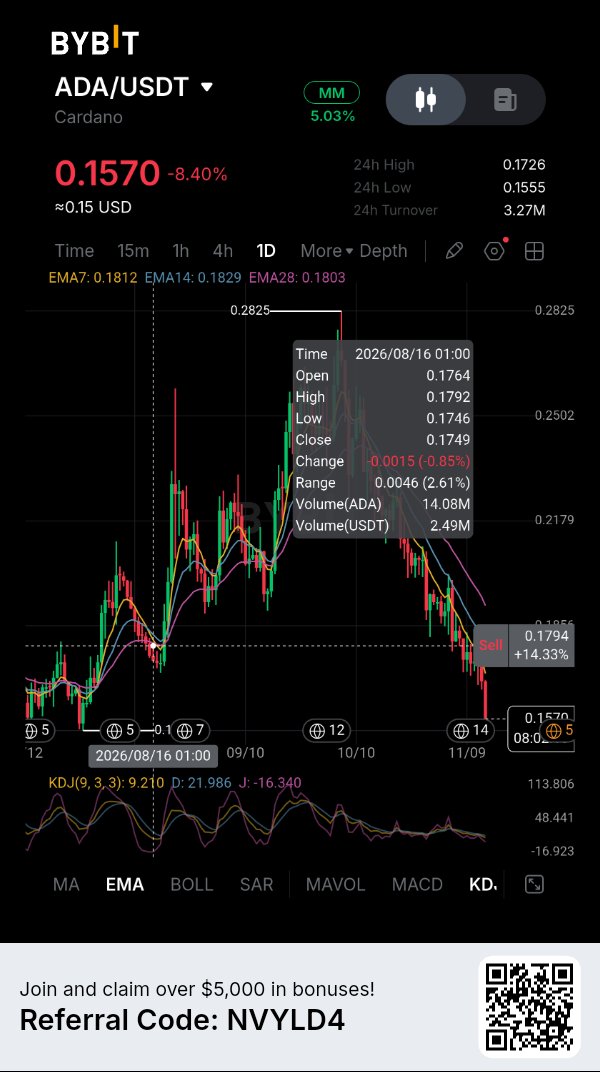

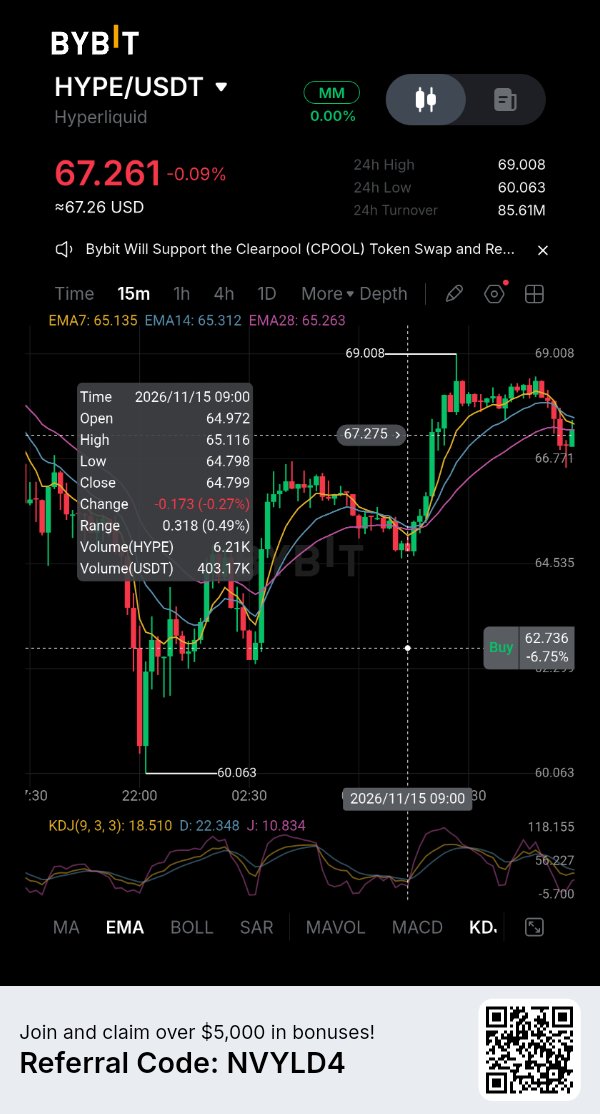
HYPE: The Leverage Reset Is Not Finished
Hyperliquid's $HYPEUSDT token is facing another test as leveraged traders reduce exposure. On November 14, HYPE traded around $69.14, down 3.87% over 24 hours and 11.07% over seven days. It remains approximately 29.4% below its September 23 all-time high of $97.98. The retreat is taking place alongside a broader crypto sell-off, with Bitcoin recently breaking below $70,000 as the stronger dollar and changing Federal Reserve rate expectations pressured risk assets. The derivatives figures reveal how much leverage remains involved in HYPE's price discovery. CoinGlass recorded $2.78 billion in futures volume over 24 hours, compared with $241.39 million in spot volume. Futures turnover was approximately 11.5 times spot activity. Open interest stood at $3.11 billion, down 4.72% over the same period. High turnover alongside declining open interest suggests traders are actively closing or reducing positions rather than simply adding fresh exposure. Liquidations reinforce that picture. Approximately $16.70 million in HYPE positions were liquidated, with $15.97 million coming from longs. That means bullish traders accounted for roughly 96% of the reported liquidations. The funding rate also turned slightly negative at -0.0010%, indicating that shorts were paying longs on average. This is a notable shift from markets where positive funding reflects persistent demand for leveraged long exposure. However, a leverage reset is not automatically a bullish development. Forced long closures can remove some immediate selling pressure, but they cannot create sustained demand for the token. With futures volume still dominating spot turnover, a recovery driven mainly by short covering could struggle to hold if buyers do not return to the underlying market. The $67 area is an important short-term reference because it marked the latest 24-hour low in the CoinGlass snapshot. A sustained move below it would expose HYPE to another test of downside liquidity. Reclaiming $72–75 would improve the immediate structure, but price recovery needs confirmation from stronger spot participation and stabilising open interest. Hyperliquid's trading activity remains substantial, but HYPE's market is still working through a crowded derivatives environment. The next move will depend on whether spot buyers replace the leveraged demand that has disappeared. Key questions: 1. Can HYPE defend the $67 area after the long liquidations? 2. Will spot demand strengthen as futures positioning contracts? 3. Can open interest rebuild without another crowded long trade? #IMPACTbyTrade

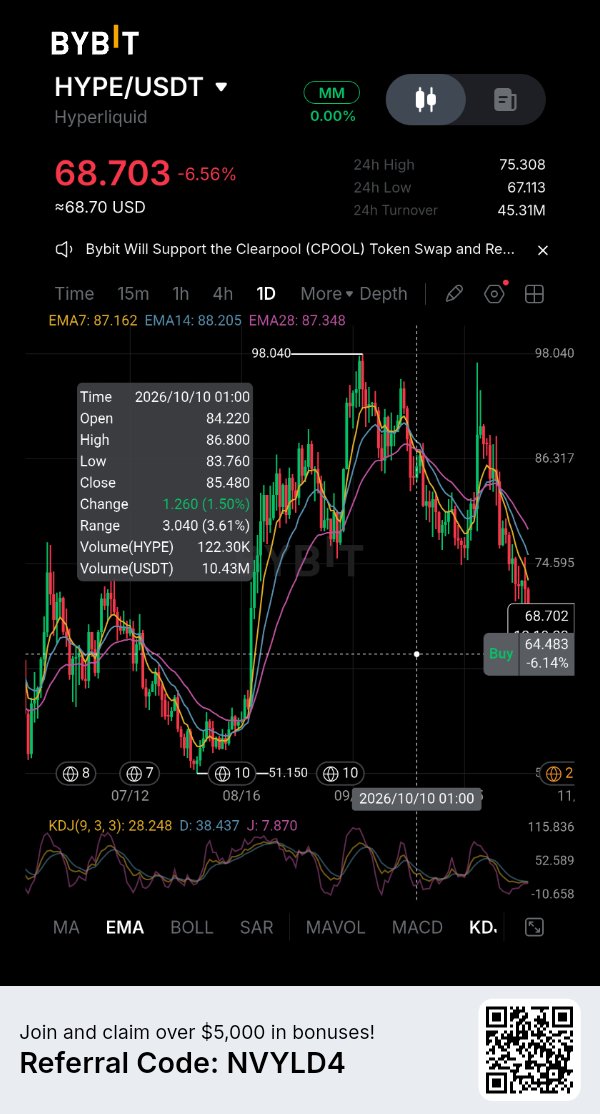
NEAR: A Leverage Reset, Not a Recovery
NEAR Protocol is under broader market pressure, but its derivatives data shows why a falling price needs to be read alongside positioning. On November 14, $NEARUSDT traded around $3.31, down 6.21% over 24 hours and 11.40% over seven days. Its market capitalisation stood near $4.39 billion, with circulating supply around 1.31 billion NEAR. CoinGlass data showed approximately $1.01 billion in NEAR futures volume over 24 hours, compared with $220.5 million in spot volume. Derivatives turnover was about 4.6 times spot activity. Total futures open interest stood near $764.2 million, down 5.56% over the same period. That combination matters: the market is trading heavily, but the value of outstanding futures positions is contracting as price falls. Liquidations add detail to the move. Around $2.55 million in NEAR futures positions were liquidated over 24 hours, including approximately $2.03 million in longs and $520,000 in shorts. Longs accounted for roughly 80% of reported liquidations. This is consistent with bullish positions being forced out during the decline. It does not, by itself, establish that sellers have exhausted their supply or that a bottom is forming. Funding remained positive at approximately 0.0073% on an open-interest-weighted basis. That suggests long positions were still paying shorts on average, despite the price decline. The rate was below the commonly cited 0.01% per eight-hour baseline, so it does not indicate extreme crowding. Still, positive funding alongside falling price and open interest shows that bullish positioning had not completely disappeared. The spot market is the missing confirmation. Futures volume remains several times larger than spot turnover, so a rebound driven mainly by short covering could fade if buyers do not return to the underlying market. A more convincing recovery would require price stabilisation, open interest rebuilding without an excessive funding premium, and stronger spot participation. For NEAR, the immediate question is not whether leverage has been reduced. The data says it has. The question is whether that reset creates room for genuine demand—or whether the market needs another leg lower before buyers are willing to step in. Key questions: 1. Can NEAR hold above the $3.30 area after the leverage unwind? 2. Will spot volume expand enough to confirm a recovery? 3. Can open interest rebuild without funding becoming overcrowded? $NEARUSDC #IMPACTbyTrade

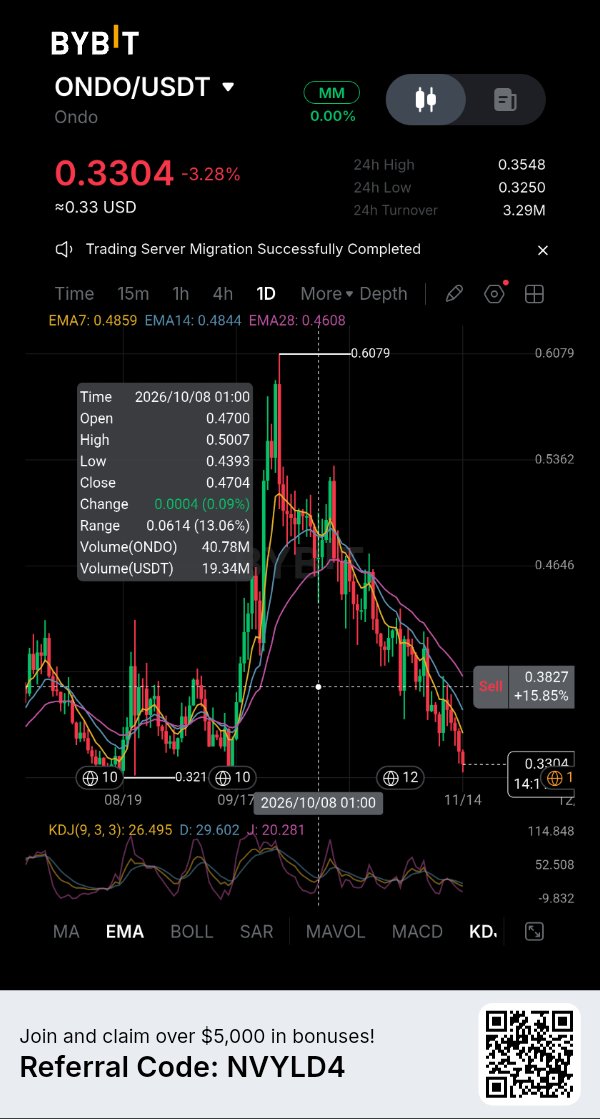
XAUT: Gold Ownership Meets a Leverage Test
Tether Gold is being pulled lower in a market trading far more derivatives than spot tokens. On November 14, $XAUTUSDT was around $3,864, down 0.54% over 24 hours and 4.76% over seven days. CoinGlass recorded $579 million in futures volume against $48.6 million in spot volume. Futures turnover was nearly 12 times spot activity. Open interest stood near $790 million, down 5.76% in 24 hours. Approximately $509,000 in XAUT positions were liquidated, with 99% attributed to longs. Spot taker flows showed a net outflow of $2.3 million, while futures flows recorded an $8.3 million outflow. Falling price alongside falling open interest is consistent with long positions being closed or liquidated. That alone does not prove investors are abandoning gold. The bullion market has also been under pressure. Reuters reported that spot gold recovered to $3,879.71 an ounce on November 13 after hitting a more than one-year low the previous session. Gold was still heading for a weekly loss of about 4.5%, pressured by a stronger dollar, higher oil prices and expectations of tighter Federal Reserve policy. XAUT and bullion will not match tick for tick: the token trades around the clock, while traditional gold benchmarks follow market hours. The backing matters. Tether’s November 4 reserve update said that, as of September 30, 827,417.63 XAUT were in circulation, matched by the same number of fine troy ounces of physical gold held in Switzerland. Each token represents one fine troy ounce on a London Good Delivery bar. That 1:1 backing supports its gold exposure, but does not remove exchange liquidity, issuer or custody risk, or the possibility of temporary price gaps against bullion. A leveraged unwind can push XAUT below the gold benchmark without changing the quantity of gold represented by each token. Conversely, physical gold strength does not guarantee immediate buying demand for XAUT on crypto exchanges. The next test is whether spot flows stabilise as open interest contracts. If futures activity cools but spot demand remains weak, the decline may reflect more than forced liquidations. Digital access to gold does not insulate XAUT from crypto-market leverage. Key questions: 1. Will spot buyers absorb XAUT as leveraged longs exit? 2. Can XAUT track bullion closely during volatile, round-the-clock trading? 3. Does falling open interest signal a healthier reset or weakening demand? #IMPACTbyTrade

POL: Adoption Must Translate Into Token Demand
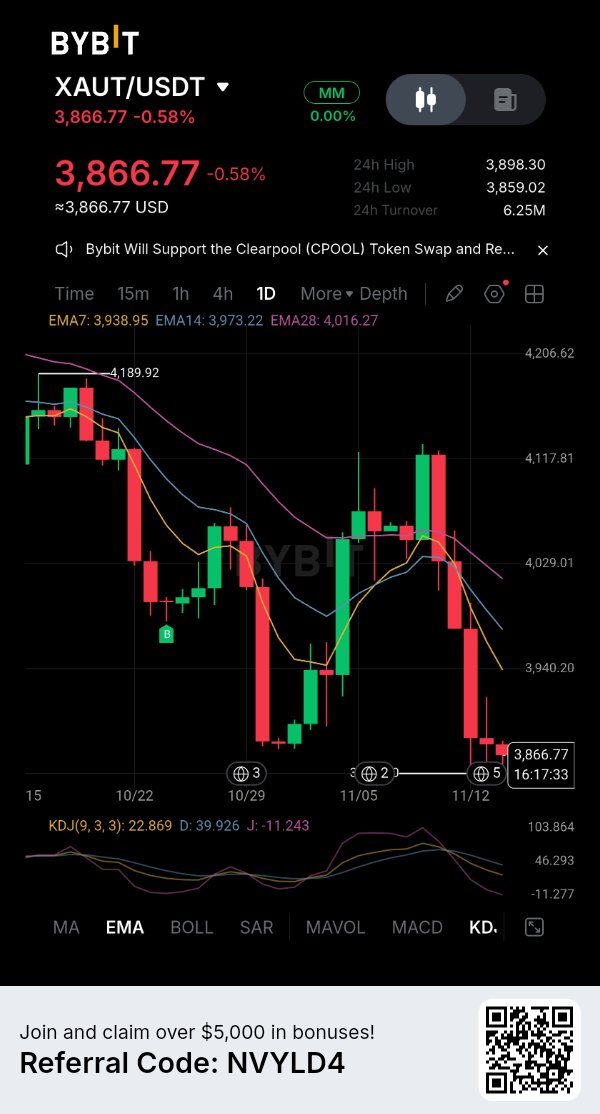
Polygon has gained another route into mainstream payments. The question for $POLUSDT holders is whether this activity will create demand for the token. On November 12, SoFiUSD went live on Polygon. The dollar stablecoin, issued by SoFi Bank, is now available to SoFi’s more than 17 million members through its app. Users can buy, sell, hold and convert it, while businesses can build payment and settlement services around it. That is a distribution opportunity, not proof that all 17 million members are using Polygon or that significant volume has arrived. Polygon already has meaningful activity. DefiLlama’s November 13 snapshot showed $2.814 billion in stablecoin value, $619.63 million in DeFi total value locked and 269,234 active addresses over 24 hours. The chain processed about 4.01 million transactions and generated $49,481 in fees. Yet stablecoin value had declined 2.85% over seven days, while daily DEX volume was $74.15 million, down 42.29% on the weekly comparison. The network is active, but these figures do not show accelerating capital or trading activity. The token economics create another test. POL traded around $0.0846 on November 14, with a market capitalisation near $901 million. POLTRACK data through November 12 showed 19.78 million POL in network fees over 30 days, including 11.71 million POL allocated to base-fee burn. Protocol emissions reached 17.48 million POL over the same period. After the burn allocation, supply still increased by approximately 5.77 million POL, or 0.05%. That does not make Polygon’s growth irrelevant. POL is used for transaction fees and staking, and a larger payment network can strengthen its utility. But adoption becomes a stronger token thesis only if it produces sustained fee demand and meaningful burn or staking activity that offsets issuance. A stablecoin integration can benefit the infrastructure before it has a visible effect on POL demand. SoFiUSD gives Polygon a credible payments catalyst. The next evidence should be actual stablecoin balances, transaction volumes and fee generation after launch—not the size of SoFi’s customer base alone. Until those figures improve, the partnership is a promising network development, not proof of a token repricing. Key questions: 1. Will SoFiUSD bring sustained payment volume to Polygon? 2. Can network fees and burns begin to offset POL emissions? 3. What level of activity would justify stronger demand for POL? $POLUSDC #IMPACTbyTrade

La ruptura de los 69 mil dólares de Bitcoin expone un problema de demanda
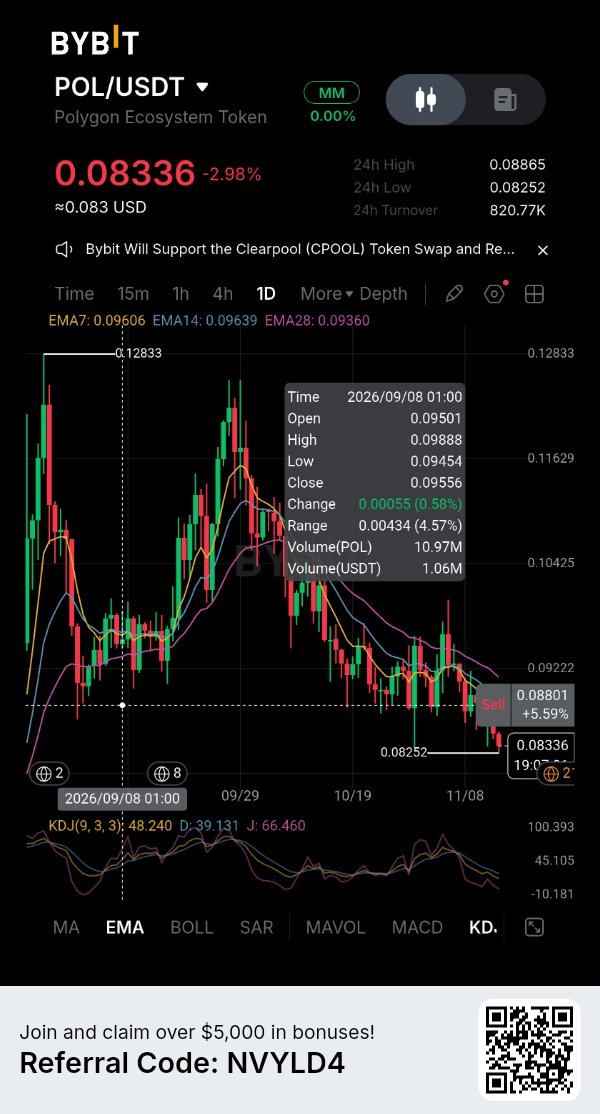
El movimiento de Bitcoin por debajo de los $70,000 es más que un intento fallido de recuperar un nivel de número redondo. El 13 de noviembre, el BTCUSDT cayó a $67,770, su precio más bajo desde el 19 de agosto, antes de cotizar alrededor de los $68,800. La caída se produjo a medida que el dólar estadounidense se fortalecía y los rendimientos de los bonos aumentaban ante las expectativas de que la Reserva Federal podría subir las tasas en diciembre. Unos mayores rendimientos esperados en los activos en dólares pueden hacer que las posiciones de mayor riesgo sean menos atractivas, añadiendo presión a un mercado cripto ya de por sí frágil. La venta es visible tanto en los datos al contado (spot) como en los de derivados. CoinGlass situó el interés abierto total de futuros de Bitcoin cerca de los $47.8 mil millones, un 10.6% menos que los $53.5 mil millones en el periodo mostrado. El interés abierto en Binance cayó un 5.5% en 24 horas, en CME disminuyó un 4.8% y en Bybit bajó un 4.2%. El mismo panel registró aproximadamente $3.2 mil millones en salidas netas de 'takers' de futuros y $259 millones en salidas netas de 'takers' al contado en 24 horas. Esto no es simplemente traders rotando entre exchanges: ambos mercados muestran ventas netas. Los flujos de los ETF añaden otra medida de cautela institucional. Los ETF de Bitcoin al contado en EE. UU. registraron $47.7 millones en salidas netas el 12 de noviembre, según CoinStats. CoinDesk informó que los fondos habían perdido aproximadamente $1.88 mil millones desde el inicio de noviembre. La cifra diaria es una instantánea, mientras que el total mensual muestra la escala de la retirada. Los flujos de los ETF no capturan cada operación institucional, pero los reembolsos persistentes eliminan una fuente importante de demanda incremental. Las liquidaciones han acelerado el movimiento, pero la cifra principal necesita contexto. CoinDesk informó de más de $1.6 mil millones en liquidaciones en los mercados cripto, no solo en Bitcoin. En Hyperliquid, las posiciones de BTC representaron alrededor de $306.5 millones de liquidaciones en 24 horas. Los cierres forzosos pueden intensificar una caída, sin embargo, no explican por qué las ventas al contado y las retiradas de los ETF están ocurriendo al mismo tiempo. El nivel inmediato a observar es el mínimo del 13 de noviembre cerca de los $67,770. Una ruptura sostenida expondría a BTC a una mayor caída y pondría a prueba si los compradores están dispuestos a absorber la oferta. Recuperar los $70,000 mejoraría el panorama a corto plazo, pero una recuperación duradera necesita algo más que cobertura de posiciones cortas. Los flujos al contado deben cambiar, los reembolsos de los ETF deben disminuir y el interés abierto debe estabilizarse sin otra acumulación de apalancamiento frágil. El problema de Bitcoin ya no es solo dónde se encuentra el soporte. Es si hay capital fresco preparado para defenderlo. Preguntas clave: 1. ¿Pueden los compradores defender el mínimo de $67,770? 2. ¿Volverán a ser positivos los flujos de los ETF después de retiradas sostenidas? 3. ¿Puede Bitcoin recuperar los $70,000 sin depender de otro 'squeeze' apalancado? $BTCUSDC #IMPACTbyTrade
ENA’s Buyback Promise Still Has a Supply Barrier
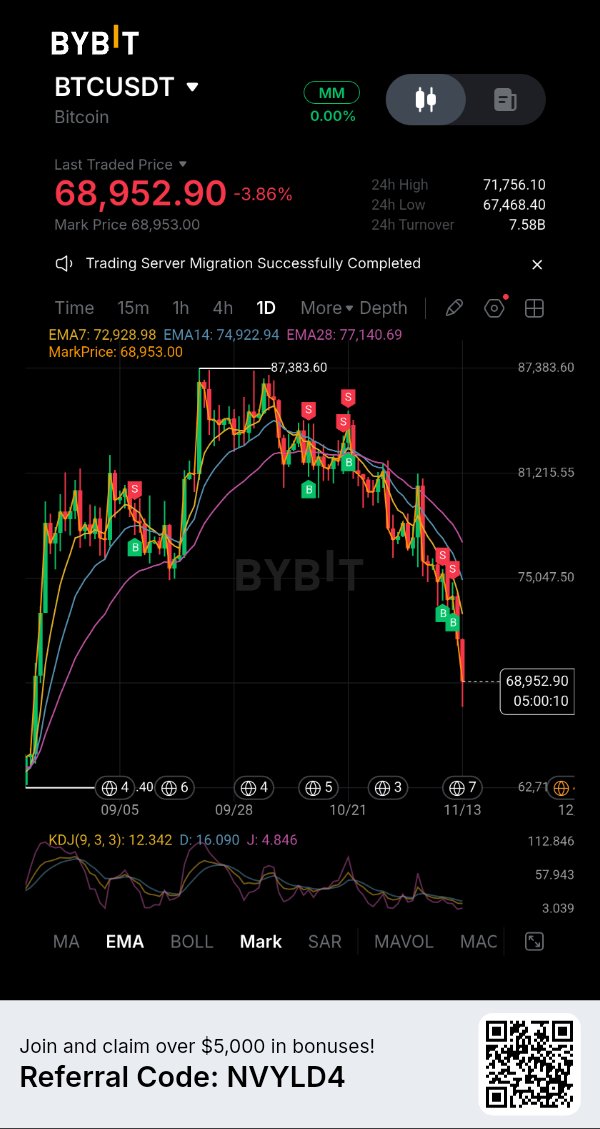
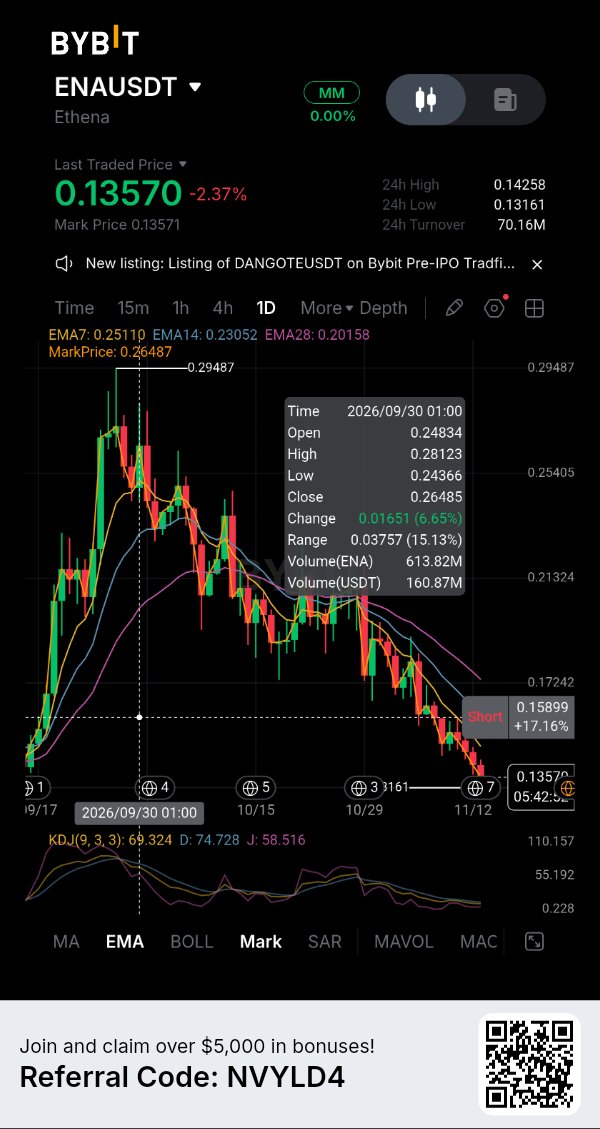
Ethena has introduced a mechanism designed to connect protocol growth with ENA demand, but the conditions for activating it remain important. The governance-approved fee-switch framework links token buybacks to USDe circulating supply. The first threshold is $7.5 billion, where 5% of protocol revenue is allocated to buybacks. Higher supply milestones increase that allocation, eventually reaching 20% at $20 billion. The difficulty is reaching the first threshold. An on-chain analysis published on October 15 put USDe supply at approximately $4.77 billion on October 12, with its 14-day average around $4.87 billion. That average needed to grow approximately 54% to reach the $7.5 billion trigger. The previous cycle shows that USDe can expand rapidly, but it also demonstrates the risk: supply peaked near $14.65 billion on a 14-day average in October 2025 before contracting sharply. Ethena's broader protocol figures show that the business remains active. DefiLlama reported approximately $5.17 billion in total value locked on November 13, with $22.18 million in fees over 30 days. However, reported protocol revenue for that period was only $61,100. Fees and revenue are not interchangeable: much of the economic activity supports sUSDe rewards and partner distributions. A large fee figure therefore does not mean an equivalent amount is available for ENA repurchases. The token itself remains under pressure. CoinGecko placed ENA around $0.1405 on November 13, down 3.91% over 24 hours and 12.17% over seven days. Its market capitalisation was approximately $1.90 billion. The next scheduled unlock is December 2, when 40.63 million ENA, representing 0.27% of total supply, is due for release to the Foundation. That is a relatively small percentage, but it adds another supply consideration while buyers are waiting for the buyback mechanism to become active. The distinction is crucial: governance approval is not the same as active buybacks. Ethena needs USDe supply to cross the required threshold before the first allocation begins. Until then, the buyback narrative is a future incentive, not current market demand. ENA's investment case now depends on whether USDe can regain sustained growth without compromising the stability and economics of its synthetic dollar. Tokenholders need to see the trigger reached, revenue generated and actual buybacks executed before treating the framework as a present source of support. Key questions: 1. Can USDe supply recover enough to reach the $7.5 billion threshold? 2. Will protocol revenue support meaningful ENA buybacks? 3. Can ENA absorb scheduled unlocks while waiting for the mechanism to activate? $ENAUSDT $ENAUSDC #IMPACTbyTrade

CVX: Protocol Revenue Isn't Token Demand
Convex Finance continues to generate income, but CVX holders need to look beyond headline fees. On November 13, DefiLlama reported $473.25 million in total value locked, down 18.1% over 30 days. Over the same period, Convex generated $2.16 million in fees and reported $909,303 in revenue. The protocol remains economically active, but that does not mean all its activity translates into value for the token. The distinction matters. Convex’s fee measure includes CRV and FXS harvested through the platform, including liquidity-provider rewards, harvest incentives, treasury fees and amounts directed to stakers and lockers. DefiLlama separately tracks $866,195 in holders’ revenue over 30 days. These are different accounting categories and should not be added together or treated as interchangeable. CVX’s value-accrual model is conditional. DefiLlama identifies protocol revenue share as the primary mechanism for locked and staked CVX holders. That is not a universal claim on Convex’s gross fees: the benefit depends on participation in the relevant locking and staking arrangements. The fee switch is listed as active, while buybacks are absent. CVX’s investment case should therefore not be presented as a routine token repurchase story. Market data reinforces the gap. CoinGlass put CVX near $1.626 on November 13, down 3.04% over 24 hours and 12.24% over seven days. Futures volume was about $6.06 million, roughly 4.4 times spot volume of $1.37 million. Open interest fell 4.84% to $7.53 million. Liquidations were modest at $18,260, mostly from longs. Derivatives activity is outweighing spot participation, but this is not evidence of a major liquidation event. Convex must retain liquidity, sustain activity around Curve and Frax-related markets, and show that the value reaching lockers is meaningful enough to support demand for CVX. A protocol can remain useful while its token struggles. Until spot participation improves and TVL stabilises, revenue alone is not a convincing bullish signal. Key questions: 1. Can Convex stabilise TVL after the 18.1% monthly decline? 2. Is revenue reaching CVX lockers meaningful enough to attract demand? 3. Will spot buying catch up with derivatives activity? $SOLUSDT #IMPACTbyTrade