
Ansarweb3
15606Me gusta0Compartir en el chat701Aficionados603Seguir
Web3 / Crypto Trader | Graphic Designer | Open to work: CM / Mod / Ambassador | Bybit Creator
Web3 / Crypto Trader | Graphic Designer | Open to work: CM / Mod / Ambassador | Bybit Creator
CAP/USDT: Trading the Pullback After a 30% Spike
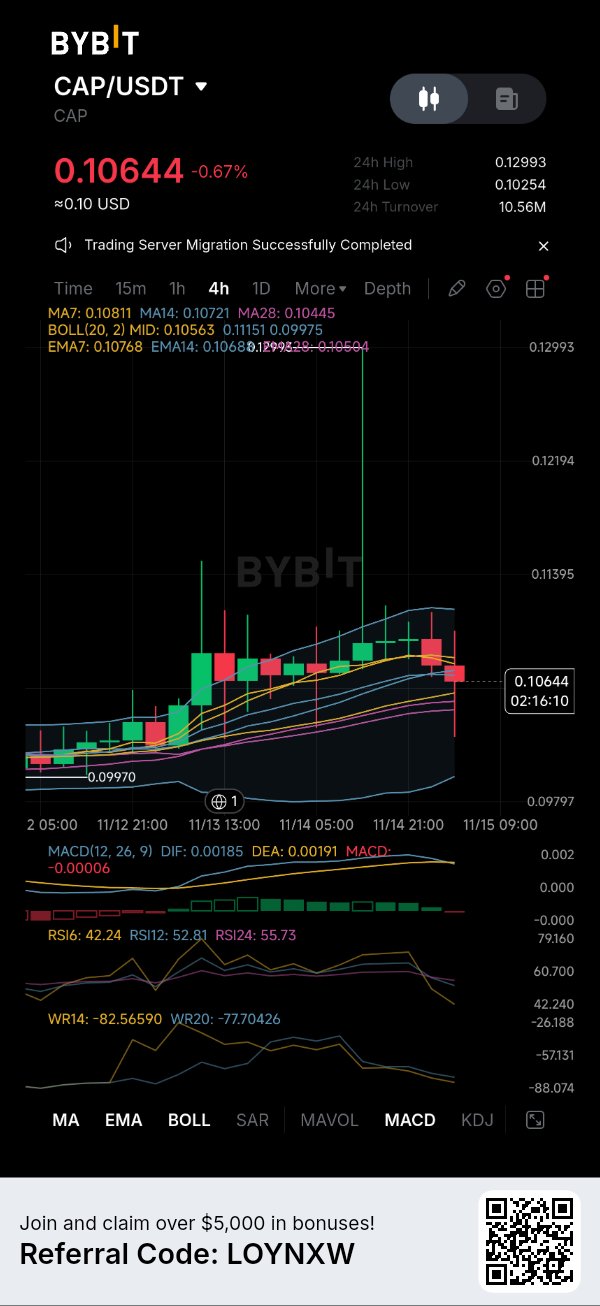
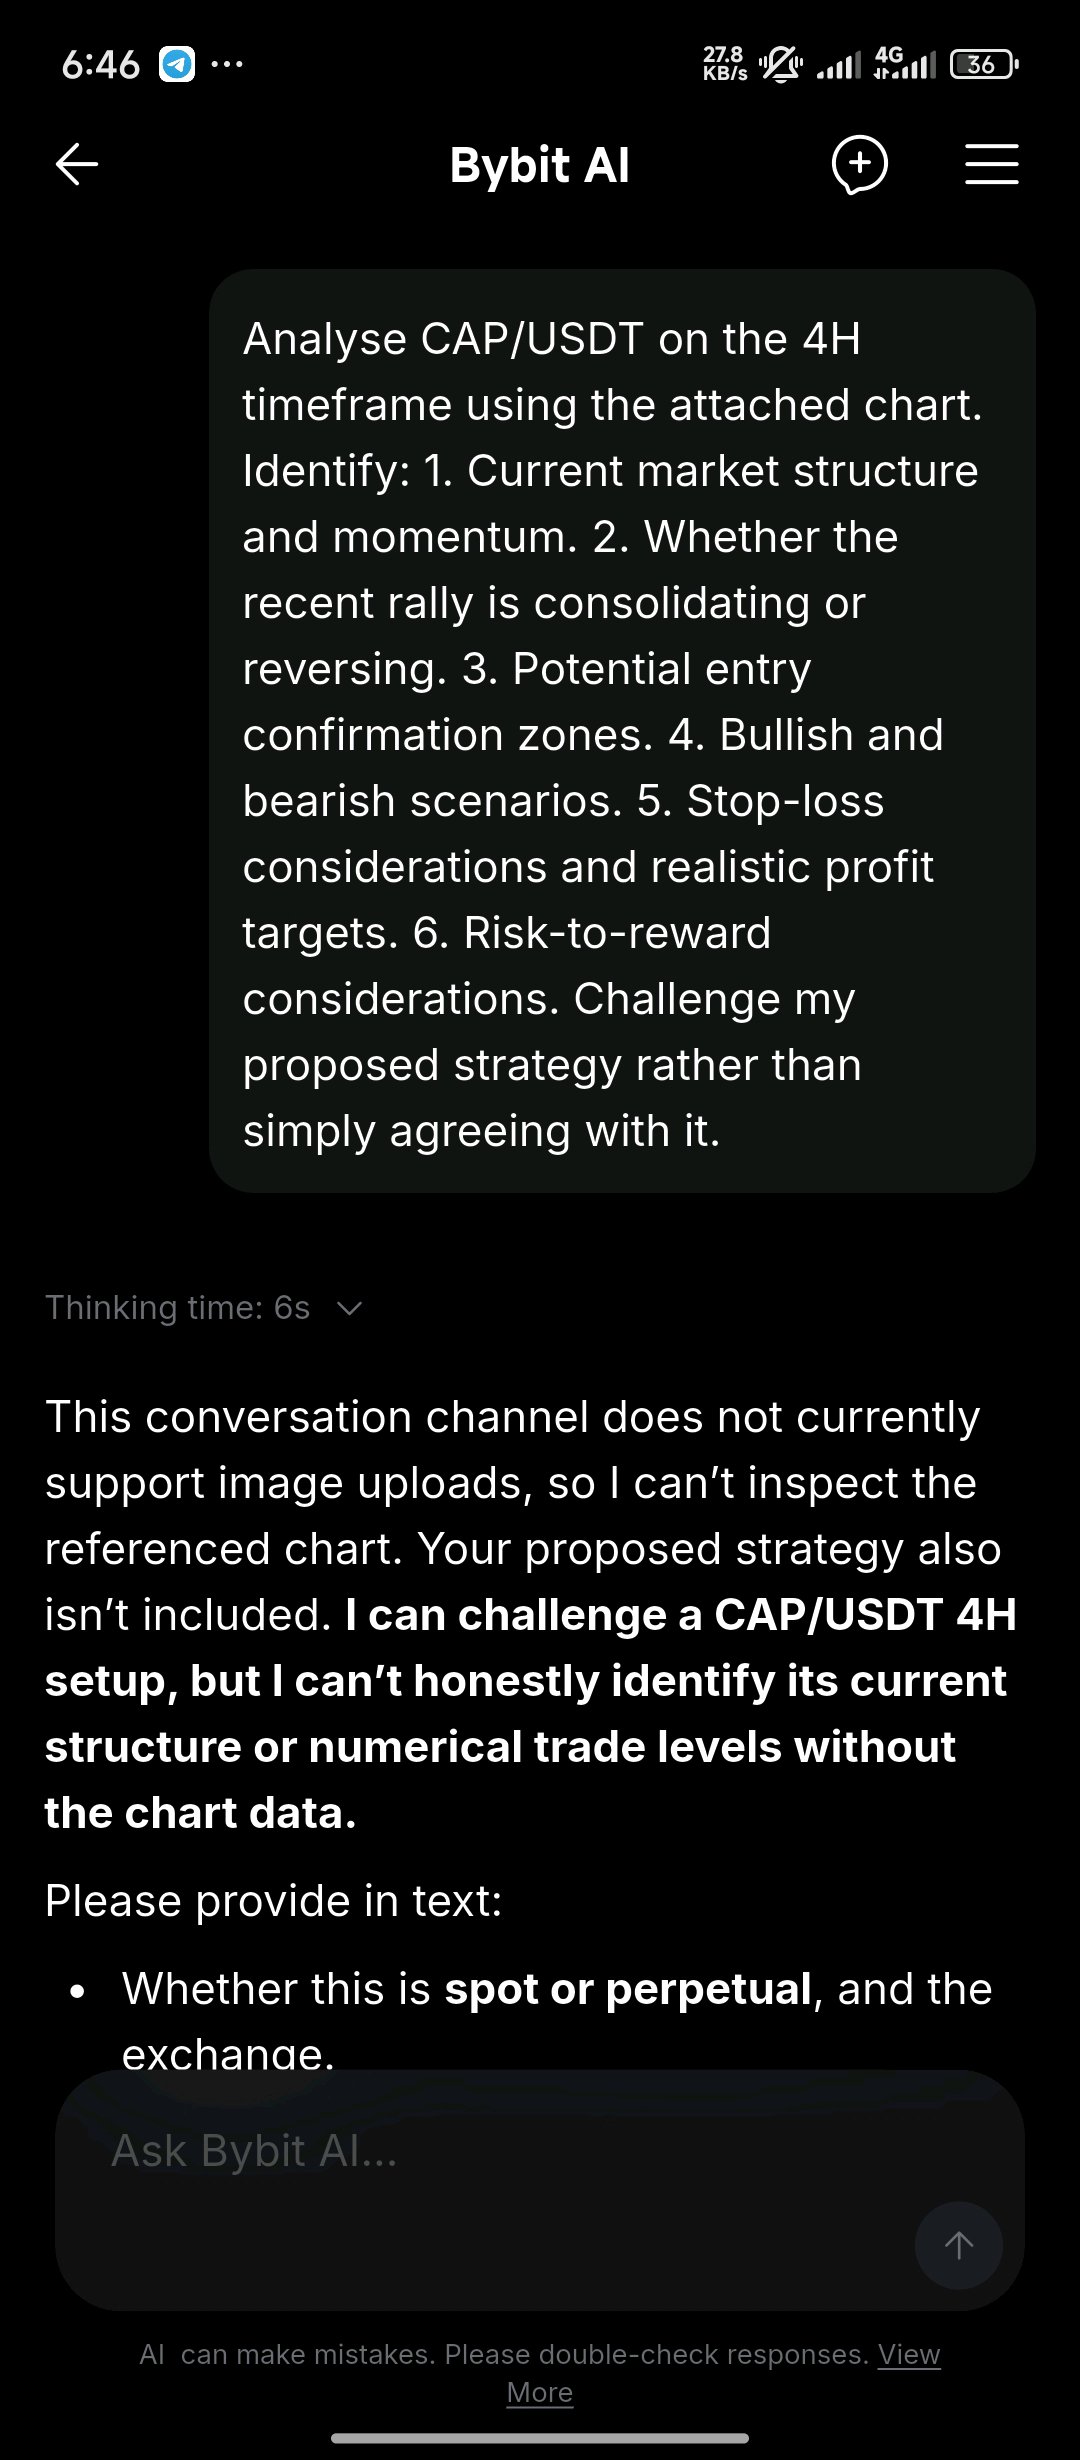
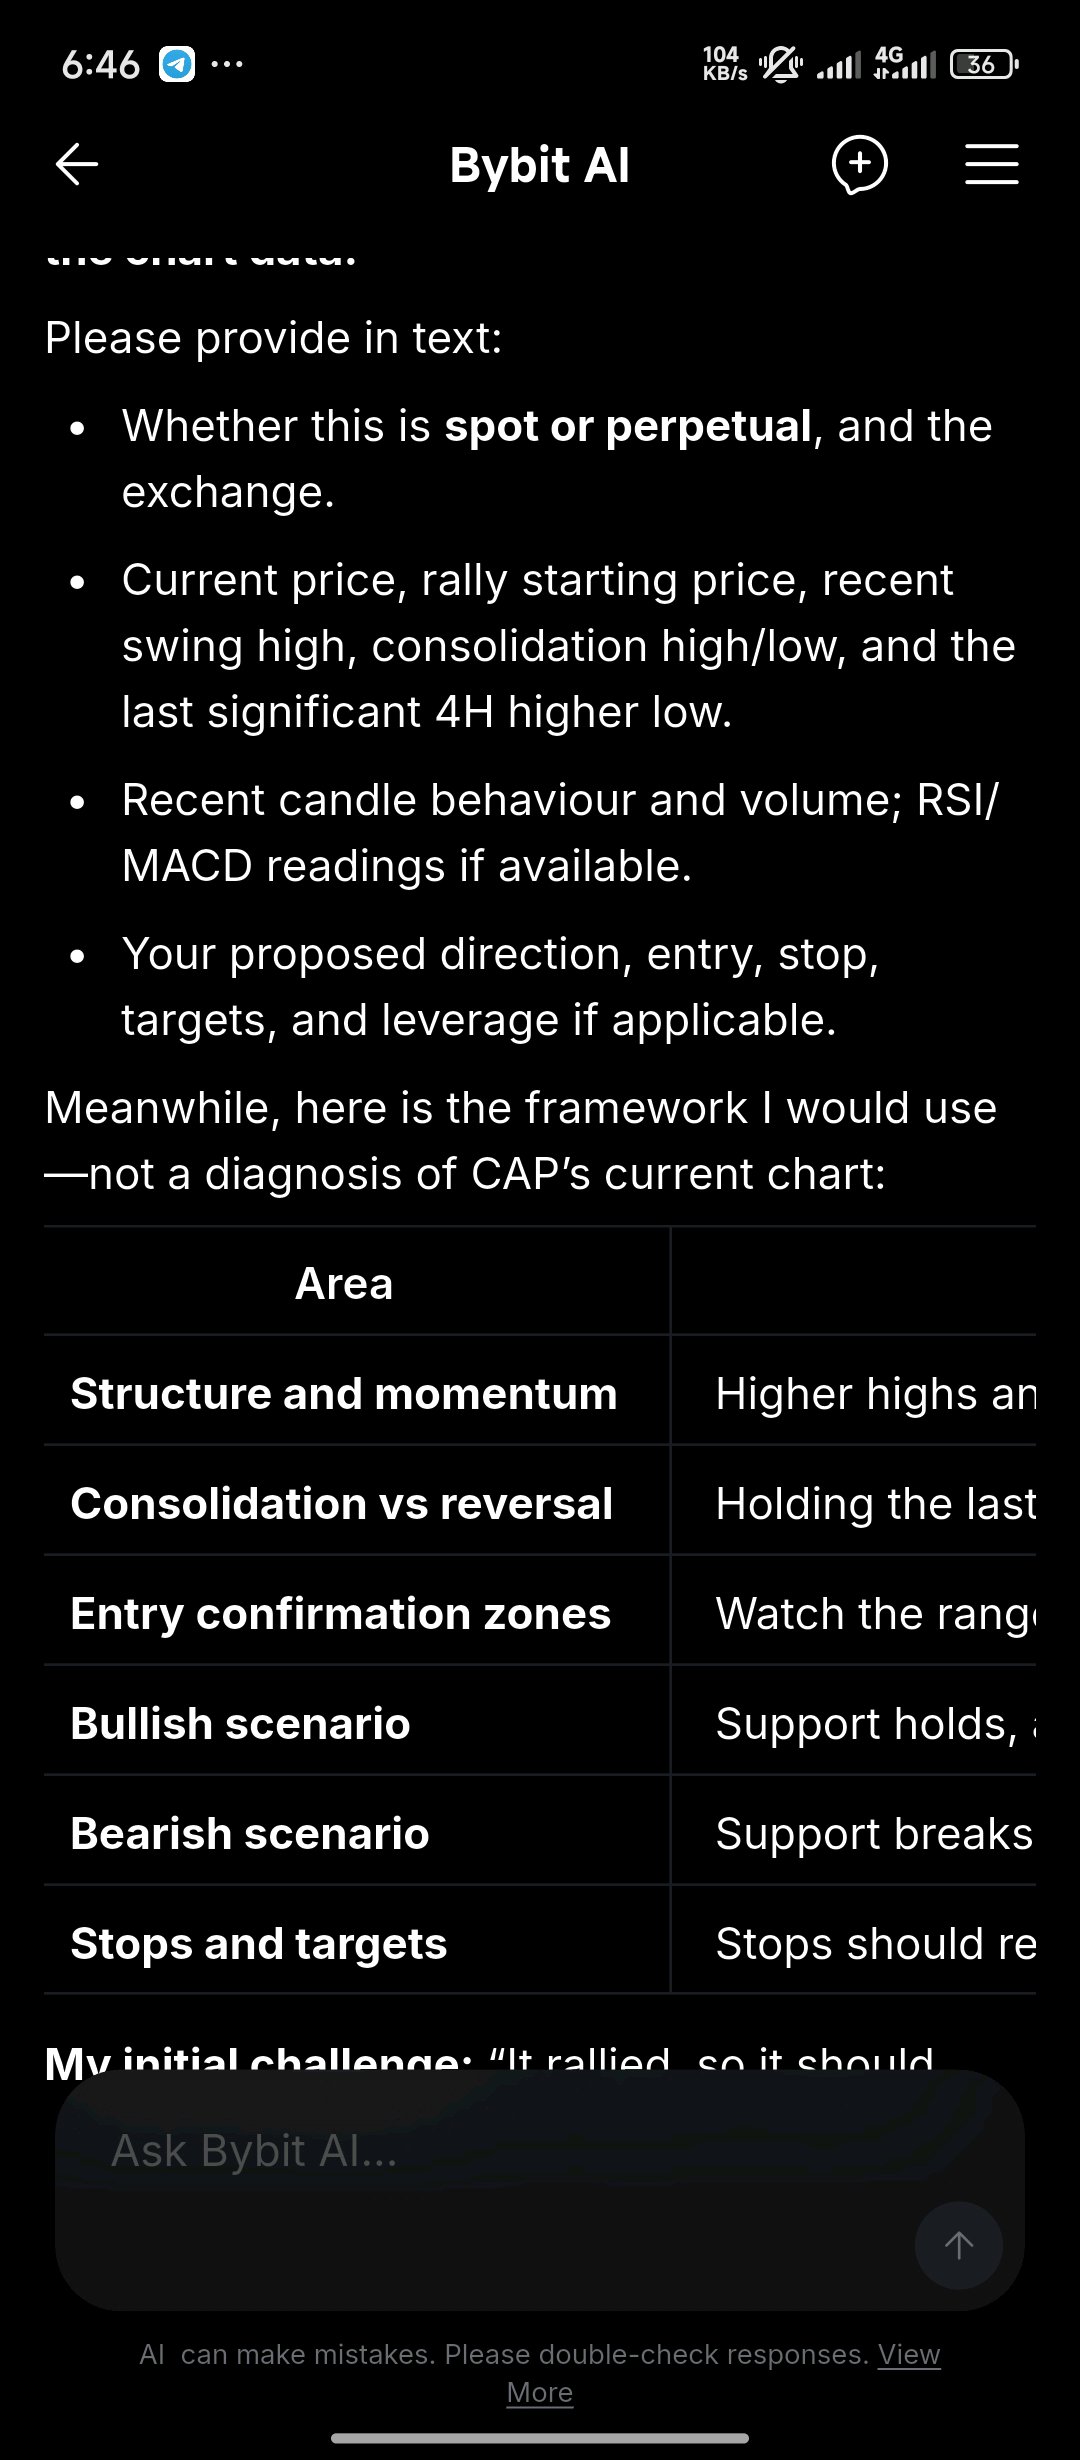
$CAPUSDT has caught my attention after recovering from $0.09970 and briefly reaching $0.12993. However, the 4H chart is now showing signs of cooling momentum. Rather than chasing the previous rally, I'm focusing on identifying a controlled entry. My technical assessment Price is currently around $0.10644. MA7 ($0.10811) and MA14 ($0.10721) are above the current price, while MA28 ($0.10445) remains below it. MACD is showing early weakness, with DIF at 0.00185 slightly below DEA at 0.00191. RSI6 has dropped to 42.24, while RSI12 and RSI24 remain above 50. This suggests short-term selling pressure without a complete breakdown of the broader recovery structure. My trading strategy I'm watching two possible opportunities: 1. A pullback toward $0.1045–$0.1056, followed by bullish confirmation. 2. A 4H reclaim of $0.1081, followed by a successful retest. My upside targets are $0.1115 and $0.1140. The $0.1025 region is my important downside invalidation level. If support fails, I would rather abandon the bullish setup than force a trade. Risk management comes first. I will avoid chasing green candles, define my invalidation before entering and consider position size based on the amount I'm prepared to lose. The lesson is simple: a strong rally does not mean every pullback is an opportunity. Confirmation matters. Not financial advice. DYOR. #WSOTShowYourAITradeToEarn10USDT
ZEC Below $1,000: Is $959 the Last Support?
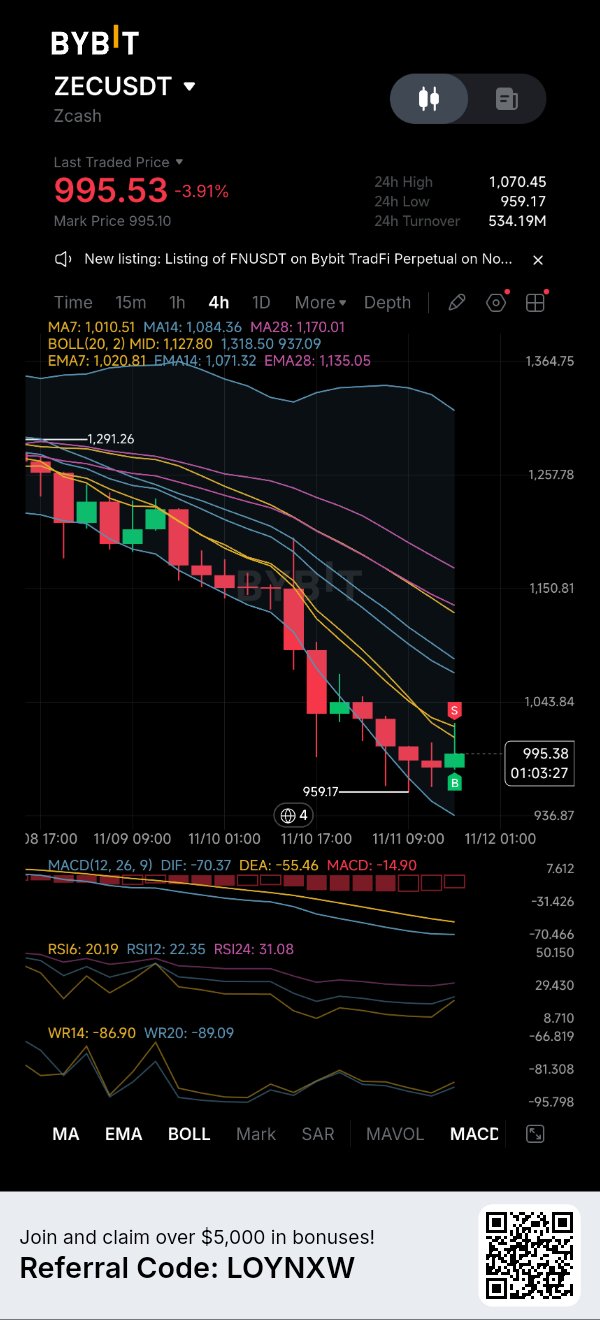
Zcash ($ZEC) is struggling to stabilise after an aggressive sell-off pushed price from above $1,290 toward the $959 region. Currently trading around $995.53, ZEC remains under pressure, with the 4H chart showing a clear bearish structure. What the indicators reveal: • Price is below MA7 ($1,010.51), MA14 ($1,084.36) and MA28 ($1,170.01). • MACD remains bearish, with DIF at -70.37 below DEA at -55.46. • The MACD histogram is negative at -14.90, confirming continued selling momentum. • RSI6 stands at 20.19, RSI12 at 22.35 and RSI24 at 31.08, indicating deeply oversold conditions. Key levels to watch: - Immediate support: $959.17 - Next support zone: $937–$936, around the lower Bollinger Band - First resistance: $1,010–$1,021 - Second resistance: $1,043–$1,071 - Major resistance: $1,084–$1,135 A sustained defence of $959.17 could create room for a relief bounce toward $1,010. However, a decisive breakdown below this support could expose the $937 region. For bulls, reclaiming $1,021 would be an early recovery signal. A stronger reversal would require overcoming the higher moving-average resistance zones. The key observation: ZEC is deeply oversold, but oversold conditions can persist during strong downtrends. Buying pressure needs to show up before the bearish structure can change. Watch the $959 support, avoid chasing speculative rebounds and define your invalidation before considering a trade. Can ZEC defend $959, or are sellers preparing another leg lower? #ZEC #Zcash #Bybit Not financial advice. DYOR. #WSOT2026 #USInflationRunsHotAndRateHikeBetsRise #BitcoinHitsTwoMonthLowAfterUSMidterms #AITechSelloffErases2Point5TrillionFromNasdaq100 #DeutscheBankLaunchesDigitalAssetCustody $BTCUSDT $ETHUSDT
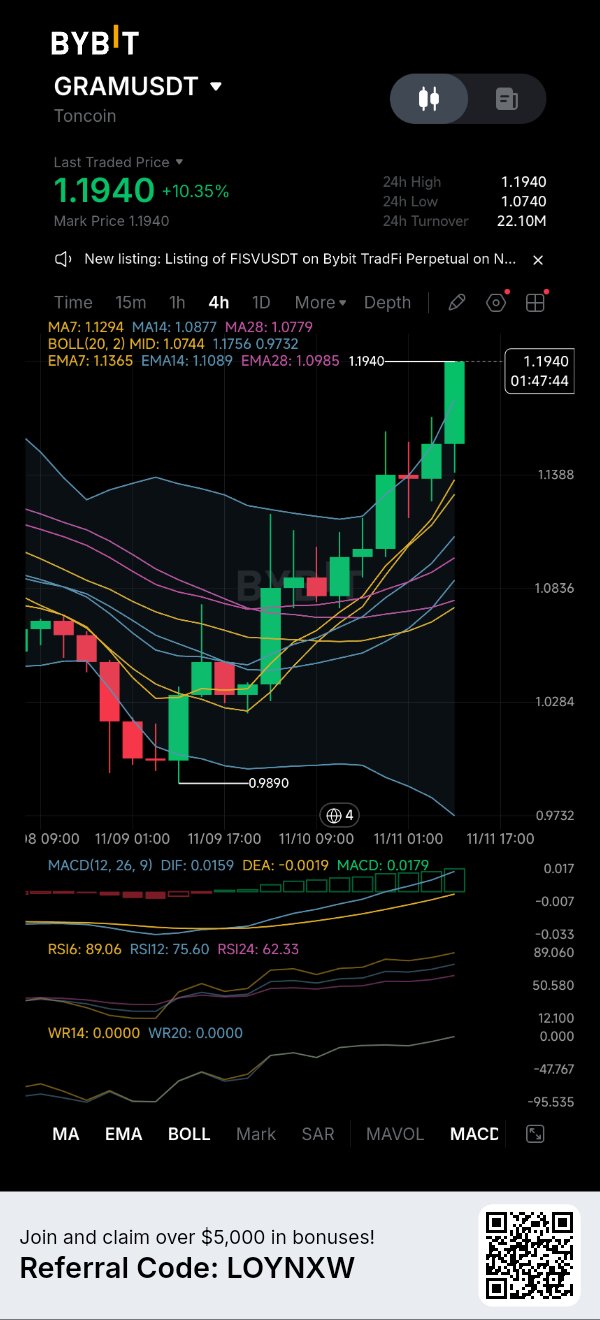
GRAM Gains 10%: Can Bulls Break $1.20?
$GRAMUSDT is showing impressive momentum after recovering from its recent $0.9890 low. Price is now trading around $1.1940, up 10.35%, with consecutive bullish candles pushing toward the $1.20 psychological resistance. The 4H structure has turned decisively bullish: • Price is above MA7 ($1.1294), MA14 ($1.0877) and MA28 ($1.0779). • MACD is bullish, with DIF at 0.0159 above DEA at -0.0019. • The MACD histogram has expanded to 0.0179, confirming strengthening momentum. • RSI6 stands at 89.06, while RSI12 is at 75.60, indicating an extremely overbought market. There is strong buying pressure, but the distance between price and the moving averages suggests that the rally may need a cooling-off period. Key levels to watch: - Immediate resistance: $1.1940 - Psychological resistance: $1.2000 - First support: $1.1756 - Secondary support: $1.1365–$1.1294 - Stronger support: $1.1089–$1.0985 A sustained breakout above $1.1940 could bring $1.20 into focus. However, rejection near this level could trigger profit-taking, with $1.1756 becoming the first important support to monitor. The bullish momentum is clear, but an RSI above 89 is a warning against chasing the current candle. Trading focus: Watch for consolidation, a controlled pullback or a confirmed breakout retest. Check liquidity, define invalidation and assess risk-to-reward before considering a position. Can GRAM sustain its momentum above $1.20, or will buyers take a breather first? Not financial advice. DYOR. #WSOT2026 #NovUSCPIWatch #WSOTPicktoEarn10U #USPayrollsAndRateDecisionsDriveMacroWeek #OilVolatilityTracksIranPeaceTalks $GRAMUSDC

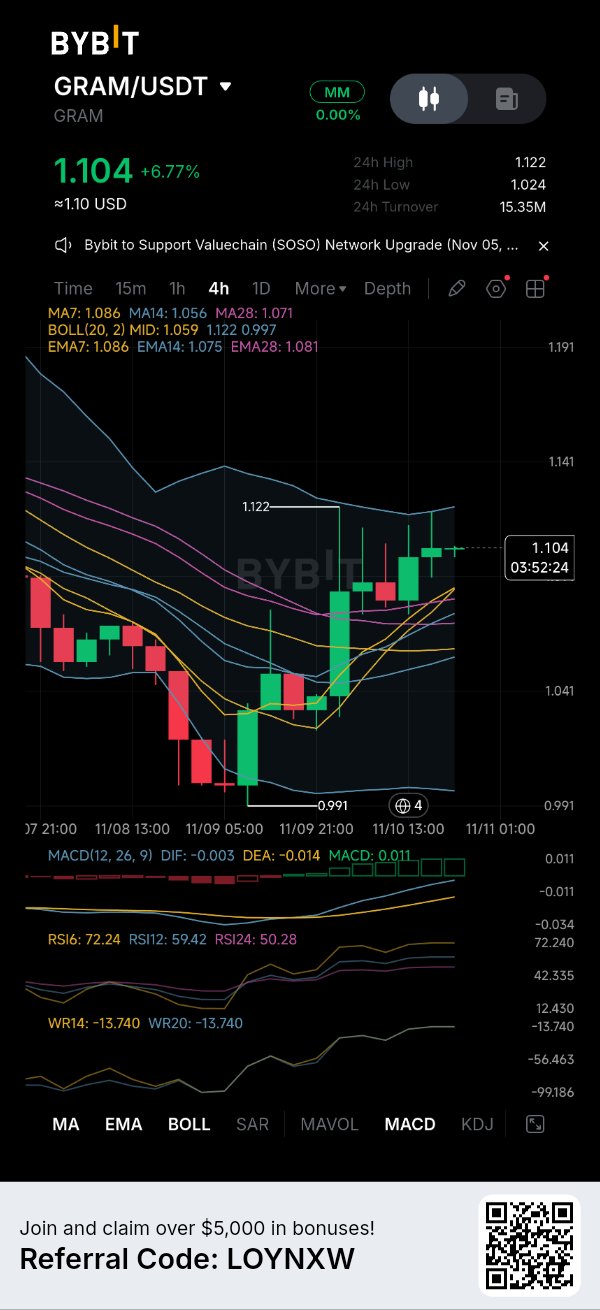
GRAM presiona la banda superior en 1.122
$GRAMUSDT está en 1.104. El máximo de 24h es 1.122, el mínimo 1.024, con un volumen de 15.35M en este par. El máximo marcado en la ventana es 1.122. El mínimo marcado es 0.991. El precio está por encima de las medias. La MA7 está en 1.086, MA14 en 1.056, MA28 en 1.071. Las EMA están cerca: 1.086, 1.075, 1.081. La banda media de Bollinger está en 1.059, los bordes en 1.122 / 0.997. El spot está atravesando el grupo y por debajo de la banda superior en 1.122, que es también el máximo de la sesión. El mínimo de 0.991 es la base inferior. Eso es un empuje hacia el techo, no un cierre por encima. El MACD tiene un histograma verde: DIF −0.003, DEA −0.014, MACD 0.011. El DIF está por encima del DEA. El RSI6 es 72.24, RSI12 59.42, RSI24 50.28. El indicador rápido está elevado. El indicador más lento no se ha roto. $GRAM es el token nativo de The Open Network (TON), anteriormente Toncoin. Se utiliza para pagar tarifas de transacción y para staking en la red. El suministro circulante es de alrededor de 2.85 mil millones. El suministro total es mayor, sin un límite máximo listado en los principales rastreadores. Esa es la estructura. No reescribe los niveles de 4h en el gráfico. Niveles en $GRAM: - 1.122 — banda superior y máximo de la sesión - 1.086 — MA7 y EMA7 - 1.059 — banda media - 0.997 / 0.991 — banda inferior y mínimo marcado Caso alcista: 1.086 se mantiene y $GRAM cierra por encima de 1.122. Caso bajista: un rechazo de 4h por debajo de 1.122, con el RSI6 en 72, lo envía de regreso a través de 1.086 hacia la banda media. ¿Tratarías la banda de 1.122 como la línea que tiene que despejar, o esperarías a un cierre de vuelta por debajo de 1.086 antes de dar por terminado el empuje? No es consejo financiero. Haz tu propia investigación (DYOR). #WSOT2026 #Observación del IPC de EE. UU. de nov. #WSOTPicktoEarn10U #Las nóminas de EE. UU. y las decisiones sobre tasas impulsan la semana macro #La volatilidad del petróleo sigue las conversaciones de paz con Irán $BTCUSDT

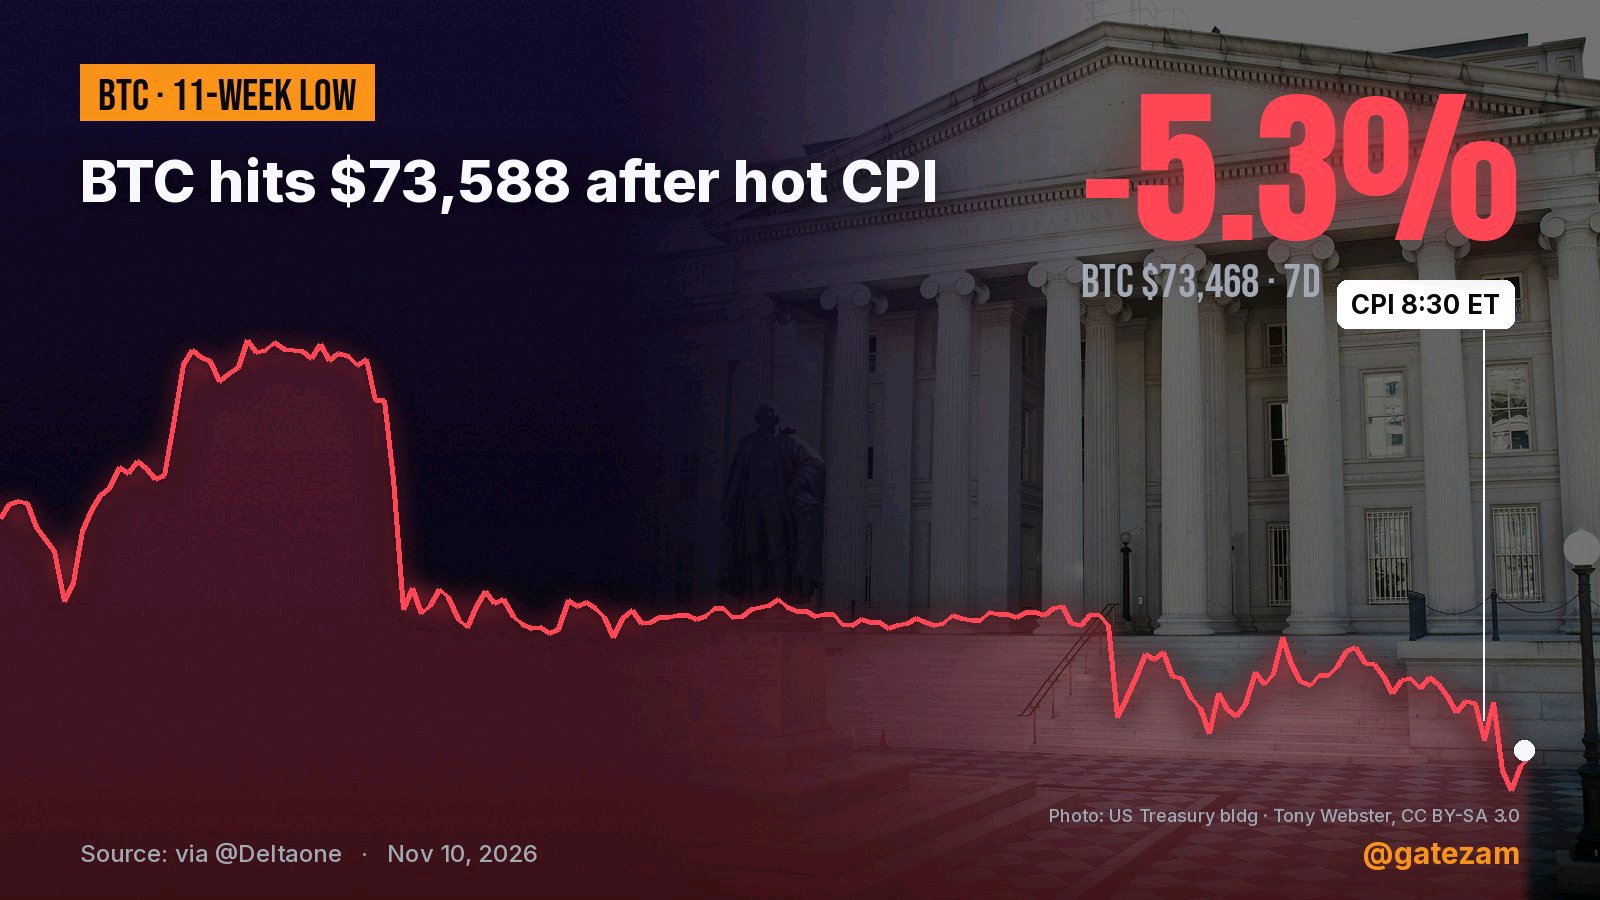
BTC mantiene los 73.4 mil dólares: IPC alto activa defensa de banda
Bitcoin está probando el soporte de la Banda de Bollinger inferior tras una publicación del IPC de EE. UU. más caliente de lo esperado, que empujó la inflación general mensual al 0.4% frente al 0.3% estimado. Aunque la volatilidad intraminuto se disparó en un rango de $1,250, el precio al contado está encontrando absorción inmediata cerca del límite inferior de su banda, mientras que un volumen de $5.43 mil millones en 24 horas defiende el suelo local de $72.6K. En Bybit, el $BTC cotiza cerca de $73,456.10 (-1.59%), manteniéndose justo por encima de su mínimo intradía de $72,686.60 después de rechazar el máximo de $75,408.00 con una rotación de $5.43 mil millones. Lo que revela el gráfico de 4H de Bybit: * Extensión de la banda inferior: El precio perforó hacia la Banda de Bollinger inferior ($73,321.66) para probar la mecha de soporte en $72,686.60 antes de estabilizarse. * Resistencia de media móvil: La resistencia dinámica superior está apilada en la MA7 ($74,359.52), MA14 ($74,698.89) y MA28 ($75,285.03), anclada por la banda media de 20 periodos ($75,046.29). * Compresión de momentum: El RSI(6) diario cayó a territorio de sobreventa en 32.61 (RSI12 en 35.06) con el WR14 en -77.94. El histograma MACD se sitúa en -94.59 con el DIF (-733.40) rastreando por debajo de la DEA (-638.81), lo que indica una desaceleración del momentum a corto plazo. Catalizadores macro de inflación y liquidez: El dato de inflación más caliente (General mensual +0.4%, Núcleo mensual +0.3%) impulsado por energía (+0.7%) y recreación (+0.8%) refuerza la cautela en la política de tasas de interés federal. Sin embargo, la absorción de liquidez sigue siendo robusta, ya que Bybit anunció actualizaciones de funcionalidad de pago automático para cuentas UTA, manteniendo una alta rotación de derivados en las principales mesas de trading. Dos configuraciones de ejecución en observación: * Defensa del soporte: Defender el suelo de la banda inferior en $73,321 y recuperar la MA7 ($74,359) abre un movimiento de reversión a la media con objetivo en la banda media de $75,046. * Continuación de la ruptura: Un cierre confirmado en 4H por debajo de $72,686 invalida el soporte a corto plazo, abriendo una caída secundaria hacia el estante de demanda macro de $70,500. Revisa la profundidad del libro de órdenes en vivo, los clusters de liquidación y las tasas de financiación en la tarjeta de Bybit a continuación antes de establecer posiciones. #ByXIMPACT No es asesoramiento financiero. Haz tu propia investigación (DYOR). #WSOT2026 #Observación del IPC de EE. UU. de nov. #WSOTPicktoEarn10U #Las nóminas de EE. UU. y las decisiones sobre tasas impulsan la semana macro #La volatilidad del petróleo sigue las conversaciones de paz con Irán $BTCUSDT $BTCUSDC

CAP Holds Above the Mid Band Under 0.106
$CAPUSDT is 0.10281. 24h high 0.12862, low 0.09854, turnover 11.01M on this pair. The marked high on the window is 0.12862. The marked low is 0.09236. Price is above the averages. MA7 is 0.10070, MA14 0.10098, MA28 0.10122. EMAs sit nearby: 0.10132, 0.10091. Bollinger mid is 0.10086, edges 0.10608 / 0.09563. Spot is through the cluster and under the upper band at 0.10608, well below the 0.12862 high. The 0.09236 low is the base below. That is a hold above the mid-band, not a break of the lid. MACD is still soft: DIF 0.00155, DEA 0.00195. DIF is under DEA and the histogram is red. RSI6 is 64.22, RSI12 57.31, RSI24 56.89. Fast clock is rising but not extreme. $CAP is the governance and utility token of Cap, an Ethereum-based covered credit protocol. The protocol issues cUSD (a dollar stablecoin) and stcUSD (its yield-bearing version). Depositors supply stablecoins; underwriters post collateral to cover loans to institutional borrowers. Total supply is fixed at 10 billion. A large portion remains in a timelock. That is the structure. It does not rewrite the 4h levels on the chart. Levels on $CAP: - 0.10608 — upper band - 0.10132 / 0.10070 — EMA7 and MA7 - 0.10086 — mid-band - 0.09563 / 0.09236 — lower band and marked low - 0.12862 — session high Bullish case: 0.1007 holds and $CAP closes above 0.106. Bearish case: a 4h reject under 0.106, with MACD still red, sends it back through 0.1007 toward the lower band. Would you treat the 0.106 upper band as the line that has to clear, or wait for a close back under 0.1007 before calling the hold done? Not financial advice. DYOR. #WSOT2026 #NovUSCPIWatch #WSOTPicktoEarn10U #USPayrollsAndRateDecisionsDriveMacroWeek #OilVolatilityTracksIranPeaceTalks
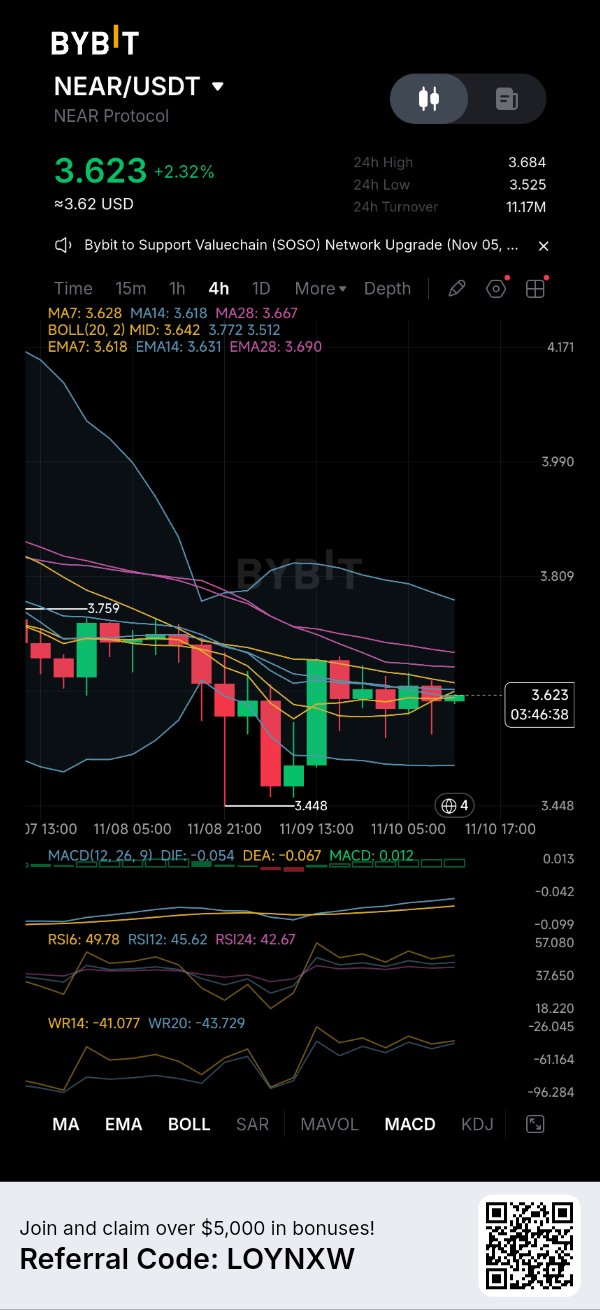
NEAR cut its issuance. Price didn't care.
$NEARUSDT just approved cutting its max issuance from 2.5% to 1.6% over 24 months. Price hasn't cared. Here's why. The cut is real but not live. It still needs Security Council review, a roughly 90-day grace period and validator adoption. It also lowers projected staking yield from about 5.3% to 3.4%, so it's a trade-off, not a free win. Meanwhile demand is soft: futures open interest fell to 230M NEAR from 318M on Oct 22, and NEAR is down about 39% from its October peak. 4H view: 3.623 is pinned on the MA7/MA14 (3.628 / 3.618), with MA28 and EMA28 overhead at 3.667-3.690. Bands are tightening and MACD is flat near zero. That's a squeeze. Bull: 4H close above 3.690, then 3.759 (last swing high). Bear: 4H close under 3.448 (swing low, near the 3.40 support analysts flag). Supply news matters over years. Price decides in days. Would you buy NEAR on a tokenomics change that isn't live yet? Not financial advice. DYOR. #WSOT2026 #NovUSCPIWatch #WSOTPicktoEarn10U #USPayrollsAndRateDecisionsDriveMacroWeek $NEARUSDC

SOL leverage is cleared. The buyers aren't back
$SOLUSDT is down about 30% from its late-September high near $124, and the leverage looks cleared. Futures open interest fell to $5.10B, the lowest since Aug 19. So why isn't it bouncing? Because the spot bid is missing. SOL ETFs have had five straight weeks of outflows (nearly $170M), with about $8.8M more provisionally out on Monday. 4H view: price 85.15 sits under MA7/14/28 (86.33 / 87.30 / 88.61), just above the lower band (84.52). RSI6 is 31 and WR is -95, so it's oversold. But the MAs all slope down and rebounds keep stalling under them. I don't see a base yet. Bull: 4H close above 88.61 (MA28/EMA28), then the broken trendline near 90-92 is the real test. Bear: 4H close under 84.89 puts 82 in play, then the 77.60 demand zone. Leverage gone, buyers missing. Do you wait for ETF flows to turn, or buy the oversold? Not financial advice. DYOR. #IMPACTbyTrade #WSOT2026 #NovUSCPIWatch #WSOTPicktoEarn10U #USPayrollsAndRateDecisionsDriveMacroWeek #OilVolatilityTracksIranPeaceTalks $BTCUSDT
INIT +65% on a halted chain. Not a thesis.
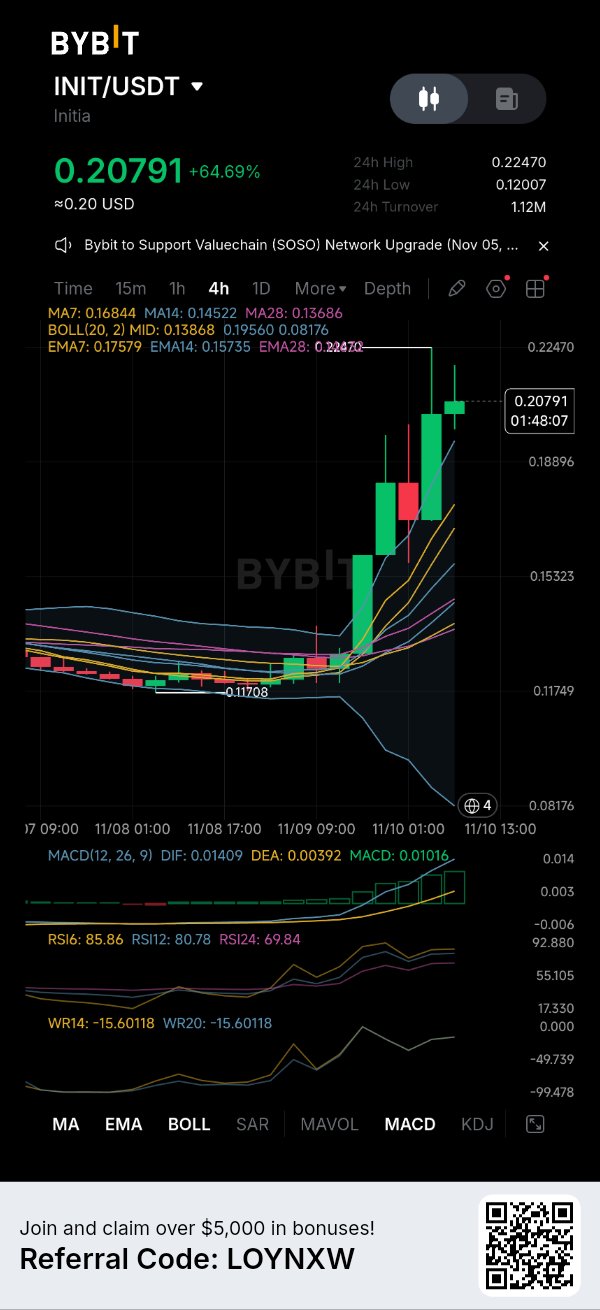
$INITUSDT is up 65% while its own chain is paused after an exploit. Read that again before you chase. Reported facts: attackers used compromised rollup keys to forge IBC transfers and drain about $605K in USDC, and the L1 paused block production. That follows an Oct 23 exploit of about $2.7M. Yet price ripped, with spot volume around $33M against futures volume near $883M, and funding deeply negative (about -1.8%). Negative funding means shorts were paying longs. That reads like a squeeze, not adoption. 4H view: 0.20791 is above the upper band (0.1956), RSI6 is 85.9, and price sits 23% above the MA7 (0.1684). The 0.2247 spike got rejected. Bull: 4H close above 0.2247, squeeze continues. Bear: a close under 0.1756 (EMA7) opens the fade zone down toward 0.1387 (mid band), near where the move started. Paused chain, thin liquidity, possible exchange restrictions. Size like it can gap both ways. Is this a squeeze you'd trade, or a trap you'd skip? Not financial advice. DYOR. #IMPACTbyTrade #WSOT2026 #NovUSCPIWatch #WSOTPicktoEarn10U #USPayrollsAndRateDecisionsDriveMacroWeek #OilVolatilityTracksIranPeaceTalks $BTCUSDT
ETFs are selling ETH. BitMine is buying.
$ETHUSDT spot ETFs have sold for six straight weeks: $365M out last week and another $185M on Monday. Meanwhile BitMine bought another 9,587 ETH and whales are reportedly accumulating. Someone is wrong. 4H view: ETH is 2,099.80, under every MA (MA7 2,122, MA14 2,155, MA28 2,197), with RSI6 at 28 and WR at -83. Oversold, yes. But oversold in a downtrend only means stretched, not finished. The 2,070.26 low is the line bulls need. 2,100 is the number everyone is watching. Lose it on a daily close and the next stops people quote are 2,000, then 1,850. Bull: 4H close above 2,155 (MA14), the first proof this bounce has legs. Bear: 4H close under 2,070.26, and 2,000 comes into play. US CPI hits at 2:30 pm Nigeria time. Size small before that print, my people. ETF sellers or dip buyers, who is right? Pick a side and say where you are wrong. Not financial advice. DYOR. #IMPACTbyTrade #WSOT2026 #NovUSCPIWatch #WSOTPicktoEarn10U #USPayrollsAndRateDecisionsDriveMacroWeek #OilVolatilityTracksIranPeaceTalks $ETHUSDC


Stocks ripped. BTC didn't. That's the tell
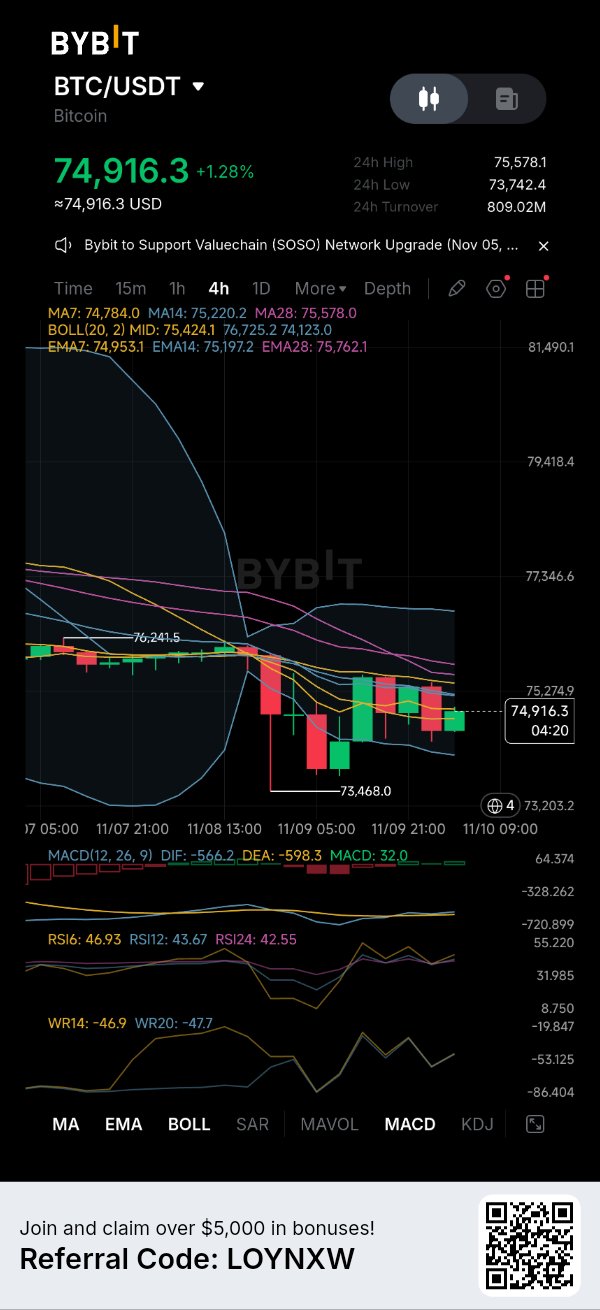
US stocks had their best day since April yesterday (S&P +2.3%). $BTCUSDT ? Barely moved, still around 75K. When BTC can't follow a risk-on day, I pay attention. Part of it is flows. Spot BTC ETFs have bled about $1.48B in November so far, with another $201M out on the latest print. The marginal buyer isn't showing up. 4H view: BTC is 74,916, boxed between the 73,742 low and 75,578 high. Overhead is a stack of resistance (MA14, EMA14, mid band, MA28, EMA28 at 75,197-75,762), and MACD is still below zero. The bands are tightening, so a move is loading. Bull: 4H close above 75,762, then 76,241 is next. Bear: 4H close under 73,468 and the weekend low is gone. US CPI drops at 2:30 pm Nigeria time, after the Fed's September hike. Don't marry a level before that print, my people. Is BTC lagging stocks a warning, or a coiled spring? Not financial advice. DYOR. #WSOT2026 #NovUSCPIWatch #WSOTPicktoEarn10U #USPayrollsAndRateDecisionsDriveMacroWeek #OilVolatilityTracksIranPeaceTalks $BTCUSDC

$HYPEUSDT Rebota desde los $72.47: ¿Podrán los toros recuperar los $77? Hyperliquid ($HYPE) intenta estabilizarse después de una fuerte caída que llevó el precio a $72.474. Actualmente cotizando alrededor de los $75.17, HYPE se ha recuperado de su mínimo reciente, pero el gráfico de 4H sugiere que los vendedores aún mantienen la ventaja general. Lo que revelan los indicadores: • El precio está por encima de la MA7 ($74.536) pero permanece por debajo de la MA14 ($75.965) y la MA28 ($77.245). • El histograma MACD se ha vuelto positivo en 0.082, lo que sugiere que el impulso bajista podría estar disminuyendo. • El DIF en -1.675 se ha movido por encima de la DEA en -1.758, aunque ambos permanecen por debajo de cero. • El RSI6 se sitúa en 45.89, mientras que el RSI12 y el RSI24 se mantienen alrededor de 40. Niveles clave a vigilar: - Soporte inmediato: $74.536 - Soporte mayor: $73.010–$72.474 - Primera resistencia: $75.965–$76.736 - Resistencia mayor: $77.245–$77.582 - Resistencia superior: $80.461 Un movimiento sostenido por encima de los $76.736 podría fortalecer el intento de recuperación, siendo los $77.245–$77.582 el siguiente obstáculo importante. Sin embargo, un rechazo alrededor de los $76 podría enviar a HYPE de vuelta hacia los $74.536. Perder ese soporte pondría nuevamente en el foco el mínimo reciente de $72.474. La mejora en el MACD vale la pena observarla, pero un cruce alcista por debajo de cero no confirma automáticamente un cambio de tendencia. Enfoque de trading: Observa cómo reacciona HYPE alrededor de los $76.7. Una recuperación confirmada podría mejorar el caso alcista, mientras que otro rechazo favorecería la cautela. Define la invalidación y evalúa la relación riesgo-beneficio antes de considerar una posición. ¿Podrá HYPE recuperar los $77, o defenderán los vendedores la zona de recuperación? #HYPE #Hyperliquid #Bybit No es un consejo financiero. DYOR (Haz tu propia investigación). #WSOT2026 #Observación del IPC de EE. UU. de nov. #WSOTPicktoEarn10U #Las nóminas de EE. UU. y las decisiones sobre tasas impulsan la semana macro #La volatilidad del petróleo sigue las conversaciones de paz con Irán
BNB at 686: Pricing the Platform Risk
$BNBUSDT is sitting at 686.67, and the market is doing something more important than watching a support line. It is repricing platform risk in real time. The chart shows the damage clearly. On the 1D timeframe, every moving average is above price: MA7 at 695.81, MA14 at 706.59, MA28 at 720.34. Price is pinned below the lower Bollinger Band at 719.97. MACD is negative (DIF -13.91, DEA -11.40, histogram -2.50). RSI6 is 35.83, RSI12 is 38.25. WR14 is -84.90. The structure is bearish, but the oscillators are stretched to the downside. The catalyst is not a normal correction. On October 29, Binance suffered a $6.3 billion security breach. The FBI linked the attack to North Korea's TraderTraitor group, and CZ confirmed US law enforcement helped freeze a significant portion of the stolen assets. Binance reported $3.64 billion in net outflows during the crisis window before resuming withdrawals. That is the event the chart is digesting. But here is what matters for the next move. Tonight, November 9 at 20:00, Binance co-CEO Richard Teng, Yi He, and CSO Jimmy Su are holding a public dialogue. This is not a routine update. After an incident of this size, the market is waiting to hear how the platform prices the risk, how users are compensated, and what the security failure actually was. The executives' answers will be the next input for the chart. The tokenomics side is quieter but still relevant. BNB completed its 37th quarterly burn on October 19, removing 1,646,196 BNB from circulation. Total supply is now 131,512,085, still working toward the 100 million floor. There are no scheduled unlocks. But the burn did not move price, which tells you the market is focused on the hack, not supply. Levels: · 673.21 (24h low): the immediate floor. Price is fighting here now. · 670–640: the demand zone buyers are trying to hold. Losing this opens the door toward 617–600. · 695.81 (MA7) and 706.59 (MA14): the reclaim zone. A close above this would suggest the panic is exhausting. · 719.97 (BB lower) and 720.34 (MA28): the level that would change the short-term trend. Bullish case: The oversold readings, the frozen stolen funds, and a clear public explanation tonight could stabilize the platform-risk premium. Reclaiming 695 and then 706 would be the first sign that buyers are looking past the hack. Bearish case: A daily close below 673 keeps the bearish stack intact. If the executives fail to provide clear answers on compensation or security, the 640 demand zone becomes the real test. Not financial advice. DYOR. Would you treat tonight's executive dialogue as a buying catalyst if the answers are clear, or does the chart need to reclaim 706 first before you trust it? #WSOT2026 #NovUSCPIWatch #WSOTPicktoEarn10U #USPayrollsAndRateDecisionsDriveMacroWeek #OilVolatilityTracksIranPeaceTalks $BNBUSDC


PEPE Reclaims $0.0000052: Upper Band Test Active
$PEPEUSDT has staged a strong multi-day recovery off its $0.00000421 baseline, pressing into upper Bollinger Band resistance as 24-hour volume holds firm at $18.44M. But bidding market orders directly into a structural supply cap without waiting for a daily close confirmation is how aggressive buyers risk catching pullbacks. On Bybit, $PEPE trades near $0.000005201 (+2.99%), consolidating near its 24h high of $0.000005392 after defending the $0.000004777 floor on 18.44M daily turnover. What the 1D Bybit chart reveals: * Upper band penetration: Spot price pierced above the $0.000005251 upper Bollinger Band to print a local wick high of $0.000005392 before pulling slightly back. * Moving average stack: The fast dynamic trend stack turned bullish, with price holding cleanly above MA7 ($0.000004947), MA14 ($0.000004881), and MA28 ($0.000004571), anchored by the 20-day mid-band ($0.000004751). * Momentum expansion: Daily RSI(6) expanded to 68.25 (RSI12 at 62.81) with WR14 sitting at -33.80. The MACD histogram printed green at +0.00000016 as DIF (0.000000202) holds above DEA (0.000000185). Market catalysts & ecosystem updates: PEPE’s breakout momentum follows a technical exit from its long-term descending channel, with daily trading volume expanding across major exchanges. In parallel, overall platform connectivity remains steady as Bybit confirmed active support for ecosystem network upgrades, including the Valuechain (SOSO) infrastructure maintenance. Two execution setups on watch: * Trend continuation: A confirmed daily close clearing $0.00000539 opens an expansion runway targeting the $0.00000568–$0.00000600 overhead liquidity shelf. * Support retest: Rejection at $0.00000539 opens an orderly pullback toward the $0.00000494 (MA7) or $0.00000475 mid-band floor to reset 6-period RSI conditions. Check live order book depth, meme coin liquidity, and funding rates on the Bybit card below before entering positioning. Not financial advice. DYOR. #WSOT2026 #NovUSCPIWatch #WSOTPicktoEarn10U #USPayrollsAndRateDecisionsDriveMacroWeek #OilVolatilityTracksIranPeaceTalks $PEPEUSDC


PIEVERSE Surges Hard, Catch The Trend Early 📈
$PIEVERSEUSDT is delivering an aggressive rally, climbing 40.19% to $2.0930 after breaking out of a prolonged consolidation around $1.35–$1.50. The 4H chart shows a clear shift in momentum: • Price is trading above MA7 ($1.6945), MA14 ($1.5592) and MA28 ($1.4497). • MACD is strongly bullish, with DIF at 0.1575 above DEA at 0.0981. • The MACD histogram has expanded to 0.0593. • RSI6 stands at 93.99, while RSI12 is 88.76, indicating extreme overbought conditions. • Price is trading significantly above the upper Bollinger Band at $1.9150. The breakout is impressive, but the distance from the moving averages suggests that chasing the rally at current levels carries substantial pullback risk. Key levels to watch: - Immediate resistance: $2.1821 - Psychological resistance: $2.20 - First support: $1.9150 - Secondary support: $1.7770 - Stronger support: $1.6945–$1.6294 A sustained breakout above $2.1821 could extend the bullish momentum. However, rejection near $2.18 could trigger profit-taking, with $1.9150 becoming an important level to monitor. The bigger question is whether this breakout can develop into sustained price discovery or whether buyers will need a cooling-off period first. Trading focus: Avoid chasing an extended candle. Watch for consolidation, a controlled pullback or a confirmed breakout retest. Check liquidity and define invalidation before considering any position. Is $PIEVERSE preparing for another leg higher, or is a cooldown approaching? Not financial advice. DYOR. #IMPACTbyTrade #WSOT2026 #NovUSCPIWatch #WSOTPicktoEarn10U #USPayrollsAndRateDecisionsDriveMacroWeek


SOL Rebounds From $85: Reclaiming $90 📈
$SOLUSDT is attempting to recover after a sharp sell-off pushed price down to $85.06. SOL is currently trading around $87.75, but the recovery still needs confirmation before a bullish reversal can be considered. What the 4H indicators reveal: • Price has reclaimed MA7 at $87.53 but remains below MA14 at $88.57 and MA28 at $89.98. • MACD remains negative, with DIF at -1.43 below DEA at -1.29. • RSI6 has recovered to 47.69, while RSI12 and RSI24 remain around 41. • The Bollinger midline sits at $89.09, making it an important recovery hurdle. Key levels to watch: - Immediate support: $87.46–$86.11 - Major support: $85.06 - First resistance: $88.33–$88.57 - Next resistance: $89.09–$90.00 - Higher resistance: $91.39 A sustained move above $88.57 could strengthen the recovery attempt, with $89.09–$90 becoming the next major test. However, rejection around $88.33–$89.09 could send SOL back toward $86.11. A breakdown below $85.06 would invalidate the immediate recovery scenario. The interesting development is that RSI is recovering while MACD remains bearish. Buyers are showing up, but they haven't established full control yet. Trading focus: Watch the $88.57 reclaim and the $86.11 support. Wait for confirmation, define invalidation and assess risk-to-reward before considering a position. Can SOL reclaim $90, or will sellers force another support test? Not financial advice. DYOR. #WSOT2026 #NovUSCPIWatch #WSOTPicktoEarn10U #USPayrollsAndRateDecisionsDriveMacroWeek #OilVolatilityTracksIranPeaceTalks $SOLUSDC


ARB Breakout And Approaching $0.188 Resistance
Arbitrum ($ARBUSDT ) is showing strong buying pressure after recovering from $0.15963. Price has climbed to $0.18405, approaching the recent high of $0.18792. The 4H technical structure has turned constructive. • Price is above MA7 ($0.17254), MA14 ($0.17050) and MA28 ($0.16705). • MACD is bullish, with DIF at 0.00344 above DEA at 0.00224. • The MACD histogram is positive at 0.00120, confirming improving momentum. • RSI6 is at 83.34, RSI12 at 74.20 and RSI24 at 64.33. However, there's a warning traders shouldn't ignore: ARB is trading above the upper Bollinger Band at $0.17820. This reflects aggressive buying but also increases the possibility of a short-term cooldown. Key levels to watch: - Immediate support: $0.17820 - Secondary support: $0.17254–$0.17050 - Stronger support: $0.16930 - First resistance: $0.18792 - Next psychological resistance: $0.19000 A sustained breakout above $0.18792 could extend the bullish move toward $0.19000. However, rejection around the recent high could trigger profit-taking and a retest of $0.17820. The momentum is impressive, but buying strength and chasing an extended candle are two different things. Trading focus: Watch for a confirmed breakout or a controlled pullback toward support. Define invalidation and assess risk-to-reward before considering a position. Can ARB clear $0.188, or is a cooldown coming first? Not financial advice. DYOR. #WSOT2026 #NovUSCPIWatch #WSOTPicktoEarn10U #USPayrollsAndRateDecisionsDriveMacroWeek #OilVolatilityTracksIranPeaceTalks $ARBUSDC


SUI Defends $0.80: Can Bulls Reclaim $0.85?
$SUIUSDT is attempting to stabilise after a sharp sell-off pushed price to $0.8011. Currently trading around $0.8294, SUI has recovered from its recent low, but the broader 4H structure remains under pressure. The technical picture is mixed: • Price remains below MA7 ($0.8313), MA14 ($0.8439) and MA28 ($0.8606). • MACD remains negative, with DIF at -0.0154 below DEA at -0.0131. • RSI6 has recovered to 42.49, while RSI12 and RSI24 remain below 42. • The Bollinger midline sits at $0.8518, leaving another resistance hurdle for buyers. Key levels to watch: - Immediate support: $0.8154 - Major support: $0.8011 - First resistance: $0.8313–$0.8439 - Next resistance: $0.8518–$0.8606 - Higher resistance: $0.8881 A sustained move above $0.844 could improve the recovery outlook, with $0.852–$0.861 becoming the next test. However, rejection around the moving averages could send SUI back toward $0.8154. A breakdown below $0.8011 would invalidate the immediate support-recovery scenario. The important distinction is between a temporary bounce and a genuine change in market structure. Trading focus: Watch whether buyers can reclaim $0.844 or whether sellers force another support test. Set alerts, define invalidation and assess risk-to-reward before considering a position. Can $SUIUSDC reclaim $0.85, or are sellers still in control? Not financial advice. DYOR. #WSOT2026 #NovUSCPIWatch #WSOTPicktoEarn10U #USPayrollsAndRateDecisionsDriveMacroWeek #OilVolatilityTracksIranPeaceTalks


ETH Retests $2,103: Support Compression In Play
$ETHUSDT is retesting the critical $2,103 demand floor as selling pressure compresses lower band volatility across intraday timeframes. Bidding market orders directly into dynamic overhead moving average resistance without waiting for structural defense confirmation risks catching secondary liquidity sweeps. On Bybit, $ETH trades near $2,103.44, testing its intraday baseline low after pulling back from local resistance. What the chart structure reveals: * Demand floor test: Spot price is battling to hold the $2,100–$2,105 zone, which serves as the primary line of defense against extended down-trending expansion. * Dynamic moving average resistance: Overhead trend resistance remains anchored by short-term moving averages, keeping pressure on the lower Bollinger Band boundary. * Momentum reset: Short-period RSI and MACD indicators are pressing into oversold territory, signaling an impending expansion or mean-reversion move off current price compression. Fundamental & institutional context: Ethereum network liquidity continues to adjust following exchange ecosystem developments, including Bybit's verified support for active L2 token migrations like Aerodrome (AERO) and ongoing Layer-2 settlement activity across Base and mainnet DeFi infrastructure. Two execution setups on watch: * Support defense: Holding the $2,100 support floor and reclaiming dynamic 4H MA resistance opens a mean-reversion move targeting the upper band ceiling. * Breakdown continuation: A confirmed close below $2,100 clears the path for a liquidity sweep toward key lower macro demand zones. Check live order book depth and funding rates on the Bybit card below before entering positioning. Not financial advice. DYOR. #WSOT2026 #NovUSCPIWatch #WSOTPicktoEarn10U #USPayrollsAndRateDecisionsDriveMacroWeek #OilVolatilityTracksIranPeaceTalks $ETHUSDC


$BTCUSDT Block Hits 11.2K Transactions: Historical Milestone Bitcoin's base layer just printed a rare milestone. AntPool successfully mined block 974961, packing a staggering 11,255 transactions into a single block—the second-highest transaction count in Bitcoin history. The block came within 984 transactions of breaking the all-time network record of 12,239 set over a decade ago on August 1, 2015. Operating at an efficient ~1.1 MB size (occupying 99.85% of block weight limits), it highlights an exceptionally dense throughput environment. What this on-chain milestone reveals: * Sustained base-layer demand: This event underscores a 2026 macro trend defined by consistently elevated daily transaction counts and high-density mempool activity. * Fee efficiency: Despite the massive payload of 11,255 transfers, total block fees remained remarkably light at roughly 0.0024 BTC, reflecting optimized transaction batching. * Network resilience: Miners continue to push maximum block-space efficiency without disrupting confirmation cadence or security parameters. Two execution perspectives on watch: * Throughput expansion: Sustained high-density block metrics point toward structural scaling adoption across secondary and batching protocols. * Fee market sensitivity: Persistent high transaction counts place increased focus on mempool congestion tracking during high-volatility market windows. Check live order book depth, network hashrate, and funding rates on the Bybit card below before managing your spot or derivatives positioning. Not financial advice. DYOR. #WSOT2026 #NovUSCPIWatch #WSOTPicktoEarn10U #USPayrollsAndRateDecisionsDriveMacroWeek #OilVolatilityTracksIranPeaceTalks $BTCUSDC

