VenomRanaBNB
1940Me gusta0Compartir en el chat43Aficionados53Seguir
Content Creator 😎 Technical Analysis, Trading ideas ✨
Content Creator 😎 Technical Analysis, Trading ideas ✨
$XRPUSDT ¿Es esto una oportunidad de compra o una señal de advertencia? XRP ha experimentado una presión de venta significativa, por lo que la confirmación del mercado es especialmente importante. Estoy observando: Si XRP puede mantener sus mínimos recientes. Si los compradores regresan con un volumen más fuerte. Si el mercado cripto en general comienza a recuperarse. Intentar atrapar un mercado en caída sin confirmación puede ser arriesgado. Los traders inteligentes observan la acción del precio en lugar de seguir las emociones. Holders de XRP, ¿se mantienen pacientes o esperan una señal de recuperación más fuerte? #IMPACTbyTrade

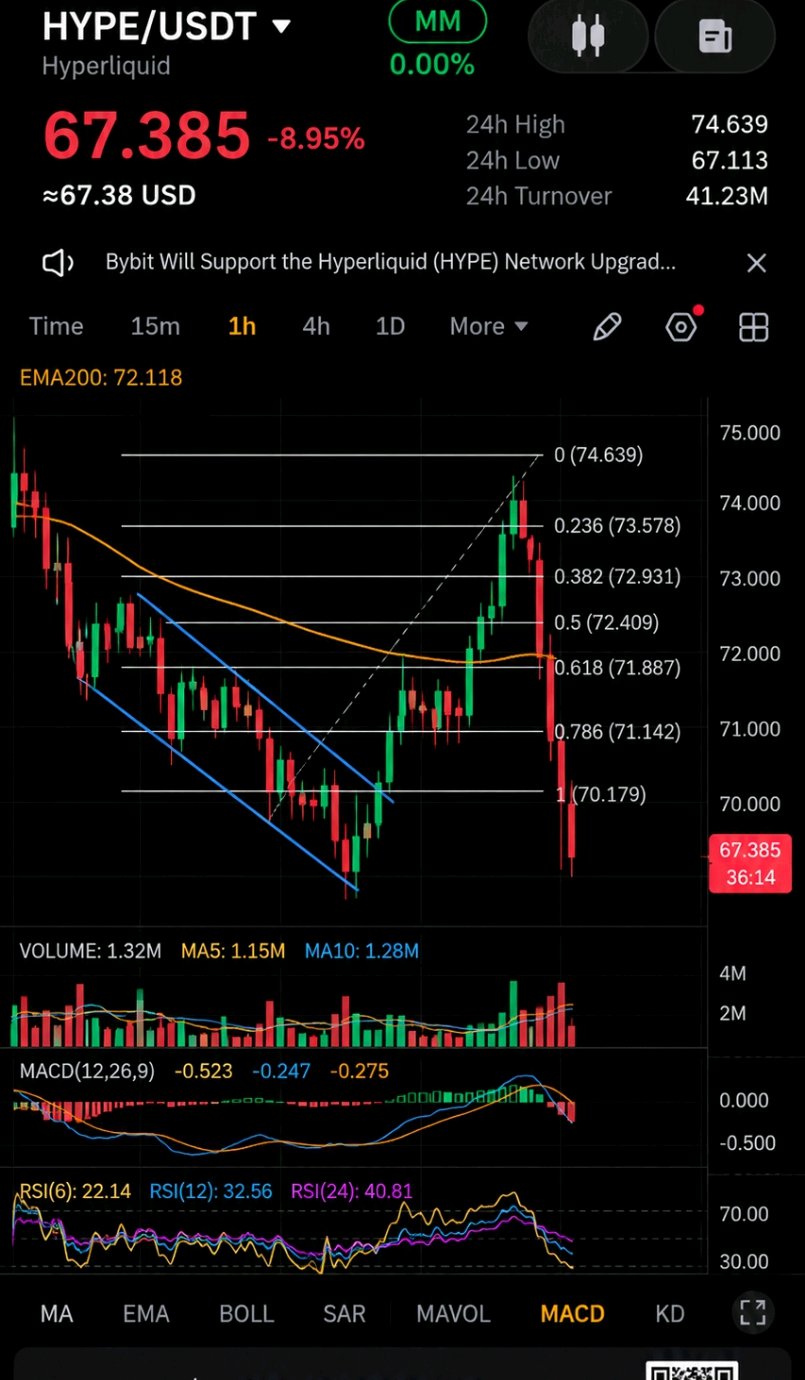
HYPERLIQUID (HYPE): Is the Market Underestimating Its Potential? Hyperliquid is an interesting project to watch in the decentralized trading sector. My focus is on three factors: 1. Growth in platform activity. 2. User adoption and ecosystem development. 3. Whether HYPE can regain market strength. Long-term potential and short-term price action are two different things. I want to see real ecosystem growth before becoming overly bullish. What matters more to you: HYPE's technology, adoption, or price performance? $HYPEUSDT #IMPACTbyTrade

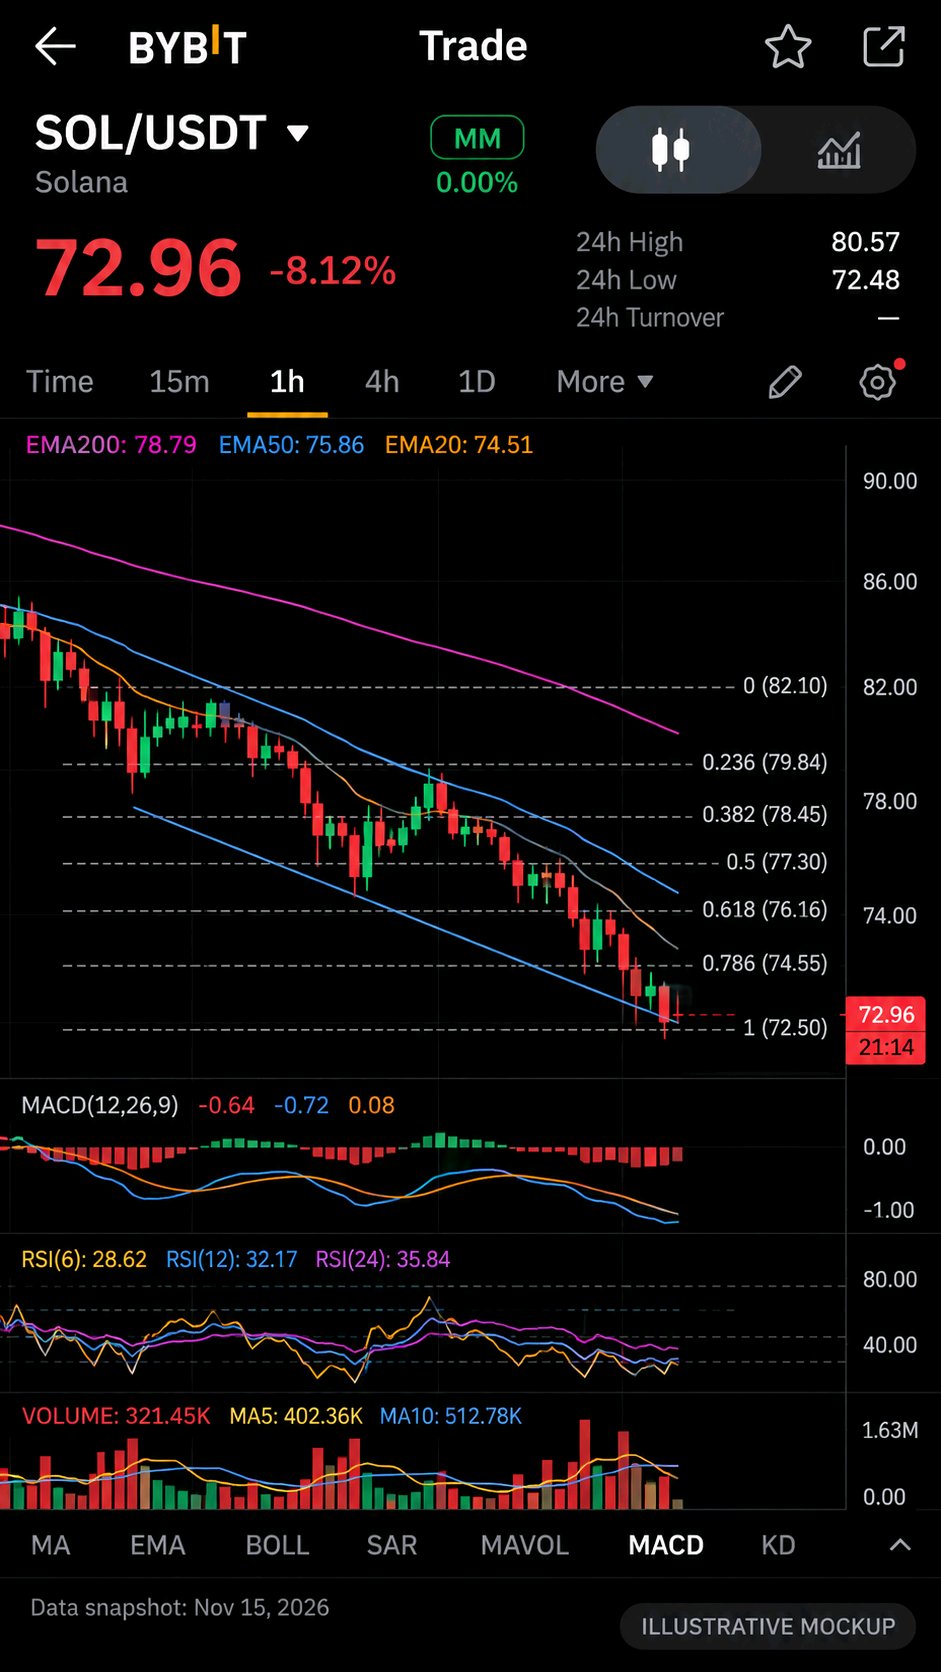
SOLANA ($SOLUSDT): Can Bulls Turn the Momentum Around? Solana is facing a challenging market environment, and traders are watching closely for signs of strength. Here are three things I am monitoring: Whether buyers defend the recent support area. Whether trading volume starts recovering. Whether SOL can build a stronger market structure. A recovery needs confirmation, not just hope. SOL community: Are you waiting for a bullish reversal or expecting more downside? #IMPACTbyTrade

ETHEREUM: A Critical Moment for ETH Bulls! Ethereum is facing an important test as market uncertainty continues. Here are three things worth watching: ETH's ability to hold its key support zone. Whether buying volume starts increasing. Whether ETH shows strength compared with Bitcoin. A strong recovery needs confirmation, not just optimism. Ethereum remains one of the most important assets to watch in the crypto market. ETH holders, are you bullish or bearish on the next move? Why? $ETHUSDT #IMPACTbyTrade

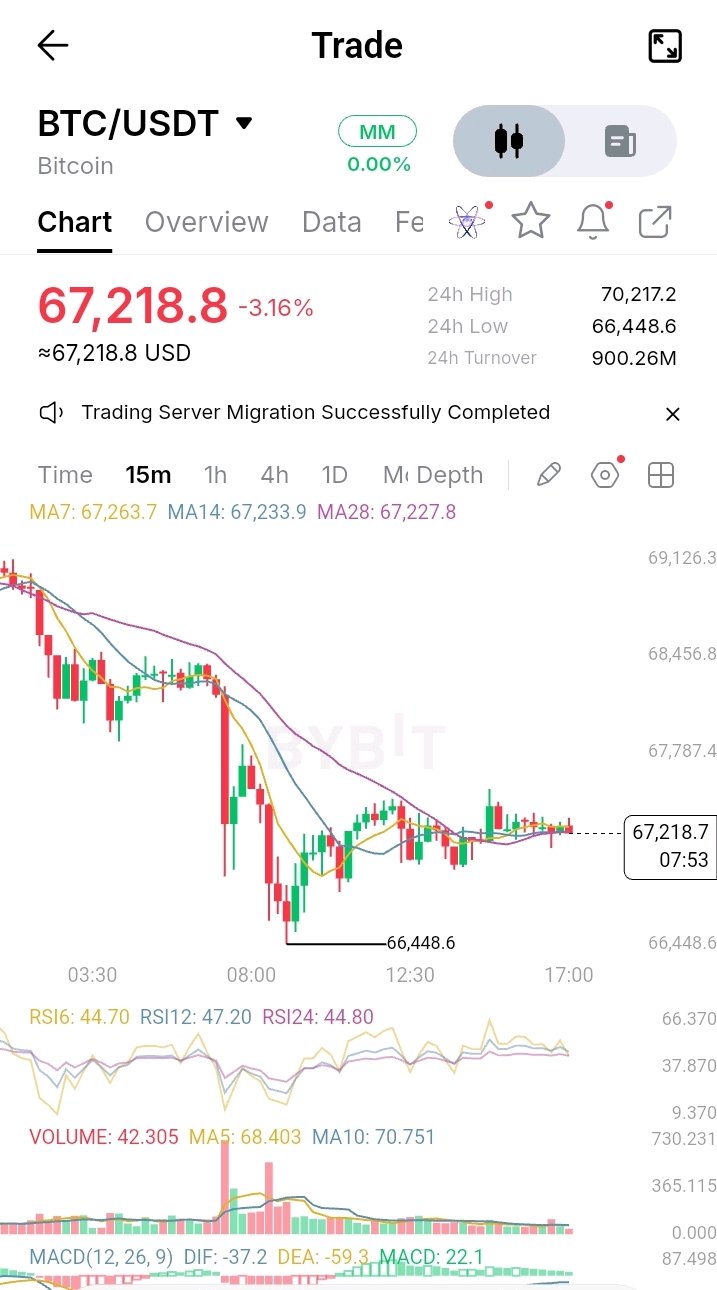
BITCOIN: Is This a Recovery or Just a Temporary Bounce? Bitcoin's recent market weakness reminds us that every bounce is not necessarily a trend reversal. The key things I am watching: Can buyers defend important support zones? Will trading volume confirm the recovery? Can BTC reclaim resistance with strong buying pressure? I believe patience and confirmation are more important than chasing every price movement. What do you think: Is Bitcoin preparing for a recovery, or could sellers remain in control? $BTCUSDT #IMPACTbyTrade
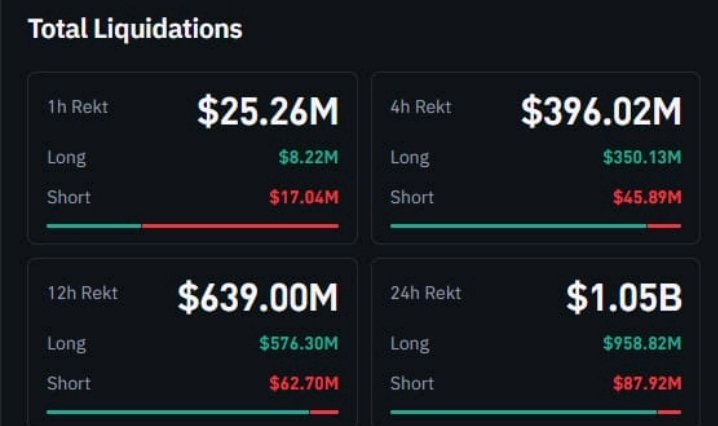
Over $1 billion in crypto liquidations in just 24 hours, with nearly $959 million coming from LONG positions. The market is reminding traders that leverage can be dangerous when momentum turns against you. Don't chase every move. Protect your capital and trade with a plan. Survival comes first. $BTCUSDT $ETHUSDT #ByXIMPACT
Ethereum is seeing a growing commitment to staking, yet its market price is moving in the opposite direction. That disconnect deserves more attention than another prediction about where ETH goes next. At $1,771.70, ETH is down 8.31% on the Bybit chart. The four-hour structure is firmly bearish. Price sits below the 7, 14 and 28-period moving averages, while RSI has fallen to 14.75. The $1,728.93 low is now an important level to watch. But the more interesting detail is happening beneath the price chart. According to Ethereum staking data recorded on November 13, approximately 922,423 ETH were waiting to enter staking, compared with 232,310 ETH waiting to exit. Around 36.28% of the total ETH supply was already staked. That suggests validator participation remains substantial even as market sentiment weakens. However, there is an important distinction between staking demand and actual market demand. Locking ETH into validators does not automatically create new spot buyers, nor does it guarantee price support. Network participation and token valuation are driven by different forces. For traders, the immediate question is whether ETH can defend $1,728.93. For long-term holders, the bigger question is whether growing network participation can eventually translate into stronger economic demand for ETH. Those two stories are not necessarily moving together. $ETHUSDT #ByXIMPACT
SOL biggest tokenomics misconception is that rising network activity automatically makes the token scarcer. It doesn't. The distinction lies in how Solana distributes transaction fees. According to its official documentation, only 50% of base transaction fees are burned. The other 50% goes to validators. More importantly, 100% of priority fees also goes to validators. That changes how network growth should be interpreted. Higher transaction demand can increase validator income without creating an equivalent reduction in SOL supply. Meanwhile, staking rewards are funded through protocol inflation. Solana's published monetary policy started at 8% annual inflation, declining by 15% each year toward a 1.5% long-term rate. Those rewards support network security, but they also introduce new SOL into circulation. The supply figures make this relevant. Solscan currently reports approximately 591.1 million SOL in circulating supply, with roughly 429.2 million actively staked. The chart shows SOL at $72, down 10.12%, with price trading below its major moving averages on the four-hour timeframe. The important question is not simply how much activity Solana generates. It is how much of that activity translates into sustainable value capture for SOL holders. Until fee generation and token scarcity become more closely aligned, network growth and token value remain two different measurements. $SOLUSDT #ByXIMPACT
HYPE está mostrando un fuerte colapso técnico, pero la pregunta más interesante es si el negocio subyacente de Hyperliquid puede resistir la presión sobre su token. La captura de pantalla de Bybit muestra a HYPE/USDT cotizando a $67.385, una baja del 8.95%, con un máximo de 24 horas de $74.639 y un mínimo de $67.113. El precio se acerca al mínimo de la sesión, lo que indica que los vendedores siguen teniendo el control. En el gráfico diario, HYPE cotiza por debajo de los tres promedios móviles mostrados: MA7 en $72.281, MA14 en $77.138 y MA28 en $79.078. Esta alineación confirma una estructura bajista a corto plazo y no solo una corrección intradía aislada. El impulso es particularmente débil. El RSI6 se sitúa en 16.16, el RSI12 en 27.20 y el RSI24 en 36.76. Estas lecturas indican condiciones de sobreventa profunda, pero sobreventa no significa automáticamente una reversión. Mientras tanto, el MACD sigue siendo negativo, con el DIF en -3.327, el DEA en -2.107 y el histograma en -1.219. Hay otra advertencia importante: el volumen de negociación mostrado es de 290.53K, por debajo del volumen de la MA5 de 481.74K y de la MA10 de 435.81K. La caída es significativa, pero la captura de pantalla aún no muestra un volumen en expansión que confirme una capitulación o reversión fuerte. El problema más profundo es la diferencia entre la economía del protocolo de Hyperliquid y la valoración de mercado de HYPE. Hyperliquid tiene un mecanismo de captura de valor significativo. Según sus declaraciones presentadas ante la SEC, el 99% de las comisiones del protocolo se asignan al Fondo de Asistencia, que compra HYPE en el mercado abierto. Para el 8 de septiembre de 2026, aproximadamente 47.1 millones de HYPE habían sido adquiridos y quemados permanentemente a través de este mecanismo. Esto crea una conexión directa entre la actividad comercial y la demanda del token. El negocio subyacente también muestra una actividad sustancial. La investigación del tercer trimestre de 2026 de Bitwise reportó $228.1 millones en comisiones e ingresos por reservas, $730.1 mil millones en volumen de negociación y un interés abierto promedio de $12.7 mil millones. Los mercados HIP-3 contribuyeron con $261.5 mil millones en volumen, lo que representa el 36.5% de la actividad de perpetuos. Amazon Web Services, Inc. Sin embargo, aquí es donde la contradicción se vuelve importante: una economía de protocolo sólida no garantiza una apreciación inmediata del precio. HYPE todavía enfrenta riesgos de distribución de suministro y liquidez en todo el mercado. Tokenomist reportó aproximadamente el 49.47% del suministro máximo de mil millones de tokens desbloqueado al 13 de noviembre, con más consolidación (vesting) de contribuyentes programada. El suministro futuro que entra en circulación puede compensar parte de la presión de compra generada por el Fondo de Asistencia. Para los inversores, los niveles técnicos inmediatos son los que importan. El área de $67.11 es el primer soporte visible en la captura de pantalla. Una ruptura sostenida por debajo de este nivel aumentaría el riesgo a la baja. Por el lado de la recuperación, reclamar los $72.28 es la primera prueba significativa, seguida de $77.14. Estos son niveles de referencia de promedios móviles, no zonas de resistencia confirmadas. La tesis alcista permanece intacta si la actividad comercial, la generación de comisiones y las quemas de HYPE se mantienen fuertes mientras el precio se estabiliza y recupera sus promedios diarios. La tesis bajista se fortalece si el volumen aumenta en nuevas caídas, el soporte falla y el crecimiento del suministro circulante supera las compras de tokens. Mi conclusión: Hyperliquid ha demostrado una demanda comercial real y un mecanismo de comisión-a-token inusualmente directo. Pero el mercado actualmente cuestiona cuánto de esa fortaleza económica merece reflejarse en la valoración de HYPE. ¿Es este un reajuste de mercado temporal de un protocolo fuerte, o está HYPE entrando en un restablecimiento de valoración más largo a pesar de su creciente ecosistema? $HYPEUSDT #ByXIMPACT
Bitcoin just closed a session below the short-term holder cost basis near $75,700 while the broader market’s cash reserves keep shrinking. Stablecoin supply has contracted by roughly $14 billion over the past 30 days the steepest drop since June 2022. That pool of dry powder on exchanges and on-chain is the fuel that normally absorbs sell pressure and funds rebounds. At the same time, U.S. spot Bitcoin ETFs have recorded consecutive days of net outflows, and short-term holders as a cohort now sit largely underwater. The result is a market that can still move sharply lower on modest selling because the usual buyers are either absent or themselves realizing losses. Miner flows to exchanges spiked in one recent window, but the larger picture is thinner liquidity rather than widespread capitulation. Long-term holders continue to control the majority of supply and have not flooded the market. Price action around $67,000 therefore reflects more than a simple technical breakdown. It reflects a temporary shortage of the very capital that has historically turned dips into accumulation opportunities. Whether that capital returns depends less on the next candle and more on whether the stablecoin contraction reverses. $BTCUSDT #ByXIMPACT
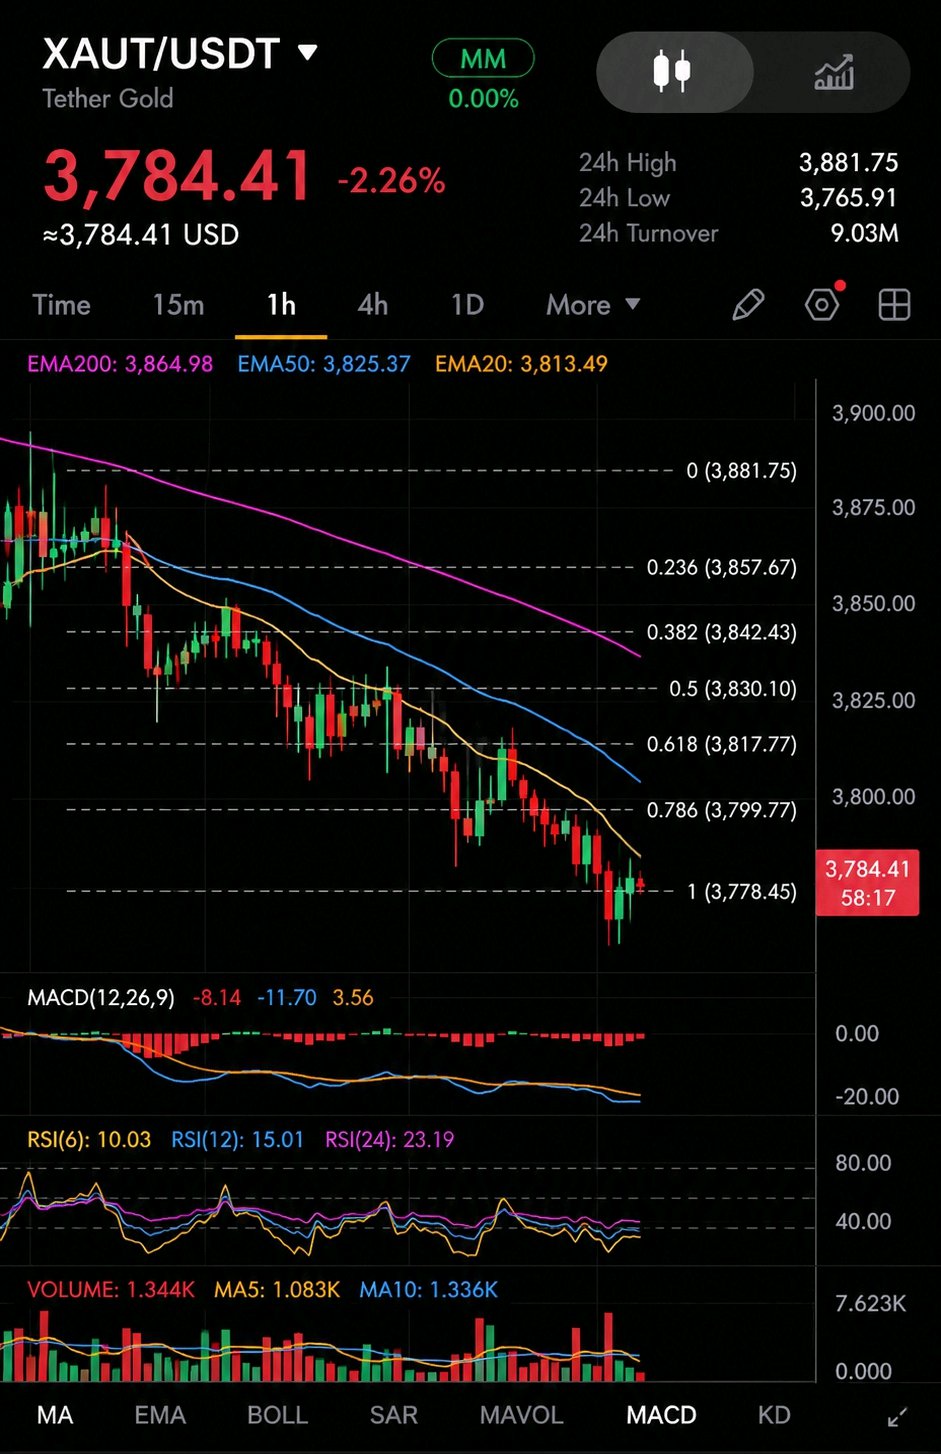
KPMG just counted every gold bar behind Tether Gold. The Big Four firm issued an unqualified opinion on TG Commodities’ 2025 financial statements and physically inspected each bar rather than relying only on custodian records. At year-end 2025 the audit confirmed 520,089 ounces of allocated London Good Delivery gold in Swiss vaults against the same number of XAUT tokens. That is a genuine step up from quarterly BDO attestations. Yet the audit is a snapshot of December 31, 2025. By the end of September 2026, Tether reported reserves had grown to roughly 827,000 ounces. Nearly 40 percent of today’s circulating supply was added after the period KPMG examined. Each XAUT is meant to represent an undivided ownership interest in a specific bar. The gold is held for token holders, not the issuer. Still, the custodian is a related party and remains unnamed in public disclosures. Redemption for physical metal requires a full Good Delivery bar — around 430 XAUT at current prices — so most holders exit through secondary markets rather than the vault. A full audit of last year’s books strengthens the historical claim. It does not continuously verify the bars added since. For a token whose entire value rests on physical metal, the gap between the audited date and the current supply is the detail that still matters. $XAUTUSDT #ByXIMPACT

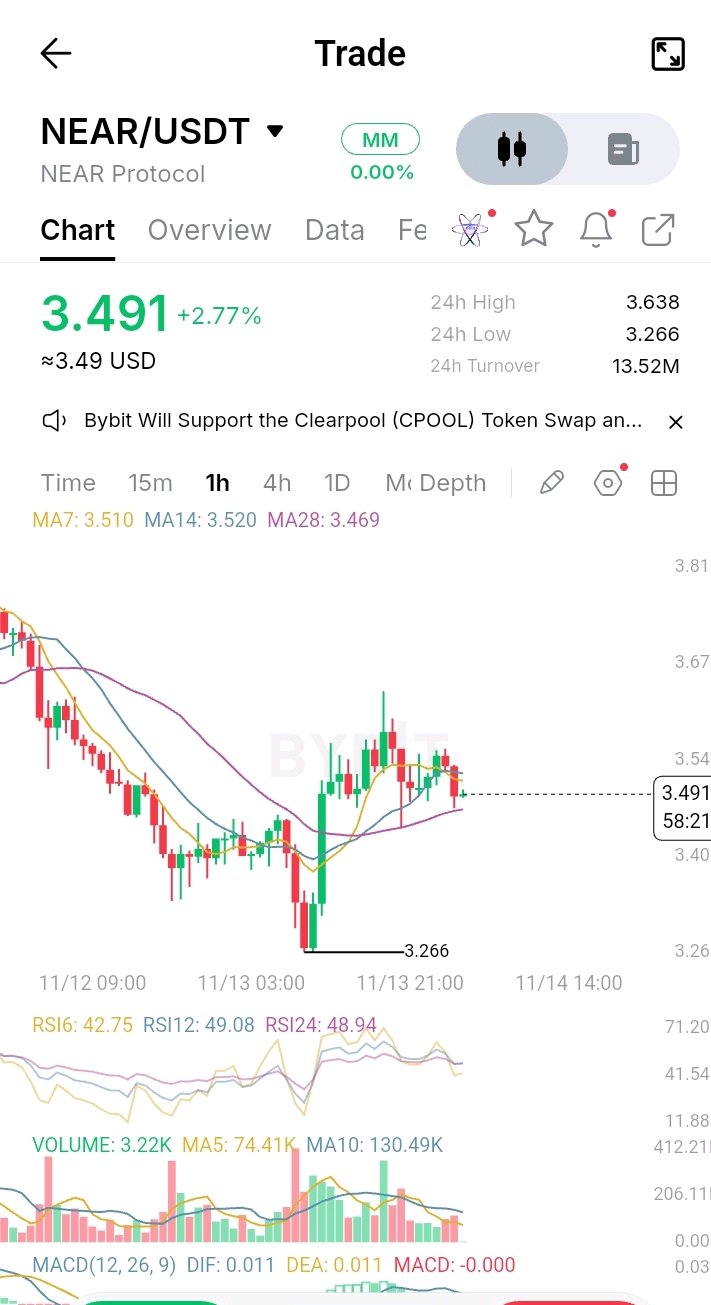
$NEARUSDT acaba de votar para reducir su emisión máxima otro 36%, pasando del 2.5% al 1.6%. Aun así, cada 30 días la red sigue creando aproximadamente cinco veces más NEAR en términos de dólares de lo que recompra su principal producto generador de ingresos. La House of Stake aprobó la HSP-029 el 2 de noviembre. La reducción es gradual, comienza meses después de la ratificación y aún requiere una versión de nearcore además de la adopción por parte de los validadores para que sea vinculante. Con el suministro actual de aproximadamente 1.31 mil millones y un precio cercano a los $3.50, el límite existente del 2.5% produce alrededor de $9 a $10 millones en nuevos tokens al mes. NEAR Intents, el enrutador multicadena que ya ha procesado decenas de miles de millones en volumen, está capturando cerca de $1.8 millones mensuales para recompras en el mercado abierto. Incluso con el objetivo completo del 1.6%, los cálculos siguen estando desequilibrados. La emisión aún superaría los ingresos capturados actualmente por un múltiplo claro. El fundador ha señalado el desajuste estructural él mismo: la demanda llega como ingresos en dólares, mientras que la inflación es un porcentaje fijo del suministro. Un precio más alto de NEAR significa que los mismos ingresos retiran menos tokens frente a una tasa de emisión sin cambios. La mayoría de los tokens recién emitidos van a los validadores (stakers). Los poseedores que no hacen staking enfrentan una menor dilución con la tasa más baja, pero la tensión principal no desaparece. El primer recorte del 5% al 2.5% a finales de 2025 ya redujo a la mitad la emisión diaria y se ha mantenido. El segundo recorte aprieta aún más las tuercas. Si la captura de comisiones de Intents puede crecer lo suficientemente rápido como para cerrar la brecha restante es el número que el mercado seguirá poniendo a prueba. #ByXIMPACT
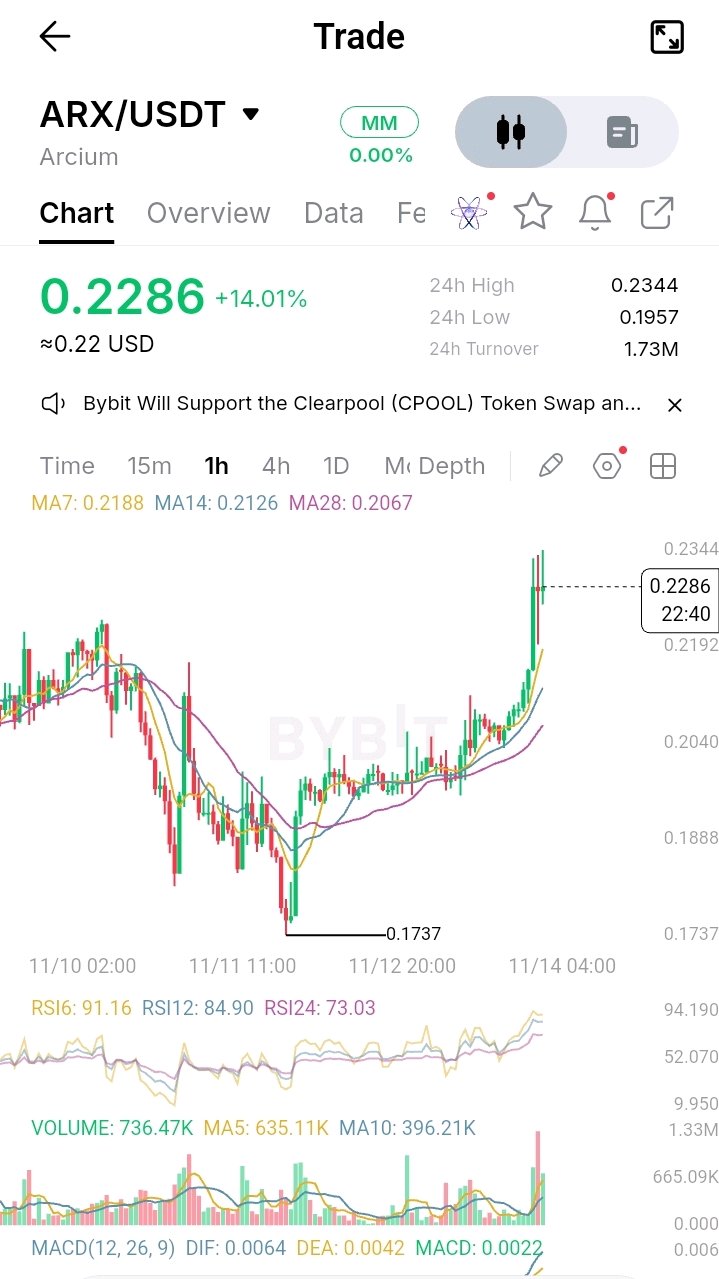
$ARXUSDT acaba de subir un 14% en la gráfica de 1 hora mientras el RSI se mantiene por encima de 90. El movimiento está ocurriendo con un float que apenas alcanza el 21% del suministro fijo de 1 mil millones. Esa cifra baja en circulación no es un accidente. En el TGE de junio de 2026, se desbloquearon aproximadamente 208.8 millones de ARX. Casi todo lo demás —respaldos iniciales, colaboradores principales, ángeles, validadores— se encuentra detrás de un periodo de bloqueo (cliff) de 12 meses. Los primeros desbloqueos significativos para inversores y el equipo no comenzarán hasta junio de 2027. El detalle más interesante es para qué sirve realmente el token. Las tarifas de computación en Arcium se pagan con el activo nativo de la cadena anfitriona, principalmente SOL. El setenta por ciento de esas tarifas va a los operadores de nodos, el 20% a los nodos de recuperación y el 10% a la tesorería. ARX en sí no es el token de pago de tarifas. Es una garantía que los operadores deben hacer staking para ofrecer capacidad de cómputo, además de ser un token de gobernanza cuyo poder de voto escala según la duración del bloqueo. Esto crea un desfase estructural. La demanda de ARX solo aumenta cuando los operadores necesitan más garantía para expandir su capacidad o cuando los holders bloquean sus tokens para tener influencia en la gobernanza. No aumenta automáticamente con cada computación confidencial que procesa la red. Hasta que la demanda de staking o la actividad de gobernanza crezca significativamente, la captura de valor del token sigue siendo indirecta. El bajo float actual amplifica cada movimiento en ambas direcciones. El mismo calendario que protegió al mercado durante el primer año comenzará a liberar tramos más grandes a mediados de 2027. Si esos desbloqueos encontrarán una demanda real de staking o simplemente golpearán el mercado es la gran incógnita que los próximos seis meses empezarán a responder. #ByXIMPACT

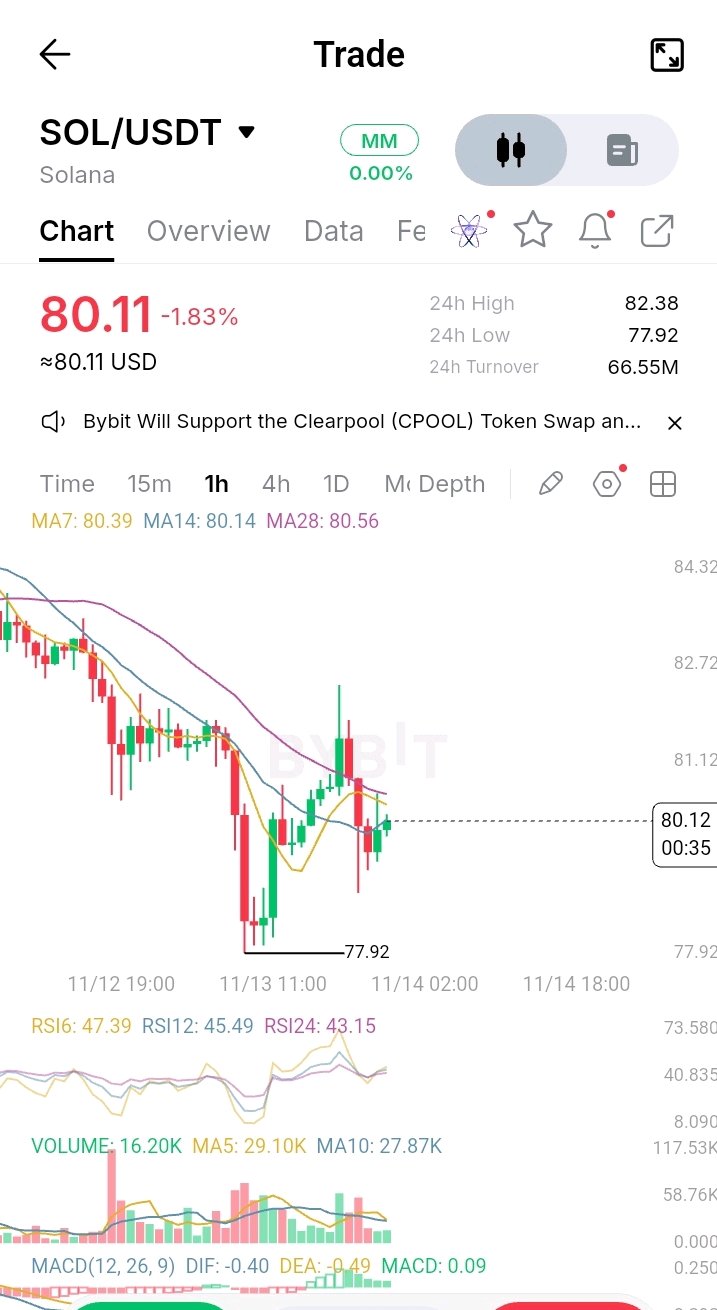
$SOLUSDT is testing $78 support while the network has produced blocks without a single halt for over 1,000 days and Alpenglow now targets 150 ms finality. Most of the original genesis allocations are long unlocked. Circulating supply sits near 591.5 million of roughly 637.5 million total. That looks clean on a surface dashboard. It is not the full picture. New SOL still arrives every epoch through staking rewards at the current ~3.56% inflation rate. On top of that, residual Alameda and FTX bankruptcy releases continue on a monthly cadence—approximately 637k SOL on the 11th of each month through early 2028. Add the remaining locked stake accounts that unlock on fixed dates and the next 90 days still inject roughly 1.14% new supply into the float. Staking currently locks about 68% of total supply and delivers a gross yield near 5.2%. That absorbs some pressure, but it does not eliminate the continuous issuance. Every new SOL paid to validators and stakers still expands the denominator that price must overcome. The contradiction is sharp. Network reliability and speed have improved dramatically since the last outage in February 2024. Institutional pipelines (DTCC tokenization targeting H2 2027, tokenized funds already live) are lengthening. Yet the supply schedule remains structurally expansive until the disinflation taper accelerates or demand grows faster than the roughly 22–23 million SOL issued annually at current rates. Holders who treat SOL as “fully unlocked” are measuring the wrong variable. The residual schedule and ongoing inflation are the variables that still matter. #ByXIMPACT
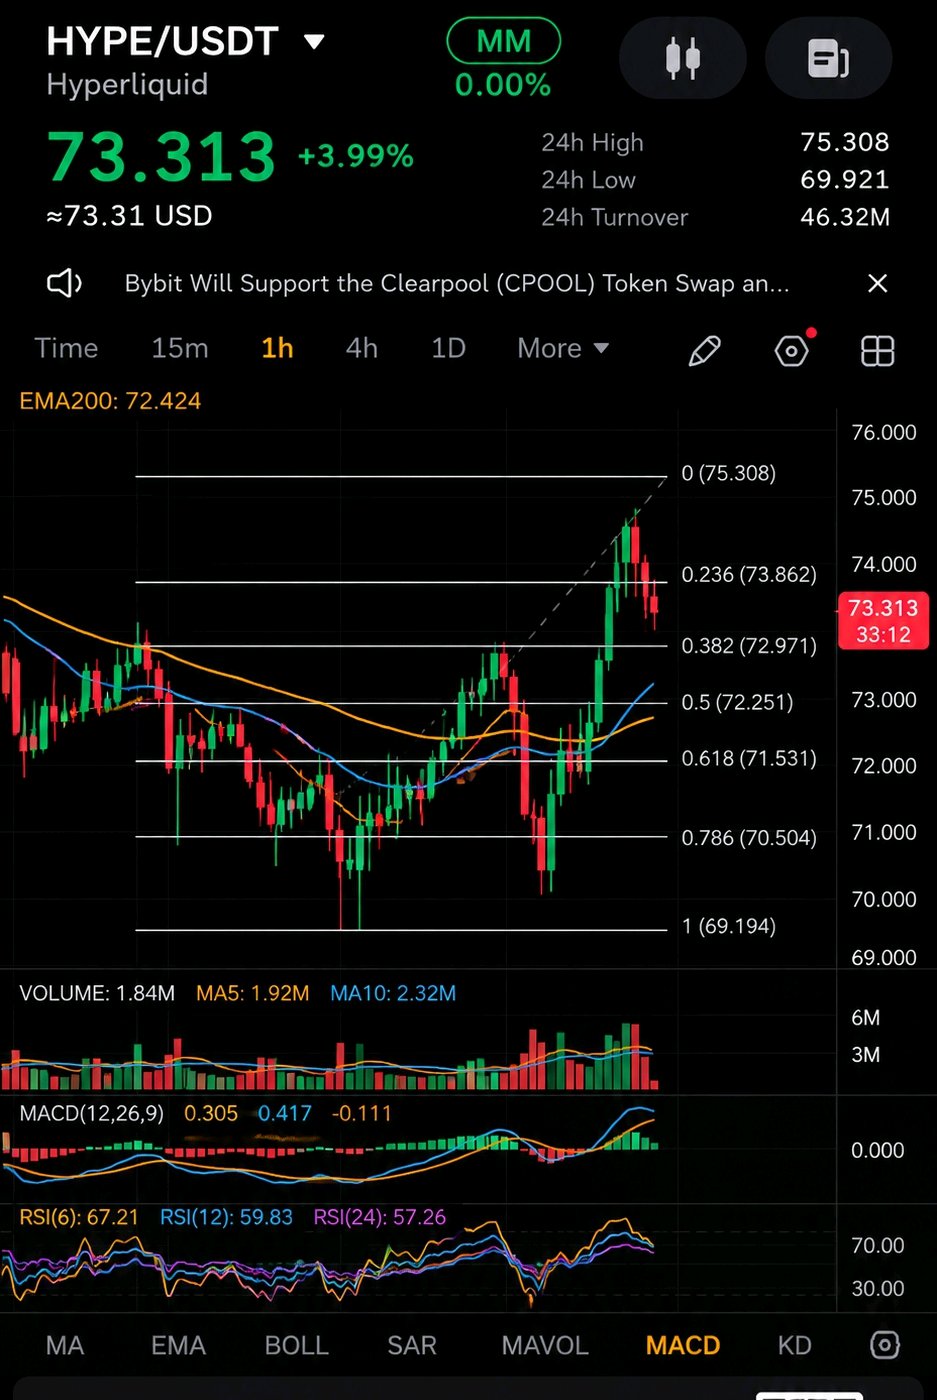
$HYPEUSDT trades near $73 after reclaiming the short-term moving averages, yet the more interesting number sits off the chart. Hyperliquid’s Assistance Fund has already accumulated and treated as burned more than 50 million HYPE roughly 5% of the original 1 billion max supply funded almost entirely by trading fees. That is not a one-time event. Every day the order book generates volume, a portion of those fees continues to buy HYPE and remove it from the effective supply. Meanwhile the circulating figure reported by most trackers sits around 25–30%. The remaining bulk is either reserved for future emissions, locked under contributor vesting that runs through 2027–2028, or staked. The one-year cliff on the 23.8% core-contributor allocation ended late 2025; actual monthly releases since then have been far smaller and more discretionary than the theoretical linear schedule many models assume. The result is a token that faces ongoing sell pressure from vesting while simultaneously experiencing continuous, protocol-native demand from its own fee stream. Most perpetual DEXs distribute fees or keep them in a treasury. Hyperliquid routes them into permanent removal. That mechanism does not eliminate unlock risk, but it does create a structural offset that pure emission schedules lack. Whether the burn rate can outpace future vesting and any increase in free float remains the open question. The data so far shows the buy-side from fees is real and measurable. The sell-side from unlocks is slower and less predictable than the calendars suggest. #ByXIMPACT
Bitcoin just flushed to a 24-hour low near 67,500 while already sitting at roughly 95.8% of its hard-capped 21 million supply. That number sounds scarce. The tradable reality is tighter still. On-chain estimates put the effective float coins that are neither lost, long-term held, nor locked in ETFs and similar vehicles closer to 29% of the total that will ever exist. Newly mined supply continues at about 450 BTC per day until the next halving. In a market where daily demand can run several times that figure, the available inventory is thinner than the circulating-supply headline suggests. The recent drop occurred against a backdrop of consecutive U.S. spot ETF outflows totaling roughly $1.5 billion across six sessions. When the institutional buyer steps back, the thin free float amplifies the move in both directions. Price does not need massive absolute volume to travel far; it only needs the marginal seller to meet limited willing buyers. This is not a new design feature. It is the mechanical result of a fixed issuance schedule colliding with years of accumulation and irreversible loss. The same scarcity that supports the long-term narrative also means short-term liquidity can evaporate faster than most charts imply. What remains uncertain is how quickly that float can expand again if sentiment turns. Until it does, every large outflow tests a market that is already more concentrated than the 20.11 million circulating figure advertises. $BTCUSDT #ByXIMPACT
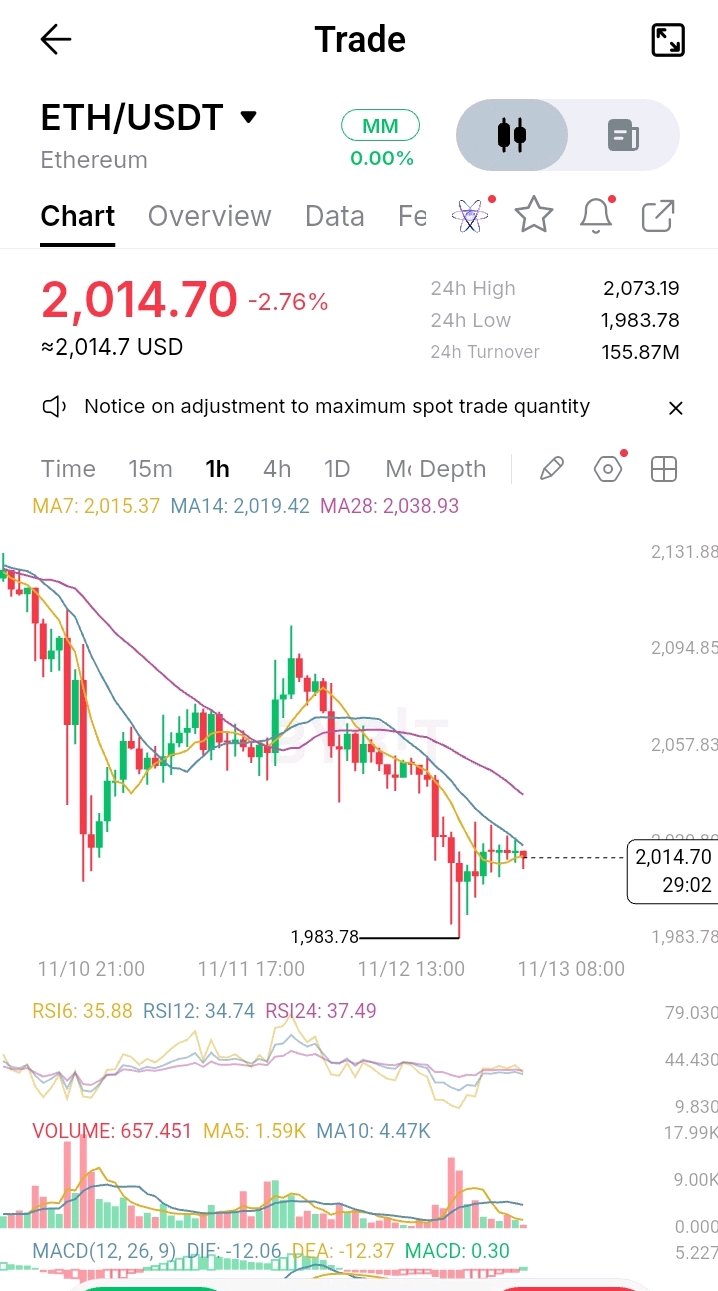
El rebote de Ethereum aún no ha reparado el daño $ETHUSDT se mantiene alrededor de $2,014 después de otra sesión difícil, y el gráfico de 1 hora explica por qué no me estoy apresurando a cantar un suelo. El movimiento importante ocurrió cerca de los $1,983.78. Los compradores intervinieron agresivamente tras esa caída, evitando una continuación inmediata a la baja. Sin embargo, el rebote ha sido relativamente débil en comparación con la venta masiva previa. Ese es el problema. Ethereum sigue cotizando por debajo de sus medias móviles de 1 hora, mientras que el RSI se mantiene cerca de 35. El mercado muestra cierta estabilización, pero los compradores no han demostrado la fuerza suficiente para cambiar el panorama a corto plazo. Existe un margen estrecho para que los alcistas mejoren la situación. Un movimiento por encima de los $2,040 sería un primer paso significativo, especialmente si ETH logra mantenerse por encima de ese nivel en lugar de solo superarlo brevemente. A partir de ahí, $2,057 es la siguiente zona que vale la pena probar. Si no se logra ese movimiento, ETH podría quedar vulnerable de nuevo. El nivel psicológico de $2,000 está cerca, pero la referencia más importante es $1,983.78. Otra visita a ese mínimo pondría bajo presión el intento de recuperación actual. Curiosamente, el MACD ha comenzado a mejorar ligeramente. Eso podría significar que la parte más fuerte de la ola de ventas se está desvaneciendo, aunque todavía no establece una tendencia alcista. Prefiero perderme la primera parte de una recuperación que comprar un rebote que no ha demostrado ser sólido. ¿Crees que ETH ya encontró un suelo a corto plazo, o necesita probar de nuevo los $1,984 antes de que los compradores puedan tomar el control? #ByXIMPACT

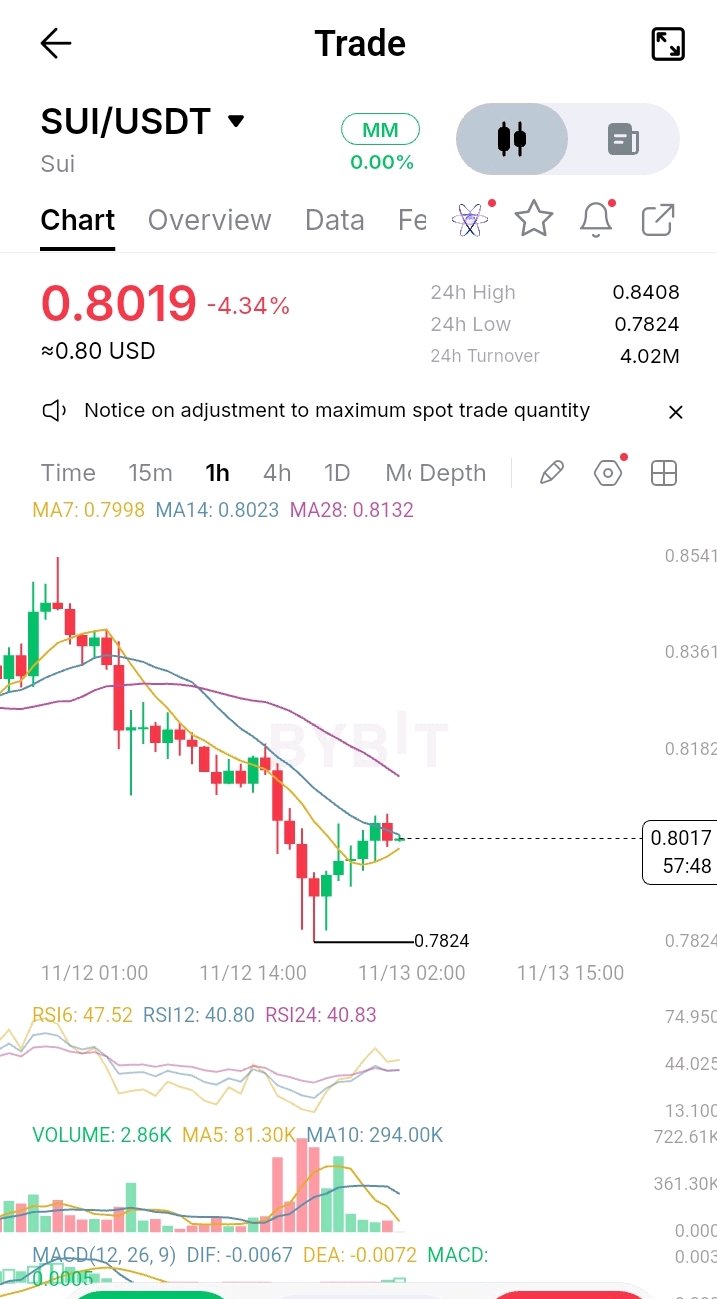
$SUIUSDT se está recuperando desde los $0.7824, pero los compradores aún no han recuperado el control SUI se está negociando cerca de los $0.8019 después de caer un 4.34% en las últimas 24 horas. Lo interesante de este gráfico es que los compradores han logrado alejar el precio del mínimo de $0.7824, pero la recuperación está empezando a perder impulso cerca de una zona de resistencia clave. Estoy observando de cerca el área de $0.8023–$0.8132. Esta zona es importante porque contiene las EMA14 y EMA28 de 1 hora. SUI se ha recuperado por encima de su EMA7 en $0.7998, pero todavía le cuesta recuperar los promedios más altos. Hasta que los compradores no recuperen esta área, veo el movimiento como un rebote de alivio más que como una reversión de tendencia confirmada. Hay un detalle más que vale la pena vigilar: el volumen se ha enfriado considerablemente después de la intensa actividad alrededor del mínimo reciente. El rebote aún no ha atraído la misma participación que la venta masiva, lo que me hace ser cauteloso al llamarlo una recuperación fuerte. Si SUI recupera los $0.8132 y se mantiene por encima, la siguiente área a vigilar está alrededor de los $0.8182, seguida de los $0.8361. Si la recuperación falla, los $0.7998 son el primer nivel cercano a monitorear. Perder esa área podría poner nuevamente en el foco a los $0.7824. Las lecturas del RSI se sitúan en territorio neutral a débil, mientras que el MACD muestra una ligera mejora, pero permanece por debajo de cero. Esa es una señal temprana de estabilización del impulso, no una prueba de que la presión de venta más amplia haya terminado. Personalmente, quiero ver a SUI recuperar la resistencia con un volumen más fuerte antes de considerar que la recuperación es convincente. ¿Está SUI construyendo una base para otro intento al alza, o simplemente se les está acabando la fuerza a los compradores cerca de los $0.81? #IMPACTbyTrade

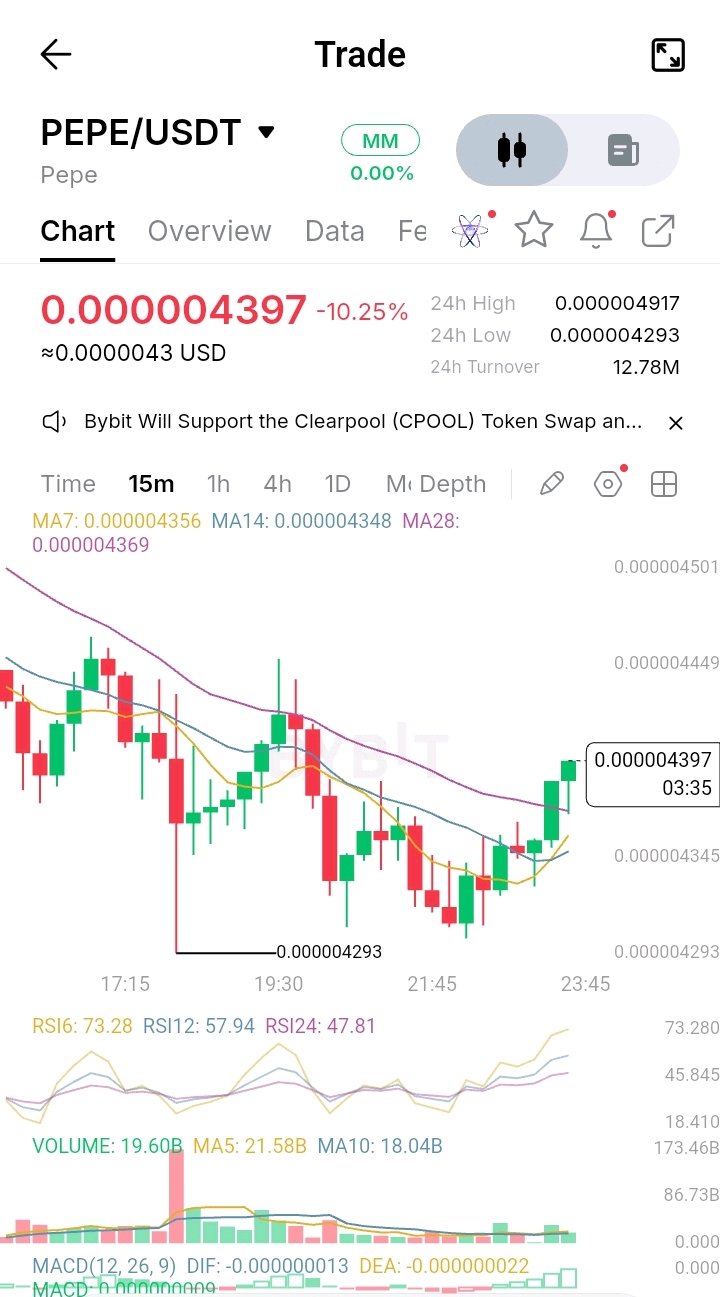
$PEPEUSDT Is Bouncing From $0.000004293, But Can Buyers Turn This Into a Real Recovery? PEPE is still down 10.25% over 24 hours, trading near $0.000004397. But the latest 15-minute chart shows something worth watching: buyers have stepped in after price touched $0.000004293 and pushed it back above the short-term moving averages. That recovery is encouraging, but there's a difference between a short-term bounce and a genuine change in trend. The interesting part is that PEPE has reclaimed the MA7, MA14 and MA28, currently clustered around $0.000004348–$0.000004369. Short-term RSI has also climbed to 73.28, showing that buying momentum has accelerated. However, that high RSI also makes me cautious about chasing the latest green candles. A brief pullback would not be surprising. I'm watching $0.000004369 as an important nearby support area. If buyers defend this zone, PEPE could attempt to challenge $0.000004449, followed by the $0.000004501 area. But if price falls back below the moving-average cluster, the recovery could lose momentum. The recent low at $0.000004293 remains the key downside level. One thing I don't want to overlook is the bigger picture: a 10.25% daily decline is still significant. The latest bounce needs follow-through before I start calling it a reversal. PEPE has shown that buyers are willing to defend the lows. Now I want to see whether they can defend the recovery. Would you trust this bounce, or wait for PEPE to break above $0.000004449 first? #IMPACTbyTrade
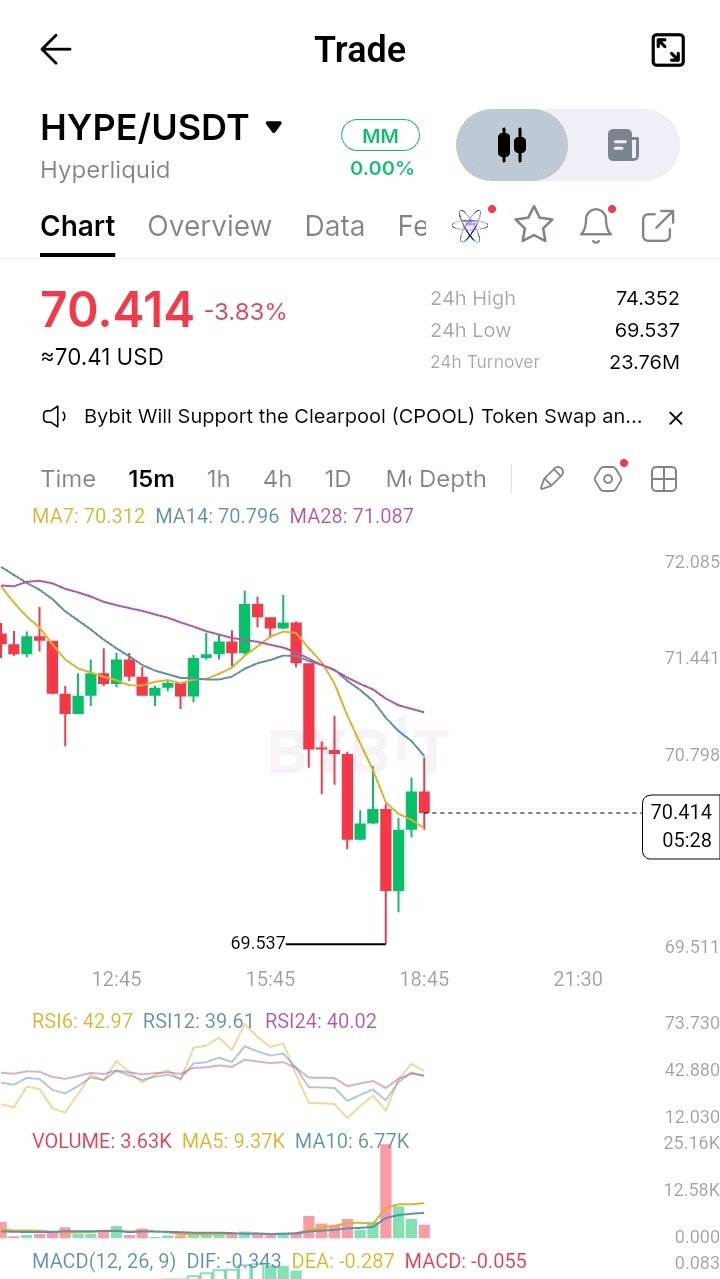
HYPE rebotó desde los $69.53, pero la recuperación enfrenta su primera prueba real HYPE ha caído un 3.83% en las últimas 24 horas y cotiza alrededor de los $70.41. Lo que me llamó la atención en la gráfica de 15 minutos no es solo la fuerte venta, sino la reacción después de que el precio tocara los $69.537. Los compradores intervinieron e impulsaron a HYPE de vuelta por encima de los $70, evitando una continuación bajista inmediata. Eso es alentador, pero no confundiría un rebote con un cambio de tendencia. Todavía hay un problema para los toros. El precio se mantiene por debajo de las medias móviles de 14 y 28 períodos, actualmente cerca de los $70.80 y $71.09. Las lecturas del RSI a corto plazo también están por debajo de 50, mientras que el MACD permanece negativo. En otras palabras, los vendedores aún tienen la estructura a corto plazo más fuerte. Estoy observando de cerca el área de $70.80–$71.10. Si HYPE puede recuperar esta zona y mantenerla en un nuevo test, la recuperación podría ganar credibilidad, con los $71.44 como la siguiente área de resistencia. Pero si los compradores fallan aquí, el mínimo de $69.537 vuelve a estar en el radar. Una ruptura por debajo podría exponer a HYPE a otro tramo bajista. Un detalle que no quiero ignorar es el volumen. El movimiento brusco alrededor del mínimo reciente vino con un aumento notable en el volumen, pero el volumen más reciente se ha enfriado. Eso significa que el rebote aún necesita una participación más fuerte para demostrar que la demanda está regresando. No me apresuraría a entrar en largo solo porque HYPE rebotó desde el mínimo. Primero, quiero ver a los compradores recuperar la resistencia y defenderla. ¿Es este el comienzo de una recuperación de HYPE, o solo un rebote temporal antes de que regresen los vendedores? $HYPEUSDT #IMPACTbyTrade