Bao 宝
6406Suka0Pembagian172Penggemar253Ikuti
$GRAMUSDT just did something rare: every average agrees on the price. After sliding from 1.113 to 1.016 (about 8.7%), GRAM is sitting at 1.049 with the 7, 14 and 28-period MAs stacked at 1.051, 1.049 and 1.049. On the 1h chart, that's a market that has stopped disagreeing with itself. For most of this move, the 28 MA was a ceiling sloping down and every bounce died under it. Now it's flat, and price is sitting on it instead of below it. That's not a reversal. It's the end of the one-way pressure. What bothers me is the volume. The latest bar is 156K against a 5-bar average of 384K. The sell-off came on heavy volume. The recovery from 1.016 came on lighter, fading volume. Buyers stepped in, but they haven't paid for the move yet. The order book shows 91% bids, but I wouldn't lean on that. Bids can be pulled in seconds, and a lopsided book next to shrinking volume often means people are placing orders, not taking price. What I'm watching -Above 1.073: the 24h high and the first higher high since the drop. That's the real signal. - Below 1.016: the low gets swept and the recovery was just a pause. - 1.016–1.073: a range about 5.6% wide, and price is sitting in the middle of it. The part most people will skip Suppose GRAM breaks 1.073 and you chase it, with a stop under 1.016. Risk is about 5.3%. The first logical target, 1.113, is only about 3.7% away. That's roughly 0.7R, which is a bad trade even if you're right about direction. The better version is a reclaim of 1.073, a retest that holds, and a tighter invalidation. Without that, this isn't a setup yet. It's a compression, and a compression on fading volume resolves with a candle, not an opinion. I'm not calling it either way. I need a close above 1.073 with volume well above that 384K average, or a break under 1.016 that fails to bounce. #IMPACTbyTrade
$MNT bounced 4% off the low and walked straight into resistance Mantle has recovered from 0.3631 to 0.3773, and the 1h chart has just run into the 28-period MA near 0.3786. The latest candle is red with an upper wick, so buyers got the touch but couldn't hold it. That matters more than the bounce itself. Price only climbed back above the 7 and 14 MAs (0.3750 and 0.3731) after the slide had already stretched. The 28 MA is still the highest of the three and still sloping down, so the structure hasn't flipped. This is a recovery inside a downtrend until proven otherwise. The volume tells the same story. The selloff printed heavy bars, with several well above the 10-period average of 974K. The bounce has been quieter, and the latest bar is around 795K, below both averages. A real reversal usually has participation behind it. This looks more like the market catching its breath. Don't read too much into the 98% bid in the order book. Resting bids are easy to place and easy to pull. What counts is whether price can close above resistance. Where the bounce stands: - The recovery covers about 35% of the drop from 0.4036 to 0.3631. - The 50% retrace sits near 0.3834, and the 24h high is 0.3940. Both are untouched. - A hold above 0.3786 would be a real change in tone. What I'd need to see - A 1h close above the 28 MA, followed by a retest that holds it as support. - Volume that expands on the push instead of fading. Hypothetical setup, not a live signal: an entry near 0.379 after a confirmed hold, a stop under 0.3725, and a first target at 0.3940 would give roughly 2.3:1. If price loses 0.3731 first, the setup is off and 0.3631 is back in play. A break below that low would suggest the bounce was just a pause. I'm not chasing this into resistance. Right now the market has shown a bounce, not a reversal. The 0.3786 close is what separates the two. Not financial advice. $MNTUSDT #IMPACTbyTrade

$HYPEUSDT HYPE swept $60 and rebounded 13.7%. The volume tells me the easy part is over. HYPE's wick to $60.063 came on the heaviest volume of the whole move. Buyers answered within hours, and price is now back at $68.27, above the 7, 14 and 28 hourly MAs. That is a real reclaim. It also changes the question. The capitulation candle printed the biggest volume bar on the chart. The latest bar is around 9K against a 5-period average above 31K. The sell-off had conviction and the recovery is quiet. Buyers are not leaving, but they are not pressing either. $69 is the ceiling. The 24h high is $69.008, and the last pushes up were rejected with an upper wick. Price is about 1.1% below it and has not cleared it yet. The MAs have also not turned bullish. MA7 is up at $66.90, but MA14 ($65.92) is still under MA28 ($66.14), and the downward slope of the whole leg is only now flattening. Price is also 6.7% below the $72.86 high that started this drop. I would not call a trend reversal until that level is reclaimed. Where the R:R changes These are hypothetical setups, not signals. Chasing a break above $69: with an invalidation near $66.90, risk is about $2.10 and the move to $72.86 is about $3.86. That is roughly 1.8:1. Waiting for a retest of $66.1–66.9: the reward-to-risk is much better, but a stop tucked under $65.9 sits inside normal hourly noise. A wider stop erases most of that edge. I'd rather see a retest hold on lighter selling than buy the breakout. If $66 fails, the sweep low was just the first half of the move. Buyers were fast. Whether they are still willing to pay up is the part nobody has proved yet. #IMPACTbyTrade
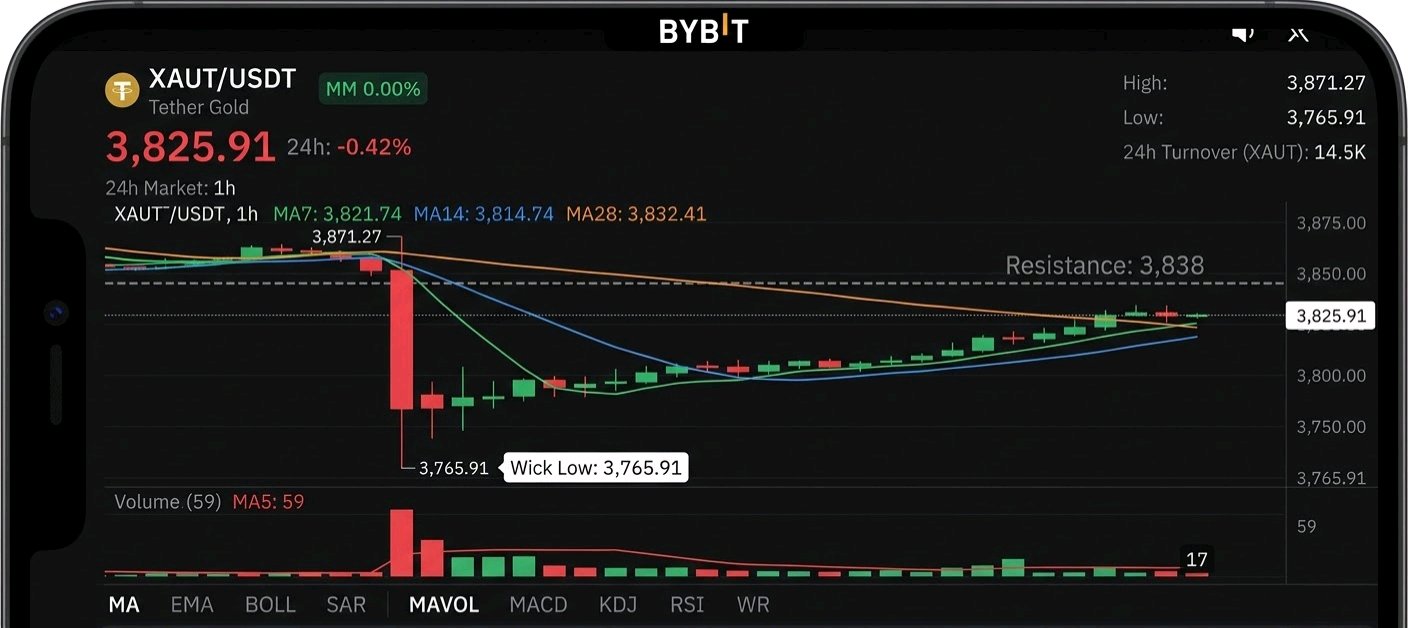
$XAUTUSDT XAUT swept the lows at 3,765.91, but the recovery is running on fading volume The drop was violent. XAUT fell through the 1h moving averages in one heavy-volume leg and wicked down to 3,765.91. The buyers who stepped in there did real work, and price is back at 3,825.91, about 57% of the 24h range. But the volume has gone quiet. The flush came on the biggest bars of the session. The bounce has been built on shrinking participation, and the latest bar shows about 17 against a 5-bar average near 59. A reversal needs buyers to show up with conviction, and so far they haven't. The moving averages show the same split: - MA7 (3,821.74) and MA14 (3,814.74) have been reclaimed. That's the good news. - MA28 (3,832.41) is still above price, sloping down, and only about 6.5 points away. It's the line that separates "bounce" from "trend repair." - The recovery's first rejection came around 3,838, so that's the nearby ceiling to clear. The order book also leans sell at 79%. That's a snapshot and can flip quickly, so I wouldn't build a thesis on it. But the pressure above price matches what the volume is saying. What I need to see A 1h close above MA28 and the ~3,838 rejection high, ideally with volume expanding rather than shrinking. That would turn the sweep into a real higher-low structure and put the 24h high (3,871.27) back in play. What weakens it Losing the MA7/MA14 cluster (3,815–3,822) would turn this into a lower-high retest of the lows. Gold-backed tokens can also whip hard around the sweep zone, so I'm not interested in chasing the bounce under the MA28. I'm not offering an entry or stop here. The chart doesn't confirm one, and I'd rather wait for the reclaim. The sweep is done. What's still unproven is whether anyone wants to buy the recovery. #IMPACTbyTrade
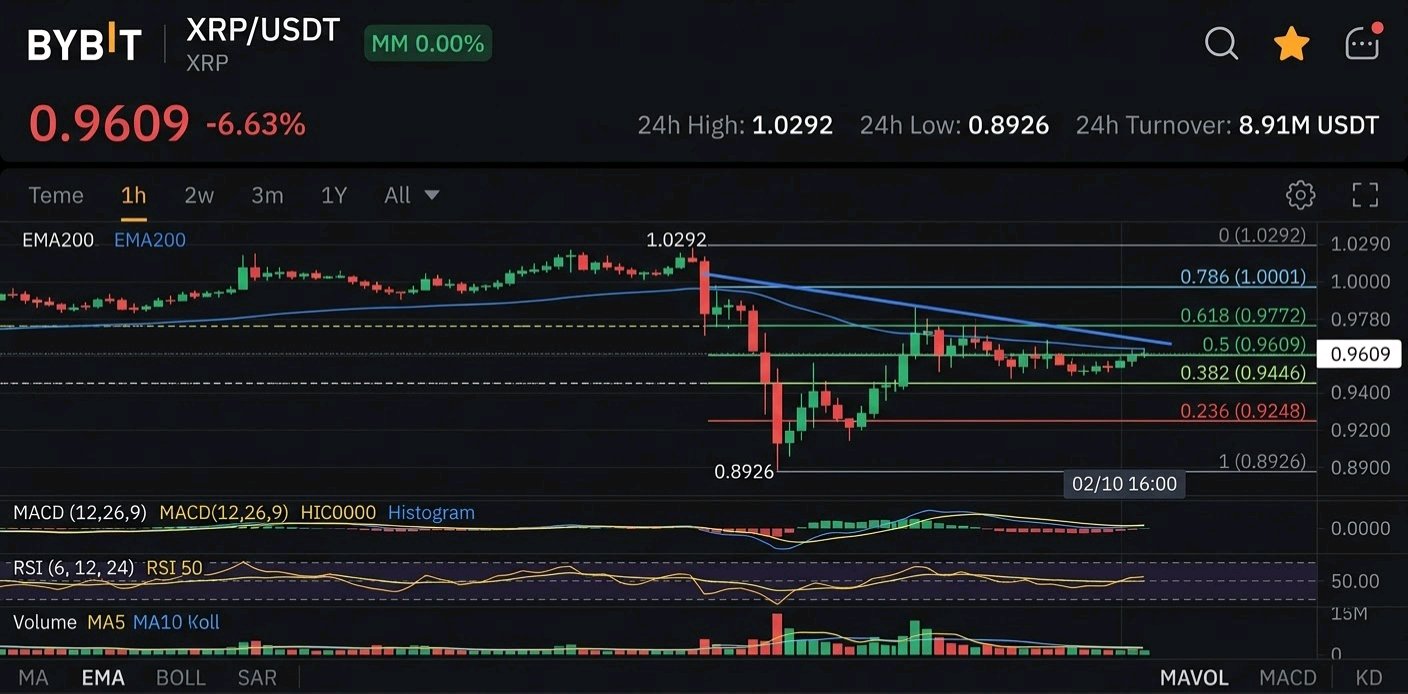
XRP just sold off 13%, bounced 8%, and is now sitting on the exact midpoint of its range XRP dumped from 1.0292 to 0.8926, a 13.3% flush, then recovered to 0.9635. That is a 52% retracement of the entire drop. The 50% level of that range is 0.9609, so price is parked right on equilibrium. Everything else lines up there too. The MA7 (0.9607) and MA28 (0.9590) have collapsed into the same spot, and the 24h high of 0.9977 sits just above. When trend, mean, and midpoint all agree on one price, the market is waiting for someone to break the tie. The recovery itself looks stronger than it is. The bounce topped out around 0.978, below the earlier 0.99+ area, so it is a lower high. Volume on the rebound has also been fading, with the 5-period average now below the 10-period. The big volume came on the flush and the first green recovery candle. Buyers showed up at the low, but they haven't followed through. One caveat: the current candle is only a few minutes old, so its 38.59K volume means little. I'm judging the trend of the volume average, not that bar. What I need to see - A 1h close above ~0.978 would take out the recovery high, and the 0.995 to 1.00 zone becomes the next test. - A rejection here followed by a close below the MA14 (0.9397) would suggest the bounce was just relief, with 0.8926 back in play. The order book shows 59% bids, but a single snapshot is easy to fake, so I wouldn't lean on it. I don't see a clean entry yet. Chasing a bounce into its own midpoint isn't edge. The decision comes at 0.978 or 0.94, and I'd rather let the market pick the side first. $XRPUSDT #IMPACTbyTrade
PEPE bounced 7% off the lows, but the math says it isn't a trade yet PEPE swept the 0.000003697 low, reclaimed the 7 and 14-period moving averages on the 1h, and is now at 0.000003956. That looks like a recovery, but I'm not convinced yet. The selloff came on heavy volume. The bounce has come on visibly lighter volume. Sellers pushed price down with conviction, while buyers are only drifting it back up. The current candle also isn't closed, with about half an hour left on the clock. A close above the MA14 (0.000003903) is the first thing I want to see. A wick above it that gets rejected doesn't count. The level that matters more is the MA28 at 0.000004096, about 3.5% above price and sloping down. PEPE already tried this bounce yesterday and was rejected near that area. It's the same test, and the bounce hasn't passed it yet. Why I'm not chasing Take a hypothetical entry at the current price, with a stop just under the 0.000003697 low (say 0.00000369): - Risk is about 0.000000266. - A target at the MA28 pays about 0.53R. - A target at the 24h high of 0.000004320 pays about 1.37R, and only if price clears the MA28 first. Buying here means risking a break of the low for less than 1:1 to the first real resistance. This is a hypothetical calculation, not a signal. What would change my mind - A retest of the MA14 or MA7 that holds as support, on a quiet pullback, gives a much better entry and tighter risk. - An hourly close above 0.000004096, followed by a hold on the retest, would shift the structure. - A break back under 0.000003697 cancels the bounce and reopens the downside. The sweep of the low was real, but a sweep alone doesn't make a reversal. The market still has to prove it by reclaiming the MA28 on volume that matches the selling. $PEPEUSDT #IMPACTbyTrade

Penurunan tajam 15% pada DOT bermuara pada satu pertanyaan: di mana para pembeli? DOT/USDC turun 15,4% ke 0,6877, dan candle merah besar bukan lagi bagian yang saya perhatikan. Kerusakan terjadi dalam satu candle per jam yang menembus MA7 dengan volume terberat dari keseluruhan pergerakan. Itu adalah aksi jual nyata. Sejak saat itu, harga sempat menyentuh level rendah 0,6811, memantul sekali, dan kembali tergelincir ke sekitar 1% di atas level terendah tersebut. Volume telah memudar tajam dari saat penurunan, meskipun candle saat ini masih terbuka, jadi saya akan menilainya saat penutupan. Order book menunjukkan 87% bid, namun harga tidak mau beranjak dari level terendah. Bid memang ada di sana, tetapi tidak ada yang berani mengambil posisi beli lebih tinggi. Bid yang terpasang hanyalah niat yang dinyatakan, dan bisa ditarik dalam hitungan detik. Konteks Saya tidak menemukan katalis spesifik untuk DOT. Pasar yang lebih luas sedang dalam mode risk-off: fear & greed berada di angka 26 per 11 November, dan total kapitalisasi pasar turun sekitar 5,8% dalam seminggu. Ini juga hari Minggu, dan turnover 24 jam pasangan ini hanya 17,34K. Saya akan memeriksa silang pergerakan ini terhadap DOT/USDT sebelum menyimpulkan terlalu jauh dari penurunan 15% ini. Apa yang perlu saya lihat Harga berada di bawah ketiga MA, dan semuanya tersusun secara bearish: MA7 di 0,7066, MA14 di 0,7346, MA28 di 0,7655. Tanda kehidupan pertama yang nyata adalah reclaim (pemulihan kembali) MA7 dengan volume yang meningkat. Sentuhan di 0,6811 bukanlah sebuah pembalikan, begitu pula dengan pantulannya. Setup hipotetis, bukan sinyal: reclaim 0,7066 dengan stop di bawah 0,6811 merisikokan sekitar 0,0255. - MA14 di 0,7346 hanya membayar sekitar 1,1R. - MA28 di 0,7655 membayar sekitar 2,3R. - MA yang terus turun berarti target tersebut menyusut setiap jam. Reclaim MA7 saja tidak memberikan perdagangan yang menarik. Perlu adanya kelanjutan hingga ke MA28 untuk membenarkan risikonya. Invalidasi: penembusan bersih di bawah 0,6811 dengan volume. Pada titik itu, bid 87% tidak lagi berarti. Para penjual telah menunjukkan kartu mereka. Para pembeli belum. $DOTUSDT #IMPACTbyTrade

SOL sedang berada di titik terendahnya dengan 81% bid dan tidak ada pembeli. Order book menunjukkan adanya pembeli. Grafik menunjukkan tidak ada yang membeli. SOL/USDC berada di 75,49, turun 7,37% hari ini, dan hanya 0,71 di atas level terendah 24 jam di 74,78. Sekitar 81% dari order book yang terlihat ada di sisi bid, yang terlihat bullish. Tapi lihat apa yang dilakukan harga terhadapnya. Setelah menyentuh 74,78, SOL memantul ke kisaran yang sempit dan saling tumpang tindih. Candle-nya kecil dan sumbunya pendek, tanpa kelanjutan pergerakan. Tawaran bid yang besar dan harga yang tidak mau naik biasanya berarti permintaan pasif sedang menyerap aksi jual sementara pembeli sebenarnya tetap berada di pinggir lapangan. Itu adalah bid wall, bukan perubahan tren. Tren masih turun - MA28 berada di 77,84 dan melandai turun. - MA14 berada di 75,84, masih di atas harga. - MA7 berada di 75,56, datar dan mengikuti harga. Harga tertahan di sekitar rata-rata cepat sementara yang lebih lambat terus menekan dari atas. Setiap pantulan sejak level tertinggi 82,32 selalu berakhir lebih rendah dari yang sebelumnya. Volume menceritakan kedua sisinya Volume per jam saat ini adalah 1,45K dibandingkan dengan MA5 sebesar 1,70K dan MA10 sebesar 1,81K. Aksi jual yang mendorong penurunan telah mereda. Itu adalah perubahan nyata, karena pasar tidak lagi didorong lebih rendah. Tapi pantulannya juga tidak didukung oleh volume. Basis tanpa volume adalah jeda, bukan pembalikan arah. Apa yang perlu saya lihat - Reclaim: penutupan per jam kembali di atas 75,84 (MA14). Sumbu yang menembusnya tidak dihitung. - **Konfirmasi nyata:** bertahan di atas 77,84 (MA28). Sampai saat itu, setiap pergerakan naik hanyalah pantulan di dalam tren turun. - Invalidasi: penutupan per jam di bawah 74,78. Level tersebut sudah diuji sekali, dan pengujian kedua dengan volume yang lebih lemah jarang bertahan. Berikut adalah pengaturan hipotetis, bukan perdagangan aktif. Jika SOL reclaim 75,84 dan bertahan, dengan stop di bawah 74,78 dan target pertama di 77,84, risikonya sekitar 1,06 terhadap imbalan sekitar 2,00. Itu kira-kira 1,9:1. Ini dapat diterima, bukan luar biasa, dan hanya ada setelah reclaim. Membeli sekarang berarti masuk di bawah kedua rata-rata dengan stop pada level yang sama yang baru saja diuji. Saya tidak mengejar bid wall tersebut. SOL telah berhenti turun, tetapi berhenti tidak sama dengan berbalik arah. Penutupan per jam berikutnya di atas 75,84 akan memberi tahu kita apakah tawaran bid tersebut adalah permintaan nyata atau hanya lantai yang menunggu untuk disapu bersih. Ini adalah pengamatan grafik, bukan nasihat keuangan. Saya hanya bekerja dari tangkapan layar dan tidak memeriksa berita, pendanaan, atau data derivatif, jadi periksa hal-hal tersebut sebelum bertindak. $SOLUSDT #IMPACTbyTrade

Bounce HYPE mulai kehabisan tenaga HYPE anjlok dari level 71-an ke 67,113 dalam satu candle per jam, dan bounce 3-4 jam setelahnya sudah terhenti. Dip tersebut memang dibeli, tapi bounce-nya tidak ada kelanjutannya. Rentang 24 jam berada di 75,308 hingga 67,113, dan harga saat ini di 68,85, turun 5,87%. Lonjakan ke 75,3 adalah wick satu candle yang langsung ditolak, jadi aksi jual dimulai dari dorongan yang gagal, bukan karena kelemahan. Bounce-nya adalah masalah Candle sell-off mencetak volume paling berat di chart, mendekati 60K. Candle rebound yang menyusul menunjukkan volume yang jauh lebih kecil, dan jam saat ini berada di 7,76K dibandingkan rata-rata 10 periode sebesar 20,72K. Flush sebesar itu dengan volume tersebut terlihat seperti aksi jual paksa. Pemulihan dengan volume yang hanya sebagian kecil dari itu terlihat seperti jeda saja. Moving average juga menunjukkan hal yang sama. Harga berada di bawah MA 7, 14, dan 28 (69,37, 69,93, 71,48), dan ketiganya melandai turun. Bounce sempat menyentuh area MA7, gagal, dan mencetak lower high. Sekarang candle saat ini kembali merah. Apa yang saya pantau - 67,113: titik terendah kapitulasi. Retest yang bertahan dengan volume lebih rendah akan bersifat konstruktif. Break yang bersih berarti flush itu hanyalah kaki pertama. - 69,4-69,9: kluster MA7/MA14. Reclaim dan bertahan di atas level ini akan mengubah analisis saya. - 71,5: MA28 dan titik asal penurunan. Tanpa reclaim di sini, saya akan menyebut ini sebagai bounce di dalam downtrend. Order book yang menunjukkan tekanan jual 70% sesuai dengan gambaran ini, tetapi itu hanya snapshot dan bisa berubah dalam hitungan detik, jadi saya tidak akan terlalu mengandalkannya. Saya tidak akan mengejar bounce di tengah moving average yang menurun. Posisi long memerlukan reclaim di ~69,9 dengan volume nyata, dan posisi short memerlukan retest yang gagal atau hilangnya level 67,1. Sampai salah satu dari itu terjadi, tidak ada setup, hanya pasar yang sedang memutuskan. Flush tadi adalah bagian yang heboh. Apa yang terjadi di 67,1 saat retest akan menentukan apakah itu titik terendah atau hanya kaki pertama penurunan. Hanya berdasarkan chart 1 jam. Saya belum memverifikasi berita, pendanaan, atau data flow di balik pergerakan ini. $HYPEUSDT #IMPACTbyTrade

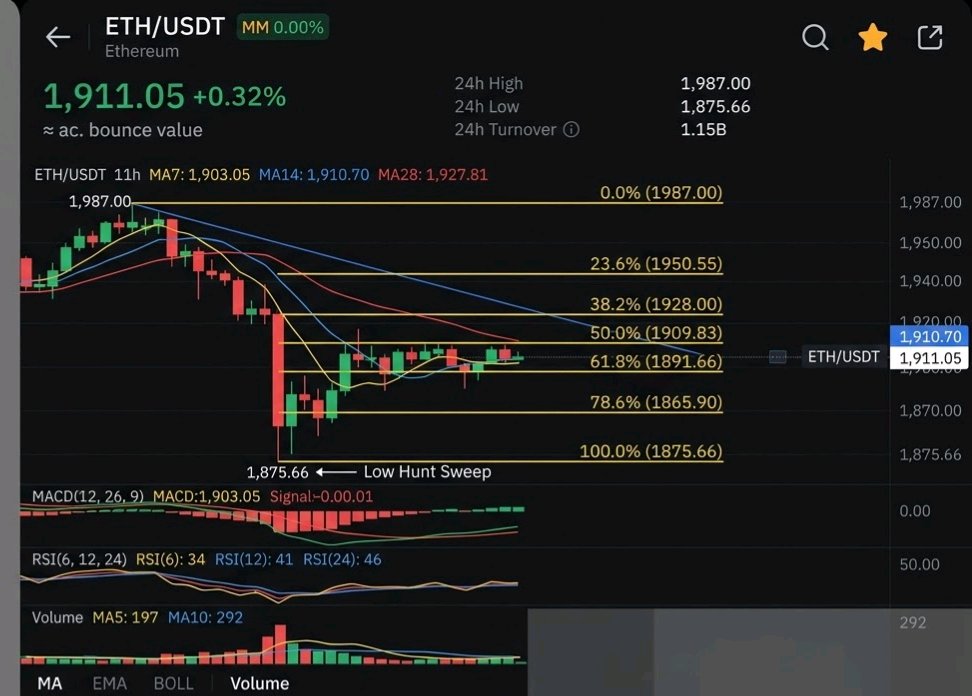
ETH telah mengambil posisi terendah yang diincarnya. Pemulihan belum terjadi. Aksi jual sudah menyapu sisi penurunan. ETH sempat turun drastis (wick) ke 1.875,66 dengan volume terberat di sesi tersebut dan langsung membalas (snap back). Biasanya di situlah saya mulai mencari tanda-tanda pembalikan arah. Tapi lihat apa yang terjadi setelah wick tersebut. Pantulan harga telah membawa harga dari 1.875 ke 1.910, tepat ke MA 14-periode di 1.910,70, dengan volume yang terus menyusut. Rata-rata volume 5-periode adalah sekitar 197 dibandingkan 292 untuk 10-periode. Pantulan dengan volume yang memudar hanyalah jeda, bukan penentu. Strukturnya adalah masalah yang lebih besar. Level tertinggi per jam terus turun, dari level tertinggi 24 jam di 1.987 ke sekitar 1.950, dan sekarang ke sekitar 1.917. MA tersusun secara bearish dengan MA28 (1.927,81) di atas MA14 di atas MA7 (1.903,05), semuanya melandai ke bawah. Harga berada di sepertiga bawah kisaran 24 jam, sekitar 31% di atas level terendah. Apa yang perlu saya lihat: - Penutupan per jam di atas 1.927,81. Itu saja tidak mengubah keadaan, tetapi itu adalah tanda pertama bahwa pantulan ini punya kekuatan. - Dorongan menembus area sekitar 1.950. Itu adalah level tertinggi yang lebih rendah (lower high) terakhir, dan jika berhasil dilewati, maka rangkaian lower high akan terpatahkan. Apa yang membatalkan ide ini: Jika ETH kehilangan level 1.875,66 lagi, sapuan tersebut bukan lagi sebuah sapuan, melainkan penembusan support. Setiap pembeli yang masuk pada wick tersebut sekarang akan rugi (underwater). Saya tidak mengejar pantulan ini di bawah MA28. Tidak ada entri yang terkonfirmasi di sini, hanya setup hipotetis yang menunggu konfirmasi (reclaim). Order book juga menunjukkan 65% sisi jual, tetapi itu hanya snapshot, bukan sinyal. ETH tidak gagal di 1.875. Hanya saja, ia belum mendapatkan reward karena berhasil menahannya. $ETHUSDT #IMPACTbyTrade
LINK's 10.214 breakout never had a chance to hold LINK pushed to 10.214 on the 1H chart, then gave up the entire move. One long-wicked candle was followed by a full-bodied red one that erased it. That's the signature of a failed breakout: buyers got price there, but nobody wanted to pay it. Since then the structure has only gotten weaker. Every bounce has made a lower high, and the stack is now fully bearish: MA7 (9.615) under MA14 (9.735) under MA28 (9.838). Each rally has died at or near the fastest average, which tells me sellers are still using strength to exit rather than buyers using weakness to accumulate. Volume agrees. The heaviest bars on the chart are the red ones, while the green recovery candles trade on noticeably lighter volume. That's a bounce nobody is committing to. Price is now 9.577, down 3.25%, only about 0.7% above the 24h low at 9.510. The latest candle did wick down to 9.510 and bounce, so there's a hint of buying there. But a wick is not a reclaim. Until LINK closes back above 9.615, it's just a pause inside a downtrend. Why a bounce isn't automatically a trade Suppose a long only triggers after a hourly close above MA14 at 9.735, with a stop below 9.510: - Risk: 0.225 - Reward to MA28 (9.838): 0.103, which is about 0.46R - Reward to 10.038: 0.303, which is about 1.35R So even a successful recovery offers poor reward-to-risk until price is well above the moving averages. That's hypothetical, not a signal, since the chart doesn't establish an entry. But it explains why I'd rather wait than catch this. What I'm watching - Bullish: A close above 9.615, then 9.735, ideally on rising volume. That would turn the averages from a ceiling into support. - Bearish: A close below 9.510 would take out the day's low. There's no visible support beneath it on this chart, so that break would open fresh downside and shouldn't be treated as a dip to buy. The 9.510 low is holding for now, but the market has to prove buyers will defend it with volume, not just a wick. Note: This is based only on the screenshot, so I didn't verify news, derivatives data or broader market context. Add anything you know of, such as BTC direction or a LINK catalyst, and I can sharpen the angle. $LINKUSDT #IMPACTbyTrade

STX Mengembalikan Seluruh Kenaikannya, dan Volume Memberi Peringatan Perubahan 24 jam menunjukkan +2,42%, tetapi grafik 1 jam menceritakan kisah yang berbeda. STX menyapu level terendah 0,2730 pada 13 November, lalu membalas dengan satu candle hijau besar. Pergerakan itu melesat langsung ke 0,2996, tepat di bawah angka bulat 0,30, dan terhenti di sana. Harganya tidak pernah benar-benar menyentuh level 0,30. Yang mengganggu saya adalah volumenya. Kenaikan ke 0,2996 terjadi hampir tanpa volume sama sekali. Candle penolakan dan aksi jual setelahnya justru membawa bar volume terbesar di grafik. Pembeli mendorong harga naik dengan tenang, sementara penjual masuk dengan agresif begitu harga sampai di sana. Sekarang harga berada di 0,2796, hampir tepat di MA7 (0,2797) dan masih di bawah MA14 (0,2869) dan MA28 (0,2862). Kedua rata-rata tersebut telah bertemu di sekitar 0,286, jadi zona itu adalah ujian nyata pertama. Penyapuan di 0,2730 bertahan, yang setidaknya merupakan sesuatu, tetapi saya tidak menyebut pantulan sebagai pembalikan sampai harga kembali di atas klaster tersebut. Secara matematis, hanya sebagai pengaturan hipotetis (tidak ada entri yang dikonfirmasi di sini): - Long dari 0,2796 dengan invalidasi di bawah 0,2730 berisiko sekitar 2,4%. - Target 0,2865 mendapatkan sekitar 2,5%, kira-kira 1:1. Itu tidak layak diambil. - Target 0,2996 mendapatkan sekitar 7,2%, kira-kira 3:1. Itu berhasil, tetapi hanya jika harga menembus klaster MA terlebih dahulu. Menunggu reclaim di atas 0,287 justru memperburuk keadaan. Dengan stop loss yang sama, risikonya sekitar 0,0140 terhadap potensi kenaikan 0,0126 ke 0,2996, jadi perdagangannya di bawah 1:1. Entri terbaik adalah di dekat level terendah, dan mengejar harga saat sudah terlambat tidak menarik. Saya memantau dua hal: penutupan 1 jam kembali di atas 0,2870, dan apakah ada volume yang muncul selama proses tersebut. Jika 0,2730 tembus, ide sweep-and-reclaim batal dan kisaran harga tersebut hilang. Satu peringatan: perputaran pada pasangan ini tipis (3,46K), jadi pergerakan di sini bisa terlihat lebih bersih atau lebih buruk daripada di pasar dengan likuiditas yang lebih dalam. Saya belum memeriksa berita atau katalis lain untuk STX. Ini murni pembacaan grafik saja. Jika Anda mau, saya bisa meneliti perkembangan Stacks dan memasukkannya ke dalam analisis. $STXUSDT #IMPACTbyTrade

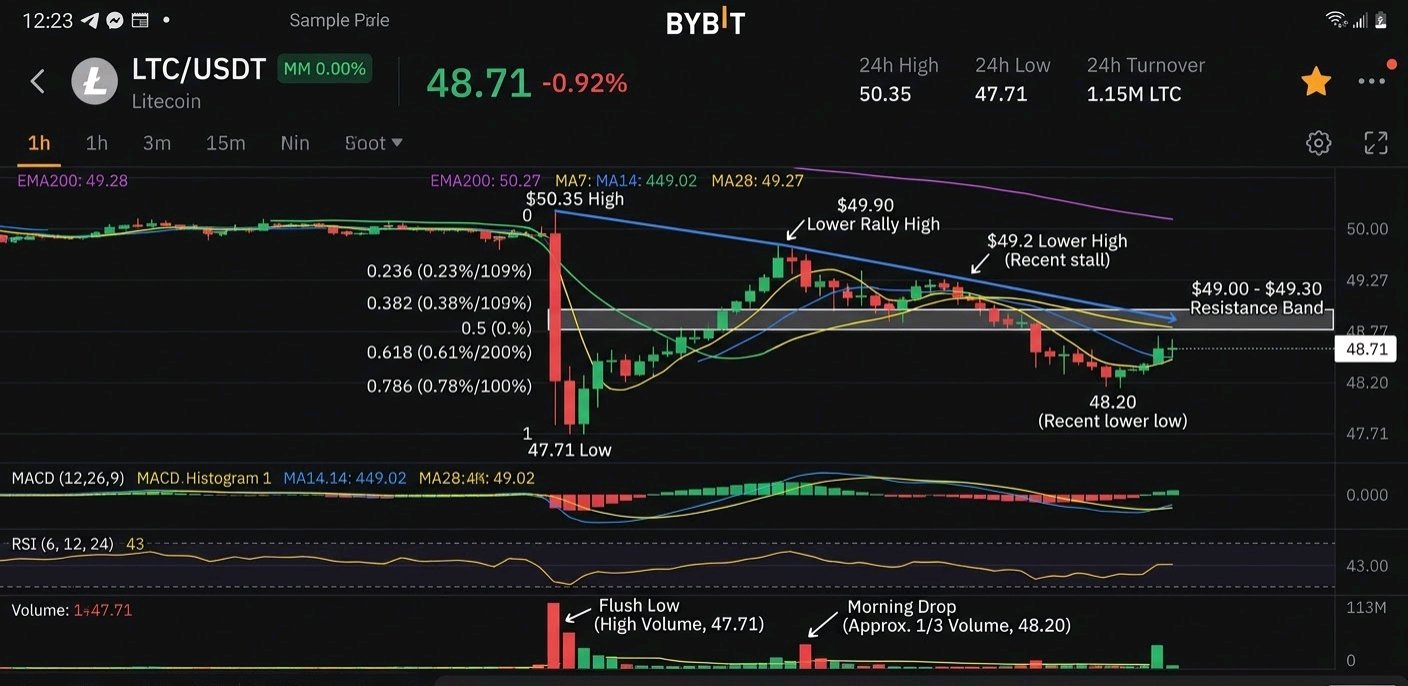
Litecoin's $47.71 low is still standing, but the bounces keep failing below it LTC swept $47.71 in a heavy flush yesterday, then rallied. Every rally since has made a lower high, and the latest sell-off stopped around $48.20, well above that low. Price is now coiling between a floor it hasn't revisited and a ceiling that keeps getting lower. On the 1H chart the high is $50.35, followed by a lower rally high near $49.90. The most recent push stalled around $49.2. Price is at $48.71 and sits under the MA7 ($49.02), MA14 ($49.27) and MA28 ($49.11). Those three are bunched within about 25 cents, so $49.00-$49.30 is one resistance band, not three separate levels. The volume is the interesting part. The first drop to $47.71 was by far the biggest volume bar on the chart, which looks like a real flush. The second drop this morning printed roughly a third of that volume. Sellers pushed price lower again with much less force, and that is why the $47.71 low hasn't been tested again. The bounce isn't convincing either. The current green candle's volume (about 79) is below its 5-bar average (about 91), and the order book shows 66% asks to 34% bids. That's a snapshot and can change in seconds, but it does mean buyers aren't being aggressive here. What would change my mind I'm not interested in buying anything under $49.00. A 1H close above $49.30 that holds on a retest would tell me the lower-high sequence is broken. Until then, this looks like a pause in a weak structure, not a reversal. Risk management Even a confirmed reclaim has a problem. Say a long triggers on a $49.30 retest, with invalidation just under the $47.71 low (about $47.65) and a first target at $50.35. That's about $1.65 of risk for $1.05 of reward, roughly 0.6:1. This is a hypothetical setup, not a signal. The confirmation costs you the reward-to-risk. You'd need either a tighter structural stop, such as under $48.20, or a target beyond $50.35 to make it worth taking. If $47.71 breaks on rising volume, the flush low becomes a failed support and the downside story takes over. Right now neither side has proven anything. The level that matters is $47.71 below and $49.30 above. LTC has to leave that range before there's a trade, and I'd rather wait for it than guess which way it goes. Based only on the 1H chart provided; I didn't research news or derivatives data. Not financial advice. $LTCUSDT #IMPACTbyTrade
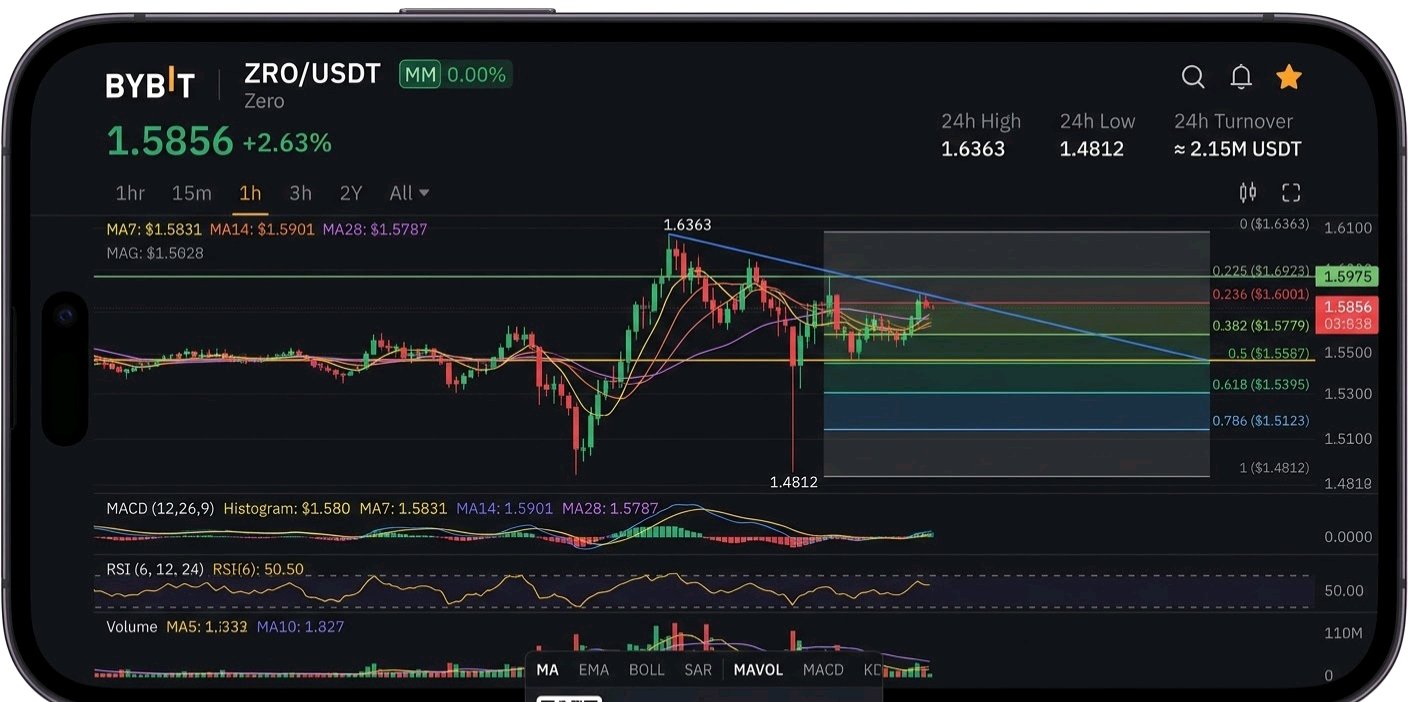
ZRO sempat dibeli saat harga turun, lalu mendadak tenang. Keheningan itu ada artinya. ZRO berada di harga $1,5856 (+2,63%) setelah pemulihan berbentuk V dari titik terendah $1,4812. Grafik per jam kini terjepit dalam rentang sempit di bawah level tertinggi $1,6363. Pemulihannya terlihat kuat, tetapi pergerakan harga sejak penolakan di $1,6363 menunjukkan serangkaian titik tertinggi yang lebih rendah (lower highs). Penurunan terakhir juga menyapu area $1,55. Penjual menekan harga turun hingga sekitar $1,52 dengan sumbu panjang, pembeli menyerapnya, dan harga kembali melambung. Itu adalah pengambilan likuiditas (liquidity grab) yang gagal berlanjut, yang mana cukup konstruktif. Namun, kelanjutannya adalah apa yang tidak saya lihat. Volume pada candle saat ini sekitar 19rb, jauh di bawah rata-rata 5 periode (34rb) dan 10 periode (28rb). Satu-satunya lonjakan volume besar dalam rentang terakhir terjadi pada candle merah, dan pantulan setelahnya sangat tipis. Moving average menunjukkan keraguan yang sama. MA7 ($1,5831), MA14 ($1,5901), dan MA28 ($1,5787) berkumpul dalam rentang sekitar satu sen, dan harga berada tepat di atas semuanya. Itu adalah kompresi, bukan tren. Order book memberikan peringatan kecil: 45% bid berbanding 55% ask. Itu hanya snapshot dan tidak boleh dianggap terlalu berat, tetapi tidak bertentangan dengan volume yang memudar. Apa yang perlu saya lihat: - Konfirmasi bullish: penutupan per jam di atas $1,5975 dengan volume di atas rata-rata 5 periode. Itu akan membalikkan urutan lower-high, dengan $1,6363 sebagai ujian berikutnya. Penutupan di atas level itu akan mengonfirmasi pemulihan lebih dari sekadar pantulan. - Tanda peringatan: penutupan kembali di bawah level $1,5587. Itu akan membuat sumbu sapuan (sweep wick) terlihat seperti jebakan, dan titik terendah sumbu $1,52 menjadi level yang harus diperhatikan. Kehilangan level itu akan membuat titik terendah $1,4812 kembali terancam. Tidak ada perdagangan yang terkonfirmasi di sini. Harga berada di kisaran tengah, jadi posisi long memberi Anda reward-to-risk yang buruk sampai harga menembus resistance atau menguji kembali support. Saya lebih suka membiarkan rentang ini teratasi daripada menebak arahnya. Penurunan harga sempat dibeli. Yang penting sekarang adalah apakah ada yang mau membayar lebih untuk menembus $1,5975. Bukan nasihat keuangan. Hanya berdasarkan grafik 1 jam; saya belum memverifikasi berita atau katalis apa pun. $ZROUSDT #IMPACTbyTrade
SUI baru saja mengembalikan 38% dari reli-nya dan berhenti tepat di tempat yang seharusnya. SUI naik dari 0,7646 ke 0,8280 dalam beberapa jam, sebuah pergerakan sekitar 8,3%. Sejak itu, harga terkoreksi ke 0,8036, yang hampir tepat merupakan retracement 38,2% dari kenaikan tersebut (sekitar 0,8038). Pasar kini sedang jeda di level pertama yang memberi tahu Anda apakah pergerakan tersebut didukung oleh permintaan nyata. Candle yang paling menarik bukanlah lonjakan itu. Melainkan candle hourly merah besar setelahnya. Aksi jual itu menekan harga turun ke sekitar 0,7985, tepat ke area cluster di mana MA14 (0,7979) dan MA28 (0,7984) berada. Harga kemudian pulih sebagian besar dari candle tersebut, meninggalkan sumbu bawah yang panjang. Penjual telah melakukan aksi jual mereka, dan pembeli tetap mempertahankan cluster moving average tersebut. Saat ini, itu terlihat seperti pullback, bukan reversal. Namun, ini belum terkonfirmasi. Apa yang masih membuat saya tidak yakin: - Harga berada di bawah MA7 (0,8087), dan beberapa candle terakhir berwarna merah. Momentum jangka pendek telah mendingin. - Order book relatif seimbang, 48% beli berbanding 52% jual. Tidak ada pihak yang jelas memegang kendali di harga ini. - 0,8087 adalah level pertama yang penting. Sampai SUI berhasil menembusnya kembali, ini hanyalah upaya pemantulan, bukan tren. Masalah risiko/imbalan: Misalkan saya menunggu penutupan hourly yang bersih di atas 0,8087 dan menggunakan 0,7975 sebagai invalidasi, tepat di bawah cluster MA. Itu adalah setup hipotetis, karena belum ada entry yang valid. - Target 0,8158: sekitar 0,59R. Itu tidak layak untuk diambil. - Target 0,8280: sekitar 1,65R. Ini adalah satu-satunya target yang membenarkan risikonya. Jadi, mengejar lonjakan awal menuju 0,8158 hasilnya buruk. Trading ini hanya masuk akal jika Anda memperkirakan pengujian ulang penuh terhadap level tertinggi 0,8280, dan level tertinggi itu masih harus ditembus. Apa yang membatalkannya: Penutupan hourly di bawah 0,7979 berarti support MA gagal, dan level terendah 0,7646 kembali menjadi perhatian. Itu akan mengubah sumbu tersebut menjadi jebakan, bukan pertahanan. Pandangan saya: para pembeli saat harga turun muncul di tempat yang seharusnya, tetapi mereka belum diuji kembali. Ujian berikutnya adalah 0,8087. Catatan: ini didasarkan hanya pada grafik di tangkapan layar Anda (1 jam, 13 Nov, 21:23). Saya tidak memeriksa berita, unlock, atau data derivatif, jadi tambahkan katalis apa pun yang Anda ketahui sebelum memposting. Ini bukan saran keuangan. $SUIUSDT #IMPACTbyTrade

Reli INJ hanyalah satu candle, bukan tren INJ naik 11% ke 8,183, tetapi hampir seluruh pergerakan itu berasal dari satu candle per jam. Volume menunjukkan hal yang sama: satu lonjakan ke sekitar 3,29K, sementara hampir semua bar lain di chart terlihat datar. Seperti itulah tampilan ledakan pembelian agresif, dan ini belum menjadi tren yang berkelanjutan. Sebelumnya, INJ terus turun di bawah ketiga moving average hingga sempat menyapu level terendah 7,172 dengan wick panjang lalu memantul kembali. Pembeli langsung mempertahankan level tersebut. MA7 1 jam (7,943) kini telah melengkung ke atas menembus MA14 (7,659) dan MA28 (7,548), dan harga berada di atas semuanya. Itu adalah perubahan nyata dalam struktur jangka pendek. Saya belum mempercayainya, karena tiga alasan: - Harga sudah sekitar 8% di atas MA28 setelah kenaikan yang hampir vertikal. Moving average belum mengejar, jadi pullback menuju MA7 akan menjadi hal yang wajar dan sehat. - Level tertinggi 8,352 ditolak, dan candle tepat setelahnya tercetak merah dengan wick. Itu adalah jeda di level resistance, bukan breakout. - Turnover 24 jam hanya 29,66K. Pada pasangan yang setipis ini, satu order besar bisa menciptakan pergerakan seperti ini, dan bisa menghilang sama cepatnya. Apa yang perlu saya lihat: - Bullish: penutupan per jam di atas 8,352 yang bertahan saat retest. Sampai saat itu, ini hanya sentuhan pada resistance. - Melemah: penurunan kembali ke badan candle lonjakan, kira-kira area 7,9 menurut pembacaan chart saya. Itu akan menunjukkan pergerakan tersebut hanyalah squeeze satu kali tanpa kelanjutan. Saya tidak akan mengejarnya. Belum ada entry atau stop yang ditetapkan, jadi trading apa pun di sini bersifat hipotetis sampai harga terkonfirmasi. Entry terbaik biasanya datang setelah pullback pertama dipertahankan, bukan di puncak candle vertikal. Pertanyaannya sekarang adalah apakah volume akan kembali pada dorongan berikutnya atau tetap pada satu bar itu saja. $INJUSDT #IMPACTbyTrade

SOL mengambil likuiditas di 77,85 dan langsung memantul kembali, tapi pantulan ini belum meyakinkan saya. Aksi jual ke 77,85 berlangsung brutal, dan pembalikannya pun hampir secepat itu. Solana kini telah merangkak naik kembali di atas MA periode 7, 14, dan 28 pada grafik 1 jam. Ini adalah pertama kalinya harga ditutup di atas MA 28 (di sekitar 80,86) sejak penurunan dimulai. Inilah yang mengganggu saya. MA28 telah menahan setiap pantulan sejak level tertinggi 84,82, jadi reclaim level ini memang penting. Tapi coba lihat volumenya. Candle washout mencetak bar paling tebal di grafik, sementara dorongan saat ini hanya menunjukkan 3,51K dibandingkan dengan rata-rata 5 periode sebesar 2,51K. Pergerakan naik di atas rata-rata memang bagus, tetapi para penjual yang membuang aset di 77,85 jauh lebih dominan daripada pembeli yang mengangkat harga sekarang. Harga juga berada di titik yang sangat spesifik. Rentang 84,82 → 77,85 adalah sekitar 6,97 poin, dan retracement 61,8% berada di dekat 82,16. Candle terakhir mencetak 82,04 dan tertahan tepat di bawahnya. Pemulihan berbentuk V yang berhenti di golden pocket adalah titik di mana saya ingin melihat penutupan (close) yang bersih di atas level tersebut, bukan sekadar sumbu (wick). Yang saya pantau: Konfirmasi bullish: penutupan hourly di atas ~82,2 yang bertahan pada retest, dengan volume yang meningkat. Resistance berikutnya adalah 83,07, lalu level tertinggi 84,82. Pullback yang sehat: retest area MA28 (~80,9) yang bertahan. Setup hipotetis di sana, dengan invalidasi di bawah ~79,6, akan memberikan sekitar 1,5R ke 83,07 dan sekitar 2,7R ke 84,82. Ini adalah sebuah skenario, bukan sinyal, dan saya belum menentukan entry. Kegagalan: kehilangan area cluster MA dan area 79,6 akan mengubah ini menjadi sweep yang diikuti oleh dead-cat bounce. Sweep sudah selesai. Apakah pemulihan ini nyata atau tidak, bergantung pada apakah pembeli akan muncul saat harga menyentuh 82,2. $SOLUSDT #IMPACTbyTrade

BNB bounced 17 points off the low, but the bounce hasn't proven anything yet BNB dumped from 688.15 to 622.55, a drop of about 9.5%. The sell-off candle carried the heaviest volume on the chart. The bounce since then has been quiet: volume fades with each green candle. Price is at 640.12 (-3.32% on the day), sitting right on the 14-period MA at 639.76. It has reclaimed the 7-period MA (635.90), but the 28-period MA at 649.03 is still above and still sloping down. All three averages remain stacked bearishly. Buyers have retaken the fast average, but they haven't touched the one that matters. The bounce retraces only about 27% of the entire drop. The 38.2% level lands near 647.6, almost exactly on the 28 MA. The 50% level is 655.35. So the first real test sits around 648-649, where trend resistance and the first Fibonacci retracement overlap. What concerns me is the volume. The heavy volume came on the way down, and the recovery has been thin. The last candle's volume is around 202 against a 5-period average of 537. That's a relief bounce, not conviction. The order book is slightly bid-heavy at 53/47. That's a mild positive, but order books change fast and I wouldn't build a thesis on it. What I need to see - A 1h close above 649, ideally with volume rising instead of fading. - Then 655.35, followed by the 24h high at 662.39. - If price loses the 635.9 MA7 and rolls over from here, the 622.55 low gets retested. - A close below 622.55 would invalidate any recovery idea. I'm not chasing a candle that's pressed against a falling MA with fading volume. There's no confirmed entry here, only a level to watch. Until BNB closes above 649, this is a bounce inside a downtrend. Chart-based only. I haven't checked news, listings or derivatives data, so add those if you want a fundamental angle. $BNBUSDT #IMPACTbyTrade

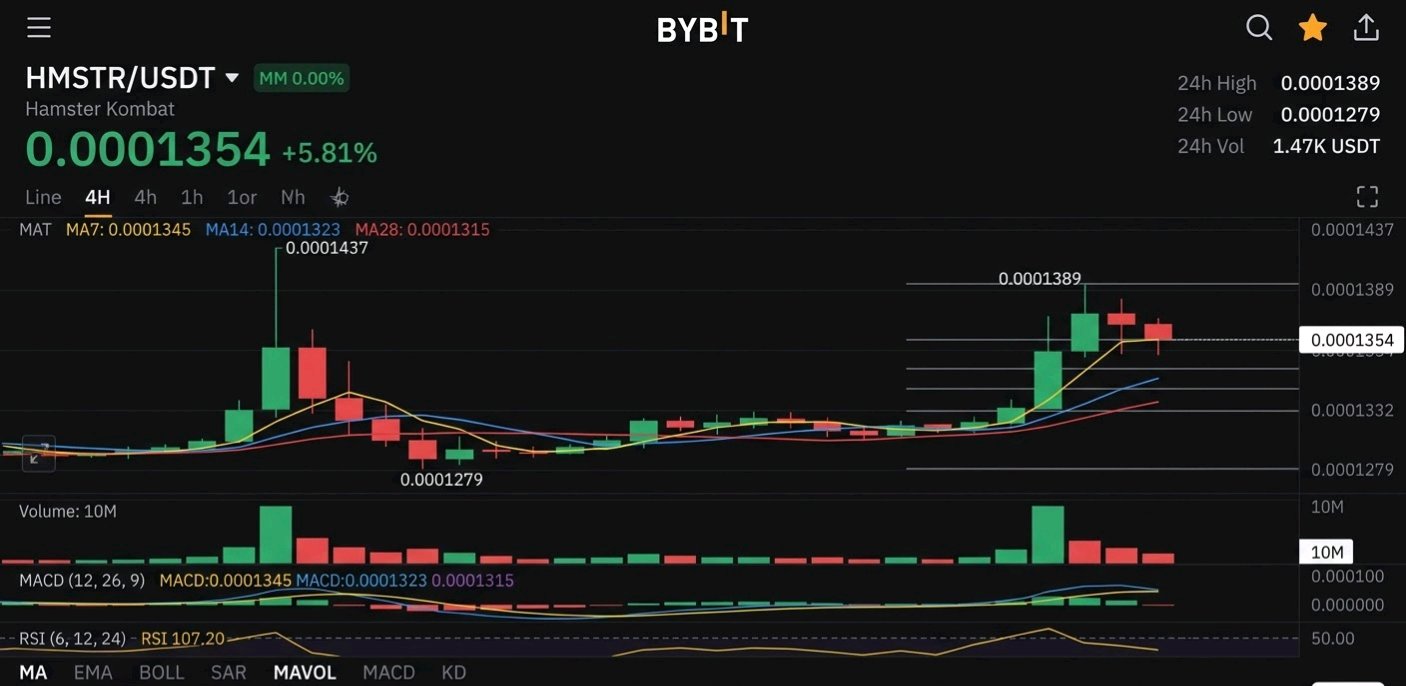
HMSTR just did what its November 8 spike couldn't: it came back with volume. The first push to 0.0001437 on the 4h chart was a fade. Buyers sprinted, sellers hit the wick, and within two days price had given back the entire move and tagged 0.0001279. That was a spike with no follow-through. This one is different. After roughly two quiet days of base-building between 0.000128 and 0.000132, the breakout candle carried the largest volume bar on the chart, around 10M. The earlier spike never came close to that. Price is now at 0.0001354, above MA7 (0.0001345), MA14 (0.0001323) and MA28 (0.0001315), with the shorter averages stacked above the longer ones. That is the first clean bullish alignment on this chart. But it isn't confirmed. The breakout ran into 0.0001389, left a long upper wick, and the next 4h candle closed red. Buyers pushed, sellers answered, and price is now sitting in between. What I need to see - A 4h close above 0.0001389 to turn that wick into reclaimed territory. - Dips holding the 0.0001318-0.0001323 zone, where MA14 and MA28 cluster. Losing 0.0001301 (the 24h low) would invalidate the breakout. As a purely hypothetical setup, a 0.0001354 entry with a stop under 0.0001300 and a first target at 0.0001437 gives roughly 1.5R. That is acceptable, not exciting. A pullback toward 0.000132 would improve the ratio a lot more than chasing here. The caution The order book shows 94% bids to 6% asks, which looks bullish. But 24h turnover is only about 1.47K, so that book is thin and easy to move or spoof. I wouldn't read it as conviction until real volume holds up through the next push. The setup is better than last week's, but 0.0001389 still has to be reclaimed. Not financial advice. $HMSTRUSDT #IMPACTbyTrade

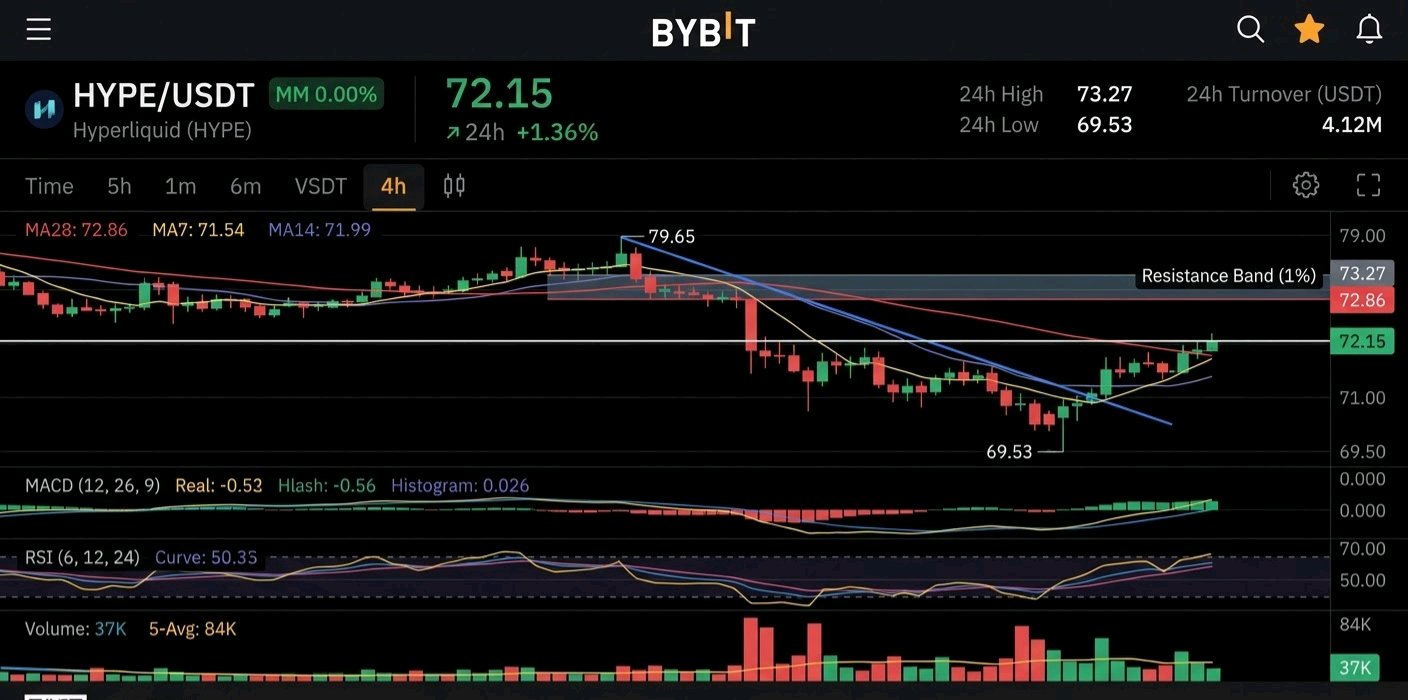
HYPE baru saja memantul. Ujian sesungguhnya adalah garis penolakan beberapa jam yang lalu. HYPE telah turun sekitar 12,7% dari swing high 79,65 ke low 69,53. Sekarang kembali ke 72,15, naik 1,36% hari ini. Lantunan itu sendiri bukanlah bagian yang menarik. Level harganya yang menarik. MA28 4 jam berada di 72,86, dan penolakan terakhir berasal dari area tersebut. High 24 jam di 73,27 berada tepat di atasnya. Itu menempatkan zona resistance sekitar 1% di atas harga saat ini, jadi ruangnya sangat sempit sebelum pembeli membenturnya lagi. Dua hal yang menonjol bagi saya. Pembeli mempertahankan level low dua kali. Zona 69,5 hingga 70 menarik dua sumbu bawah yang tajam, dan yang kedua mencapai dasar sedikit lebih tinggi. Itu adalah tanda pertama penyerapan setelah downtrend yang bersih. Lantunan ini belum mendapatkan volume. Semua bar volume yang tinggi berada di dalam aksi jual. Candle 4 jam saat ini menunjukkan 37K dibandingkan rata-rata 5 periode sebesar 84K. Masih dalam pembentukan, jadi saya tidak akan terlalu memikirkannya, tetapi pemulihan membutuhkan partisipasi agar bisa berarti apa pun. MA7 (71,54) dan MA14 (71,99) sekarang datar dan di bawah harga, tetapi MA28 masih melandai ke bawah. Harga telah merebut kembali rata-rata jangka pendek, bukan trennya. Masalah reward-to-risk. Katakanlah Anda menunggu penutupan 4 jam yang terkonfirmasi di atas 73,27. Ini adalah entri hipotetis, bukan sinyal. Dengan invalidasi di 69,53, Anda mengambil risiko sekitar 3,7. Target pertama di dekat 75,98 memberikan sekitar 2,7, yang kira-kira 0,7R. Bahkan retrace penuh ke 79,65 hanya sekitar 1,7R. Konfirmasi memakan banyak pergerakan, dan itu alasan yang sama mengapa mengejar ke arah resistance tidak menarik. Apa yang perlu saya lihat: Penutupan 4 jam di atas 73,27, idealnya dengan volume di atas rata-rata 10 periode. Retest zona tersebut yang bertahan sebagai support. Jika 69,53 jebol, ide double-bottom mati dan high 79,65 tidak lagi relevan. Sampai saat itu, ini terlihat seperti relief rally di bawah rata-rata yang jatuh. Belum mengonfirmasi pembalikan. $HYPEUSDT #IMPACTbyTrade