TUWALLIYE
3986いいね0シェア92ファン40フォロー
Technical Analysis and Risk management
Technical Analysis and Risk management
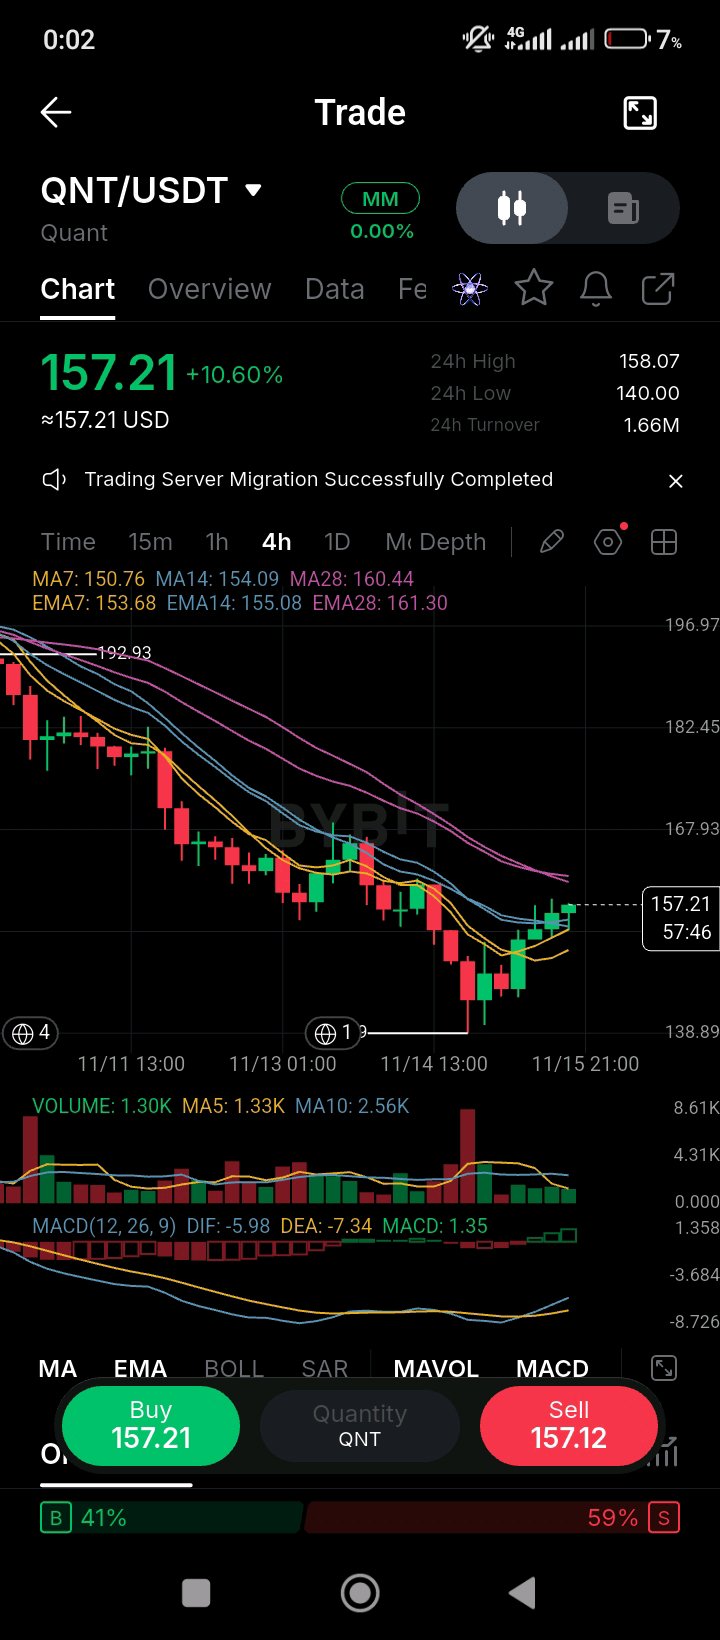
QNT bounced 10.6% off a 140 low today to 157.21, but it's still about 19% below where it traded at the start of the week and the order book is leaning sell. The November 5 move was a market-wide selloff: CoinMarketCap put QNT's 5.7% drop that day at roughly the same size as a 5.2% fall in total crypto market cap, with no Quant-specific news. The same day, COINOTAG reported a 6.9% rally on reports that The Clearing House was moving tokenized-deposit payments onto Quant's network. So the token is still trading on two different stories: the banking adoption that drove September's surge, and the risk appetite that sets the day-to-day moves. The bank pilots haven't been reversed, but they haven't produced steady buying either. On the chart, QNT is up 10.60% to 157.21, with a 24-hour range of 140.00 to 158.07. Price is above the MA7 (150.76), MA14 (154.09) and EMA7 (153.68) and EMA14 (155.08), but still under the MA28 (160.44) and EMA28 (161.30). MACD is positive (1.35), with the DIF (-5.98) crossing above the DEA (-7.34). Volume (1.30K) is roughly level with the MA5 (1.33K) and well below the MA10 (2.56K), so the bounce isn't drawing much buying. The order book is 59% sell-side. The 160.4 to 161.3 MA28 and EMA28 are the level to clear. A close above them on rising volume would bring the 165 area back into view. A loss of 140 would reopen the early-week lows. $QNTUSDT #ByXIMPACT
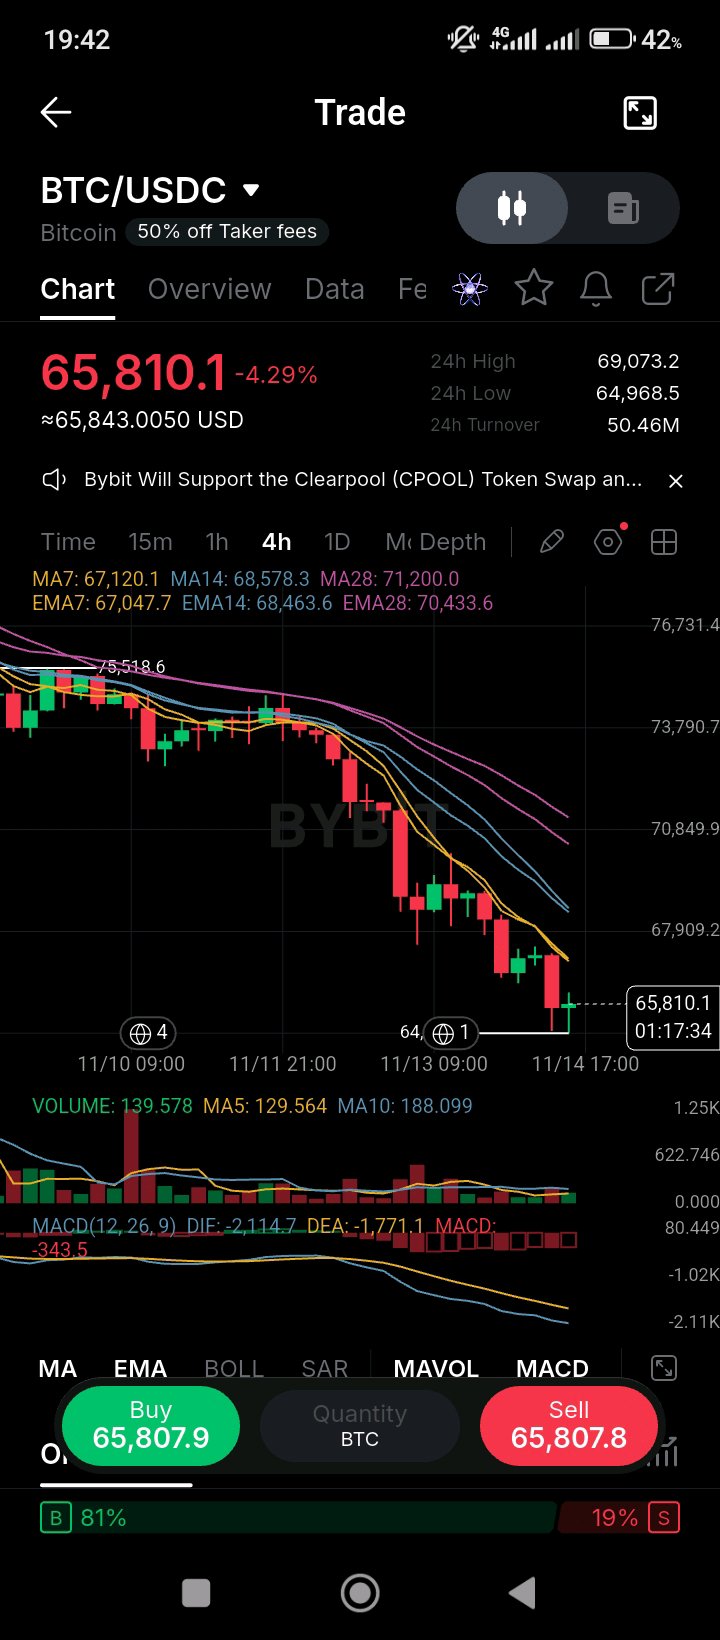
今日、ビットコインは66,000ドルを割り込み、1時間で2億1,500万ドル相当のレバレッジポジションが清算されました。チャートは強制的な売りが続く領域に入っています。 11月9日、ビットコインは9月以来初めて50週移動平均線(約75,488ドル)を下回って終値をつけ、24時間で10億ドルを超える仮想通貨のロングポジションが清算されました。本日の下落はその動きをさらに拡大させるものです。24/7 Wall Stによると、米国東部時間の午前9時56分頃に66,000ドルを下回り、同時間帯にはイーサリアムも1,850ドルを割り込みました。現物ETFのフローもこの状況の半分を占めています。The Blockの報道によると、11月9日の動きの前後で大きな流出が見られ、夏の相場上昇を支えていた機関投資家による買い圧力が消失しました。本日の売り浴びせの直接的なトリガーは確認できておらず、特定の要因によるものとは断定していません。 チャート上では、BTCは4.29%下落して65,810.1ドルとなっており、24時間のレンジは64,968.5ドルから69,073.2ドルです。価格は表示されているすべての移動平均線を下回っています。MA7(67,120.1)、MA14(68,578.3)、MA28(71,200.0)、そしてEMA7(67,047.7)、EMA14(68,463.6)、EMA28(70,433.6)すべてが上値抵抗となっています。MACDは深くマイナス圏に沈んでおり(DIF -2,114.7、DEA -1,771.1)、ヒストグラムは-343.5で依然として拡大傾向にあります。出来高(139.578)はMA5(129.564)を上回っていますが、MA10(188.099)は下回っており、今回の上昇(下落)局面は市場全体の参加よりも清算が主導していることがわかります。オーダーブックを見ると買い注文が81%を占めていますが、これは現在のローソク足の動きとは矛盾しています。 64,968ドルの安値が最も重要な水準です。ここを下抜ければ、アナリストが指摘していた60,000ドル台への道が開かれます。67,050ドルのEMA7と68,460ドルのEMA14を回復することが、清算に伴う投げ売りが収束に向かう最初のシグナルとなるでしょう。 $BTCUSDT #ByXIMPACT
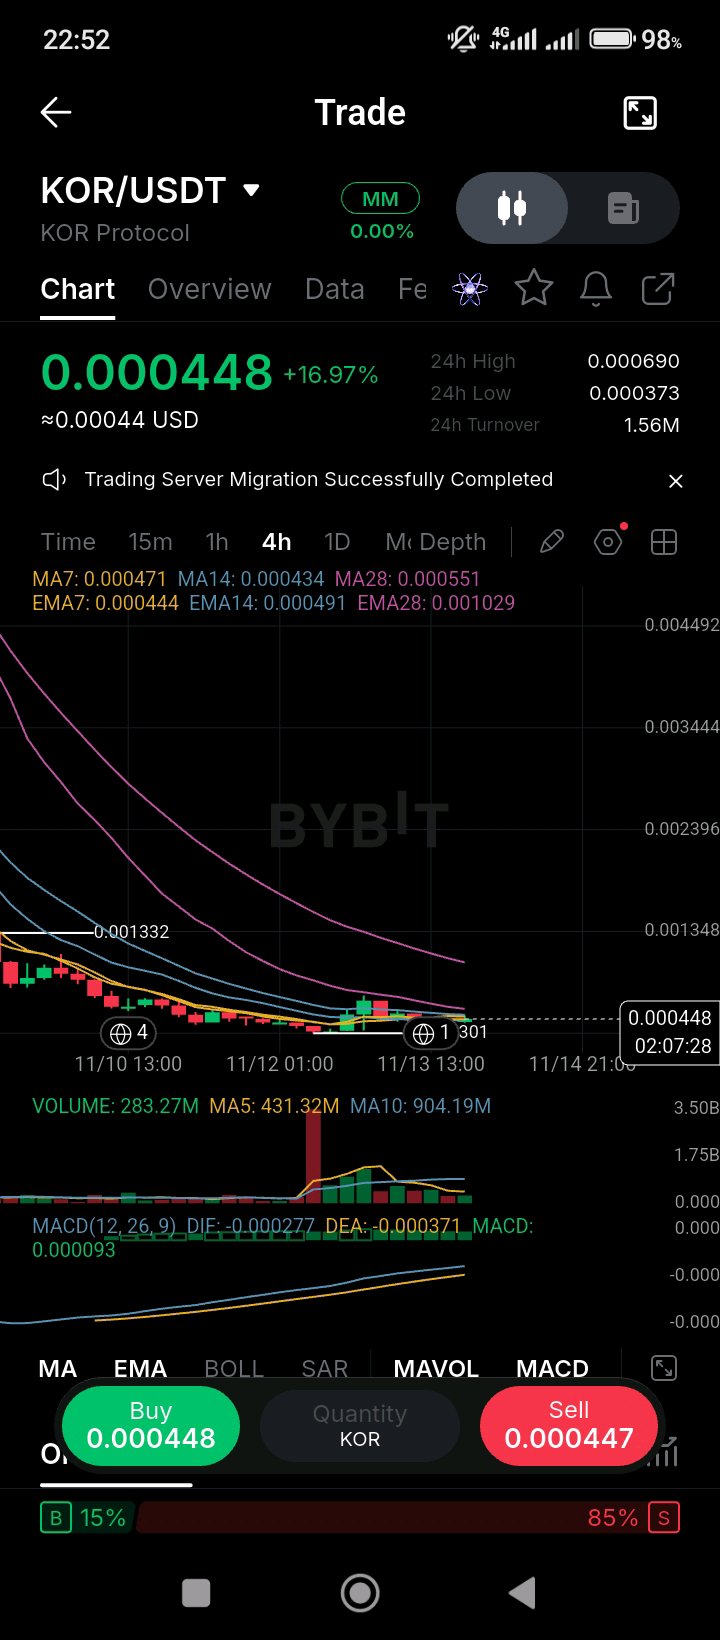
KORは本日0.000448まで17%上昇しましたが、11月4日の上場来高値0.032からは依然として約97%下落しており、このトークンは上場以来、エアドロップや報酬による供給が支配的な状況が続いています。 KORは11月4日に上場し、同日に約0.032ドルの史上最高値を付けましたが、Kor Protocolのエアドロップ請求が開始されると急落しました。請求期間は11月9日14:00(UTC)に終了しました。CoinMarketCapにリンクされたAIノートでは、この下落を利益確定売りとLaunchpool報酬によるものとし、合計180万KOR相当のKuCoinの2つの報酬キャンペーンが11月20日まで実施されています。循環供給量は100億枚のうち約22.8億枚であり、アンロックされた浮動株が少ないため、報酬による売り圧力は過大となっています。史上最安値については情報源によって0.0005ドルから0.0012ドルと見解が分かれており、現在の取引価格についても同様であるため、特定の数値を鵜呑みにせずチャートを確認してください。Base上のクリエイティブアセット向けのオンチェーン・クリアリングハウスであるプロトコル自体や、Binanceへの上場については、いずれも確認されていません。 チャートを見ると、KORは16.97%上昇の0.000448となっており、24時間のレンジは0.000373から0.000690です。価格はMA7(0.000471)の上に位置しているかと思いきや、実際にはMA7を下回っていますが、MA14(0.000434)とEMA7(0.000444)の上、そしてMA28(0.000551)とEMA28(0.001029)を大きく下回っており、長期平均線がはるか上方にあります。MACDはわずかにプラス(0.000093)ですが、DIF(-0.000277)は依然としてDEA(-0.000371)を下回っています。出来高(2億8327万)はMA5(4億3132万)およびMA10(9億419万)を大きく下回っており、今回の反発は出来高を伴わない小幅なものとなっています。板情報は売り側が85%を占めており、これが今回の値動きを慎重に見るべき最大の理由です。 0.000434から0.000444の移動平均線が今回の反発を支えるラインとなっています。0.000373の安値を割り込めば、11月の安値を再試行する展開となるでしょう。MA28の0.000551に向けた回復には、現時点のチャートでは確認できない出来高が必要となります。 $KORUSDT $BTCUSDT #ByXIMPACT
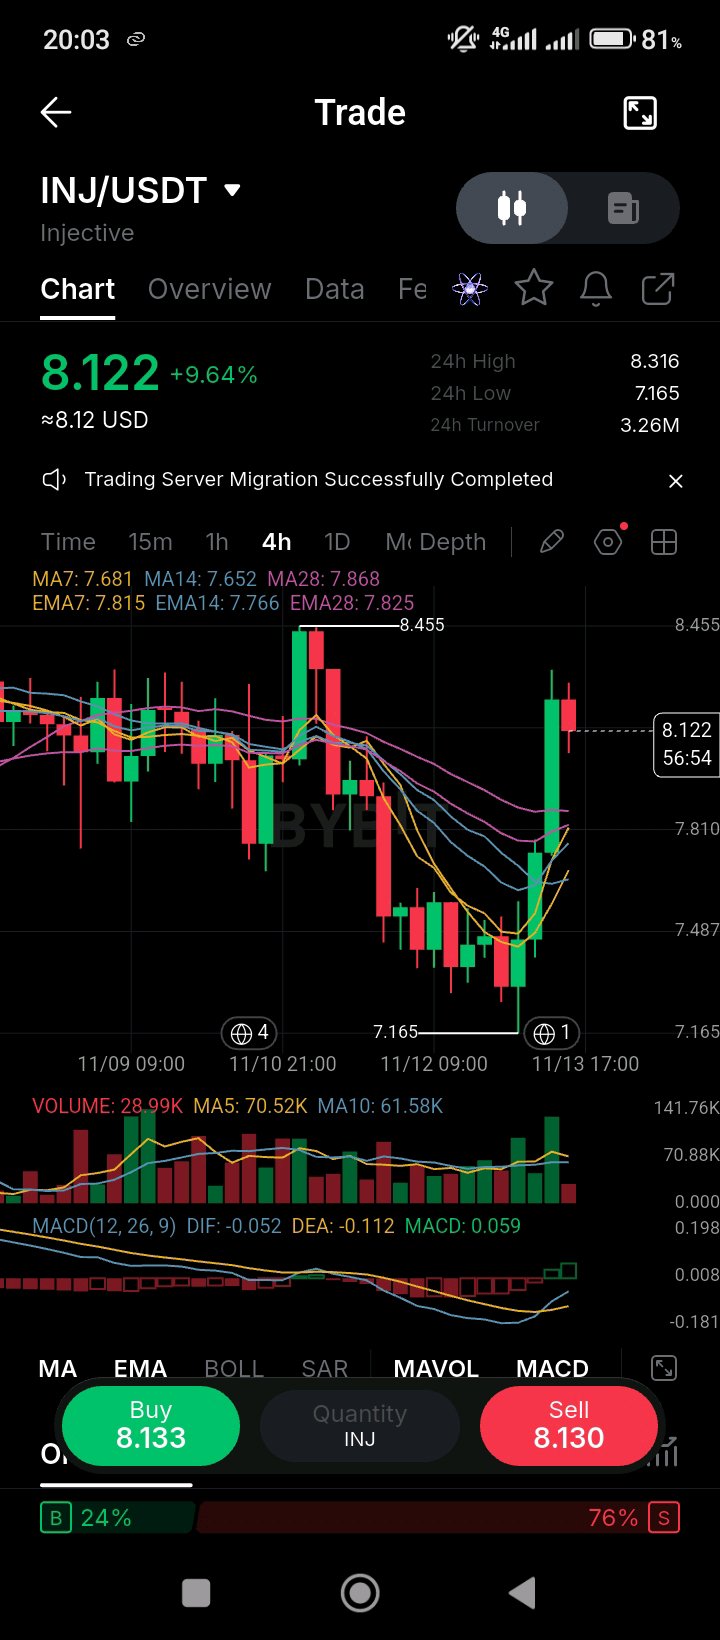
INJは本日9.64%上昇し8.122となり、10月の高値以来初めてMAスタックを上抜けました。ただし、オーダーブックは依然として売りサイドが76%を占めています。 上昇のカタリストは、11月5日にナスダックで取引が開始されたCanary Staked INJ ETF(INJC)です。このファンドはINJを保有・ステーキングしており、CoinMarketCapはこれによる2日間の3.18%の上昇を報じました。このローンチは米国で初の同カテゴリー商品であり、SECには21Sharesによる2件目のINJ申請が依然として審査待ちの状態です。11月8日、Injectiveは設立5周年を迎え、2025年11月から2026年11月までのオンチェーン取引額が128.6億ドルに達したと報告しました。そのうち18億ドルが実資産(RWA)のパーペチュアル取引によるものです。また、1月には発行量が年間2.2%〜4.4%に削減され、長期的に供給が引き締められています。しかし、ETFの組成には新規の現物買いがあまり伴わなかったため、値動きは不安定です。CMCのメモによると、初期のINJCへの流入は新規需要というよりはシード資本のように見えたため、今後数週間のステーキングフローを注視する必要があります。 チャート上では、INJはMA7(7.681)、MA14(7.652)、MA28(7.868)、およびEMA7(7.815)、EMA14(7.766)、EMA28(7.825)を上回っており、ローソク足は表示されているすべての平均線をクリアしています。今週の高値である8.455が次の上値目標です。MACDはポジティブ(0.059)で、DIF(-0.052)がDEA(-0.112)を上抜けてゴールデンクロスしました。出来高(28.99K)はMA5(70.52K)およびMA10(61.58K)を大きく下回っており、ラリーは薄い参加者の中で進行しています。オーダーブックは買い24%、売り76%です。 7.87のMA28が押し目時の最も近いサポートであり、7.65から7.82の平均線帯がその下のクッションとなります。出来高を伴って8.46を超えて引ければ、ETFのストーリーを追う買い手が活発化していることを示唆するでしょう。7.65を割り込めば、週半ばの安値である7.17が再び視野に入ります。 $INJUSDT #ByXIMPACT
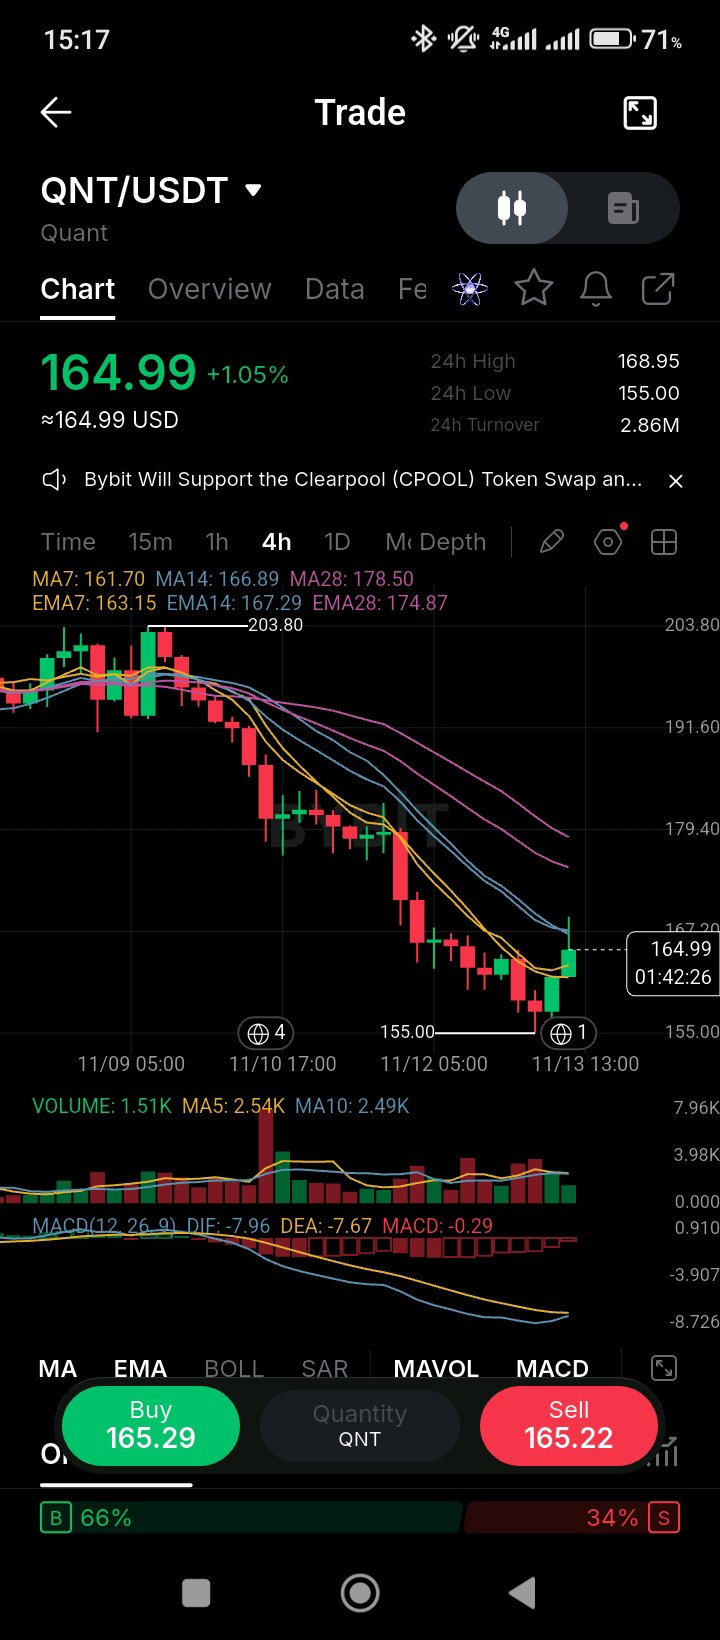
QNTは164.99で推移しており、11月9日の高値203.80から約19%下落しています。この下落はQuantによる発表ではなく、市場全体の下落傾向に連動したものです。 11月5日、CoinMarketCapはQNTの5.7%の下落について、仮想通貨市場全体の時価総額が24時間で約5%減少した市場全体の売り圧力によるものとし、Quant固有のニュース、上場、トークンのアンロック、悪用などの事実は確認されなかったと報告しました。11月10日には下落がさらに加速し、coinotagはQNTが24時間で6.89%下落し187.57ドルになったと報じました。建玉(オープン・インタレスト)が急速に増加したことから、ロングの清算ではなく、新規のショートポジションが増加したと解釈されました。同期間のビットコインの下落幅はわずか0.59%であったため、QNTは市場の動きを大きく上回る変動を見せたことになります。同日は米CPIの発表があり、これが主要なマクロイベントでした。9月に発表されたクリアリングハウスとの提携や銀行のトークン化パイロット運用は現在も継続していますが、11月のトークン価格はこれらの発表ではなく、市場心理とポジショニングによって左右されています。 チャートは明確なダウントレンドを示しています。QNTは1.05%上昇して164.99となっており、24時間のレンジは155.00から168.95です。価格はMA7(161.70)およびEMA7(163.15)の上位に位置していますが、MA14(166.89)、MA28(178.50)、EMA14(167.29)、EMA28(174.87)の下位にあり、長期の移動平均線がすべて上値抵抗として重なっている状況です。MACDはマイナス(-0.29)で、DIF(-7.96)はDEA(-7.67)を下回っており、両線とも下降しています。出来高(1.51K)はMA5(2.54K)およびMA10(2.49K)を下回っています。オーダーブックは66%が買いサイドに傾いていますが、緑のバーは依然として平均を大きく下回っています。 155の安値が維持すべき水準であり、167から167.3のMA14およびEMA14のクラスターが最初に突破すべきレジスタンスとなります。155を割り込むと、次の下落局面へ移行する可能性があります。 $QNTUSDT #ByXIMPACT
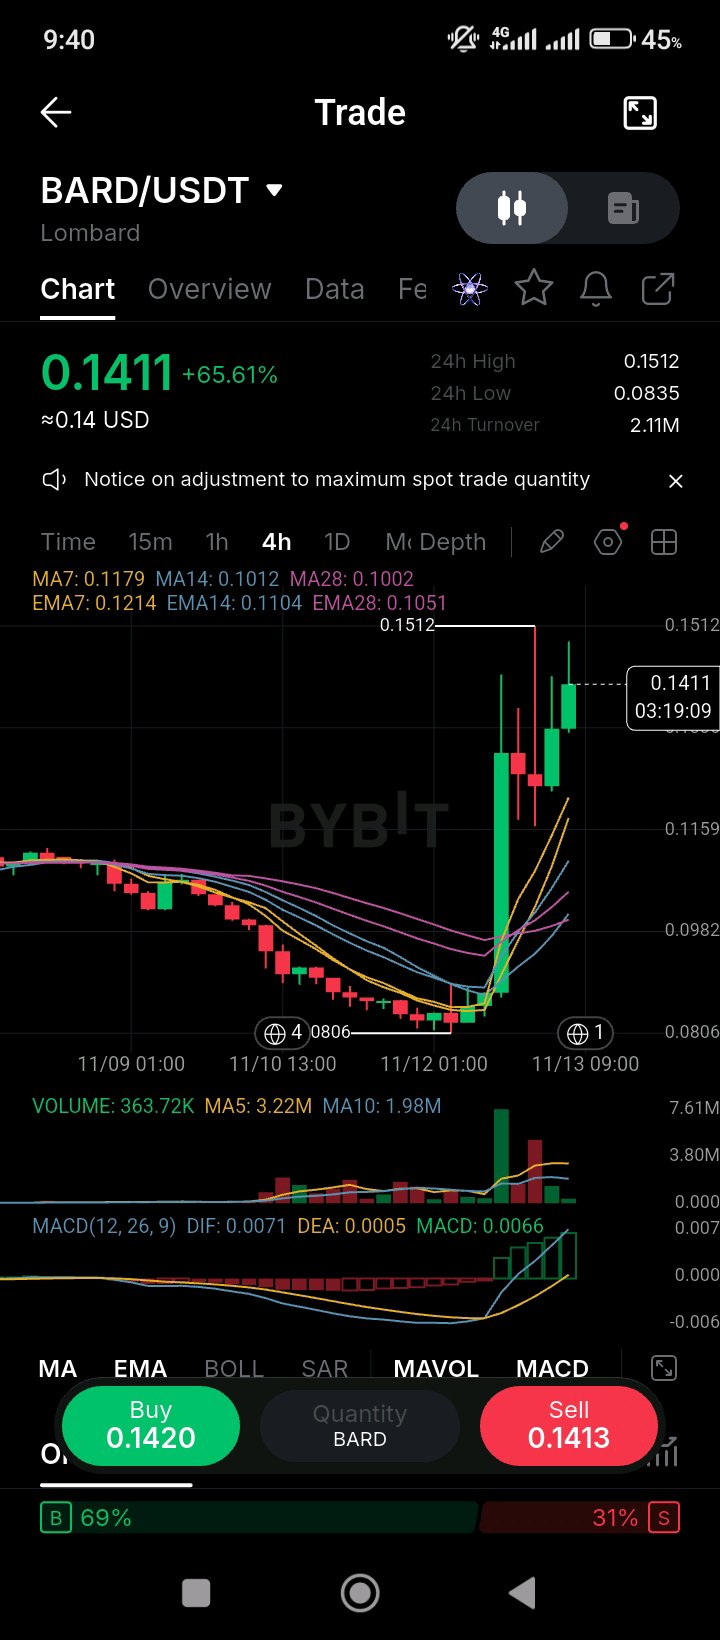
BARDは本日65%上昇しましたが、この動きを裏付ける確たる材料は見当たりません。しかも5日後にはトークンのアンロックが控えています。 LombardのBARDは3月初旬にローンチされ、3月5日に1.70ドルでピークを付けた後、8月3日には0.1029ドルの安値まで下落しました。9月28日のChainlink CCIP 2.0移行によるセキュリティ強化、そして10月29日に終了したシーズン3のエアドロップ請求が直近のイベントです。当面の最大のリスクはトークンの供給スケジュールです。RootDataによると、11月18日に1,375万BARD(現在の価格で約150万ドル相当)がアンロックされる予定で、その後も2027年初頭まで毎月同規模のリリースが続きます。流通量3.4億に対しては小規模なアンロックですが、65%急騰した直後のタイミングであるため、買い手が吸収できるかどうかが試されるでしょう。本日の急騰を説明するニュースは見当たらなかったため、特定の要因に結びつけることは控えます。 チャートを見ると、BARDは65.61%高の0.1411ドルで、24時間のレンジは0.0835〜0.1512ドルです。価格はMA7(0.1179)、MA14(0.1012)、MA28(0.1002)を大きく上回り、EMA7(0.1214)、EMA14(0.1104)、EMA28(0.1051)も上回っています。MACDは0.0066と強くポジティブで、DIF(0.0071)はDEA(0.0005)を大きく上回っています。出来高(363.72K)はMA5(3.22M)やMA10(1.98M)を大きく下回っており、足元のローソク足は直近の平均レベルほどの出来高を伴っていません。オーダーブックは買い注文が69%を占めています。 0.1179ドルのMA7と0.1214ドルのEMA7が、この上昇が維持されるかどうかのサポートラインとなります。0.1012ドルを割り込んで引けるようなら、上昇分のほとんどが打ち消されるでしょう。 $BARDUSDT #ByXIMPACT
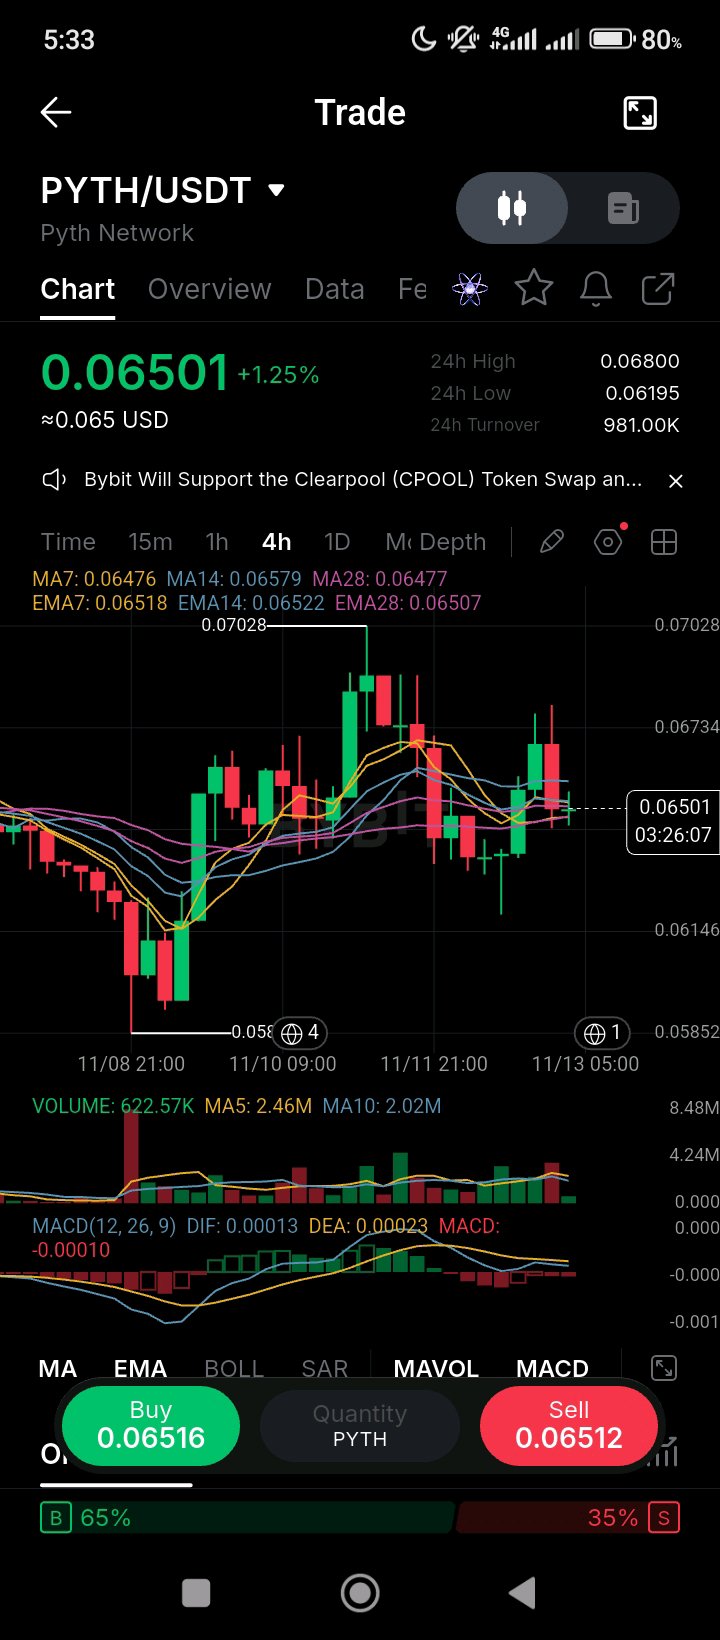
Pythの収益はトークン価格よりも速いペースで成長しており、バイバックプログラムはこの両者を結びつけるメカニズムとして機能することになっています。 11月3日に発表されたPythの2026年10月のレポートでは、年換算のサブスクリプション収益は1367万ドルで、9月から18.9%増加しました。これは、センチメントで取引されてきたトークンにとって、このスレッドで最も具体的な数字となります。この収益は機関投資家向けの市場データ製品によるものであり、プロトコルのRWA(現実資産)パーペチュアルに関する取り組みにより、トークン化資産取引の大部分でPythのフィードが役割を確立しています。注目すべきメカニズムはバイバックです。2025年12月に立ち上げられたPYTH準備金は、プロトコル収益を原資として、DAOトレジャリーの33%を月次の市場買付に充てるものです。重要なのは、収益がバイバックの原資であり続ける限りにおいてのみバイバックは意味をなすため、収益が今後も複利で増加し続けるかどうかという点です。 チャート上では、PYTHは1.25%上昇し0.06501となっています。24時間のレンジは0.06195から0.06800です。価格はMA7(0.06476)とMA28(0.06477)、およびEMA7(0.06518)の上方に位置していますが、MA14(0.06579)とEMA14(0.06522)よりわずかに下にあるため、現在の価格付近で移動平均線が絡み合っています。MACDはわずかにマイナス(-0.00010)で、DIF(0.00013)がDEA(0.00023)を上抜こうとしています。出来高(622.57K)はMA5(2.46M)およびMA10(2.02M)を大きく下回っており、今日のローソク足からはあまり活発な参加は見られません。オーダーブックは買いサイドが65%となっています。 MA14の0.0658が次の動きを左右する水準となります。出来高を伴ってこの水準を上回って引ければ、11月の高値である0.0703への道が開けます。安値である0.0619を割り込めば、反発の動きは打ち消されるでしょう。 $PYTHUSDT #ByXIMPACT
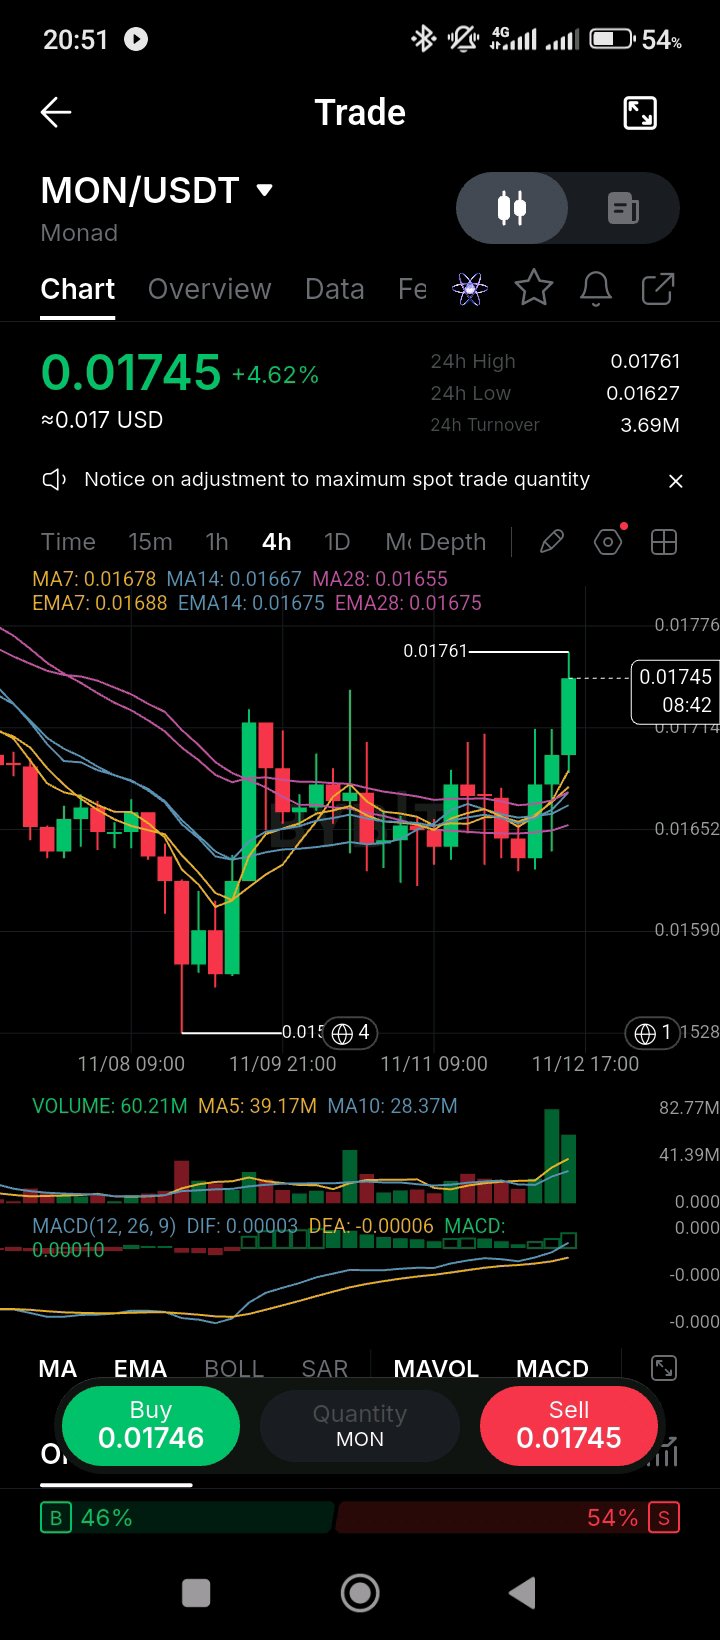
MONは4.6%上昇し0.01745で推移しており、9月下旬の水準を約35%下回っています。11月24日、つまりあと12日で初のインサイダーアンロック(ロック解除)が控えています。 MonadのメインネットとMONトークンは2025年11月24日にローンチされ、1000億枚の供給量の50%以上がローンチ時にロックされ、2029年までベスティング(権利確定)が行われる予定です。最初の大規模なインサイダーアンロックは2026年11月24日に予定されています。Coinspeakerのドイツ語版報道では約168億MONが放出されるとしていますが、Cryptorankの報道では初期放出後の月次アンロックは約11.6億MONとされており、この2つの数値の整合性が取れないため、ポジションサイズを決める前にベスティングスケジュールを確認してください。ポジティブな面としては、MonadのDeFi TVL(預かり資産)は9月に10億ドルを突破し、ネットワークは2026年に少なくとも2回のアップグレードを実施しています。9月29日時点でMONは約0.027ドルで取引され、循環時価総額は約3億1600万ドルでした。つまり、評価額の大半はロックされた供給分にあり、今後数週間の最大の変動要因はアンロックとなります。 チャートを見ると、0.01627の安値から反発し、価格は4.62%上昇して0.01745となり、24時間の高値は0.01761を記録しています。価格はMA7(0.01678)、MA14(0.01667)、MA28(0.01655)、およびEMA7(0.01688)、EMA14(0.01675)、EMA28(0.01675)を上回っており、移動平均線はローソク足の下でタイトなバンドを形成しています。MACDはわずかにプラス(0.00010)で、DIF(0.00003)がDEA(-0.00006)を上回っています。出来高(60.21M)はMA5(39.17M)とMA10(28.37M)の両方を上回っており、この上昇には実際の市場参加が伴っています。オーダーブックは売りサイドが54%を占めています。 当日の高値0.01761をクリアできるかが焦点です。0.01655から0.01688の移動平均バンドが維持すべきサポートラインとなります。0.01627を割り込めば、アンロックが価格の重しになり始めているというサインとなるでしょう。 $MONUSDT #ByXIMPACT
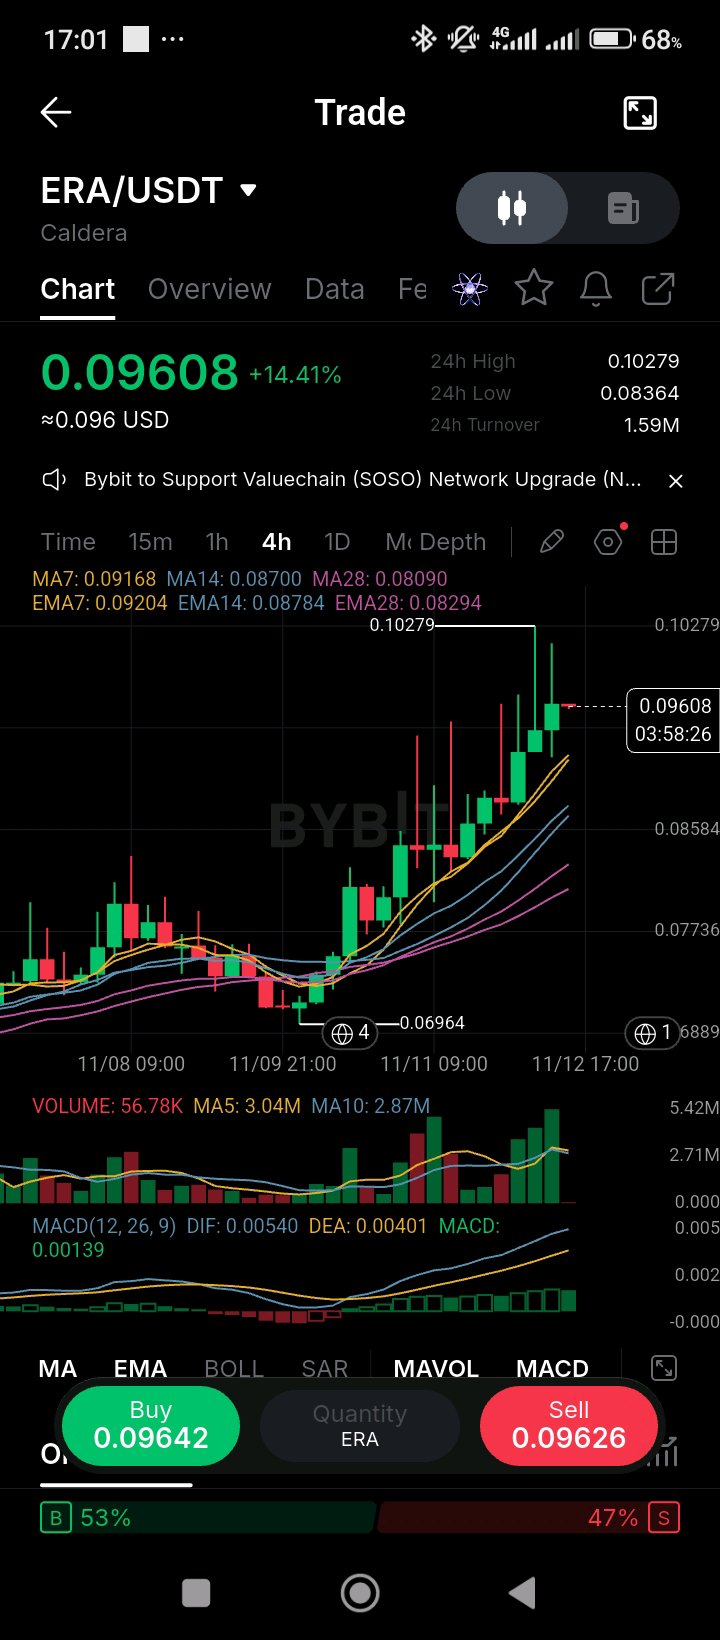
ERA is up 14% today, roughly 40% above its November low of 0.06964, and the move sits against a supply backdrop that's been heavy all summer. Caldera's ERA token, the native token of its Metalayer network for connecting Ethereum rollups, has been dominated by unlocks since July. A July 17 release put between 26.4 million and 77.5 million tokens into the market, which CoinMarketCap put at 12.6% to 52% of market capitalization, and another 26.4 million went to private investors in August. CMC's circulating figure is about 148.5 million out of a 1 billion total, roughly 15% of supply, so the unlock schedule still has a long way to run. The token set its all-time low of about $0.0545 on August 19. Caldera's own announcements haven't tied the November move to a specific catalyst, and CMC's November 10 overview describes the role of ERA only in general terms, so there's no news event to point to here. On the chart, ERA is up 14.41% to 0.09608, on a 24-hour range of 0.08364 to 0.10279. Price is above the MA7 (0.09168), MA14 (0.08700) and MA28 (0.08090), and above the EMA7 (0.09204), EMA14 (0.08784) and EMA28 (0.08294). The 0.10279 high is the level to clear. MACD is positive (0.00139), with the DIF (0.00540) above the DEA (0.00401), so momentum is building. Volume (56.78K) is well under the MA5 (3.04M) and MA10 (2.87M), so this surge is running on very thin participation. The order book is 53% buy-side. The 0.0917 MA7 and 0.0920 EMA7 are the support to hold. A close above 0.1028 on rising volume would be a real breakout. A loss of 0.0870 would undo the move. $ERAUSDT #ByXIMPACT
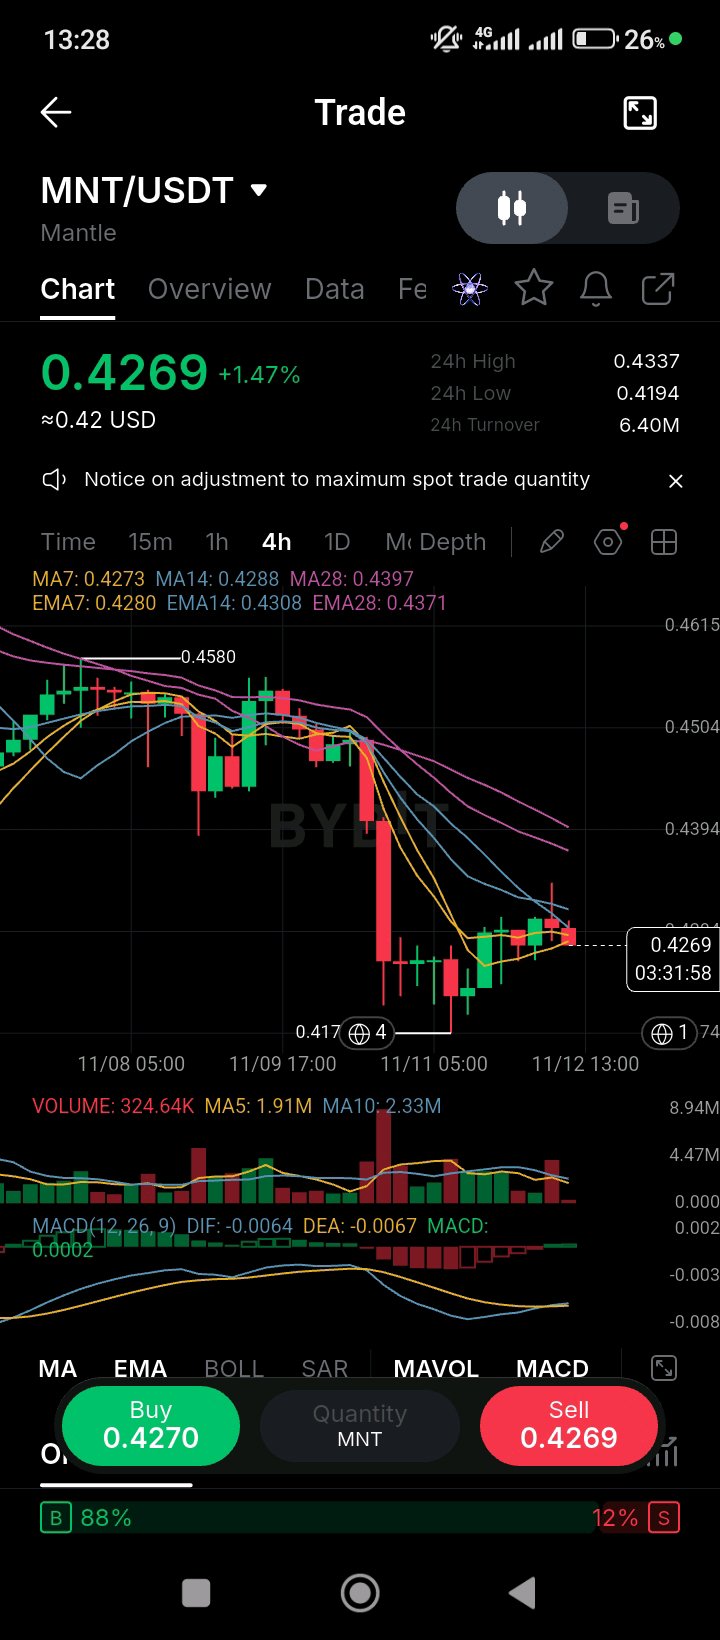
MNT is at 0.4269, down about 60% over the year, and the protocol's next budget cycle is the newest supply item on the table. On October 28, Mantle's core team proposed a fourth budget cycle covering July 2026 to June 2027, with $40 million in USDx and 150 million MNT allocated to operations and ecosystem growth. The plan renews automatically every 12 months, and it can't go to a vote until delegators finish allocating their MNT. The 150 million MNT figure is a meaningful amount of supply directed at ecosystem spending, so the vote outcome matters for the token's supply picture. In July, the Mantle Super Portal moved from LayerZero to Chainlink CCIP, which strengthened MNT's cross-chain security, and the market has largely ignored that upgrade. CoinMarketCap's October 29 note put the 5 to 6% drop that week down to an altcoin selloff rather than anything Mantle-specific, and the CMC coverage from September had credited the USDG integration for a 3.7% gain. On the chart, MNT is up 1.47% to 0.4269, on a 24-hour range of 0.4194 to 0.4337. Price sits above the MA7 (0.4273) and EMA7 (0.4280), but below the MA14 (0.4288), MA28 (0.4397), EMA14 (0.4308) and EMA28 (0.4371), so the overhead averages are still stacked above the price. MACD is essentially flat (0.0002), with the DIF (-0.0064) just above the DEA (-0.0067), so the cross is only starting. Volume (324.64K) is well under the MA5 (1.91M) and MA10 (2.33M), so this bounce is coming on very thin participation. The order book is 88% buy-side. The 0.4288 MA14 and 0.4308 EMA14 are the level to clear. A close above the 0.4397 MA28 would be the first sign of a trend change, and a loss of the 0.4170 low would reopen the November lows. $MNTUSDT #ByXIMPACT
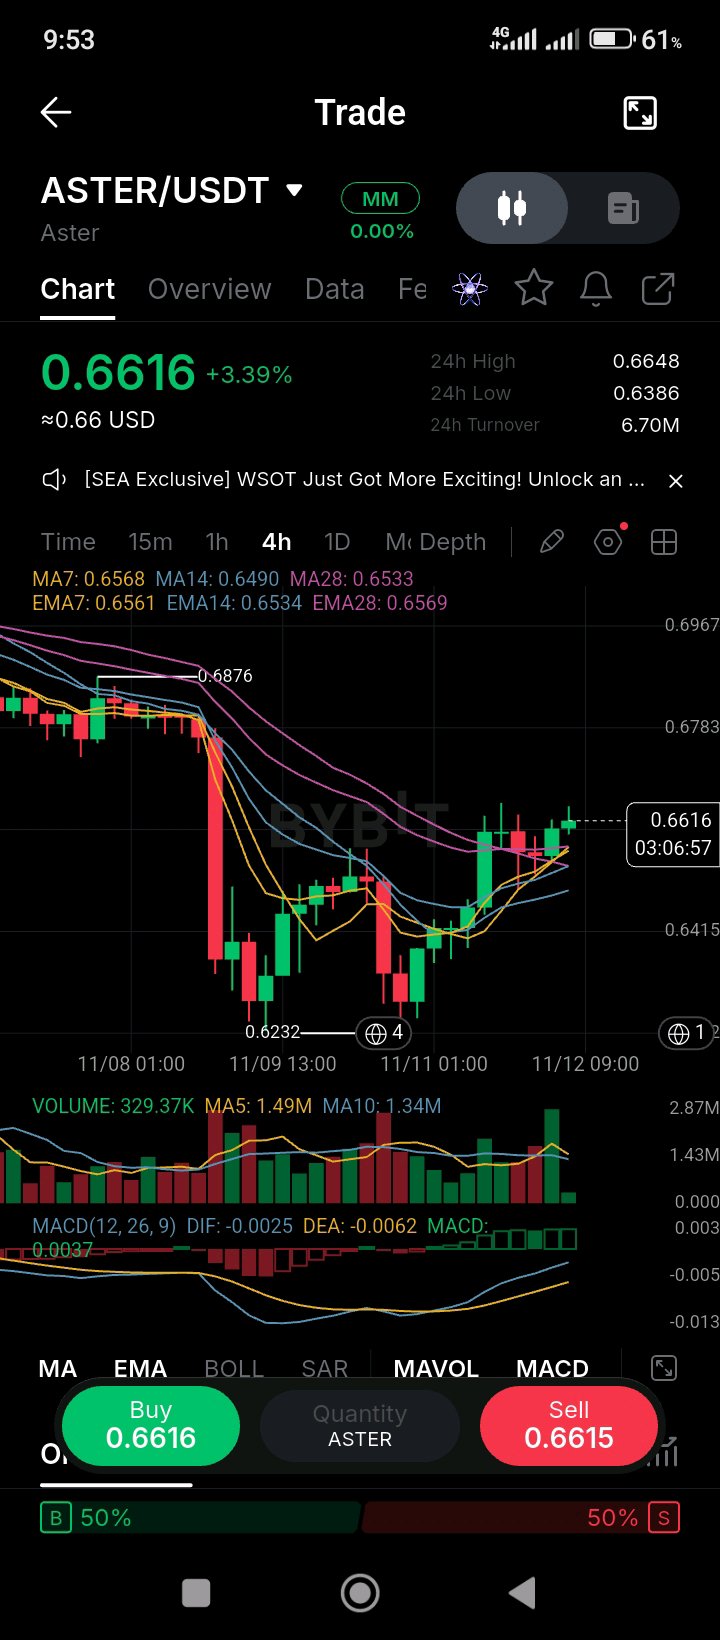
the Stage 6 airdrop is in its claim window through December 4, so the token has a known supply event running alongside the price action. On November 4 at 12:00 UTC, Aster opened the Stage 6 claim for holders who picked the six-month vesting option, letting them claim their full allocation in one step. The claim window runs to December 4, and the allocation page shows how much of the airdrop is still locked. That means a block of tokens that was vesting over months can reach the market within the next few weeks, and claimants who want to take profit will have that option. On the buyback side, the program has been routing up to 99% of daily fees to repurchases since June, and a matching team-allocation burn was added then too. Those buybacks and burns are the offset to that claim supply, and the tug-of-war between them is the main thing to watch this month. On the chart, ASTER is up 3.39% to 0.6616, on a 24-hour range of 0.6386 to 0.6648. Price sits above the MA7 (0.6568), MA14 (0.6490) and MA28 (0.6533), and above the EMA7 (0.6561) and EMA14 (0.6534). The EMA28 (0.6569) is just overhead, which makes it the nearest level to clear. MACD has turned positive on the histogram (0.0037), with the DIF (-0.0025) above the DEA (-0.0062). Volume (329.37K) is well under the MA5 (1.49M) and MA10 (1.34M), so this rebound is coming on light participation. The order book is split 50/50. The 0.6569 EMA28 and 0.6876 November high are the two levels to watch. A close above 0.6569 on rising volume would open the way back toward 0.69 to 0.70. A loss of the 0.6232 low, which came in on November 10, would put the bounce in doubt. $ASTERUSDT #ByXIMPACT
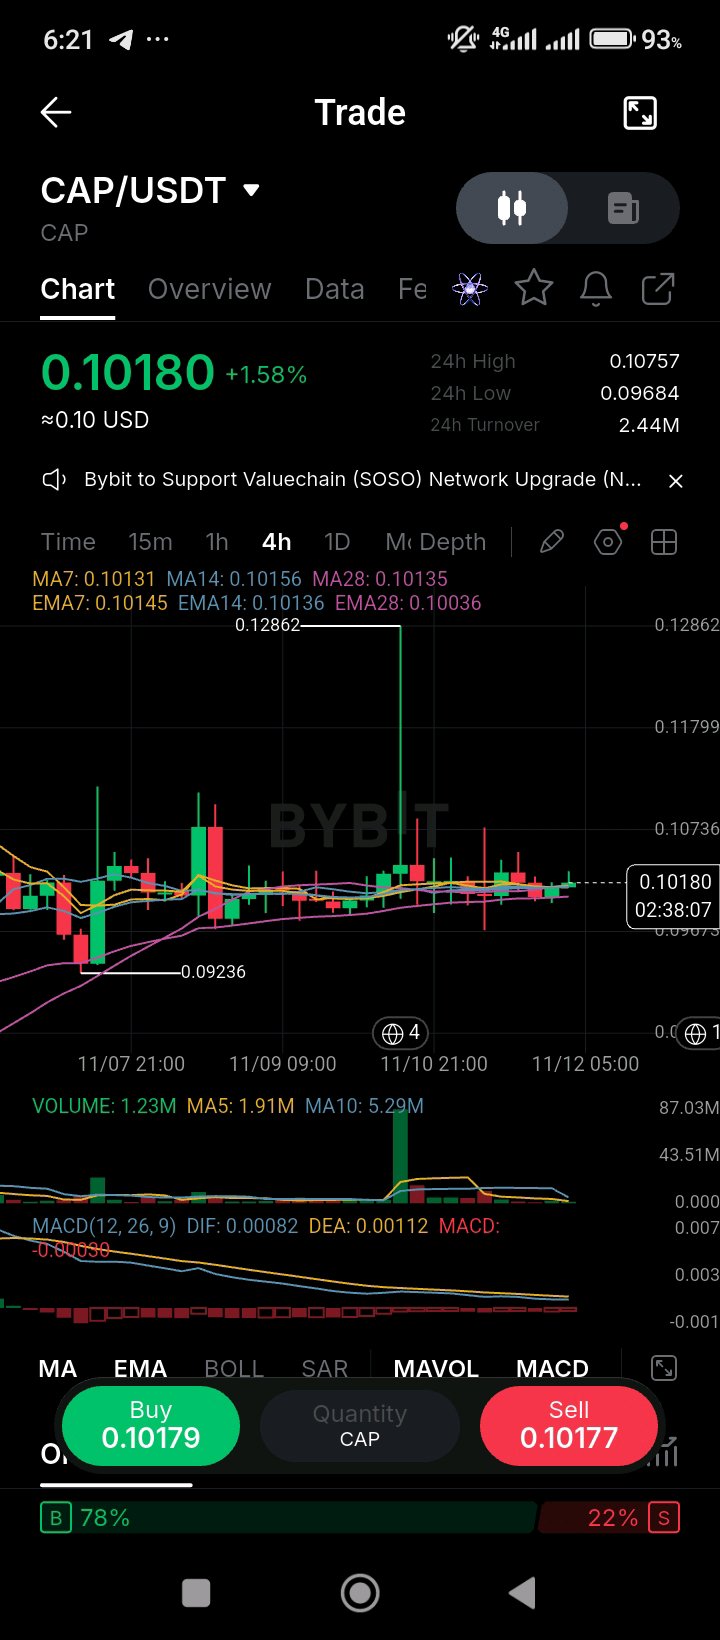
CAP is at 0.1018, about nine and a half times its June auction price, and the chart is holding the averages after a November 10 wick to 0.12862. The auction cleared at $0.011 in late June, a $106 million fully diluted valuation, with $16.4 million of bids from 1,002 participants and 5.5 times oversubscription. Trading began June 26, and by early July the token had posted nearly $900 million of volume in its first 10 days, with a first-day close near a $325 million FDV. The Block lists 1.6 billion CAP circulating out of 10 billion total. At today's price that is roughly a $163 million circulating market cap against about a $1.02 billion fully diluted value, so most of the valuation is still unlocked-in-the-future supply. The governance rights cover risk parameters, borrower whitelisting and fee models, so the token's value depends on protocol decisions rather than on a fixed revenue stream. The chart shows a range after the spike. CAP is up 1.58% to 0.10180, with a 24-hour range of 0.09684 to 0.10757. Price sits on the averages: the MA7 (0.10131), MA14 (0.10156) and MA28 (0.10135) are bunched within a few hundredths of a cent, and the EMA7 (0.10145), EMA14 (0.10136) and EMA28 (0.10036) are in the same band. The 0.09236 low is the level below which this range breaks. MACD is slightly negative (histogram -0.00030), with the DIF (0.00082) above the DEA (0.00112) and the lines close together. Volume (1.23M) is well under the MA5 (1.91M) and MA10 (5.29M), so the range is trading quietly. The order book is 78% buy-side. The 0.1014 to 0.1016 averages are the level to reclaim above. A close above the 0.1286 spike high would be a real breakout. A loss of 0.0924 would undo the range. $CAPUSDT #ByXIMPACT
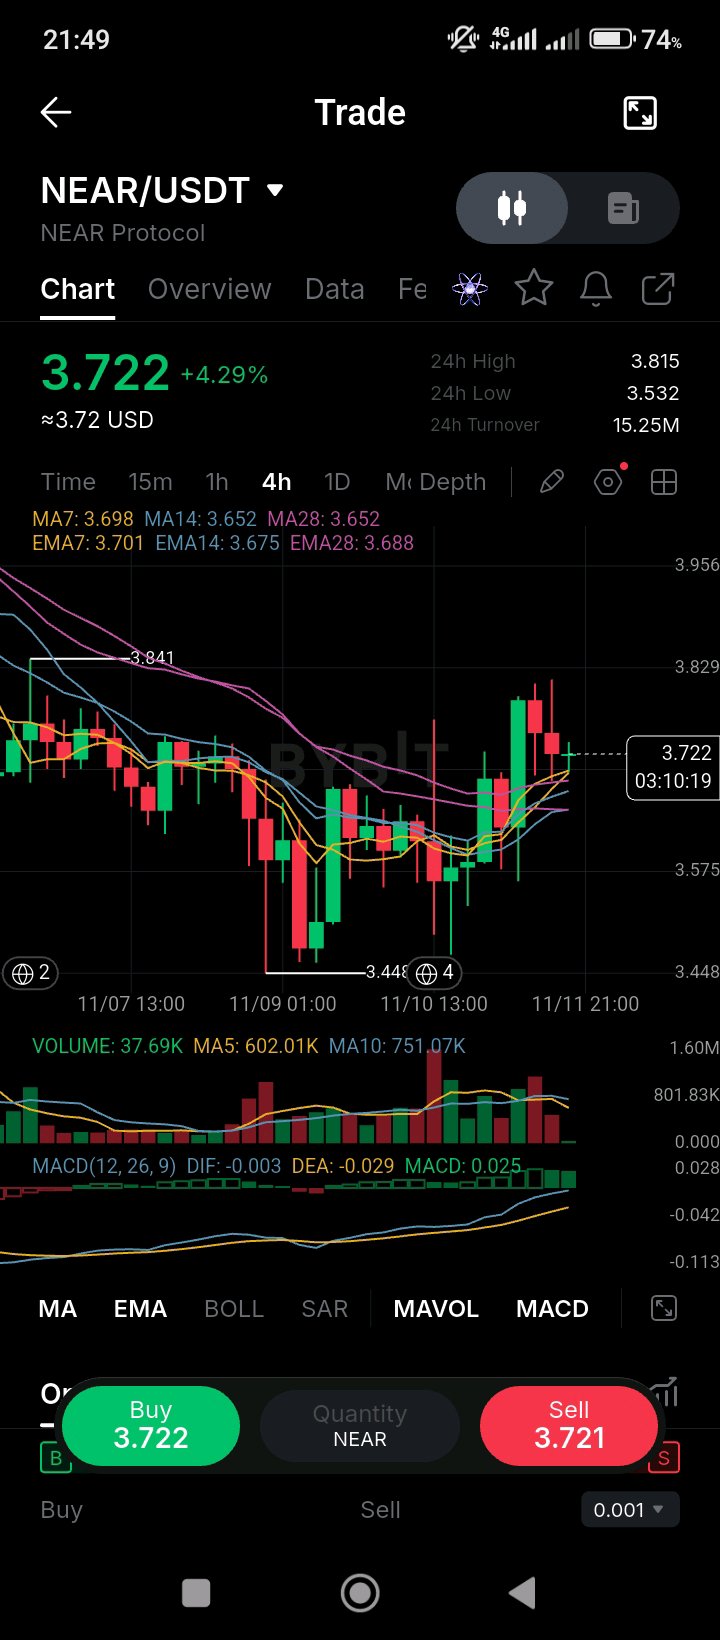
NEAR has been cut back to 3.72, but the supply side got a real change this month, and the Intents business is still growing. On November 2, NEAR holders approved HSP-029, a proposal to cut annual token issuance, with 99.9% of participating voting power in favor. Cointelegraph reported the token fell 7% on November 3 despite the vote, so the market has treated the supply cut as a long-term change, not a short-term catalyst. The protocol's Intents product, the cross-chain trading layer, hit a record daily fee of more than $400,000 in November and passed $10 million in cumulative fees, per Todayonchain. The regulated side is softer. The Bitwise NEAR ETF (NRR) posted its second straight weekly outflow in the week to November 8, totalling $4.38 million. NEAR fell about 15% in the first week of November, and CoinMarketCap put the 200-day average near $3.60 as the key support. On the chart, NEAR is up 4.29% to 3.722, on a 24-hour range of 3.532 to 3.815. Price is above the MA7 (3.698), MA14 (3.652) and MA28 (3.652), and above the EMA7 (3.701), EMA14 (3.675) and EMA28 (3.688), so every average on the chart is now below the price. MACD is positive (0.025), with the DIF (-0.003) above the DEA (-0.029). Volume (37.69K) is well under the MA5 (602.01K) and MA10 (751.07K), so this bounce is running on very light participation. The 3.65 to 3.70 cluster is the level to hold, since it's the MA14, MA28 and EMA7 together. A close above the 3.84 high would show buyers are back. A loss of the 3.60 support would bring the November low back into view. $NEARUSDT #ByXIMPACT
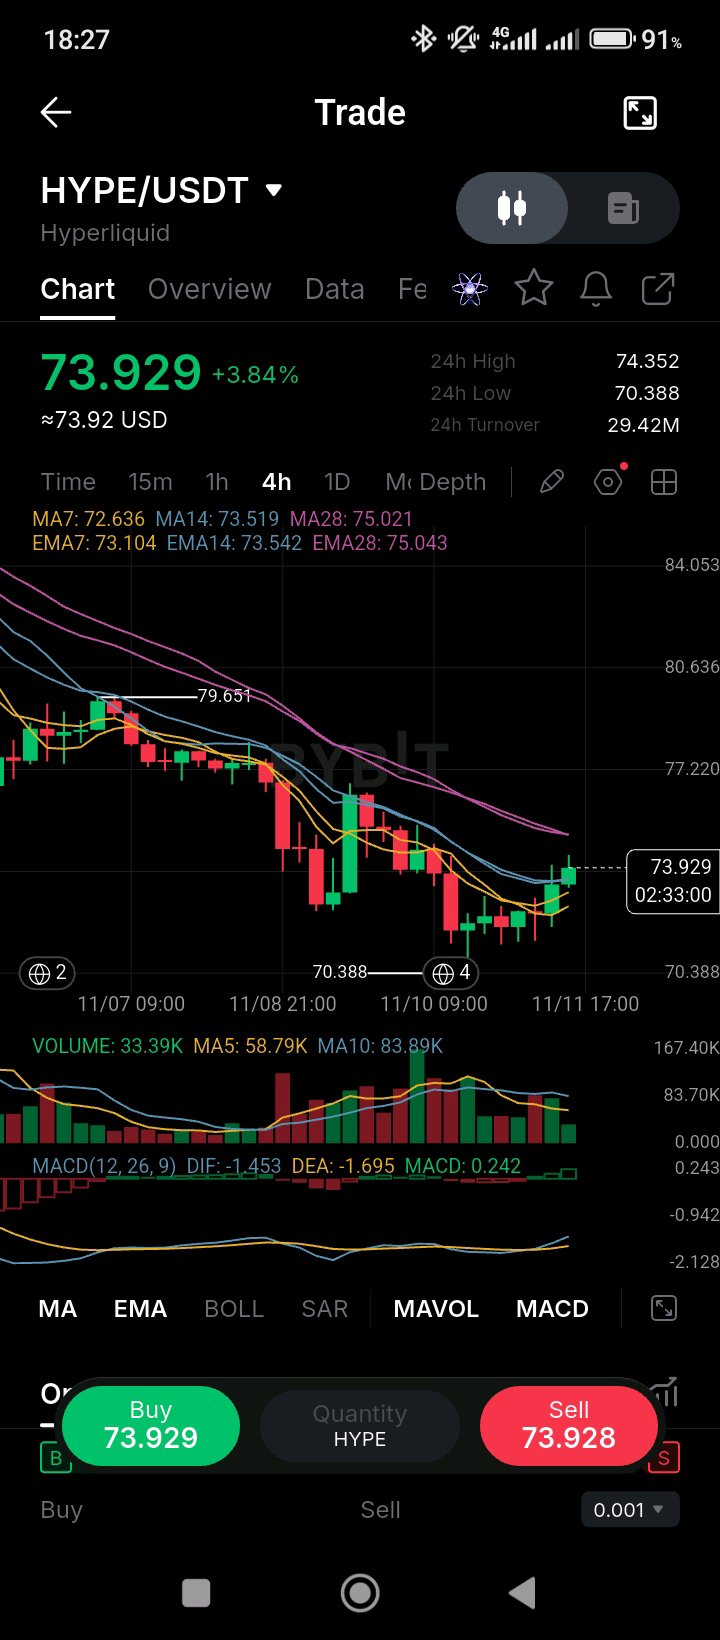
トークンプロフィール: Hyperliquid ($HYPE) Hyperliquid ($HYPE) は、分散型無期限先物取引に特化して構築された、高性能なレイヤー1アプリチェーンである「Hyperliquid」を支えるネイティブユーティリティ、ガバナンス、およびステーキング資産です。毎秒数万件の注文を処理し、1秒未満でファイナリティを確定できる独自構築の高速コンセンサスエンジンを活用することで、Hyperliquidは中央集権型取引所のスピードとUXに、DeFiの非カストディアルな透明性を融合させています。固定されたトークノミクス構造を基盤とし、ネイティブのバリデーターによるプルーフ・オブ・ステーク(PoS)コンセンサスを通じてネットワークを保護し、プロトコルレベルのトランザクションガス代を賄い、拡大するスポットおよびデリバティブのオーダーブックインフラストラクチャ全体でエコシステムのガバナンスを推進します。 テクニカル分析: HYPE/USDT — 4時間足(4H)での局所的な反発と移動平均線のテスト 4時間足チャートにおいて、HYPEは **$73.929** (+3.84%)[span_0](start_span)[span_0](end_span) 付近で取引されており、スイングハイの **$79.651**[span_2](start_span)[span_2](end_span) からの数日間にわたる調整を経て、直近のローカル安値である **$70.388**[span_1](start_span)[span_1](end_span) からの回復局面を迎えています。 * **移動平均線のダイナミックレジスタンススタック:** 現在の価格動向は、移動平均線リボンによって形成される直上のレジスタンスをテストしています[span_3](start_span)[span_3](end_span)。価格は **$72.636 (MA7)**[span_4](start_span)[span_4](end_span) および **$73.104 (EMA7)**[span_5](start_span)[span_5](end_span) を上抜けており、現在は **$73.519 (MA14)**[span_6](start_span)[span_6](end_span) および **$73.542 (EMA14)**[span_7](start_span)[span_7](end_span) に直接圧力をかけています。さらに上のレジスタンスは **$75.021 (MA28)**[span_8](start_span)[span_8](end_span) および **$75.043 (EMA28)**[span_9](start_span)[span_9](end_span) に位置しています。構造的な転換を確認し、$77.22〜$79.65の流動性ゾーンへの上昇を狙うには、4時間足での $73.55 上での確定的な終値が必要です[span_10](start_span)[span_10](end_span)。 * **サポートベースとフロアスイープ:** 直近のローカルサポートは、$70.388のフロアスイープ安値(24時間安値も $70.388 に位置)にしっかりと固定されています[span_11](start_span)[span_11](end_span)。この水準以上で価格が推移すれば、短期的な調整レンジは維持されます[span_12](start_span)[span_12](end_span)。一方、$70.38を下回ると、より深いマクロ需要圏に向けて下落が拡大するリスクがあります[span_13](start_span)[span_13](end_span)。 * **出来高とMACDプロファイル:** 4時間足の出来高は **33.39K HYPE ($29.42M USDT 24h売買高)**[span_14](start_span)[span_14](end_span) を記録しており、安値からの着実な買い吸収が見て取れます(5期間の出来高MAは58.79K、10期間のベースラインは83.89K)[span_15](start_span)[span_15](end_span)。4時間足のMACD(DIF: -1.453, DEA: -1.695)は強気のクロスオーバーを形成し、ヒストグラムはプラス圏に転じています(**MACD: +0.242**)[span_16](start_span)[span_16](end_span)。これは、価格が14期間移動平均線のレジスタンスに挑む中、モメンタムがプラス領域へ転換しつつあることを示唆しています[span_17](start_span)[span_17](end_span)。 あなたは $70.38 のサポートフロア付近で現物HYPEを拾っていますか?それとも $73.55 の移動平均線クラスターを上抜ける4時間足の確定を待っていますか? $HYPEUSDT #ByXIMPACT
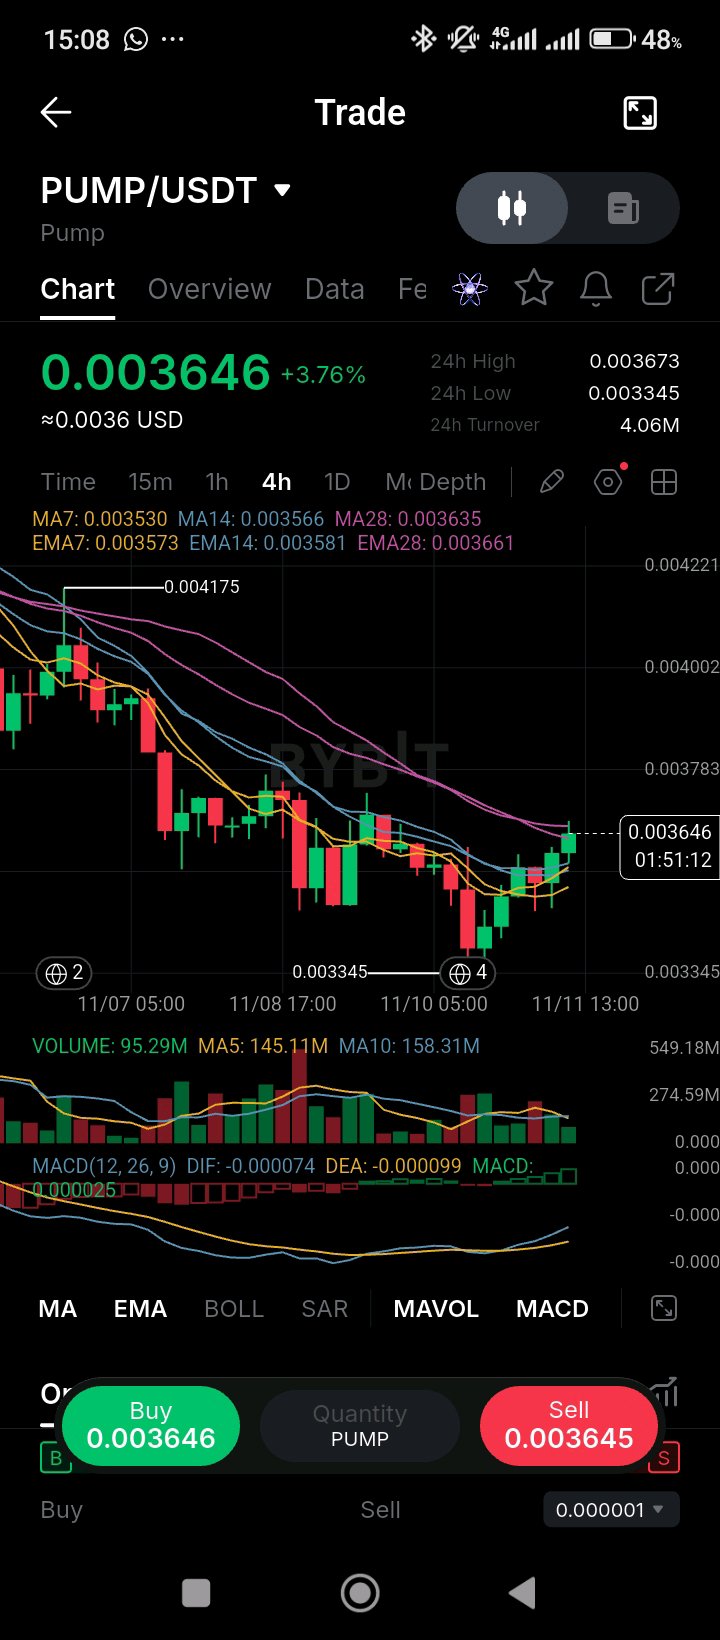
PUMP is up 3.76% today, but the bigger story is the platform's own treasury sales, which are weighing on the token. According to a crypto.news report summarized by CoinMarketCap on November 7, Pump.fun moved another 76,111 SOL, worth about $6.85 million, to a Kraken deposit address on November 6. That brings its estimated cumulative SOL sales to about 5.55 million SOL, roughly $882 million, at an average of about $158.88. The same day, PUMP fell 3.32% in a weak market, and CoinMarketCap tied the move to beta and de-risking rather than a platform-specific break. Whether those SOL sales are treasury management or something else is disputed, and Pump.fun hasn't given a full accounting, so the number is best treated as a reported figure. The token's supply policy is clearer: in April, the platform burned about 36% of circulating supply, roughly $370 million of PUMP, and moved to a 50% revenue buyback model. On the chart, PUMP is up 3.76% to 0.003646, on a 24-hour range of 0.003345 to 0.003673. Price sits above the MA7 (0.003530) and MA14 (0.003566), and the EMA7 (0.003573) and EMA14 (0.003581), but it's still under the MA28 (0.003635)? No, price is above it too, so the price sits above every average on the chart except the EMA28 (0.003661), which is just overhead. MACD is turning positive (0.000025), with the DIF (-0.000074) just under the DEA (-0.000099). Volume (95.29M) is well below the MA5 (145.11M) and MA10 (158.31M), so the bounce isn't drawing much buying. The 0.004175 high from November 7 is the level to reclaim. The EMA28 at 0.003661 is the close to clear. A break above it on rising volume would test the 0.004175 high. A loss of 0.003345 would put the sell-off back in control. $PUMPUSDT #ByXIMPACT
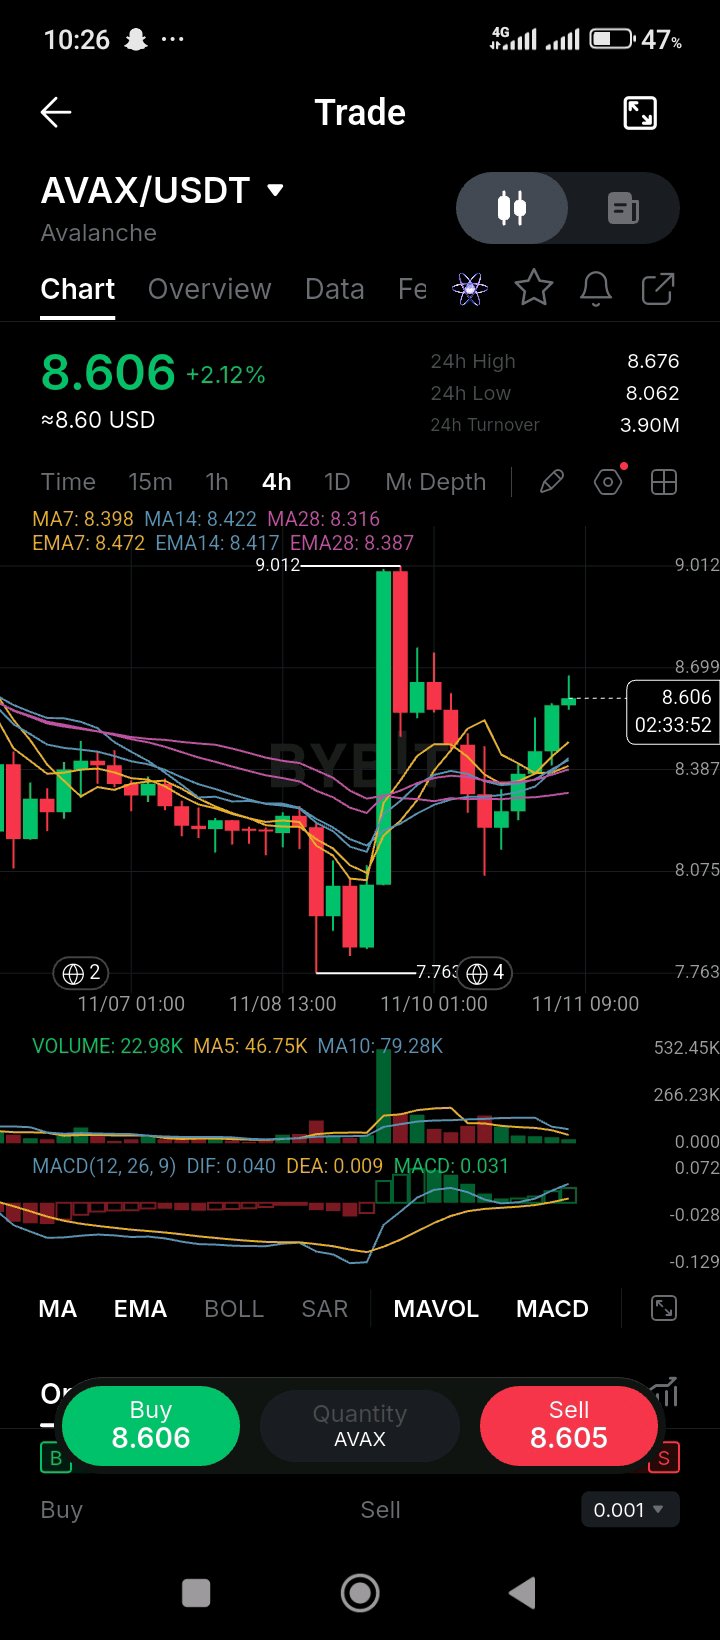
AVAX/USDT — 11月8日に8ドルを割り込んだAVAXは、現在8.60ドル台まで回復しており、チャート上では2つの移動平均線の間に位置しています。また、次のアンロック(トークン解禁)イベントも通過済みです。 11月8日、アバランチ財団の計画的なベスティングにより1,666,800 AVAXがリリースされました。これは10月31日時点の価格で約1,400万ドル相当であり、流通量4億4,400万枚の0.4%未満に相当します。これは公開スケジュールに基づく計画的な措置であり、新たな決定事項ではないため、価格への直接的な影響は軽微です。より大きな文脈としては、cryptonewsによると、AVAXは11月8日までの28日間で27.6%下落し、8ドルを割り込んでBitcoinやEtherの両方をアンダーパフォームしていました。財務面では、11月5日に発表されたAVATの第3四半期暫定レポートによると、9月30日時点で1,331万AVAXを保有しており、その約91%がステーキングされています。つまり、保有資産の大半が遊休状態ではなく、利回りを得ていることを意味します。第3四半期の全結果とカンファレンスコールは11月19日に予定されています。 チャート上では、AVAXは24時間レンジ8.062~8.676の間で推移し、2.12%上昇して8.606となっています。価格はMA7(8.398)、MA14(8.422)、MA28(8.316)、さらにEMA7(8.472)、EMA14(8.417)、そしてEMA28(8.387)のすべてを上回っています。スパイクトルネードの高値は9.012、安値は7.763です。MACDはポジティブ(0.031)で、DIF(0.040)がDEA(0.009)を上回っています。出来高(22.98K)はMA5(46.75K)の半分未満であり、MA10(79.28K)を大きく下回っているため、今回の反発にはあまり活気が見られません。 8.42のMA14と8.47のEMA7が維持すべき最初の水準となります。9.01を再び上回って引ければ、11月のスパイク高値を試す展開となり、8.32を割り込めば7.76の安値が視野に入ってきます。 $AVAXUSDT #ByXIMPACT
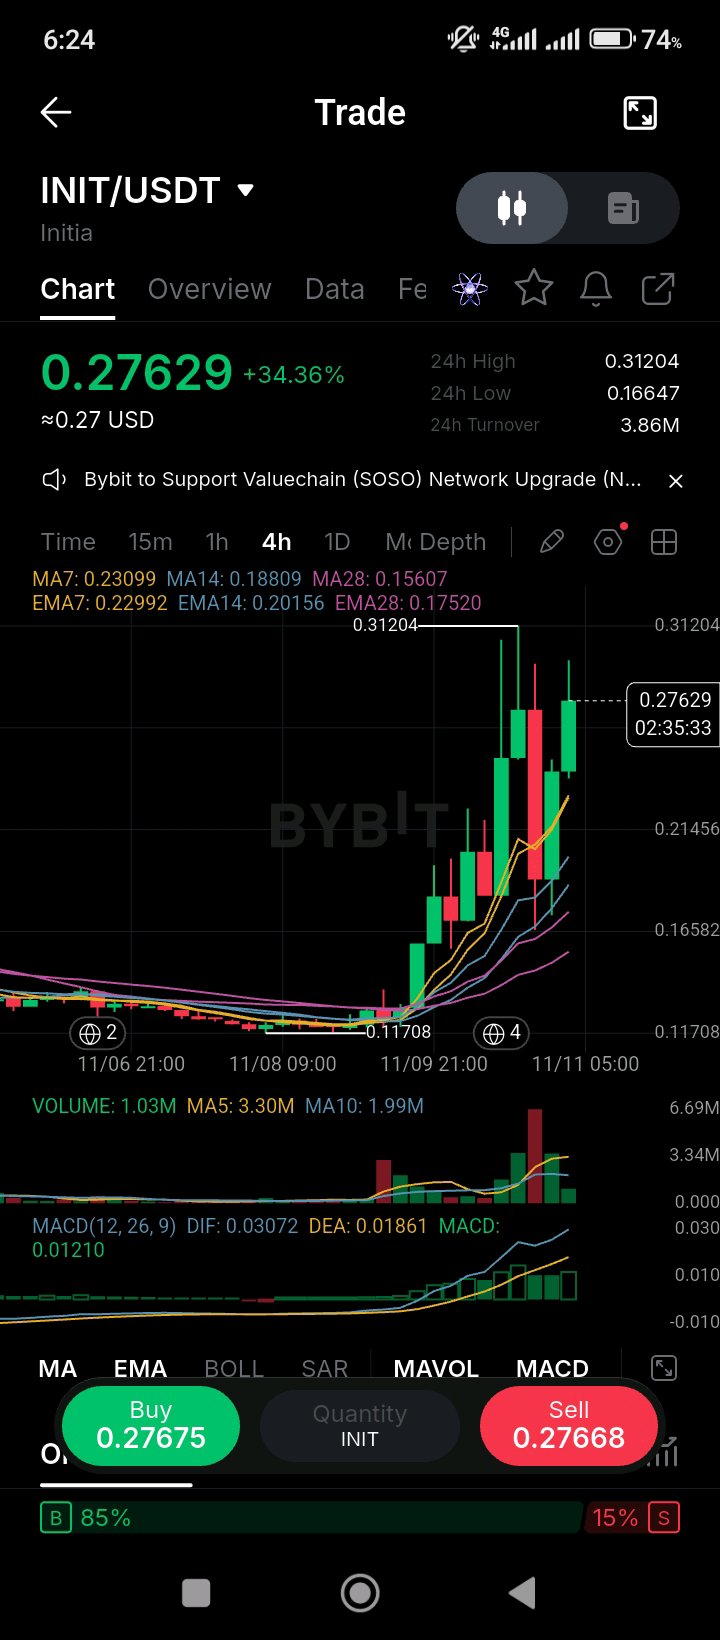
$INITUSDT Initia rallied more than 34% today even after its L1 was halted following a $615K exploit, which makes this a rally that the market is treating as separate from the security risk. On November 10, Initia halted its layer-1 chain after compromised rollup keys let an attacker drain about $615K, according to Whale Alert and Crypto News. The network's native token reportedly surged more than 60% at one point, while the exploit itself is still being reported as it develops. This is the second security incident in the past few weeks, following an October 23 event where reports said an attacker minted tokens. The team's unlock delay, which moved investor vesting to April 2027, was the main supply-side positive earlier this year. Holding a halted chain is still a bigger issue than a price spike, and any restart, post-mortem, or compensation plan will matter more than the current candle. The chart shows the move from the 0.11708 low to a 0.31204 high, and today's bar is up 34.36% to 0.27629. Price sits well above its MA7 (0.23099), MA14 (0.18809) and MA28 (0.15607), and above the EMA7 (0.22992), EMA14 (0.20156) and EMA28 (0.17520). MACD is positive (0.01210), with the DIF (0.03072) above the DEA (0.01861). Volume (1.03M) is under the MA5 (3.30M) and MA10 (1.99M), so the candle is running on lighter participation than the earlier spike. The order book is 85% buy-side, but that is a thin book after a halt, so its reading is less useful than usual. The 0.31204 high is the level to clear, and the 0.23 MA7 is the first support on any pullback. A loss of the 0.20 cluster would signal that the post-exploit buying has faded. #ByXIMPACT
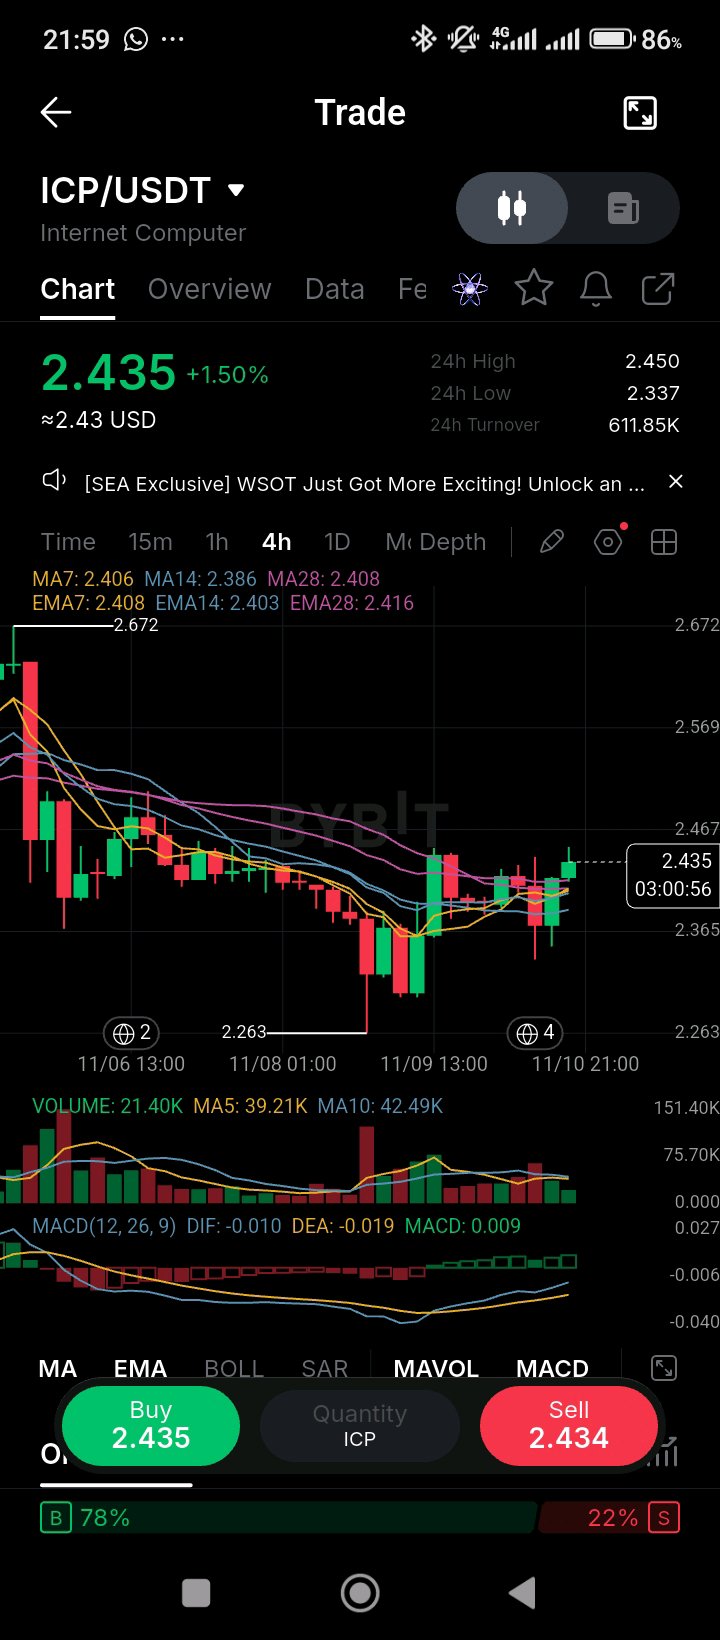
Internet Computer(ICP)は、市場全体が売り込まれる中で、すべての移動平均線を上回る水準まで回復しました。トレーダーの多くは、依然としてこのプロトコルの供給改革を価格に織り込もうとしています。 3月、DFINITYは「Mission 70」と呼ばれる経済修正を発表しました。これはICPのインフレ率を約70%削減するもので、クラウドエンジンの収益をノードプロバイダーに80%、バーン(焼却)に20%割り当てるという内容です。これにより、トークンの価値は新規発行ではなく実際の利用料に依存するようになり、これは大きな変化と言えます。流通面でも動きがありました。3月にUpbitがICPをKRWペアとして上場させ、仮想通貨市場で最も活発なリテール市場の一つに加えました。11月2日にはMULTI/DEXのプレイモードアップデートが実装されました。これは、本物の資金を使用しないテストモードの完全オンチェーン・オーダーブックですが、価格は2.50ドル付近でほとんど反応しませんでした。11月5日のCoinMarketCapのレポートによると、同日の5.6%の下落の背景にはICP特有のニュースはなく、プロトコルではなく市場全体の影響が指摘されています。 チャートを見ると、ICPは移動平均線を維持しています。24時間のレンジは2.337〜2.450ドルで、1.50%上昇し2.435ドルとなっています。価格はMA7(2.406)、MA14(2.386)、MA28(2.408)、そしてEMA7(2.408)、EMA14(2.403)、EMA28(2.416)を上回っています。MACDはプラス(0.009)で、DIF(-0.010)がDEA(-0.019)を上抜けしています。出来高(21.40K)はMA5(39.21K)およびMA10(42.49K)の約半分であり、この反発にはあまり参加者が集まっていません。オーダーブックは買い注文が78%を占めています。 MA28とEMA28が位置する2.41〜2.42ドルのラインが、維持すべき最初の水準となります。日中高値の2.45ドルを上回って引ければ、11月の高値である2.67ドルを試す展開となるでしょう。2.41ドルを割り込めば、再び2.26ドルの安値が視野に入ってきます。 $ICPUSDT #ByXIMPACT
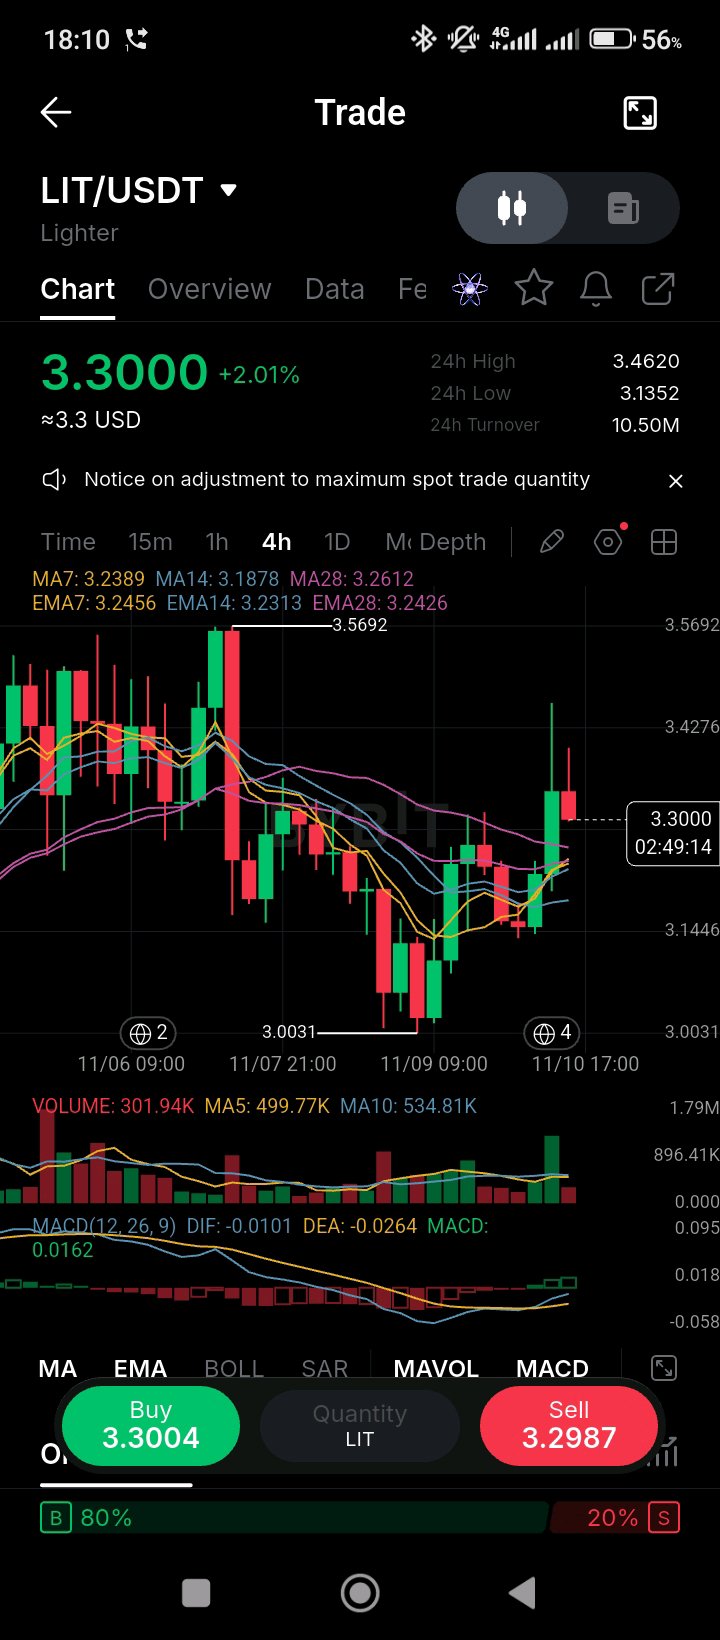
look at Lighter, and the token is now above all three averages after the November bounce, but the protocol's security setup is the part traders rarely check. A DataWallet explainer updated in October 2026 puts Lighter's annual protocol revenue near $26 million, which goes toward public-market buybacks for holders. That's consistent with the buyback story from the earlier posts, and the monthly figure works out to roughly $2 million to $3 million. The same piece flags a security item worth knowing: an October upgrade added two guardian roles that can pause batches and withdrawals for up to 72 hours, and neither role has been assigned yet. Lighter is still classed as a Stage 0 rollup, because its security council can bypass the 21-day upgrade delay. Users can still exit to Ethereum if the system freezes, but the team has a fast path for upgrades that hasn't been tested with an exit window. None of that is a red flag on its own, but it's the kind of detail to track before sizing a position. The chart has turned up. LIT is up 2.01% to 3.3000 on a 24-hour range of 3.1352 to 3.4620. Price is above the MA7 (3.2389), MA14 (3.1878) and EMA7 (3.2456), EMA14 (3.2313) and EMA28 (3.2426), but still under the MA28 (3.2612), which sits just overhead. MACD is positive (0.0162), with the DIF (-0.0101) crossing up through the DEA (-0.0264). Volume (301.94K) is under the MA5 (499.77K) and MA10 (534.81K), so this leg is coming in on light participation. The order book is 80% buy-side. The 3.26 MA28 is the level that matters. A close above it on rising volume would open the way back to the 3.57 high. A fall back below the 3.13 low would undo the November bounce. $LITUSDT #ByXIMPACT
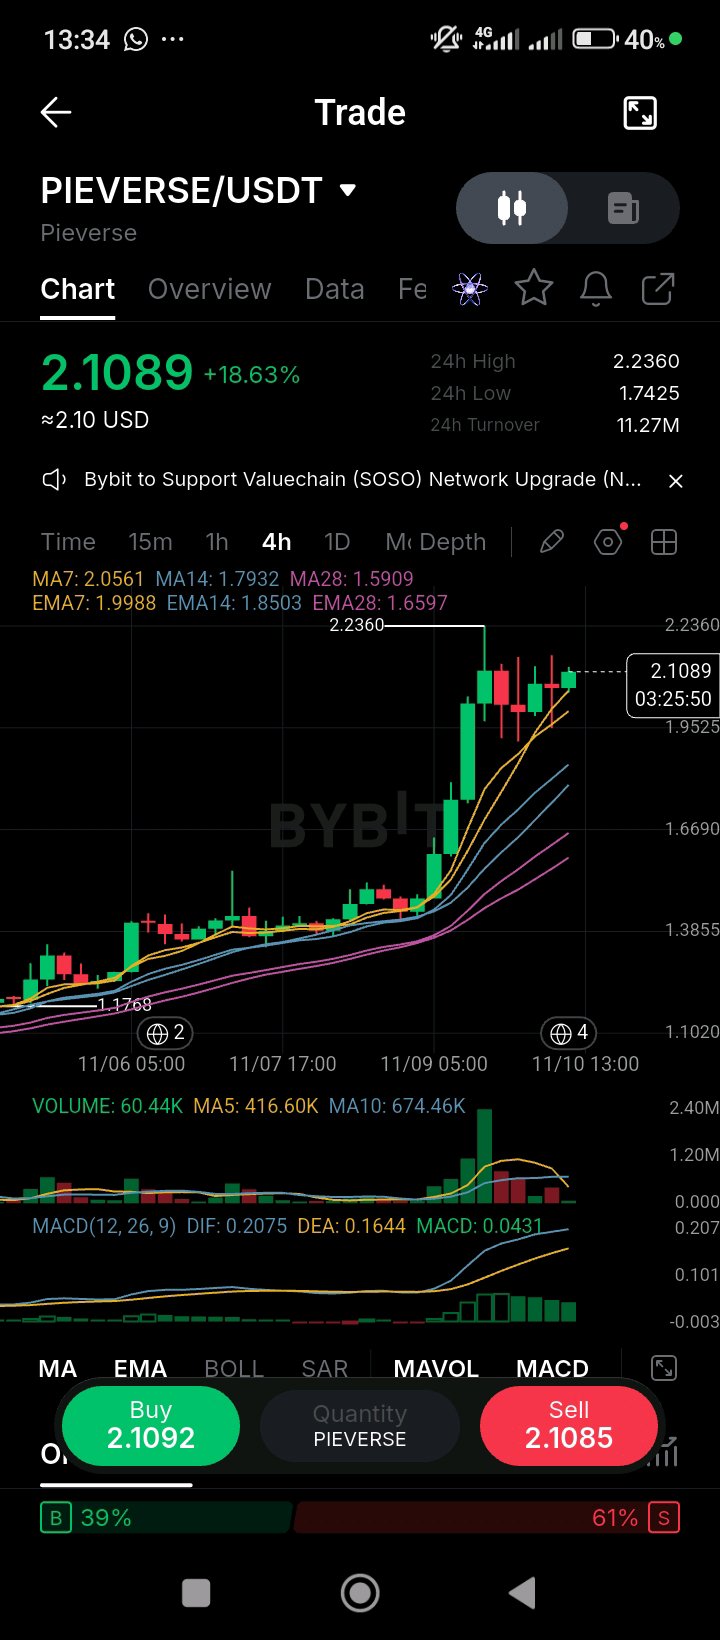
Token Profile: Pieverse ($PIEVERSE) Pieverse ($PIEVERSE) is a decentralized multi-chain ecosystem token powering interactive virtual experiences, digital asset marketplaces, and community-driven Web3 applications. Operating with specialized utility across immersive virtual worlds and tokenized reward protocols, connects creator economies with decentralized liquidity rails. Designed with an ecosystem-focused tokenomics model, the native token underpins platform governance, cross-chain marketplace settlements, staking incentives, and ecosystem growth allocations across participating virtual infrastructure networks. Technical Breakdown: PIEVERSE/USDT — 4-Hour (4H) Bullish Expansion & Moving Average Support On the 4-hour chart, PIEVERSE is trading around **$2.1089** (+18.63%)[span_0](start_span)[span_0](end_span), maintaining strong upside momentum after staging an aggressive parabolic markup leg toward its local high of **$2.2360**[span_1](start_span)[span_1](end_span) from a previous consolidation base around **$1.1768**[span_2](start_span)[span_2](end_span). * **Moving Average Dynamic Support Ribbon:** Price action is well-supported above a strongly bullish, upward-sloping moving average stack[span_3](start_span)[span_3](end_span). Immediate dynamic support is rising sharply at **$2.0561 (MA7)**[span_4](start_span)[span_4](end_span) and **$1.9988 (EMA7)**[span_5](start_span)[span_5](end_span), with broader trend support trailing at **$1.8503 (EMA14)**[span_6](start_span)[span_6](end_span), **$1.7932 (MA14)**[span_7](start_span)[span_7](end_span), **$1.6597 (EMA28)**[span_8](start_span)[span_8](end_span), and **$1.5909 (MA28)**[span_9](start_span)[span_9](end_span). Sustaining a 4-hour close above the $1.99–$2.05 dynamic support zone keeps the active bullish continuation structure fully intact[span_10](start_span)[span_10](end_span). * **Support Base & Resistance Defenses:** Immediate upside resistance is anchored at the recent swing peak of **$2.2360**[span_11](start_span)[span_11](end_span). Structural floor support is firmly established at the multi-day base low of **$1.1768**[span_12](start_span)[span_12](end_span), with intermediate local pullbacks supported around the 24h low of **$1.7425**[span_13](start_span)[span_13](end_span). * **Volume & MACD Profile:** 4-hour turnover registers at **11.27M USDT**[span_14](start_span)[span_14](end_span), backed by strong historical volume spikes during the primary impulse leg (with a 5-period MA volume of 416.60K and 10-period baseline of 674.46K)[span_15](start_span)[span_15](end_span). The 4-hour MACD (DIF: 0.2075, DEA: 0.1644) remains firmly positive above zero[span_16](start_span)[span_16](end_span), accompanied by expanding green histogram bars (MACD: 0.0431)[span_17](start_span)[span_17](end_span), confirming robust buying momentum during this consolidation phase below highs[span_18](start_span)[span_18](end_span). Are you riding the momentum continuation toward a break of the $2.23 high, or waiting to bid a pullback retest near the $2.00 dynamic support ribbon? $PIEVERSEUSDT $TRXUSDT #ByXIMPACT