Asmauhusnah
10619Like4Shares450Fans806Follow
Crypto Learner | Web3 Enthusiast Sharing market insights, ideas & opportunities Building. Learning. Growing. 🚀 Let’s grow together on ByX.
Crypto Learner | Web3 Enthusiast Sharing market insights, ideas & opportunities Building. Learning. Growing. 🚀 Let’s grow together on ByX.
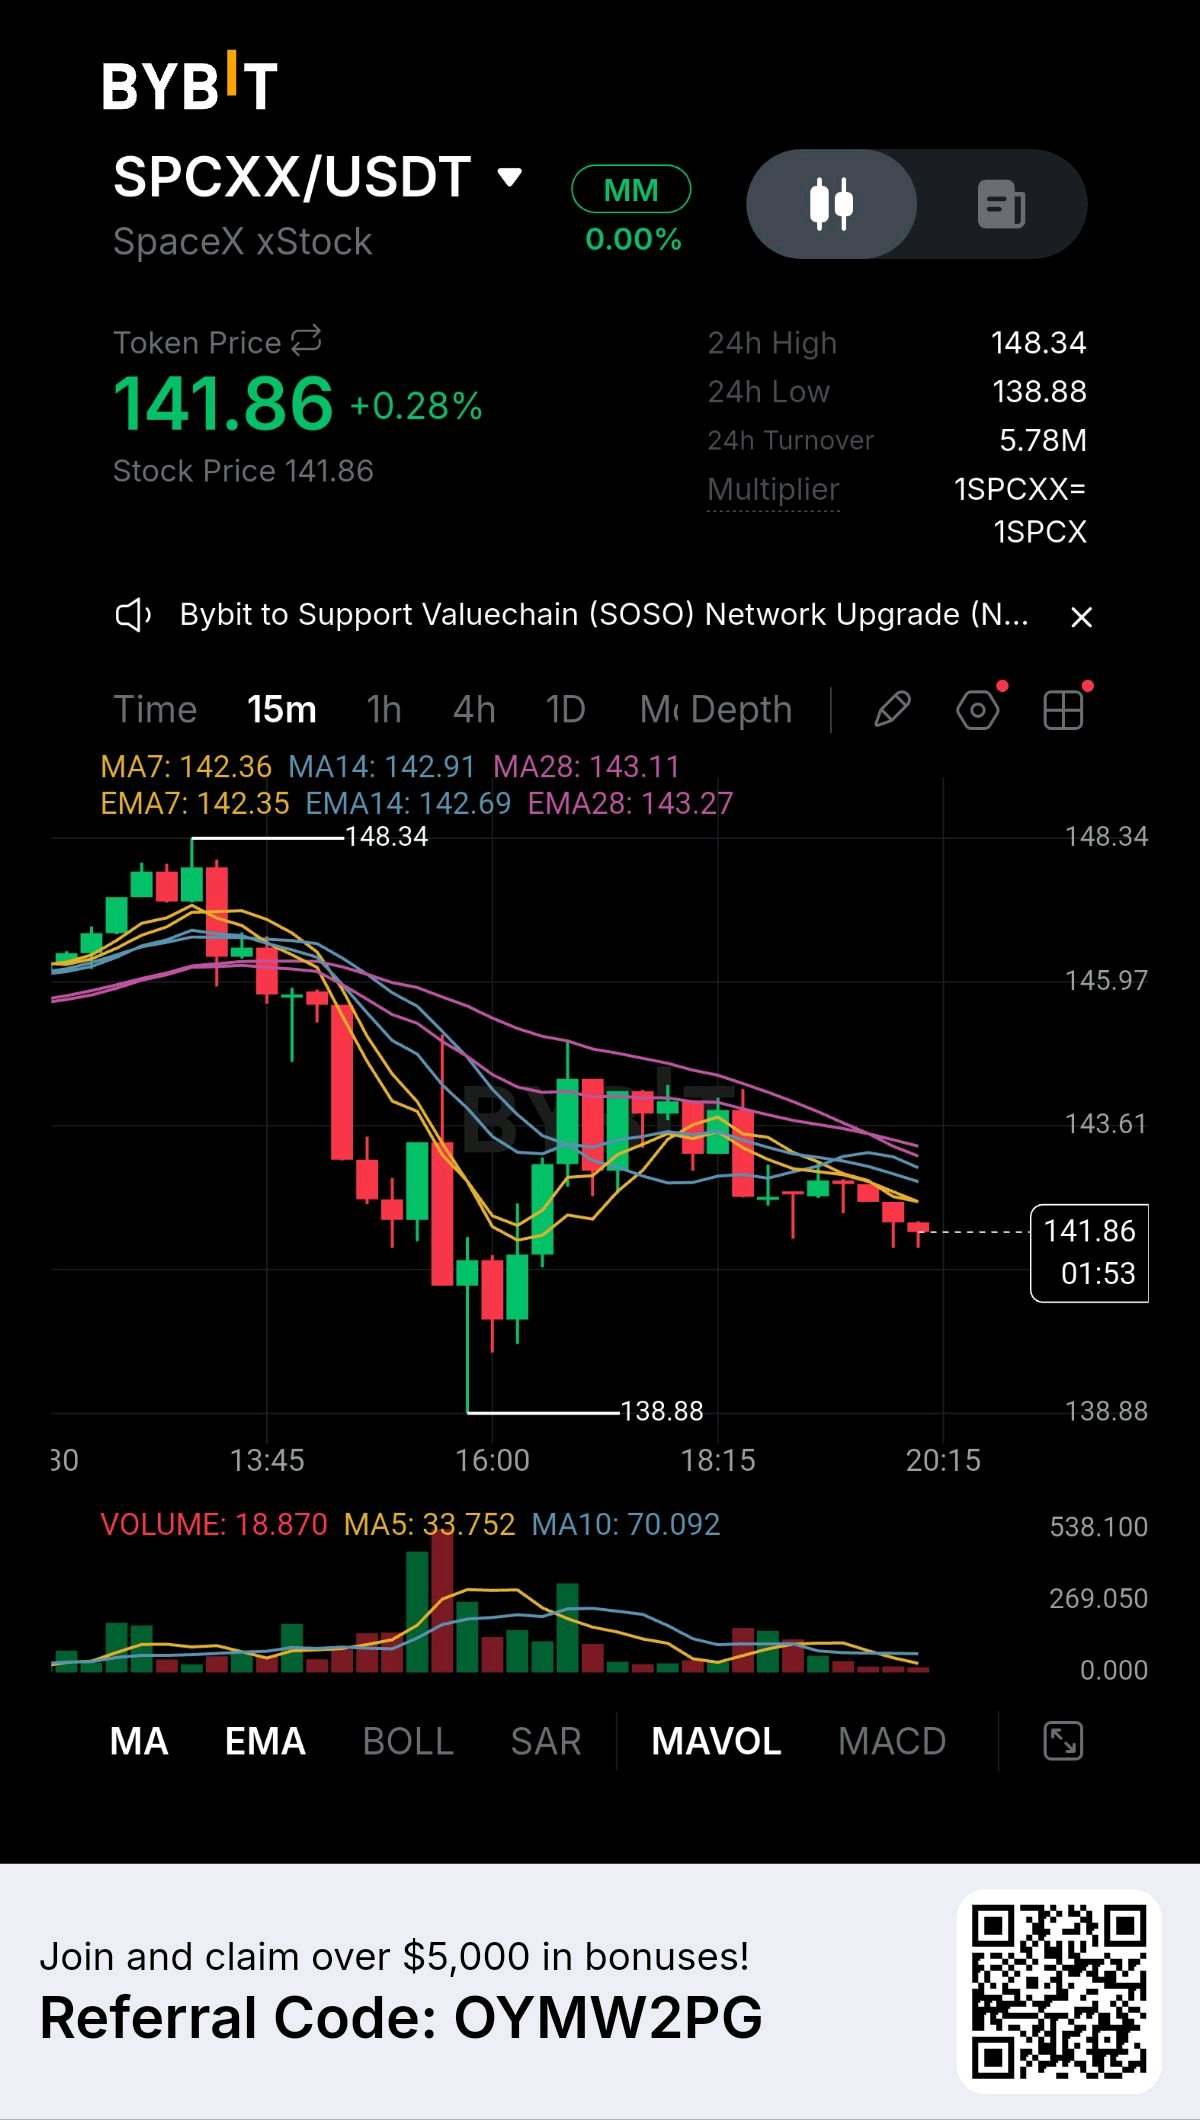
$SPCXXUSDT at a Crossroads: The 143.11 Ceiling vs 138.88 Floor Market Overview · Current Price: 141.86 · 24h Change: +0.28% · 24h Range: 138.88 to 148.34 · 24h Turnover: 5.78M The Situation The 15 minute chart shows SPCXX trapped in a bearish vice. After a sharp drop from 148.34, the price has established a pattern of lower highs, currently hovering at 141.86. The market is compressing, and a volatile move is highly probable in the near term. The Evidence · Moving Averages: The price is buried beneath a falling cluster of resistance. The MA7 sits at 142.36, MA14 at 142.91, and MA28 at 143.11. All are sloping down. · Volume: The volume profile is heavily skewed toward red spikes, confirming sellers are in control. · Candlesticks: Current price action is printing small, indecisive bodies, showing a lack of aggressive buyer interest at these levels. The Execution Plan Do not guess the direction in this chop. The setup demands a WAIT stance until the range resolves. · Long Trigger: A 15 minute candle closing decisively above 143.11. This breaks the bearish structure and targets 145.97. · Short Trigger: A 15 minute candle closing firmly below 141.00. This confirms the downtrend and targets the 138.88 session low. · Invalidation: Longs are dead below 141.00. Shorts are dead above 143.27. The Takeaway When a market compresses beneath a falling wall of moving averages, the path of least resistance is almost always down. The bears hold the tactical advantage until the price proves otherwise. The most profitable action right now is patience. Wait for the market to show its hand. Engagement Question Are you waiting for the price to break through the 143.11 resistance to confirm a reversal, or are you expecting a breakdown below 141.00 to continue the trend?#ByXIMPACT #WSOT2026 #BybitAIEvolving $ICPUSDT
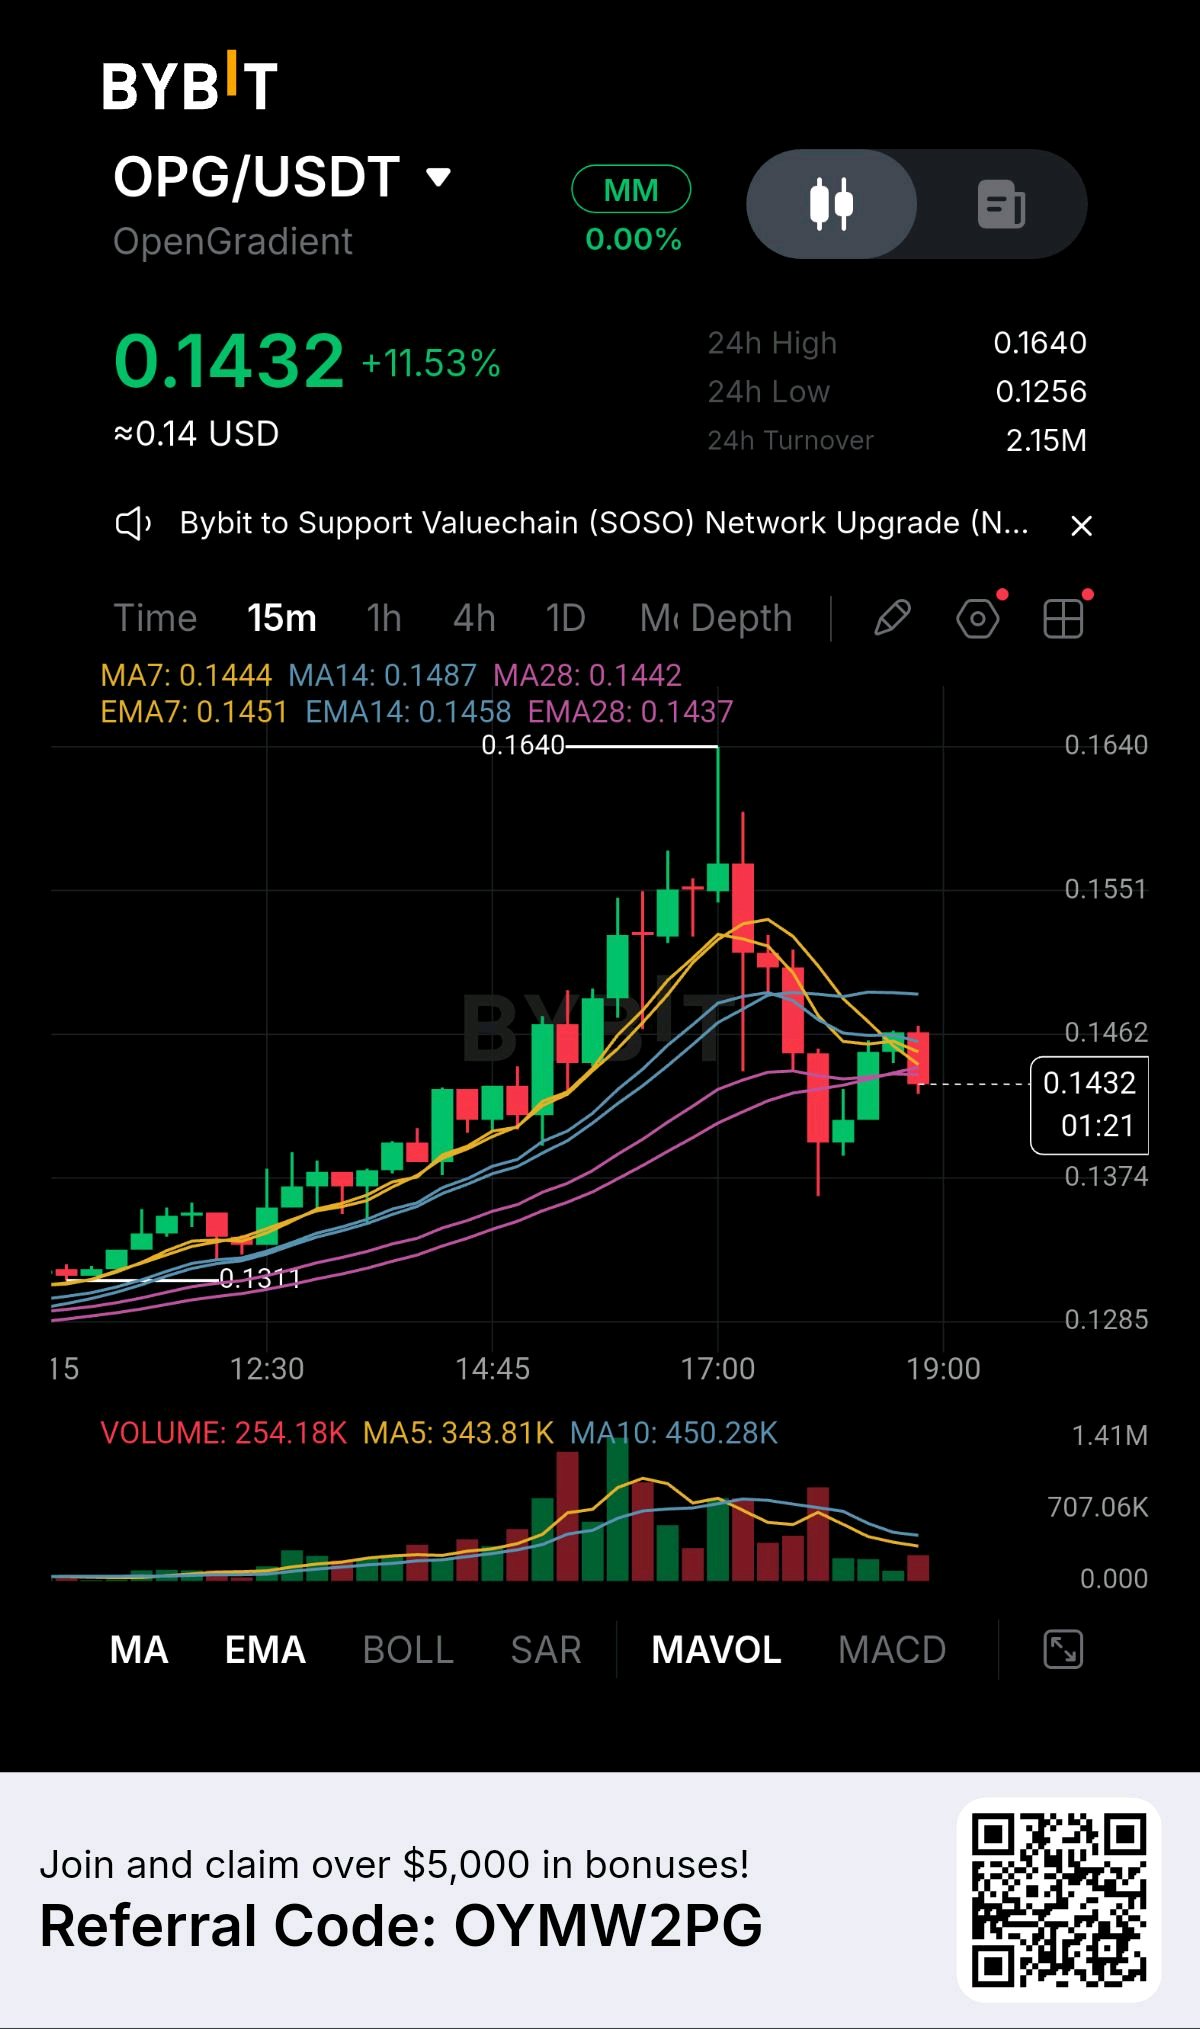
$OPGUSDT is currently in a sharp short term pullback after a massive rally. The market is sitting exactly on the MA28 support level at 0.1437. The immediate direction depends entirely on whether bulls can defend this line or if sellers force a breakdown. Market Context · Current Price: 0.1432 · 24h Change: +11.53% · 24h Range: 0.1256 to 0.1640 · 24h Turnover: 2.15M The Technical Reality The recent price action shows heavy profit taking. The price has broken below the short term MA7 at 0.1444 and MA14 at 0.1487, which signals immediate bearish momentum. However, the price has landed directly on the MA28 at 0.1442 and the EMA28 at 0.1437. These longer term averages are acting as the last line of defense for the uptrend. The red volume spikes confirm that sellers are aggressive. The current candle is attempting to stabilize, but there is no strong confirmation of a bounce yet. What to Watch · Bullish Trigger: A 15 minute candle closing back above the MA7 at 0.1444. This would signal that buyers are stepping in and a relief rally toward 0.1462 is possible. · Bearish Trigger: A 15 minute candle closing firmly below 0.1437. This invalidates the short term uptrend and opens the door for a deeper flush toward 0.1374. · Invalidation: The bullish idea is dead if price breaks 0.1437. The bearish idea is dead if price aggressively reclaims 0.1487. Actionable Strategy Do not force a trade here. The market is at a critical inflection point. Wait for the 15 minute candle to close. If it closes strong and green above 0.1444, look for longs. If it closes red below 0.1437, look for shorts. Final Thought An 11 percent daily run often leads to a sharp correction. The key is watching where the correction stops. The MA28 is the structural backbone of the rally. If buyers hold it, the trend is healthy. If they lose it, the rally was just a liquidity grab. Patience at this level will save your capital. Engagement Question Are you buying this dip at the MA28, or are you waiting for a confirmed breakdown below 0.1437 to look for short entries?#ByXIMPACT $TAIKOUSDT
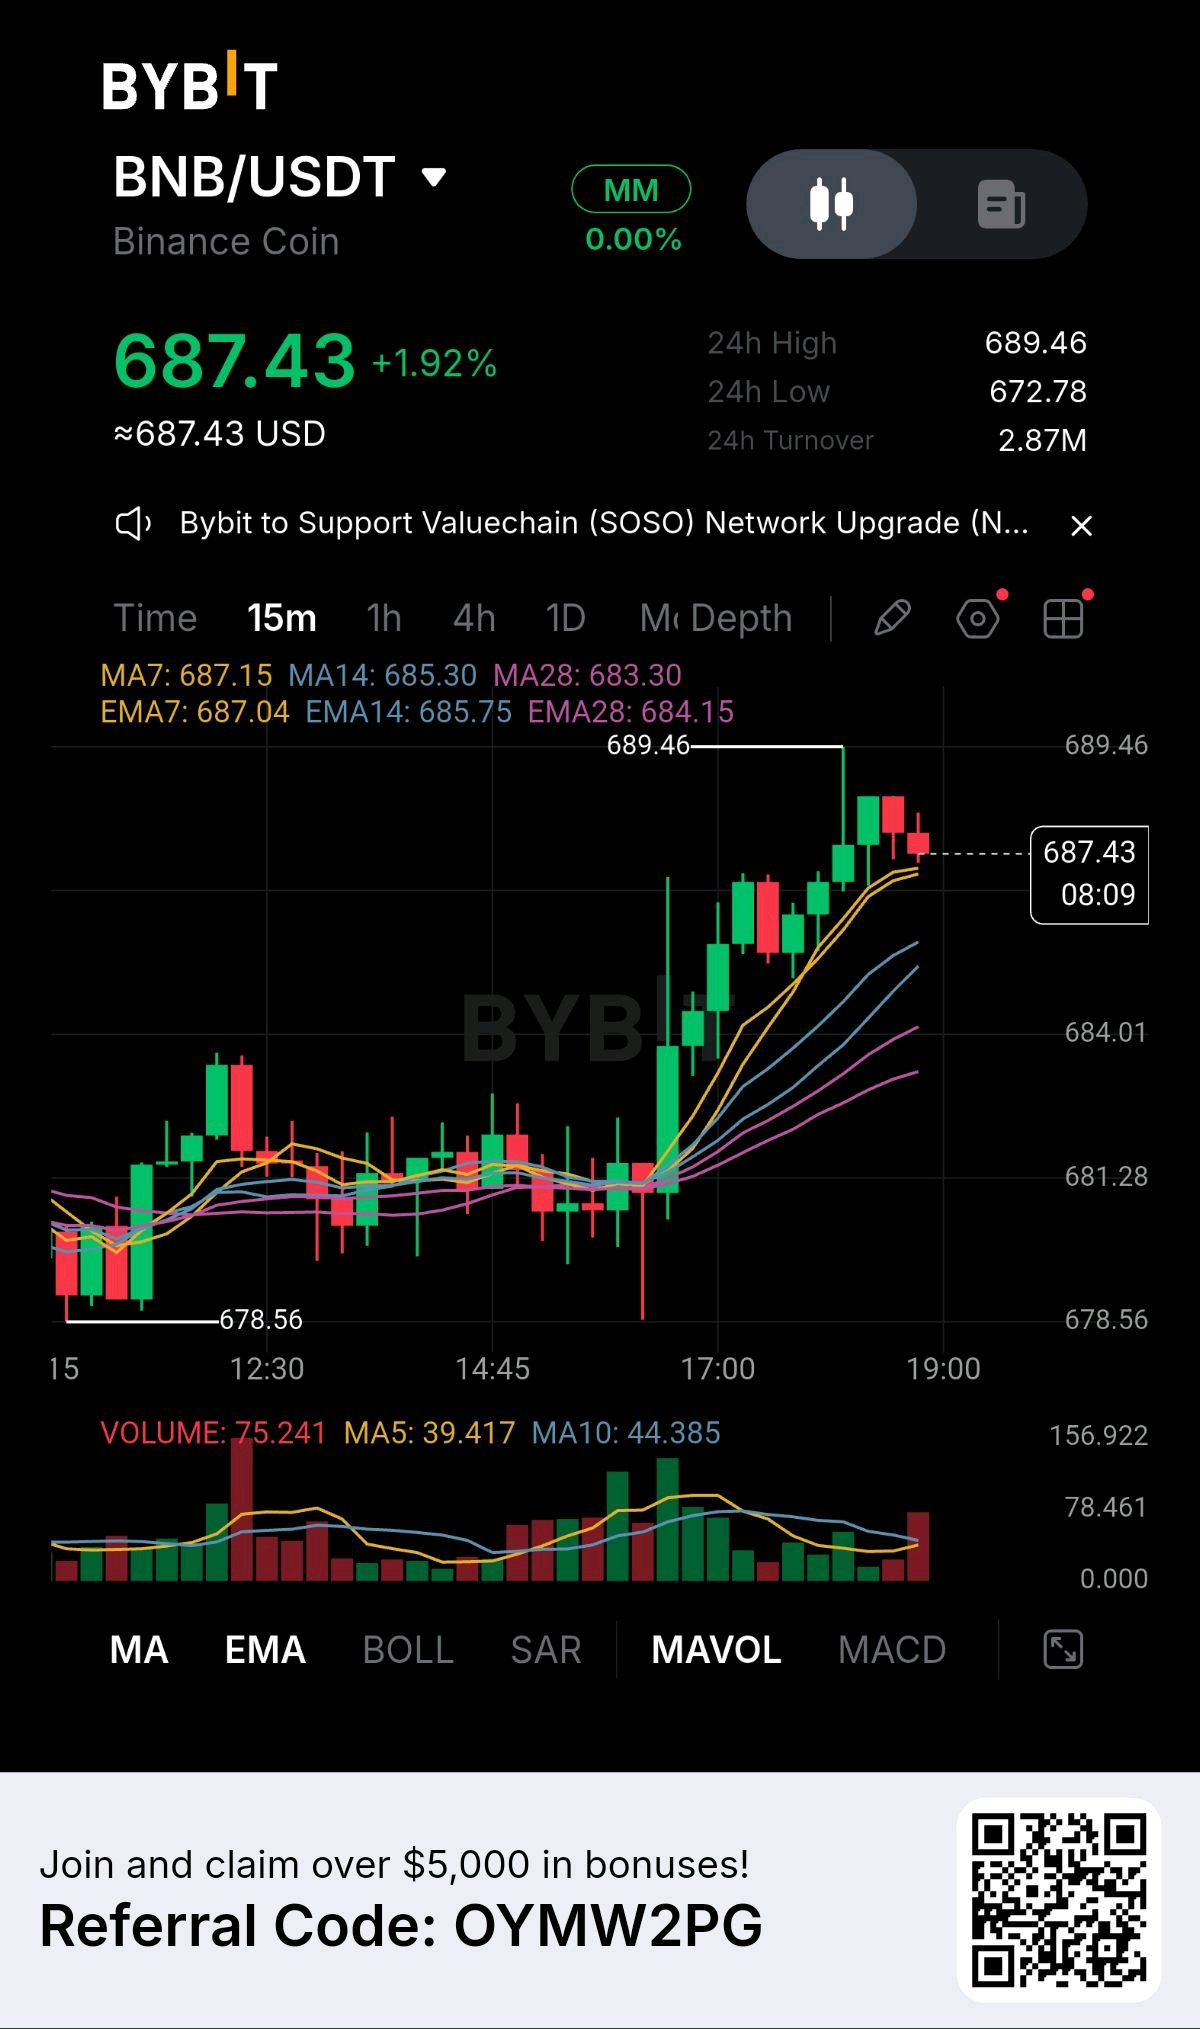
BNB Surges: Bulls Test 689.46 Resistance Ceiling
Market Snapshot · Current Price: 687.43 · 24h Change: +1.92% · 24h Range: 672.78 to 689.46 · 24h Turnover: 2.87M Market Structure The 15 minute chart shows a decisive shift to a bullish structure. After a prolonged period of flat, sideways consolidation near the session low of 678.56, buyers ignited an aggressive breakout. The price has carved a near vertical sequence of higher highs, pushing directly into a new local peak at 689.46. The market is currently pausing just below this high, attempting to establish a new support base. Technical Evidence The technical picture is strongly bullish. The moving averages are fanning out in a perfect bullish alignment. The MA7 at 687.15 and MA14 at 685.30 are well above the MA28 at 683.30, and all are sloping steeply upward. The price is trading comfortably above this cluster. The volume profile confirms the move with a massive green spike during the initial breakout. The current candles are small red bodies, indicating a healthy pause and minor profit taking at the highs rather than a reversal. Key Levels · Immediate Resistance: 689.46. The local high. A clean 15 minute close above this level confirms a continuation of the breakout. · Immediate Support: 685.30. The MA14 line and the first dynamic support level. · Structural Support: 683.30. The MA28 line and the ultimate floor for the current bullish trend. Bullish Scenario If BNB breaks and closes above 689.46, the momentum continues. Bulls will look to push toward the 690.00 psychological level, using the MA7 as a tight trailing stop. Bearish Scenario If the price rejects this high and forms a bearish reversal candle, the first sign of weakness would be a break below 687.15. A close below this level would signal a deeper retracement toward the MA14 at 685.30. Risk and Invalidation The setup is currently a WAIT for a new entry. The trend is strongly bullish, but buying directly at resistance after an extended move is risky. The bearish thesis is invalidated if price aggressively breaks above 689.46. The bullish thesis is invalidated if the price closes firmly below 683.30. Trader Insight When a market breaks out of a long consolidation phase with strong volume and stacked moving averages, it is a sign of genuine trend initiation. However, the safest entry is rarely at the very top of the impulse. Look for a controlled pullback to the MA7 or MA14 that shows immediate buying support, or wait for a confirmed 15 minute close above the local high. Do not chase the green candles. Engagement Question Given this strong bullish structure, are you chasing the breakout above 689.46, or are you waiting for a pullback to the MA14 at 685.30 to enter a long?#ByXIMPACT #WSOT2026 #USInflationRunsHotAndRateHikeBetsRise $BNBUSDT $BNBUSDC
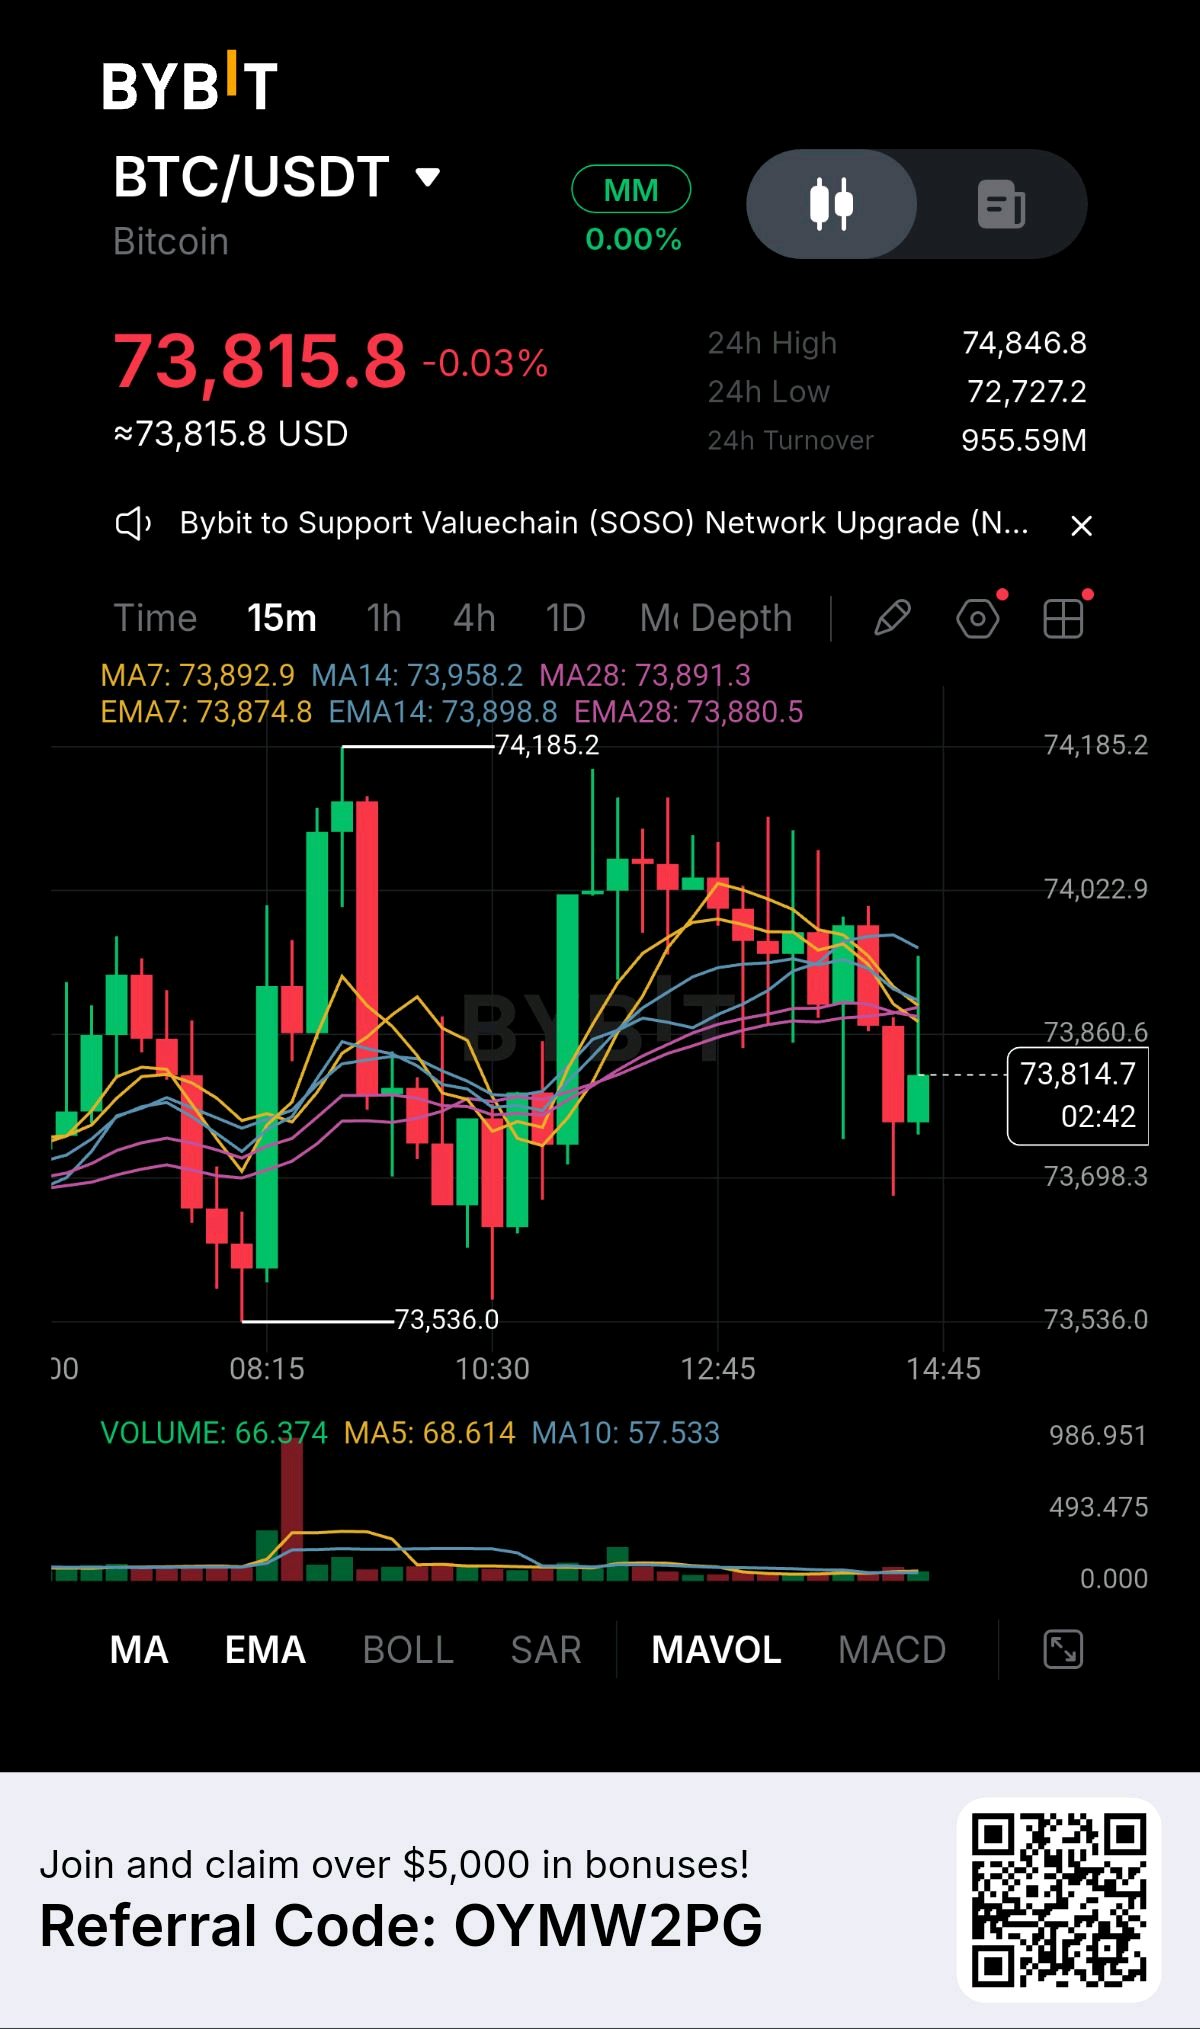
BTC Tests MA Support: Bulls Defend 73.8K Floor
Market Snapshot · Current Price: 73,815.8 · 24h Change: -0.03% · 24h Range: 72,727.2 to 74,846.8 · 24h Turnover: 955.59M Market Structure The 15 minute chart shows a choppy, volatile session with no clear sustained trend. After a sharp drop to 73,536.0, the market staged a strong recovery to a local high of 74,185.2. Since that peak, sellers have regained control, carving out a series of lower highs and pushing the price back down toward the 73,815.8 level. Technical Evidence The technical picture is at a critical inflection point. The price is trapped inside a dense cluster of moving averages. The MA7, MA14, and MA28 are all converging around the 73,892 level, with the EMA lines providing similar compression. The price is currently trading just below this cluster, which is a bearish signal. Volume has dried up significantly during the recent pullback, suggesting a lack of aggressive buying interest, while the current candles are red bodies pressing into support. Key Levels · Immediate Resistance: 73,898.8. The EMA14 line and the top of the moving average cluster. Bulls must reclaim this to halt the bleed. · Immediate Support: 73,698.3. The lower boundary of the recent consolidation zone. · Structural Support: 73,536.0. The session low and the critical line in the sand. Bullish Scenario For a relief rally, bulls must defend the 73,698.3 level and print a strong 15 minute candle closing back above the MA cluster at 73,898.8. This would signal that the selling pressure is exhausted and set up a retest of the 74,185.2 local high. Bearish Scenario If the current support fails and a 15 minute candle closes firmly below 73,536.0, the downtrend continues. The market would likely look for a deeper flush into lower price discovery. Risk and Invalidation The setup is currently a WAIT for a long entry. The market is in a short term downtrend and actively testing dynamic support. Catching a falling knife here is risky. The bearish thesis is invalidated if price aggressively reclaims 73,898.8. The bullish thesis is completely invalidated by a clean close below 73,536.0. Trader Insight When the price is trapped in a tight moving average cluster after a volatile swing, the market is in a state of equilibrium. The safest approach is to wait for a decisive close outside of this zone. A strong candle body closing above the cluster is your long signal. A clean break below the session low is your short signal. Do not force a trade in the middle of the chop. Engagement Question Given this tight moving average convergence, are you waiting for a confirmed reclaim of the MA cluster at 73,898 to go long, or is a breakdown below 73,536 your signal to look for shorts?#ByXIMPACT #WSOT2026 #BitcoinHitsTwoMonthLowAfterUSMidterms $BTCUSDT
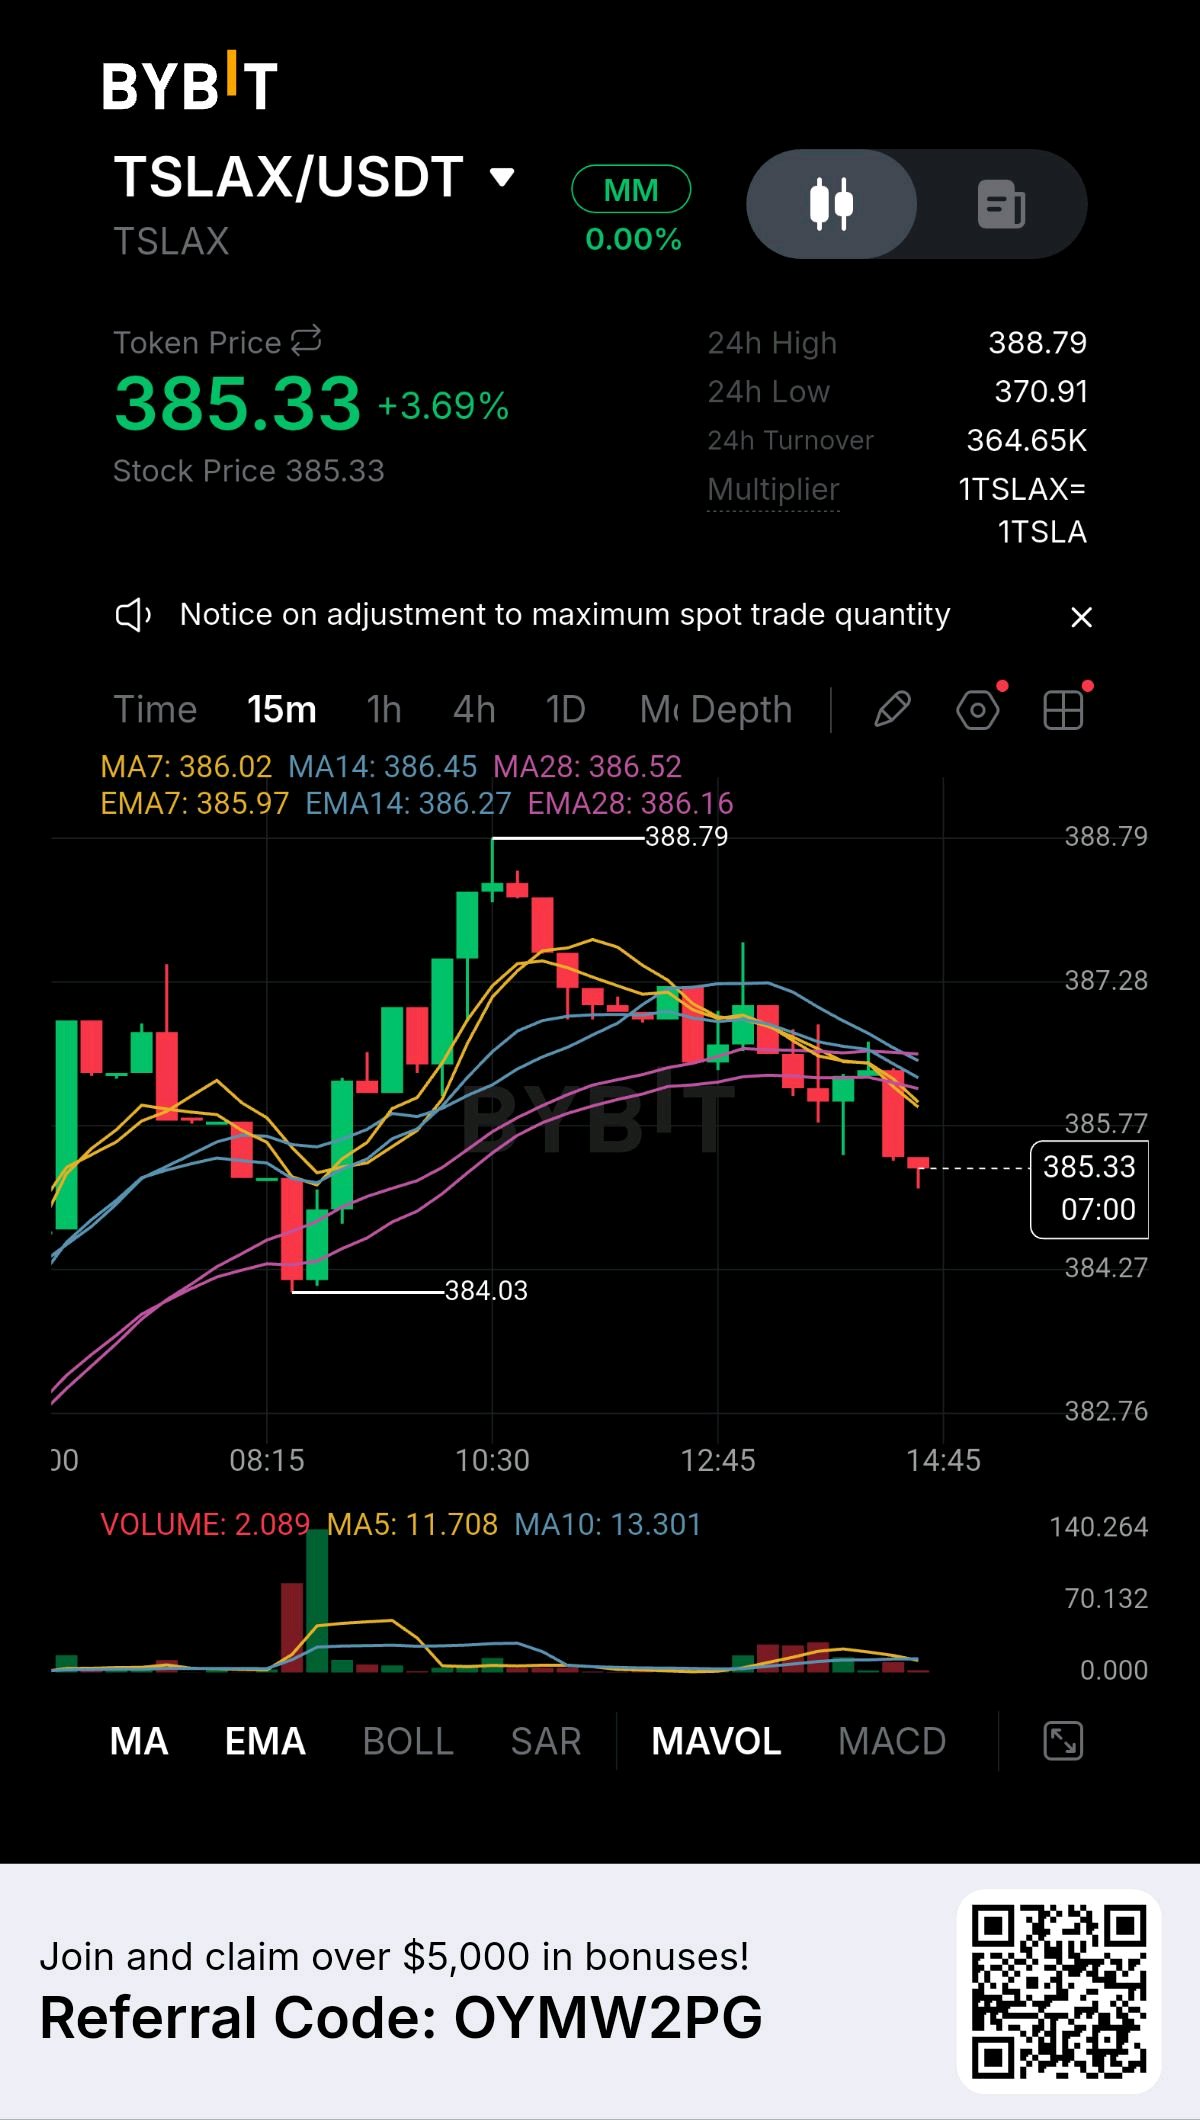
TSLAX Retreats: Bears Target 384.03 Support Floor
Market Snapshot · Current Price: 385.33 · 24h Change: +3.69% · 24h Range: 370.91 to 388.79 · 24h Turnover: 364.65K Market Structure The 15 minute chart reveals a sharp bullish impulse that has transitioned into a heavy retracement. After a strong rally from the session low of 384.03 to a local peak of 388.79, buyers lost momentum. The market has since carved a clear sequence of lower highs and lower lows, with sellers currently pressing the price down toward the 385.33 level. Technical Evidence The technical picture highlights a clear loss of bullish control. The price has broken below a dense cluster of moving averages. The MA7, MA14, and MA28 are all converging tightly around the 386.45 to 386.52 zone, with the EMA lines providing similar resistance overhead. The price is trading beneath all of them, which is a bearish signal. Volume has dried up significantly during the pullback, suggesting a lack of buyer interest at these levels, while the current candles are red bodies pushing toward the lows. Key Levels · Immediate Resistance: 386.02. The MA7 line and the bottom of the moving average cluster. Bulls must reclaim this to halt the bleed. · Immediate Support: 384.03. The session low and the critical line in the sand. · Macro Resistance: 386.52. The MA28 and the ultimate ceiling for the current bearish structure. Bullish Scenario For a relief rally, bulls must defend the 384.03 level and print a strong 15 minute candle closing back above the MA cluster at 386.52. This would signal that the selling pressure is exhausted and set up a retest of the 387.28 region. Bearish Scenario If the current support fails and a 15 minute candle closes firmly below 384.03, the downtrend continues. The market would likely look for a deeper flush into lower price discovery. Risk and Invalidation The setup is currently a WAIT for a long entry. The market is in a short term downtrend with moving averages stacked against it. Catching a falling knife here is risky. The bearish thesis is invalidated if price aggressively reclaims 386.52. The bullish thesis is completely invalidated by a clean close below 384.03. Trader Insight When a market rallies hard and then pulls back below a cluster of moving averages, it is a sign that the immediate buying pressure has been exhausted and sellers are stepping in. The key is to watch the support level. If the price can hold above 384.03 and form a base, a bounce is possible. If it slices through with a large red candle, the market is likely heading lower. Engagement Question Given this pullback, are you waiting for a confirmed reclaim of the MA cluster at 386.52 to look for longs, or is a breakdown below 384.03 your signal to short the next leg down?#ByXIMPACT #WSOT2026 #USInflationRunsHotAndRateHikeBetsRise $TSLAXUSDT
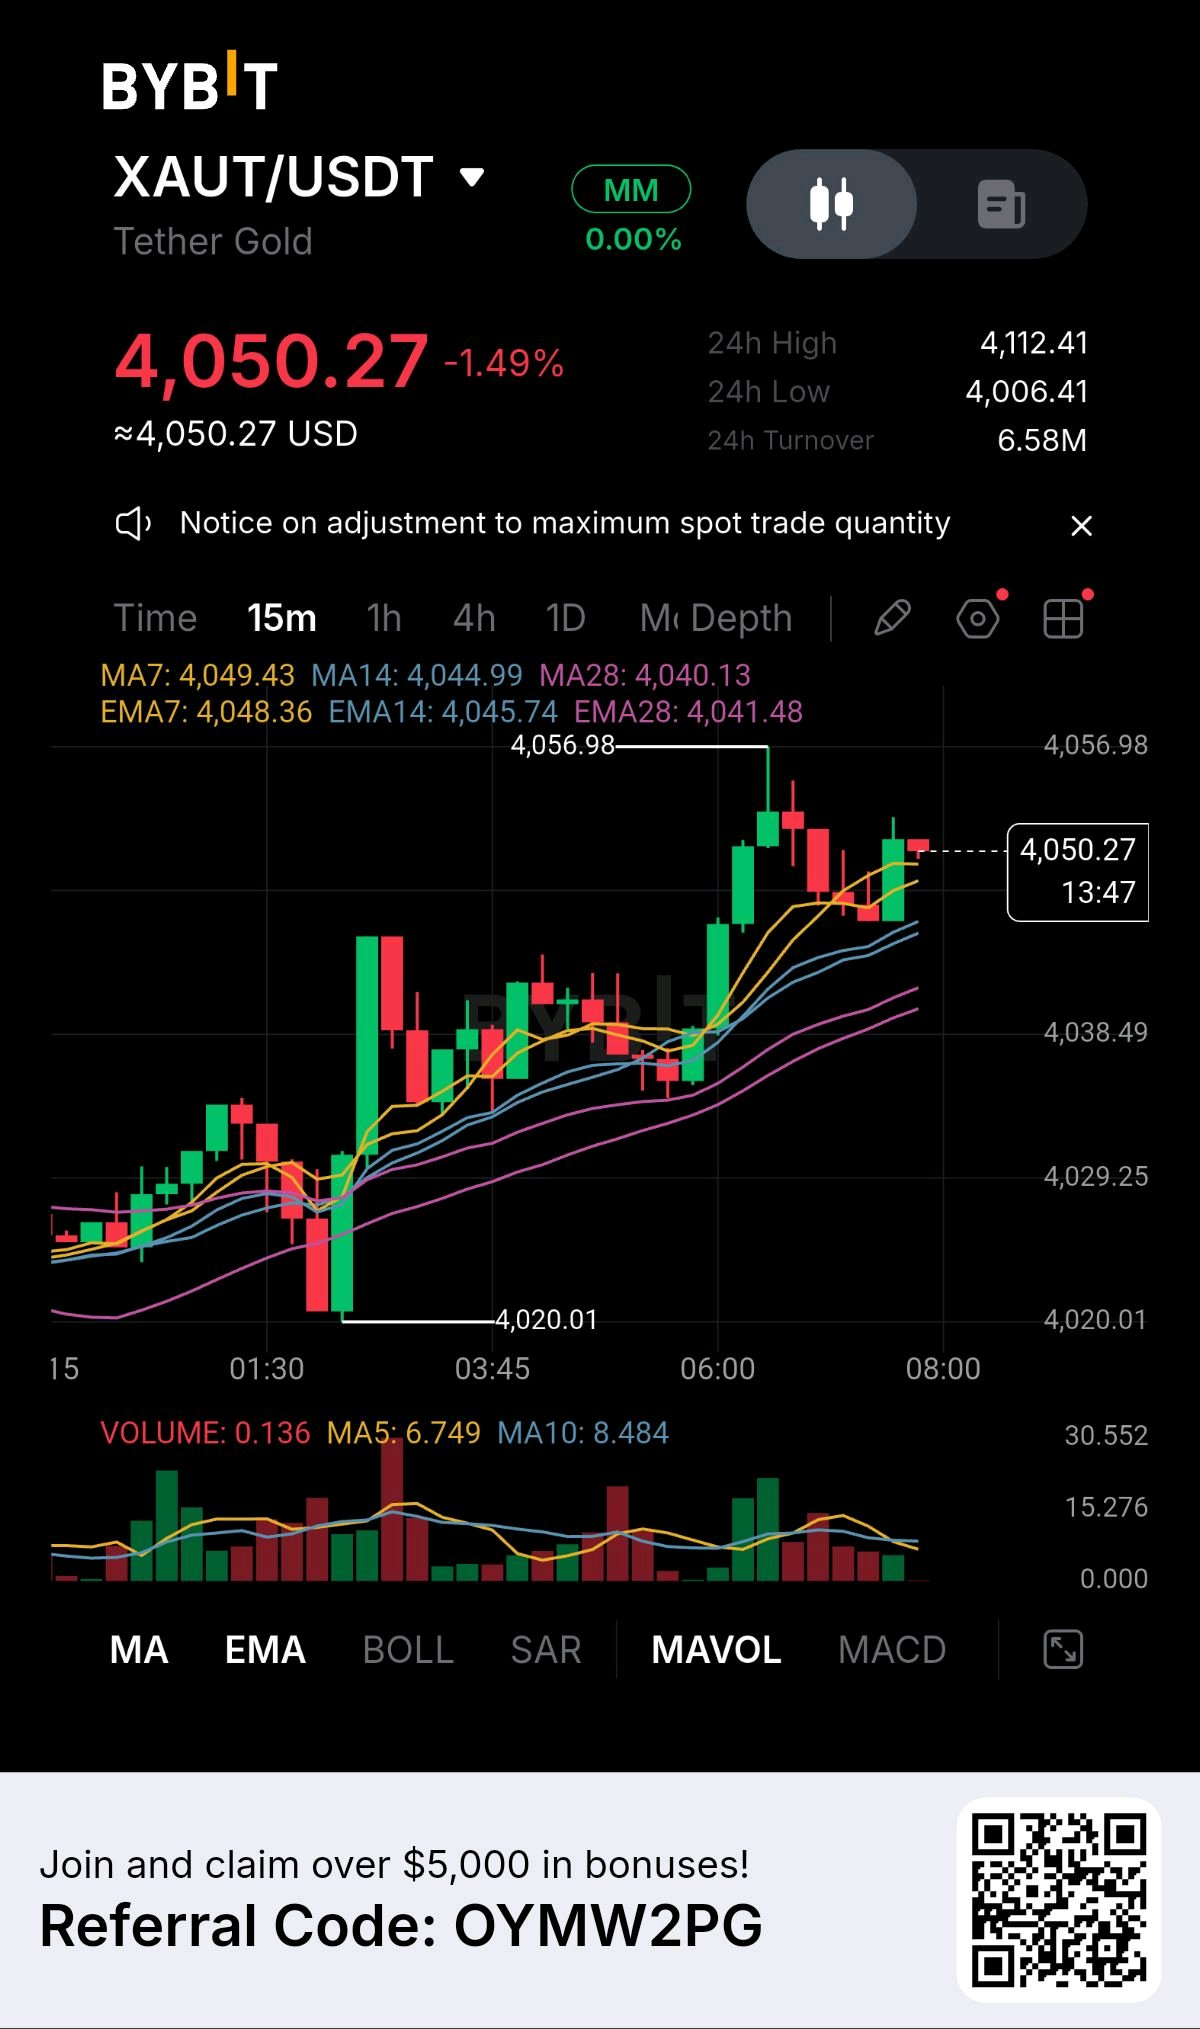
XAUT Holds Its Ground: Is Another Gold Move Loading? Gold is showing an interesting short term recovery structure despite remaining under pressure on the 24 hour chart. $XAUTUSDT is trading at $4,050.27, down 1.49% over the last 24 hours. However, the 15 minute chart reveals that buyers are still defending the recent recovery. What the chart is revealing • Price: $4,050.27 • 24H High: $4,112.41 • 24H Low: $4,006.41 • Turnover: $6.58M The technical picture The short term moving averages are aligned positively: • MA7: $4,049.43 • MA14: $4,044.99 • MA28: $4,040.13 The EMA structure tells a similar story, with price trading slightly above the major short term averages. This suggests that buyers still have some control over the immediate market structure, although momentum needs stronger confirmation. The levels that matter Resistance: $4,056.98 Support: $4,044 to $4,040 Further downside support: $4,038.49 and $4,029.25 Two possible developments A convincing breakout above $4,056.98 could strengthen bullish momentum and open the way for another upward test. However, losing the $4,040 support zone could weaken the recovery and expose lower support levels. My market perspective The important question is no longer just whether XAUT can recover. It is whether buyers can sustain the pressure long enough to turn this recovery into a stronger upward move. A breakout needs confirmation, not anticipation. What do you think comes next? Will gold break above $4,057 or return to test lower support?#ByXIMPACT #WSOT2026 #WSOTPicktoEarn10U

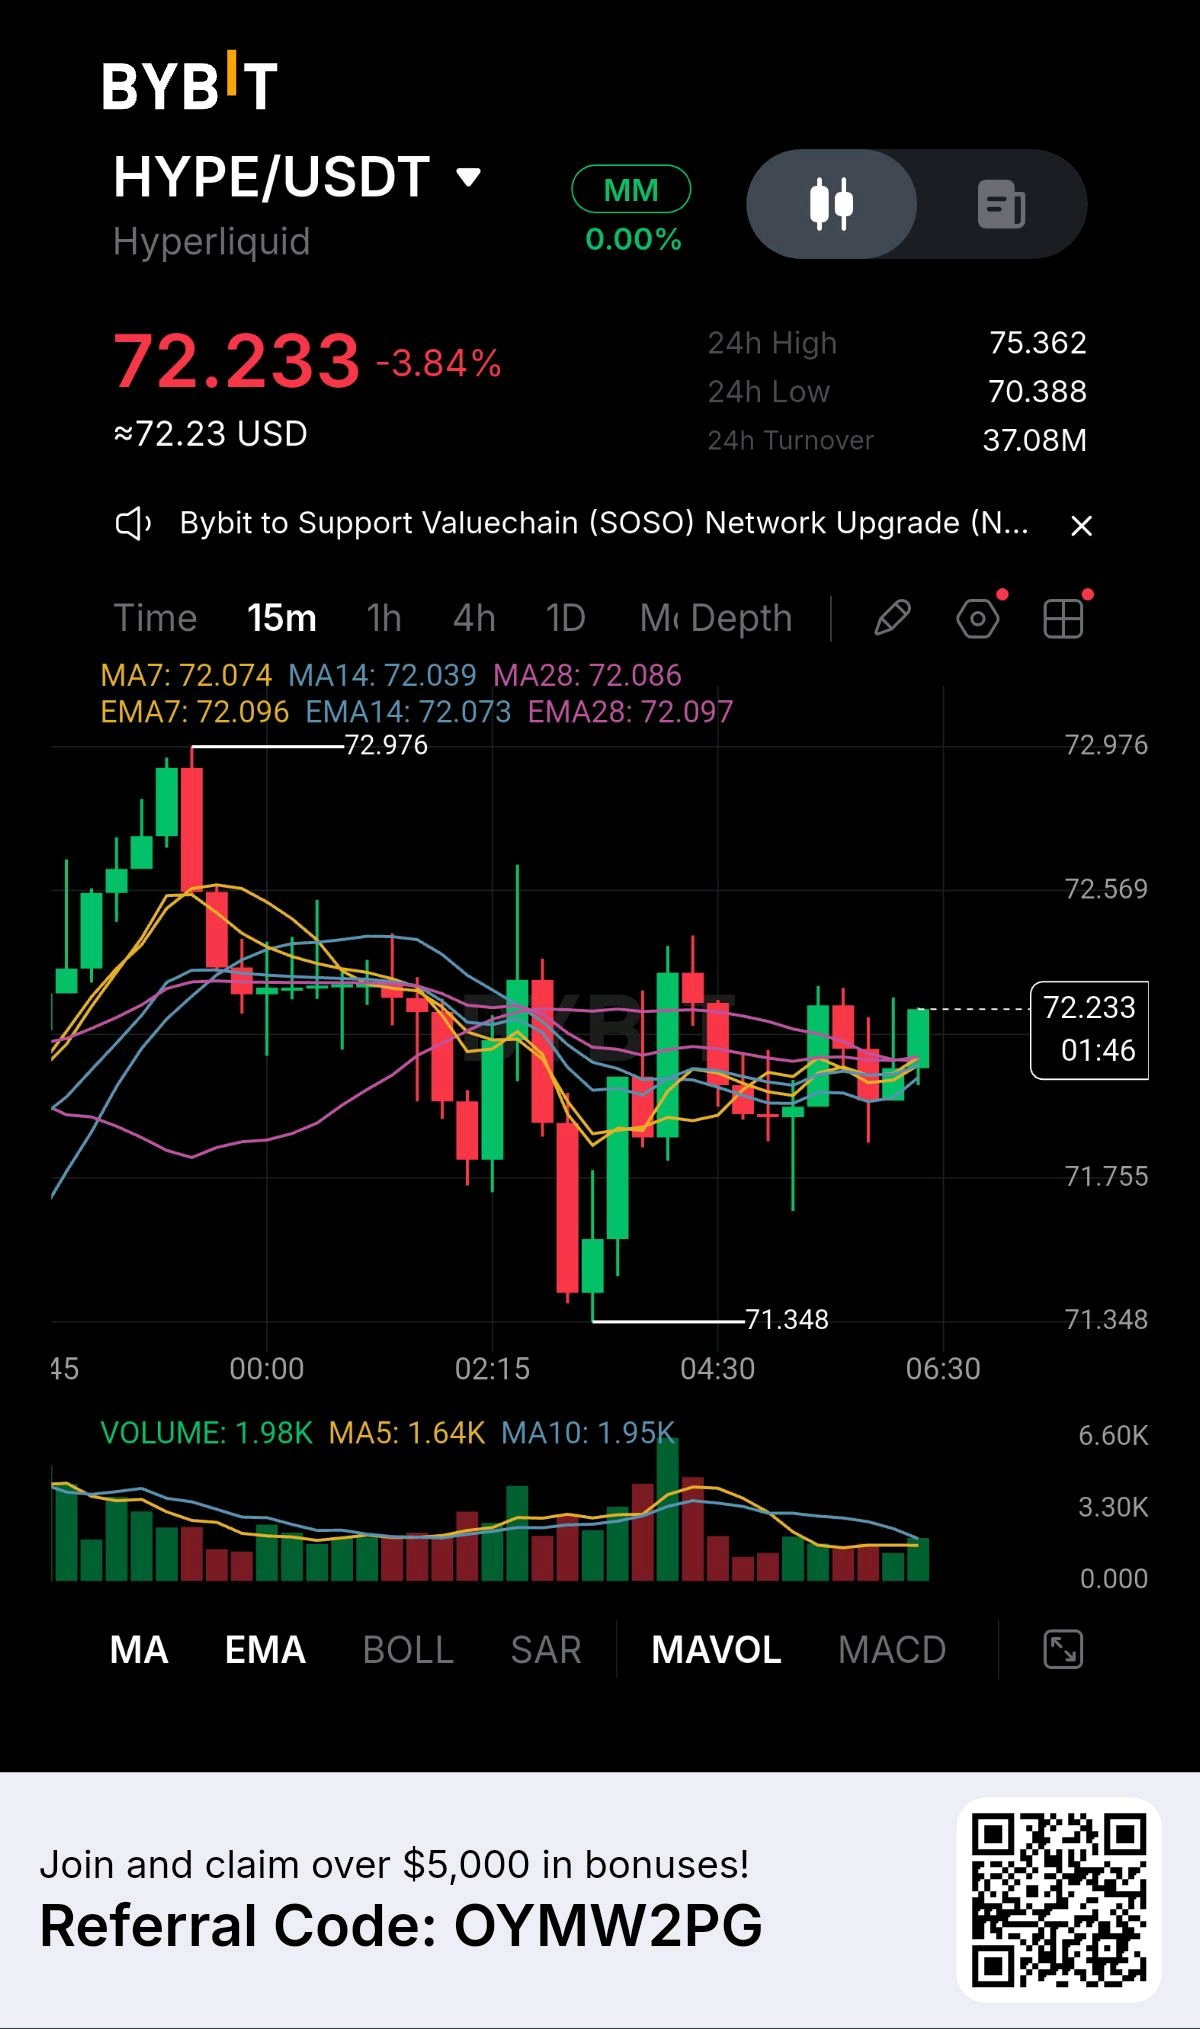
HYPE Compresses at Support: MA Cluster in Focus
Market Snapshot · Current Price: 72.233 · 24h Change: -3.84% · 24h Range: 70.388 to 75.362 · 24h Turnover: 37.08M Market Structure The 15 minute chart shows a volatile session defined by a sharp sell off followed by a tight consolidation. After a local peak at 72.976, sellers drove the price down to a session floor at 71.348. Since that low, the market has carved out a choppy, sideways range. The price is currently flatlining, showing a lack of clear directional momentum from either buyers or sellers. Technical Evidence The technical picture highlights extreme indecision. The price is trapped directly inside a dense cluster of moving averages. The MA7, MA14, and MA28 are all converging tightly around the 72.08 level, alongside their EMA counterparts. This compression indicates that the short term momentum has completely neutralized. The volume profile has also dried up significantly during this chop, suggesting the market is waiting for a fresh catalyst to dictate the next move. Key Levels · Immediate Resistance: 72.569. A clean 15 minute close above this level is needed to confirm a bullish breakout. · Immediate Support: 71.755. The lower boundary of the current chop zone. · Structural Support: 71.348. The session low and the critical line in the sand. Bullish Scenario If HYPE breaks out of this MA cluster and prints a strong 15 minute candle closing above 72.569, the consolidation is resolving to the upside. Bulls would then target a retest of the 72.976 local high. Bearish Scenario If the price is rejected by the MA cluster and a 15 minute candle closes firmly below 71.755, the recent recovery has failed. The market would likely revisit the 71.348 structural low. Risk and Invalidation The setup is currently a WAIT. The market is in a tight, low volume consolidation right at the moving averages. Trading in the middle of this chop is a low probability setup. The bearish thesis is invalidated if price aggressively reclaims 72.569. The bullish thesis is completely invalidated by a clean close below 71.348. Trader Insight When moving averages converge tightly and volume dries up, the market is coiling and building energy. It is a state of equilibrium. The first decisive close outside of this cluster with a strong candle body will dictate the short term trend. Patience is key here. Do not front run the breakout. Wait for the market to show its hand. Engagement Question Given this tight moving average convergence, are you waiting for a confirmed breakout above 72.569 to go long, or is a breakdown below 71.755 your signal to look for shorts?#ByXIMPACT #WSOT2026 #WSOTPicktoEarn10U $HYPEUSDT

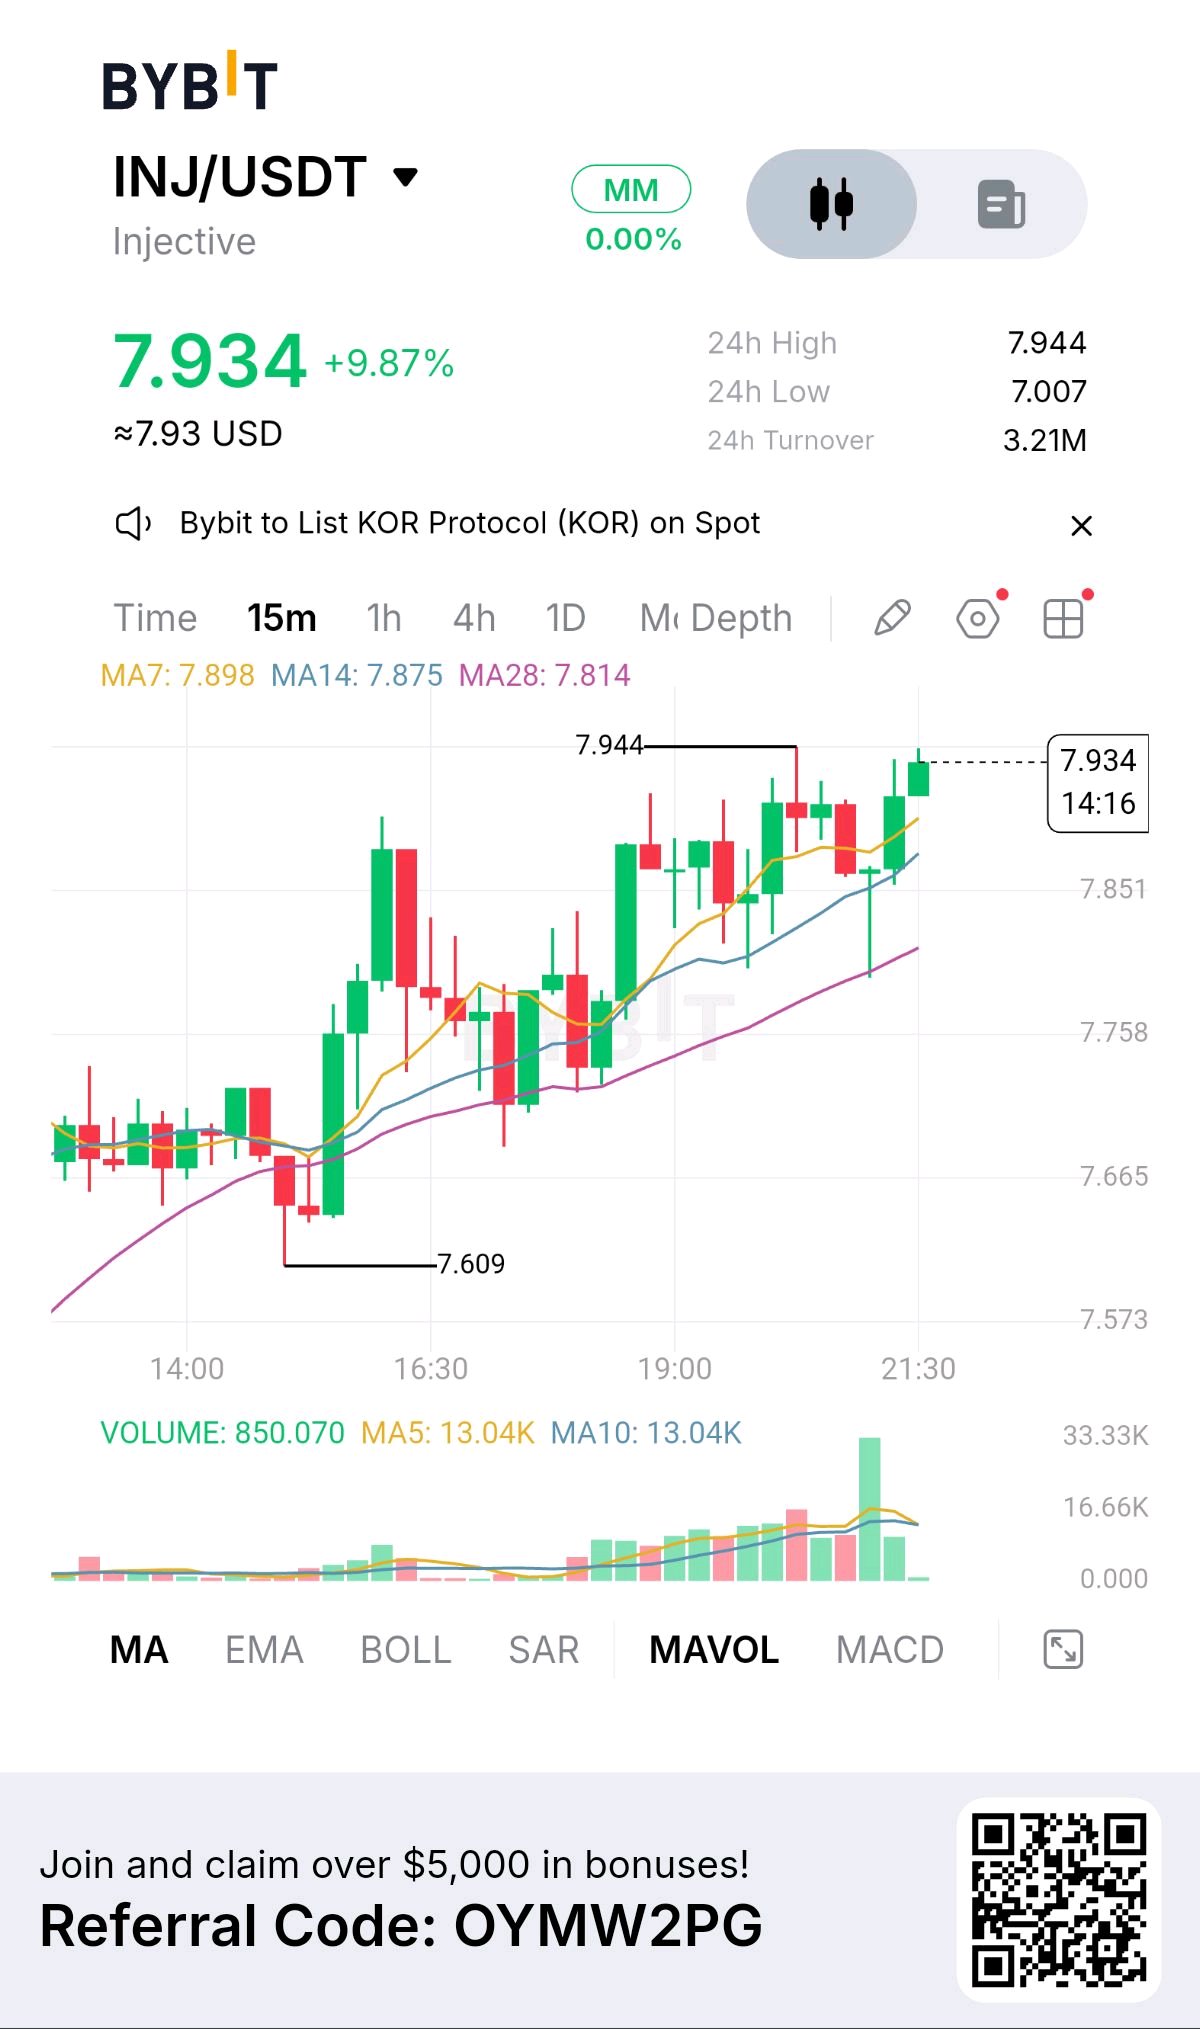
$INJUSDT has climbed 9.87% in 24 hours and is now trading at 7.934, just below its 7.944 local high. The rally has been impressive, but the next move could be more important than the entire advance that brought price here. The 15-minute structure remains constructive. Higher highs and higher lows, supported by an upward-moving average alignment, show that buyers have maintained control. MA7: 7.898 MA14: 7.875 MA28: 7.814 Price is above all three averages, with the short-term structure still favoring buyers. However, 7.944 is the immediate barrier. A confirmed 15-minute close above it would strengthen the breakout case and bring the psychological 8.00 level into focus. There is also a risk worth respecting. After such a strong advance, rejection at the local high could trigger profit-taking. A move below 7.898 would be an early sign of weakening momentum, while 7.814 is the more important support reference. The temptation is to chase a rally that looks unstoppable. But strong momentum does not remove the need for confirmation. The market still has to prove that 7.944 can become support rather than another rejection point. INJ is close to 8.00, but will buyers break the ceiling or pause to build a stronger base first?#ByXIMPACT #BitcoinSlidesBelow$80K
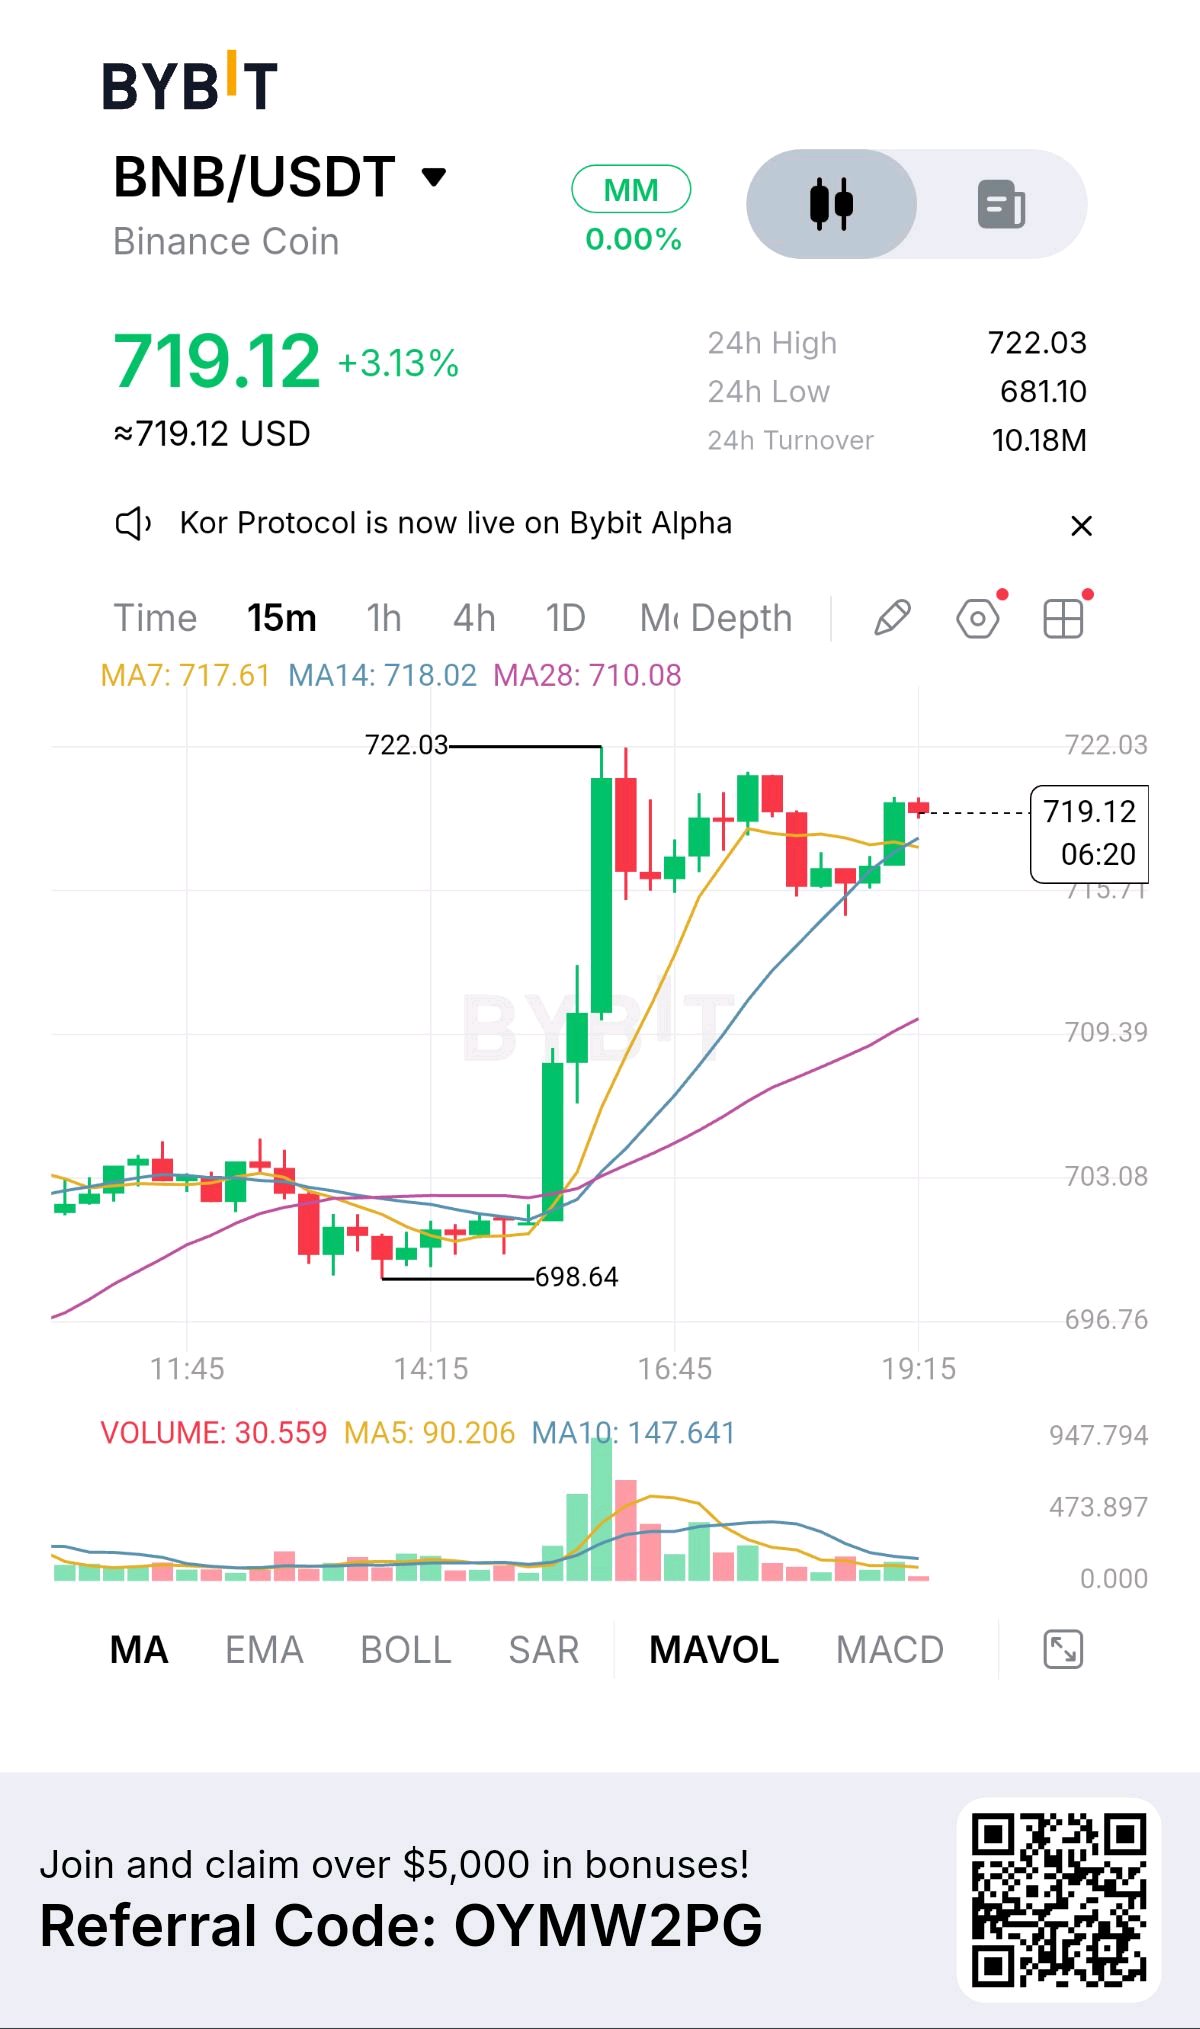
$BNBUSDT is up 3.13% in 24 hours, trading at 719.12 after climbing from 698.64 to a local high of 722.03. What makes this move interesting is not just the rally, but how price is behaving after reaching that high. Instead of giving back most of its gains, BNB is consolidating around the 717–719 area. The moving averages support the bullish picture: MA7 at 717.61, MA14 at 718.02 and MA28 at 710.08. Price remains above all three, while the averages are aligned upward. This suggests buyers still have the advantage, although the short-term MA7 and MA14 are close together and should be watched carefully. The market now faces a clear test. A strong 15-minute close above 722.03 would provide evidence of renewed upside momentum. Until then, resistance remains unbroken. If price loses 717.61, the consolidation could turn into a deeper pullback, with 710.08 becoming an important support reference. The declining volume during consolidation may indicate that trading activity is cooling after the rally. It does not, by itself, guarantee another breakout. The key question is whether BNB is building enough strength to challenge 722.03 again, or whether buyers will need a deeper pullback before the next move. Would you rather wait for a confirmed breakout above 722.03 or watch for a pullback that holds the moving-average support?#ByXIMPACT #BitcoinSlidesBelow$80K
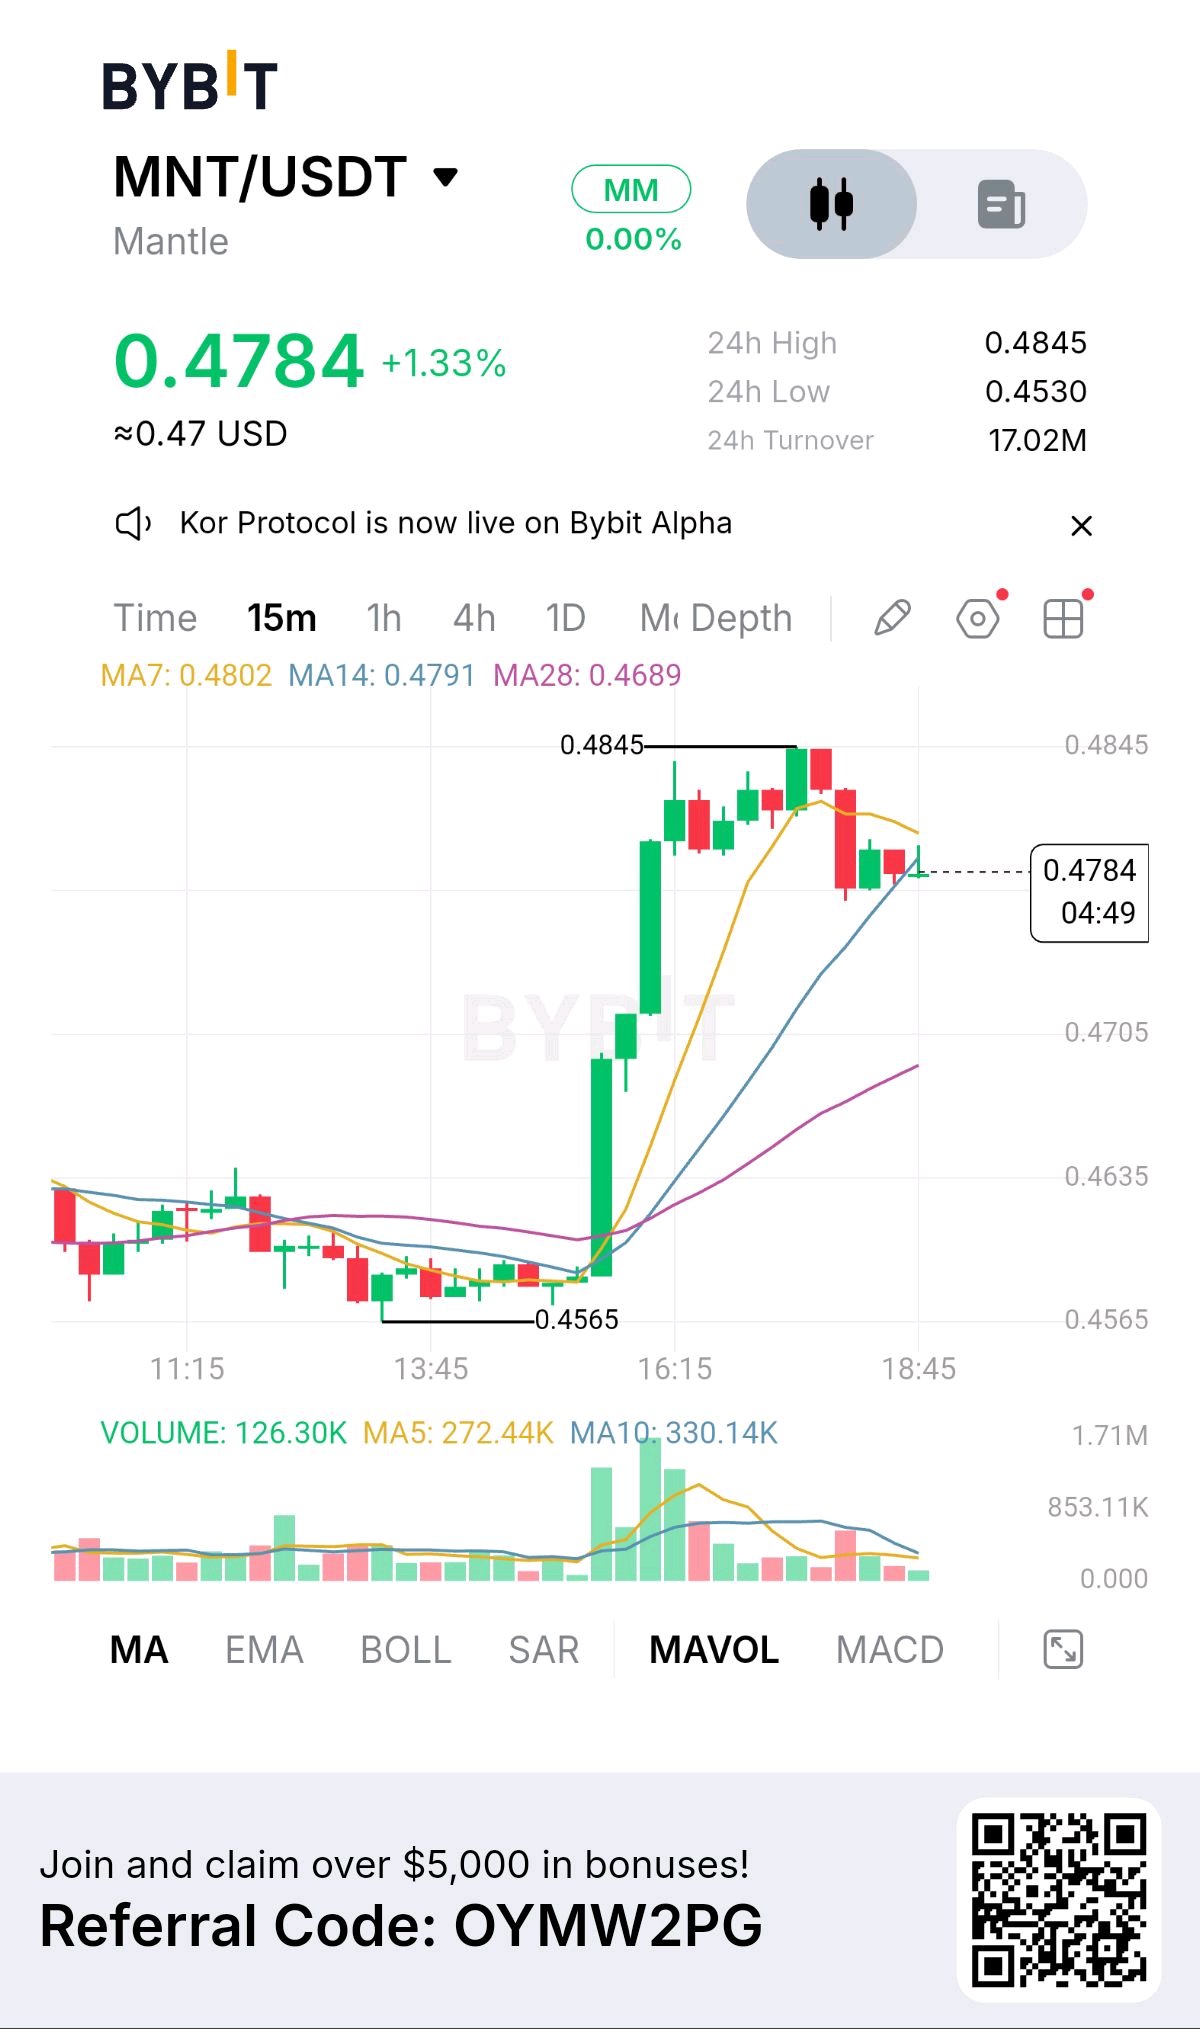
$MNTUSDT is holding onto its daily gains, but the rally from 0.4565 to 0.4845 is now facing a test of momentum. After the strong upward move, price has retreated to 0.4784. It is currently below MA7 at 0.4802 and MA14 at 0.4791, suggesting that short-term buying momentum has weakened. However, it remains above MA28 at 0.4689, leaving the broader recovery structure with an important support level still in play. The next move could define the market's direction. A convincing 15-minute close above 0.4802 would strengthen the recovery and bring the 0.4845 high back into focus. On the other hand, a decisive break below 0.4689 could expose the 0.4635 area. The difference between this pullback and a genuine trend reversal will depend on how price reacts around these levels. The lower pullback volume compared with the rally is worth watching, but it is not proof that sellers have lost control. MNT is not showing a confirmed continuation signal yet. Buyers need to reclaim short-term momentum, while the MA28 remains a key downside reference. Will buyers turn this pullback into another push toward 0.4845, or will the recovery lose its foundation below 0.4689?#ByXIMPACT #BitcoinSlidesBelow$80K #WSOTPicktoEarn10U

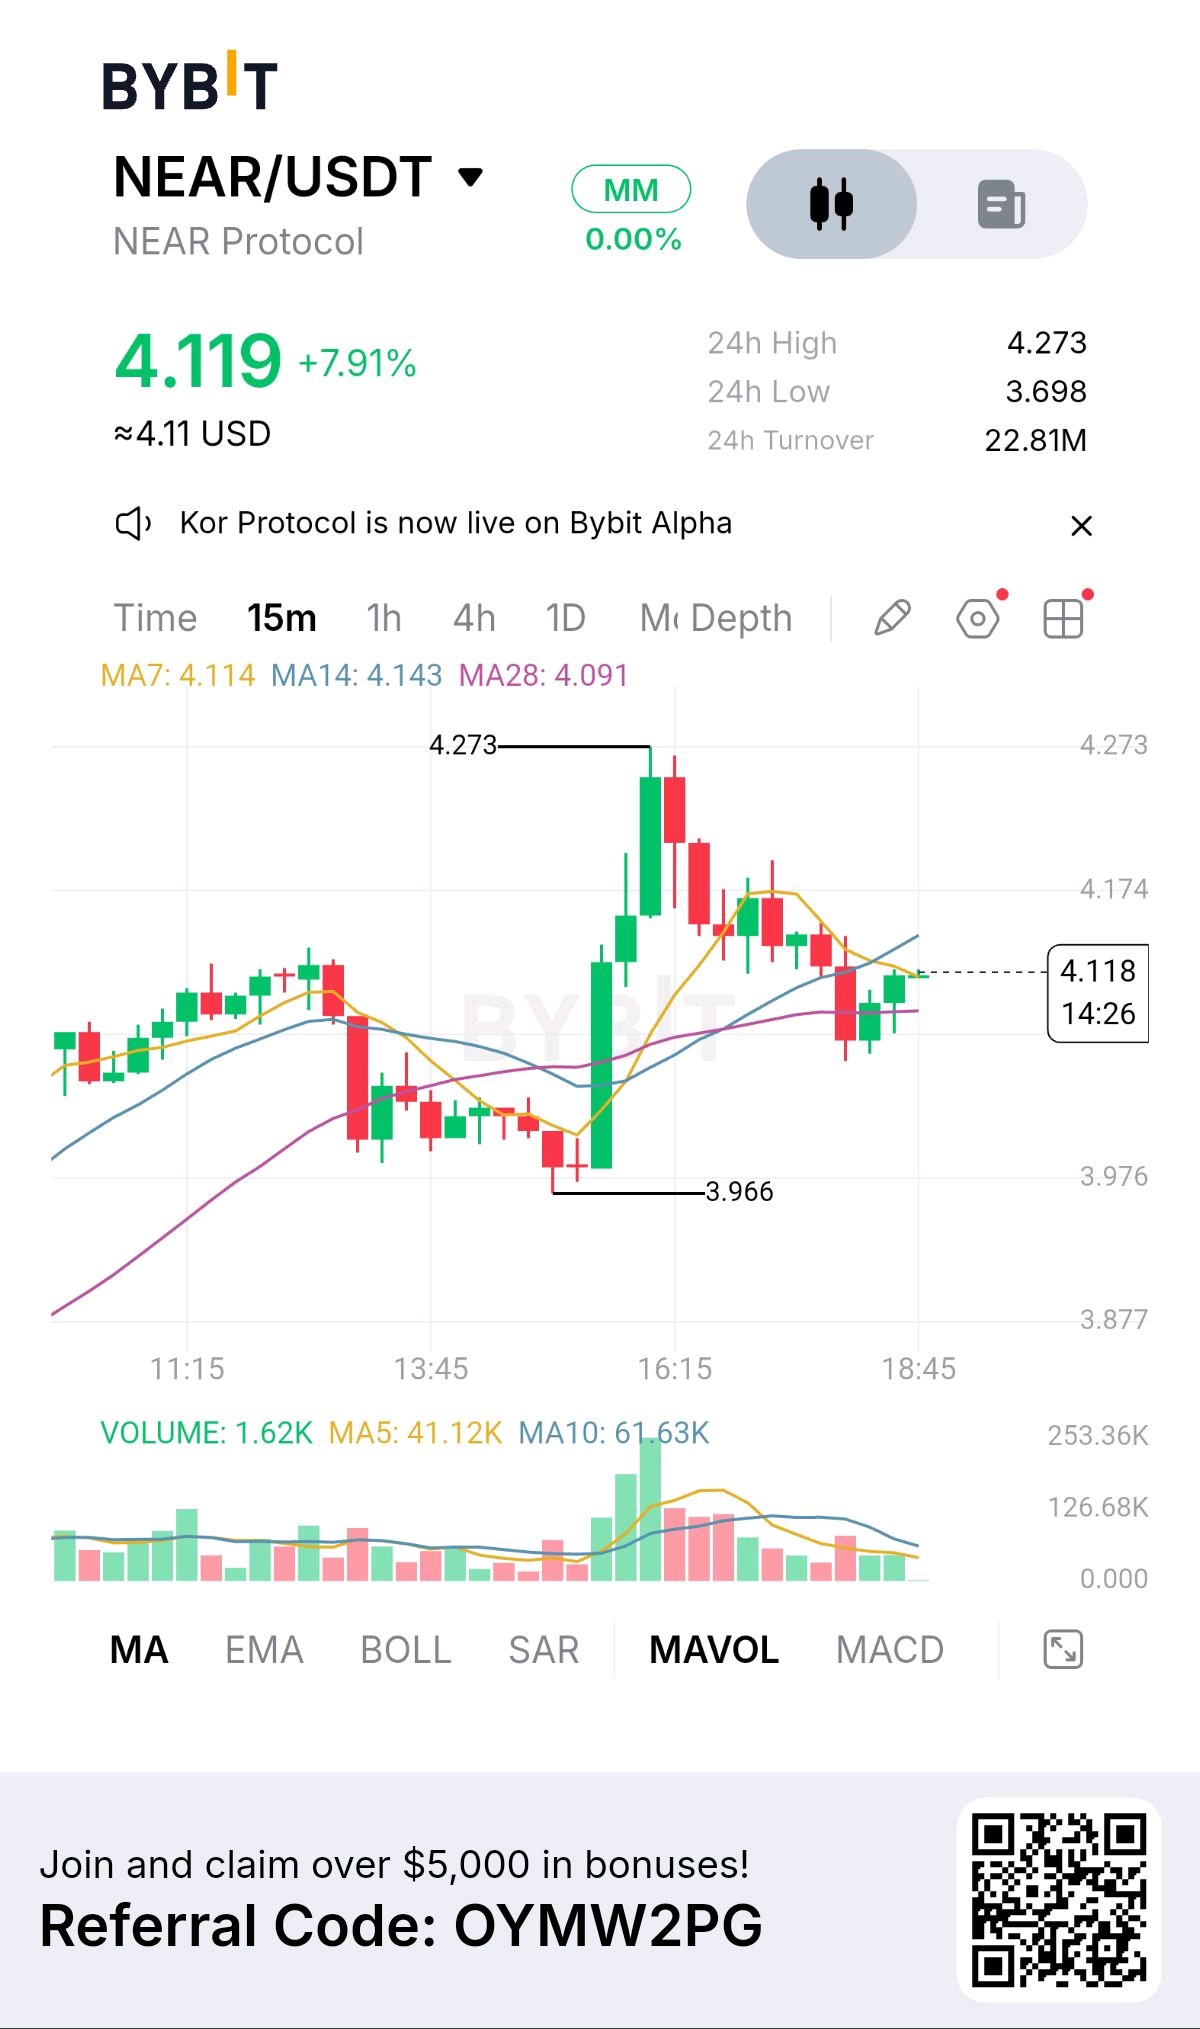
$NEARUSDT has gained 7.91% in 24 hours, but the rally is now facing a different challenge: holding its gains. After climbing from 3.966 to 4.273 on strong buying volume, price has pulled back to 4.119. The momentum has cooled, and the short-term moving averages are beginning to separate the recovery from a possible deeper correction. Here is where the battle stands: MA7: 4.114 MA14: 4.143 MA28: 4.091 Price is slightly above MA7 and MA28, but remains below MA14. That leaves 4.143 as the immediate level buyers need to reclaim, while 4.091 is an important support reference. If buyers defend the MA28 and push NEAR above 4.143 with a convincing 15-minute close, the recovery could regain momentum toward 4.273. But a decisive close below 4.091 would weaken the bullish structure and put the 3.976 area in focus. One detail deserves attention: the pullback volume is reportedly lighter than the volume behind the rally. That may suggest selling is less forceful, but it does not guarantee that the correction is over. NEAR has already demonstrated strong upside momentum. Now the market must show whether buyers can defend those gains. Is this a healthy pause before another attempt at 4.273, or the beginning of a deeper retracement?#ByXIMPACT #Oracle20BFundingPlanTestsTheAITrade

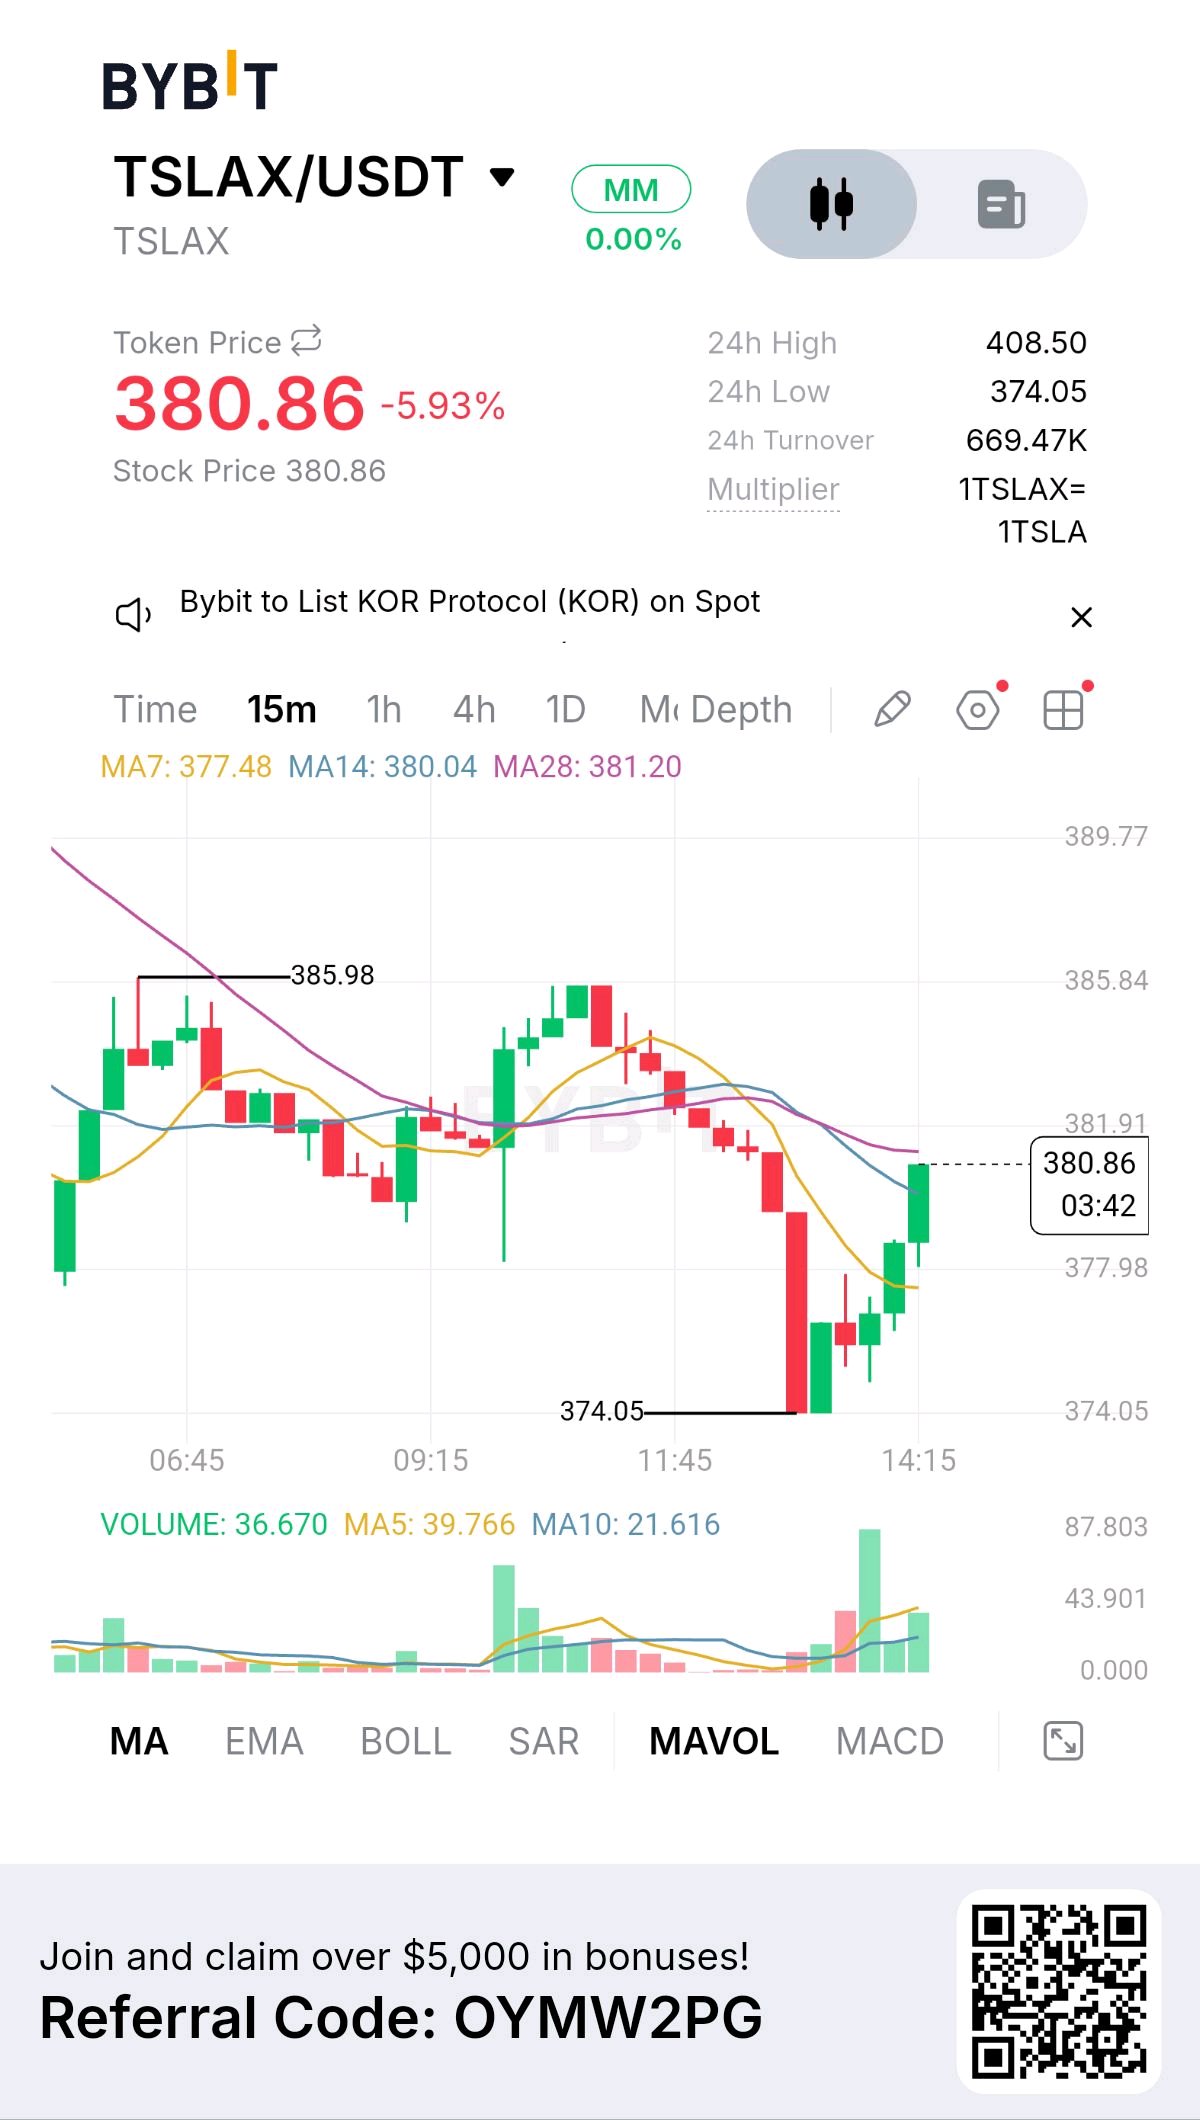
$TSLAXUSDT has bounced from 374.05 to 380.86, but the bigger question is whether this recovery has enough strength to reverse the short-term bearish structure. Despite gaining ground from the session low, TSLAX remains down 5.93% over 24 hours. The decline from 385.98 was aggressive, and the heavy selling volume around 374.05 shows how intense the downward move became. Now the balance is changing. Price has reclaimed MA7 at 377.48 and MA14 at 380.04, bringing it directly toward MA28 at 381.20. This is where the recovery must prove itself. A confirmed 15-minute close above 381.20 would strengthen the bullish case and put 385.98 back in focus. However, rejection at this resistance, followed by a move below 380.04, could weaken the rebound and expose 377.98, with 374.05 remaining the major downside reference. The important distinction is that a recovery is not yet a reversal. Buyers have recovered lost ground, but they still need to overcome resistance before the market structure can be considered stronger. The next candle close matters more than the bounce itself. Will TSLAX turn this recovery into a genuine reversal above 381.20, or will sellers use this rebound as another opportunity to regain control?#ByXIMPACT

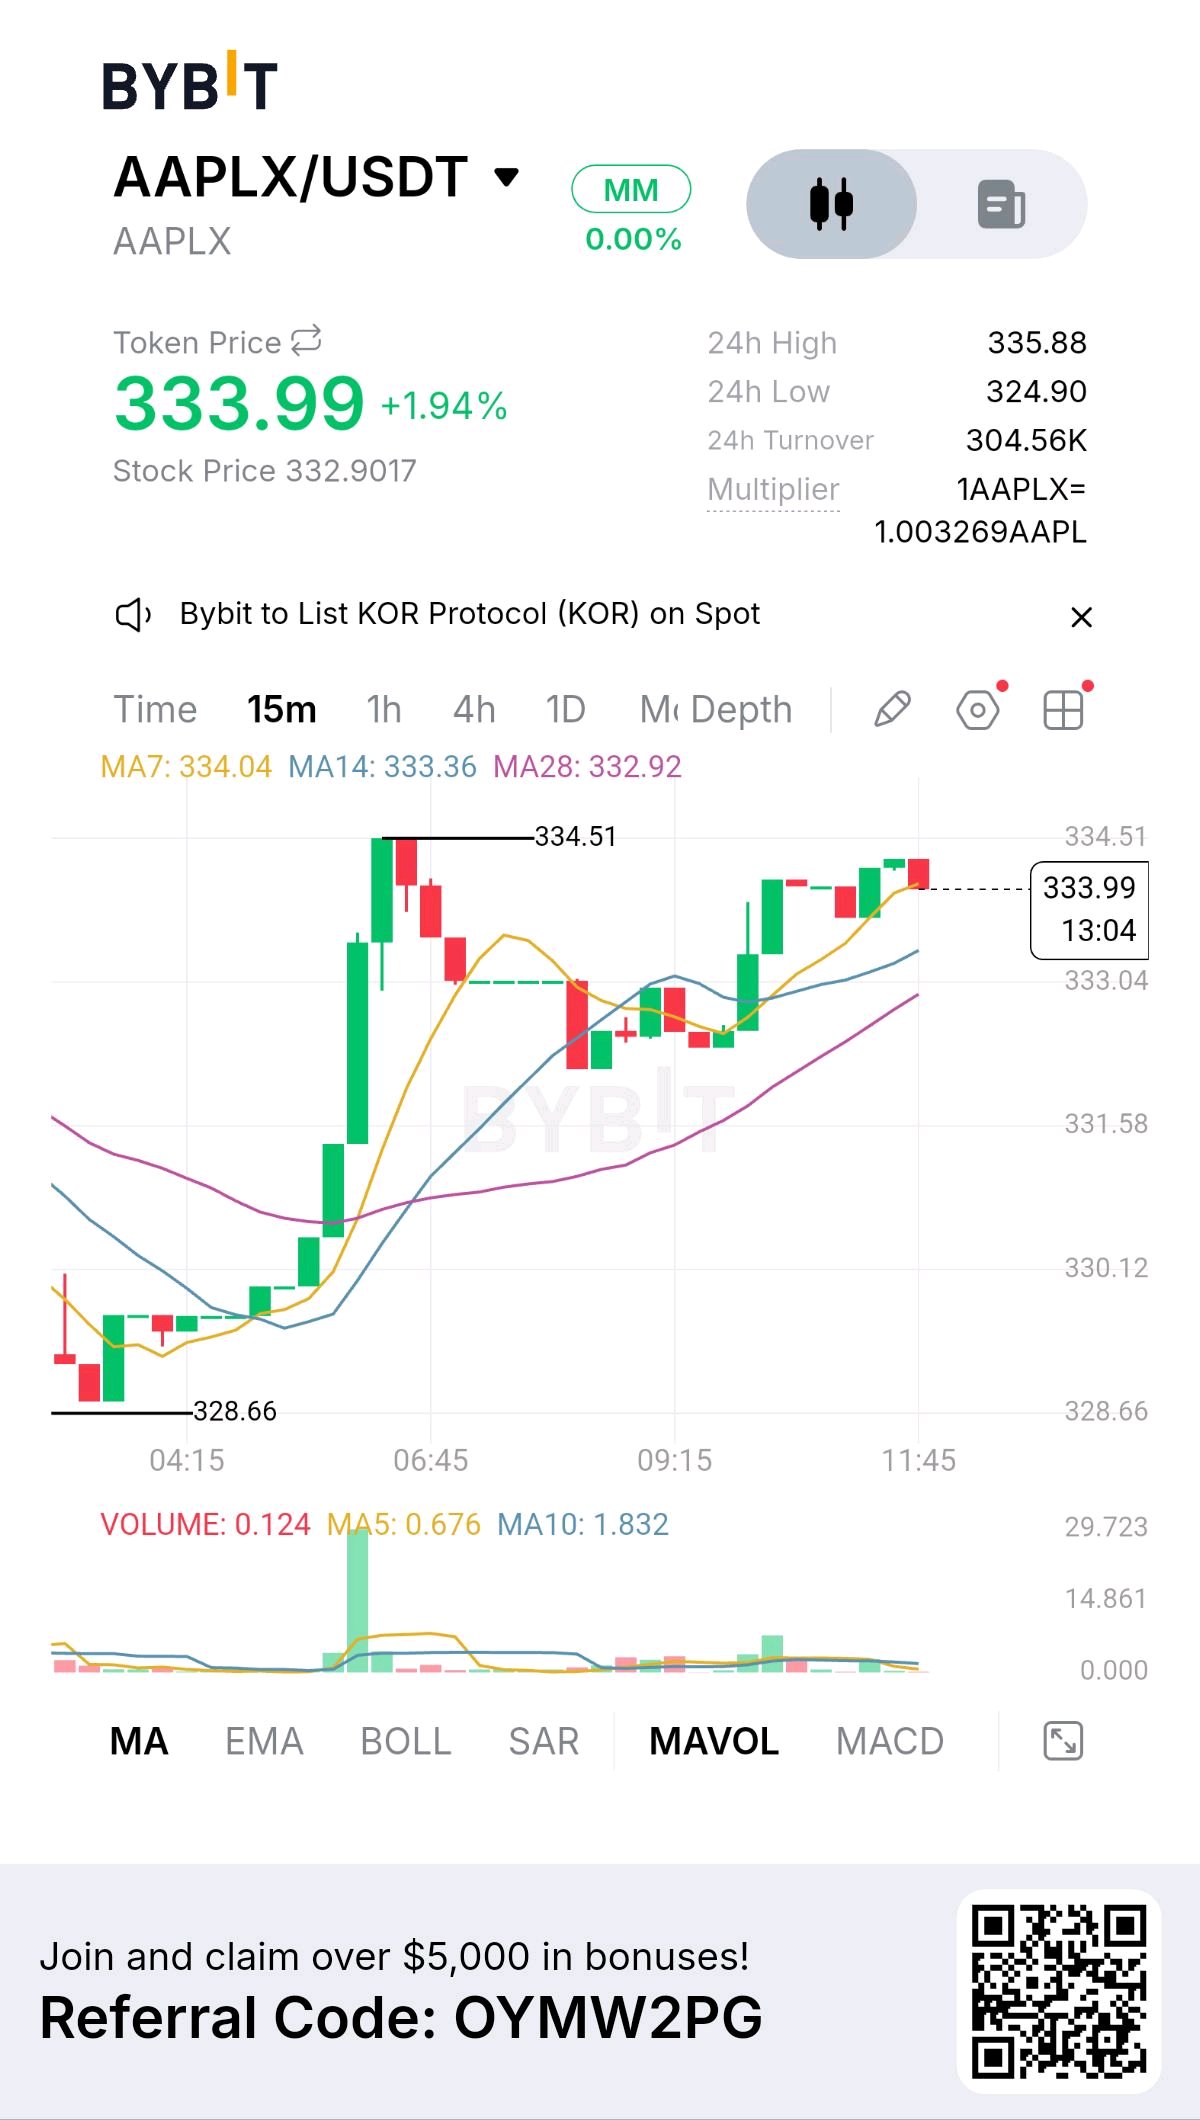
$AAPLXUSDT is approaching a decisive moment. Buyers have recovered from the recent decline and are now challenging the same resistance that previously stopped the rally. Trading at 333.99, the token is up 1.94% over 24 hours. Its range is 324.90–335.88, with turnover at 304.56K and an underlying stock multiplier of 1.003269. Why This Test Matters The 15-minute chart shows buyers recovering from 328.66 and pushing toward 334.51. After a brief pullback, price has returned to challenge that ceiling. This creates an important market question: will the second attempt break through, or will sellers defend the level again? The technical structure currently favors buyers: MA7: 334.04 MA14: 333.36 MA28: 332.92 The averages are aligned upward, while price remains above MA14 and MA28. However, it is still slightly below MA7, showing that immediate momentum is being tested. Two Outcomes, Two Different Signals A strong 15-minute close above 334.51, preferably supported by increased volume, would strengthen the breakout case and bring 335.88 into focus. But rejection at 334.51 followed by a loss of 333.36 could expose the 332.92 support area. The Insight Repeated resistance tests are important because they reveal whether buyers can maintain pressure. However, approaching a level several times does not guarantee that it will break. For AAPLX, the quality of the next breakout attempt matters more than the number of attempts. My question to the community: Will buyers finally clear 334.51, or are we about to see another rejection at the same ceiling?#ByXIMPACT #BitcoinSlidesBelow$80K
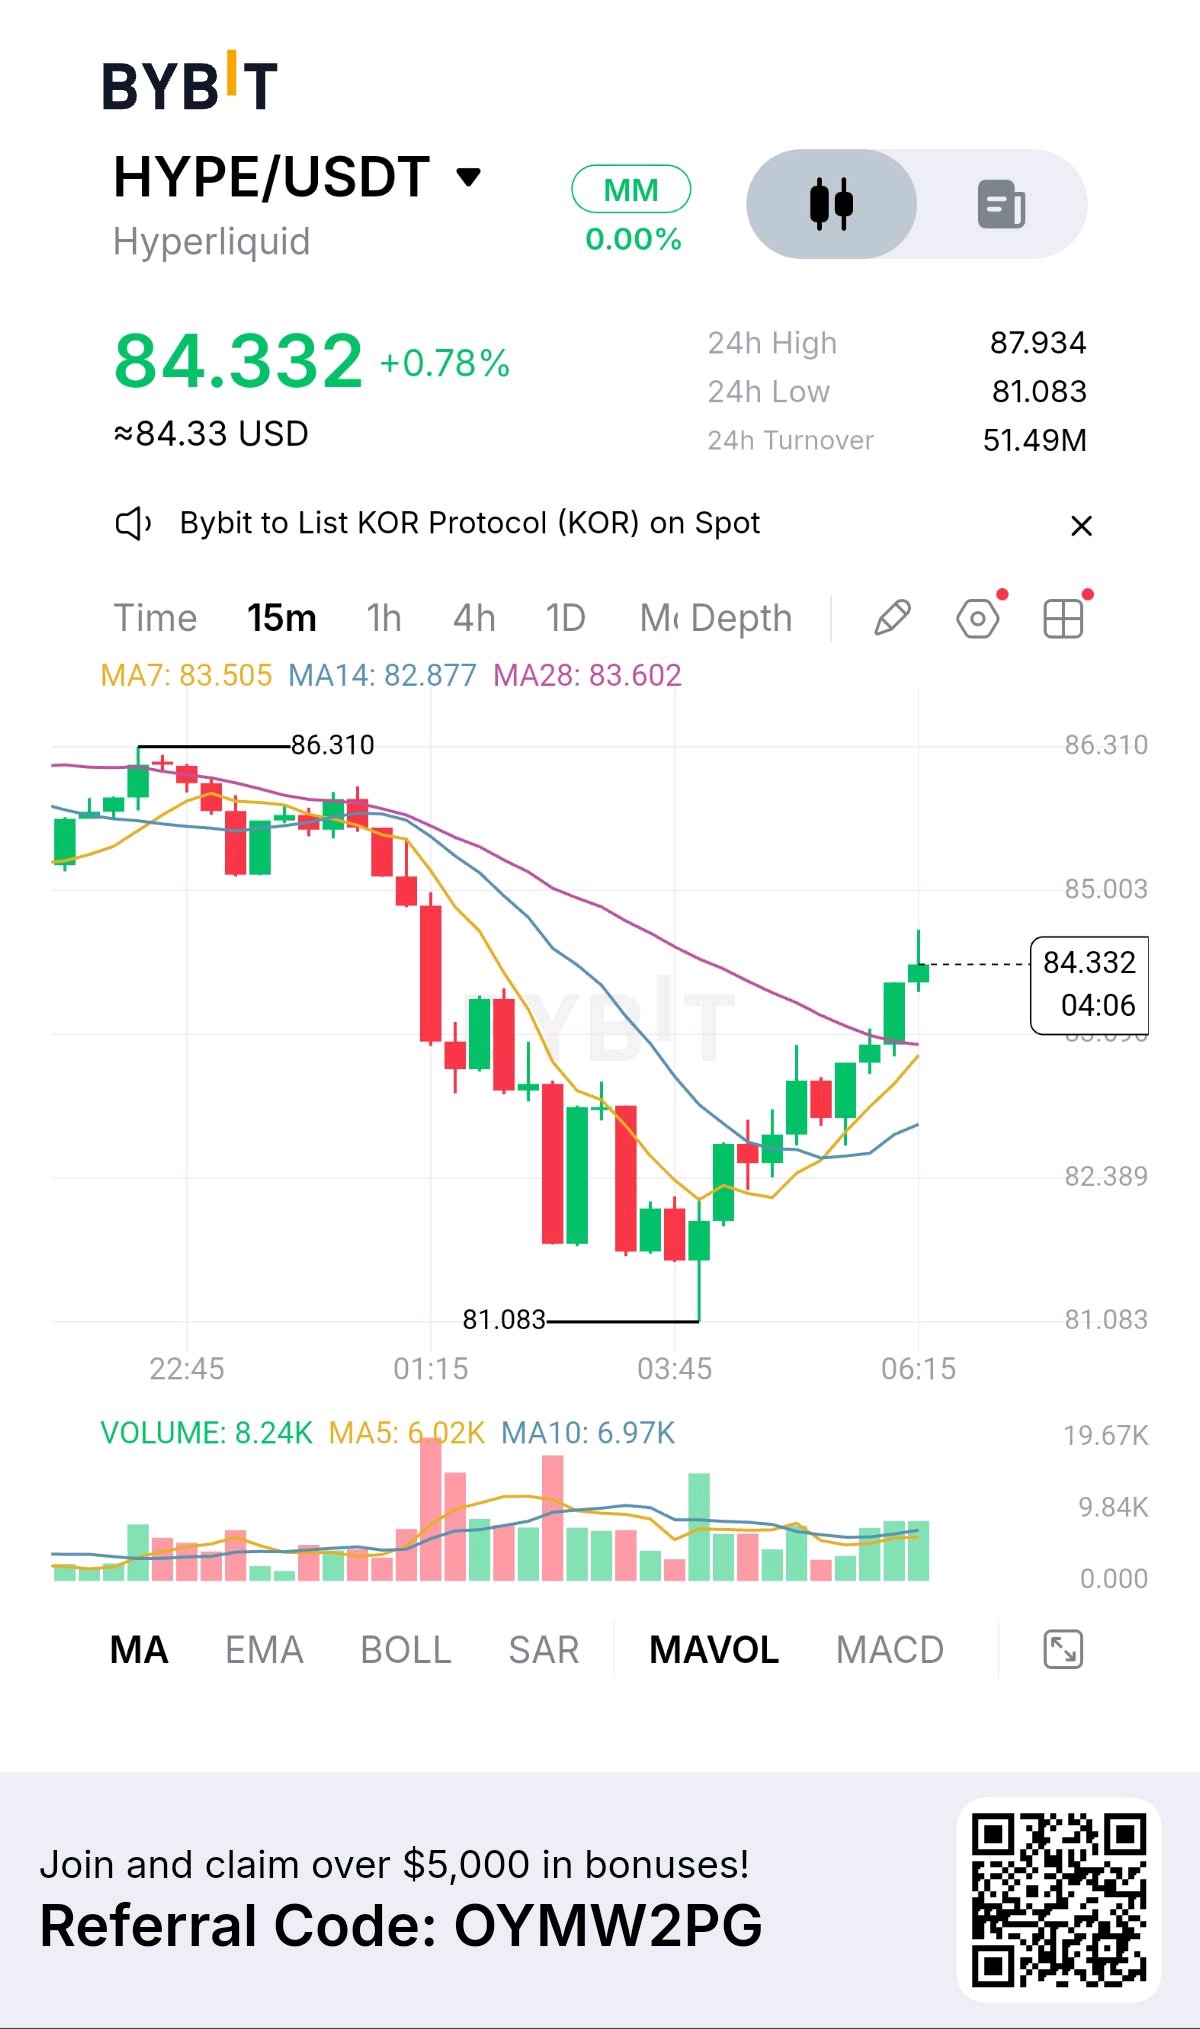
HYPE: The Bulls Are Fighting Back
A 81.083 low, HYPE faced serious selling pressure. Now, buyers are pushing back, and the recovery is becoming difficult to ignore. $HYPEUSDT trades at 84.332, gaining 0.78% over 24 hours. The price has ranged between 81.083 and 87.934, with turnover reaching 51.49M. But here is what makes this recovery interesting. The Market Structure Is Changing After falling from 86.310 to 81.083, HYPE began forming higher highs and higher lows. This suggests buyers are gradually rebuilding short-term momentum. The moving averages add another important detail: MA7: 83.505 MA14: 82.877 MA28: 83.602 Price has recovered above all three averages. That is an encouraging development, but the next resistance could determine whether this is a genuine trend recovery or simply a temporary bounce. 85.003 Is the Real Test This is where the battle becomes interesting. A strong 15-minute close above 85.003 could strengthen the bullish case and bring 86.310 back into focus. However, failure to break resistance could invite another pullback. A move below 83.602 would weaken the recovery, while 82.389 becomes an important downside reference. One Thing I Am Watching The most important question is not how far HYPE has recovered. It is whether buyers can defend the ground they have regained. A recovery becomes more meaningful when resistance turns into support. Until that happens, confirmation matters more than excitement. Let's hear your market perspective: Is HYPE preparing for another run toward 86.310, or do you expect sellers to defend 85.003 again?#ByXIMPACT

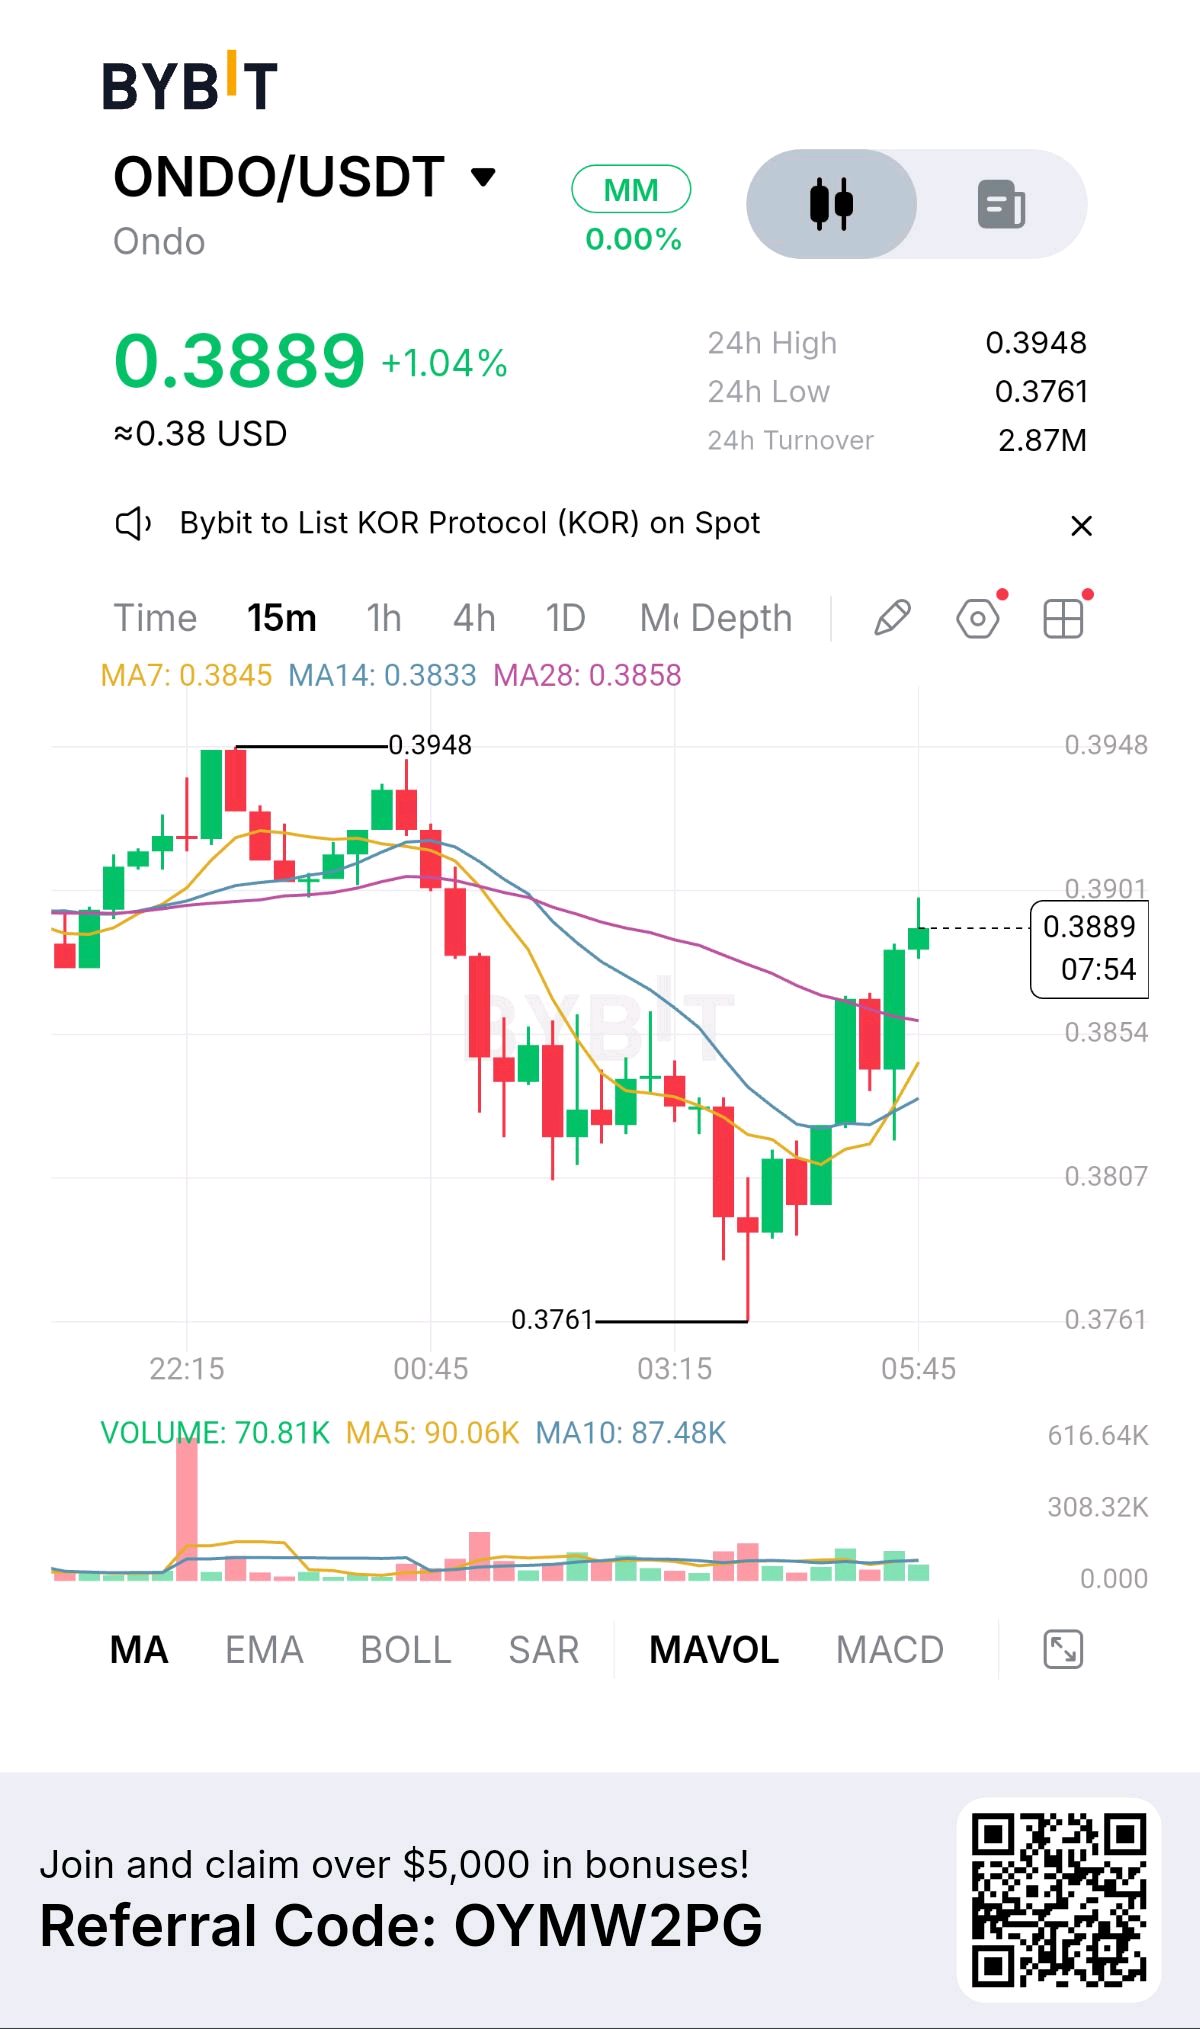
ONDO: Bulls Regain Control
The sell-off was sharp. The recovery has been equally important. But ONDO now faces a test that could determine whether this rebound develops into a stronger bullish move. $ONDOUSDT is trading at 0.3889, gaining 1.04% over 24 hours. The session high stands at 0.3948, the low at 0.3761, and turnover has reached 2.87M. The Shift in Market Control The 15-minute chart reveals a dramatic change in price action. After reaching 0.3948, ONDO suffered a sharp decline toward 0.3761. Buyers then stepped in, driving a recovery that brought price back above its short-term moving averages. That recovery matters because the market is no longer trading at the session lows. However, reclaiming lost ground is only the first step. Buyers still need to challenge the recent recovery high. The Technical Evidence Current moving averages: MA7: 0.3845 MA14: 0.3833 MA28: 0.3858 At 0.3889, price is above all three averages. This gives the short-term structure a positive bias and suggests buyers have regained some control. But momentum must now prove itself around 0.3901. The Level That Could Change Everything A convincing 15-minute close above 0.3901 would strengthen the recovery and put the 0.3948 session high back in focus. Failure to overcome resistance could trigger another pullback. The first important support reference is 0.3858, followed by 0.3807 if selling pressure increases. A sustained move below 0.3858 would weaken the current recovery structure. My Take ONDO has moved beyond a simple bounce from the lows. It has reclaimed its moving-average cluster, giving buyers a better technical position than they had during the sell-off. Still, I would not confuse improving momentum with a confirmed breakout. The real test is whether buyers can turn 0.3901 into a level of acceptance rather than another rejection point. Is ONDO preparing to challenge 0.3948 again, or will resistance at 0.3901 stop the recovery?#ByXIMPACT #BitcoinSlidesBelow$80K
RUNE: +13% Gains, But Can Bulls Win Back Control?
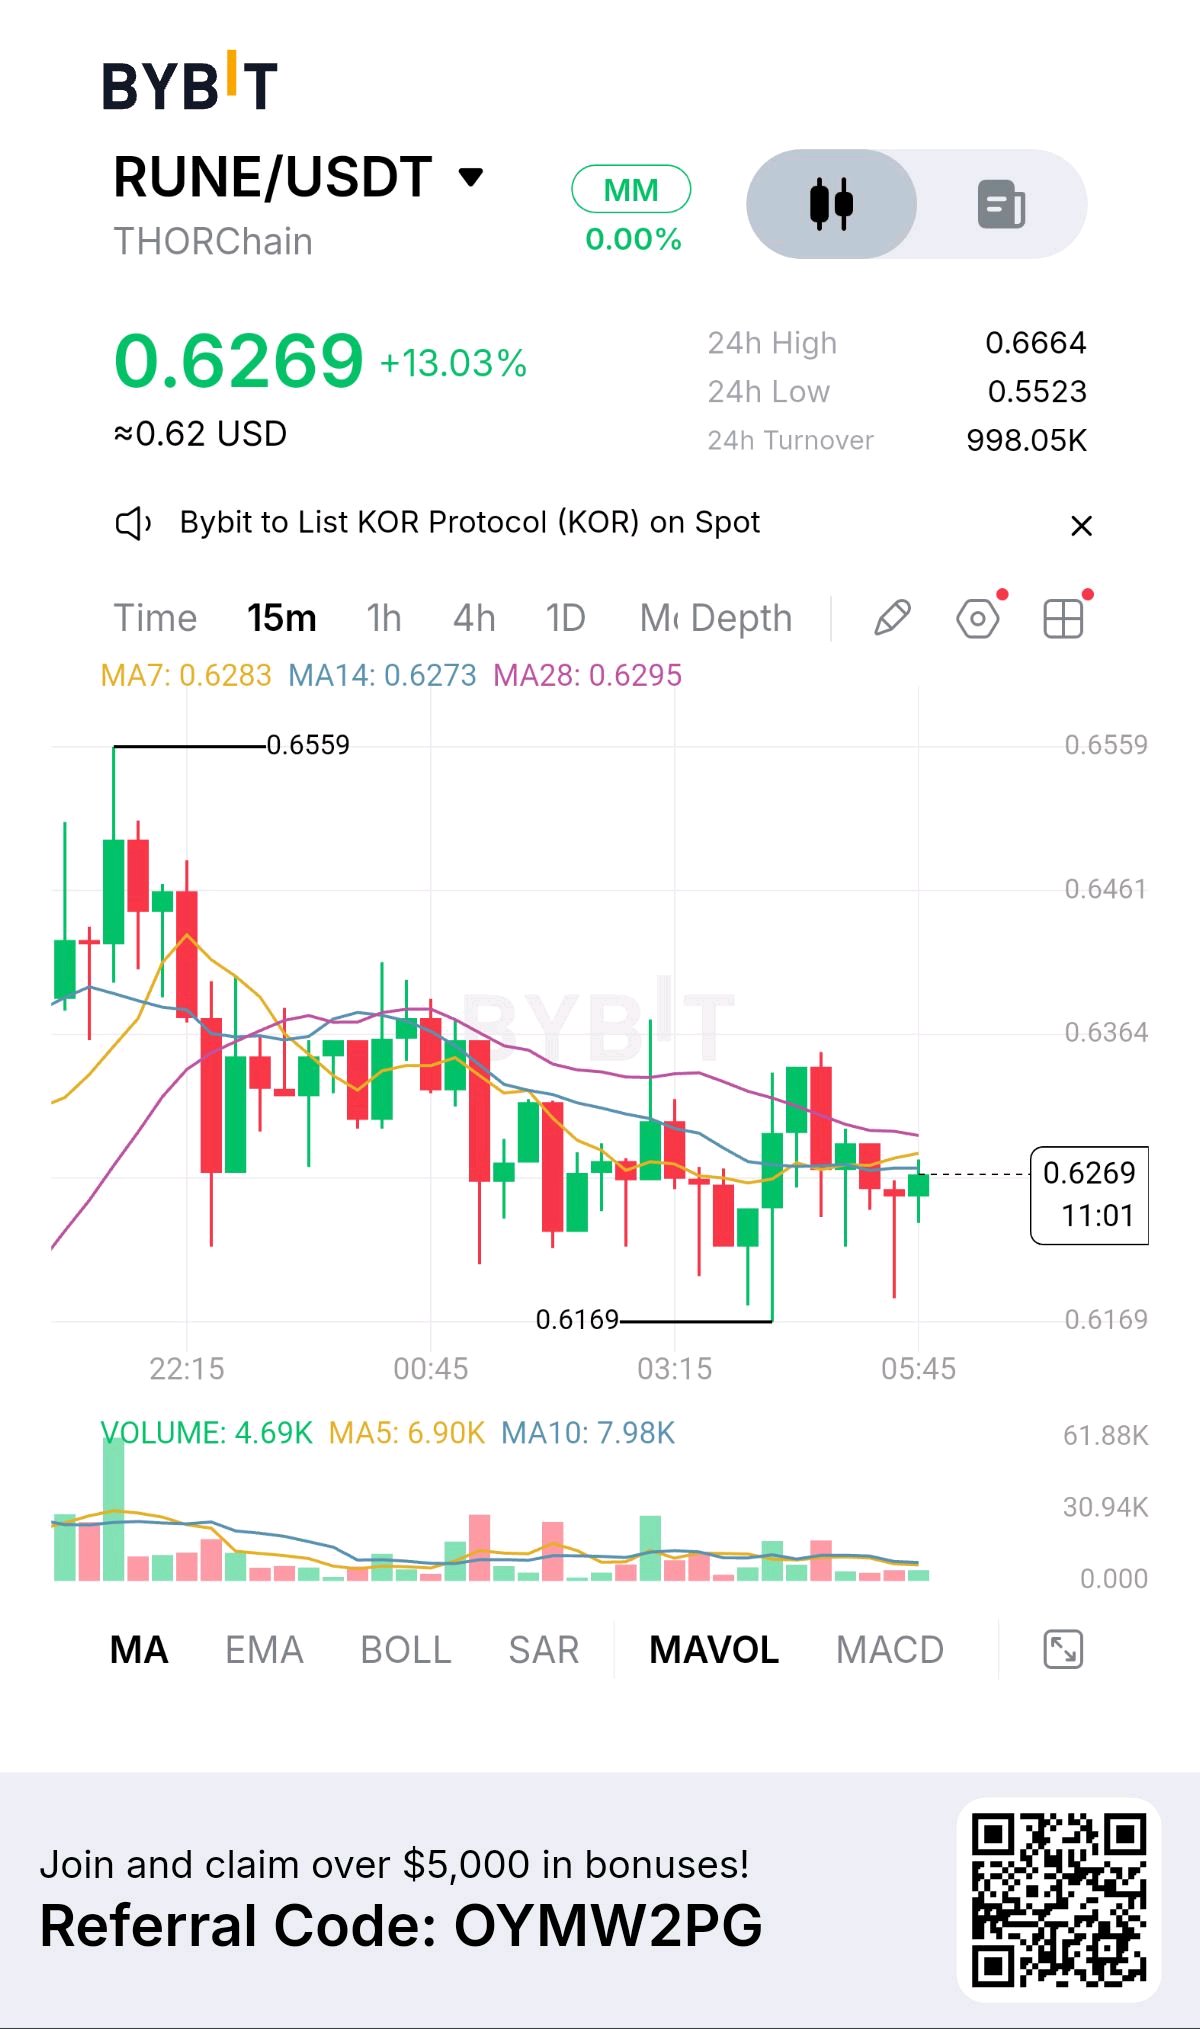
A strong rally can change market sentiment, but defending those gains is where the real battle begins. $RUNEUSDT is up 13.03% over 24 hours, currently trading at 0.6269. Price has moved between 0.5523 and 0.6664, with turnover reaching 998.05K. Yet the 15-minute chart is telling a more complicated story. After climbing toward 0.6559, RUNE experienced a sharp reversal. Sellers gradually pushed price lower until buyers stepped in around 0.6169. The rebound from that area is encouraging, but it has not yet reclaimed the moving-average cluster. The Momentum Test Three levels are now standing in the way of a stronger recovery: - 0.6273 — MA14 - 0.6283 — MA7 - 0.6295 — MA28 Price remains below all three. This means the recent bounce is still facing technical resistance, despite the impressive 24-hour performance. There is an important distinction here: a coin can remain strongly positive over 24 hours while its short-term momentum is weakening. Where the Battle Could Turn If buyers reclaim 0.6295 with a convincing 15-minute close, attention could shift toward 0.6364. That would be an important step toward repairing the damaged short-term structure. But another rejection could leave RUNE vulnerable. A move below 0.6269 would weaken the immediate recovery, while 0.6169 remains the key structural low to watch. The relatively quiet volume during the rebound also means buyers still need to demonstrate stronger participation. The Bigger Question RUNE has already delivered a substantial rally. The question now is whether buyers can defend that performance or whether the latest bounce will become another lower high. I would pay more attention to the reaction around 0.6295 than to the headline 13% gain. Is RUNE preparing for another bullish expansion, or are sellers getting ready to take back control?#ByXIMPACT #BlockchainSecurity #PiecesOf8
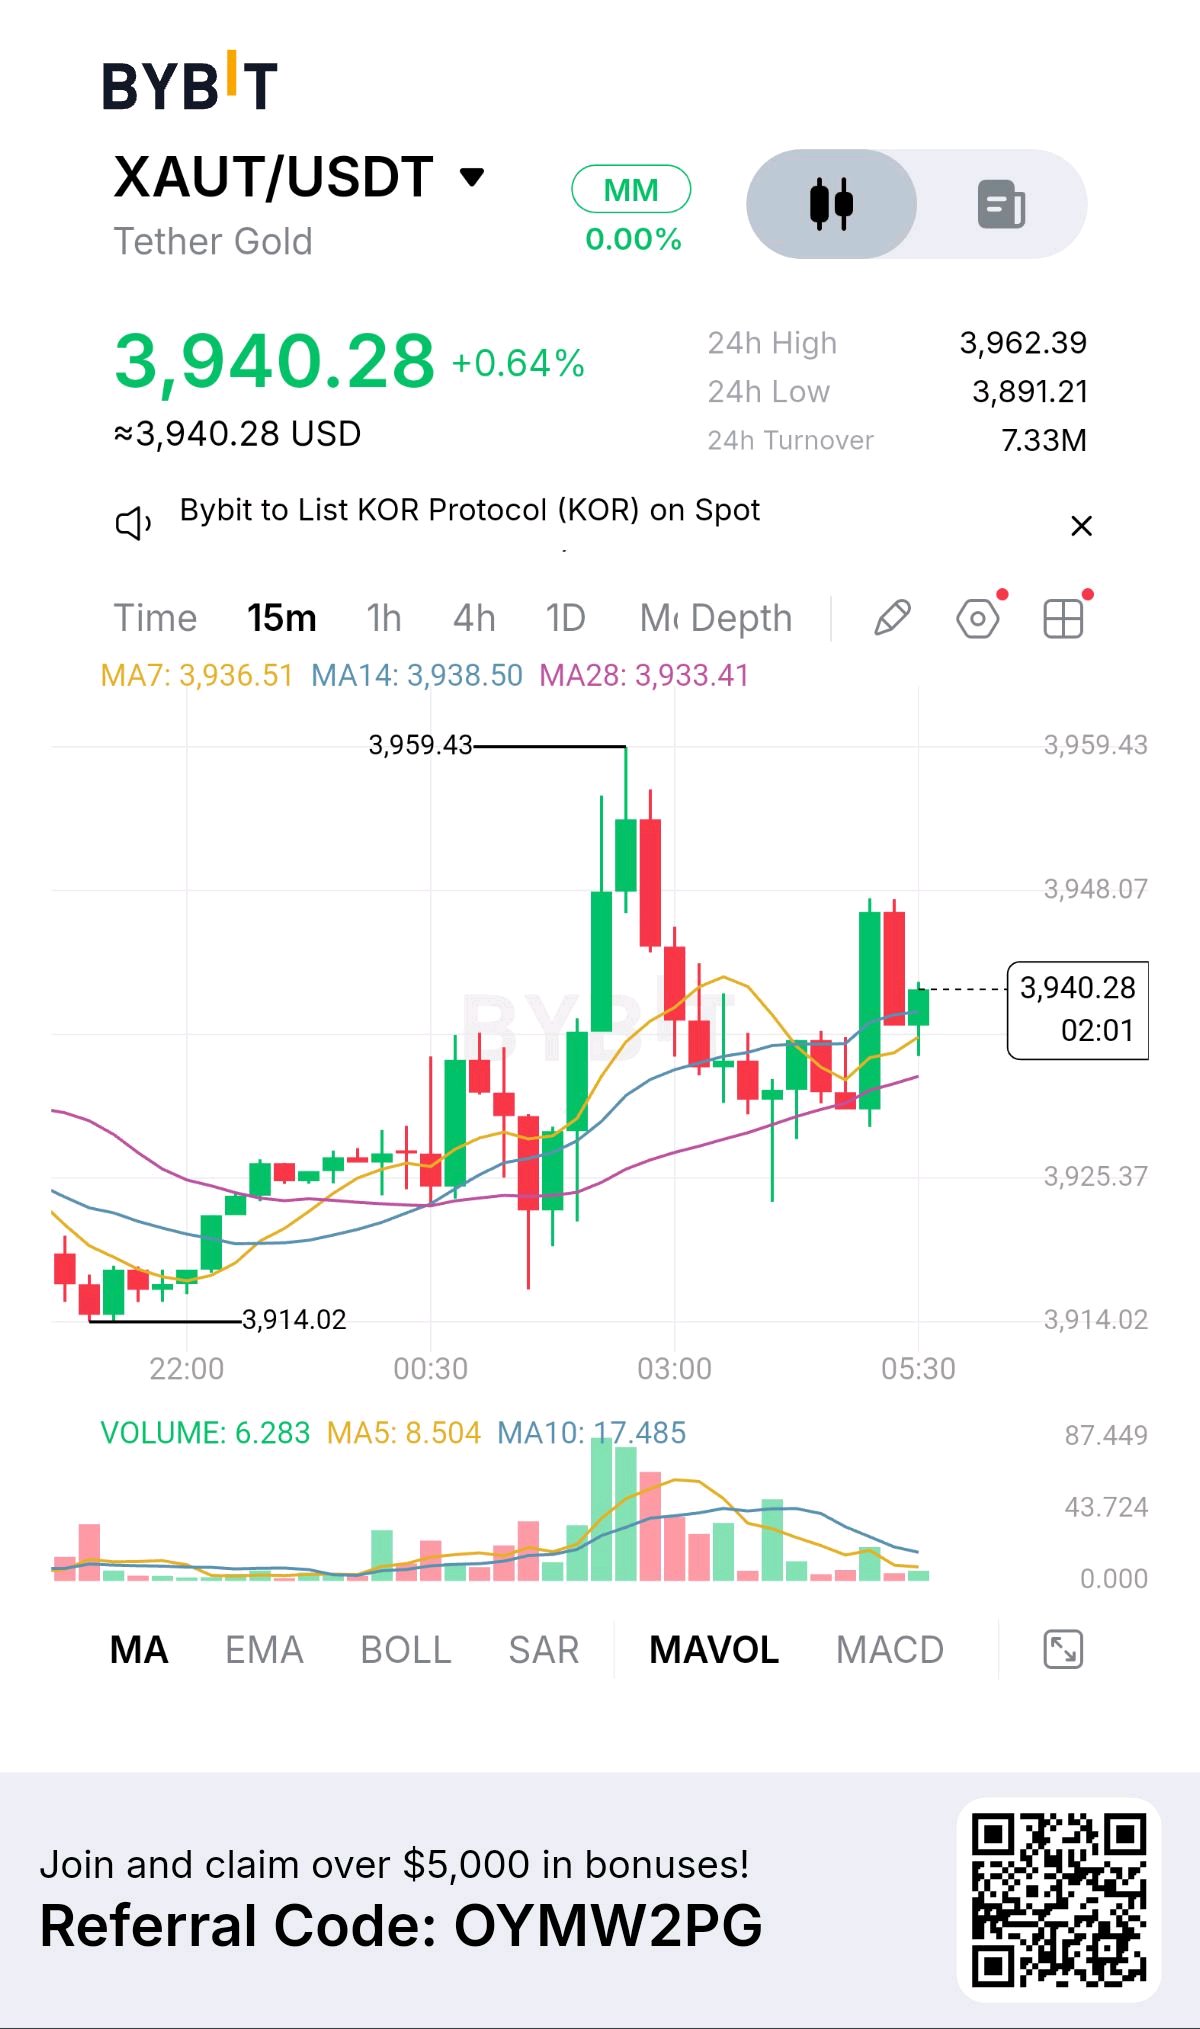
Gold-backed $XAUTUSDT is showing resilience after recovering from 3,914.02, but the latest price action suggests buyers still have an important battle ahead. At 3,940.28, XAUT is up 0.64% over 24 hours. Its trading range stands between 3,891.21 and 3,962.39, with turnover at 7.33M. What the Chart Is Really Saying The rally toward 3,959.43 demonstrated strong buying interest. But the rejection that followed prevented bulls from maintaining control at the highs. What matters now is how price behaves around the moving-average cluster: MA7: 3,936.51 MA14: 3,938.50 MA28: 3,933.41 XAUT is currently above all three. That is encouraging for buyers, but the narrow distance between these averages suggests the market is still searching for a decisive direction. The Critical Price Battle The 3,948.07 region is the first obstacle bulls need to overcome. Beyond that, 3,959.43 represents the previous peak and a more significant breakout test. On the other side, losing the 3,933–3,936 support area could shift momentum back toward sellers. A deeper decline would bring 3,925.37 into focus. My Market Read This is not yet a confirmed breakout, and it is not a confirmed reversal either. The important development is that buyers have recovered the moving-average zone after the pullback. If they can turn 3,948.07 into support, the previous high may come under pressure again. But if price loses the average cluster, the current recovery could quickly lose its strength. In this market, the next decisive candle matters more than the latest percentage gain. Are buyers preparing for another attack on 3,959.43, or is this recovery running out of momentum?#ByXIMPACT #BitcoinSlidesBelow$80K

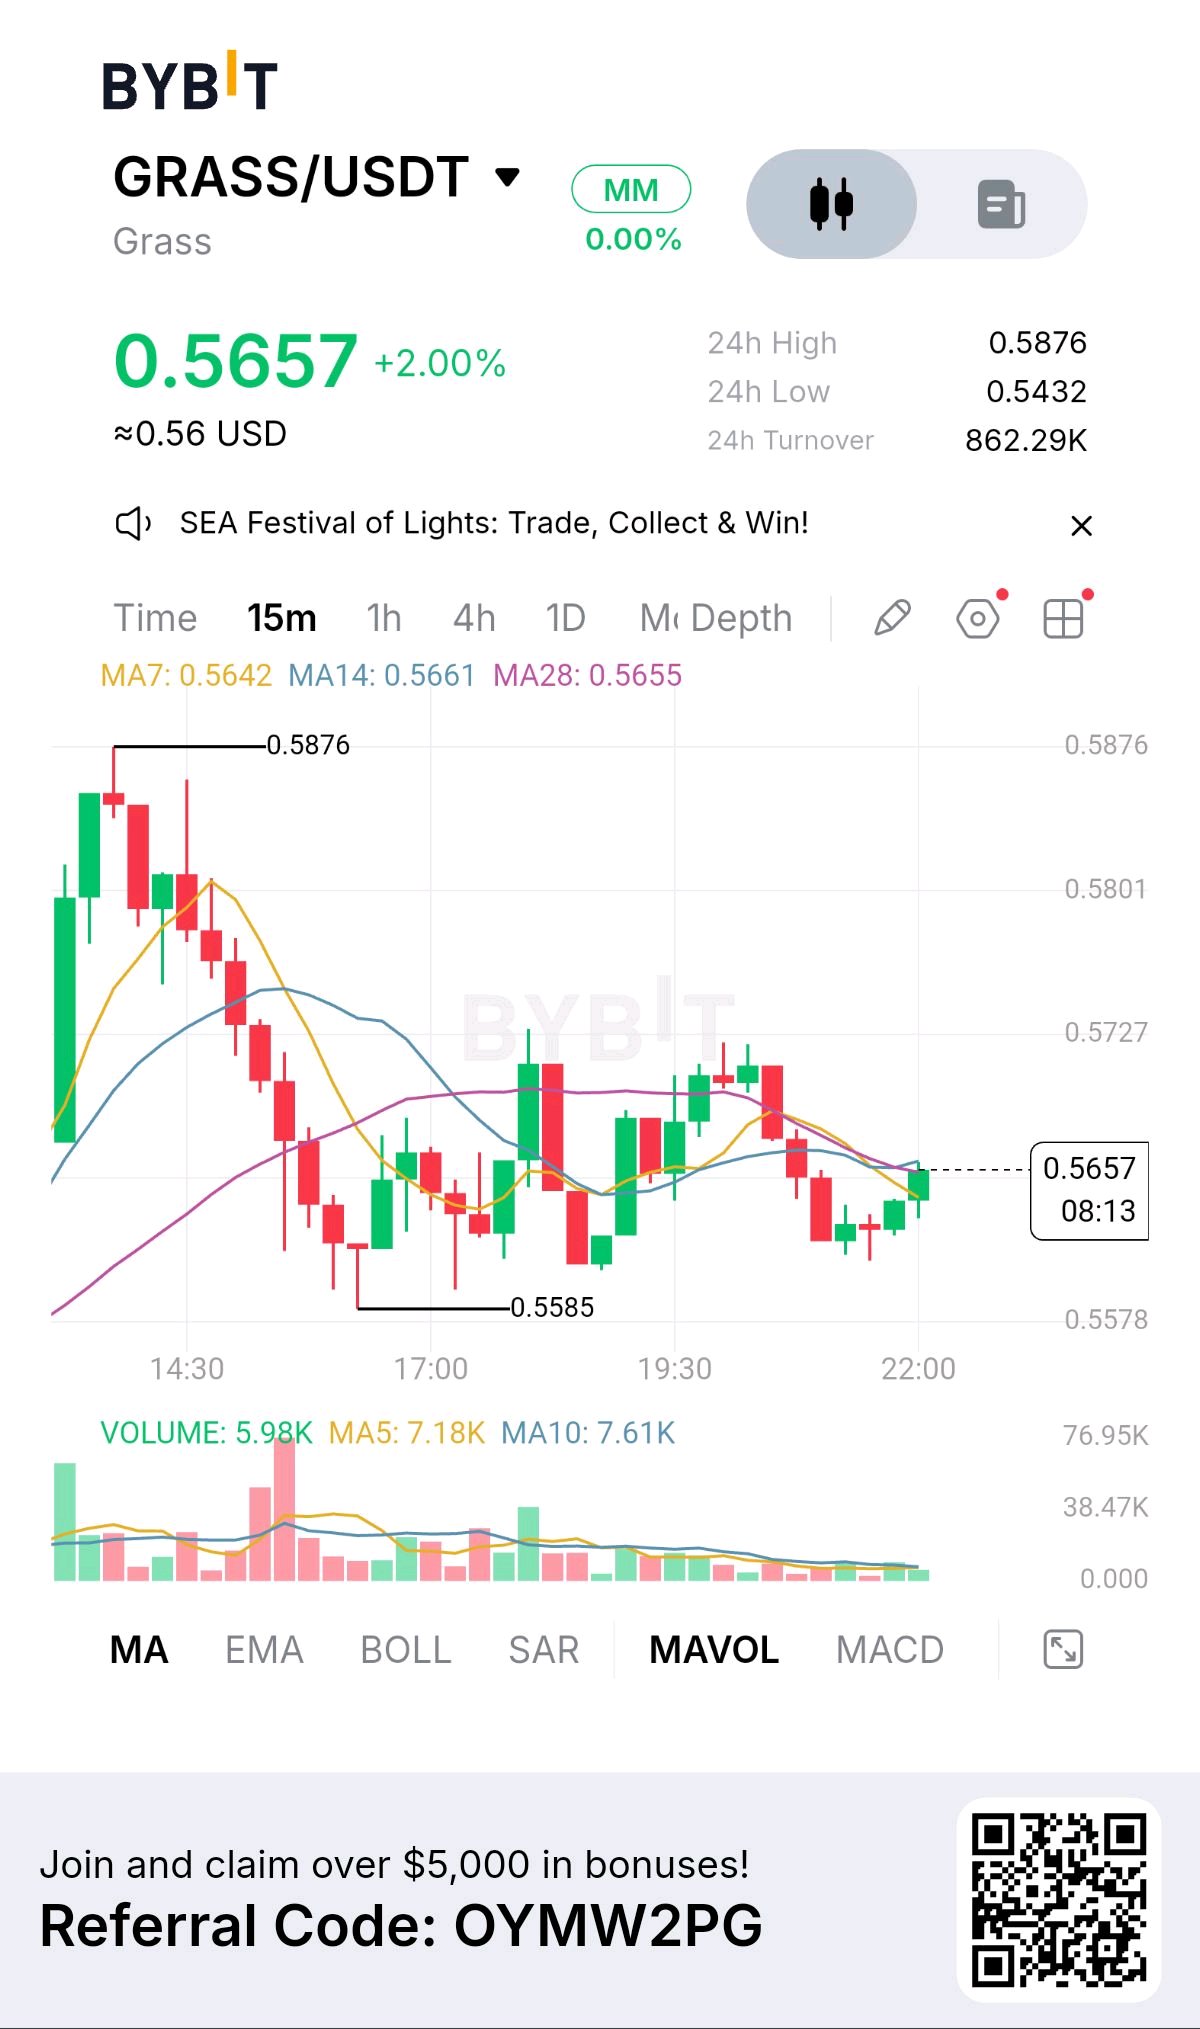
$GRASSUSDT is up 2.00%, currently trading at 0.5657. The 24-hour range stretches from 0.5432 to 0.5876, with turnover standing at 862.29K. The Recovery Has Reached a Decision Point The 15-minute chart tells a story of recovery after heavy selling. Following a peak at 0.5876, GRASS dropped toward 0.5585 before buyers stepped in. Since that low, price has gradually recovered through higher lows. However, the rebound has not yet developed into a clear upward trend. Instead, the market is moving sideways around a closely packed group of moving averages. Three Averages, One Battleground - MA7: 0.5642 - MA14: 0.5661 - MA28: 0.5655 With the current price at 0.5657, GRASS is trading within this cluster. The averages have flattened, suggesting that the earlier directional momentum has weakened. Volume has also contracted during consolidation, indicating reduced trading activity rather than a confirmed advantage for either buyers or sellers. The Next Move Depends on Confirmation A strong 15-minute close above 0.5661 could give buyers an opportunity to challenge 0.5727. If price instead falls below 0.5642 and fails to recover, attention may shift back to 0.5585, the recent structural low. The key is to distinguish a temporary move outside the range from a sustained breakout. Volume expansion would add useful confirmation. Patience Before Direction GRASS is currently caught between a developing recovery and lingering selling pressure. Neither side has established clear control. The next decisive move away from the moving-average cluster could provide the market's next short-term signal. Which level deserves more attention: 0.5661 for a bullish breakout or 0.5642 for a possible bearish breakdown?#ByXIMPACT #BitcoinSlidesBelow$80K
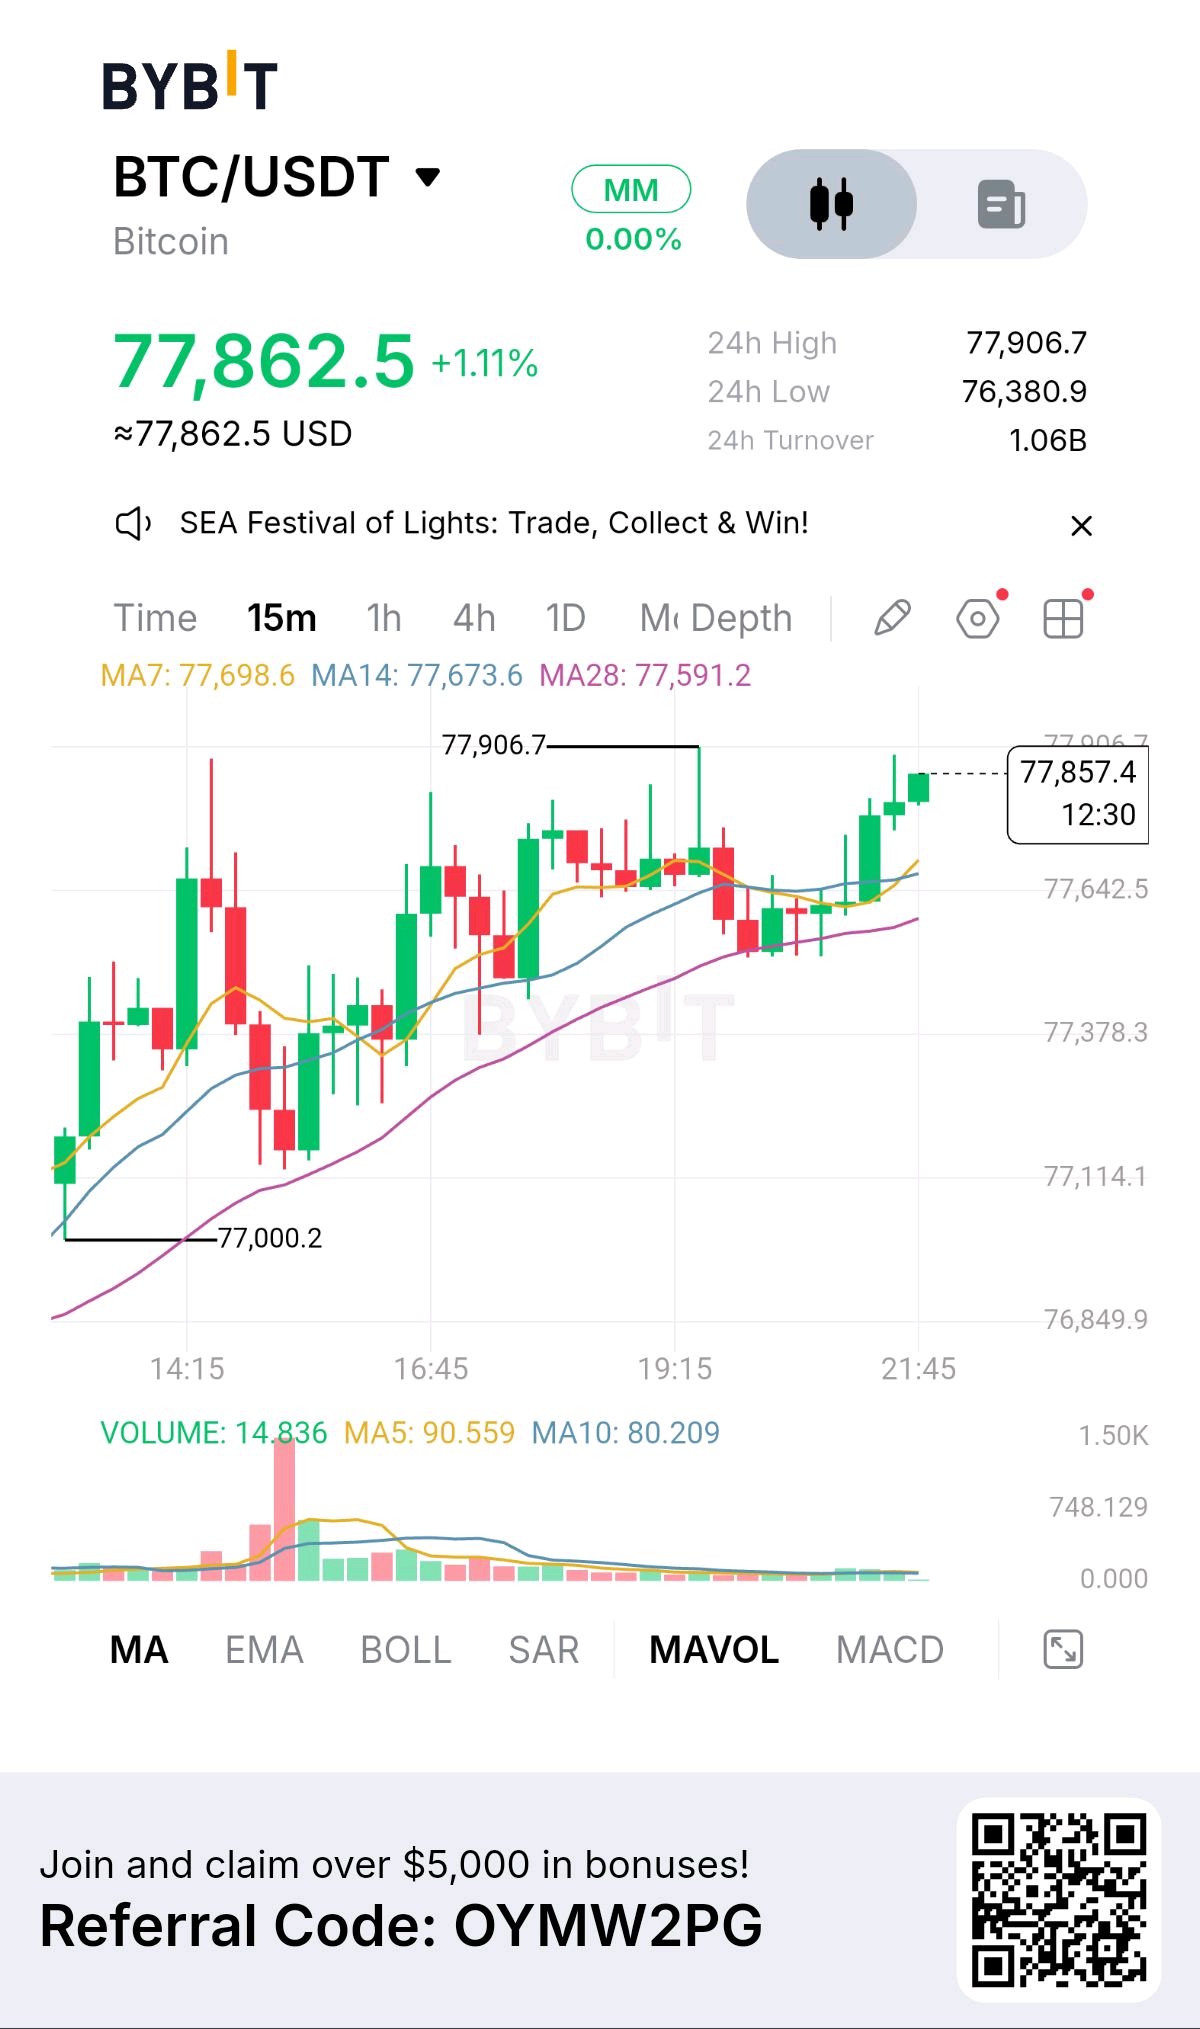
Bitcoin is showing renewed strength, trading at 77,862.5 with a 24-hour gain of 1.11%. The session range stands between 76,380.9 and 77,906.7, while turnover has reached 1.06B. Buyers Maintain Control On the 15-minute chart, BTC has developed a sequence of higher highs and higher lows, climbing from the 77,000.2 area toward a fresh local high of 77,906.7. The moving averages support this bullish structure: MA7: 77,698.6 MA14: 77,673.6 MA28: 77,591.2 All three averages are aligned upward, with price trading above them. This keeps the short-term trend positive, although the market is now approaching resistance where buyers must prove they can sustain the momentum. The Breakout Test The immediate barrier is 77,906.7. A strong 15-minute close above this level could open the way toward the psychological 78,000 mark. If BTC fails to break higher, the first support reference is 77,698.6 at MA7. Further weakness could bring MA28 at 77,591.2 into focus. Volume has eased as price approaches the high. This may reflect a pause in activity, but stronger participation would make any breakout more convincing. Momentum Is Strong, but Confirmation Matters BTC currently has the advantage, with its moving averages supporting the upward structure. However, resistance remains unbroken, making patience important at this stage. A confirmed breakout could extend the rally, while a loss of the moving-average support zone would signal that the momentum is weakening. Would you rather wait for a confirmed break above 77,906.7 or watch for a pullback toward 77,698.6 before judging the next move?#ByXIMPACT #BitcoinSlidesBelow$80K $BTCUSDT

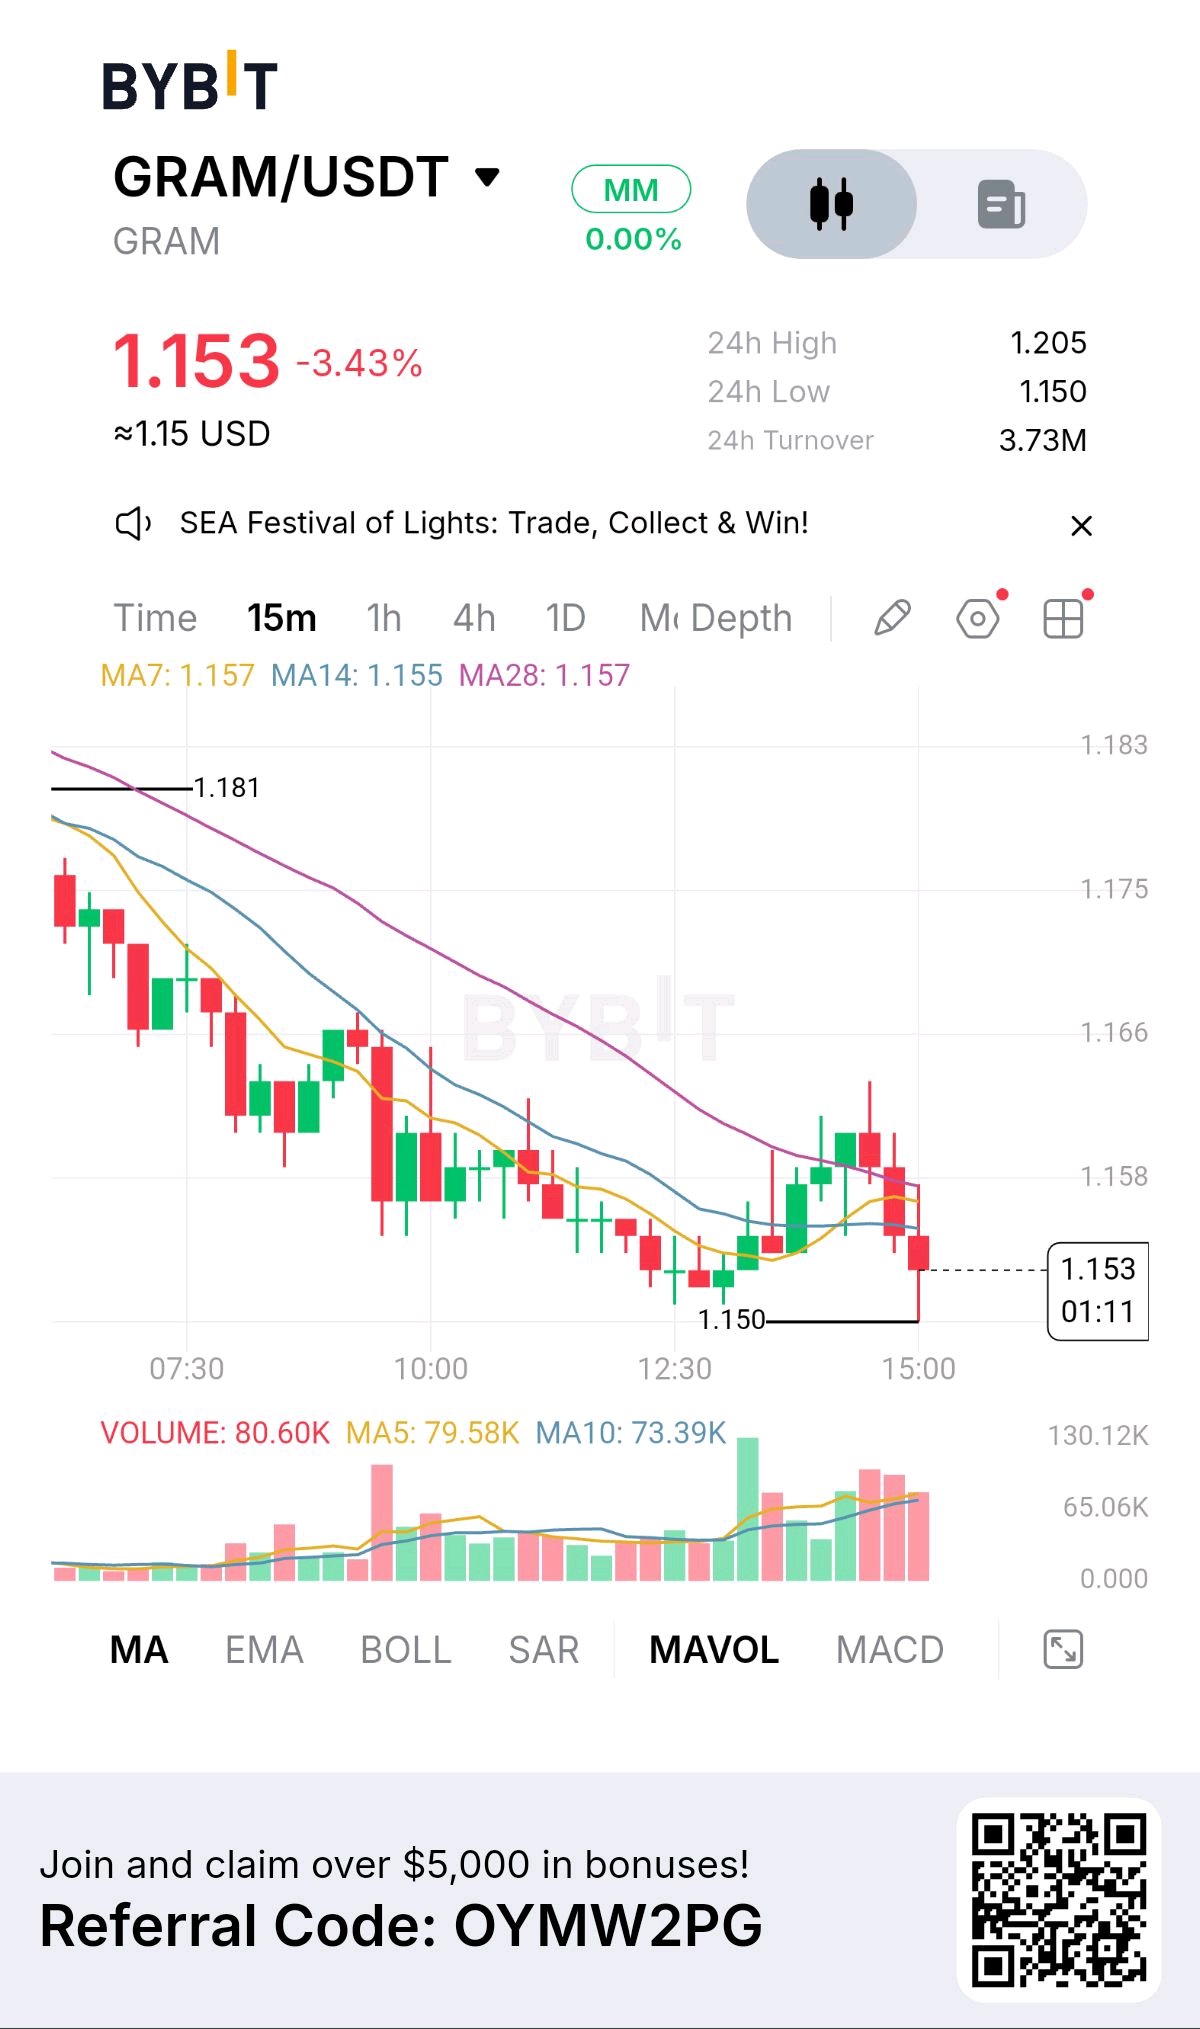
GRAM at 1.153: Support Is Under Pressure
$GRAMUSDT is struggling to regain upward momentum after a failed recovery attempt. The token is trading at 1.153, down 3.43% over 24 hours, with a high of 1.205, a low of 1.150, and turnover of 3.73M. Sellers Still Have the Advantage On the 15-minute chart, GRAM has moved from a local high of 1.181 into a prolonged decline. Although buyers managed a brief rebound from 1.150, the recovery failed to hold, leaving price near the session low. The short-term moving averages reinforce this weakness: - MA7: 1.157 - MA14: 1.155 - MA28: 1.157 With price below all three averages, the immediate trend remains under bearish pressure. Recent red volume spikes also show selling activity, while the long lower wick on the latest candle suggests some buying interest around 1.150. The Battle for 1.150 This level is now the market's immediate test. If buyers defend 1.150 and push price above the moving-average cluster at 1.157, a recovery toward 1.166 could come into focus. However, a decisive 15-minute close below 1.150 would weaken the current support structure and expose GRAM to further downside. No specific lower target is confirmed by the supplied chart data. What Could Change the Picture? A sustained move above 1.157 would challenge the bearish setup. Until that happens, the moving-average cluster remains an overhead barrier. For now, GRAM is caught between buyers defending the session low and sellers controlling the short-term structure. The next confirmed candle close could provide a clearer indication of direction. Will buyers defend 1.150, or will sellers force a breakdown below the session low?#ByXIMPACT #BitcoinSlidesBelow$80K