Ali Explorer..
567Like0Shares8Fans3Follow
just Beginning of learning 🔺
just Beginning of learning 🔺
HYPE REVERSE FROM my levels!
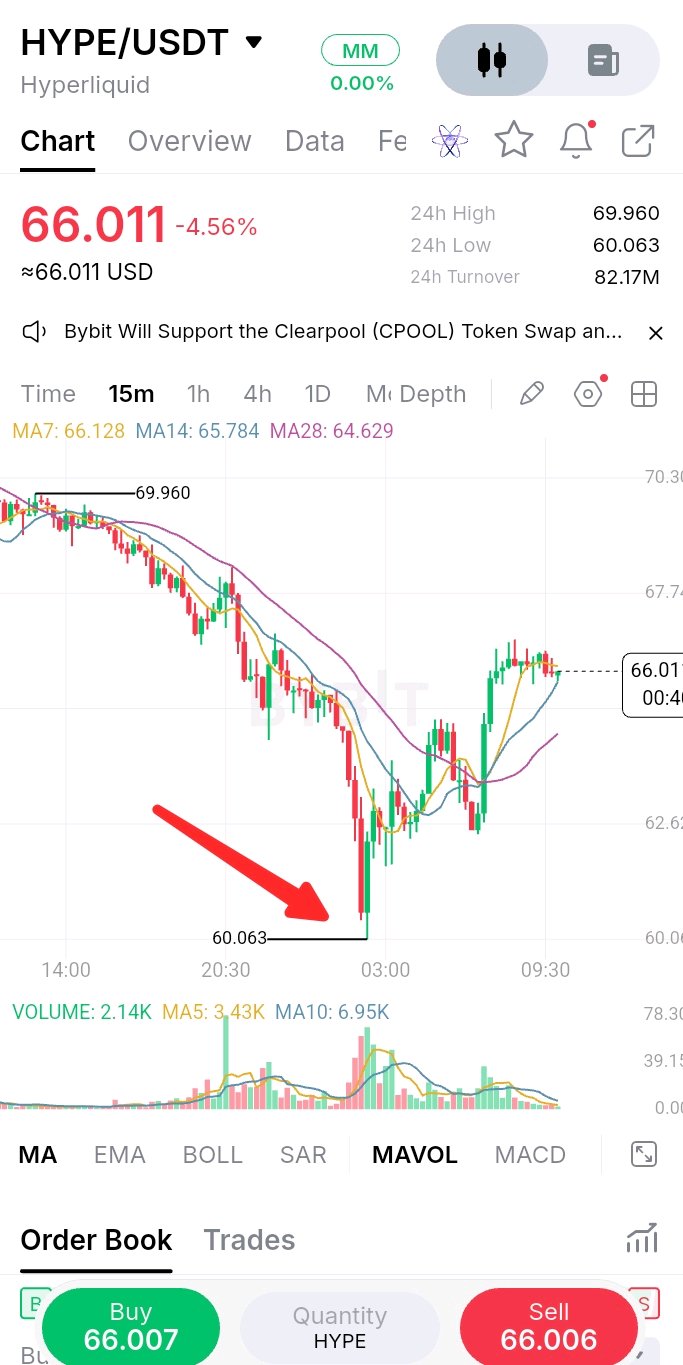
🚀 $HYPEUSDT THE BOUNCE WE WERE WATCHING! As discussed in my previous analysis, HYPE lost its $70–$71 support and moved toward the downside liquidity zone. Price swept liquidity near $60.06 and then staged a strong recovery toward $66. On the 15M chart, buyers are showing momentum, with price trading around the short-term moving averages. However, the broader downtrend is not confirmed broken yet. Key levels to watch 👀: $68–$70 resistance; $64–$65 immediate support. A sustained move above resistance could open the way toward $70–$73. For now, this looks like a recovery attempt, not a confirmed trend reversal. Watch volume and the next 4H closes before taking a position. Did HYPE finally find its bottom, or is this just a relieved... #IMPACTbyTrade
BTC bottom
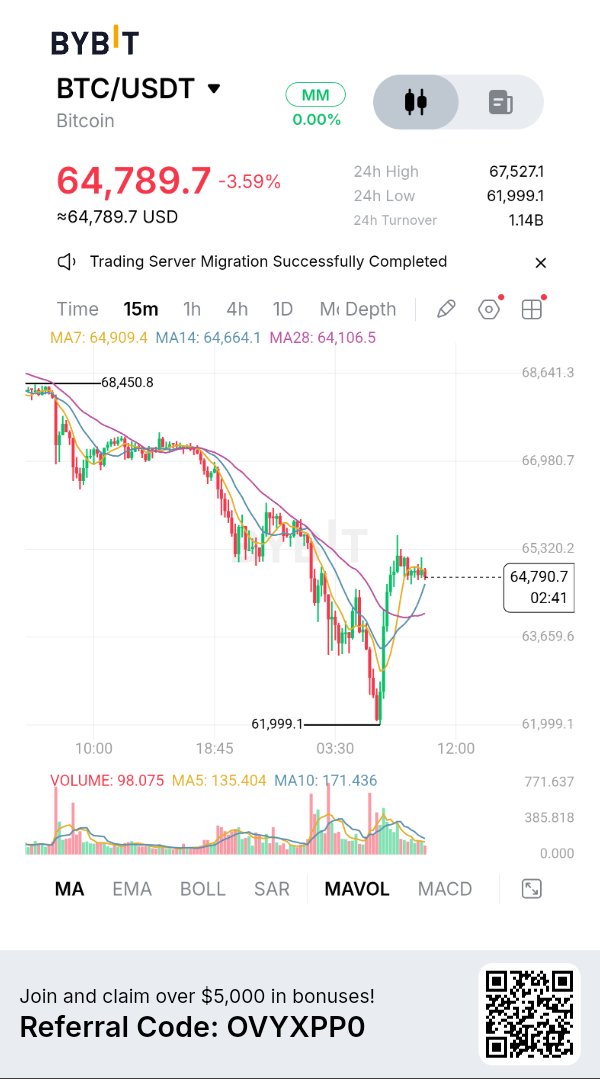
I think $BTCUSDT Bottom is near 📉 #BitcoinHitsTwoMonthLowAfterUSMidterms
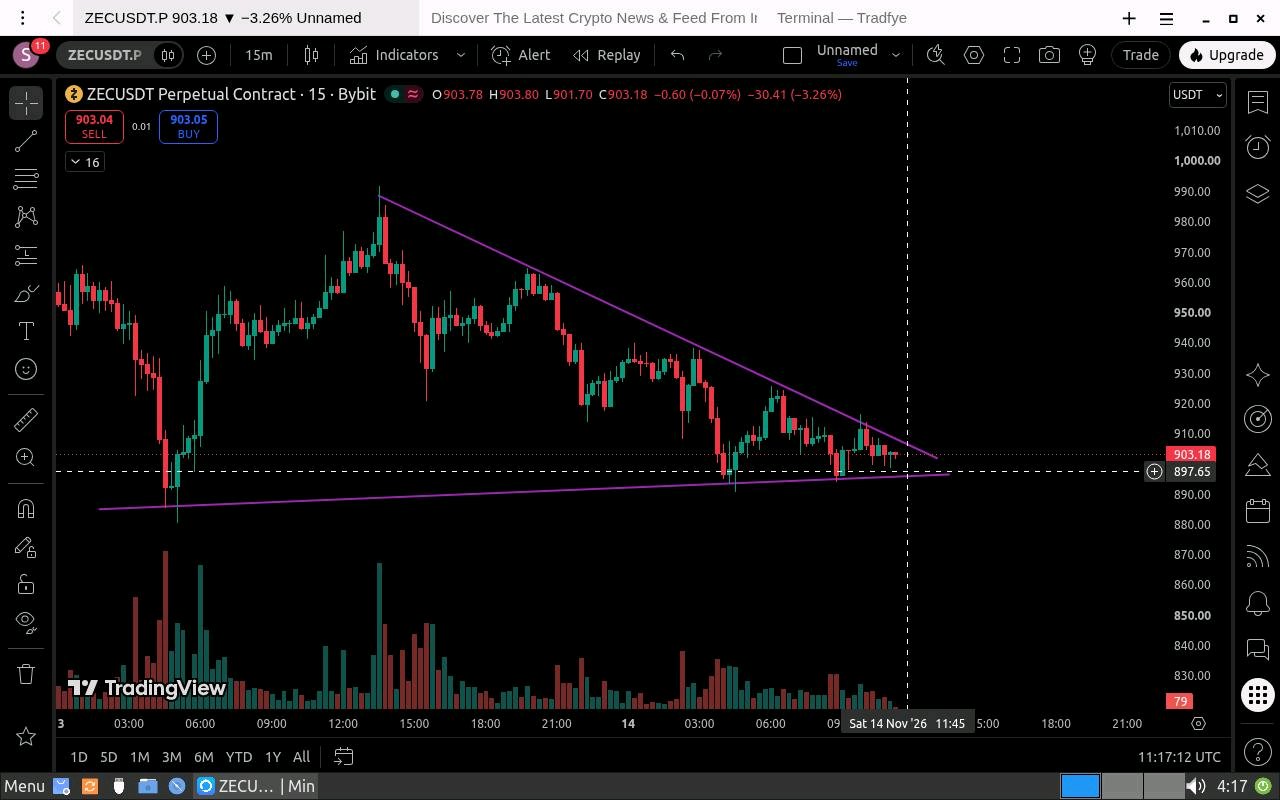
ZEC A BIG MOVE COULD BE COMING! 📊🔥
ZEC is trading around $903, squeezing inside a descending resistance structure on the 15-minute chart. Price is holding a critical support zone between $890 – $900. A breakout or breakdown could trigger the next major move. 📊 KEY LEVELS TO WATCH 👀 LONG 🎯 Target 1: $916 🎯 Target 2: $927 🚀 Final Target: $934 🛑 Stop loss: Below around $890. At $927, consider securing partial profits and moving SL to breakeven. If ZEC loses the $890–$900 support zone with a confirmed breakdown: 📉 Potential downside target: $860 🔥 THE BIG QUESTION Will ZEC break upward toward $934 or collapse toward $860? The market is approaching a critical decision zone. Don't chase the move wait for confirmation. 💡 Remember: Trade the confirmation, not the prediction. Manage your risk! What's your bias? 🐂 BULLISH or 🐻 BEARISH? #IMPACTbyTrade
Trying to Understand What Is Happening With BTC
I have been closely observing Bitcoin on the 1H timeframe, and the current market structure is showing signs of weakness. $BTCUSDT continues to form lower highs and lower lows, suggesting that sellers are still dominating the short term trend. Looking at the chart, I have mapped a possible A B C D E corrective structure. Price has recently bounced from the D wave area, but I am not considering this a confirmed bullish reversal yet. Key Technical Levels☑️ • Resistance: $69,120 • Immediate Support: $66,400–$66,500 • Next Potential Support Zone: $61,000–$63,000 if selling pressure continues. A sustained move above $69,120 could improve the short-term structure, while a breakdown below $66,400 may expose the lower support zone. Understanding the Market with Bybit AI I also used Bybit AI to understand the possible reasons behind BTC's recent decline. The analysis helped me look at the broader market picture, including: • Weakening demand and changing market sentiment. • Reduced institutional buying interest. • Derivatives positioning and the possibility of leveraged long liquidations. • Overall market uncertainty and selling pressure. According to the analysis, the current decline appears to be more related to market-wide pressure and weakening demand, potentially amplified by leverage, rather than a confirmed problem with Bitcoin itself. My Overall Market View At the moment, I am keeping an eye on the $66,400 support area and whether BTC can recover above the $69,120 resistance. If support fails, the $61,000–$63,000 zone becomes important to watch. I don't consider every bounce a reversal. I prefer to observe price confirmation, market structure and risk before making any decision. The main thing I learned from this analysis is that looking at technical structure alongside broader market conditions gives a more complete picture of what is happening. #WSOTShowYourAITradeToEarn10USDT
HYPE TREND LINE BREAK 😱
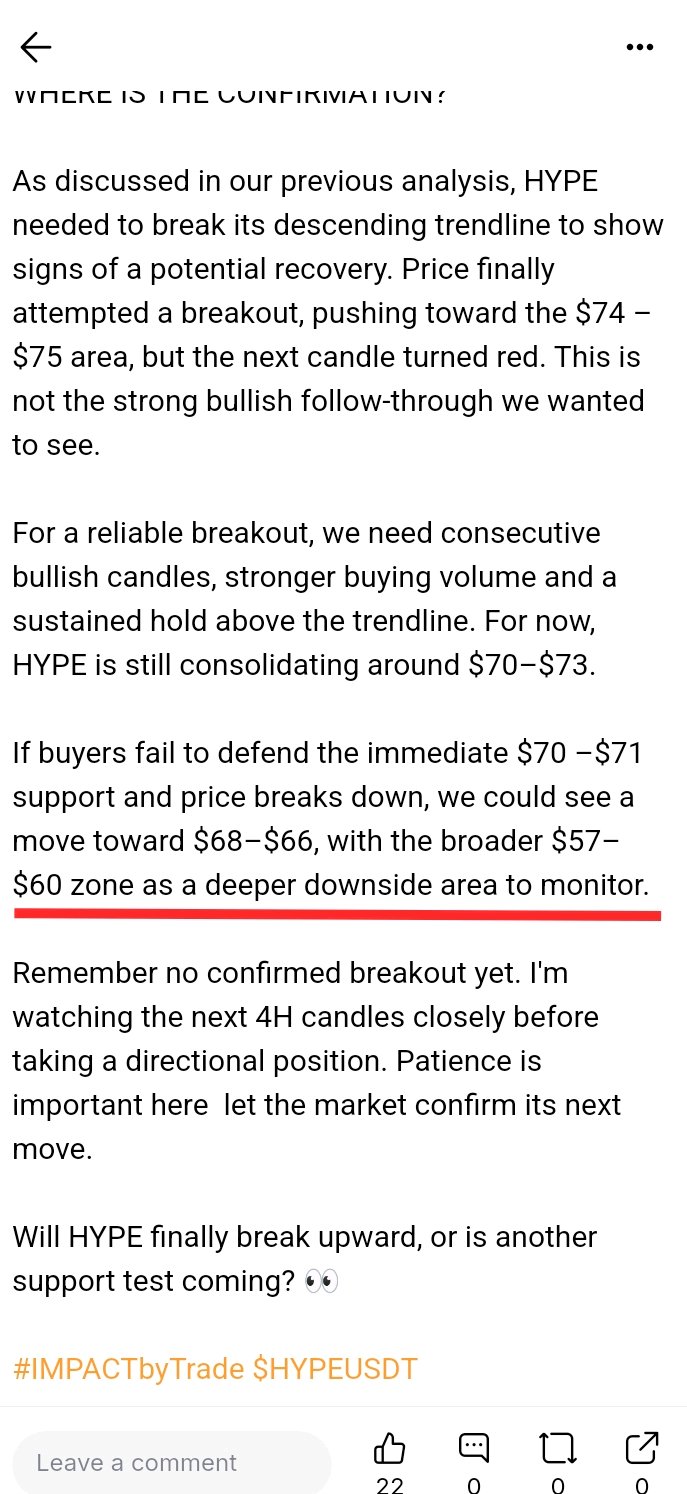
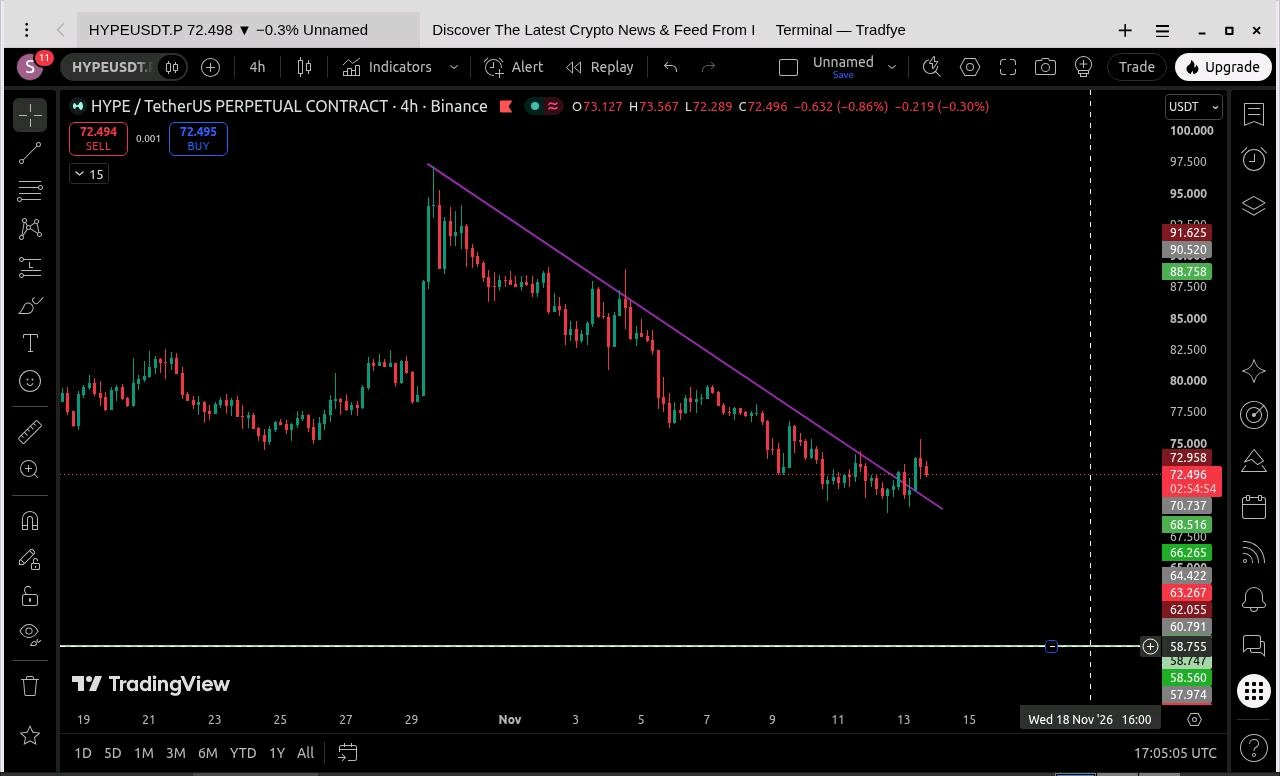
⚡ HYPE UPDATE TRENDLINE BREAKOUT BUT WHERE IS THE CONFIRMATION? As discussed in our previous analysis, HYPE needed to break its descending trendline to show signs of a potential recovery. Price finally attempted a breakout, pushing toward the $74 – $75 area, but the next candle turned red. This is not the strong bullish follow-through we wanted to see. For a reliable breakout, we need consecutive bullish candles, stronger buying volume and a sustained hold above the trendline. For now, HYPE is still consolidating around $70–$73. If buyers fail to defend the immediate $70 –$71 support and price breaks down, we could see a move toward $68–$66, with the broader $57– $60 zone as a deeper downside area to monitor. Remember no confirmed breakout yet. I'm watching the next 4H candles closely before taking a directional position. Patience is important here let the market confirm its next move. Will HYPE finally break upward, or is another support test coming? 👀 #IMPACTbyTrade $HYPEUSDT
BITCOIN TESTED DAILY FVG
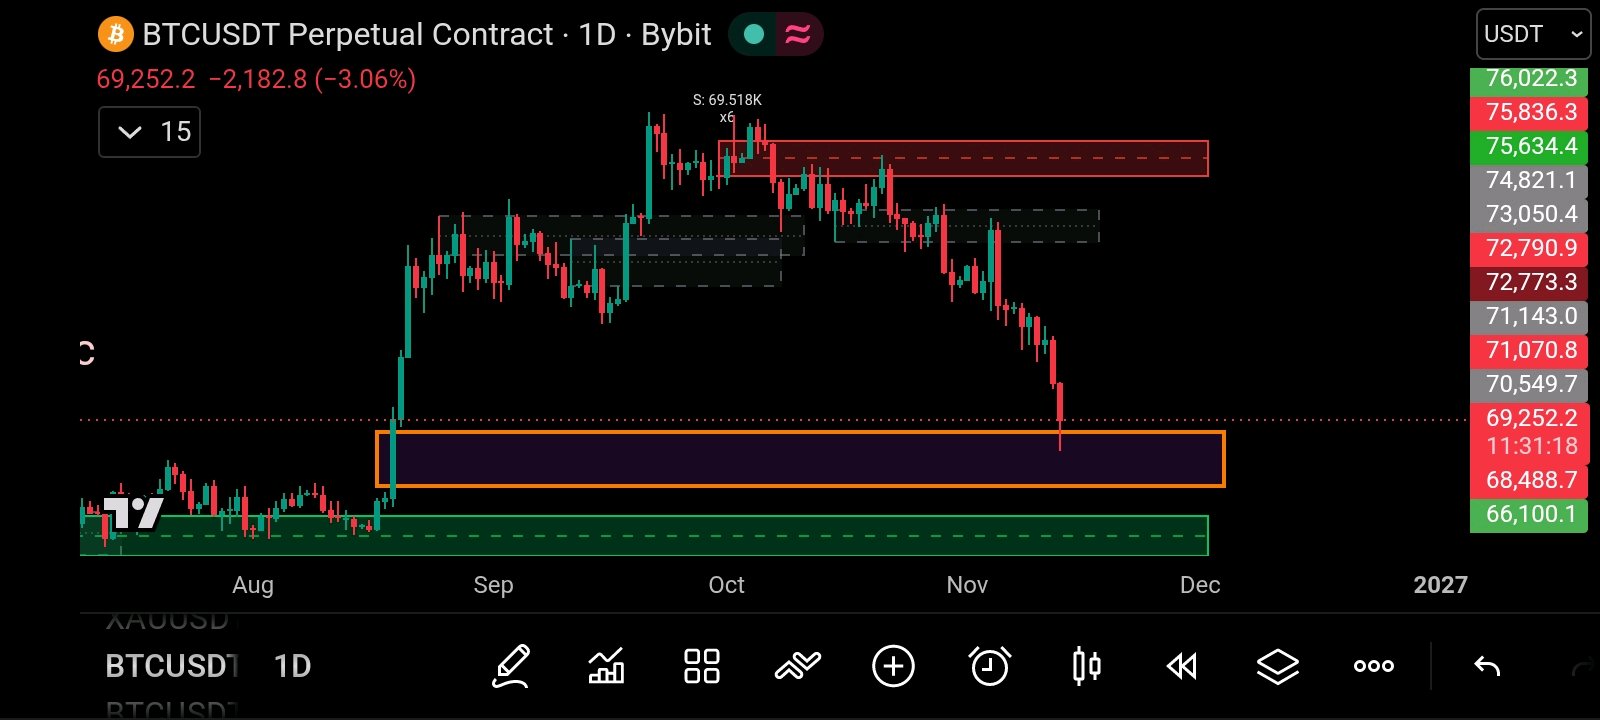
Bitcoin has officially pulled back and tested the major Daily Fair Value Gap FVG demand zone around $65K – $69K 🌐. Following the intense flash crash that liquidated over $750M in longs, price action is now printing early signs of buyer absorption at these lower levels 📉. With BTC currently stabilizing around $69,174, this zone is acting as the ultimate inflection point. Here is how we are playing the setup 🧠. The Setup: Planning a conditional LONG position off the FVG defense 🟢. Upside Target: $72,000+ Where significant overhead liquidity and previous structure converg) 🎯 Strict Stop Loss: Placed cleanly below the recent flash crash low, around $67,000 🛡️ ⚡ Execution Rule: Never trade blind hope. We need to see a strong, verified bullish reaction and a clean 1h/4h confirmation structure before pulling the trigger. If this demand zone fails to hold, we respect our risk boundaries immediately and step aside 📉. Risk management always comes first. Let’s watch the order flow closely and see if BTC can use this Daily FVG as a launchpad for recovery! 🚀 What’s your Analysis says!? Is is go to $72K , or are we testing lower? Drop your view below! 👇 $BTCUSDT #WSOTShowYourAITradeToEarn10USDT
BITCOIN Drop below 68,000 is This end!
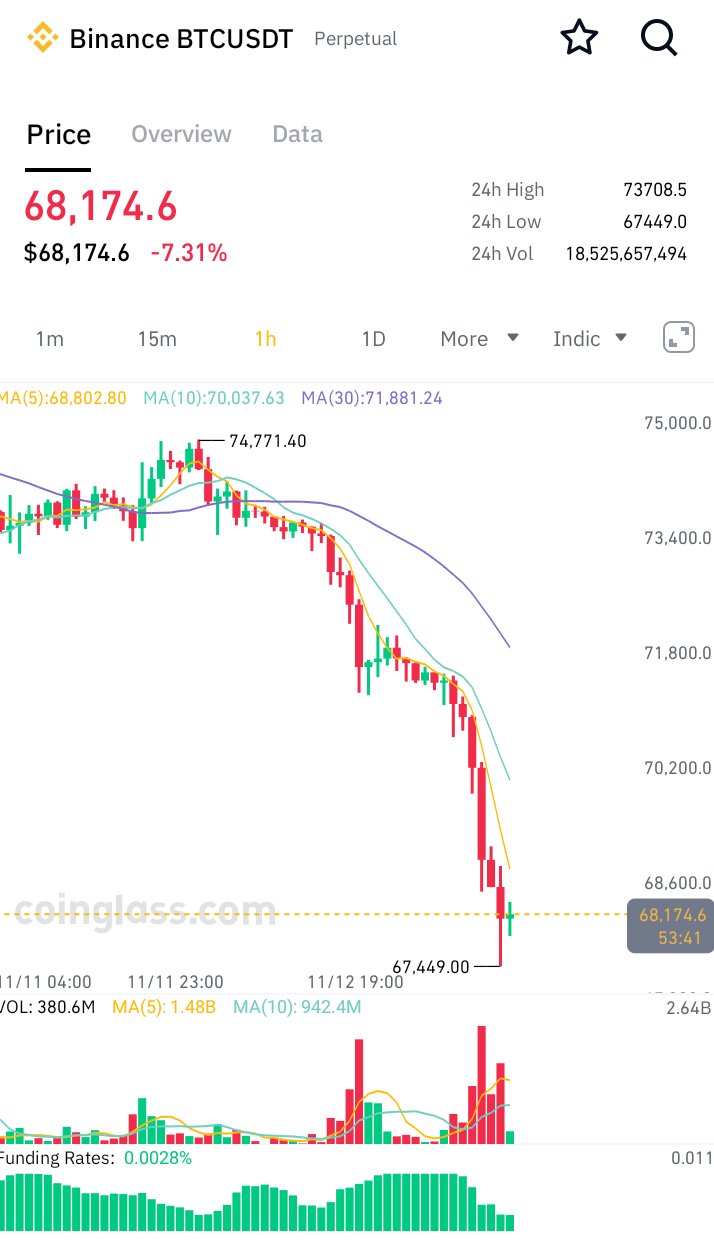
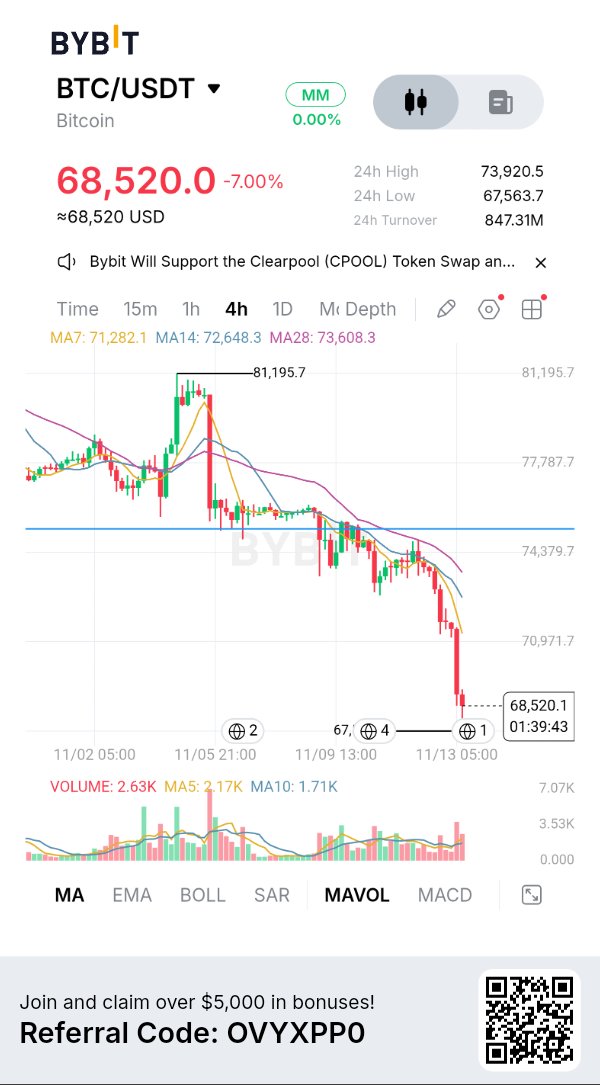
Bitcoin has fallen below $69,000 for the first time in nearly two months, triggering one of the larger leverage resets of recent weeks. After trading near $81,000 last week, $BTCUSDT slid under the $69,000 level on November 13. The move forced roughly $1.4 billion in liquidations across crypto derivatives markets, with long positions accounting for the vast majority of the damage. More than 170,000 traders were liquidated in the cascade. Bitcoin linked liquidations alone totaled around $740 million, while Ethereum saw roughly $250 million wiped out. The broader crypto market followed lower, with total market capitalization dropping about 5–6% to roughly $2.3 trillion. Analysts are framing the sell off primarily as a deleveraging event rather than a fundamental breakdown. Dense clusters of leveraged longs sat just below $70,000. Once that level broke, automatic liquidations accelerated the decline. Macro factors added pressure: recent spot Bitcoin ETF outflows, a stronger U.S. dollar, weakness in tech stocks, and hotter inflation data that raised expectations for tighter financial conditions. Altcoins mirrored the move. Ethereum $ETHUSDT dropped toward the $1,900–$1,925 range, XRP hovered near $1, and names like SOL and DOGE posted losses of 5–9%. The key signals to watch from here are leverage metrics open interest and funding rates, spot ETF flows, and whether Bitcoin can stabilize in the high $60,000s. If forced selling slows and outflows calm, the market could shift into more orderly trading. Renewed heavy leverage, however, would leave it vulnerable to further volatility. In short, this was a sharp leverage flush against a risk off backdrop painful for overextended longs, but not yet a clear structural break in the broader Bitcoin thesis. #ByXIMPACT

Bitcoin just lost the $69K level
$BTCUSDT dropped below $69,000 for the first time in nearly two months, falling from around $81K last week. The move triggered roughly $1.4 billion in liquidations, with the vast majority coming from long positions. Over 170,000 traders got wiped out in the cascade. This looks more like a leverage flush than a fundamental breakdown. Crowded longs below $70K got hit hard, while ETF outflows, a stronger dollar, and broader risk-off sentiment in tech added pressure. Altcoins followed $ETHUSDT slid toward $1,900 – 1,925, XRP hovered near $1. Key things to watch now: - Whether leverage continues to reset - Spot ETF flows - If BTC can hold the high $60Ks Classic leverage reset against a risk off backdrop. #WSOT2026 #BitcoinHitsTwoMonthLowAfterUSMidterms #USInflationRunsHotAndRateHikeBetsRise

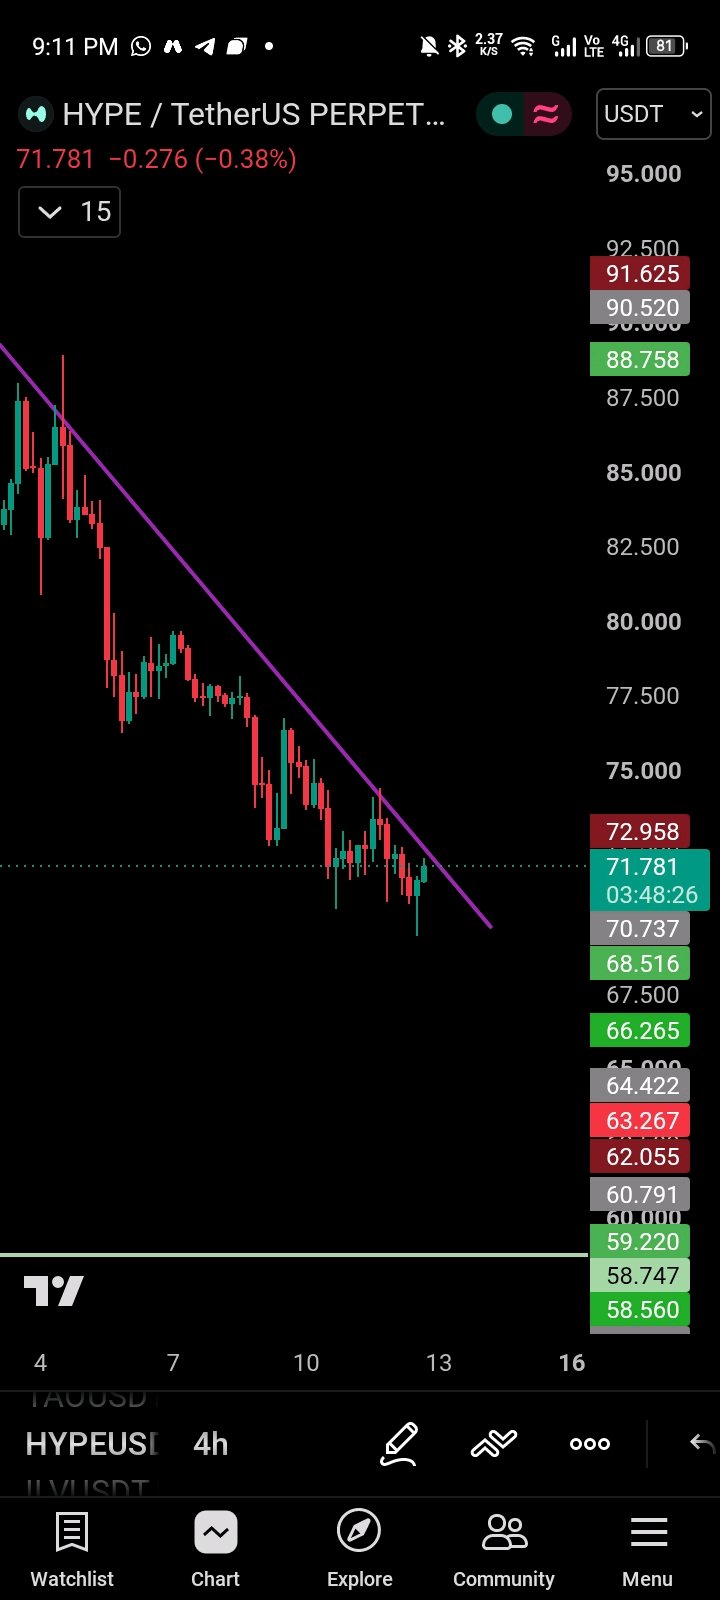
$HYPEUSDT BUYERS ARE SHOWING UP! As expected from our previous analysis, HYPE has swept liquidity below the $70 support zone, which is now showing signs of acting as a demand area. Buyers are attempting to push price upward, but the overall trend remains bearish, with sellers still in control. The key level to watch is the descending trendline a confirmed breakout with strong volume could trigger a recovery, while another rejection may bring further downside. This is a critical moment, so every micro move matters. Let's see: breakout or breakdown? 👀 #HYPEUSDT #IMPACTbyTrade
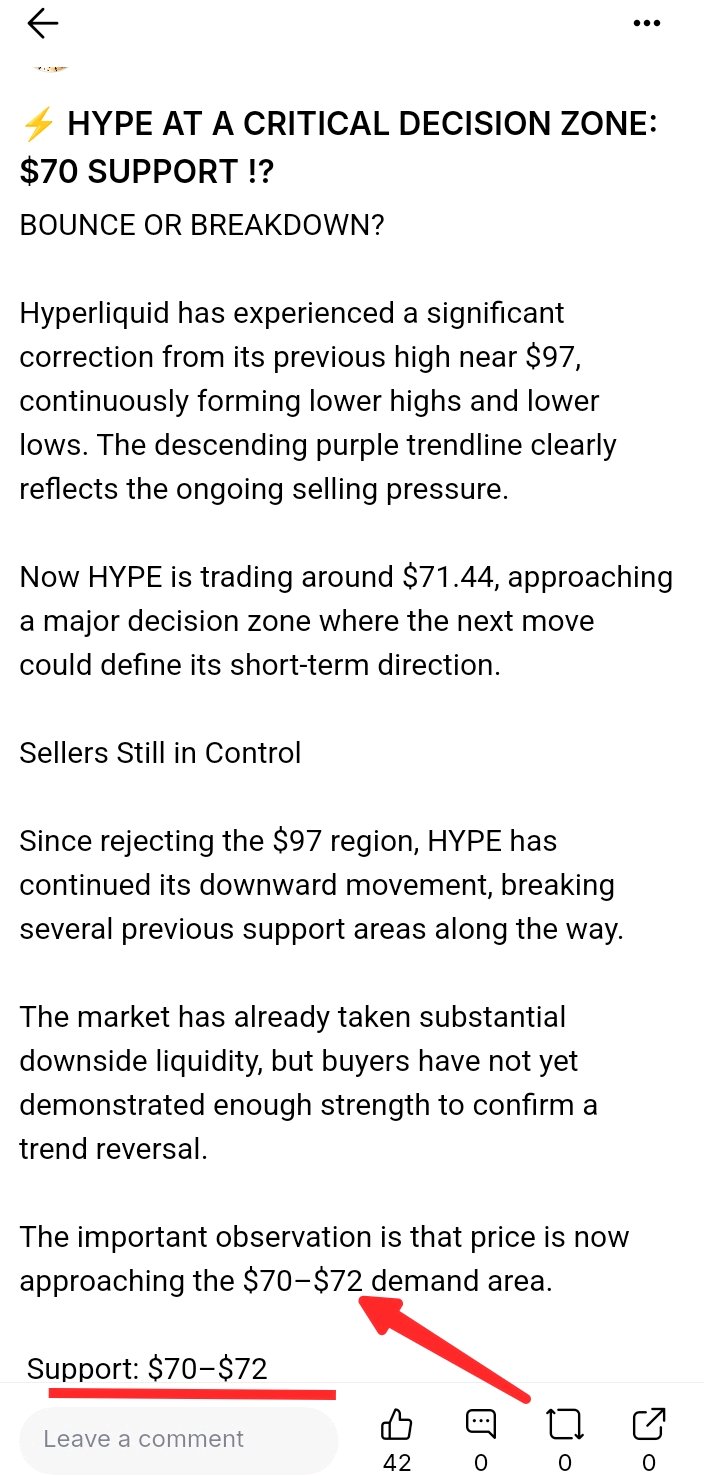
⚡ HYPE AT A CRITICAL DECISION ZONE: $70 SUPPORT !?
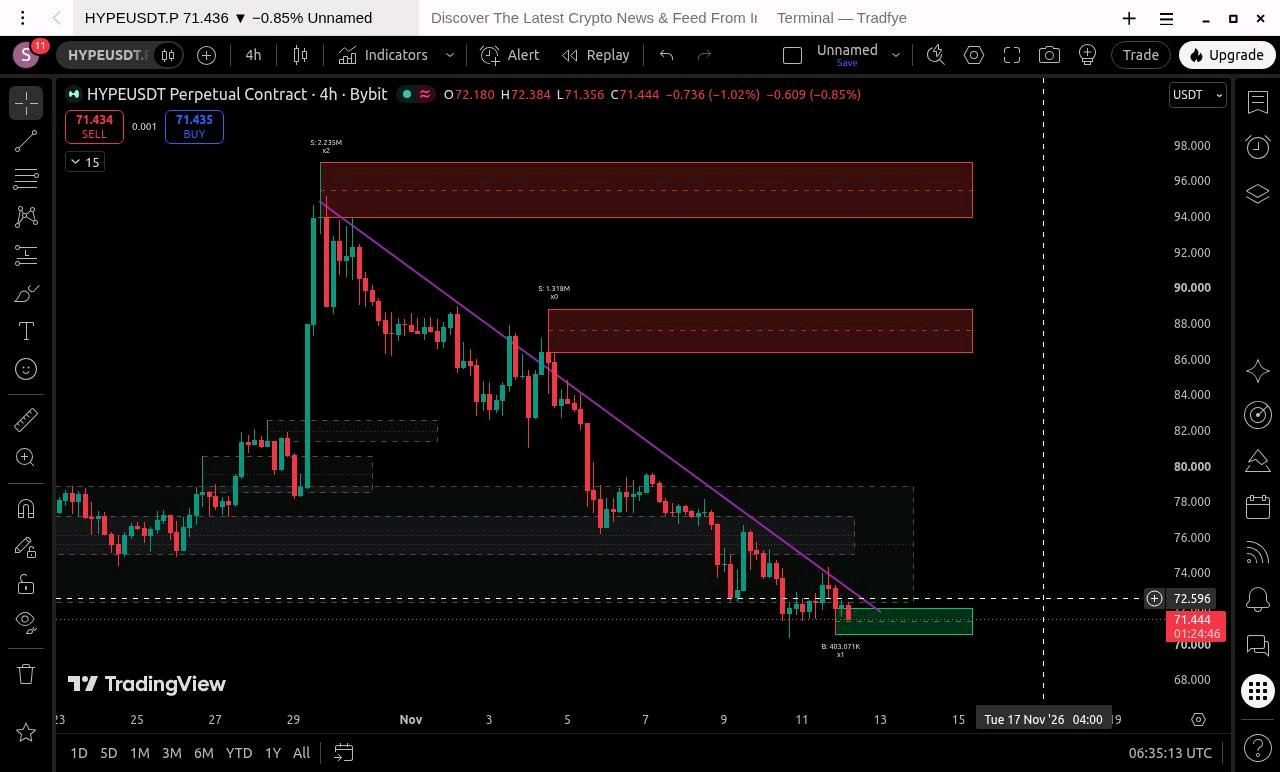
BOUNCE OR BREAKDOWN? Hyperliquid has experienced a significant correction from its previous high near $97, continuously forming lower highs and lower lows. The descending purple trendline clearly reflects the ongoing selling pressure. Now HYPE is trading around $71.44, approaching a major decision zone where the next move could define its short-term direction. Sellers Still in Control Since rejecting the $97 region, HYPE has continued its downward movement, breaking several previous support areas along the way. The market has already taken substantial downside liquidity, but buyers have not yet demonstrated enough strength to confirm a trend reversal. The important observation is that price is now approaching the $70–$72 demand area. Support: $70–$72 This is the immediate zone I'm watching. Price is consolidating near this support while the descending trendline is approaching the same area. Two scenarios are possible: Bullish scenario If buyers defend $70–$72 and price breaks above the descending trendline with strong volume, we could see a recovery toward $75 – $76, followed by a possible move toward $78. Bearish scenario But If sellers remain in control and HYPE decisively breaks below $70, the next potential downside area could be around $66, where a daily-timeframe FVG is worth monitoring. For now, the immediate confirmation levels are: - $70–$72: Major support and demand zone. - $72.60: Immediate reclaim level. - $75–$76: First recovery resistance. - $78–$79: Next upside liquidity/resistance area. - $86–$89: Higher resistance zone. - $94–$97: Major overhead supply. A 4H close above the descending trendline, supported by increased buying volume, would strengthen the recovery scenario. On the other hand, repeated rejection from the trendline followed by a breakdown below $70 would favour further downside. Fundamental Perspective❓ There is also an interesting development on the fundamental side: Upbit announced HYPE trading against KRW, BTC and USDT on November 10, expanding its market access in South Korea. This is a positive development for accessibility and potential liquidity, but it has not yet reversed the bearish price structure. A listing alone does not guarantee buying pressure. HYPE has fallen significantly from its $97 high and is now approaching a major support zone around $70–$72. In my view, this is the market's next important decision point. If buyers finally break the descending trendline with strong volume, a recovery toward $78 becomes possible. But if the $70 support fails, we could see another downside extension toward the $66 daily FVG area. For now, I'm watching two things very closely👀: the $70 support and the descending trendline breakout. Let's see which side takes control. #ByXIMPACT $HYPEUSDT
ZEC SUPPORT BREAK CONFIRMED 👌 BEARS TAKE CONTROL
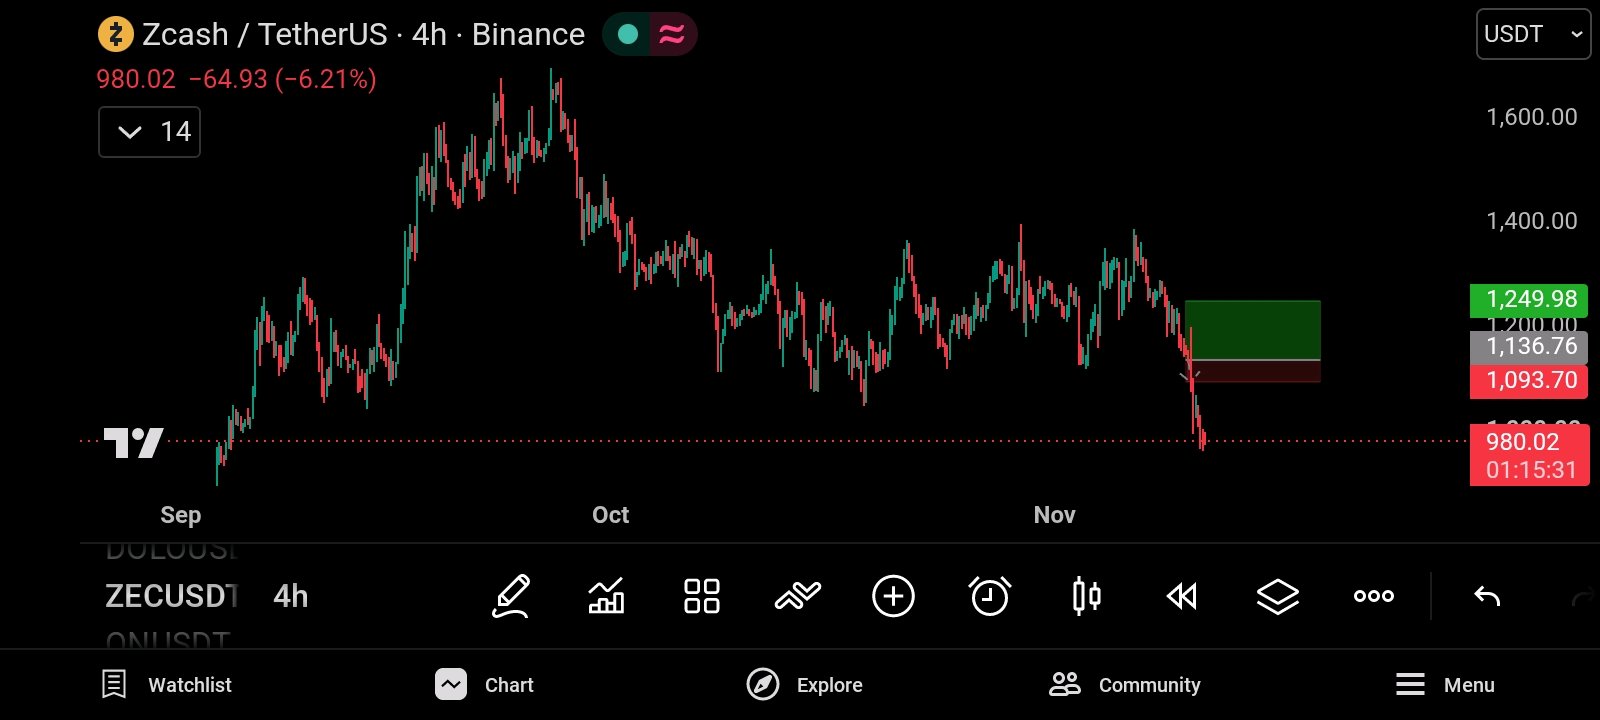
Remember my previous analysis? I highlighted the possibility that ZEC could lose its important support after repeated tests. That scenario has now played out. ZEC briefly bounced from the $1,136 region toward $1,198, but buyers failed to maintain momentum. Sellers returned aggressively, broke the support structure and pushed price toward $980. So What Changed? The previous support zone failed to hold, and the recovery attempt was rejected. This suggests that buyers are losing control and that the market may be transitioning into another bearish phase. My current downside outlook is: - $980: Current chart reference area. - $910: First short target. - $800: Broader downside zone to watch. A sustained recovery above the broken support region would weaken this bearish scenario. Is Zcash Actually Weak? Interestingly, Zcash's fundamental developments are not entirely bearish. NU7 Network Upgrade: Zcash activated its major NU7 upgrade on November 6, reducing target block intervals from 75 seconds to 25 seconds. It also introduced a Network Sustainability Mechanism that directs 60% of transaction fees into a reserve. These are meaningful long-term infrastructure improvements. Privacy Ecosystem Growth: CoinDesk Research reported that Zcash's Ironwood shielded pool gained approximately 122,000 ZEC in October, while total shielded supply increased by around 27,000 ZEC to approximately 4.97 million ZEC. Institutional Interest: Grayscale's Zcash ETF share count reportedly grew by 54.2% between its August listing and October 30, indicating growing institutional exposure. However, there are also concerns. Around 12,224 ZEC remained in the retired Sprout pool following NU7 activation, and October shielded transaction activity averaged approximately 4,450 transactions per day, down around 36% from September. The interesting part is that Zcash has meaningful long term development progress, yet its price structure has weakened considerably 📉. This suggests that positive fundamentals are not currently providing enough immediate buying pressure to overcome selling activity. My short-term outlook remains cautious to bearish unless price reclaims the broken support region. My Trading Plan 🔸 Short target: $910 Broader downside area: $800 Stop loss: $1,120 I will monitor whether sellers maintain control and whether price continues forming lower highs. Risk management is essential. If entering around $980, the $1,120 stop represents approximately $140 of risk against a $70 move to the $910 target. That is only around 0.5:1 reward to risk, so the entry, target or position sizing deserves careful reassessment. #ByXIMPACT
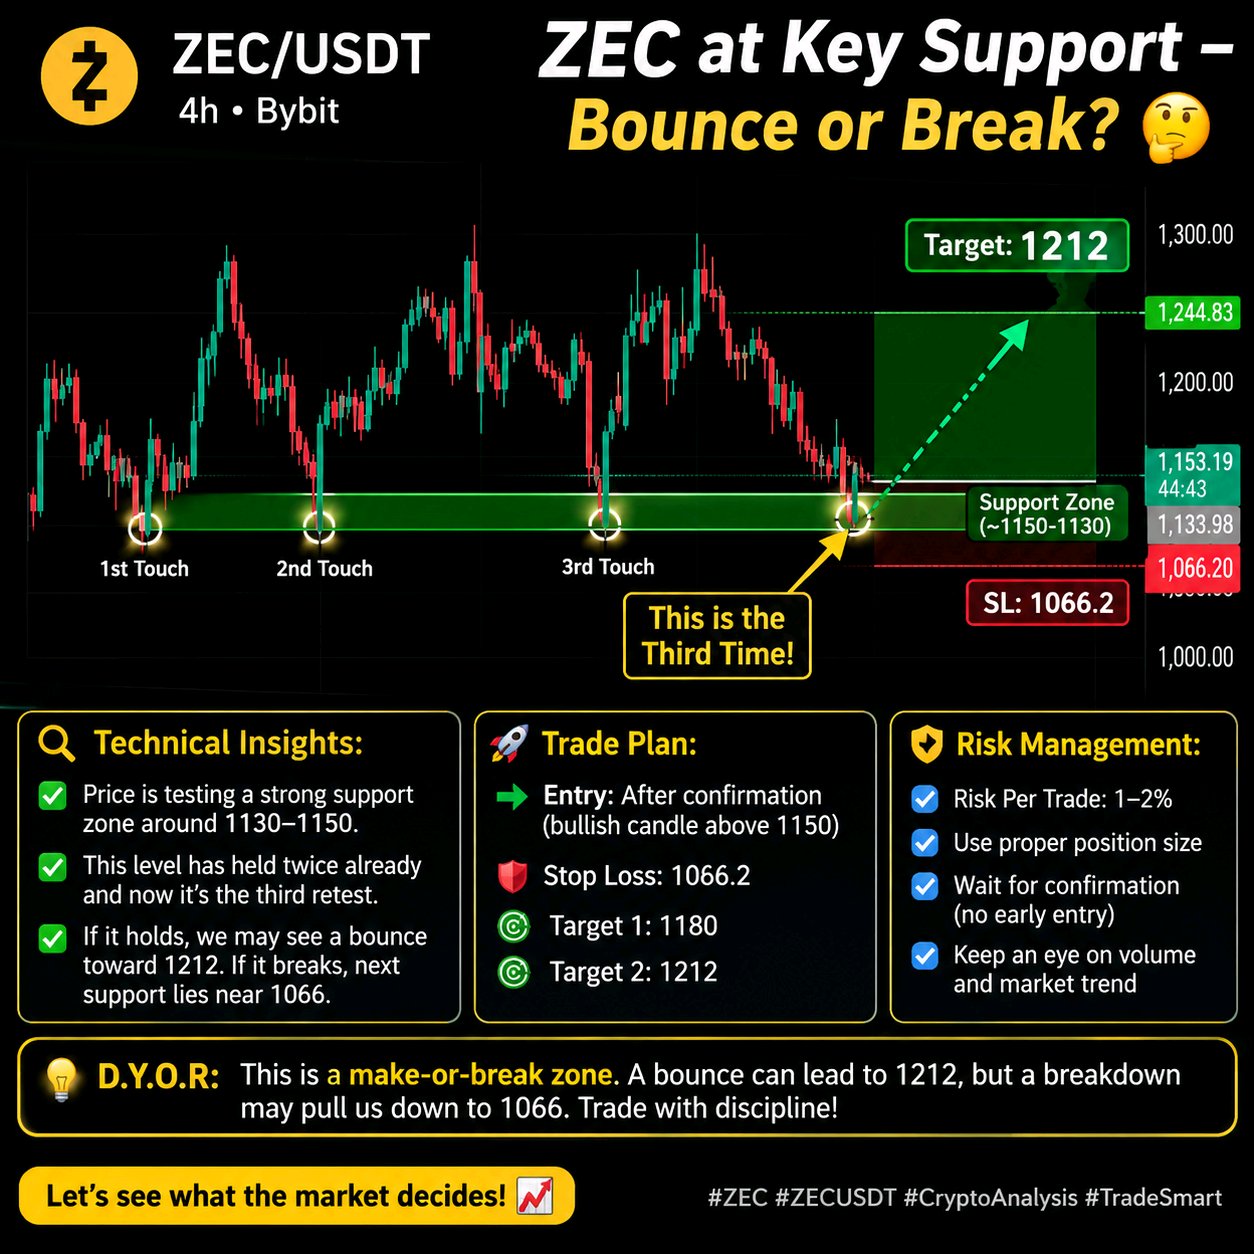
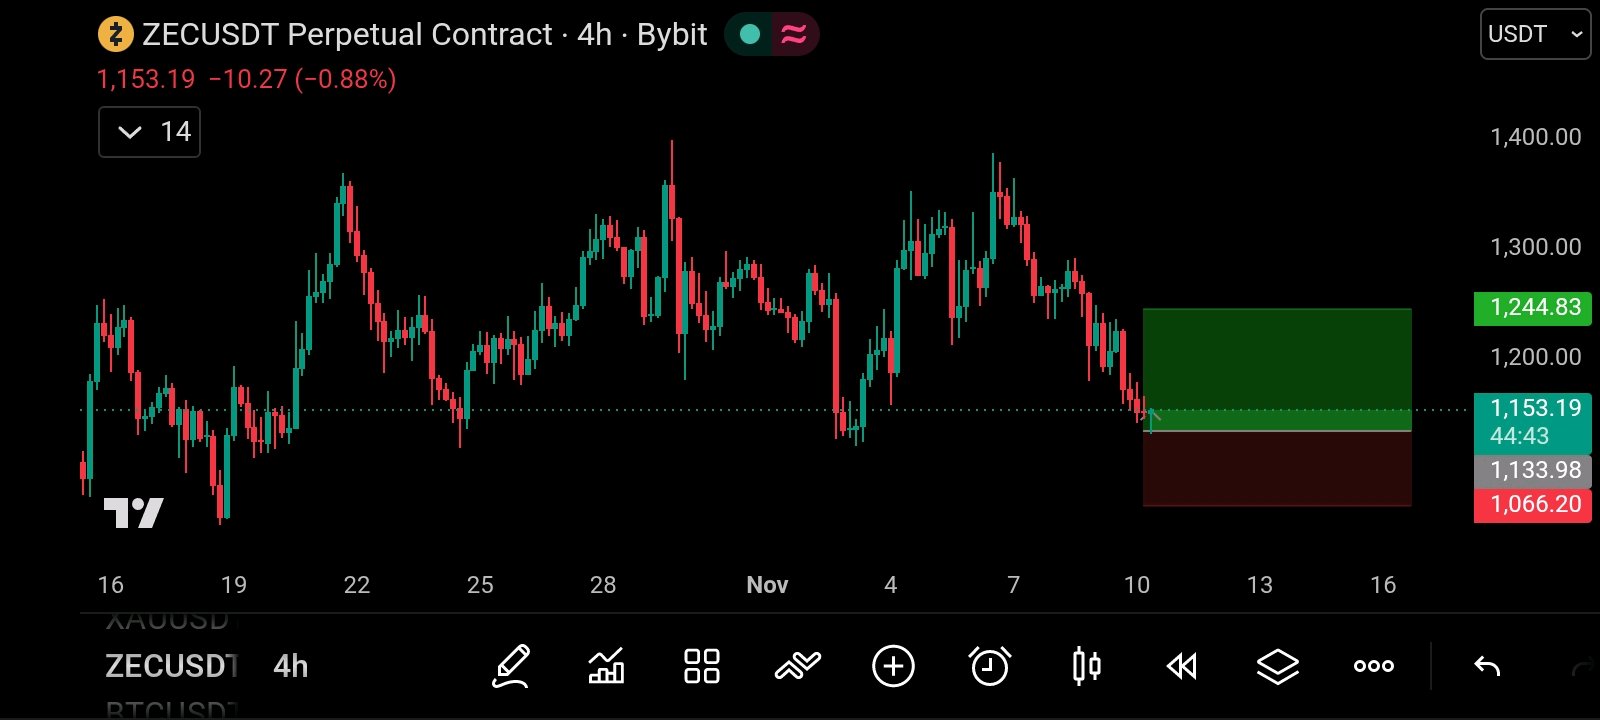
⚡ ZEC THIRD TEST OF SUPPORT BOUNCE OR BREAK?
ZEC is currently trading around $1,153, testing the important $1,134 – $1,153 support zone for the third time on the 4H chart. If buyers defend this area and we get a strong bullish confirmation, I'm interested in a potential LONG, targeting $1,212. My planned stop loss is $1,066.20. However, if support breaks decisively, the bullish setup is invalidated and further downside is possible. I'll wait for confirmation before entering no blind trades. Position sizing and risk management are essential, especially at a third support retest. Will ZEC bounce from here or finally break support? Let's see what the market decides! 👀 DYOR. Manage your risk and never trade blindly. #ByXIMPACT
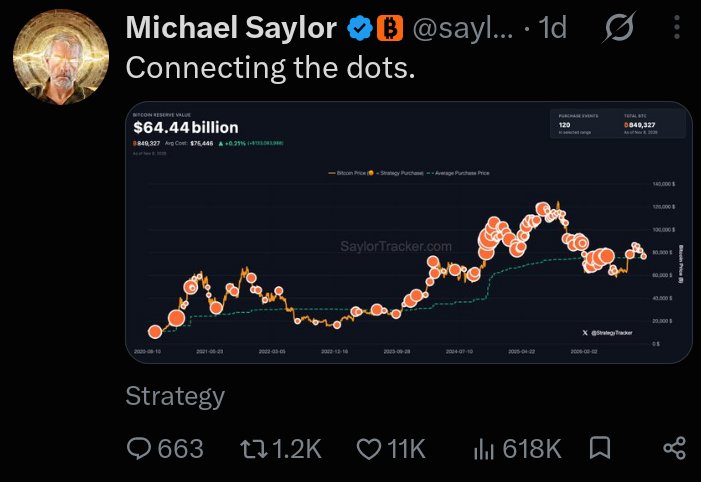
Michael Saylor dropped another Bitcoin tease!
"Connecting the dots" The Strategy chairman's latest X post has sparked speculation about another potential $BTCUSDT purchase. But there's a bigger story behind it. 🧵👇 🟠 Strategy reportedly holds 849,327 BTC, worth approximately $62.98 billion. 📉 Bitcoin falling below Strategy's average purchase price of $75,451 has pushed its holdings into roughly $1 billion in unrealized losses. Just a month ago, Strategy was reportedly sitting on nearly $10 billion in unrealized profits. A dramatic market reversal! 🐻 Bitcoin's Q4 2026 weakness is drawing comparisons with previous bearish cycles in 2014, 2018 and 2022. 📊 Analysts are also warning about weakening momentum, with BTC approaching its fifth consecutive weekly red candle. 💰 Despite the pressure, Strategy reportedly maintains $4.9 billion in USD reserves and recently acquired $208 million worth of STRC. 👀 Now everyone's watching Michael Saylor. Does "Connecting the dots" hint at another Bitcoin purchase? Or is it simply another message about his long term BTC conviction? One thing is clear that Strategy's Bitcoin strategy is facing another major market test. #IMPACTbyTrade #MidtermsMarketWatch
Bybit Expands European Presence With Web Summit
Bybit is strengthening its position in Europe's digital financial sector through its partnership with Web Summit 2026 in Lisbon, following key regulatory approvals in Austria. 🗝️ Taking place from November 9 –1 2, Web Summit 2026 will provide Bybit with an opportunity to showcase its European strategy, financial technology innovations and growing focus on artificial intelligence. A major milestone in the company's expansion is the regulatory progress achieved by its European operations. In May 2025, Bybit EU GmbH received authorization as a Crypto-Asset Service Provider (CASP) under the European Union's MiCA framework. More recently, in August 2026, Bybit Payments GmbH secured an Electronic Money Institution (EMI) license from Austria's Financial Market Authority. These approvals establish a foundation for Bybit to expand its regulated crypto, electronic money and payment services across the European Economic Area. During Web Summit, Bybit executives will participate in discussions about cryptocurrency regulation, AI-powered financial infrastructure and the future of digital finance. The company will also host a masterclass focused on autonomous trading agents. Beyond cryptocurrency trading, Bybit is exploring opportunities in payments, U.S. equities, ETFs and investment services. With more than 80 million users worldwide, Bybit is positioning itself as a broader digital financial platform, combining cryptocurrency services, traditional financial products and emerging AI technologies. Bybit's European expansion highlights the growing convergence between cryptocurrency$BTCUSDT , traditional finance and artificial intelligence, as exchanges compete to become comprehensive financial service providers. #BybitAIEvolving
BNB Chain Dominates Daily Activity
🔥$BNBUSDT Chain just hit 4.86 million active addresses in the last 24 hours ranking #1 among all public blockchains. For comparison: • Solana → ~1.97M • Ethereum → ~535K • Base → ~312K That’s roughly 2.5x Solana and 9x Ethereum in daily active addresses.$SOLUSDT Strong on chain activity continues even as BNB price sits near $684. #NovUSCPIWatch #BybitAIEvolving #WSOT2026

BTC next year !?
Guys what is your analysis about $BTCUSDT for next year 🙃 ? Are we heading towards another massive bull run, or should we expect a major correction? 🤔📈 Would love to hear your thoughts and predictions! 🚀
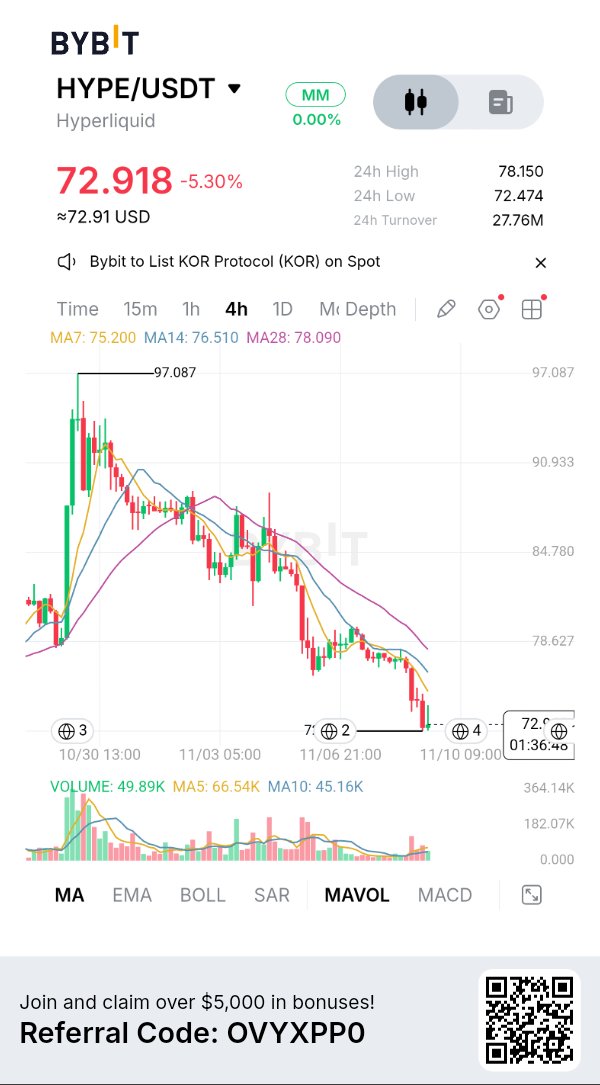
HYPE has pulled back significantly from its $97 peak and is working to build a base at $72.00 – $75.00 🌐⚡. While ecosystem fundamentals like the Elysium L2 launch are strong, price action demands patience 📊. The key level to watch is $75.20 — reclaiming it is the first true signal of recovery 💎📈. Keep your position sizing disciplined and let the market confirm the reversal! What’s your take? Are you buying the $72 support or waiting for a $75.20 reclaim? Drop your thoughts below! 👇$HYPEUSDT #IMPACTbyTrade
🚀 SOLANA: RECOVERY INCOMING?
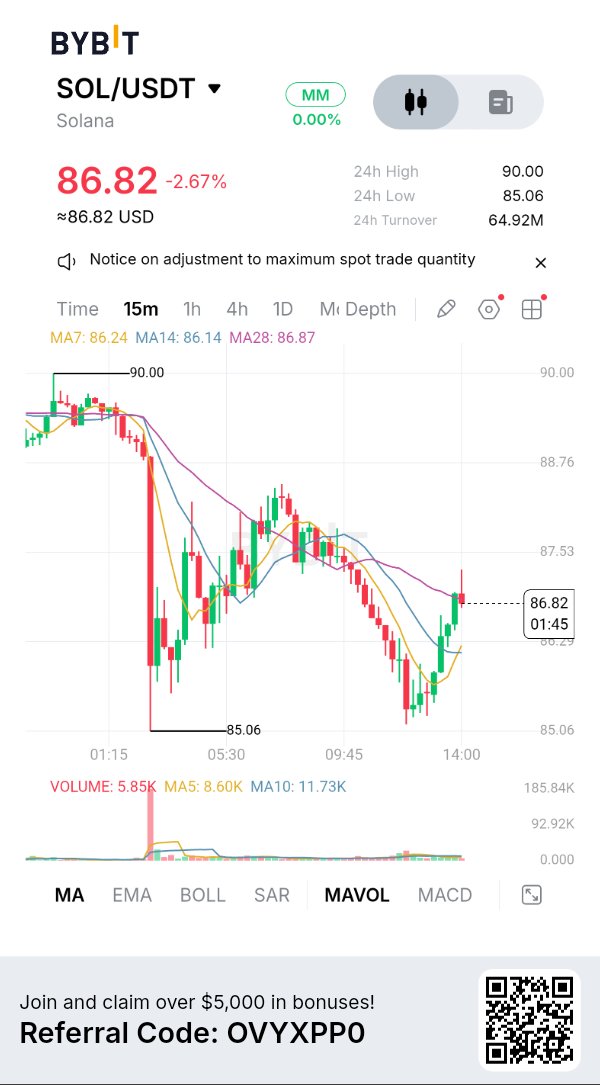
$SOLUSDT dropped sharply from the $96 resistance zone toward $85, but buyers are now showing some strength on the 15-minute chart. If SOL reclaims $88.25 with confirmation, we could see a recovery toward $90 and potentially $92. A long setup may develop, but the 4H trend remains bearish, so patience and proper risk management are essential. Can SOL make a comeback? 👀📈 #SOLUSDT #NovUSCPIWatch #WSOT2026
🚨 $344M IN BITCOIN MOVES
A massive Bitcoin transfer has put Trump Media under the market spotlight. Wallets labeled “2028 Convertible Notes Collateral” reportedly moved 4,259 BTC, worth approximately $344 million, to a Crypto.com address in two transactions. That's nearly 30% of Trump Media's reported Bitcoin holdings. But a transfer doesn't automatically mean a sell off. Similar movements in May and August reportedly did not lead to market liquidation, suggesting custody restructuring or collateral management could be behind the latest move.$BTCUSDT The bigger concern is November 30. According to the reported securities filings, noteholders may have the right to demand up to $1 billion in cash redemptions. With previously reported cash reserves of around $425 million, investors are watching closely for any signs of asset sales or further collateral arrangements. The key question: Is this simply institutional balance-sheet management, or could Bitcoin become a source of liquidity for upcoming corporate obligations? For now, the transfer is confirmed by the reported on-chain movement, but an actual Bitcoin sale has not been established. Don't confuse wallet activity with market selling pressure. 📊 #WSOT2026 #NovUSCPIWatch #USPayrollsAndRateDecisionsDriveMacroWeek

Bitcoin on Decision point
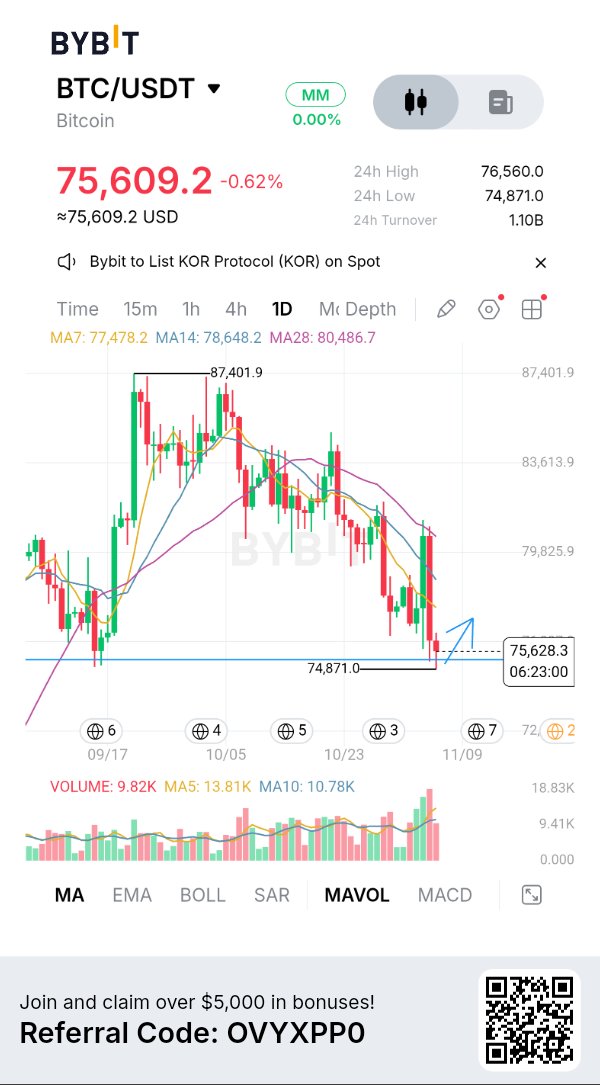
$75K SUPPORT — WILL BULLS DEFEND THE FLOOR? 🚀 Bitcoin is currently pressing into the critical $75,000 support region after a continuous pullback from local highs near $87,400 🌐. The Daily chart highlights a liquidity sweep down to $74,871, putting the market at a pivotal make or break juncture 📈. This is a major key level where buyers need to step in to prevent a deeper macro correction. Can $BTCUSDT stabilize here and launch a recovery toward $78,000–$80,000, or do we need further downside liquidity before a true bounce? Let’s break it down 🧠. 1. The $75K Support Test: Key Observations 🔍 Price action on the 1D timeframe shows clear selling pressure dragging BTC below its moving averages (MA7: $77,478, MA14: $78,648, MA28: $80,486) 📉. Liquidity Sweep: BTC swept lower to $74,871 before absorbing immediate selling pressure, leaving a small wick on the daily candle 🟢. Volume Profile: Daily volume shows persistent selling, but volume is beginning to contract near the support floor, indicating potential seller exhaustion 🛡️. 2. The Recovery Targets: What Bulls Need to Claim 🧱 If buyers defend this daily support floor, the primary objective will be reclaiming the overhead moving averages 📊. Immediate Resistance: $77,400 – $78,600 (Confluence of MA7 and MA14) 🛑 Major Breakout Target: $80,400 MA28 defense line 🚀 Extended Upside Target: $83,600 – $87,400 Macro swing high reclamation 🎯 The Bullish Scenario: A strong daily candle close back above $76,500 confirms aggressive buying interest, opening the doors for a rapid relief rally toward $78,000–$80,000 ⚡. The Cautionary Scenario: If BTC fails to hold the $74,800 low and loses daily support, the market risks extending its pullback toward lower demand zones before establishing a permanent bottom 📉. 🎯 Key Levels to Watch 👀 Current Resistance: $77,478 MA7 line 🛑 Major Breakout Zone: $78,600 – $80,486 (MA14 & MA28 confluence) 🟢 Critical Support Floor is $74,871 – $75,000 Local low & daily demand 🛡️ Macro Upside Target: $78,000 – $80,000 (Relief rally targets)$XRPUSDT 🎯 for now Bitcoin is putting buyers to the test at the $75,000 support zone 🌐⚡. While a bounce toward $78,000–$80,000 remains a solid high-probability scenario, we still need actual buying volume and a strong daily closing reaction to confirm the reversal 💎📈. Don't rush into unconfirmed trades wait for structural confirmation, respect your stop losses, and trade disciplined. What’s your plan,Are we holding $75K for a reversal to $80K, or breaking lower first? Drop your thoughts below! 👇 #IMPACTbyTrade #WSOT2026 #NovUSCPIWatch