ByXIMPACT
Де творці ByX щотижня змагаються за 8 000 USDT. Публікуйте свої погляди на ринок, торгові сетапи та розбір графіків — або виходьте в ефір — і перетворюйте кожен перегляд на бали в таблиці лідерів. Піднімайтесь у рейтингу та отримуйте виплати. 🔥 v0804

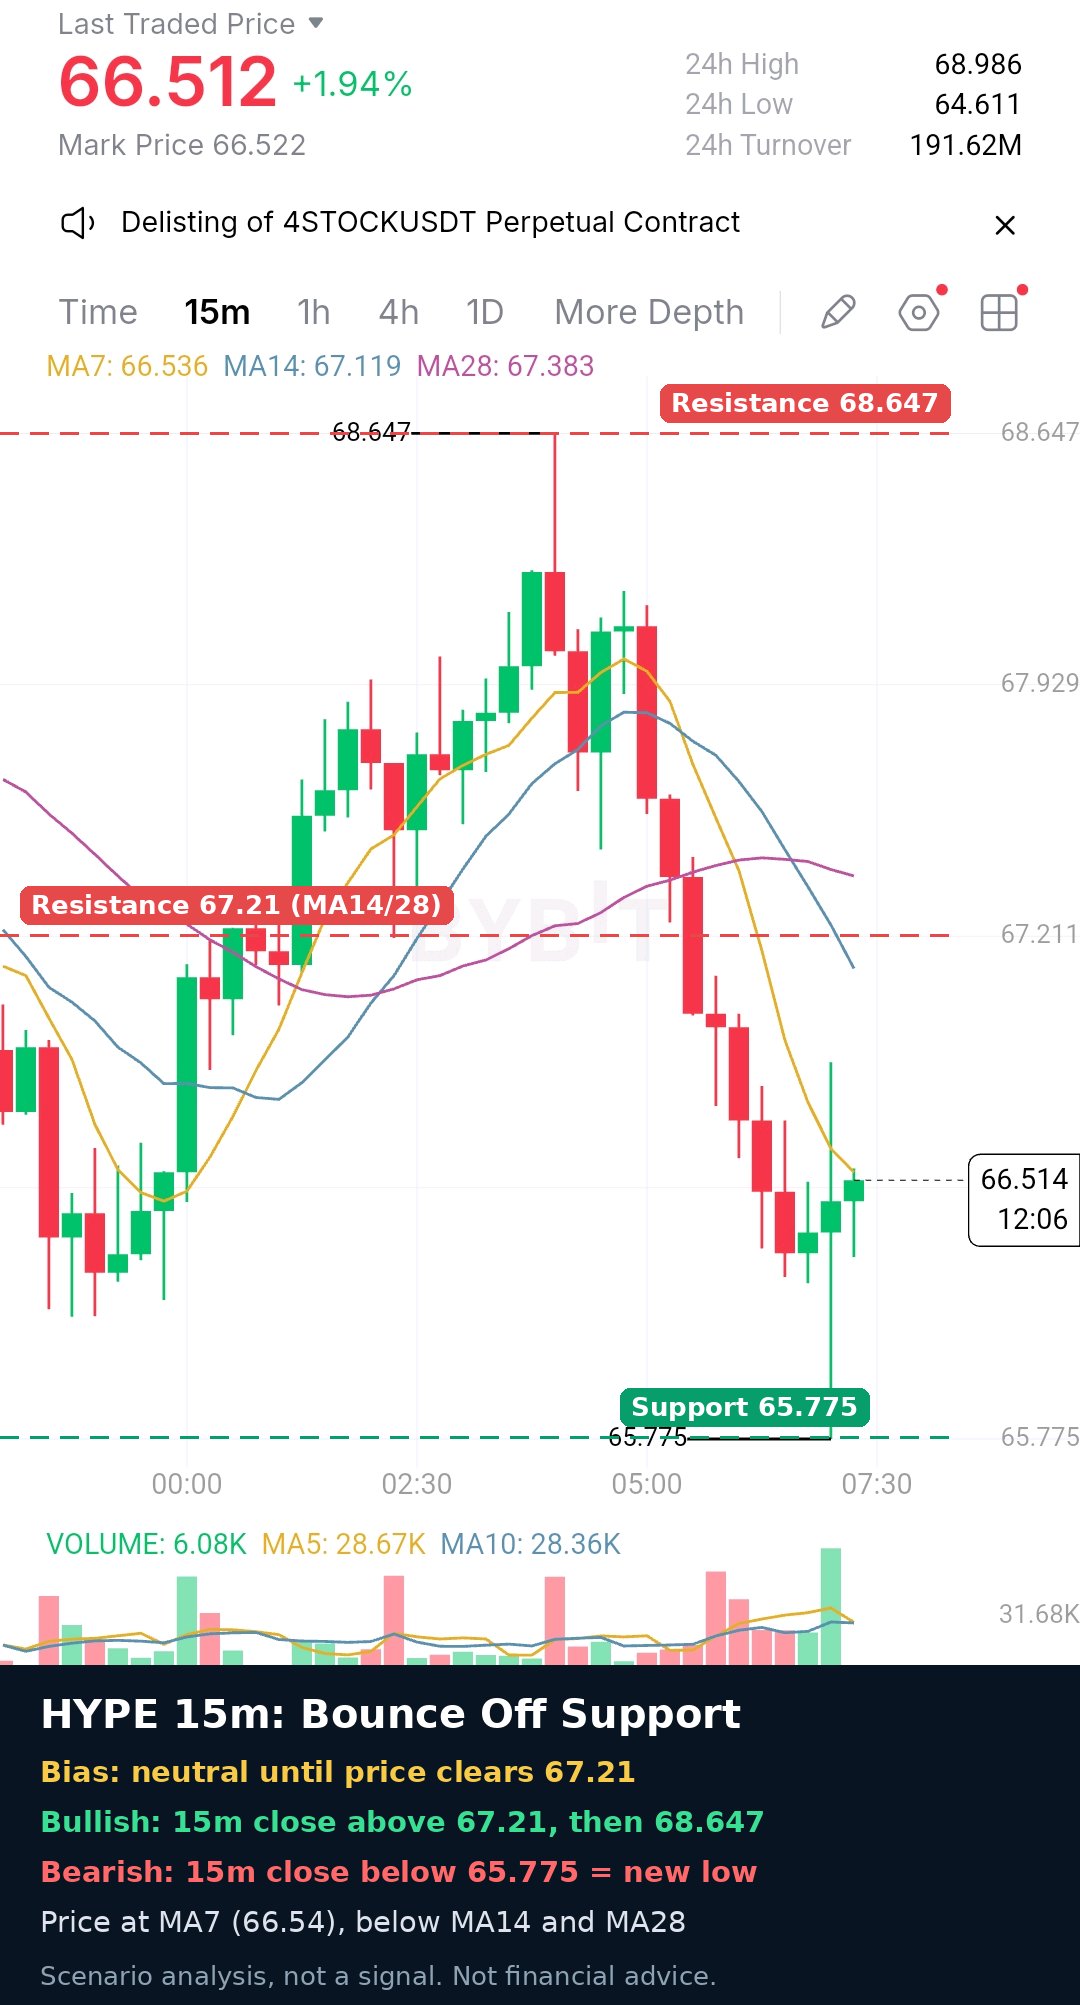
"HYPE: Bullish Above 67.21, Neutral Below"
HYPE is trading at 66.512 (+1.94%) after a wild swing. It spiked to 68.647, dropped sharply to 65.775, then bounced with a long lower wick. That wick shows buyers stepped in at support. Price is now sitting on the MA7 but is still below the MA14 and MA28, so the recovery is not confirmed yet. Key levels: Resistance: 67.21 (MA14 and MA28 zone), 68.647 (swing high) Support: 65.775 Scenarios: Bullish: A 15m close above 67.21 would be the first sign of strength, with 68.647 as the next target. Bearish: A 15m close below 65.775 would put the price at a new low. Until one of these breaks, the bias stays neutral. Do not chase the bounce. Wait for confirmation, use a stop loss and risk only 1-2% per trade. #ByXIMPACT $HYPEUSDT

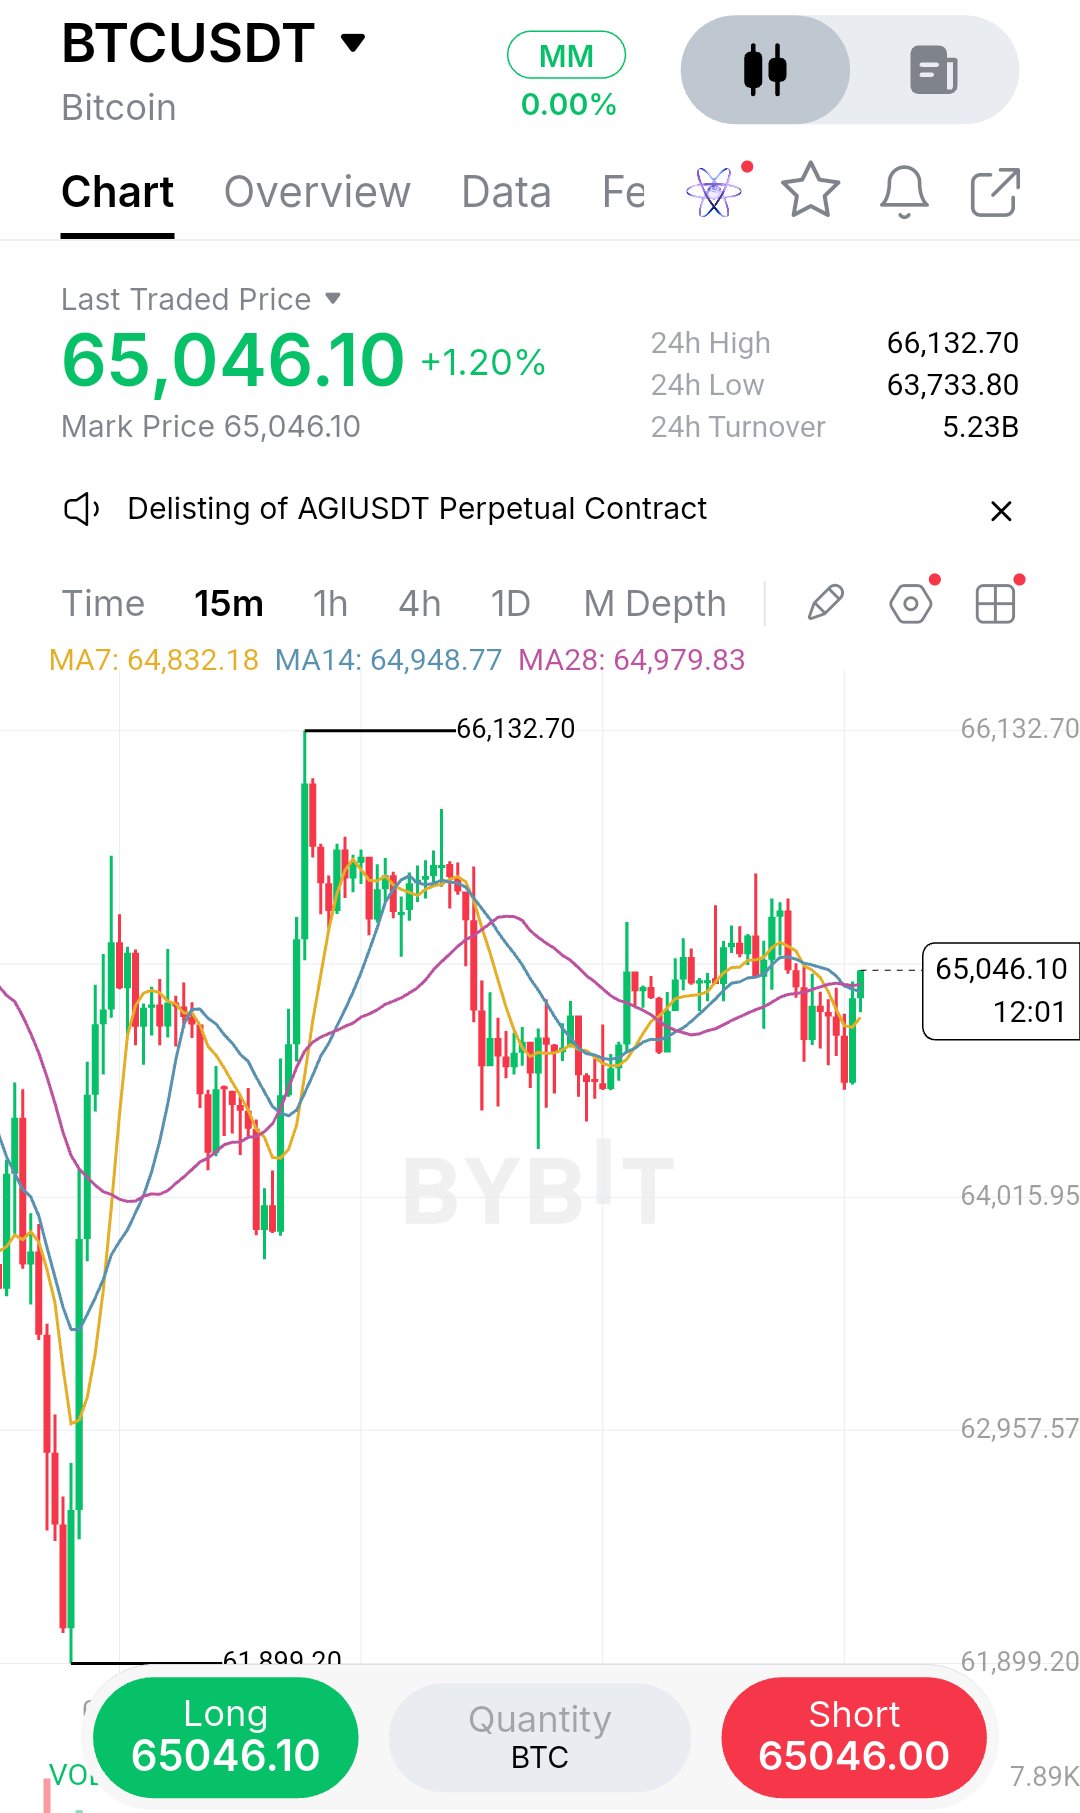
I used to jump on every green candle that formed after a pullback, but I’ve since learned that waiting for structure to actually confirm itself is what separates a good trade from an impulsive one. That’s exactly what I’m seeing here on this 15m BTCUSDT chart. After a strong rally that pushed price all the way up to 66,132, the market didn't immediately collapse; instead, it entered a controlled retracement and is now consolidating near the 65,000 handle. What catches my eye is how price is interacting with the moving averages. The MA7, MA14, and MA28 are tightly compressed between 64,832 and 64,980, and price is resting right on top of them. This isn't random.it tells me the short-term momentum has neutralized, and the market is catching its breath before the next directional decision. The structure here is clearly a compression phase following a bullish impulse. The higher low around 63,733 remains intact, which keeps the broader recovery thesis alive. However, the immediate resistance at 66,132 is the gatekeeper. For the bulls to take control, we need a clean 15m candle close above that swing high. Until then, every push upward is just a test. On the downside, the 64,000 zone is the critical floor. If that breaks, the compression resolves lower, and I’d be looking at 63,000 or even the 61,800 liquidity sweep low as the next destination. I’m not interested in chasing price here. The risk-to-reward on a blind entry at 65,000 is poor because you're buying right into resistance with a tight stop. Instead, I want to see the market prove itself. My Execution Plan: Bias: LONG (upon confirmation) Entry Zone: $65,100 – $65,150 Confirmation: A 15m close above $65,200 with expanding volume. Stop Loss / Invalidation: $64,500 (below the MA cluster and recent swing wick) TP1: $66,132 (recent swing high) TP2: $67,000 (psychological round number) TP3: $68,000 (if momentum accelerates) R:R: Approximately 1:2 to TP2, assuming entry near $65,150. The biggest risk I see is a fakeout at the 66,132 level. If price pushes above it and immediately gets rejected back below the moving averages, that’s a trap. I’ll cut the trade without hesitation and reassess. The other risk is if BTC loses the 64,000 support; that would invalidate the bullish structure entirely and shift my bias to short. Position sizing should reflect this uncertainty.There’s no need to go heavy on a breakout until the follow-through is clear. Are you watching this breakout level too? #ByXIMPACT #WSOT2026 $BTCUSDT $HYPEUSDT

What stands out to me here is how aggressively sellers have controlled this chart since that 224.01 peak. QNT has been printing a steady stream of lower highs and lower lows on the 4H timeframe, and the recent flush down to 138.89 looked like it might break the entire structure completely. But that low was bought up hard, and now price is bouncing back to 158.40. The recovery is sharp, but I’m not convinced it’s anything more than a relief rally inside a broader downtrend. The key insight is simple: until price reclaims major structural resistance, this is still a bounce inside a downtrend. The recovery hasn't broken any significant swing highs yet, and the overhead supply from the previous breakdown zone is still sitting there waiting. I've been burned before trying to catch these falling knives too early, convinced the bottom was finally in, only to watch price roll over and make a fresh low without me. That painful lesson taught me to wait for confirmation rather than guess where the bottom is. The market doesn't reward impatience in these conditions—it punishes it. What I'm watching now is how price behaves as it approaches the 165-170 area. If sellers show up there with conviction, it's a clean short setup back toward the lows. If buyers push through with volume, I'll reassess. There's no need to force anything. Bias: Bearish until structure shifts. Entry: 165.00 (only after a 4H rejection and close back below this zone) Stop: 180.00 (above the recent lower high to give it room) TP1: 145.00 TP2: 138.89 TP3: 125.00 Invalidation: A 4H close above 180.00 would tell me the structure is shifting. If price keeps grinding up without a clear rejection, I won't chase it. Let the market show its hand first. Patience is the edge here. #ByXIMPACT$QNTUSDT

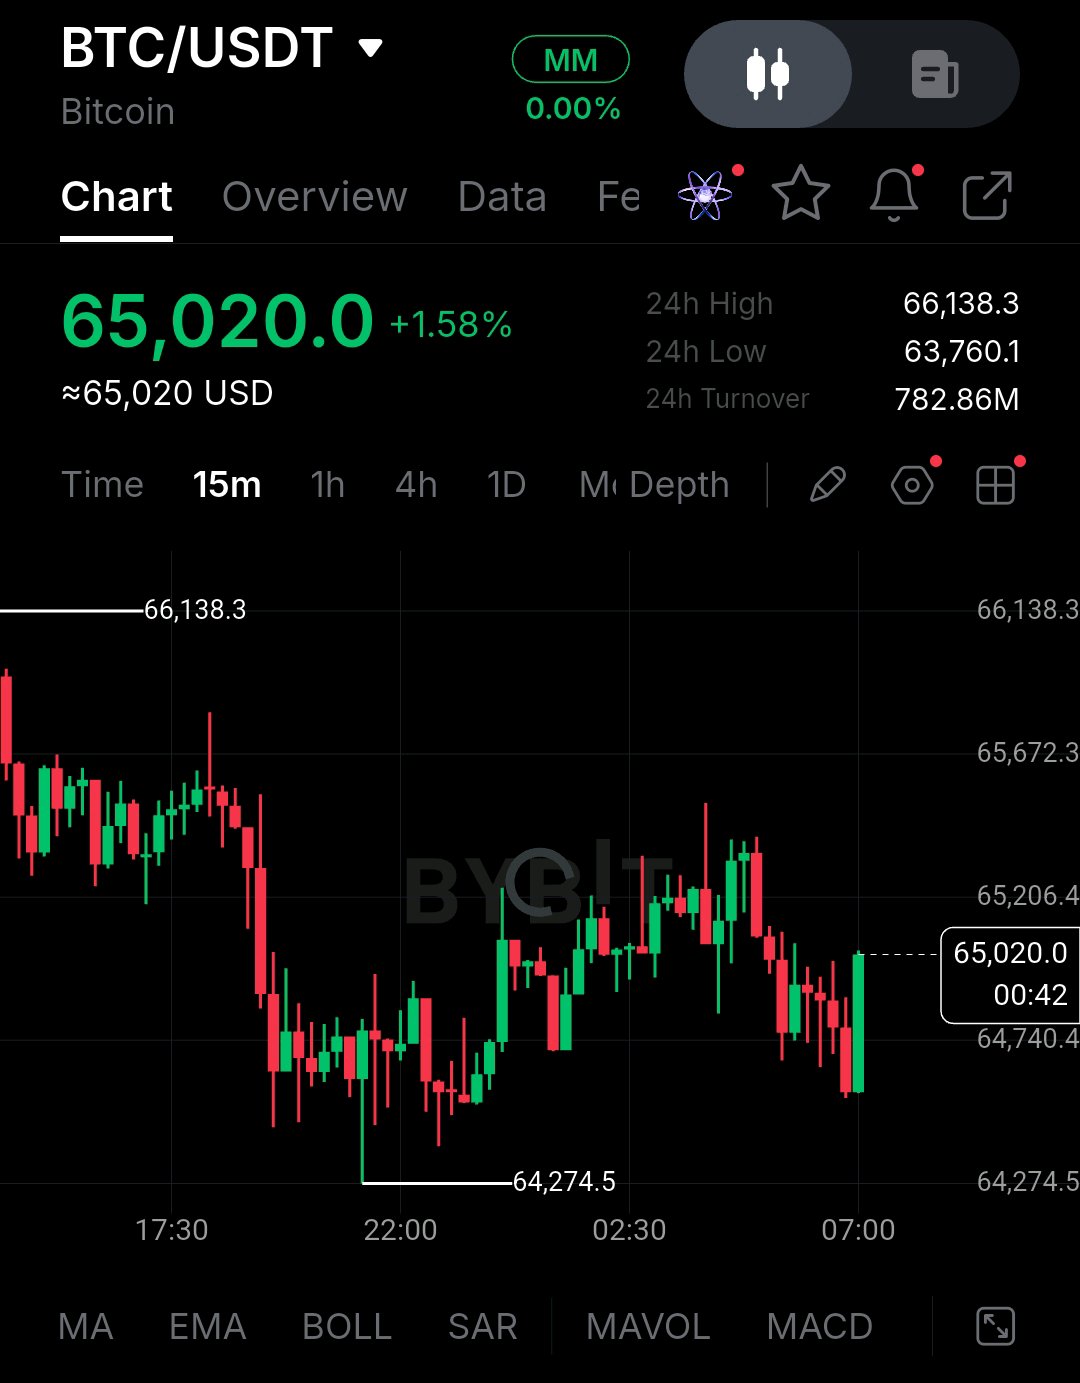
Bitcoin is attempting a short-term recovery near $65,020, up 1.58% in the latest chart snapshot. However, the broader market remains under pressure, with BTC struggling to regain bullish momentum after a significant correction. The immediate support levels are $64,274 and $63,760, while resistance stands at $65,206, $65,672 and $66,138. Institutional Developments Institutional adoption remains a long-term strength for Bitcoin, particularly through US spot Bitcoin ETFs. However, recent ETF outflows indicate weakening institutional demand. This highlights an important difference: Bitcoin's infrastructure continues growing, but capital inflows are needed to support price recovery. On-Chain Activity Bitcoin's network remains active, with approximately 465,786 daily transactions and 647,586 active addresses in the latest available dataset. Its network activity demonstrates continued usage, although transaction growth does not automatically translate into stronger buying demand. Supply and Tokenomics Bitcoin's maximum supply remains fixed at 21 million BTC, with approximately 20.11 million already circulating. The 2024 halving reduced mining rewards from 6.25 BTC to 3.125 BTC. The next halving, expected around 2028, will reduce issuance further. This declining supply supports Bitcoin's long-term scarcity narrative, but demand remains essential. Derivatives Market - Futures open interest: $41.45B - 24H OI change: -3.79% - Funding rate: -0.0013% - Futures volume: $70.55B - Spot volume: $7.01B - 24H liquidations: $249.35M Declining open interest suggests traders are reducing exposure, while negative funding indicates short-side positioning pressure. Key Market Levels - Current chart price: $65,020 - Support: $64,274 - Secondary support: $63,760 - Resistance: $65,206 - Major resistance: $66,138 - Circulating supply: 20.11M BTC - Maximum supply: 21M BTC Bullish and Bearish Scenarios Bullish: BTC needs to defend $64,274 and reclaim $65,206. A breakout above $66,138, supported by stronger spot volume and renewed ETF inflows, would strengthen recovery expectations. Bearish: Losing $64,274 could expose $63,760. Continued ETF outflows and weak spot demand would increase downside pressure. Final Outlook Bitcoin still has three major fundamental strengths: limited supply, institutional infrastructure and a globally active network. However, fundamentals alone cannot reverse a market correction. Stronger spot demand, improving ETF flows and resistance breakouts are needed. The key level I am watching is $66,138. Can Bitcoin reclaim it and turn this recovery attempt into a sustainable reversal? $BTCUSDT #ByXIMPACT

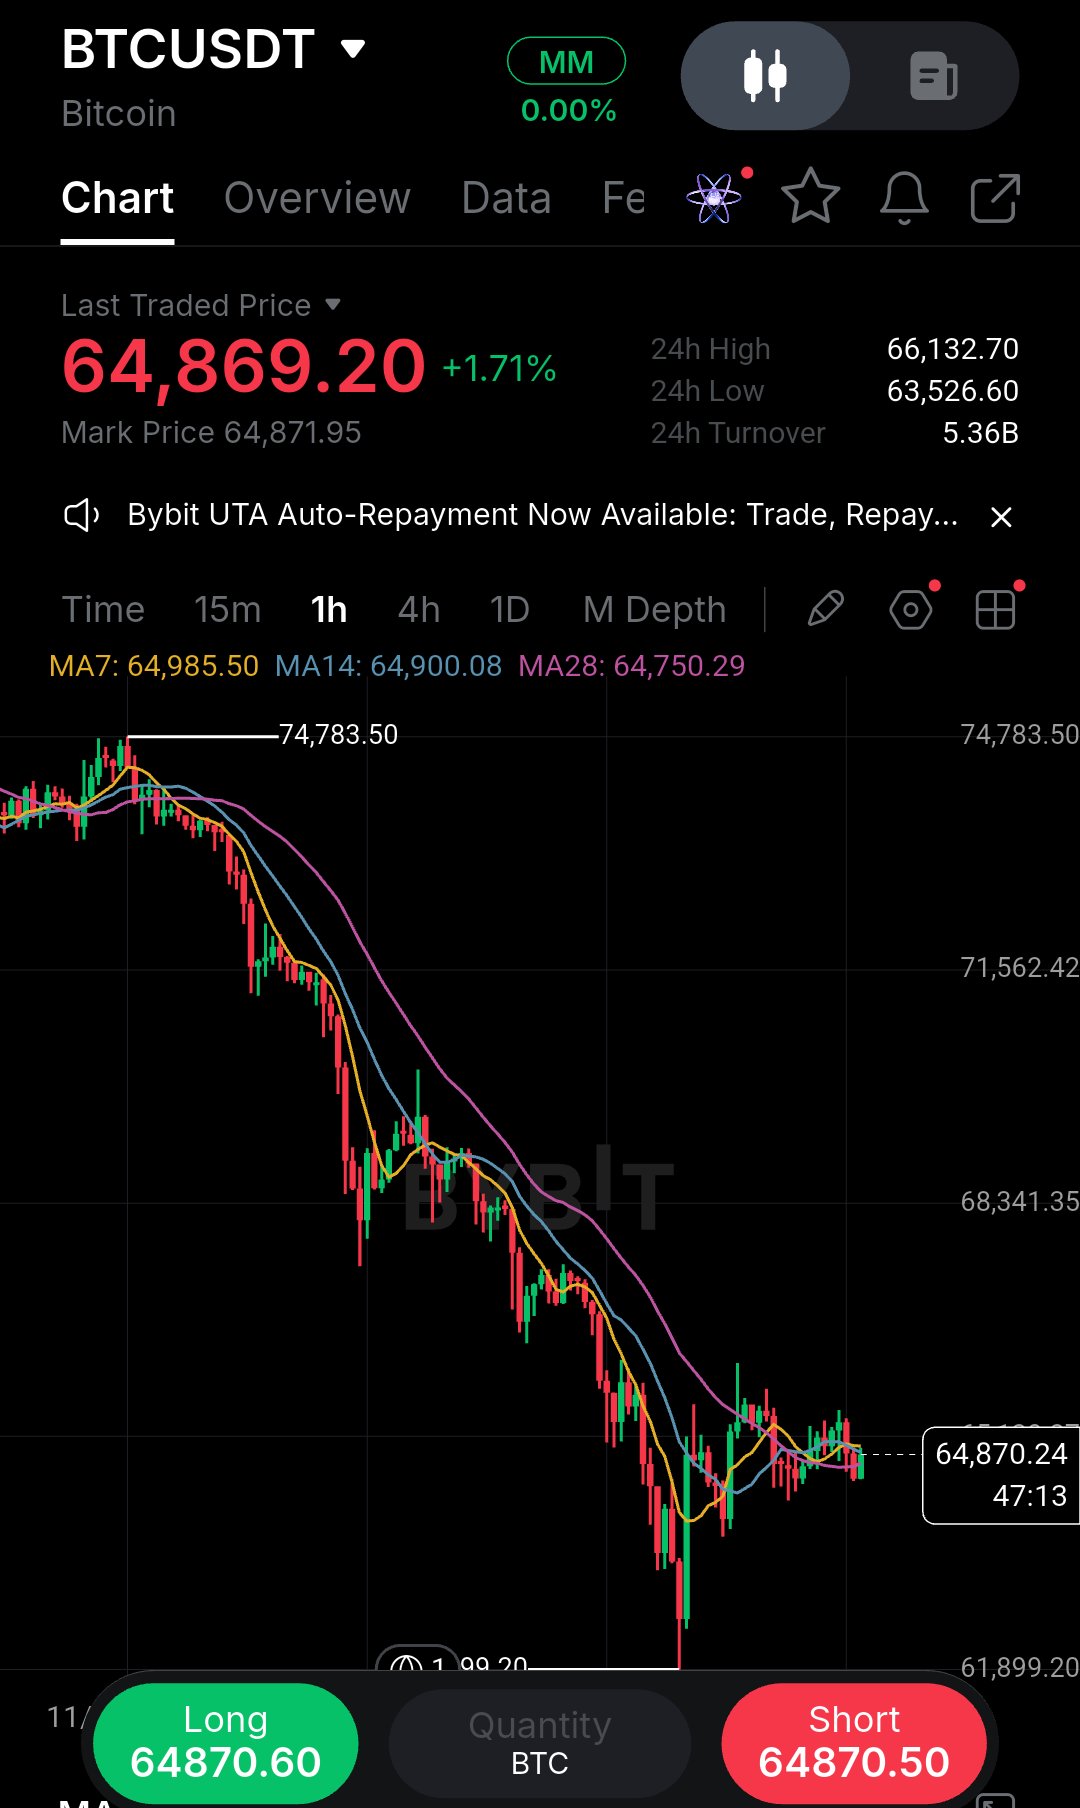
I’ve learned to be careful with charts that look ready to bounce before the structure actually proves it. For me, that’s the exact temptation sitting on this BTC 1H chart right now. Price has fallen hard from the 74,783 swing high down to a low near 61,899, and the current candle is trying to stabilize around 64,870. The green candles are tempting, and the 24h low at 63,526 shows buyers did step in. But I’ve been burned enough times to know that a bounce is not the same thing as a reversal. The moving averages are still stacked against the bulls, and the market structure remains lower highs and lower lows until proven otherwise. The single most important thing I see is the 66,100–66,200 zone. That area was previous support before the breakdown, and now it’s acting as resistance. If buyers can reclaim that level with a strong 1H close, it would be the first real sign that sellers are losing control. Until then, every rally is just a retest of broken structure. I’m not interested in guessing the bottom. I’m interested in seeing the market prove it can hold higher. What makes this setup tricky is the compression near 64,870. Price is coiling, and that usually means a bigger move is coming. But direction is not guaranteed. The 24h high at 66,132 is the immediate ceiling, and the 24h low at 63,526 is the floor. A clean break above 66,200 would open the door toward 68,340, which is the next structural resistance visible on the chart. If that breaks, 71,560 becomes the next logical target. On the downside, a breakdown below 63,500 would tell me sellers are still in control, and I’d rather step aside than catch a falling knife. My execution plan is simple: Entry: Wait for a 1H close above 66,150 SL: 64,700 (below the recent consolidation) TP1: 68,340 TP2: 71,560 Invalidation: A breakdown below 63,500 signals sellers are still in control. I’ve chased bounces like this before, and I’ve learned that entering early often means getting trapped. The discipline is to let the market prove itself first. If price rejects 66,200 again, I’ll stay patient and look for a lower support test instead. The best trades don’t require me to be a hero. They require me to wait for confirmation. That’s the lesson I keep relearning on charts like this. #ByXIMPACT #WSOT2026 $BTCUSDT $HYPEUSDT

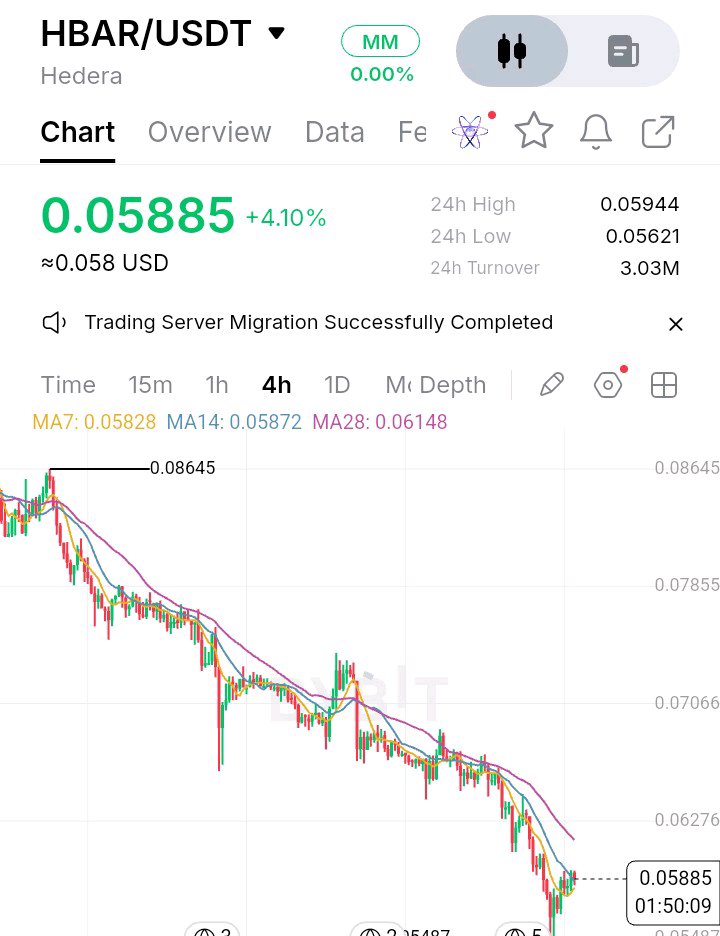
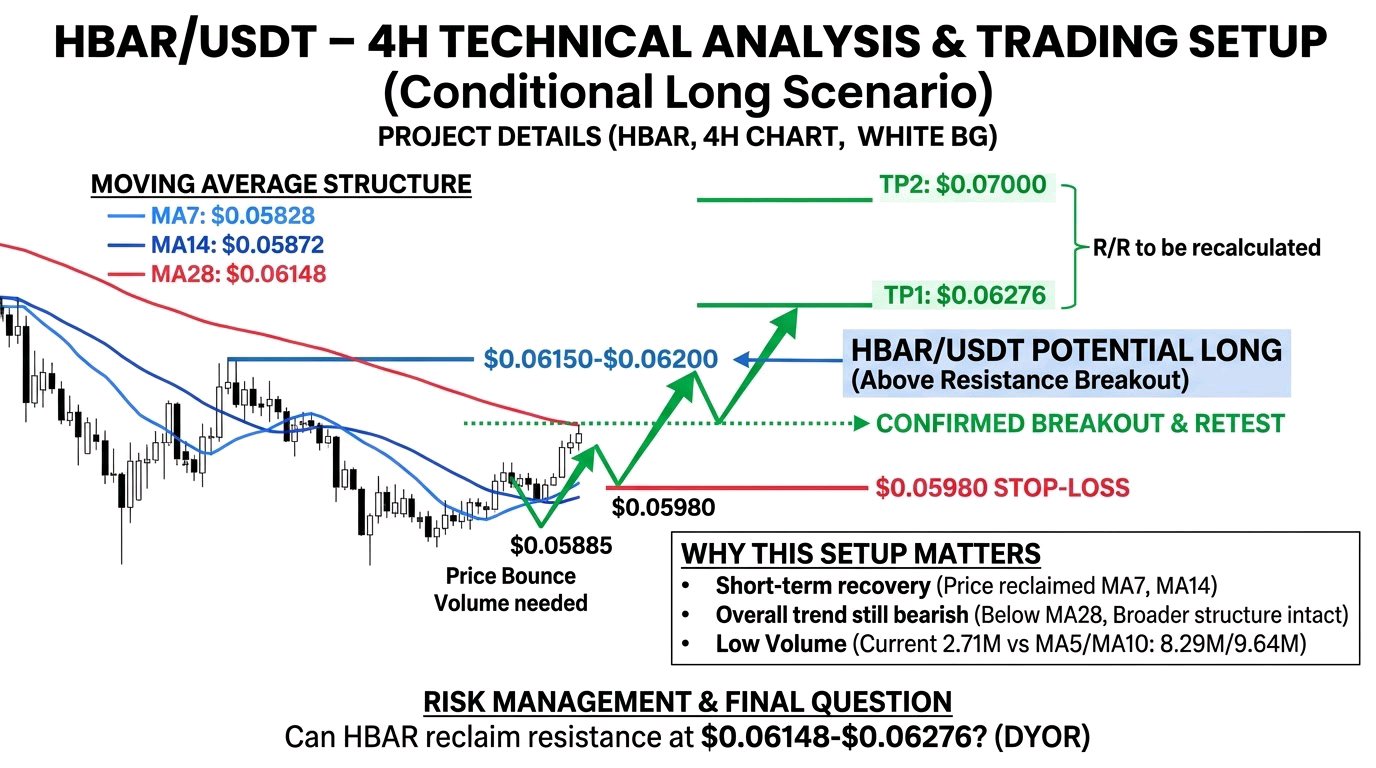
#ByXIMPACT $HBARUSDC /USDT 4H Technical Analysis and Trading Setup HBAR is showing signs of a short-term recovery after an extended bearish trend, but the latest bounce has not yet confirmed a full reversal. Buyers have stepped in near the recent lows, pushing price back toward $0.05885. The key question now is whether this recovery can overcome the next resistance zone or whether sellers will regain control. # Current Market Picture and Key Levels On the 4H chart, HBAR is trading around $0.05885, up 4.10%. The recent 24-hour range is $0.05621–$0.05944. The moving averages show improving short-term momentum: * MA7: $0.05828 * MA14: $0.05872 * MA28: $0.06148 Price has reclaimed MA7 and MA14, which is encouraging for buyers. However, it remains below MA28, indicating that the broader bearish structure is still intact. Important technical levels: * Immediate support: $0.0580–$0.0570 * Major support: $0.05487–$0.05621 * Immediate resistance: $0.05944–$0.06000 * Major resistance: $0.06148–$0.06276 * Bullish breakout: Above $0.06276 * Bearish breakdown: Below $0.05487# Trading Setup Trade direction: Potential Long – Confirmation Required Rather than chasing the current recovery, I would wait for buyers to establish strength above resistance. * Potential entry: $0.06150–$0.06200 after a confirmed breakout and successful retest. * Stop-loss: $0.05980 * TP1: $0.06276 * TP2: $0.07000 * Invalidation: A sustained move below $0.05980 after the breakout would weaken the bullish setup. This is a conditional scenario, not a confirmed entry signal. The risk-to-reward should be recalculated using the actual execution price. # Why This Setup Matters The most interesting detail is the difference between short-term recovery and the broader trend. Although HBAR has moved above its MA7 and MA14, the MA28 remains considerably higher at $0.06148. This means buyers are recovering momentum, but they still have an important technical barrier to overcome. Another detail worth watching is volume. The displayed current volume is 2.71M, compared with MA5 volume of 8.29M and MA10 volume of 9.64M. The rebound therefore needs stronger participation to support a convincing breakout. Entering after a sharp bounce can be risky because early buyers may take profits near resistance. A confirmed 4H breakout followed by a successful retest would provide stronger evidence of buyer control. # Rsk Management Avoid entering with excessive leverage or increasing position size after a losing trade. Define your stop-loss before execution and keep position sizing proportional to your account risk. If HBAR fails to break above $0.06148–$0.06276, the recovery could lose momentum and price may revisit lower support zones. Final Market Question Can HBAR reclaim the $0.06148–$0.06276 resistance zone and turn this recovery into a genuine trend reversal, or will sellers defend the moving-average resistance again? DYOR. This is market commentary, not financial advice. #WSOT2026 #JensenHuangExitTestsNvidiasAILeadership #WSOTShowYourAITradeToEarn10USDT #USInflationRunsHotAndRateHikeBetsRise $SOLUSDT

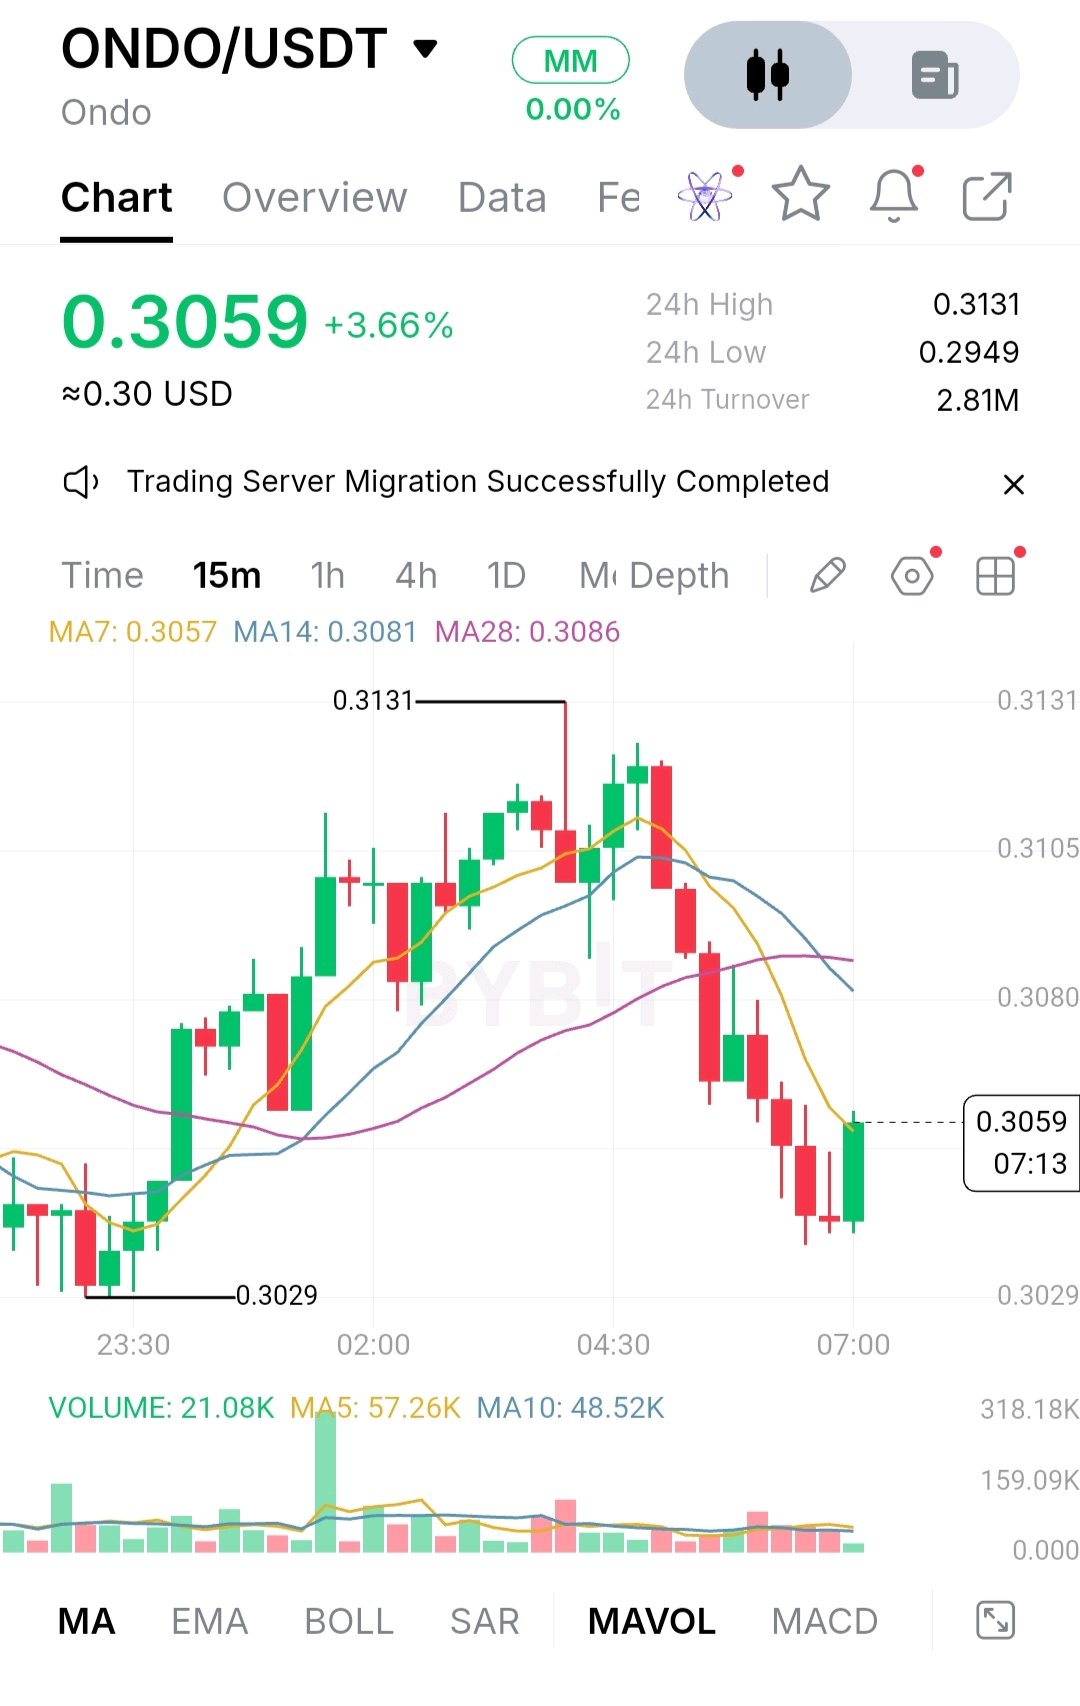
ONDO/USDT: Buyers Are Trying to Recover, But the Pressure Has Not Disappeared There is something worth paying attention to in ONDO's recent price action. Buyers managed to push the price higher, but when it approached $0.3131, the momentum quickly faded. Now the token is trading around $0.3059, attempting to recover some of those losses. The question is whether buyers genuinely see value at these levels or are simply taking advantage of a temporary pause in selling. A Bounce That Still Needs Convincing ONDO is showing a 3.66% daily gain, which initially looks positive. However, looking at the 15-minute chart tells a more complicated story. After reaching $0.3131, the price experienced a noticeable pullback. Sellers gradually took control, pushing ONDO below its 14-period and 28-period moving averages. The latest recovery has brought it close to the seven-period average at $0.3057, but the other two averages, sitting at $0.3081 and $0.3086, are still above the current price. That matters because a recovery becomes more convincing when buyers can reclaim these levels and hold them. So far, ONDO has only managed to slow the decline. Trading activity raises another question. The displayed volume is 21.08K, below both the five-period average of 57.26K and the ten-period average of 48.52K. This suggests that the latest bounce is happening without particularly strong participation. Are Buyers Stepping In or Are Sellers Simply Taking a Break? This is probably the most important question facing ONDO right now. The reaction around $0.3029 suggests that buyers are still willing to defend lower prices. However, the rejection near $0.3131 shows that sellers have not disappeared either. There is not enough evidence to call this accumulation just yet. A few green candles can improve sentiment, but sustained buying, particularly when price approaches resistance, is what would make the recovery more believable. The Bigger Picture Behind Ondo Ondo has a business model that gives it a meaningful place in the growing real-world asset sector. Its ecosystem focuses on bringing traditional financial products, including US Treasuries and other financial instruments, onto blockchain networks. Institutional interest and ecosystem expansion could support its long-term relevance. Still, investors should distinguish between the success of Ondo's platform and the actual value captured by the ONDO token. Its governance role does not mean that every new integration automatically creates additional token demand. Future token unlocks are another factor worth watching because additional circulating supply can influence market sentiment and selling pressure. Where the Market Needs to Make a Decision For now, $0.3050–$0.3029 is the immediate support area. Below that, $0.2949 becomes an important level to watch. On the upside, ONDO needs to reclaim $0.3080–$0.3086 before buyers can seriously challenge $0.3105 and the previous high of $0.3131. A convincing move above $0.3131, supported by stronger volume, would improve the recovery outlook. On the other hand, losing $0.3029 would suggest that sellers are still controlling the short-term direction. What Matters Most Now? There is no real reason to rush into a trade while the market is still searching for direction. Buying immediately means facing nearby resistance, while selling directly into support also carries its own risks. ONDO has shown that buyers are still present, but showing up once is not the same as taking control. $ONDOUSDT #ByXIMPACT

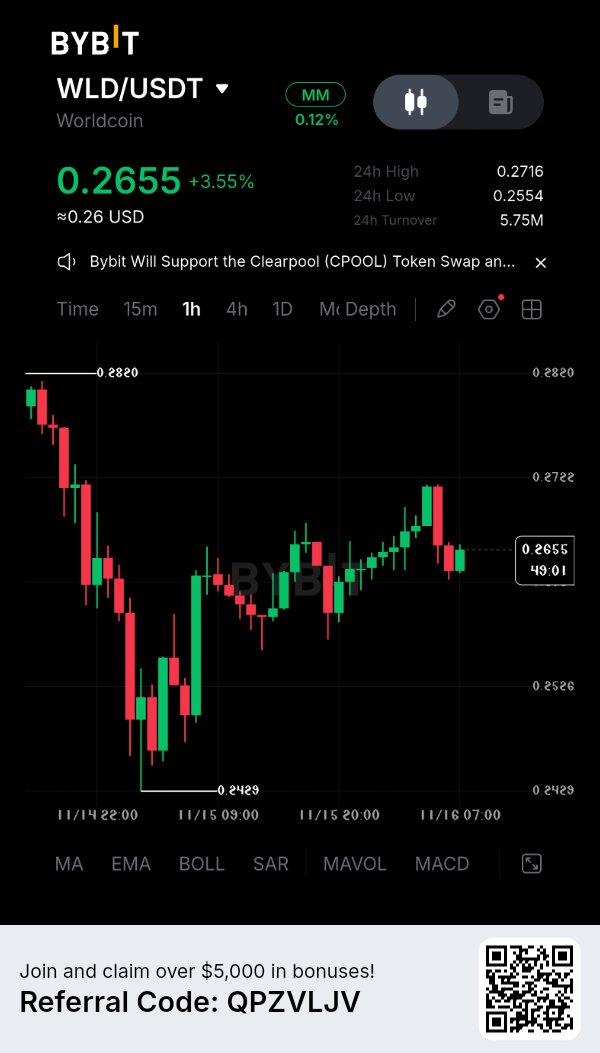
$WLDUSDT Bulls Are Trying to Take Control. Is Another Move Coming? Worldcoin is showing signs of recovery on the 1H chart after a strong bounce from the $0.2429 support area. WLD is currently trading around $0.2655, up approximately 3.55%. Buyers have managed to recover from the recent low, but the price is now facing resistance after rejection near $0.2716. Key Levels to Watch Support Zones: - $0.2625 – $0.2635 - $0.2550 – $0.2560 - $0.2525 – Major support area Resistance Zones: - $0.2680 – $0.2690 - $0.2715 – Immediate resistance - $0.2820 – Major upside target Potential Trading Setup Entry 1: $0.2625 – $0.2640 on a confirmed bullish bounce. Entry 2: Above $0.2690 after a strong 1H candle close and successful retest. Take Profit: - TP1: $0.2715 - TP2: $0.2760 - TP3: $0.2820 Stop Loss: Below $0.2590 for the pullback setup. Bearish Scenario If WLD loses the $0.2625 support with a strong 1H candle close, the bullish setup becomes weaker. A breakdown could open the way toward $0.2555 and potentially $0.2525. My Trading View The structure is showing recovery, but bulls still need to reclaim the $0.2690–$0.2715 resistance zone to confirm stronger upside momentum. I would rather wait for confirmation than chase a green candle. Patience and proper risk management matter more than entering every move. Keep your eyes on WLD. The next reaction around support and resistance could define its short-term direction. Trade smart. Protect your capital. Let the setup come to you. #ByXIMPACT

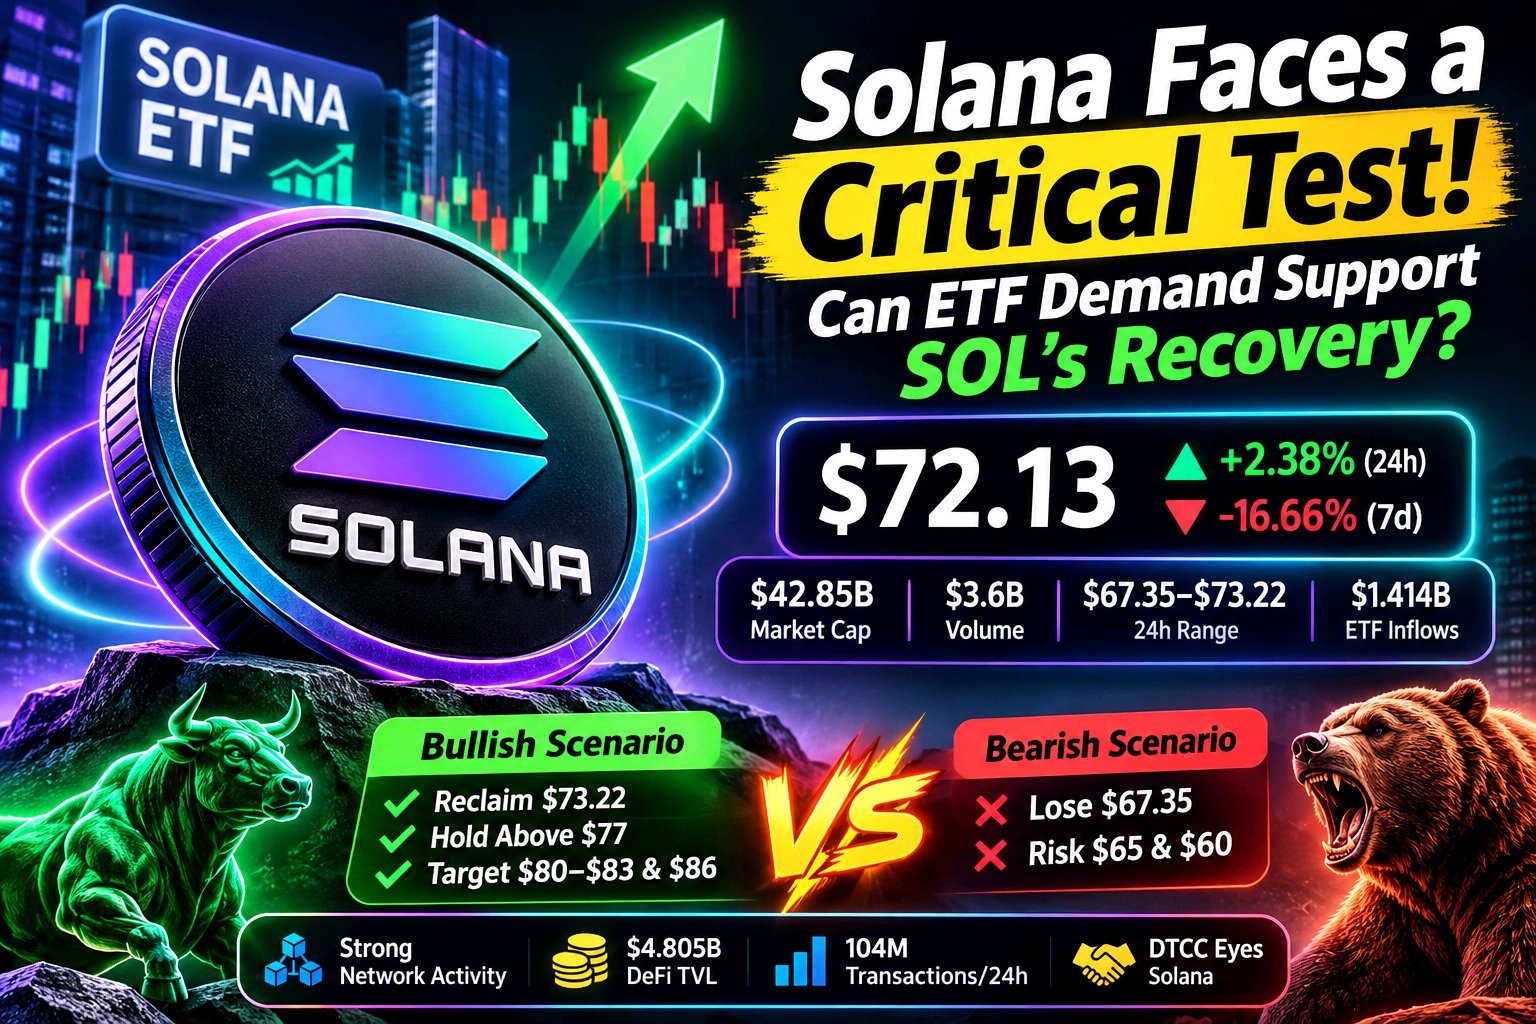
Solana is showing a mixed picture. Network activity remains strong, but SOL has dropped more than 16% over the past seven days. Meanwhile, spot ETF inflows are showing signs of recovery, and derivatives markets have experienced a significant reduction in leverage. The key question is whether institutional buyers can support the market or whether this rebound will lose momentum. SOL is trading around $72.13, with a market cap of approximately $42.85 billion and daily trading volume near $3.6 billion. Although the price has recovered 2.38% in 24 hours, its weekly performance remains weak at -16.66%. The recent trading range is $67.35–$73.22, making these levels important for the next move. Institutional activity is showing some positive signs. U.S. spot Solana ETFs recorded around $1.69 million in net inflows on November 12, ending five consecutive sessions of outflows. Total cumulative inflows remain near $1.414 billion. This suggests institutional interest has not disappeared, but one positive session is not enough to confirm a lasting trend. Solana's network fundamentals also remain meaningful. DeFi TVL stands around $4.805 billion, while stablecoin supply is approximately $13.96 billion. The network processed roughly 104 million transactions in 24 hours, generated around $448,750 in fees, and recorded $1.386 billion in daily DEX volume. However, weekly DEX activity declined by 19.11%, showing that ecosystem activity is also facing some pressure. Another development worth watching is DTCC's tokenization initiative, which has identified Solana among the blockchain networks being considered for future integration. This could create opportunities for Solana in traditional finance, although actual adoption and measurable usage will determine its long-term importance. Derivatives positioning has also changed considerably. Aggregate perpetual open interest is around $4.13 billion, with funding rates negative at approximately -0.0102% every eight hours. Around $23.24 million in positions were liquidated over 24 hours, including $14.63 million in long positions. Reduced leverage may help create a healthier market structure, but it does not automatically mean a bullish reversal is coming. Key levels to watch: - Resistance: $73.22, $77 and $80–$83. - Major upside target: $86. - Support: $67.35 and $65. - Further downside risk: $60. For bulls, reclaiming $73.22 and holding above $77 with stronger spot buying would improve the recovery outlook. On the other hand, losing $67.35 could bring renewed selling pressure. My view is that Solana still has strong infrastructure, meaningful DeFi liquidity and growing institutional exposure. But strong network activity doesn't automatically translate into higher SOL demand. I want to see consistent ETF inflows and stronger spot buying before considering this recovery convincing. For now, the market looks interesting, but confirmation is still missing. $SOLUSDT #ByXIMPACT

DOGE is attempting to reclaim the $0.0605 area after a sharp weekly decline. The bounce is encouraging, but daily and weekly trends remain bearish. I want spot demand to confirm it. MARKET SNAPSHOT Dogecoin is trading near $0.05976, up 4.37% over 24 hours but down 14.51% over seven days. The latest reported daily range is $0.05542–$0.06010. Market capitalization is around $9.38B, with approximately 156.77B DOGE circulating. DOGE has no fixed maximum supply. Aggregated spot volume is near $188.88M, futures volume around $1.39B and open interest approximately $763.69M. These are cross-exchange snapshots, not Bybit-only figures. Futures turnover is roughly 7.4 times spot volume, showing derivatives still dominate short-term activity. TECHNICAL STRUCTURE Daily RSI is around 27.1, with four-hour RSI near 38.1 and weekly RSI around 34.6. All three timeframes show a bearish bias, and price remains below all eight tracked daily moving averages. Oversold RSI is not a bottom signal; DOGE can bounce while the larger trend stays weak. The nearest resistance is $0.0605, followed by $0.0630 and $0.0803. A close above $0.0605 signals stabilisation; holding $0.0630 on a retest is stronger confirmation. Support is $0.0549, then $0.0519 and $0.0492. A daily close below $0.0549 would expose lower levels. A wick is not a breakout. DERIVATIVES: SHORT COVERING OR FRESH DEMAND? Open interest is around $763.69M, with the latest aggregate snapshot showing a 1.29% increase over 24 hours. However, the same dashboard's intraday explanation attributes the price bounce to OI falling about 2.95%, suggesting short positions are closing. The readings use different update windows, so they do not confirm a bullish leverage build-up. Funding is positive near 0.0033% per eight hours, below the 0.01% reference level. Longs are paying shorts, but positioning is not showing extreme long crowding. Around $2.67M in positions were liquidated, with approximately 63% from longs. Other trackers use different windows, so liquidation totals should not be combined. Spot net inflow is around $221K, while futures net inflow is approximately $28.5M. Futures demand is much stronger than spot participation. That makes the bounce vulnerable if leveraged buyers lose momentum. FUNDAMENTAL OUTLOOK Dogecoin remains a proof-of-work payment network with low-cost transfers, tipping and a large global community. Its next growth test is whether it can move beyond being mainly a transferable meme asset and support useful applications. DogeOS is the main ecosystem catalyst. Its public EVM-compatible testnet opened on September 30, allowing developers to build trading, lending, stablecoin, gaming and consumer applications. On November 11, the CEO said version-one development and audits were complete, with wallet, exchange and builder integrations being coordinated ahead of mainnet. No firm launch date was provided. More than 100 builders are reportedly working on projects, but testnet activity is not the same as live adoption. Dogecoin Labs has also brought MyDoge, DogeOS and other product teams together under one organisation focused on payments, commerce, consumer apps and infrastructure. The opportunity must translate into repeat users, transactions and DOGE demand. TOKENOMICS AND SUPPLY DOGE has no maximum supply and no halving schedule. Miners receive 10,000 DOGE per block, with blocks targeted approximately every minute. This creates roughly 5.2B new DOGE each year. Annual issuance is broadly fixed, so percentage inflation declines as supply grows, but dilution continues. There is no scheduled unlock calendar or protocol-level burn mechanism. Mining rewards secure the network but add supply; payments and applications must create enough demand to absorb it. BEARISH SCENARIO — SUPPORT BREAKDOWN Entry: $0.0547–$0.0550, only after a confirmed daily close below $0.0549 and a failed reclaim. Stop-loss: $0.0585. TP1: $0.0519 TP2: $0.0492 TP3: $0.0466 This is conditional, not a prediction. A sustained reclaim above $0.0585 invalidates the setup. With daily RSI oversold, a sharp relief bounce remains possible; I would not chase a breakdown without a failed retest. MY TAKE DogeOS and Dogecoin Labs could give DOGE a more useful application layer, but mainnet deployment and sustained user activity still need to prove the thesis. For now, the daily and weekly charts remain weak, derivatives activity outweighs spot participation and new mining supply continues every minute. The next test is whether $0.0549 holds and buyers can reclaim $0.0605 with stronger spot volume. Would you trust this bounce before DogeOS reaches mainnet, or wait for a broader demand shift? $DOGEUSDT #ByXIMPACT

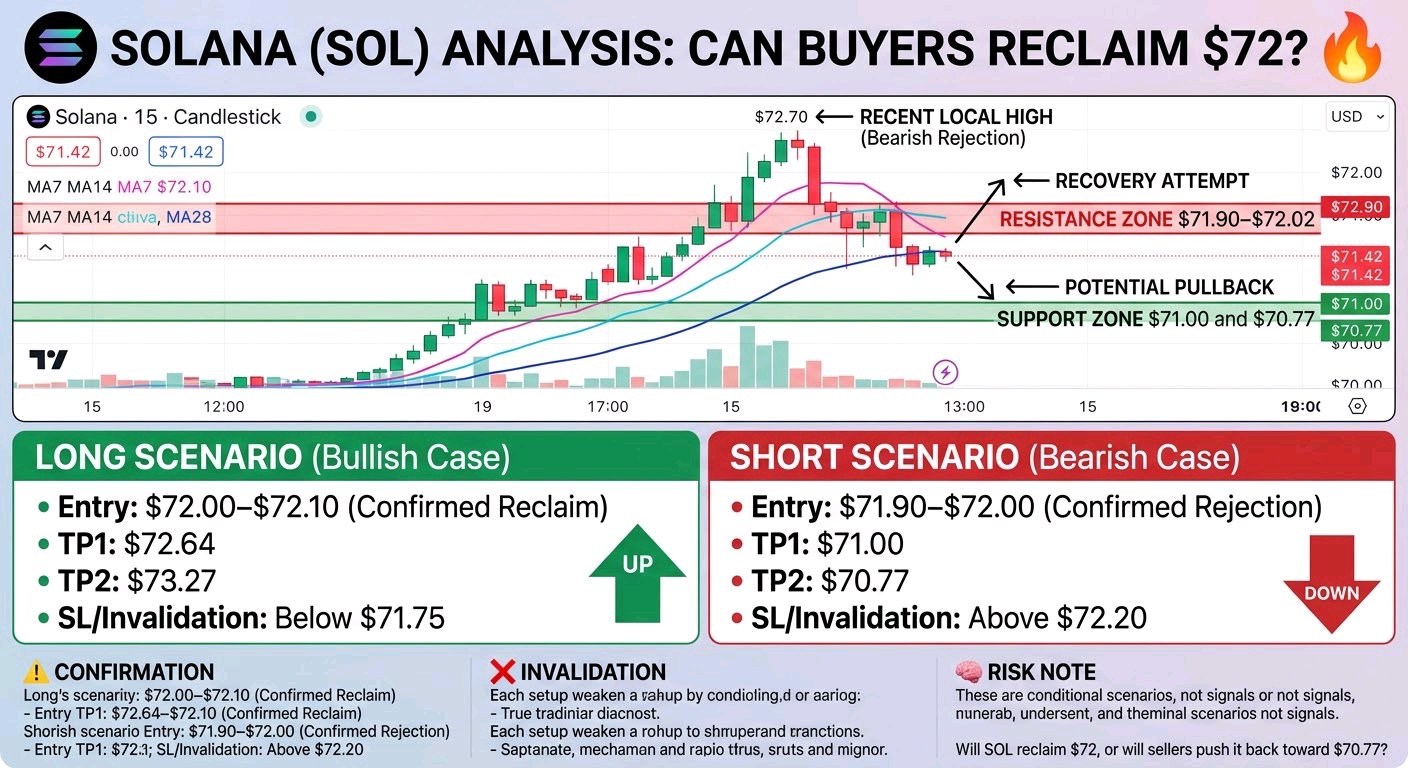
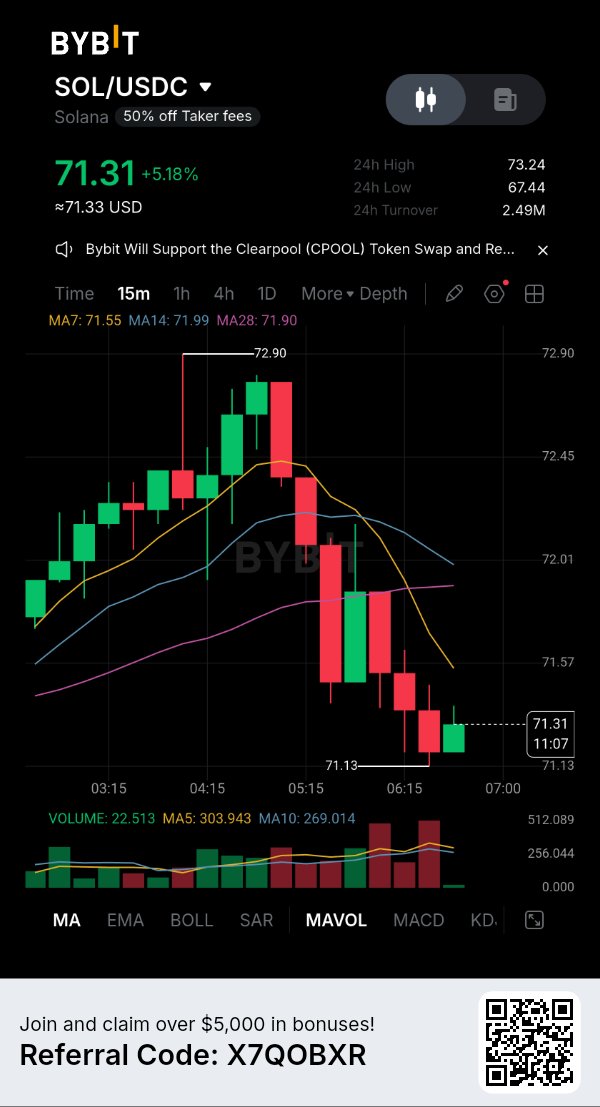
$SOLUSDT Faces a Critical Test: Can Buyers Reclaim $72? SOL is trading at $71.42, up 5.09% over 24 hours. However, the 15-minute chart shows a sharp pullback from the recent local high, followed by a small recovery. The next move around the moving-average resistance could determine short-term direction. Market Structure: Short-term structure looks bearish after the rejection near $72.6–$72.7. Price is currently below MA7 ($71.47), MA14 ($71.94), and MA28 ($71.90), showing that sellers still have an advantage. Key Support: $71.00 and $70.77 Key Resistance: $71.90–$72.02 and $72.64–$72.70 Potential Setup: LONG Scenario Entry: $72.00–$72.10 after a confirmed reclaim TP1: $72.64 TP2: $73.27 SL / Invalidation: Below $71.75 SHORT Scenario Entry: $71.90–$72.00 if price faces a confirmed rejection TP1: $71.00 TP2: $70.77 SL / Invalidation: Above $72.20 Confirmation: A strong 15-minute close above $72.00 could support a recovery attempt. Continued rejection around the moving averages may favor another move toward support. Invalidation: A sustained breakout above the resistance zone weakens the bearish scenario, while a decisive breakdown below $70.77 invalidates the current support-based recovery idea. Risk Note: These are conditional chart scenarios, not guaranteed signals. Wait for confirmation, manage position size, and always use appropriate stop-loss protection. Do you think SOL can reclaim $72, or will sellers push it back toward $70.77? #ByXIMPACT

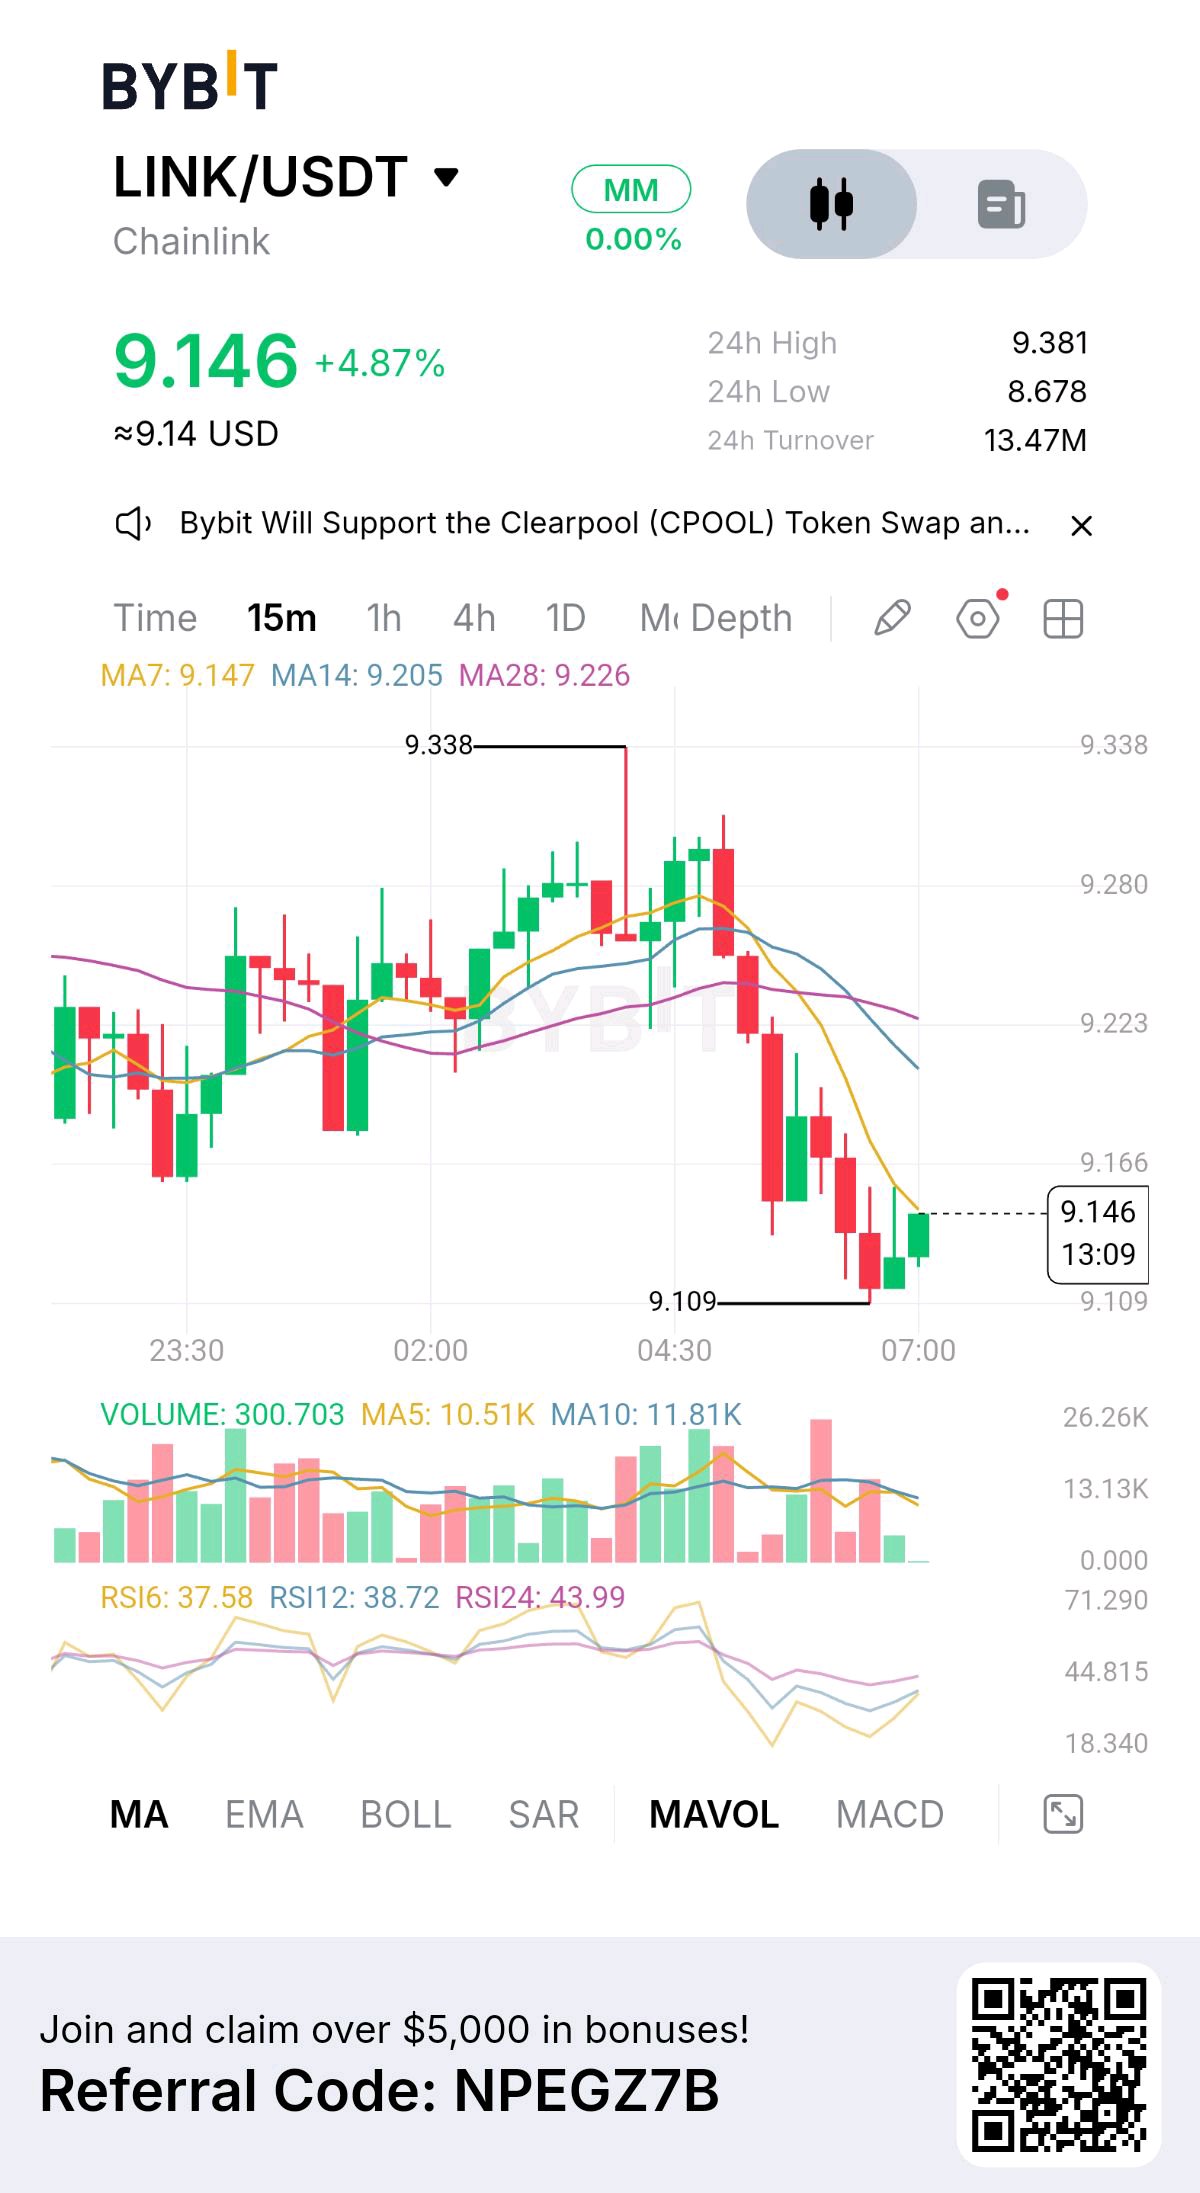
LINK is bouncing above $9.20 after briefly falling toward $8.60, but the recovery is happening while its weekly structure remains deeply negative. What makes this move interesting is that Chainlink is gaining institutional relevance at a time when its token price is still struggling. The latest development involves Moody's Ratings successfully testing Chainlink's cross-chain infrastructure for distributing credit-rating information across multiple blockchains. The question is whether institutional adoption can eventually translate into measurable demand for LINK. LINK recently traded near $9.25, up approximately 6.2% over 24 hours but down around 10.9% over seven days. Its latest 24-hour range stands at $8.616–$9.379, with market capitalization around $6.92B and trading volume near $337M. The $9.35–$9.40 zone is immediate resistance, while $9.00–$8.60 represents the important support region. A sustained move above $9.40 would strengthen the short-term recovery, but buyers still need to overcome the previous selling pressure. The fundamental catalyst is particularly important. On November 10, Chainlink and Moody's Ratings announced the successful completion of a pilot using Chainlink's Cross-Chain Interoperability Protocol (CCIP). The project demonstrated how Moody's credit-rating information could be distributed simultaneously across permissioned and permissionless blockchain networks. This matters because tokenized financial assets need reliable credit information regardless of which blockchain they operate on. However, there is one important distinction: the pilot was conducted in a testnet environment using representative data, not a live production deployment. It demonstrates technical capability, but commercial adoption still needs to follow. Another development strengthens the institutional narrative. Chainlink has introduced a revenue mechanism through which offchain and onchain enterprise revenue is converted into LINK and accumulated in the Chainlink Reserve. This creates a more direct connection between institutional adoption and token economics. The strategic opportunity is significant, but the actual impact depends on the amount of revenue generated and converted into LINK. Partnerships and integrations alone do not establish meaningful buying pressure. Tokenomics also deserve attention. Approximately 748.1M LINK are circulating against a maximum supply of 1B, meaning around 74.8% of the maximum supply is already in circulation. The remaining supply can still create distribution pressure as additional tokens enter circulation. However, the Reserve mechanism introduces a different demand-side consideration: if enterprise revenue grows and more LINK is accumulated, it could gradually strengthen the connection between network adoption and token demand. The important question is whether this demand can become large enough to offset circulating supply. Derivatives reveal another interesting development. CoinGlass reports approximately $397.26M in aggregate futures open interest, up 5.24% over 24 hours. Futures volume reached approximately $396.24M against $77.39M in spot volume, making derivatives activity roughly 5.1 times larger than spot trading. Funding is slightly positive at approximately +0.0002% per eight hours, while 24-hour liquidations reached approximately $681K, with longs accounting for around $496K. This suggests speculative participation is increasing alongside the recovery, but the relatively larger futures activity means buyers still need stronger spot confirmation. Key figures $9.25 — Current price area $9.35–$9.40 — Immediate resistance $9.00–$8.60 — Important support zone $8.616 — Recent 24H low $6.92B — Market capitalization $337M — 24H trading volume 748.1M / 1B — Circulating / maximum supply $397.26M — Aggregate futures open interest $396.24M / $77.39M — Futures / spot volume +0.0002% — Funding per eight hours $681K — 24H liquidations Bullish confirmation: Reclaim $9.40 and hold above it with stronger spot volume. That would put $9.80–$10.00 in focus, followed by the possibility of a broader recovery toward $10.50. Bearish confirmation: Lose $9.00 and fail to recover it. That would expose $8.60, with further weakness possible toward $8.20 if spot demand remains weak and leveraged positions begin unwinding. Chainlink is building a stronger institutional infrastructure story through Moody's, cross-chain interoperability and its revenue-funded Reserve mechanism. But institutional adoption and token appreciation are two different things. The decisive signal is whether real enterprise activity starts translating into sustained LINK demand while buyers reclaim $9.40—or whether derivatives-driven recovery fades under continued selling pressure. $LINKUSDT #ByXIMPACT
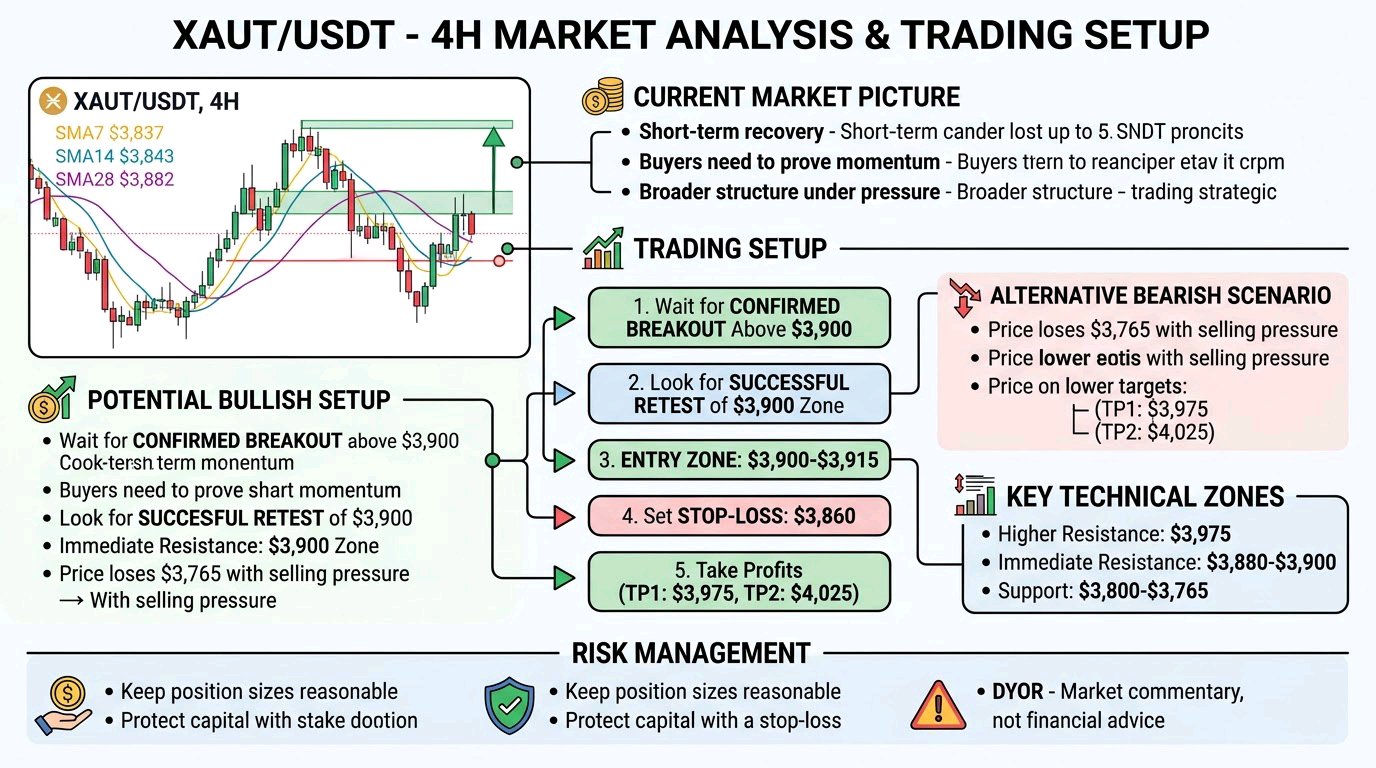
#ByXIMPACT $XAUTUSDT /USDT is showing a short-term recovery after a strong bearish move, but buyers still need to prove that this rebound is more than a temporary relief rally. On the 4H chart, Tether Gold is trading around $3,855.79, up 1.38%. Price has bounced from the recent support area near $3,765–$3,800. However, the broader structure remains under pressure after a series of lower highs and lower lows.# Current Market Picture and Key Levels The moving averages show an important battle: * MA7: $3,837.15 * MA14: $3,843.77 * MA28: $3,882.07 Price has moved above the short-term moving averages, suggesting improving buying momentum. However, the MA28 near $3,882 remains an important resistance. Key technical zones: * Support: $3,800–$3,765 * Immediate resistance: $3,880–$3,900 * Higher resistance: $3,975 * Bullish breakout level: Above $3,900 * Bearish breakdown level: Below $3,765 # Trading Setup Wait for confirmation The safer approach is to avoid chasing the current bounce and wait for a confirmed breakout or a fresh rejection. Potential bullish setup: * Entry zone: $3,900–$3,915 after a confirmed breakout and successful retest. * Stop-loss: $3,860 * TP1: $3,975 * TP2: $4,025 * Invalidation: A sustained 4H move back below $3,860 would weaken the bullish breakout scenario. The alternative bearish scenario becomes relevant if price loses $3,765 with strong selling pressure. These are conditional levels, not an active confirmed signal.# Why This Setup Matters The interesting detail is that XAUT has recovered above its MA7 and MA14, but remains below its MA28. This creates a short-term momentum improvement without confirming a complete trend reversal. Another important factor is the previous rejection around $4,080–$4,100. Sellers have already demonstrated strength in that region, making it important not to assume that one recovery candle will reverse the broader structure. Current market data also shows XAUT trading around the $3,860–$3,880 area, keeping the nearby resistance zone relevant. CoinGlass +1 Entering after a sharp recovery can expose traders to a sudden pullback. Waiting for a 4H candle close above resistance and a successful retest offers a more structured opportunity# Risk Management Keep position sizes reasonable and always define risk before entering a trade. Avoid excessive leverage, protect capital with a stop-loss, and do not move your invalidation level simply because the market moves against your position. If buyers cannot reclaim $3,900, patience may be more valuable than forcing a trade. Do you think XAUT can reclaim $3,900 and continue toward $3,975, or will sellers push the price back toward $3,800? DYOR. This is market commentary, not financial advice. #WSOTShowYourAITradeToEarn10USDT $LAVAUSDT

$DOGEUSDT deserves a closer look, but the first priority is identifying the exact asset and separating genuine market demand from speculative activity. Market Structure and Liquidity DODGE has multiple tokens circulating under similar names and tickers. Publicly indexed market data does not establish a reliable, unified DODGEUSDT market with verified current price, market capitalization, seven-day performance or derivatives positioning. Therefore, assigning precise support, resistance or price targets without confirming the Bybit contract would create false precision. For traders, liquidity is particularly important. A sharp price increase in a thin market can reflect limited selling liquidity rather than sustained buying demand. A credible breakout requires expanding trading volume, consistent spot participation and successful retests of reclaimed resistance. Technical Intelligence The key signals to monitor are the 20 and 50 EMA for short-term momentum and the 100 and 200 EMA for broader trend direction. RSI and MACD should confirm improving momentum rather than simply reacting to a sudden price spike. A higher high followed by a higher low would strengthen the bullish structure. Conversely, repeated rejection near resistance and a breakdown below the previous swing low would indicate that sellers remain in control. The Market Contradiction The most important potential contradiction is price momentum versus market depth. A token can display impressive percentage gains while having insufficient liquidity to support meaningful buying or selling activity. This means price appreciation alone cannot establish genuine market strength. Volume quality and executable liquidity deserve greater weight until stronger evidence emerges. Fundamental and Token Economics Unlike established utility-driven protocols, DODGE cannot be assigned measurable network adoption, recurring protocol revenue or sustainable token demand without identifying its exact project and verified documentation. Token holders should examine circulating supply, wallet concentration, minting permissions, liquidity distribution and contract ownership. A concentrated supply can create substantial downside risk if large holders decide to sell. Trading Strategy Bullish scenario: Wait for a confirmed resistance breakout with expanding volume, followed by a successful retest. Only then should traders consider a potential continuation setup. Bearish scenario: If price loses its established support and selling volume expands, a further decline becomes possible. Avoid treating temporary rebounds as confirmed reversals. Without verified exchange-chart data, specific entries, TP1, TP2, TP3 and stop-loss levels would be speculative. The Overlooked Factor The biggest risk may not be chart direction but market identity and liquidity. Two tokens sharing the same ticker can have completely different contracts, supply distributions and trading conditions. Contract verification must come before technical analysis. Final Verdict DODGEUSDT needs stronger confirmation before it can be classified as a sustainable bullish opportunity. The most important condition is a verified market with sufficient liquidity and a breakout supported by genuine spot demand. Would you prioritize DODGE's price momentum, or wait for stronger liquidity and volume confirmation before considering a position?#ByXIMPACT


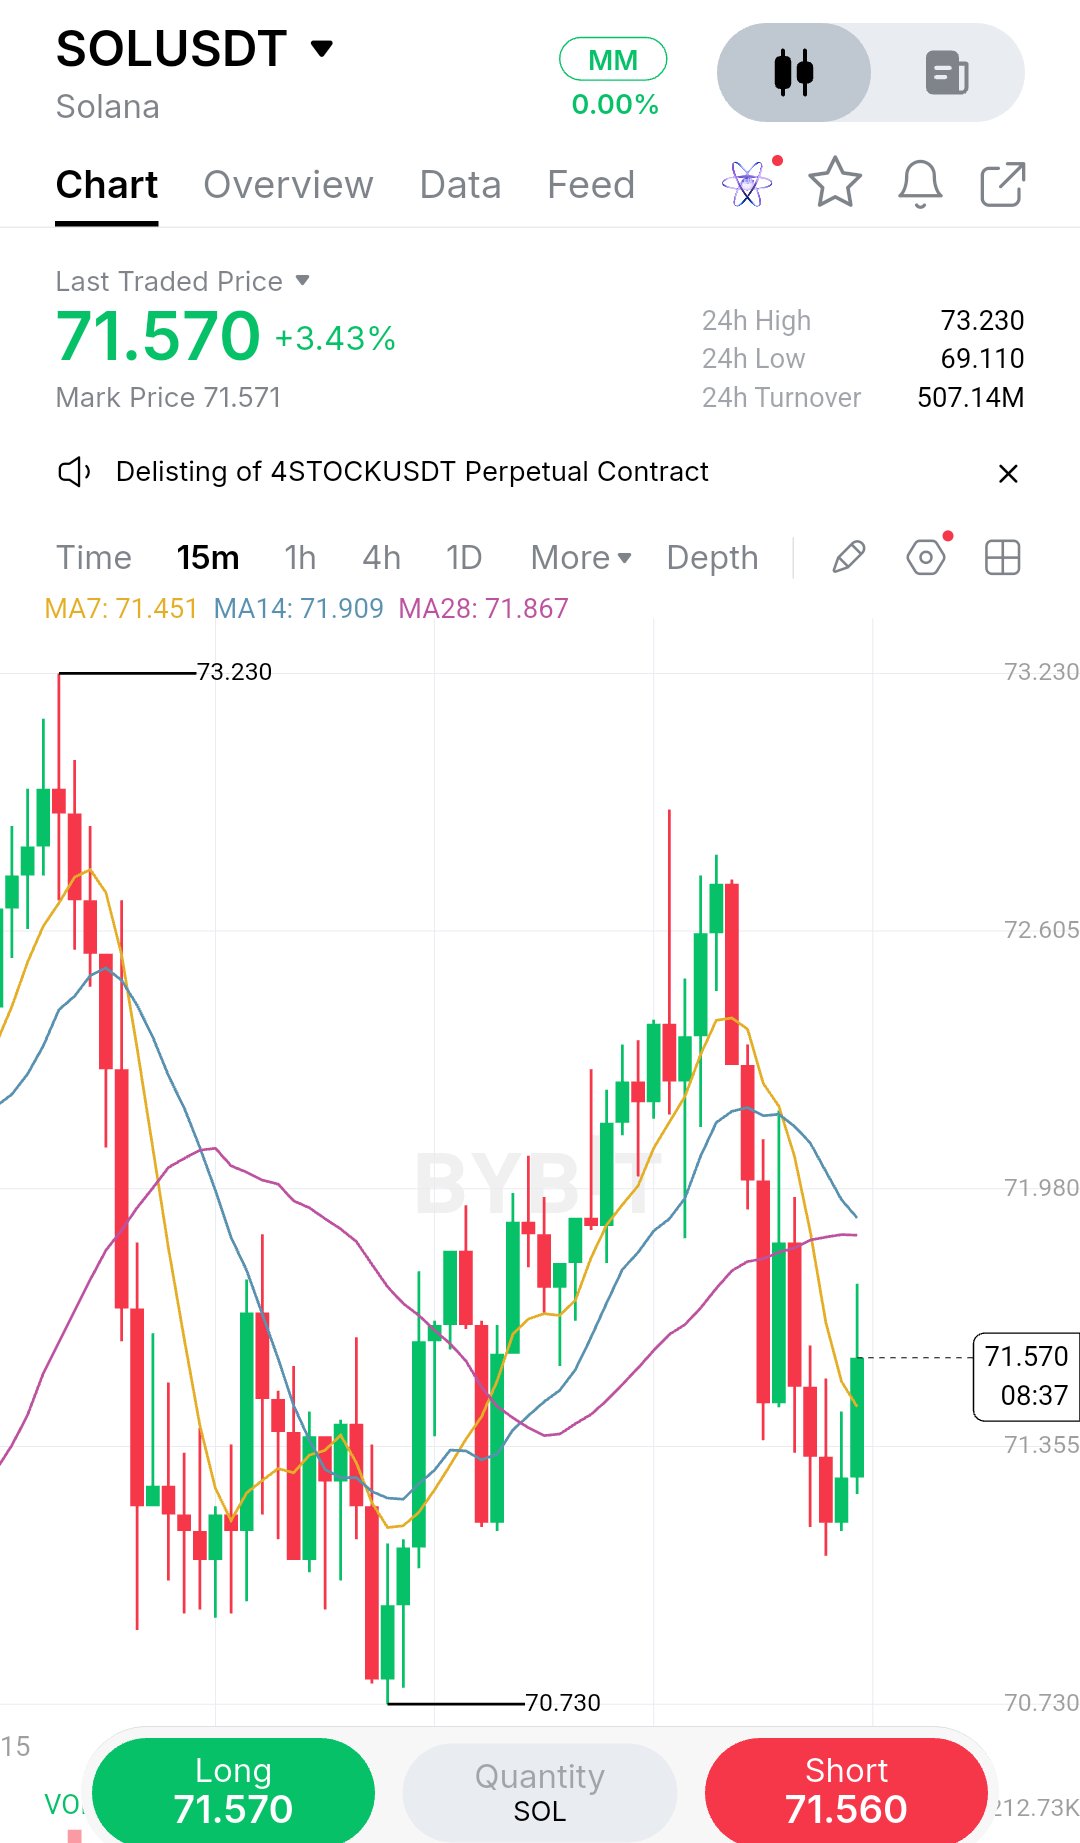
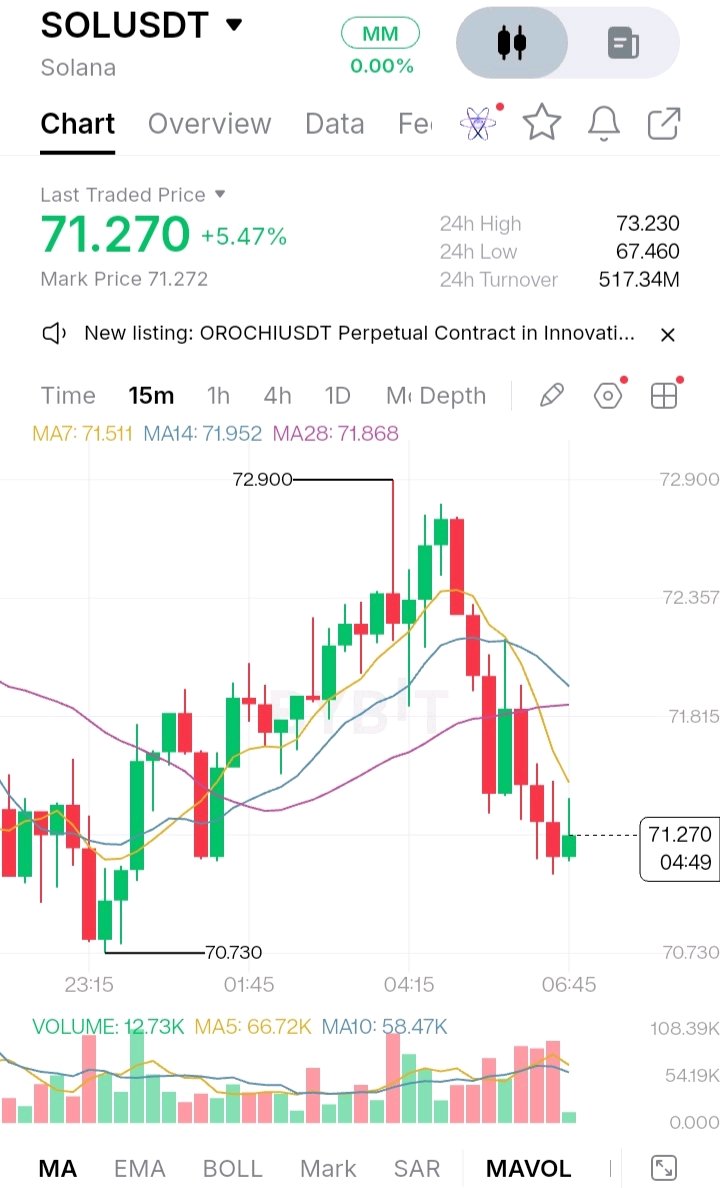
Solana is testing trader nerves right at a make or break intraday pivot after a sharp rejection near $72.900. Despite holding onto a solid 5.47% gain on the day with over 517.34M in 24h turnover the 15-minute SOLUSDT chart shows momentum hitting a clear wall. After climbing steadily off the 70.730 local low and pushing toward the 24h high of 73.230 sellers stepped in aggressively just under 72.900. That rejection triggered a swift pullback right through the short-term moving averages. Price is now trading at 71.270 sitting below the MA7 (71.511), MA14 (71.952) and MA28 (71.868), turning previous intraday support into immediate overhead resistance. For bulls, defending the 71.000 to 70.730 zone is now critical to keep the broader upward structure intact. If buyers can absorb this selling pressure and reclaim the 71.950 cluster, another run at the 73.230 high comes right back into play. Lose 70.730, however and the door opens for a deeper flush toward the 67.460 24h low. Watch how price reacts around 71.270 over the next few candles this level will decide whether the dip gets bought or turns into a full trend reversal. $SOLUSDT #ByXIMPACT

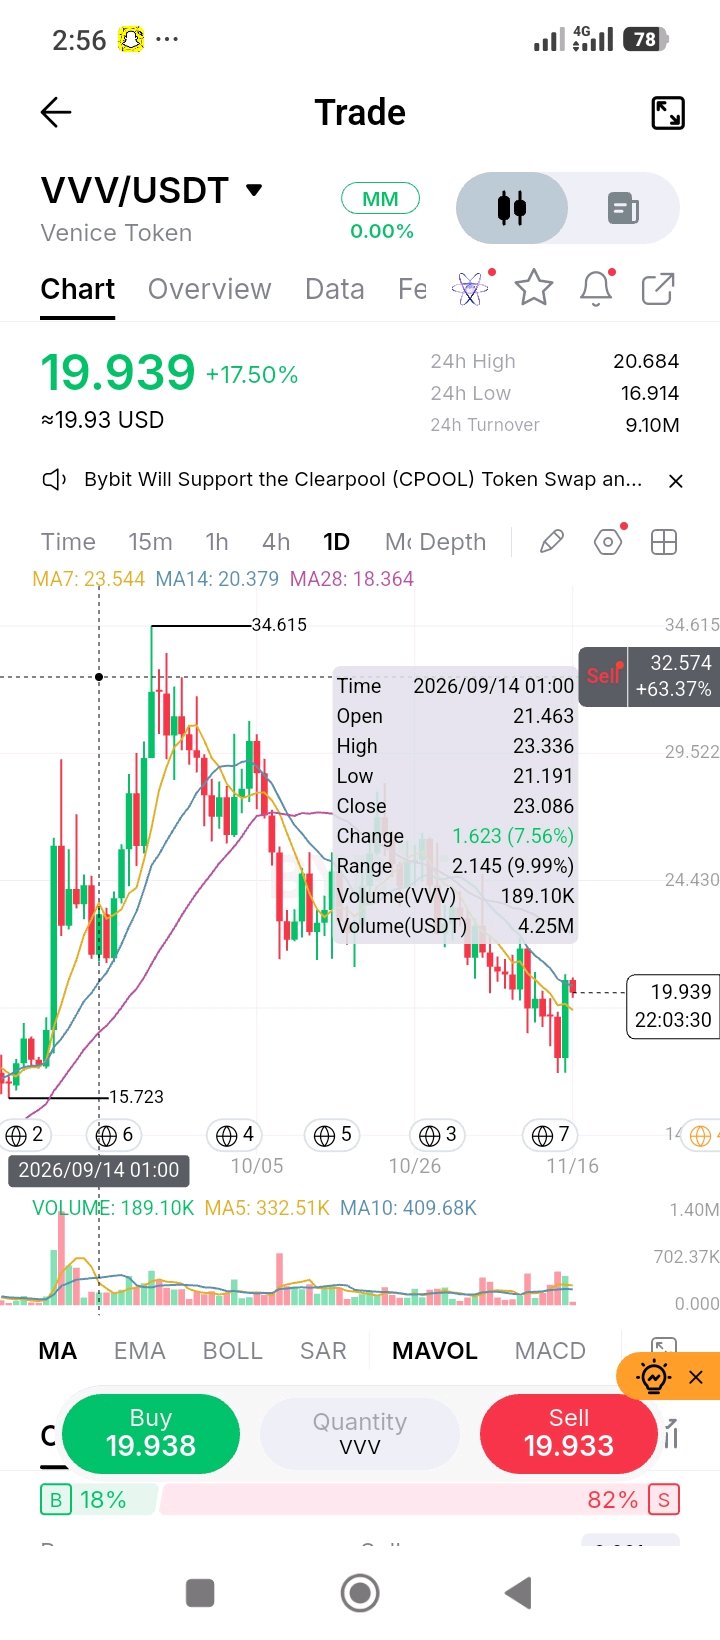
#ByXIMPACT $VVVUSDT is staging a massive relief bounce on the Daily chart, currently trading at 19.939, up a staggering 17.50% on the day. Happy new week. If you want to make the Top 100 on ByX this week, this is exactly the type of high conviction setup you need to master. The macro structure has been a bloodbath. Price collapsed from a major high of 34.615 all the way down to a swing low of 16.914. However, today is a different story. After bleeding for days, the market finally found a hard floor. Buyers aggressively stepped in at the lows, and the current daily candle is printing a massive, full bodied green candle, completely engulfing the recent selling pressure. This is a classic mean reversion bounce after an extended downtrend. Turnover 24 hour turnover is sitting at 9.10M USDT. For a daily chart, this is a moderate but not deep liquidity environment. The key data point here is the historical context you pulled up in the tooltip. Back on September 14th, during the initial breakdown phase, a single candle saw 4.25M USDT in volume with a range of 9.99%. That tells us there is real capital moving this asset when it trends. The current daily turnover shows enough liquidity to trade, but it is still sensitive to sudden flow. Volume Current volume is tracking solidly. Looking at the visual volume profile, the recent red selling candles were losing volume as they dropped, which signaled seller exhaustion. Now, this massive green bounce candle is accompanied by an uptick in volume. The tooltip shows that historical September candle traded 189.10K VVV. If today’s volume closes near or above that historical average, it confirms that real buyers, not just short covering, are driving this reversal. Moving Averages MA7 is at 23.544, MA14 is at 20.379, and MA28 is at 18.364. This is the most important technical setup on the chart. Price aggressively dumped, sliced through the MA14, but found perfect, textbook support exactly at the MA28 at 18.364. It has now bounced violently and is currently battling the MA14 at 20.379. The MA7 is still far above price, meaning the macro trend is still down, but the short term momentum has completely flipped. Levels to Watch • 16.914 is the daily swing low and the hard floor. • 18.364 is the MA28. The structural support that just held perfectly. • 20.379 is the MA14. This is the immediate battleground. A daily close above this confirms the momentum shift. • 23.544 is the MA7. The next major resistance. • 34.615 is the macro high. Consideration Look at the order book. It is extremely skewed, showing 18% buyers and 82% sellers. Retail is aggressively trying to short this bounce. They are looking at the macro downtrend and assuming this is a dead cat bounce. This is a massive trap. When price rejects a major moving average like the MA28 and rips 17% in a day, shorting it is dangerous. If price pushes through the MA14 at 20.379, those 82% of sellers will be forced to cover, creating a violent short squeeze that could easily push the price back to the 23.00 region. Trade Plan • The Bullish Path: A confirmed daily close above 20.379 (MA14). This traps the 82% of short sellers and opens a run to the MA7 at 23.544. • The Bearish Path: A rejection here leaving a long upper wick, followed by a daily close back below the MA28 at 18.364. This invalidates the bounce and sends price back to the lows. • My take: The setup is incredibly juicy, but you do not chase a candle that is already up 17.50%. I want to see how the daily candle closes. If it closes strong above the MA14, I will look for an intraday pullback to enter a long and ride the short squeeze. If it rejects here, I will wait for a daily close to look for a short. Support and Resistance Support is heavily layered at 18.364, followed by the major floor at 16.914. Resistance sits at the immediate battleground of 20.379, followed by 23.544. Invalidation and Risk Note The bullish thesis is invalidated on a daily close below 18.364 (MA28). The biggest risk here is a failed breakout at the MA14. In a macro downtrend, relief rallies often die at the first major moving average. If it rejects here, the 18% of buyers will get trapped. Do not use market orders. Wait for the daily candle to close. Size your position so you can survive a 15% wick in either direction.

MANTLE (MNT): More Than Just
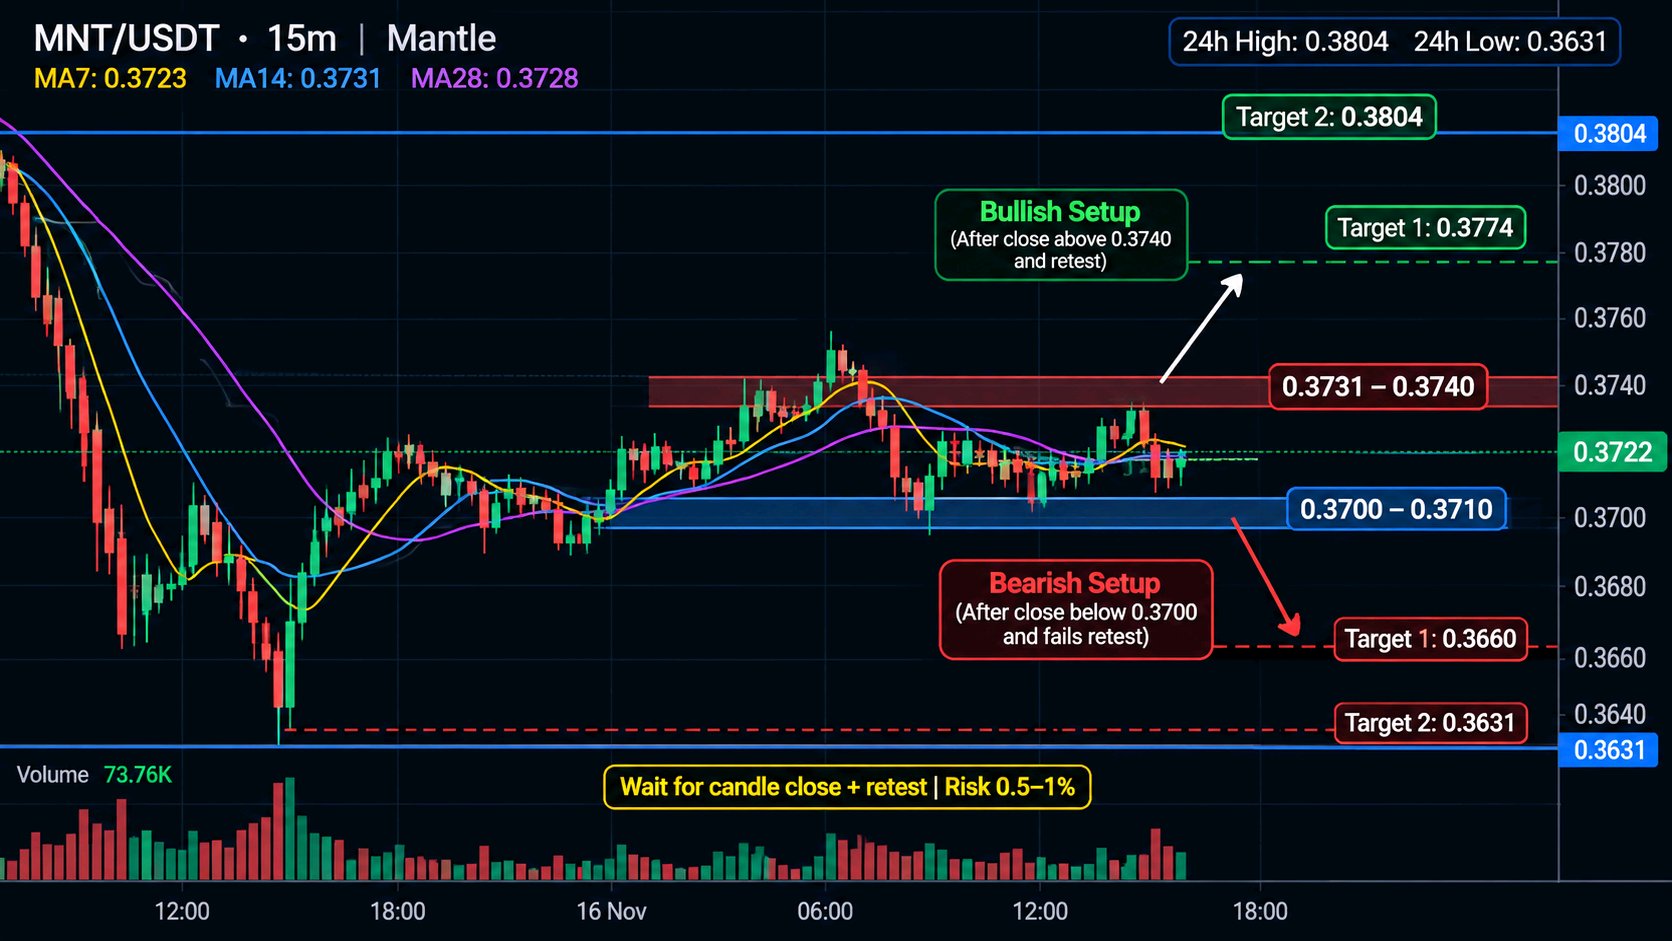
MANTLE (MNT): More Than Just Another Ethereum Layer-2 Token Mantle is building around a real blockchain challenge: making Ethereum-based applications more scalable and efficient. Its modular architecture separates key blockchain functions, while its Ethereum compatibility helps developers work with familiar tools and smart contracts. What makes $MNT important? - Network Utility: MNT is used to pay transaction fees on Mantle Network. - Governance: MNT holders can participate in ecosystem and treasury decisions. - Ecosystem: Mantle supports decentralized applications and on-chain financial activity. The interesting part is that MNT has an actual role inside its network, beyond market speculation. Its long-term progress depends on real usage, ecosystem growth and execution. 📊 MNT/USDT | 15M Trading Strategy Current price: 0.3722 My unique setup: MA Compression + Retest Trigger Instead of chasing every green candle, I watch the three moving averages compress and wait for price to prove its direction. 🟢 LONG SETUP - Trigger: 15m candle closes above 0.3740. - Entry: 0.3735–0.3740 after a successful retest. - Stop Loss: 0.3710. - TP1: 0.3774. - TP2: 0.3804. 🔴 SHORT SETUP - Trigger: 15m candle closes below 0.3700. - Entry: Failed retest of 0.3700. - Stop Loss: 0.3725. - TP1: 0.3660. - TP2: 0.3631. The trading edge: Let the market reveal its direction first. A breakout without a successful retest is not my entry signal. Risk only 0.5–1% of trading capital per setup. These are conditional levels from the supplied chart, not guaranteed outcomes. What interests you more about Mantle: its Ethereum scaling technology or the trading opportunity in $MNT? #ByXIMPACT $MNTUSDT
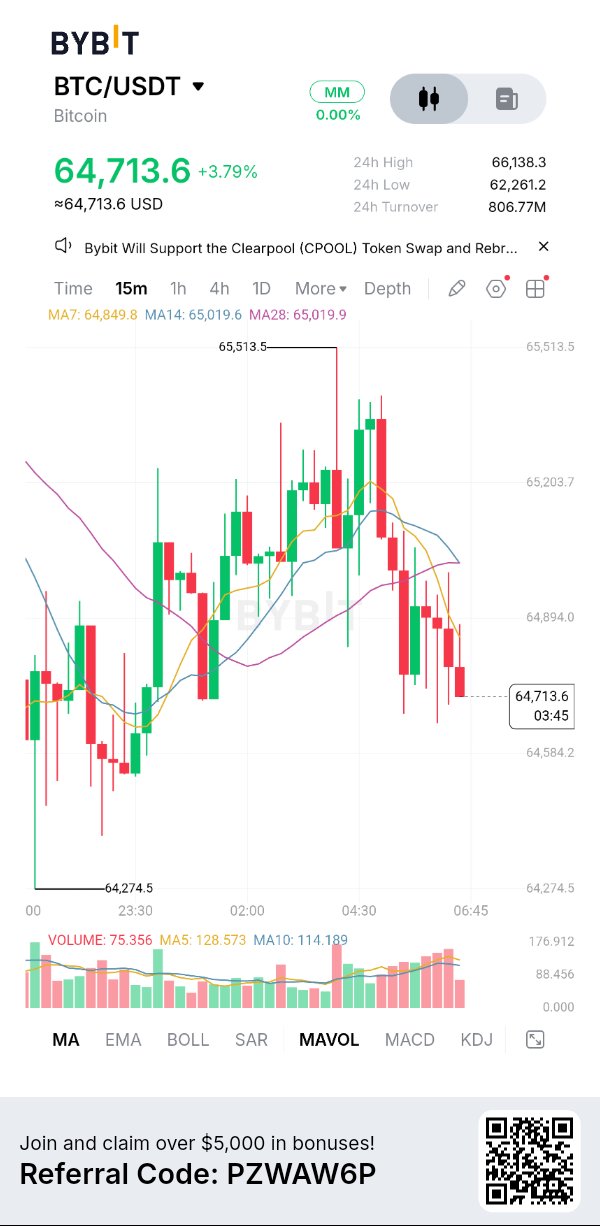
Bitcoin is showing a serious battle between exhausted sellers and buyers desperately searching for a floor. After suffering a massive correction from the $87,000 region, BTC is now hovering around $65,000, and the broader daily structure remains heavily damaged. What makes this situation particularly interesting is that the market is approaching a critical demand region where the next reaction could determine whether Bitcoin stabilizes or extends its correction even further. Looking closely at the daily chart, Bitcoin is trading significantly below its major moving averages. The EMA50 is around $77,131, while the EMA200 is near $77,735 on the reference daily analysis. This leaves a substantial resistance structure overhead, confirming that the broader trend remains under pressure. The RSI is sitting around 24, deeply inside oversold territory. Meanwhile, the daily MACD histogram remains negative, showing that bearish momentum is still a major concern. However, I would not ignore the possibility of a temporary relief rally after such an aggressive decline. Here is what I am watching closely: 📉 Critical Support Zone: Bitcoin is approaching the $62,830–$62,180 region. This is an important support area where buyers need to demonstrate meaningful strength. A decisive daily close below this zone could expose BTC to another wave of downside pressure. 🎯 Downside Targets: If the current support fails, the next levels I am watching are $60,350 and $58,720. A sustained breakdown below these areas would indicate that the corrective structure is extending further. 📈 Recovery Scenario: On the upside, Bitcoin first needs to reclaim $66,937. Above that, the $68,565 region becomes the next important resistance. A convincing move beyond $70,000 would provide stronger evidence that buyers are beginning to regain control. Momentum & Market Structure The most important thing right now is understanding the difference between an oversold market and a confirmed reversal. RSI near 24 tells us that selling pressure has been extremely aggressive, but it does not guarantee that the bottom is already in. Bitcoin can remain oversold while sellers continue controlling the trend. I want to see a meaningful change in market structure, stronger buying volume, and a confirmed higher low before considering a bullish shift. Trading Strategy & Risk Management I am not interested in chasing Bitcoin with a fresh short position after such an extended decline. Selling directly into major support without confirmation can expose traders to an aggressive relief bounce. My focus is on two possible scenarios. If BTC bounces toward the $66,937–$68,565 resistance region and sellers produce a clear rejection, a potential lower-high short setup could develop. I would require a confirmed entry, a stop-loss above the resulting swing high, and a worthwhile risk-to-reward ratio. On the other hand, if buyers successfully defend the $62,180 support region, establish a higher low, and reclaim nearby resistance, a short-term recovery opportunity could emerge. A sustained daily breakdown below $62,180 would invalidate the immediate recovery scenario. Conversely, a strong reclaim above $68,565 would weaken the bearish continuation thesis and bring the $70,000 region into focus. Bitcoin is at a critical technical decision point. The market has already experienced substantial damage, but the next move still needs confirmation. I would rather miss the first part of a recovery than enter blindly and risk unnecessary losses. Respect the trend, protect your capital, and let price action reveal the next opportunity. $BTCUSDT #ByXIMPACT
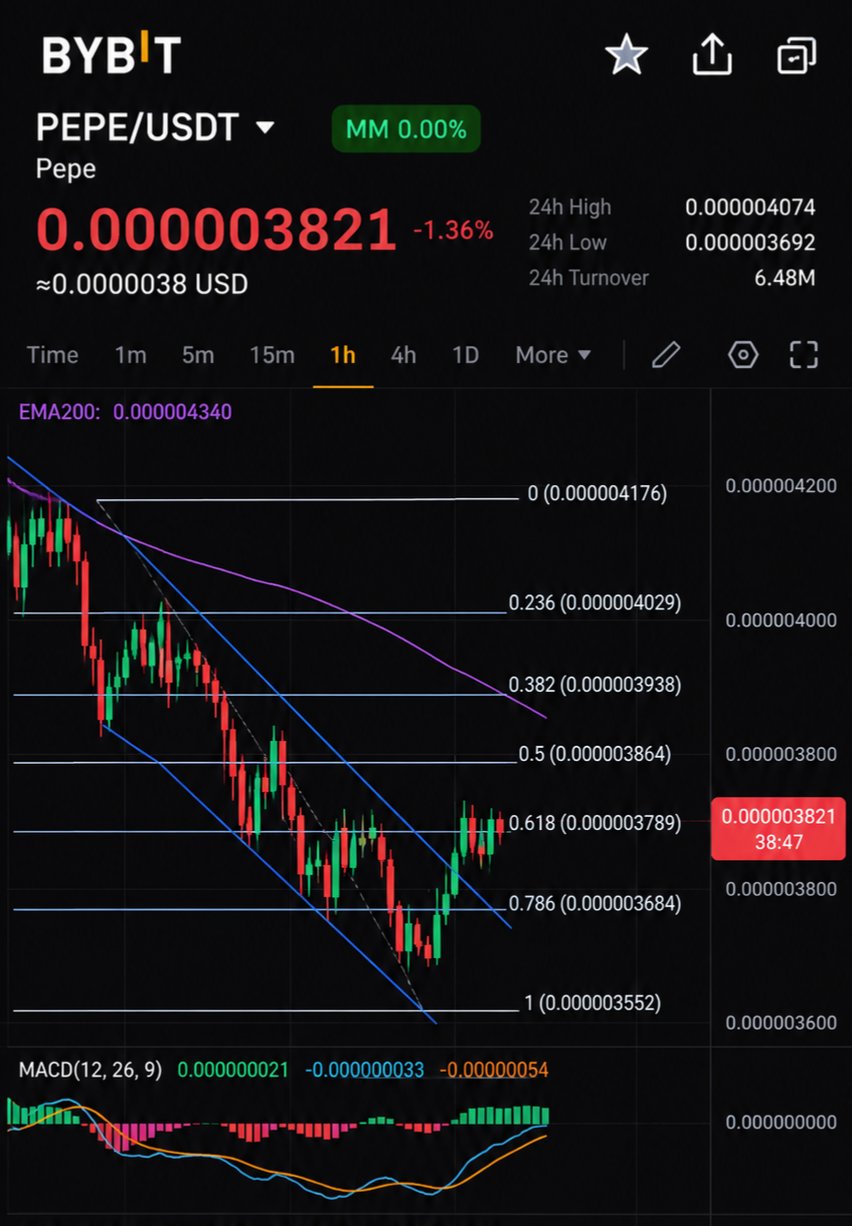
PEPE is showing a small recovery, but the 1H chart suggests buyers still have work to do. $PEPE is trading around $0.000003821, up 0.45% over 24 hours. However, price remains below all three key moving averages: MA7: $0.000003858 MA14: $0.000003902 MA28: $0.000003909 This is the level I’m watching closely. The recent bounce from $0.000003692 has not yet changed the short-term structure. PEPE needs to reclaim the $0.00000390 to $0.00000392 zone with stronger volume to show that buyers are gaining control. On the downside, $0.000003764 is the first important support, followed by the recent swing low at $0.000003692. My observation: PEPE is trying to stabilize after a sharp decline, but a green 24H reading alone does not confirm a trend reversal. The real signal will be whether buyers can reclaim resistance and sustain it with volume. $PEPEUSDT #ByXIMPACT

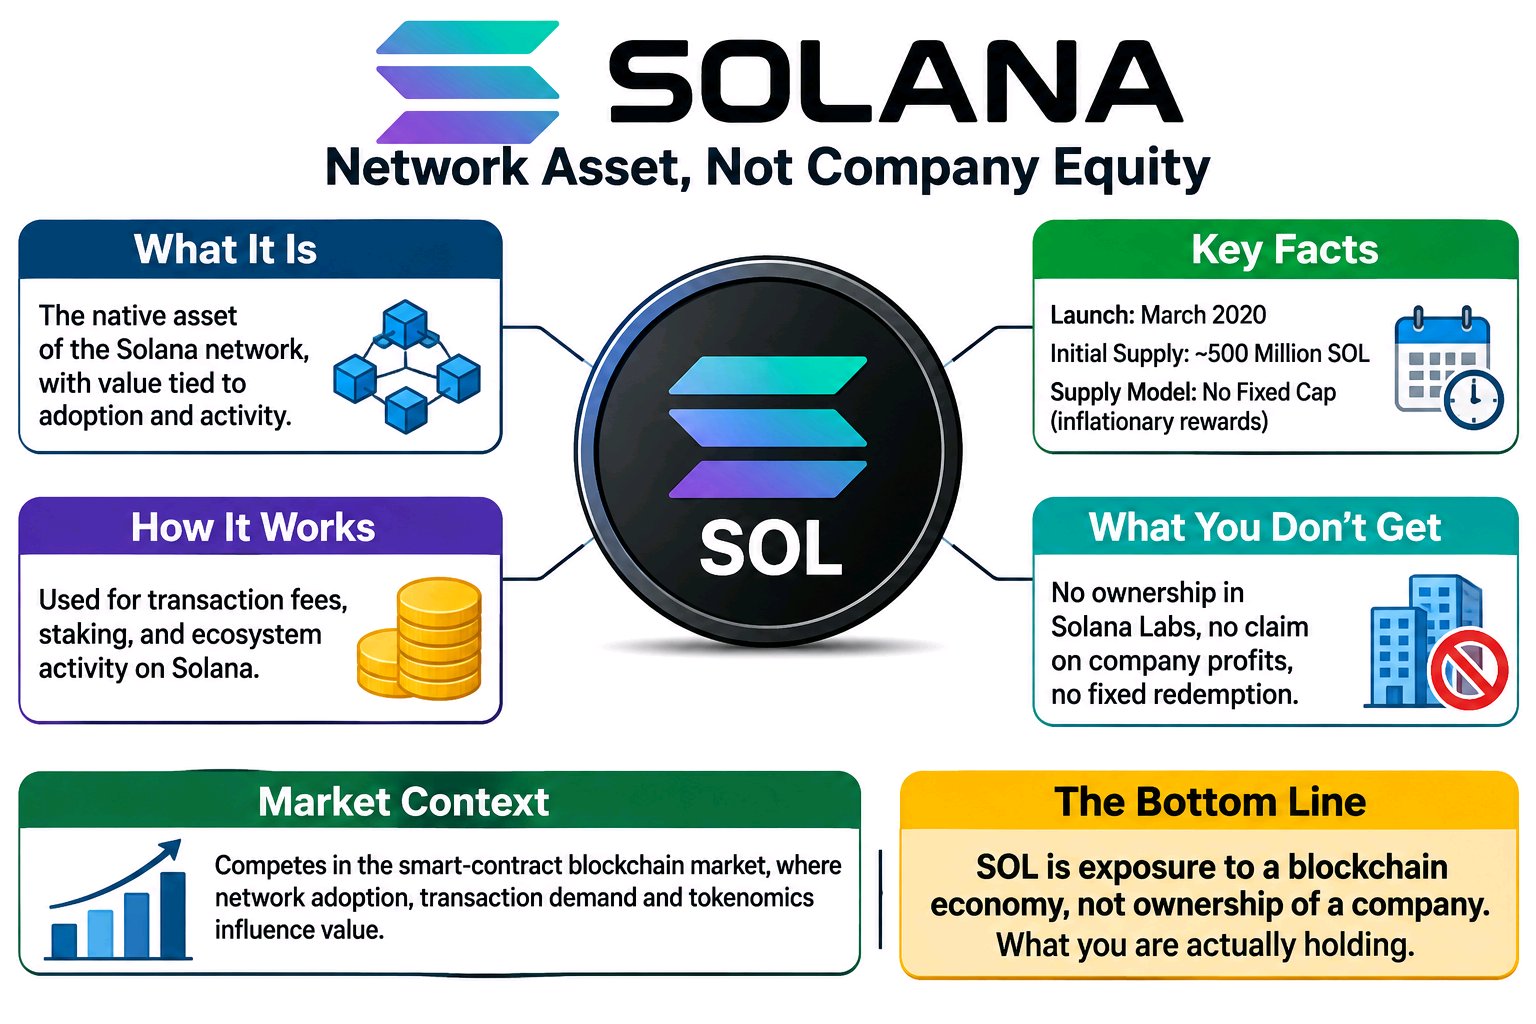
SOL may be treated as a bet on Solana's success, but it is neither company equity nor a dollar-pegged asset. It is the native asset of the Solana network, with its value tied to market demand, network activity, and its role in securing the blockchain. Solana launched in March 2020 with an initial supply of approximately 500 million SOL. Unlike Bitcoin, SOL does not have a fixed maximum supply; new tokens enter circulation through inflationary staking rewards, while transaction fees are partly burned. That distinction is easy to miss if you only read the headline. Holding SOL does not give you ownership of Solana Labs, a claim on company profits, or a guaranteed redemption value. It gives you exposure to a network asset used for transaction fees, staking, and economic activity across Solana's ecosystem. Staking can generate rewards, but those rewards come with inflation and validator-related considerations. The scale matters. Solana competes in the broader smart-contract blockchain market, where network adoption, transaction demand, competing ecosystems, token issuance, and market liquidity all influence the asset's value. A growing network does not automatically guarantee a rising SOL price, because network usage and token-holder returns are not the same thing. SOL is exposure to a blockchain economy, not ownership of a company. What matters is what you are actually holding. #ByXIMPACT$SOLUSDT

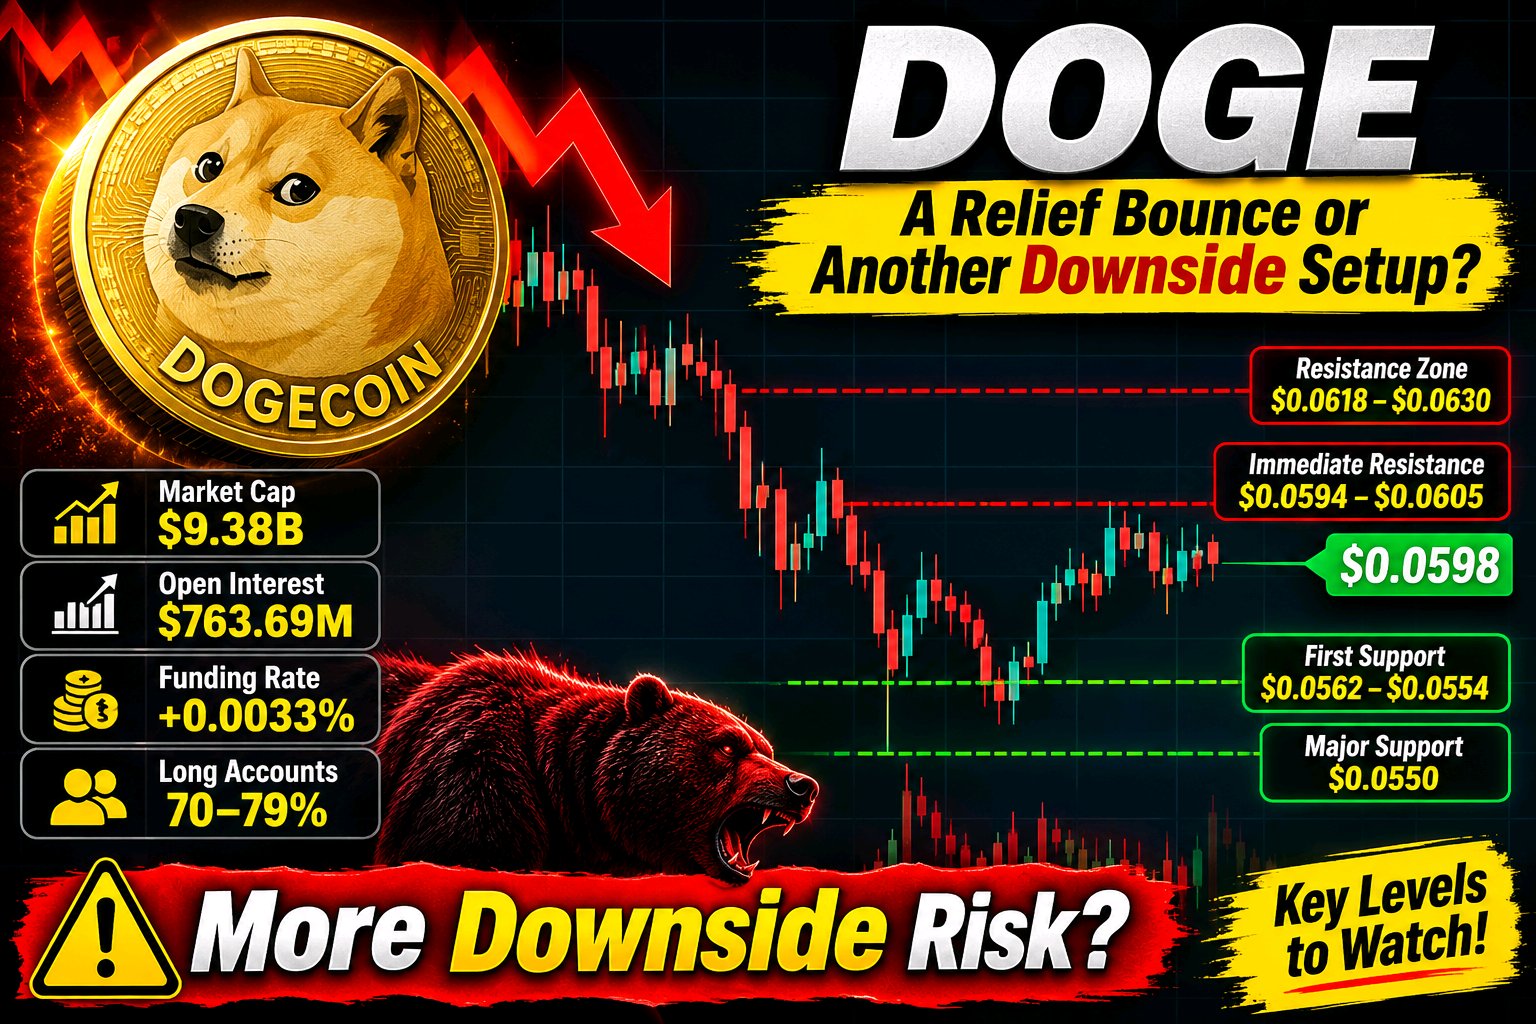
#ByXIMPACT $DOGEUSDT – A Relief Bounce or Another Downside Setup? Dogecoin is trading near $0.0598, recovering from a recent low around $0.0554. Despite the roughly 4.4% 24-hour rebound, DOGE remains down approximately 14.5% over seven days. I am not treating this stabilization as a confirmed recovery yet. The bigger concern is weak institutional demand, elevated futures exposure, and heavily long-tilted positioning that could create additional downside pressure. CoinGlass +1 DOGE has a market capitalization of approximately $9.38 billion. The recent decline has left its broader daily structure under pressure, despite the latest bounce. * Immediate resistance: $0.0594–$0.0605 * Next resistance: $0.0618–$0.0630 * First support: $0.0562–$0.0554 * Major nearby support: $0.0550 A sustained reclaim of $0.0605 would improve short-term momentum and potentially open $0.0618–$0.0630. However, the broader bearish structure remains intact until stronger buying confirms a trend change. Borearis +2 The institutional demand picture remains unconvincing. U.S. spot Dogecoin ETFs reported no net flows on November 13, with two of three funds reporting. The latest 30-session data showed approximately $539K in net outflows and virtually no fresh inflow activity. Meanwhile, DOGE futures volume is approximately 7.4 times spot volume. This suggests derivatives activity is dominating price participation rather than strong, consistent spot accumulation. Crypto ETF +1 The key question remains whether spot buyers can absorb available supply or whether the latest rebound is primarily leveraged positioning. DOGE is attempting to stabilize after a substantial decline, with the recent trading range developing around $0.0554–$0.0601. A narrow range following a sharp sell-off is not evidence of accumulation. The market needs stronger spot volume and sustained acceptance above resistance. Otherwise, another liquidity sweep below $0.0554 remains possible, potentially exposing lower support zones. Current derivatives data deserves close attention. * Total open interest: approximately $763.69M * 24-hour OI change: +1.29% * Weighted funding rate: +0.0033% * Binance long accounts: approximately 70.3% * Bybit long accounts: approximately 79.0% * 24-hour liquidations: approximately $2.67M, including $1.67M in longs. Funding is positive overall, meaning longs are paying shorts, although funding differs across exchanges. The important issue is that a substantial majority of accounts are positioned long. This creates vulnerability if support breaks, particularly with open interest increasing during the latest rebound. A downside move could trigger fresh long liquidations. CoinGlass +1 | Metric | Level | | -------------------- | -------- | | Current price | $0.0598 | | Market cap | $9.38B | | 7-day change | -14.5% | | Immediate resistance | $0.0605 | | First support | $0.0562 | | Recent low | $0.0554 | | Open interest | $763.69M | | Funding rate | +0.0033% | | Long accounts | 70–79% | Bullish confirmation: A decisive reclaim and sustained hold above $0.0605 would improve the short-term structure, opening potential tests of $0.0618 and $0.0630. Strong spot participation is necessary to validate this move. Bearish confirmation: A confirmed breakdown below $0.0554 would expose $0.0536, followed by the $0.0499 region. Elevated long positioning could accelerate the decline through forced liquidations. fullswing.ai +1 DOGE is showing temporary stability, but the broader recovery argument remains unproven. Weak institutional ETF demand, derivatives-heavy trading activity, and crowded long positioning continue to create an unfavorable risk profile. A short-term bounce does not automatically mean selling pressure has disappeared. The decisive signal is whether genuine spot buyers return while leverage remains controlled, or whether another support breakdown triggers a fresh wave of long liquidations. For now, DOGE deserves a cautious, neutral-to-bearish outlook until stronger market structure confirms otherwise.

Solana демонструє цікаву розбіжність: мережева активність залишається суттєвою, проте SOL втратив понад 16% за сім днів. Припливи у спотові ETF почали повертатися після серії відтоків, тоді як позиціювання деривативів зазнало значного перезавантаження. Важливе питання полягає в тому, чи зможе інституційний попит поглинути тиск продавців, чи останні відскоки — це просто тимчасове відновлення. SOL торгується поблизу $72.13 з ринковою капіталізацією близько $42.85 млрд і 24-годинним обсягом торгів близько $3.6 млрд. Ціна зросла приблизно на 2.38% за 24 години, але все ще залишається на 16.66% нижчою за показники семиденної давнини. Останній 24-годинний діапазон становить $67.35–$73.22. Покупці відновилися після нещодавнього мінімуму, але $73.22 залишається найближчим рівнем опору. Впевнений рух вище $77 став би сильнішим доказом того, що відновлення набирає обертів. Інституційна картина починає покращуватися. Спотові ETF на Solana в США зафіксували приблизно $1.69 млн чистого припливу 12 листопада, що поклало край п'ятиденній серії відтоків. Сукупні чисті припливи залишаються на рівні близько $1.414 млрд. Це важливо, оскільки інституційні продукти забезпечують ще одне джерело регульованого доступу до SOL. Проте одна позитивна сесія не свідчить про стале повернення інституційного попиту. Послідовні припливи важитимуть більше, ніж одноразове відновлення активності в ETF. Мережеві фундаментальні показники дають ще один важливий сигнал. DeFiLlama повідомляє про приблизно $4.805 млрд TVL у секторі DeFi на Solana, а обсяг стейблкоїнів становить близько $13.96 млрд. Мережа опрацювала близько 104 млн транзакцій за 24 години та згенерувала близько $448,750 мережевих комісій. Добовий обсяг DEX досяг приблизно $1.386 млрд, хоча тижнева активність DEX знизилася на 19.11%. Це показує, що Solana продовжує підтримувати значну фінансову активність, проте тижневе уповільнення свідчить про те, що попит в екосистемі не є імунним до загальної слабкості ринку. Існує також довгостроковий інституційний розвиток, на який варто звернути увагу. Ініціатива токенізації DTCC визначила Solana серед блокчейн-мереж, що розглядаються для майбутньої інтеграції послуг з токенізації. Це може зміцнити позиції Solana у традиційній фінансовій інфраструктурі. Проте заплановане розширення — це розвиток на майбутнє, а не поточний інституційний капітал, що прямо вливається в SOL. Фактичний вплив залежатиме від впровадження та вимірюваного використання. Деривативи показують, що спекулятивна експозиція була значно зменшена. Сукупний відкритий інтерес за безстроковими ф'ючерсами становить приблизно $4.13 млрд, а ставка фінансування (funding) є від'ємною і становить близько -0.0102% за вісім годин. Приблизно $23.24 млн у позиціях було ліквідовано за 24 години, з яких близько $14.63 млн припадало на довгі позиції. Історичні дані про позиціювання також показують, що відкритий інтерес різко впав з приблизно $558 млн 4 листопада до $327 млн 14 листопада на одній з відстежуваних платформ. Це скорочення кредитного плеча може зробити ринок менш вразливим до перевантажених довгих позицій, але від'ємна ставка фінансування сама по собі не підтверджує бичачий розворот. Ключові показники $72.13 — Поточна цінова зона $42.85 млрд — Ринкова капіталізація $3.6 млрд — 24-годинний обсяг торгів $67.35–$73.22 — 24-годинний діапазон -16.66% — Семиденна динаміка 591.63 млн SOL — Циркулююча пропозиція $4.805 млрд — TVL у DeFi $13.96 млрд — Пропозиція стейблкоїнів $1.386 млрд — 24-годинний обсяг DEX 104 млн — 24-годинна кількість транзакцій у мережі $1.414 млрд — Сукупні чисті припливи у спотові ETF $4.13 млрд — Сукупний відкритий інтерес за безстроковими контрактами -0.0102% — Зважена ставка фінансування за вісім годин $23.24 млн — 24-годинні ліквідації Бичаче підтвердження: SOL має повернути рівень $73.22 і закріпитися вище $77 завдяки сильнішим спотовим покупкам. Це може відкрити шлях до $80–$83, а потім до зони $86, якщо інституційні припливи продовжуватимуть покращуватися. Ведмеже підтвердження: Втрата $67.35 і нездатність повернути цей рівень послаблять спробу поточної стабілізації та відкриють шлях до психологічної підтримки на $65, а за нею — до зони $60 у разі прискорення продажу. Solana все ще має суттєву ліквідність у мережі, активну інфраструктуру DeFi та налагоджений канал інституційних інвестицій. Але ринок висвітлює важливу відмінність між мережевою активністю та негайним попитом на токен. Я спостерігаю за тим, чи стануть припливи в ETF послідовними, поки спотові покупці повертають собі рівень опору. Перезавантаження деривативів зменшило частину ризиків, пов'язаних з кредитним плечем, але без сильнішої спотової участі це відновлення залишається непідтвердженим. $SOLUSDT #ByXIMPACT

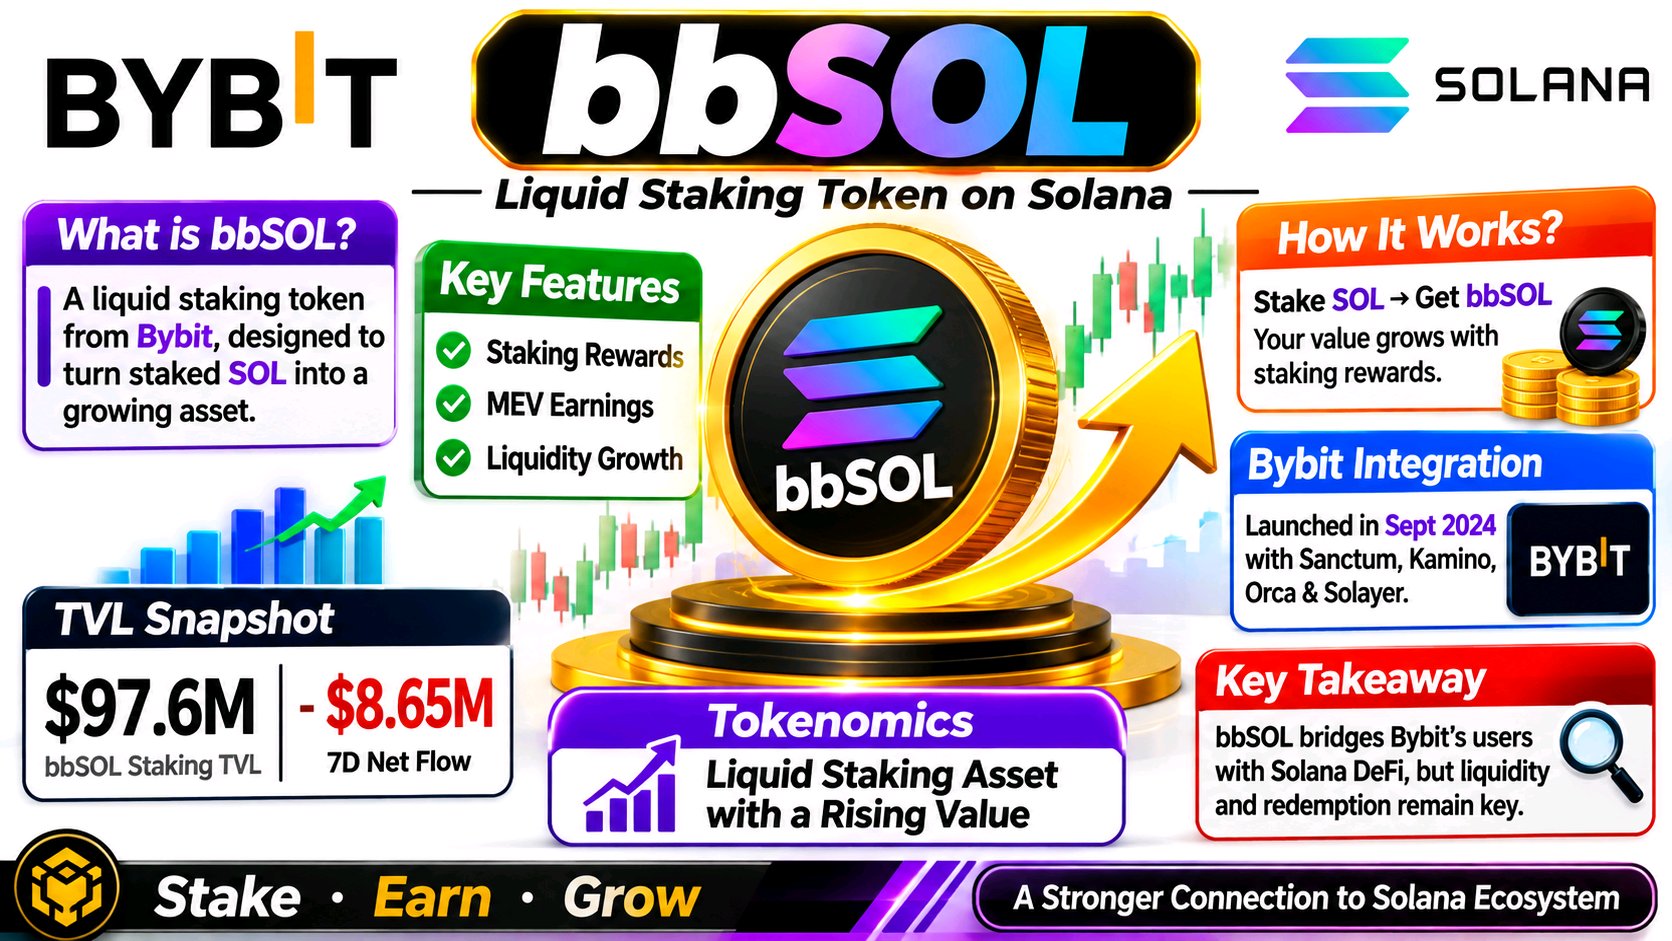
What stands out about bbSOL is that its real value is not simply earning Solana staking rewards. The more important question is whether Bybit can turn a centralized exchange's user base into sustained liquidity across Solana DeFi. That distinction matters because bbSOL is not an independent blockchain or a conventional governance token. It is a liquid staking asset issued through Bybit, with its value designed to appreciate against SOL as staking rewards accumulate. What caught my attention about bbSOL is the gap between its institutional story and the liquidity actually moving through its markets. Bybit introduced bbSOL in September 2024 with Sanctum, Kamino, Orca and Solayer. The product turns staked SOL into a liquid receipt: staking rewards, MEV and liquidity-related earnings accrue through a rising bbSOL-to-SOL exchange rate rather than regular cash payouts. Bybit’s documentation also makes the trade-off clear: a 0.1% deposit fee applies, and larger redemptions can take an epoch, roughly two to three days. So “liquid” does not mean frictionless under every condition. prnewswire.com +2 The more interesting development is distribution. Bybit announced Anchorage Digital custody support in October 2025, potentially making bbSOL easier for institutions to hold. But institutional access is not the same as institutional demand. DeFiLlama’s latest snapshot lists roughly $97.6 million in bbSOL staking TVL and an approximately $8.65 million negative seven-day net flow. That suggests capital has recently been leaving, despite the expanded custody route. Bybit Press +1 This is the tension traders should focus on: bbSOL’s value proposition depends on SOL staking economics, but its market quality depends on redemption confidence and usable DeFi liquidity. A yield-bearing token can still trade with meaningful slippage or discount if exits become crowded. I would watch net flows, bbSOL/SOL pricing, pool depth and redemption conditions before treating new integrations as adoption. The key question is whether institutional access turns into persistent on-chain liquidity—or remains mostly a distribution headline. #ByXIMPACT $BBSOLUSDT

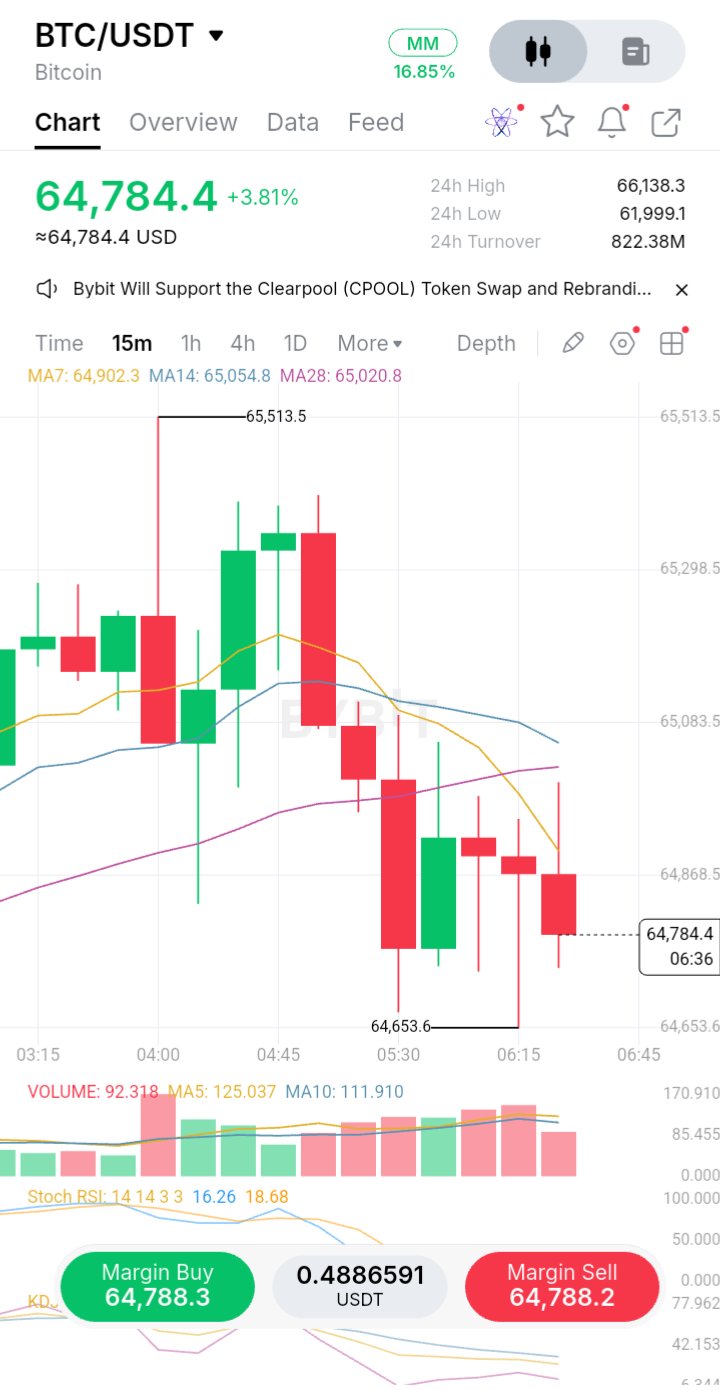
$BTCUSDT is attempting to stabilize after a sharp sell-off, but the recovery is facing a more important test than simply holding above $64,000: can spot demand absorb selling pressure, or is this rebound being driven mainly by short-term derivatives activity? Bitcoin is trading near $64,804 in the supplied Bybit snapshot, up 3.42% over 24 hours. However, the broader move remains weak. BTC has fallen roughly 12.6% over seven days, while the recent decline pushed price toward $61,999 before buyers stepped in. Market Structure: The 4H chart remains bearish. BTC is below MA7 at $64,862, MA14 at $65,655 and MA28 at $68,633. On the 1H chart, price is also below MA7 ($65,058) and MA14 ($64,992), while the 15M structure shows sellers defending the $65,000 area. The immediate recovery therefore needs confirmation, not just green candles. The Derivatives Contradiction: CoinGlass data shows futures volume around $78.5B against spot volume of $7.56B — more than 10 times higher. Open interest is down 4.68% to approximately $41.6B, while 24H liquidations reached $335M. This combination points to significant leverage being removed rather than clear evidence of fresh, sustained accumulation. Funding remains close to neutral. Institutional demand is another concern: US spot Bitcoin ETFs recorded approximately $185.4M in net outflows on November 13. The November 10–13 period saw roughly $864M in cumulative outflows. Key Figures - Bybit price: $64,804.5 - 24H change: +3.42% - 24H high/low: $66,138 / $61,999 - Bybit turnover: $825.80M - Market cap: approximately $1.31T - Circulating supply: approximately 20.11M BTC - 7D performance: approximately -12.6% What Changes the Outlook? A sustained 4H reclaim of $65,655 would be the first meaningful improvement, followed by $68,633. Failure to hold $61,999 would put the recent recovery at risk. The key signal is not whether BTC can bounce, but whether spot buyers return strongly enough to support the move. Are we seeing early accumulation, or simply a relief rally during a broader deleveraging phase? NFA. DYOR. #ByXIMPACT


$BTCUSDT — Екстрене оновлення: Біткоїн відновився після тижневого мінімуму, але я не впевнений, що ринок оговтався від завданої шкоди. Біткоїн торгується на рівні близько $65 000, а останні доступні ринкові дані свідчать про відновлення за 24 години приблизно на 1,5%. Його ринкова капіталізація становить близько $1,30 трлн, тоді як обсяг спотової торгівлі — близько $7,5 млрд. Останній 24-годинний діапазон коливається від $61 956 до $66 093. Що ще важливіше, за останні сім днів біткоїн впав приблизно на 14%. Це не просто звичайний відкат. Мене турбує тиск, що стоїть за цим рухом. За 24 години було ліквідовано ф'ючерсних позицій на BTC приблизно на $328 мільйонів, тоді як відкритий інтерес знизився майже на 5%. Це свідчить про те, що кредитне плече скорочується, але це ще не доводить, що тиск продавців закінчився. Спотові біткоїн-ETF у США також зафіксували чистий відтік коштів у розмірі $185,4 мільйона 13 листопада, що стало сьомим поспіль сеансом виведення коштів. Інцидент із безпекою на Binance 29 жовтня додав ще один рівень невизначеності. Біржа підтвердила, що постраждали цифрові активи на суму приблизно $6,34 мільярда, і заявила, що покриє збитки. Проте я не бачив жодних перевірених доказів, що пов’язують цей інцидент із навмисною ліквідацією активів. Я віддаю перевагу підтвердженим фактам, а не поясненням, побудованим на ринкових чутках. Моє найбільше занепокоєння викликає те, що біткоїн не зміг втримати регіон $66 700–$72 500 на вищому таймфреймі, який я раніше вважав важливим. Ціна опустилася нижче цієї зони. Таким чином, тижнева структура пошкоджена, і я не називатиму цей рівень підтримки цілісним лише тому, що біткоїн відскочив від своїх мінімумів. Область $62 000–$63 300 тепер є найближчою зоною зниження. Стале відновлення вище $66 700 було б першою ознакою покращення, тоді як повернення до $72 500 забезпечило б вагоміші докази структурного відновлення. Тижневий прорив нижче $60 000 поставив би під серйозну загрозу загальну тезу про «бичаче» відновлення. Мій короткостроковий прогноз залишається «ведмежим», поки біткоїн не доведе протилежне. У довгостроковій перспективі я не готовий відмовлятися від ширшої інвестиційної тези, але це переконання не дає мені права ігнорувати погіршення ринкових умов. Мій підхід простий: захистити наявні позиції, уникати гонитви за ралі полегшення та дочекатися справжньої сили покупців, перш ніж підвищувати ризик. Тижнева свічка ще не закрилася, тому я хочу підтвердження, а не припущень. Я все ще вірю, що біткоїн може відбудувати свою структуру, але ринок повинен знову заслужити цю довіру. Якщо рівень $60 000 не встоїть на стабільній тижневій основі, я перегляну свій ширший прогноз, замість того щоб захищати застаріле передбачення. Для мене збереження капіталу важливіше, ніж бути правим щодо «дна». #ByXIMPACT


Як тільки я відкрив Bybit і побачив, що SPCXX знову піднімається до $140, моїм першим інстинктом було зрадіти. Після того, як графік впав із зони $147,56 до $133,51, повернення покупців здавалося можливим переломним моментом. Але досвід навчив мене відокремлювати емоції від фактів. Ось на що я звернув увагу: $SPCXXUSDT торгується по $139,35, що на 2,85% вище. На 1-годинному графіку ціна відновилася вище всіх трьох ковзних середніх: MA7 на рівні $139,31, MA14 на $138,98 та MA28 на $137,74. MACD також у позитивній зоні, що свідчить про покращення короткострокового імпульсу. Однак я поки що не називаю це підтвердженим розворотом тренду. Опір на рівні $140,53 — це найближче випробування. Переконливий прорив із сильнішим обсягом може відкрити шлях до вищих рівнів. Відскік може відправити ціну назад до $138 або навіть $137. Мій підхід? Чекати підтвердження, керувати ризиками та не ганятися за зеленими свічками. Я пережив достатньо циклів, щоб знати: відновлення — це не те саме, що розворот. #ByXIMPACT $DOGEUSDT



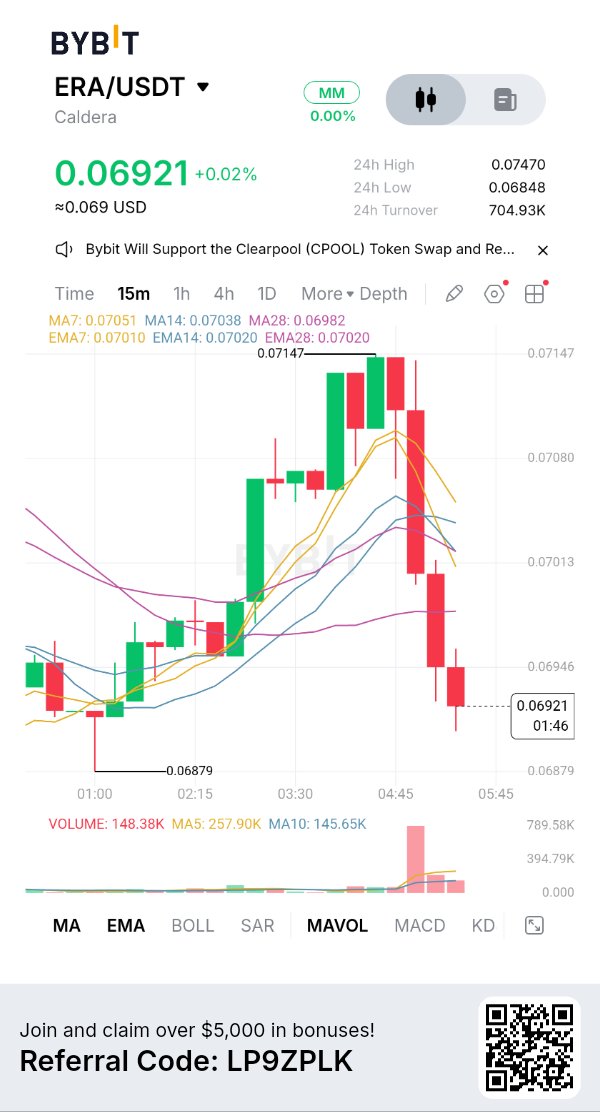
#ByXIMPACT $ERAUSDT ERA: Теза про роллапи зіткнеться з шоком пропозиції завтра. Caldera ERA торгується на рівні близько $0,070, з ринковою капіталізацією близько $10,4 млн та FDV близько $69,9 млн. CoinGlass показує діапазон $0,0666–$0,0743, падіння на 7,4% за сім днів, але зростання на 20,8% за 30 днів. Структура залишається крихкою. Caldera націлена на проблему фрагментації роллапів Ethereum. Її Rollup Engine дозволяє командам розгортати кастомізовані мережі, використовуючи OP Stack, Arbitrum Orbit та ZK Stack. Metalayer розроблений для поєднання їх через обмін повідомленнями, інтенти та міжланцюгове переміщення активів. Caldera повідомила про понад 60 роллапів, 1,7 млн унікальних гаманців та $800 млн TVL. Це метрики екосистеми, а не доказ того, що кожен ланцюг генерує повторюваний дохід. Другий сигнал — це розрив між впровадженням і корисністю токена. ERA задуманий як актив для оплати газу в Metalayer, токен для стейкінгу та інструмент управління. Але децентралізовані ретранслятори, стейкінг валідаторів, доступ до спільної ліквідності та механізми спалювання комісій все ще є механізмами, що розробляються, а не перевіреними джерелами постійного попиту на ERA. Більша кількість мереж не автоматично означає більшу купівлю ERA, поки активність між роллапами не почне споживати або блокувати токен. Завтрашній анлок — це безпосередня подія. Tokenomics.com вказує на розблокування 26,4 млн ERA 17 листопада, що коштує приблизно $1,9 млн за поточними цінами. Це 2,64% від загальної пропозиції та 8,4% від ринкової капіталізації. Близько 50,6% припадає на приватних інвесторів і 23,4% на інсайдерів; решта дістається спільноті та фондам. Не кожен розблокований токен буде продано, але масштаб суттєвий порівняно зі 148,5 млн циркулюючої пропозиції, про яку звітують CoinMarketCap та CoinGlass. Якби все стало доступним для торгівлі, це дорівнювало б приблизно 18% від цього обсягу. Стежте за депозитами на біржі, а не лише за календарем. Деривативи показують незвичайну ситуацію. CoinGlass повідомляє про обсяг ф'ючерсів $25,35 млн проти $13,04 млн на споті, співвідношення приблизно 1,9x. Відкритий інтерес становить $11,06 млн, що на 10,5% менше, при цьому OI перевищує 100% ринкової капіталізації — кредитне плече велике відносно звітної кількості токенів у вільному обігу. Фінансування (funding) глибоко негативне на рівні -0,13% за вісім годин; 93% ліквідацій на суму $116,9 тис. були довгими позиціями (longs). Падіння ціни та OI свідчить про закриття лонгів. Негативне фінансування підвищує потенціал сквизу, але чистий відтік спотових коштів у розмірі $1,5 млн свідчить про те, що покупці не абсорбували пропозицію. Карта торгів: $0,067–$0,0666 — це безпосередня підтримка. Втрата цього рівня відкриває шлях до $0,060; повернення до $0,0744 — перший сигнал відновлення. Для підтвердження потрібні спотові притоки та стабілізація OI після розблокування. Позиція: високий ризик; чекайте на поглинання пропозиції. Caldera вирішує реальну проблему фрагментації роллапів, але створення цінності ERA все ще розвивається, а завтрашнє розблокування є великим відносно ринкової капіталізації. Стежте за потоками після розблокування, активним використанням Metalayer та тим, чи стануть функціональними стейкінг/корисність комісій. Перевага: повторюваний попит на ERA в міжроллап-екосистемі.
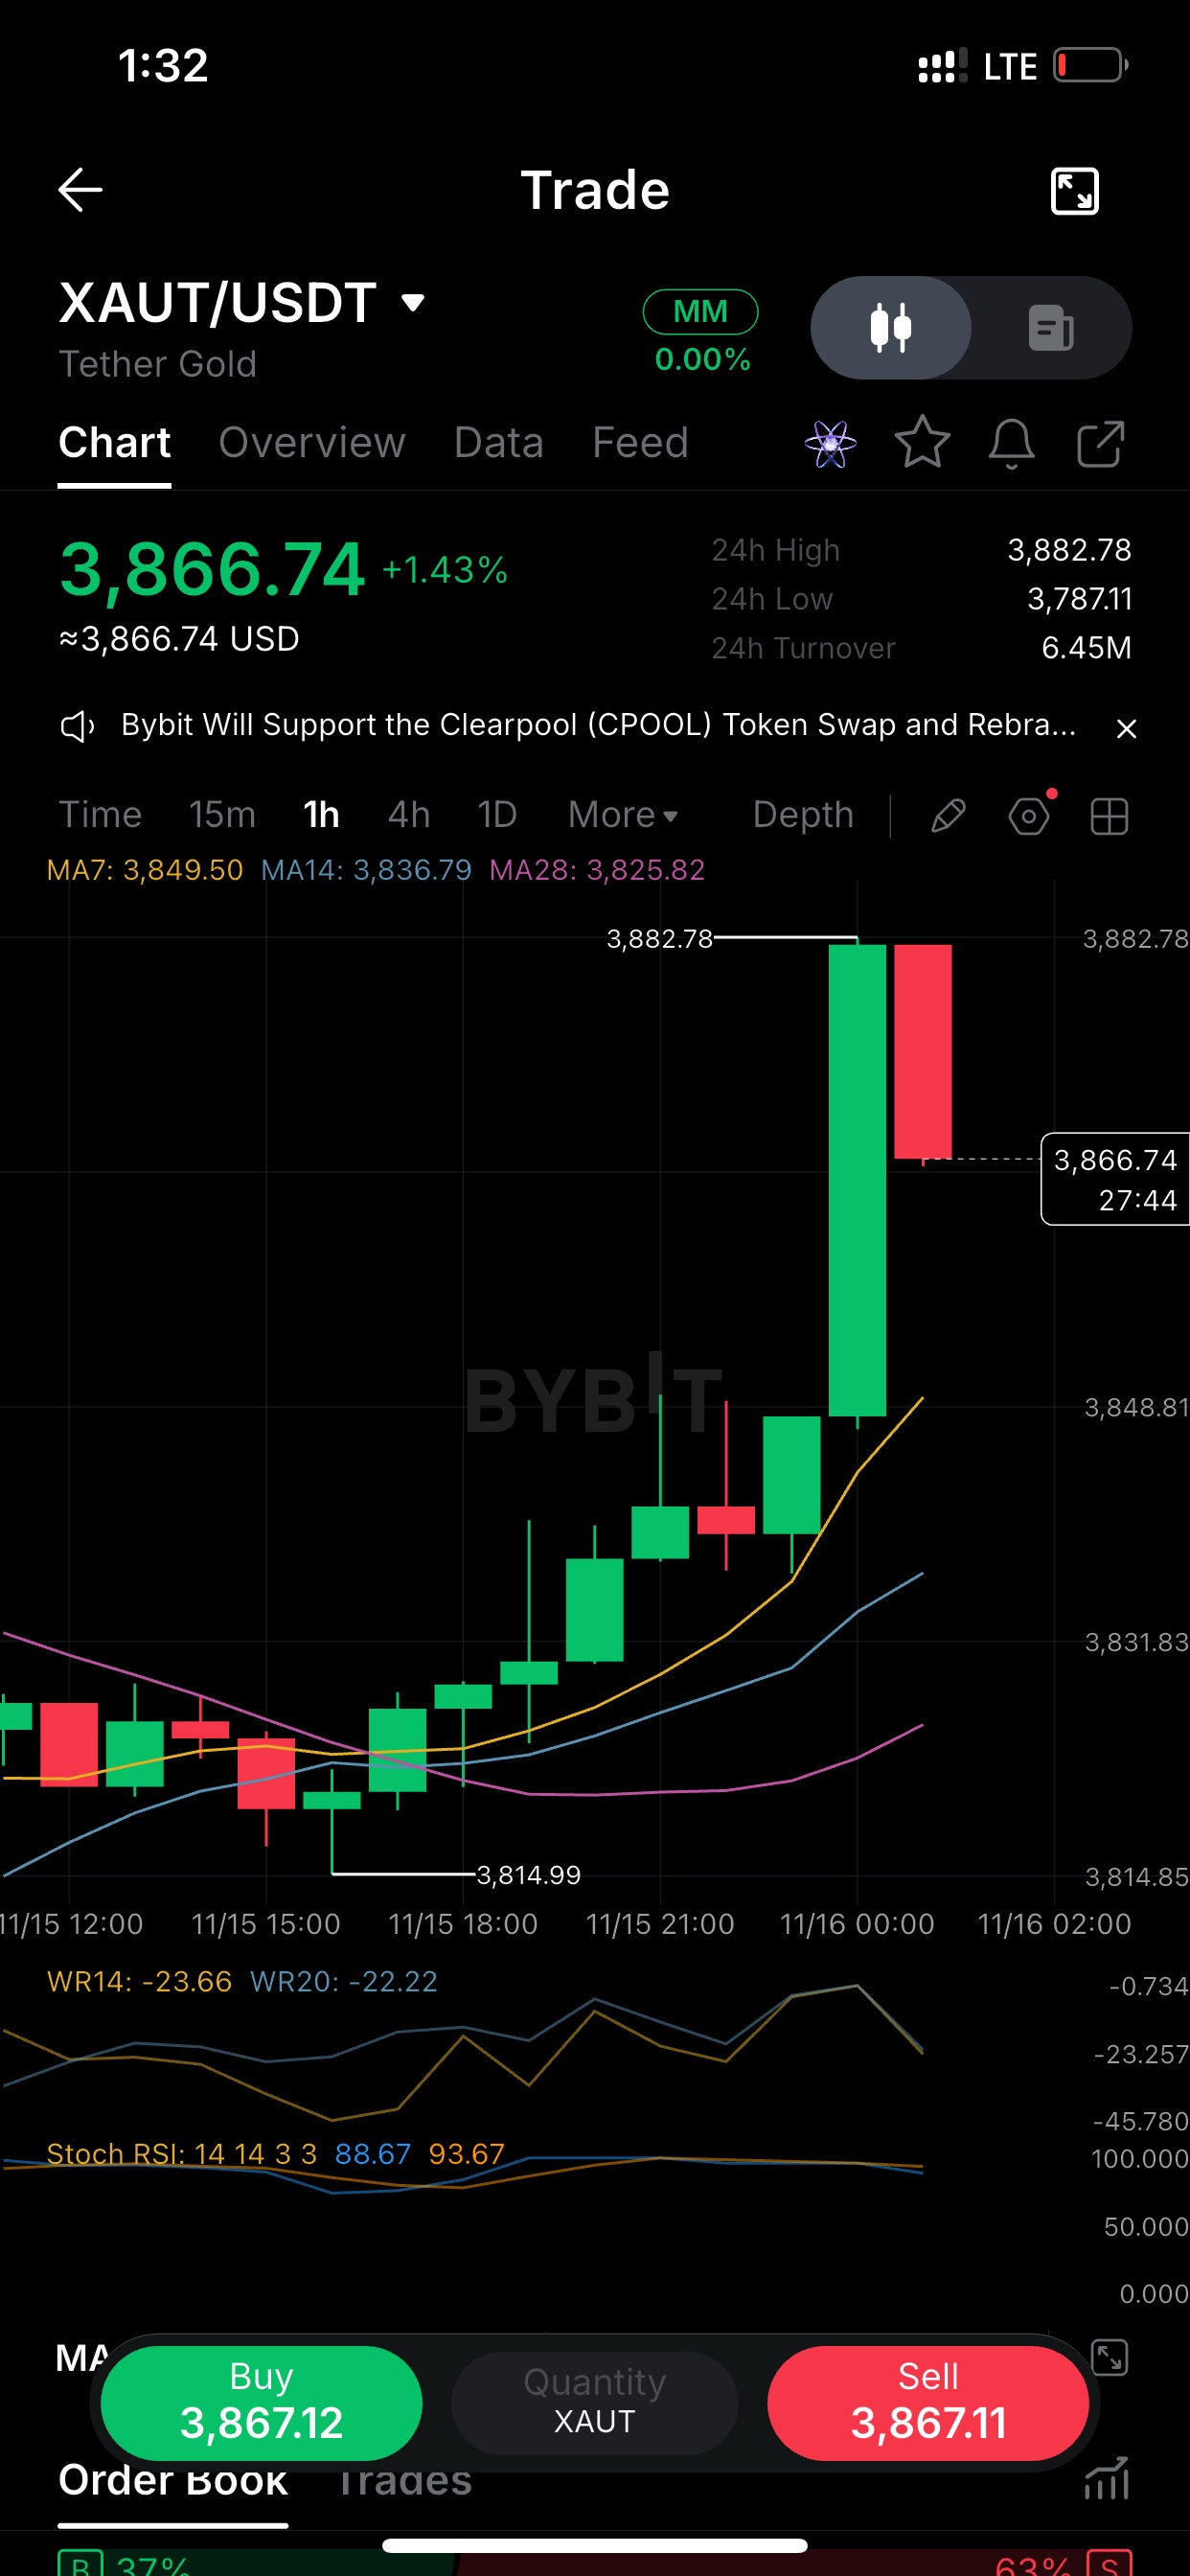
1: структура $XAUT 1Г: стрибок до 3882,78 був першим справжнім випробуванням для цього руху, і ціна вже частково відкочується назад. Але стек виглядає чисто. MA7 3849 > MA14 3837 > MA28 3826, всі ростуть, а мінімум на рівні 3815 вже далеко позаду. Я не збираюся ганятися за зеленою свічкою. Перший відкат до MA7 — це зона, за якою я буду стежити для реакції. 2: аналіз імпульсу Stoch RSI на XAUT 1Г знаходиться на рівні 88/93. Після дня з ростом на +1,4% це не дивно, але це означає, що легка частина цього етапу, ймовірно, вже завершена. Williams %R вже розвернувся від нуля до -23, тож імпульс охолоджується ще до того, як ціна суттєво відкотилася. Тренд все ще висхідний, питання лише в якості точки входу. Я краще почекаю, ніж купувати на вершині фітиля. 3: рівні Рівні, які я використовую для $XAUT (1Г): Опір: 3882,78, 24-годинний максимум, який вже один раз відштовхнув ціну Підтримка: 3849 (MA7), потім 3837 (MA14) Скасування сценарію: повернення нижче 3826 Ціна зараз 3866, тому відстань до підтримки складає близько 17 пунктів, а до опору — близько 16. Це не дає значної переваги посеред діапазону. Терпіння тут винагороджується. Нехай ціна підійде до рівня. Кілька нотаток для вашого рахунку в таблиці лідерів: - Публікуйте не більше одного разу на день з інтервалами, щоб не порушити правила щодо дублювання та високої частоти публікацій.$XAUTUSDT - Додавайте тег $XAUT або торговий віджет під час публікації, оскільки дописи мають містити один із них, щоб зарахуватися. - Якщо хочете змінити тон (більш агресивний або більш навчальний), скажіть, і я перероблю ці матеріали. #ByXIMPACT
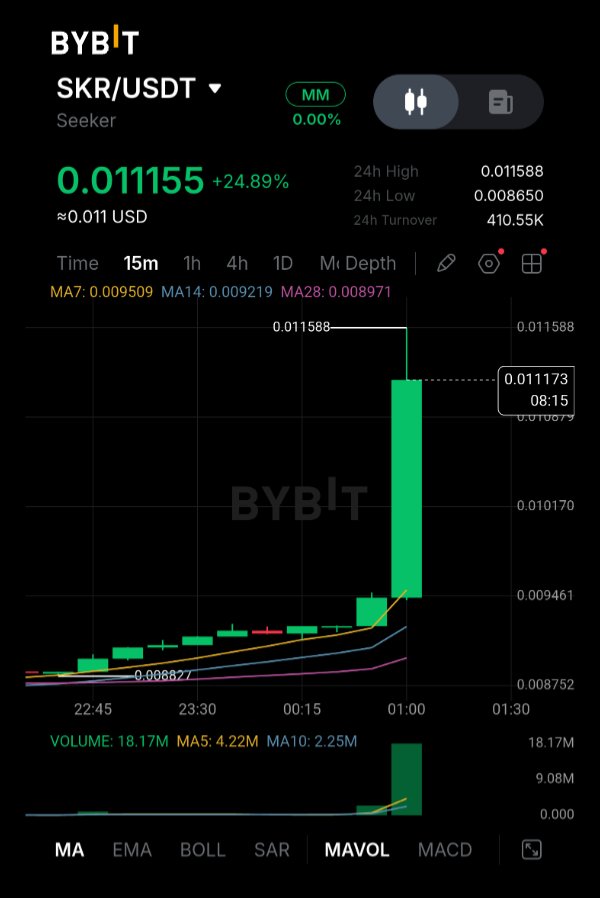
SKR зріс на 24,89% до $0,011155, і майже весь цей ріст стався завдяки одній 15-хвилинній свічці. Я не зміг знайти жодних новин про цей рух за сьогодні, тому розглядаю це як суто ринкову подію і не вигадую причину. Графік незвичайний. Протягом кількох годин SKR повз вгору маленькими свічками, причому 7-, 14- та 28-періодні ковзні середні були щільно розташовані між $0,0090 та $0,0095. Потім одна зелена свічка підскочила приблизно з $0,0095 до максимуму $0,011588, і зараз ціна тримається біля позначки $0,0112. Обсяг каже про те саме: 18,17 млн на тій свічці проти 5-періодного середнього значення близько 4,2 млн — це приблизно в чотири рази більше за норму. Це раптовий сплеск агресивних покупок, але це лише один бар, тому нічого ще не перевірено. Загальний фон змішаний. З позитивного боку: Solana Mobile проводить програму викупу та спалювання токенів (buy-and-burn), що фінансується за рахунок доходу (близько 1,8 млн SKR було спалено до 5 листопада), хакатон CLOCK IN виплатив призи 10 листопада, і у SKR понад 50 000 власників. Однак обсяги спалювання невеликі порівняно з емісією: інфляція токена становить близько 10% у перший рік із поступовим зниженням з часом, а ончейн-перевірки показали, що повноваження на мінтинг (mint authority) все ще були активними наприкінці жовтня. Крім того, SKR знаходиться приблизно на 80% нижче свого історичного максимуму $0,060, досягнутого в січні. Він впав з $0,0130 6 листопада до приблизно $0,0108 до 12 листопада, тому сьогоднішня свічка відіграє частину того падіння. Також варто пам'ятати, що 1 листопада з'явився і був видалений фейковий додаток для отримання SKR — про це слід пам'ятати всім, хто переходить за посиланнями під час пампу. Рівень, що має значення сьогодні ввечері — це максимум $0,0116. Закриття вище нього було б першим підтвердженням того, що покупці утримують позиції, а зона $0,0130 від 6 листопада є наступною ціллю. Підтримка знаходиться приблизно на рівні $0,0095 — це основа великої свічки та зона 7-періодної ковзної середньої. Рух назад нижче цього рівня означатиме, що весь приріст було втрачено. За чим я стежу: чи втримаються наступні кілька свічок вище $0,0105, чи ціна скотиться назад до $0,0095. $SKRUSDT #ByXIMPACT


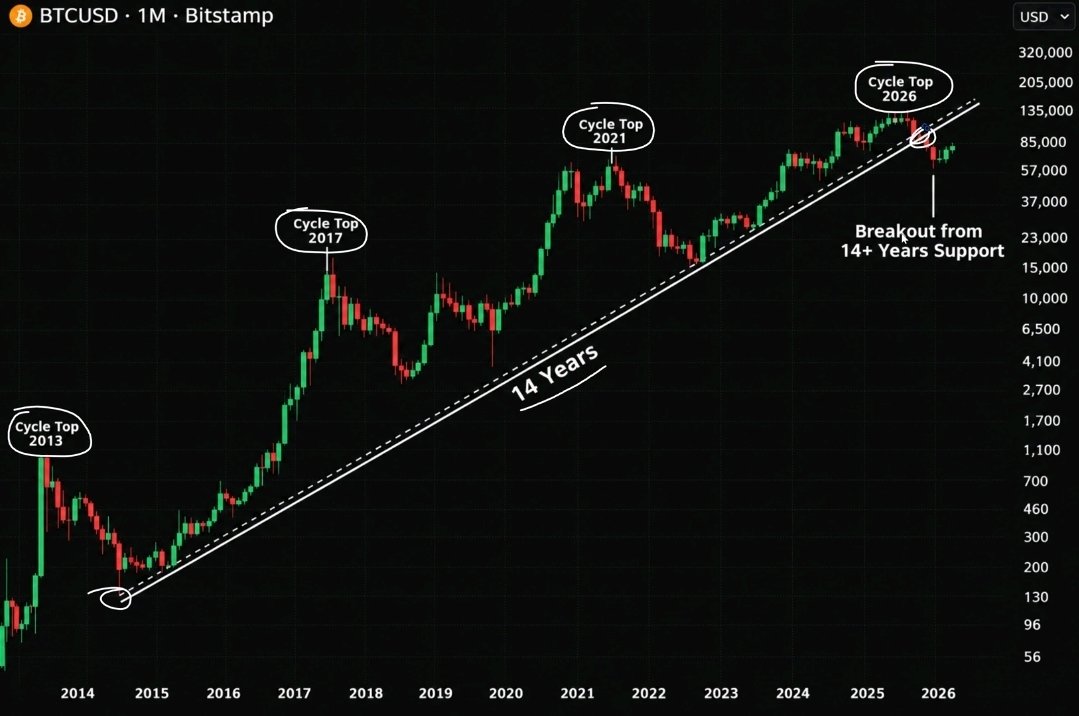
Біткоїн нарешті пробив свою 14-річну лінію тренду. І майже НІХТО не розуміє, наскільки це може бути серйозно. Подивіться на історичну закономірність: 2013 → Пік циклу. 2017 → Пік циклу. 2021 → Пік циклу. 2026 → Ще один серйозний обвал. Понад десять років ця висхідна лінія тренду визначала довгострокову «бичачу» структуру Біткоїна. Тепер, вперше, $BTC торгується НИЖЧЕ неї. Але ось що всі ПРОПУСКАЮТЬ: → Біткоїн втратив позначку $70 тис. → 200-тижнева ковзна середня біля $68 тис. була пробита. → $62 тис. — наступний критичний рівень. → Нижче цього рівня знову в гру вступає $58 тис. Це не просто чергова звичайна корекція. Якщо Біткоїну не вдасться відновити втрачену підтримку, ми можемо стати свідками СЕРЙОЗНИХ змін у всьому ринковому циклі. Зараз важливе лише одне: МІСЯЧНЕ ЗАКРИТТЯ. Відновлення може перетворити це на масштабну «ведмежу пастку». Але підтверджений місячний обвал був би серйозним попередженням. Той самий Біткоїн. Інша ринкова структура. $BTCUSDT $SPCXXUSDT #ByXIMPACT


GLMR: відіграв 58% діапазону, зараз 0.006738
$GLMRUSDT — ціна на 9,4% нижче верхньої смуги Боллінджера, 0,007434, після стрибка до 0,008385. Подивіться на 24-годинний діапазон: від 0,005535 до 0,008385. Ціна відкотилася приблизно на 58% від нього, а обсяг все ще у 1,4 раза перевищує середній показник за п'ять барів. Досі залишається відкритим питання: це відкат у межах більшого руху чи згасання стрибка? Обсяг залишається високим після великого відкату. Це покупці вступають у гру чи продавці виходять? 4H, GLMR/USDT на Bybit, 0,006738, +19,72% за 24 години. Макро-нотатка 14 листопада 2026 р.: Спотові біткоїн-ETF у США зафіксували 2,35 млрд доларів чистого відтоку за два тижні поспіль (Cointelegraph). Це лише контекст, а не причина цього руху. Що показує графік Ціна знижувалася протягом кількох днів до 24-годинного мінімуму 0,005535. Потім вона підскочила до 0,008385, що становить коливання на 51,5% від мінімуму, і відкотилася до 0,006738. Пік стрибка на 24% вище поточної ціни. Обсяг помітний. Поточний бар — 24,94 млн, що у 1,4 раза перевищує середній показник 17,88 млн за п'ять барів і в 1,9 раза — середній показник 13,13 млн за десять барів. Найвищий бар, близько 37 млн, припав на момент стрибка. Отже, відкат відбувається на активному обсязі, а не на тихому згасанні. Ціна вище MA7 (0,006333), MA14 (0,006148) та MA28 (0,006424). MACD перетнув вгору: DIF -0,000050 вище DEA -0,000204, обидва все ще нижче нуля. SAR показує 0,005528, під ціною. Вони підтримують короткостроковий імпульс. Вони НЕ доводять зміну тренду. Вони побудовані на основі ціни, MA7 все ще нижче MA28, і один стрибок тягне їх усіх вгору. Ключові рівні Підтримка: 0,006333 (MA7), потім 0,006224 (середня смуга Боллінджера). 24-годинний мінімум становить 0,005535. Опір: 0,007434 (верхня смуга Боллінджера), потім 0,008385 (24-годинний максимум). Що посилило б позицію Ціна на 9,4% нижче верхньої смуги, тому я ще не прошу про прорив. Спочатку я хочу бачити 4-годинні закриття, які залишаються вище 0,006333 і 0,006224. Потім 4-годинне закриття вище 0,007434 при обсязі, вищому за середній показник у 17,88 млн. Вищий мінімум вище 0,006224 на відкаті допоміг би. Занепокоєння 4-годинне закриття нижче 0,006224 поверне ціну під середню смугу і нівелює відскок. Пік стрибка 0,008385 був відхилений, і ціна віддала 58% діапазону. Обидва фактори є причинами для обережності. Що змінить мою думку 4-годинне закриття нижче 0,006224. Урок Стрибок показує, як далеко може піти ціна. Закриття показують, де вона може втриматися. Мій погляд Моя інтерпретація: відскок поки що тримається, тому я схиляюся до конструктивного сценарію, поки GLMR закривається вище 0,006224 на 4H. Я можу помилятися, і 4-годинне закриття нижче 0,006224 доведе мою неправоту. Орієнтуйтеся на рівні, а не на мої припущення. Це сценарій, а не прогноз. Стан на момент публікації, а не гарантія. Що для вас тут важливіше: утримання рівня 0,006224 чи закриття вище 0,007434? #ByXIMPACT
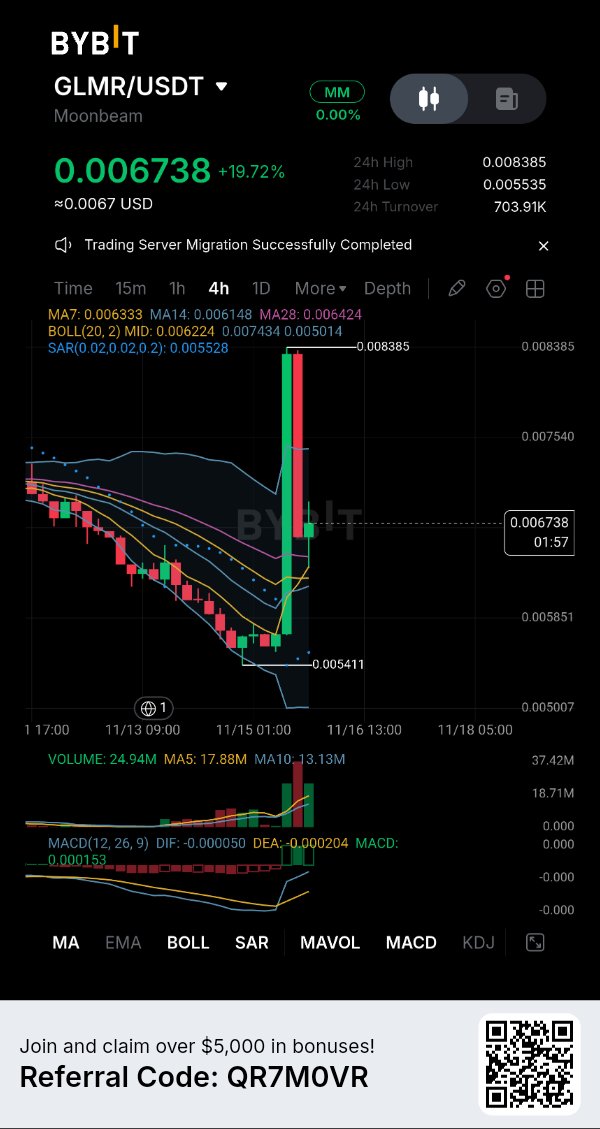
APEX може здаватися прямою ставкою на децентралізовану біржу, але володіння токеном — це не те саме, що володіння самою біржею або право на її активи. ApeX Protocol запустив свій перший продукт у 2022 році, а пізніше розширився завдяки ApeX Omni у 2024 році. Пропозиція токенів була скорочена з 1 мільярда до 500 мільйонів APEX після спалювання у 2024 році. Цю різницю легко пропустити, якщо читати лише заголовок. APEX — це токен екосистеми протоколу, призначений для управління, стейкінгу та заохочення до участі. Власники можуть стейкати APEX, щоб отримувати винагороди та брати участь у рішеннях протоколу, але токен не є часткою в компанії, не дає прямого права власності на торгову інфраструктуру чи гарантованої частки в прибутках біржі. Його ринкова ціна визначається попитом, пропозицією, корисністю та очікуваннями ринку, а не фіксованою вартістю викупу. Масштаб має значення. ApeX керує екосистемою децентралізованої торгівлі деривативами з безстроковими ринками, ліквідними продуктами та додатковими торговими функціями. Але розмір біржі не автоматично перетворюється на еквівалентні фінансові претензії для кожного власника токена. Різниця проста: експозиція до торгового протоколу — це не володіння бізнесом. APEX означає участь в екосистемі, а не право власності на все, що стоїть за нею. #ByXIMPACT $APEXUSDT
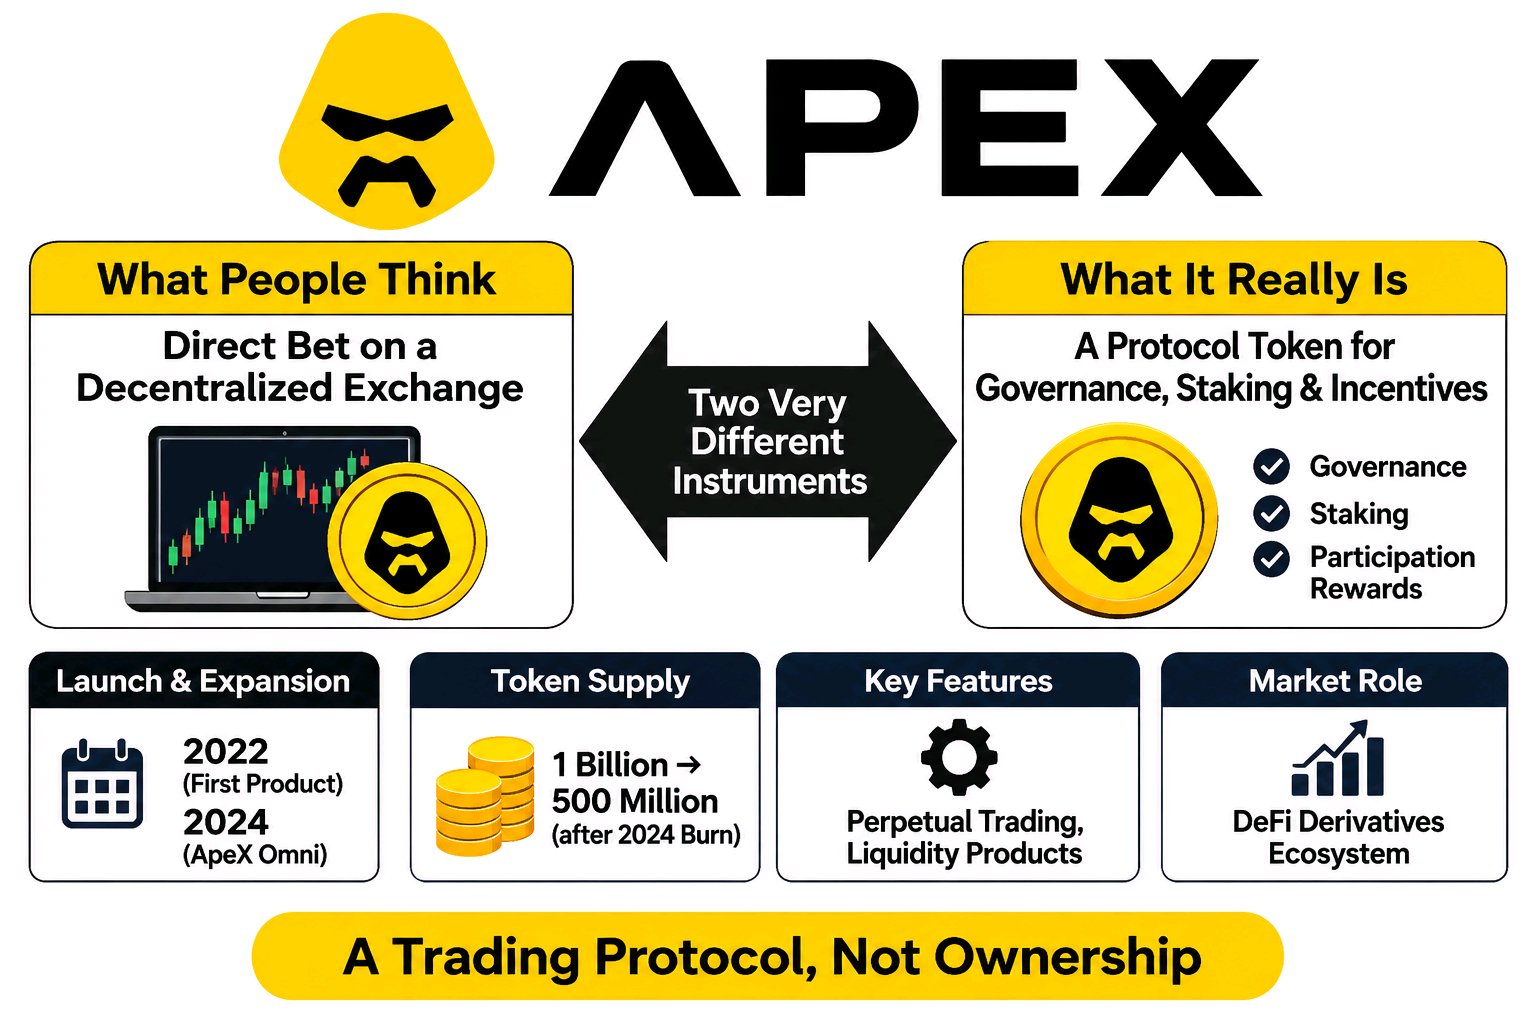
#Bitcoin #BTCUSDT #CryptoMarket #MDFUNDS
Реакція біткоїна на рівні $62 тис.: чи починає ринок поглинати тиск продавців? Денний графік біткоїна демонструє дещо варте уваги, окрім самого падіння ціни, що було в заголовках. Після невдалої спроби втримати зростання від піку у $87 401, BTC увійшов у стійку послідовність нижчих максимумів та нижчих мінімумів. Останнє розширення зниження штовхнуло ціну до $61 999, де покупці почали демонструвати помітну реакцію. Зараз BTC торгується на рівні близько $65 115, але загальна структура залишається під значним тиском. Ось деталь, яка мене цікавить. Денний обсяг торгів становить 13,36 тис., що перевищує його п'ятиденне середнє значення (12,94 тис.) та десятиденне середнє значення (10,92 тис.). Це свідчить про те, що активність зросла під час цієї волатильної фази. З точки зору методу Вайкоффа, посилення тиску продавців, за яким слідує реакція покупців, варто відстежувати. Однак високий обсяг сам по собі не підтверджує накопичення або кульмінацію продажів. Подальша поведінка ціни має надати ці докази. Ковзні середні підсилюють обережність: MA7: $70 316 MA14: $73 546 MA28: $76 996 Усі три залишаються вище поточної ціни, що відображає панівну ведмежу тенденцію. Рівні, за якими я спостерігаю: $61 999 — безпосередній орієнтир зниження. Рішучий пробій може відкрити шлях для чергової хвилі зниження BTC. $68 350 — перша значуща перешкода для відновлення, видима на графіку. $70 316 — денна MA7, яка може стати важливим тестом відновлення короткострокового тренду. Що я хочу побачити, так це чи зможе BTC сформувати вищий мінімум, відновити втрачений рівень опору та втримати цей рух при значній активності учасників ринку. До того часу називати це підтвердженим дном було б передчасно. Моє питання до ринку: чи ми спостерігаємо ранні ознаки виснаження тиску продавців, чи це просто тимчасова пауза перед черговим ведмежим розширенням? #Bitcoin #BTCUSDT #CryptoMarket #MDFUNDS $BTCUSDT #ByXIMPACT
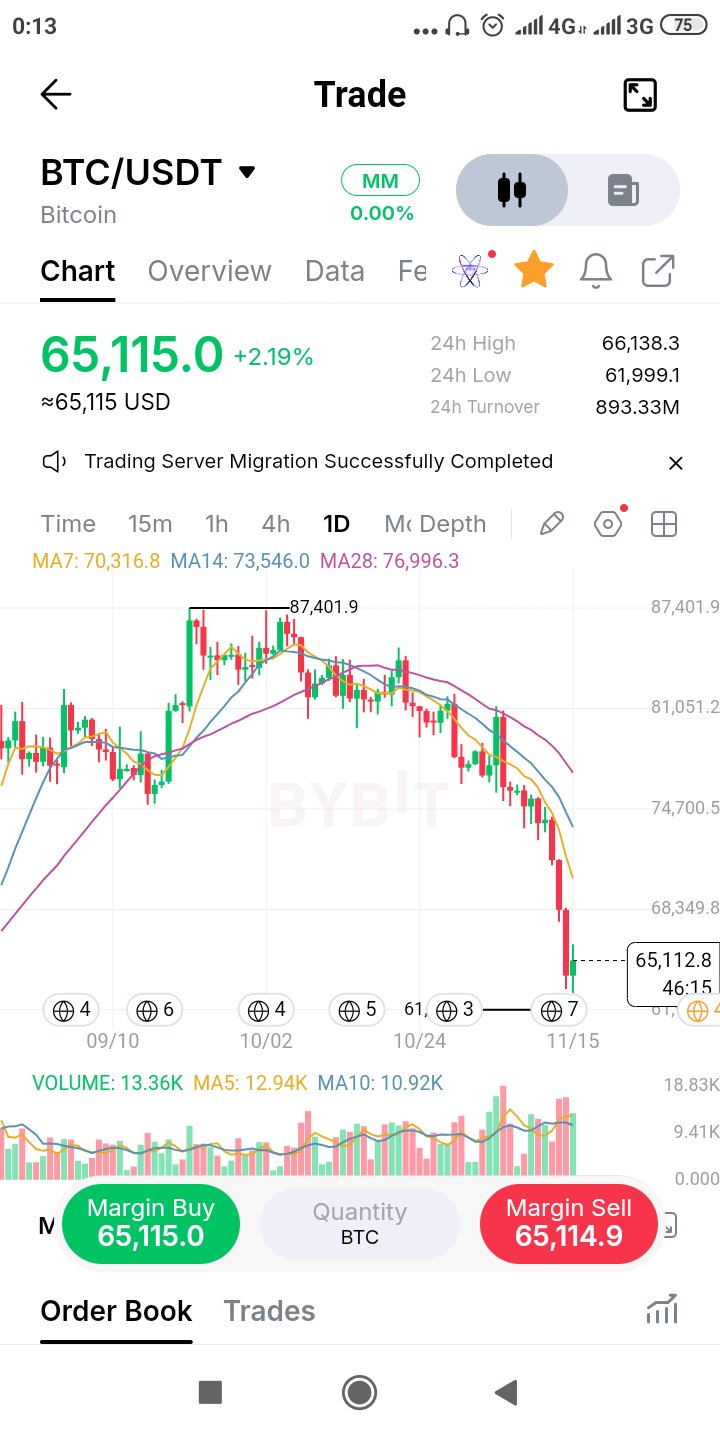
Сьогодні курс QNT відскочив на 10,6% від мінімуму в 140 до 157,21, проте він все ще приблизно на 19% нижчий за рівень початку тижня, а книга ордерів схиляється до продажу. Рух 5 листопада був частиною загальноринкового розпродажу: за даними CoinMarketCap, падіння QNT на 5,7% того дня було приблизно таким самим, як і падіння загальної капіталізації крипторинку на 5,2%, при цьому специфічних новин щодо Quant не було. Того ж дня COINOTAG повідомив про зростання на 6,9% на тлі повідомлень про те, що The Clearing House переводить платежі з токенізованими депозитами на мережу Quant. Отже, токен все ще торгується з огляду на дві різні історії: банківське впровадження, яке спровокувало стрибок у вересні, та схильність до ризику, яка визначає щоденні коливання. Пілотні проекти з банками не були скасовані, але вони також не призвели до стабільного попиту. На графіку QNT зріс на 10,60% до 157,21, з 24-годинним діапазоном від 140,00 до 158,07. Ціна вища за MA7 (150,76), MA14 (154,09), EMA7 (153,68) та EMA14 (155,08), але все ще нижча за MA28 (160,44) та EMA28 (161,30). MACD позитивний (1,35), при цьому DIF (-5,98) перетинає DEA (-7,34) знизу вгору. Обсяг торгів (1,30 тис.) приблизно відповідає MA5 (1,33 тис.) і значно нижчий за MA10 (2,56 тис.), тому цей відскок не приваблює значних обсягів купівлі. Книга ордерів на 59% складається з ордерів на продаж. Рівні MA28 та EMA28 у діапазоні 160,4–161,3 є ключовими для подолання. Закриття вище цих значень при зростаючому обсязі торгів знову зробить актуальною зону 165. Втрата рівня 140 відкриє шлях до мінімумів початку тижня. $QNTUSDT #ByXIMPACT
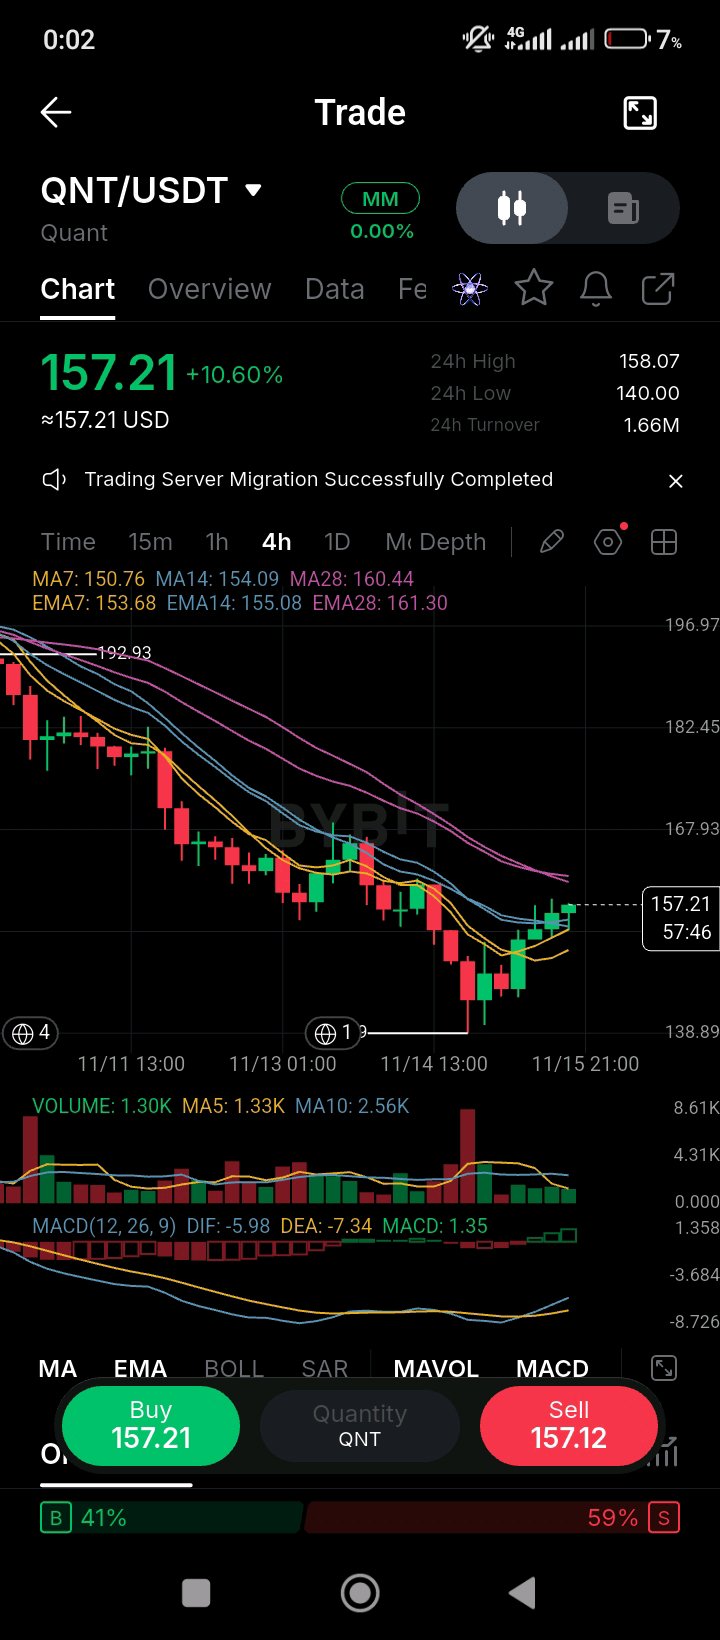

$ETHUSDT відновив усі свої ковзні середні (MA) і відскочив на 6,7% від рівня 1 710,47. Це дно, чи 1 845,30 — пастка? Контекст ETH знаходиться приблизно на 20% нижче максимуму 2 271,33 на цьому графіку і віддав більшу частину свого зростання від 1 710,47. Ціна становить 1 825,80 (+4,14%) після мінімуму 1 710,47, що на 0,31% вище 7-денної середньої: MA7 (1 820,20), з MA14 (1 821,70) і MA28 (1 804,19) нижче, всі вони розташовані в «бичачому» порядку. Зараз пізній вечір неділі, і 1-годинна свічка відкрилася близько 30 хвилин тому. Оборот і обсяг 24-годинний оборот становить близько 252,39 млн USDT, приблизно 138 тис. ETH, що складає близько 0,46 від 5-денного середнього значення 2,78 тис. і 0,27 від 10-денного (4,65 тис.) лише на цій 1-годинній свічці. 5-денна середня рухається нижче 10-денної, тому обсяг скорочувався під час відскоку, а сьогоднішня свічка вже наторгувала 1,27 тис. «Змив» (flush) стався на реальному обсязі, що характерно для масових розпродажів (washouts), хоча це не доводить, що все закінчилося. Імпульс Ціна вище всіх трьох MA, і MA починають розгортатися вгору. Останній відскок був проданий на рівні 1 919,76, потім ціна зробила нижчий мінімум на 1 710,47, після чого повернула 1 820,20. Імпульс змінюється, тому я хочу побачити реакцію, перш ніж діяти. Повернення рівня плюс його утримання створює умови для відскоку, але відскок без закриття вище «стіни» — це просто відскок. Підтримка і опір Підтримка: 1 804,19 (MA28), близько 1 820,20 (MA7), потім 1 710,47 (24-годинний мінімум), нижче рівні не перевірені. Опір: 1 845,30 (24-годинний максимум, тепер це «стіна»), близько 1 875,22 (наступний рівень), 1 919,76 (попередній максимум), потім 2 271,33. Рівень для спостереження 1 804,19 - 1 820,20 — це підлога, де MA слугують лінією розмежування. 1-годинне закриття нижче 1 804,19 відкриє шлях до 1 765 і нижче. Зверху 1 845,30 — це «стіна», де 24-годинний максимум зустрічається з круглим числом. Торговий план Відскок: купувати на рівні 1 804 - 1 820 тільки після реакції (фітіль відхилення або 1-годинне закриття вище 1 820,20), стоп нижче 1 795. Цілі — 1 845,30 і 1 875,22, приблизно 1,5R і 2,5R від 1 812. Продовження (шорт або просто відмова від лонгів): чекайте ретесту 1 845,30, який буде відхилено, стоп вище 1 855. Цілі — 1 820,20 і 1 804,19, приблизно 1,5R і 2,2R від 1 845. Я не купую по 1 825,80 посеред свічки з ростом +4,14%. Стоп має бути нижче 1 804,19, а перший опір на 1 845,30 знаходиться лише на 19 вище, тому це приносить менше 1R. Примітка щодо ризиків ETH коливався приблизно на 7,9% за останні 24 години (1 710,47 - 1 845,30), ліквідність у вихідні нижча, і фітілі можуть пробивати будь-який рівень, тому розмір позиції важливіший за точку входу. Показники перепроданості можуть залишатися такими протягом тривалого часу. Рівні MA — це зони, а не точні лінії. Рівні взяті з мого власного графіку. Не є фінансовою порадою. Це дно, чи 1 845,30 — пастка? Реакція на 1 845,30 покаже. Тільки для освітніх цілей, не є фінансовою порадою. $ETHUSDT#ByXIMPACT
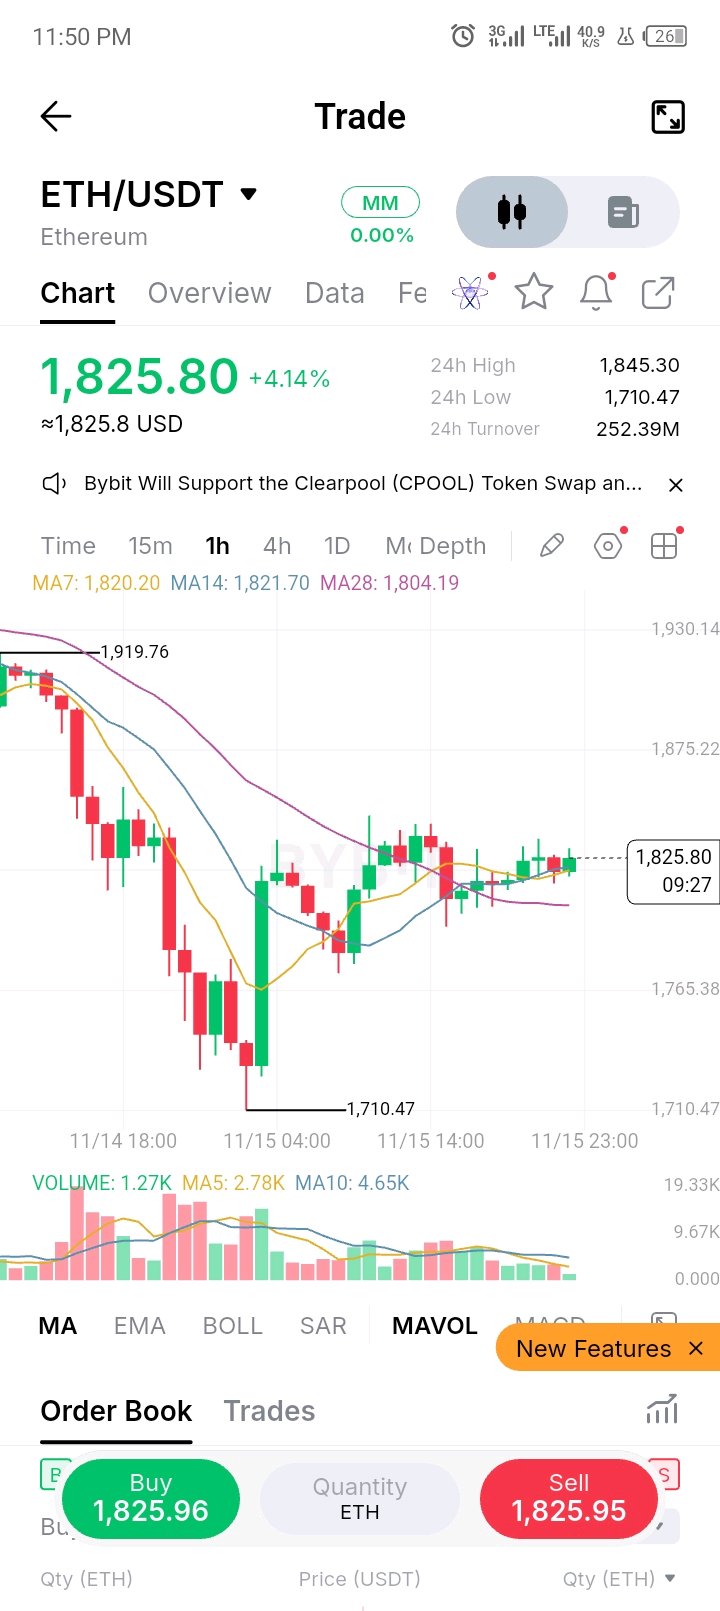
🚀 $AAVEUSDT Технічний аналіз – «бики» наближаються до серйозного прориву! AAVE демонструє сильний купівельний тиск після відновлення від зони підтримки $96.65. Наразі ціна торгується близько $109.90, показавши зростання на 10.43%. 1-годинний графік показує чітку структуру відновлення, де покупці поступово штовхають ціну до зони опору $110. Але головне питання полягає в тому, чи зможуть «бики» успішно подолати цей рівень. Давайте розберемо важливі торгові рівні. 📊 Огляд поточного ринку Пара: AAVE/USDT Поточна ціна: $109.90 Зміна за 24 год: +10.43% Максимум за 24 год: $110.00 Мінімум за 24 год: $96.65 Обсяг торгів за 24 год: $23.60 млн Таймфрейм: 1 год 🟢 Важливі рівні підтримки $107.15 – $106.50: Безпосередня підтримка та зона потенційного відкату. $105.00 – $104.50: Другорядна зона підтримки. $103.65 – $102.00: Важлива зона попиту. $100.15 – $96.65: Основна зона підтримки знизу. 🔴 Важливі рівні опору $110.00 – $110.66: Безпосередній опір і зона прориву. $111.50 – $112.00: Наступна потенційна ціль зростання. $113.00: Психологічна ціль, якщо «бичачий» імпульс збережеться. 📈 Торгова стратегія LONG Сет-ап 1 – Вхід на відкаті Зона входу: $107.50 – $108.50 Стоп-лосс: нижче $106.50 Тейк-профіт 1: $110.00 Тейк-профіт 2: $111.50 Тейк-профіт 3: $113.00 Перед входом зачекайте на свічку відскоку та підтвердження. Сет-ап 2 – Вхід на прориві Вхід: вище $110.70 після підтвердженого закриття 1-годинної свічки. Зона ретесту: $110.00 – $110.70 Стоп-лосс: нижче підтвердженої структури ретесту. Тейк-профіт 1: $111.50 Тейк-профіт 2: $112.00 Тейк-профіт 3: $113.00 Високий обсяг під час прориву підвищить впевненість у сетап-і. 📉 Торгова стратегія SHORT Якщо AAVE не зможе пробити зону опору $110.00 – $110.66 і сформує сильний «ведмежий» розворот, може з'явитися можливість для шорту. Зона входу: $110.00 – $110.50 після «ведмежого» підтвердження. Стоп-лосс: вище $111.00 Тейк-профіт 1: $108.50 Тейк-профіт 2: $107.50 Тейк-профіт 3: $106.50 Уникайте шортів, якщо покупці успішно пробили опір і закріпилися вище. 🧠 Професійні поради з трейдингу 1. Стежте за закриттям 1-годинної свічки біля $110.66. 2. Підтверджуйте силу прориву торговим обсягом. 3. Уникайте входу безпосередньо в опір. 4. Зачекайте на ретест перед відкриттям угоди на прориві. 5. Обмежуйте ризик 0.5%–1% від свого торгового капіталу. 6. Завжди використовуйте стоп-лосс і розглядайте можливість часткової фіксації прибутку. 🎯 Мій ринковий прогноз AAVE наразі має «бичачу» короткострокову структуру після сильного відновлення від $96.65. Зона $110.00 – $110.66 — це найважливіша ділянка для спостереження. Підтверджений прорив може відкрити шлях до $111.50 і, можливо, до $113.00. Однак відхилення від цього опору може спровокувати відкат до $107.15 або $105.00. Моя стратегія проста: я волію дочекатися підтвердження, ніж гнатися за поточними зеленими свічками. Торгуйте за планом. Захищайте свій капітал. Нехай ринок підтвердить ваш сетап. Який ваш прогноз? Чи проб'є AAVE $110.66 і піде до $113, чи продавці захистять цей опір? Поділіться своїми думками нижче. #ByXIMPACT #WSOTПокажітьСвоюШІУгодуЩобЗаробити10USDT #Вихід Дженсена Хуана випробовує лідерство Nvidia в галузі ШІ #USPPITestsTheHigherForLongerTrade #Інфляція у США зростає, а ставки на підвищення процентних ставок посилюються $AAVEUSDC
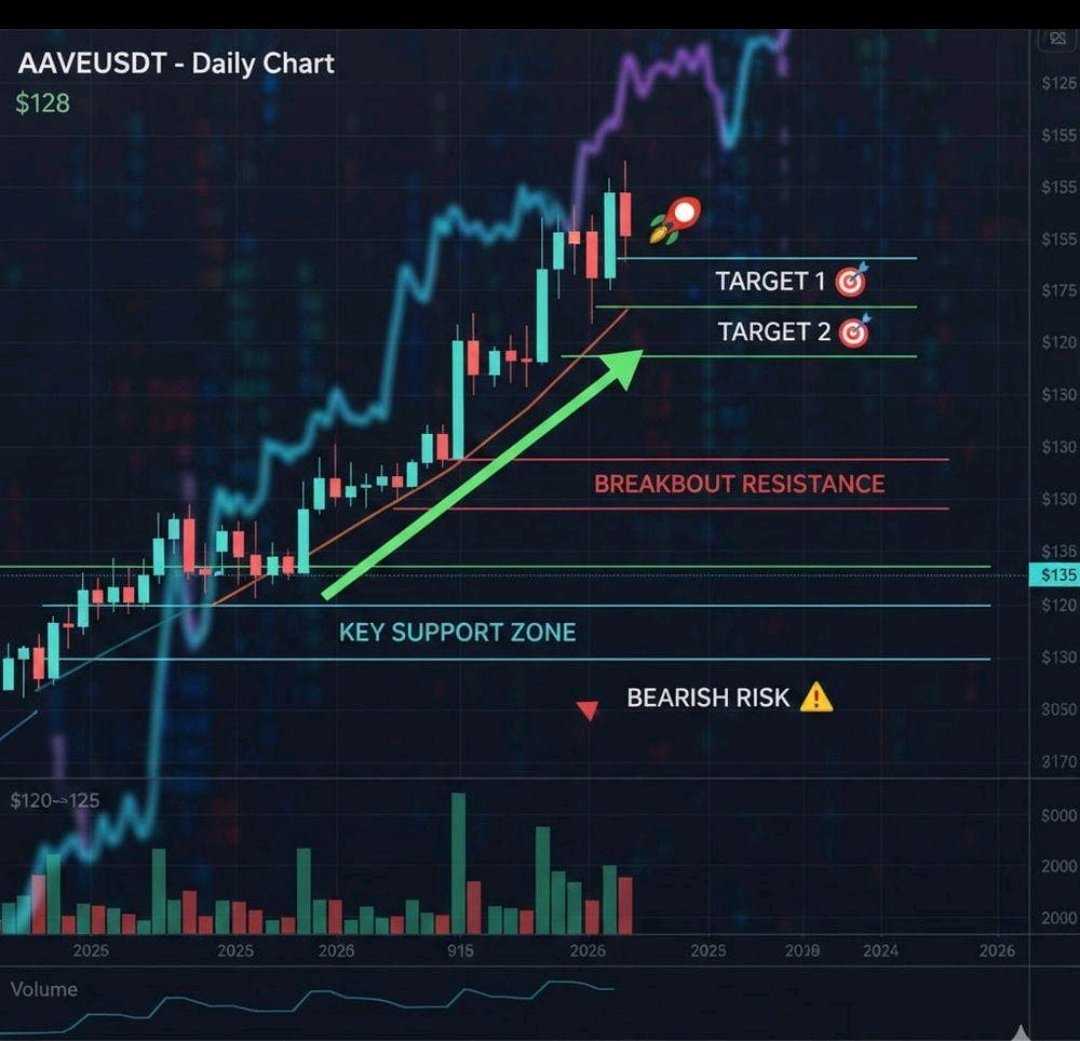
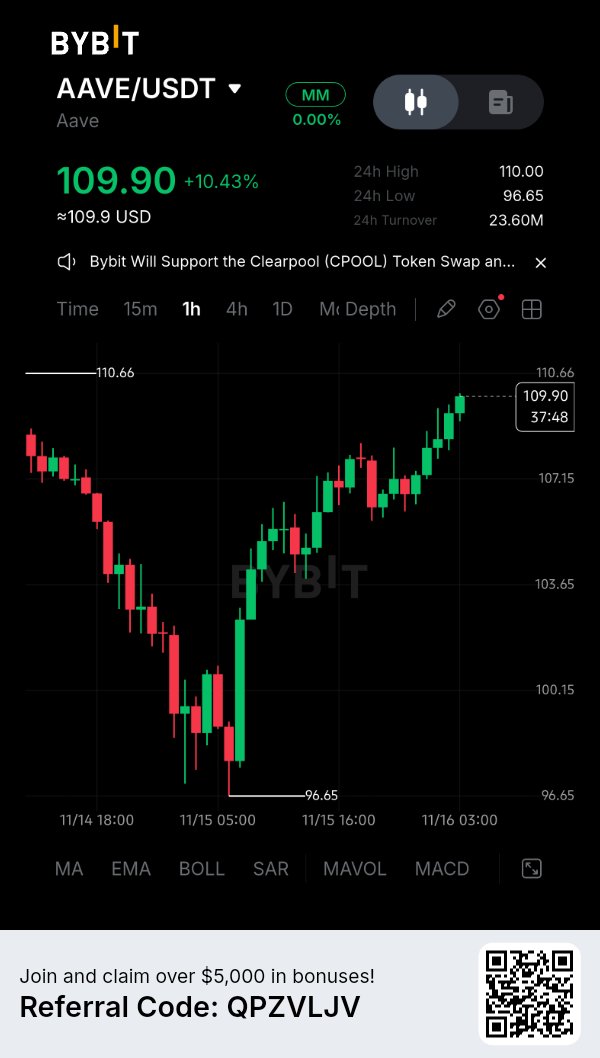
Tether Gold торгується поблизу $3,838.62, зрісши на 1,6% після падіння до зони $3,765.91 на 6-годинному графіку. Останні свічки показують, що покупці намагаються стабілізувати ціну. XAUT повернувся вище EMA7 на рівні $3,837.69 та MA7 на рівні $3,830.60. Це покращення, але я б не плутав короткострокову стабілізацію з підтвердженим розворотом тренду. Значний опір все ще залишається попереду. EMA14 знаходиться на рівні $3,866.13, за нею йде середня лінія смуг Боллінджера на рівні $3,896.47. Впевнений рух вище цих рівнів надав би вагоміші докази того, що покупці відновлюють контроль. Імпульс все ще вимагає терпіння. RSI6 становить 39.49, RSI12 — 32.86, а RSI24 — 36.26. MACD залишається негативним, при цьому DIF становить -51.60 проти DEA на рівні -48.21. Тиск з боку продавців може слабшати, але «бичачий» імпульс ще не сформований. Обсяг додає ще один рівень обережності: 198.4 порівняно з MA5 на рівні 562.2 та MA10 на рівні 539.6. Відскок відбувається при відносно обмеженій участі. Зараз я зосереджений на тому, чи зможе XAUT втримати $3,830 і повернути $3,866. Якщо це станеться, $3,896 стане наступним важливим випробуванням. Нездатність утримати короткострокові ковзні середні може знову повернути в центр уваги рівень $3,800 і попередній мінімум поблизу $3,766. Я віддаю перевагу очікуванню підтвердження, замість того, щоб надавати занадто великого значення скромному відскоку. Це початок сильнішого відновлення чи просто пауза перед черговим тестуванням мінімумів? Не є фінансовою порадою. $XAUTUSDT $BTCUSDT #ByXIMPACT

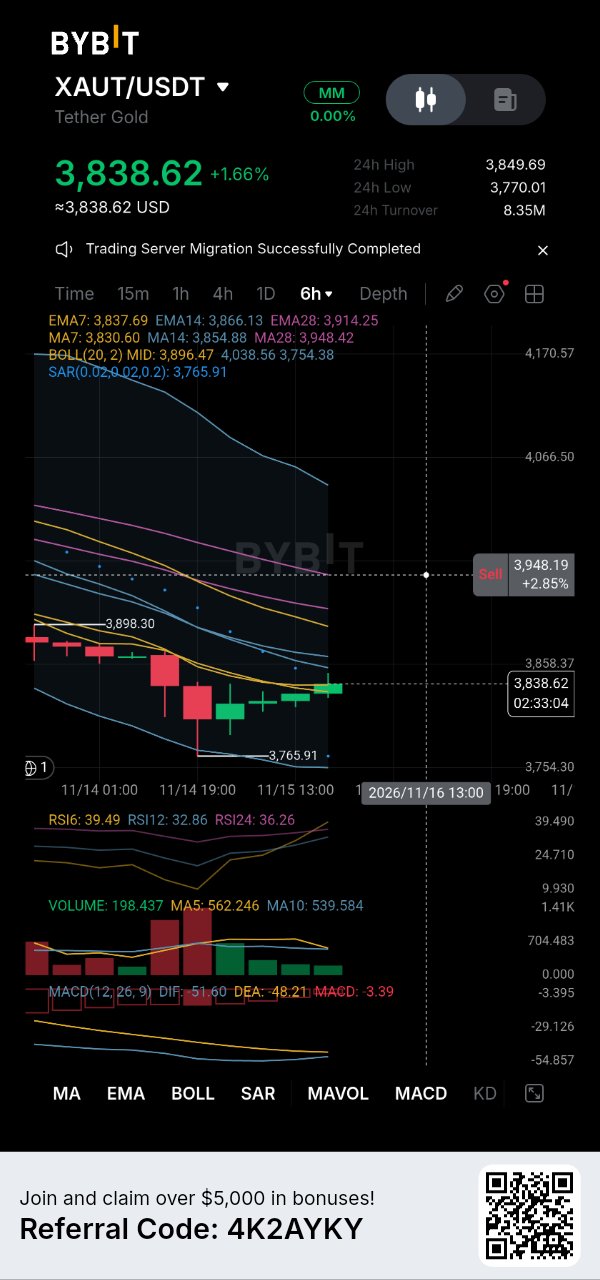

Відновлення на 7% виглядає цікаво, але покупці все ще стикаються із серйозною зоною опору. Chainlink демонструє сильне короткострокове відновлення: ціна LINK зросла на 7,12%, повернувшись вище 4-годинної ковзної середньої (MA7). Однак мою увагу привертає той факт, що це відновлення відбувається в межах ширшої низхідної структури. Цікаво те, що покупцям вдалося відштовхнути ціну від нещодавнього мінімуму в $8,62, але зараз вони наближаються до зони, де кілька ковзних середніх можуть поставити під сумнів це відновлення. Я хочу зрозуміти, чи є це початком справжнього розвороту тренду, чи просто технічним відскоком перед поверненням продавців. РИНКОВА ІСТОРІЯ Наразі LINK торгується близько $9,277 після відновлення від нещодавнього падіння до зони $8,621. 4-годинний графік показує, що попередня низхідна структура не повністю зникла. Ціна все ще нижче MA14 та MA28, незважаючи на те, що вона відновилася вище MA7. Це створює цікаву технічну ситуацію. Покупці демонструють відновлену силу, але їм ще потрібно подолати зону опору $9,35–$9,73, перш ніж я зможу вважати ширше відновлення переконливим. Для мене наступна реакція в цій зоні має більше значення, ніж поточне зростання на 7%. ДАНІ ТА ПІДТВЕРДЖЕННЯ Ось важливі показники зі знімка екрана Bybit: Поточна ціна: $9,277 Зміна за 24 год: +7,12% Максимум за 24 год: $9,381 Мінімум за 24 год: $8,621 Оборот за 24 год: $14,72 млн Попередній видимий максимум: $10,844 Ковзні середні показують важливу різницю між короткостроковим імпульсом і ширшим трендом: MA7: $9,141 MA14: $9,355 MA28: $9,731 LINK повернув MA7, що свідчить про покращення короткострокового тиску з боку покупців. Однак MA14 і MA28 залишаються вище поточної ціни. Це означає, що ширша 4-годинна структура все ще потребує підтвердження, перш ніж можна буде констатувати бичачий розворот. Обсяг торгів дає ще одну важливу деталь: Поточний обсяг: 87,06 тис. MA5 обсягу: 211,15 тис. MA10 обсягу: 298,30 тис. Незважаючи на зростання ціни на 7,12%, поточний відображений обсяг залишається нижчим за обидва середні показники. Це те, що я б не став ігнорувати. Ціна відновлюється, але активність ще не досягла рівнів недавнього середнього значення. Сильніше розширення обсягів зробило б відновлення переконливішим. МІЙ АНАЛІЗ Я бачу два важливі рівні в поточній структурі LINK. Перший — $9,355, де розташована MA14. Другий — $9,731, де MA28 створює ще один потенційний опір. Якщо покупці повернуть обидва рівні й утримають ціну вище за них, поточне відновлення може перерости в ширший розворот тренду. Однак, якщо LINK буде важко в цій зоні опору і сформується підтверджена ведмежа 4-годинна свічка відхилення, можливий ще один рух до $9,14 і, потенційно, до $8,62. Я волію не «ганятися» за відновленням після руху на 7%. Я краще поспостерігаю за тим, як ціна поводитиметься навколо ковзних середніх, перш ніж визначатися з напрямком. ТОРГІВЕЛЬНИЙ ПЛАН LINK — Сценарій SHORT (коротка позиція) Ведмежий тригер: Відхилення від зони опору $9,35–$9,73 з подальшою підтвердженою ведмежою 4-годинною свічкою. Зона входу: $9,40–$9,65 Stop Loss: $9,85 TP1: $9,14 TP2: $8,85 TP3: $8,62 Скасування «бичачого» сценарію: Стійке закріплення 4-годинної свічки вище $9,85, що послаблює ведмежий сценарій продовження. Цілі зниження — це оцінки, засновані на видимій структурі графіка, причому TP3 розташований поблизу попереднього мінімуму $8,621. Потенційне зниження до TP3: приблизно 8%–10%. Розрахункове співвідношення ризику до прибутку: близько 2,5:1, залежно від точки входу та виконання. Цей сетап є умовним. Я почекаю реального відхилення ціни, перш ніж вважати позицію SHORT активною. ПІДСУМОК Що робить Chainlink цікавим прямо зараз, так це контраст між покращенням короткострокового імпульсу та невідновленим ширшим трендом. Зростання на 7,12% свідчить про те, що покупці повернулися, але ковзні середні вказують на те, що їм ще потрібно подолати важливий опір. Для мене зона $9,35–$9,73 визначить, чи має це відновлення достатньо сили, щоб кинути виклик існуючій ведмежій структурі. Якщо покупці повернуть її з переконливим обсягом, перспективи зміняться. Якщо продавці її захистять, недавнє відновлення може стати ще одним нижчим максимумом у межах ширшого низхідного тренду. Наступний важливий сигнал надійде від того, як LINK відреагує, коли зустрінеться з цією зоною опору. $LINKUSDT #ByXIMPACT
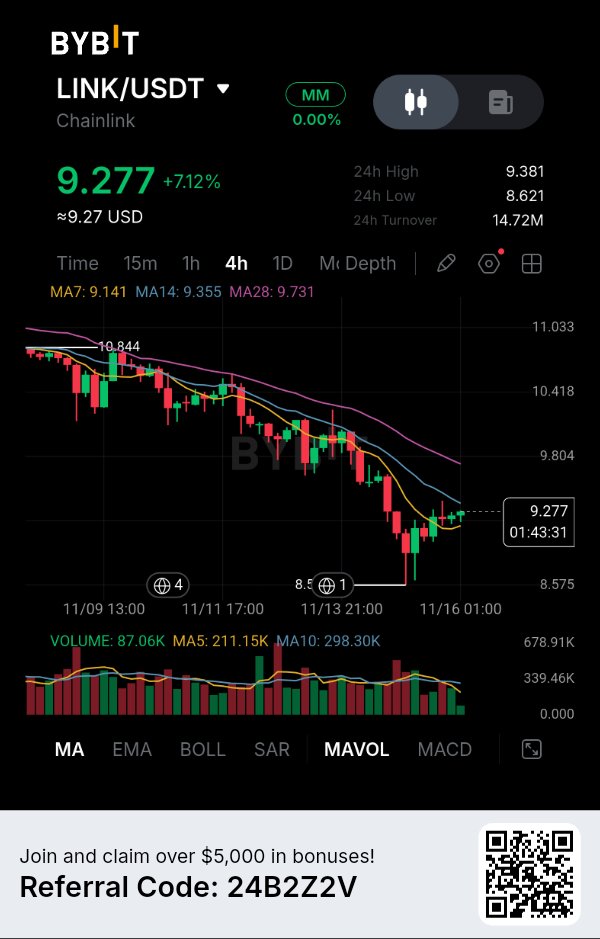


⚠️ $ETH: ІНСТИТУЦІЙНИЙ КАПІТАЛ ВИХОДИТЬ З ETF, АЛЕ РЕЗЕРВИ БІРЖ ТАКОЖ ЗНИЖУЮТЬСЯ — ЩО НАСПРАВДІ ВІДБУВАЄТЬСЯ? Ethereum стикається зі складними ринковими умовами, але ситуація складніша, ніж просто зниження ціни. Станом на 15 листопада ETH торгується в районі $1800 після значного тиску з боку продавців. Що робить цю ситуацію особливо цікавою, так це контраст між відтоком коштів інституційних фондів і скороченням біржових резервів. Давайте подивимось за межі свічок і розглянемо загальну картину. 🔴 1. РИНОК ПІД ТИСКОМ Ethereum рухається вниз разом із Bitcoin та ширшим ринком криптовалют. Кілька факторів сприяють цій слабкості: - Очікування підвищення відсоткових ставок. - Загальноринковий тиск з боку продавців. - Примусові ліквідації на ринку деривативів. - Слабкий інституційний попит через спотові ETH ETF. Це свідчить про те, що поточне зниження не обов'язково спричинене новою фундаментальною проблемою в самому Ethereum. 📉 2. ІНСТИТУЦІЙНІ ПОТОКИ: ПОПЕРЕДЖУВАЛЬНИЙ СИГНАЛ Однією важливою подією є чистий відтік коштів у розмірі приблизно $398,9 мільйона, зафіксований спотовими ETH ETF у США в період з 9 по 13 листопада. Це свідчить про те, що інституційні інвестиційні продукти зазнали значного тиску з боку продавців протягом цього періоду. Проте відтік коштів з ETF не слід автоматично трактувати як доказ того, що довгострокова довіра до Ethereum зникла. Це лише частина значно ширшої ринкової картини. 📊 3. ПАРАДОКС БІРЖОВИХ РЕЗЕРВІВ Ось ще одна подія, на яку варто звернути увагу. За повідомленнями, резерви Ethereum на Binance знизилися приблизно до 2,9 мільйона ETH, досягнувши найнижчого рівня майже за п'ять років. Це створює цікавий контраст: - Відтік коштів з ETF вказує на тиск на попит з боку інституційних інвесторів. - Скорочення біржових резервів вказує на те, що менша кількість ETH утримується на гаманцях, позначених як біржові. Чи може це відображати довгострокове виведення коштів і зменшення негайно доступної біржової пропозиції? Можливо. Але виведення коштів з бірж не є автоматичним доказом накопичення або нових покупок. Саме тому дані он-чейн потрібно інтерпретувати обережно. ⚡ 4. ТЕХНІЧНІ РІВНІ, ЯКІ МАЮТЬ ЗНАЧЕННЯ На основі аналізу ринку від 15 листопада, ось ключові зони, за якими я стежу: Зона підтримки: $1790–$1814 Утримання цієї зони може дозволити ETH спробувати відновитися. Перший опір при відновленні: $1838–$1868 Стале повернення вище цієї зони покращило б короткостроковий технічний прогноз. Критичний орієнтир зниження: $1712 Пробій нижче структури підтримки може піддати ETH ще одному серйозному випробуванню. Це рівні для спостереження, а не гарантовані цілі. 🧠 5. ЩО ЗМІНИЛО Б МІЙ ПОГЛЯД НА РИНОК? Я став би більш оптимістичним, якби: - ETH втримає підтримку в районі $1790–$1814. - Ціна повернеться до $1838–$1868. - Активність спотових покупок покращиться. - Відтік коштів з ETF почне стабілізуватися. - Позиціювання на ринку деривативів стане здоровішим. З іншого боку, сталий пробій нижче рівня підтримки, що супроводжується зростанням тиску з боку продавців, скасував би сценарій короткострокового відновлення. 🎯 6. ДИСЦИПЛІНОВАНИЙ ПІДХІД Замість того, щоб купувати просто тому, що ETH знизився, я розділив би потенційну експозицію на умовні етапи: 1. Спостерігати, чи втримається підтримка і чи послабшає тиск продавців. 2. Шукати підтвердження через відновлення ціни та сильнішу участь. 3. Оцінювати додаткову експозицію лише після того, як буде подолано опір. Загальна експозиція повинна визначатися заздалегідь встановленим лімітом ризику. Якщо підтримка не встоїть, правильною реакцією буде переоцінка тези, а не автоматичне збільшення експозиції. 🔥 МОЯ ЗАГАЛЬНА КАРТИНА Ethereum зараз стикається з двома протилежними силами. З одного боку, інституційний відтік коштів з ETF та загальноринкові ліквідації створюють тиск. З іншого боку, зниження біржових резервів піднімає цікаве питання щодо руху та доступності пропозиції ETH. Жодна з цих подій окремо не визначає подальший напрямок ринку. Справжнє підтвердження має прийти від цінового руху, ліквідності, інституційних потоків та сталого попиту. Я вважаю, що найближчі сесії будуть важливими для визначення того, чи зможе Ethereum стабілізуватися, чи у продавців ще є простір для подальшого тиску. Як ви інтерпретуєте стан ETH прямо зараз? Ми спостерігаємо тимчасову корекцію, зумовлену ліквідністю, чи ринок входить у глибшу ведмежу фазу? Давайте обговорювати дані, а не лише прогнози. $ETHUSDT $ETHUSDC #ByXIMPACT