🚀 Win 10 USDT: Show Your WSOT Trade × Bybit AI
From Nov. 13–27, show us how you’re using AI to gain an edge in WSOT: 1️⃣ Post your WSOT Al Arena P&L screenshot and explain your setup, entry, risk management and key takeaway; or 2️⃣ Share how Bybit AI helped you assess a market opportunity, shape your trading strategy, and execute the trade. 🎁 10 winners will each receive 10 USDT! We’re looking for authentic trades with clear reasoning and useful insights. Post with #WSOTShowYourAITradeToEarn10USDTand let the community learn from your trading setup! Notes: Bybit AI provides informational support and does not constitute financial advice.



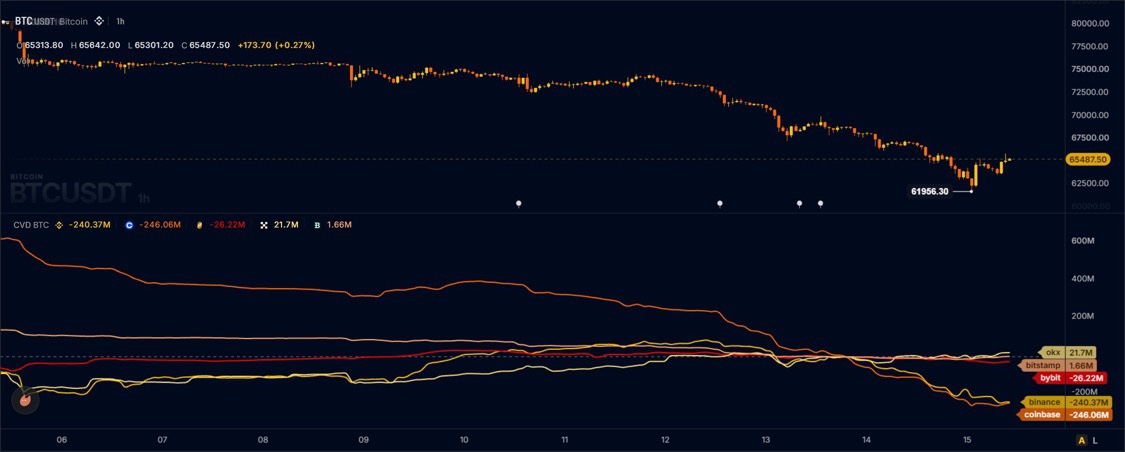
Binance and Coinbase have been the biggest $BTCUSDT sellers this month. This is why we had such an aggressive dump without a single relief rally.

$XAUTUSDT
$BTCUSDT

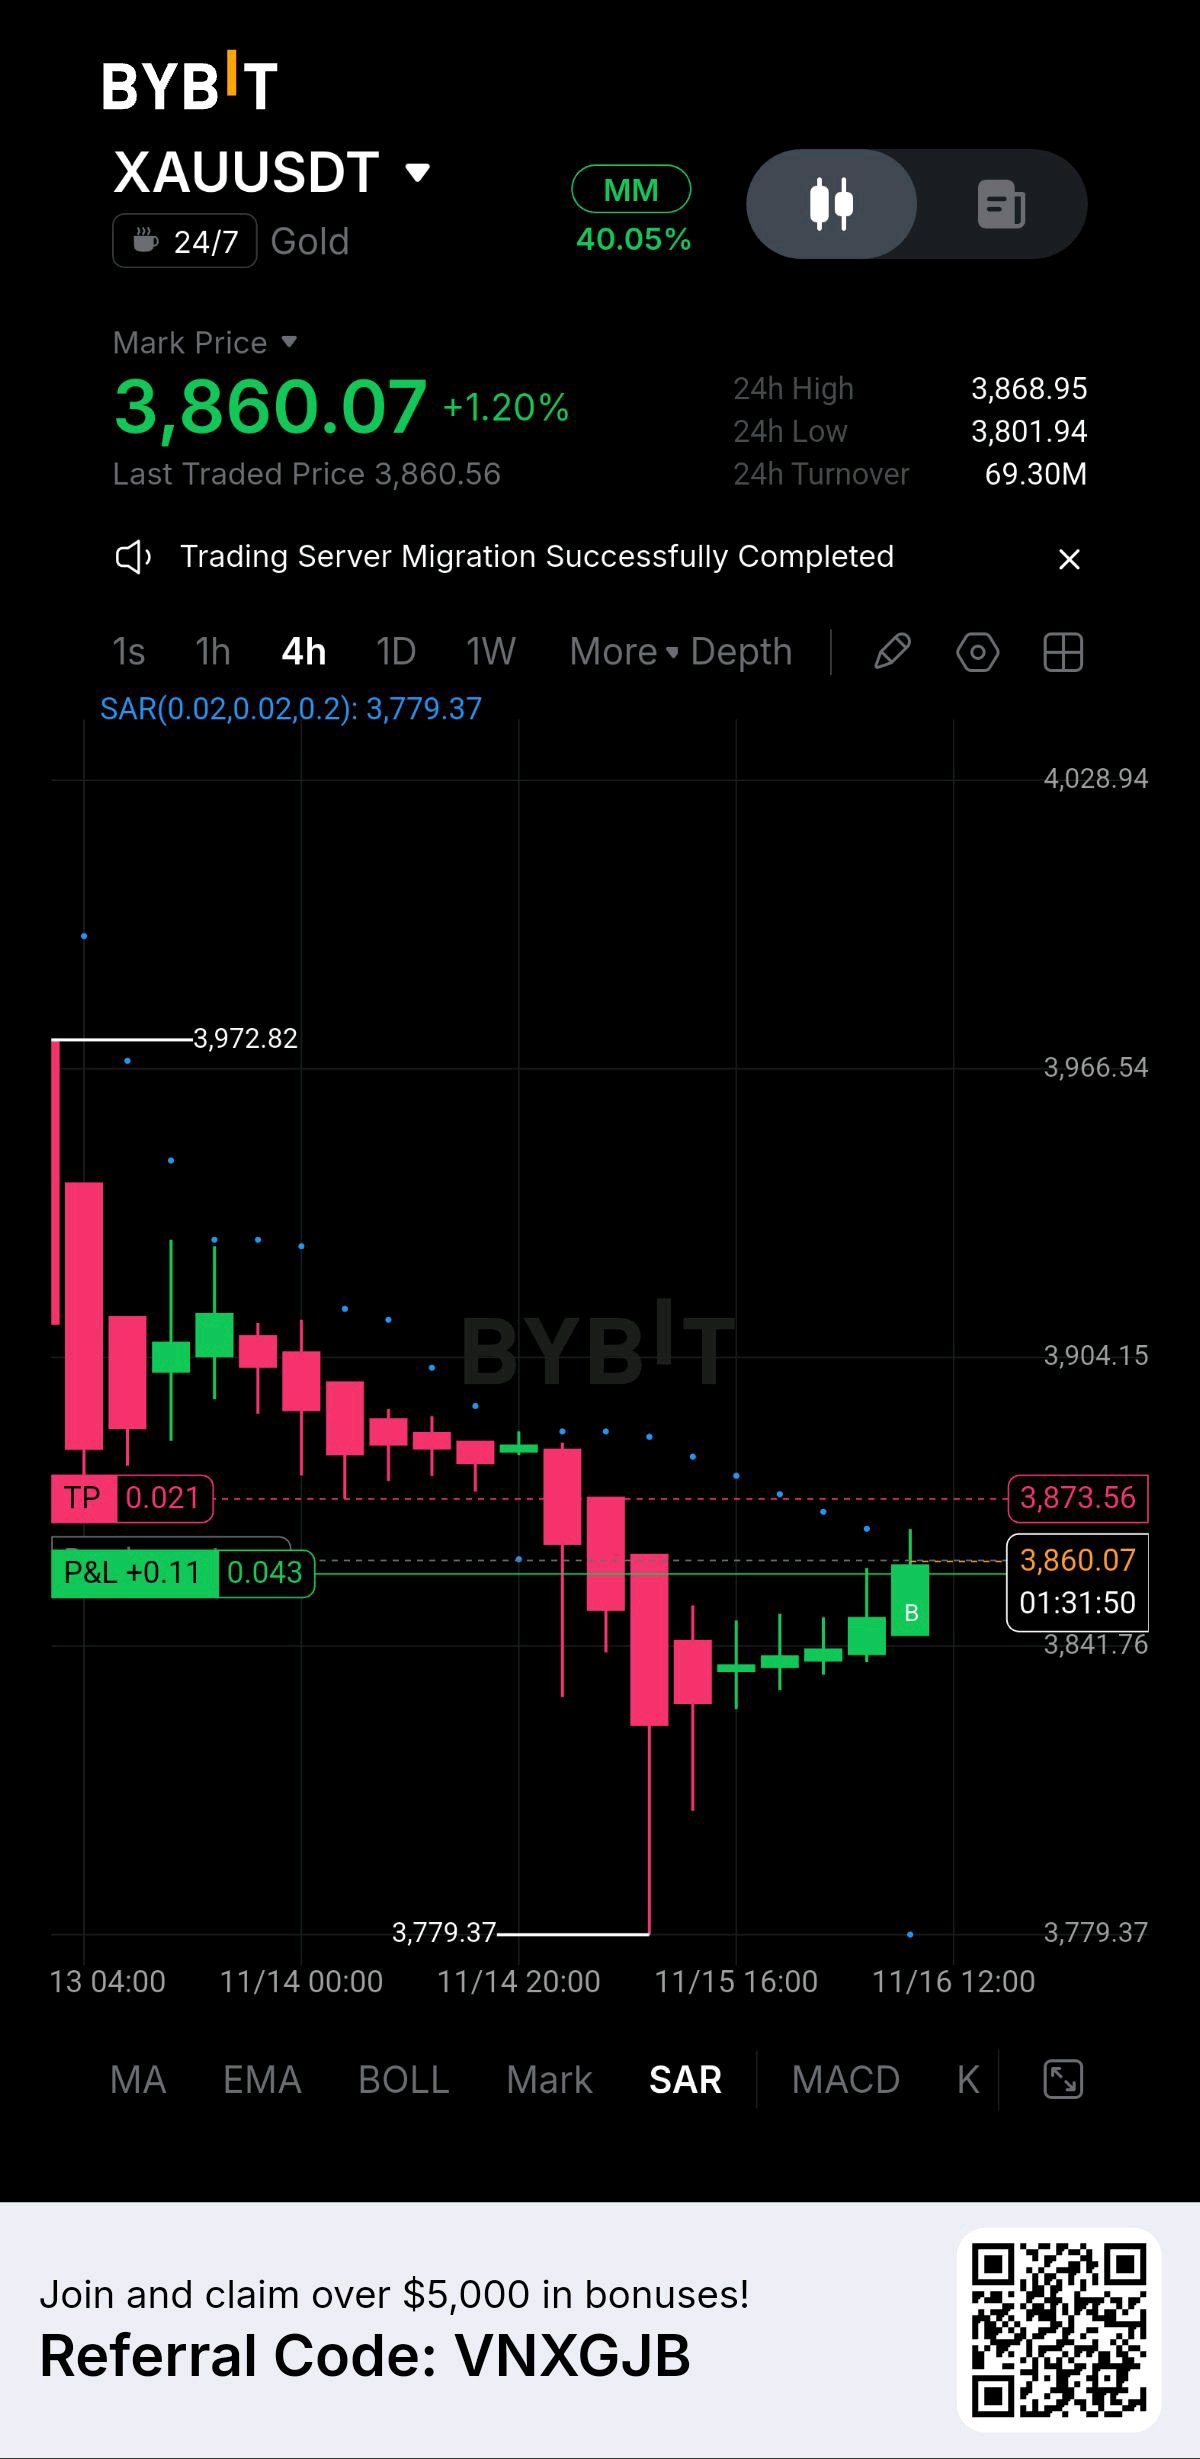
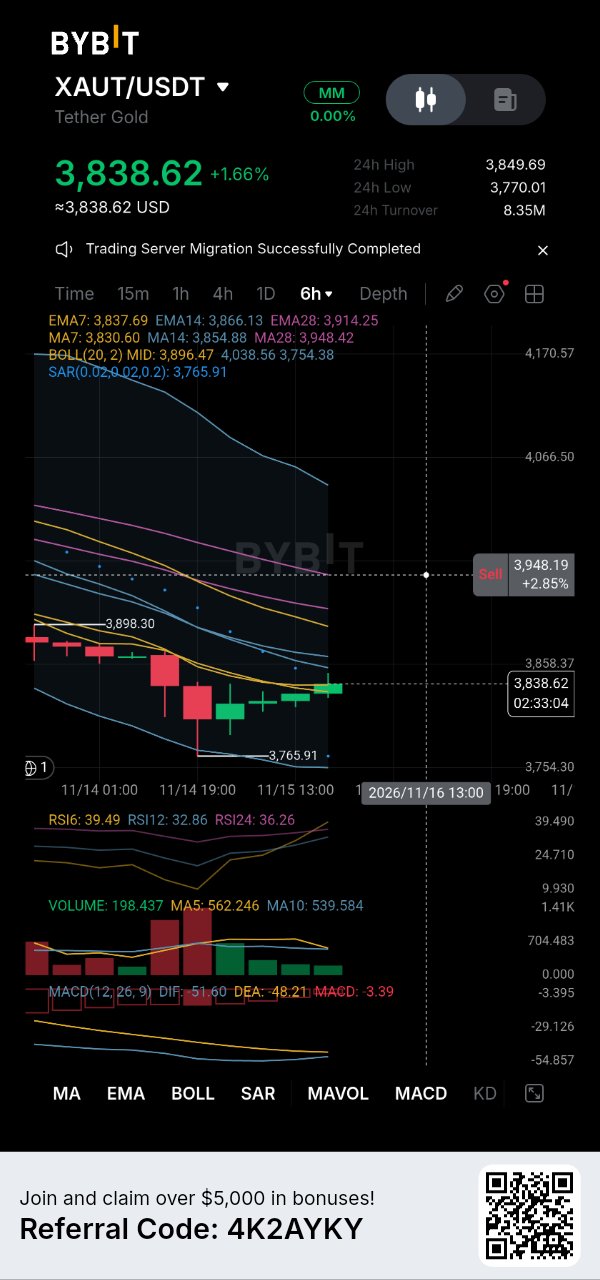
Tether Gold is trading near $3,838.62, up 1.6%, after falling toward the $3,765.91 area on the 6H chart. The latest candles show buyers attempting to stabilize the price. XAUT has moved back above EMA7 at $3,837.69 and MA7 at $3,830.60. That is an improvement, but I would not confuse short-term stabilization with a confirmed trend reversal. The bigger resistance remains overhead. EMA14 sits at $3,866.13, followed by the Bollinger midline at $3,896.47. A sustained move above these levels would provide stronger evidence that buyers are regaining control. Momentum still calls for patience. RSI6 is at 39.49, RSI12 at 32.86, and RSI24 at 36.26. MACD remains negative, with DIF at -51.60 against DEA at -48.21. The selling pressure may be easing, but bullish momentum has not been established. Volume adds another layer of caution: 198.4, compared with MA5 at 562.2 and MA10 at 539.6. The rebound is occurring with relatively limited participation. My focus is now on whether XAUT can hold $3,830 and reclaim $3,866. If it does, $3,896 becomes the next important test. Failure to hold the short-term averages could bring $3,800 and the previous low near $3,766 back into focus. I prefer to wait for confirmation rather than assign too much importance to a modest rebound. Is this the start of a stronger recovery, or simply a pause before another test of the lows? Not financial advice. $XAUTUSDT $BTCUSDT #ByXIMPACT


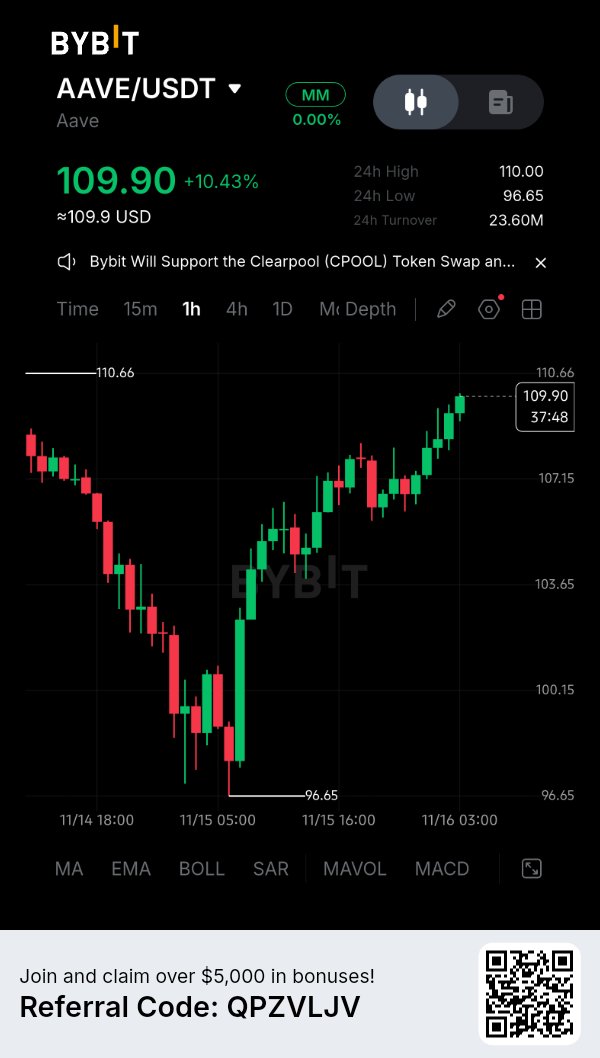
🚀 $AAVEUSDT Technical Analysis – Bulls Are Approaching a Major Breakout! AAVE is showing strong buying pressure after recovering from the $96.65 support area. The price is currently trading around $109.90, with a 10.43% gain. The 1H chart shows a clear recovery structure, with buyers gradually pushing the price toward the $110 resistance zone. But the big question is whether bulls can successfully break this level. Let's break down the important trading levels. 📊 Current Market Overview Pair: AAVE/USDT Current Price: $109.90 24H Change: +10.43% 24H High: $110.00 24H Low: $96.65 24H Turnover: $23.60M Timeframe: 1H 🟢 Important Support Levels $107.15 – $106.50: Immediate support and potential pullback area. $105.00 – $104.50: Secondary support zone. $103.65 – $102.00: Important demand area. $100.15 – $96.65: Major downside support zone. 🔴 Important Resistance Levels $110.00 – $110.66: Immediate resistance and breakout area. $111.50 – $112.00: Next potential upside target. $113.00: Psychological target if bullish momentum continues. 📈 LONG Trading Strategy Setup 1 – Pullback Entry Entry Zone: $107.50 – $108.50 Stop Loss: Below $106.50 Take Profit 1: $110.00 Take Profit 2: $111.50 Take Profit 3: $113.00 Wait for a bullish rejection candle and confirmation before entering. Setup 2 – Breakout Entry Entry: Above $110.70 after a confirmed 1H candle close. Retest Zone: $110.00 – $110.70 Stop Loss: Below the confirmed retest structure. Take Profit 1: $111.50 Take Profit 2: $112.00 Take Profit 3: $113.00 Strong volume during the breakout would increase confidence in the setup. 📉 SHORT Trading Strategy If AAVE fails to break the $110.00 – $110.66 resistance zone and forms a strong bearish rejection, a short opportunity may develop. Entry Zone: $110.00 – $110.50 after bearish confirmation. Stop Loss: Above $111.00 Take Profit 1: $108.50 Take Profit 2: $107.50 Take Profit 3: $106.50 Avoid shorting if buyers successfully break and hold above resistance. 🧠 Professional Trading Tips 1. Watch the 1H candle close around $110.66. 2. Confirm breakout strength with trading volume. 3. Avoid entering directly into resistance. 4. Wait for a retest before taking a breakout trade. 5. Keep risk limited to 0.5%–1% of your trading capital. 6. Always use a stop loss and consider taking partial profits. 🎯 My Market Outlook AAVE currently has a bullish short-term structure after its strong recovery from $96.65. The $110.00 – $110.66 zone is the most important area to watch. A confirmed breakout could open the way toward $111.50 and potentially $113.00. However, rejection from this resistance could trigger a pullback toward $107.15 or $105.00. My strategy is simple: I would prefer waiting for confirmation rather than chasing the current green candles. Trade with a plan. Protect your capital. Let the market confirm your setup. What is your prediction? Will AAVE break $110.66 and move toward $113, or will sellers defend this resistance? Share your thoughts below. #ByXIMPACT #WSOTShowYourAITradeToEarn10USDT #JensenHuangExitTestsNvidiasAILeadership #USPPITestsTheHigherForLongerTrade #USInflationRunsHotAndRateHikeBetsRise $AAVEUSDC
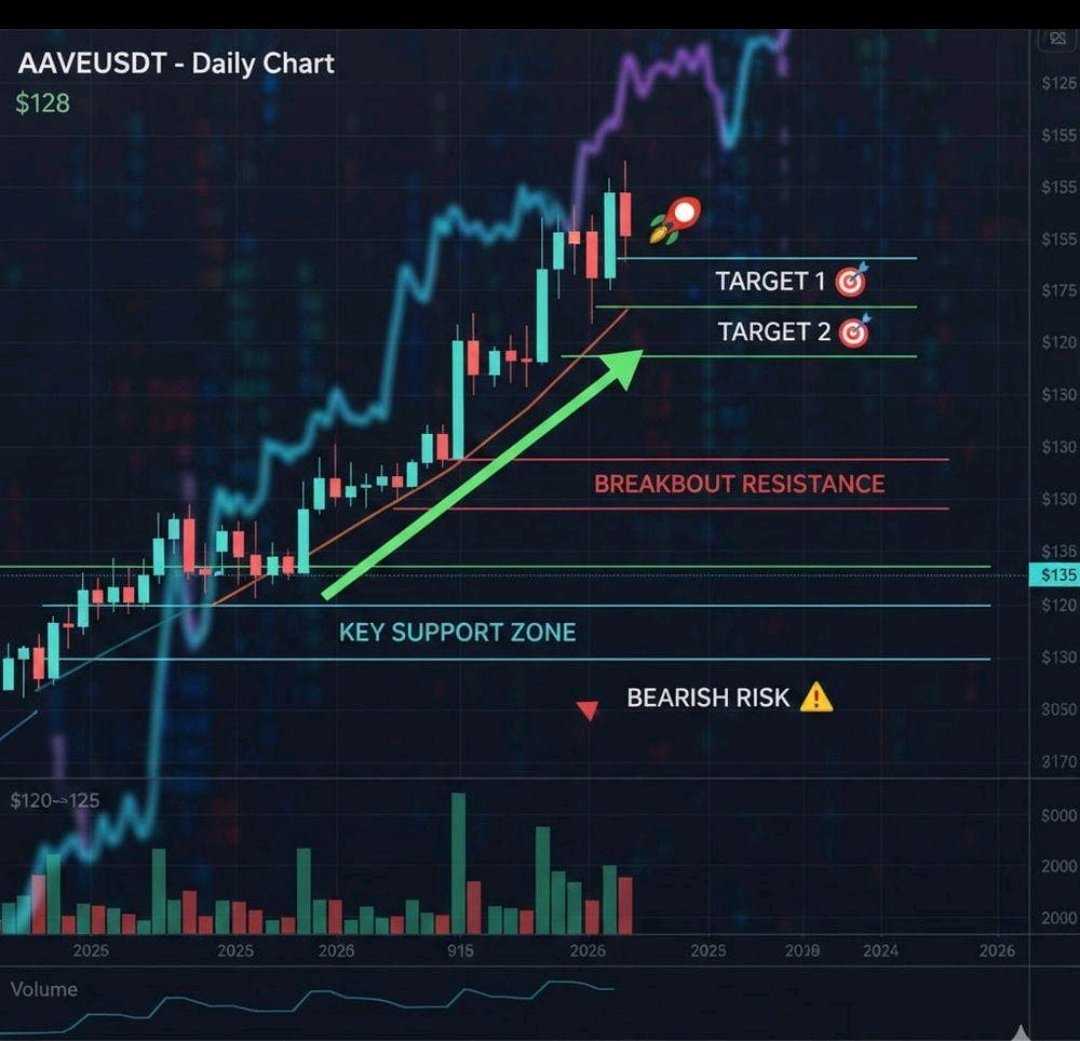
$BTCUSDT longs have been fully hunted. A $18,000 drop in 17 days with total liquidations over $13 Billion. Right now, the long liquidation cluster is only $1B, while the short side liquidity is $16B. It's clear which side will get hunted next.

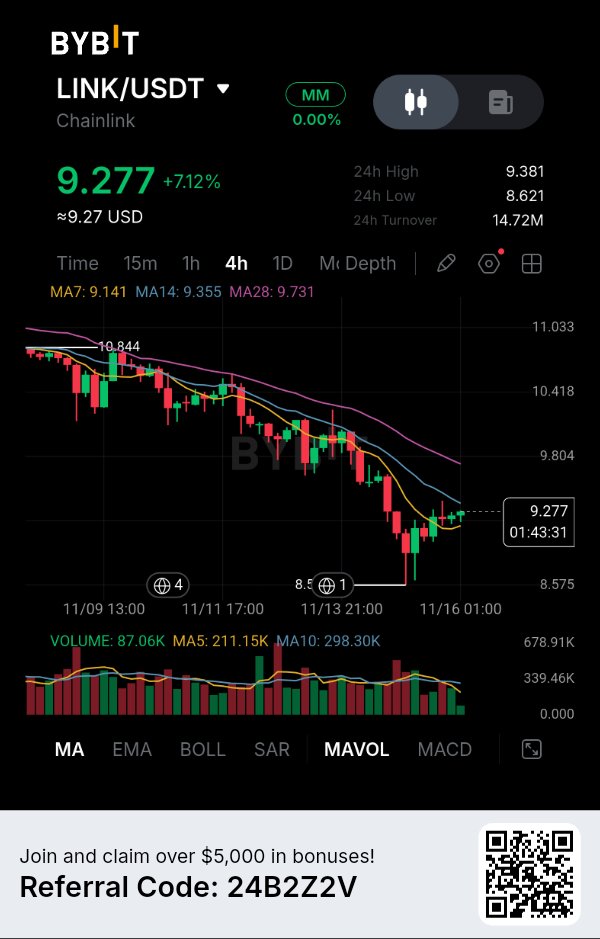
The 7% Recovery Looks Interesting, But Buyers Still Face a Major Resistance Zone. Chainlink is showing a strong short-term recovery, with LINK gaining 7.12% and moving back above its 4H MA7. However, what catches my attention is that this recovery is happening inside a broader declining structure. The interesting part is that buyers have managed to push price away from the recent $8.62 low, but they are now approaching a region where multiple moving averages could challenge the recovery. I want to understand whether this is the beginning of a genuine trend reversal or simply a relief bounce before sellers return. THE MARKET STORY LINK is currently trading around $9.277, after recovering from the recent decline toward the $8.621 area. The 4H chart shows that the previous downward structure has not completely disappeared. Price is still below MA14 and MA28, even though it has recovered above MA7. This creates an interesting technical situation. Buyers are showing renewed strength, but they still need to overcome the $9.35–$9.73 resistance region before I would consider the broader recovery convincing. For me, the next reaction around this zone matters more than the current 7% gain. DATA & EVIDENCE Here are the important figures from the supplied Bybit screenshot: Current price: $9.277 24H change: +7.12% 24H high: $9.381 24H low: $8.621 24H turnover: $14.72M Previous visible high: $10.844 The moving averages reveal an important difference between short-term momentum and the broader trend: MA7: $9.141 MA14: $9.355 MA28: $9.731 LiNK has reclaimed MA7, which suggests improving short-term buying pressure. However, MA14 and MA28 remain above the current price. This means the broader 4H structure still needs confirmation before a bullish reversal can be established. Volume provides another important detail: Current volume: 87.06K Volume MA5: 211.15K Volume MA10: 298.30K Despite the 7.12% price recovery, current displayed volume remains below both averages. This is something I would not ignore. Price is recovering, but participation has not yet reached the recent average levels. A stronger volume expansion would make the recovery more convincing. MY READ I see two important levels in LINK's current structure. The first is $9.355, where MA14 is positioned. The second is $9.731, where MA28 creates another potential resistance. If buyers reclaim both levels and maintain price above them, the current recovery could develop into a broader trend reversal. However, if LINK struggles around this resistance zone and produces a confirmed bearish 4H rejection, another move toward $9.14 and potentially $8.62 becomes possible. My preference is to avoid chasing the recovery after a 7% move. I would rather observe how price behaves around the moving averages before committing to a direction. TRADING SETUP LINK — SHORT Scenario Bearish trigger: Rejection from the $9.35–$9.73 resistance region, followed by a confirmed bearish 4H candle. Entry Zone: $9.40–$9.65 Stop Loss: $9.85 TP1: $9.14 TP2: $8.85 tP3: $8.62 Bullish invalidation: Sustained 4H acceptance above $9.85, weakening the bearish continuation setup. The downside targets are estimates based on the visible chart structure, with TP3 positioned near the previous $8.621 low. Potential downside to TP3: Approximately 8%–10%. Estimated risk-to-reward: Around 2.5:1, depending on entry and execution. This setup is conditional. I would wait for an actual rejection before considering the SHORT active. FINAL THESIS What makes Chainlink interesting right now is the contrast between improving short-term momentum and an unrecovered broader trend. The 7.12% gain shows that buyers have returned, but the moving averages suggest they still have important resistance to overcome. For me, the $9.35–$9.73 region will determine whether this recovery has enough strength to challenge the existing bearish structure. If buyers reclaim it with convincing volume, the outlook changes. If sellers defend it, the recent recovery could become another lower high in the broader downtrend. The next important signal will come from how LINK reacts when it meets this resistance zone. $LINKUSDT #ByXIMPACT


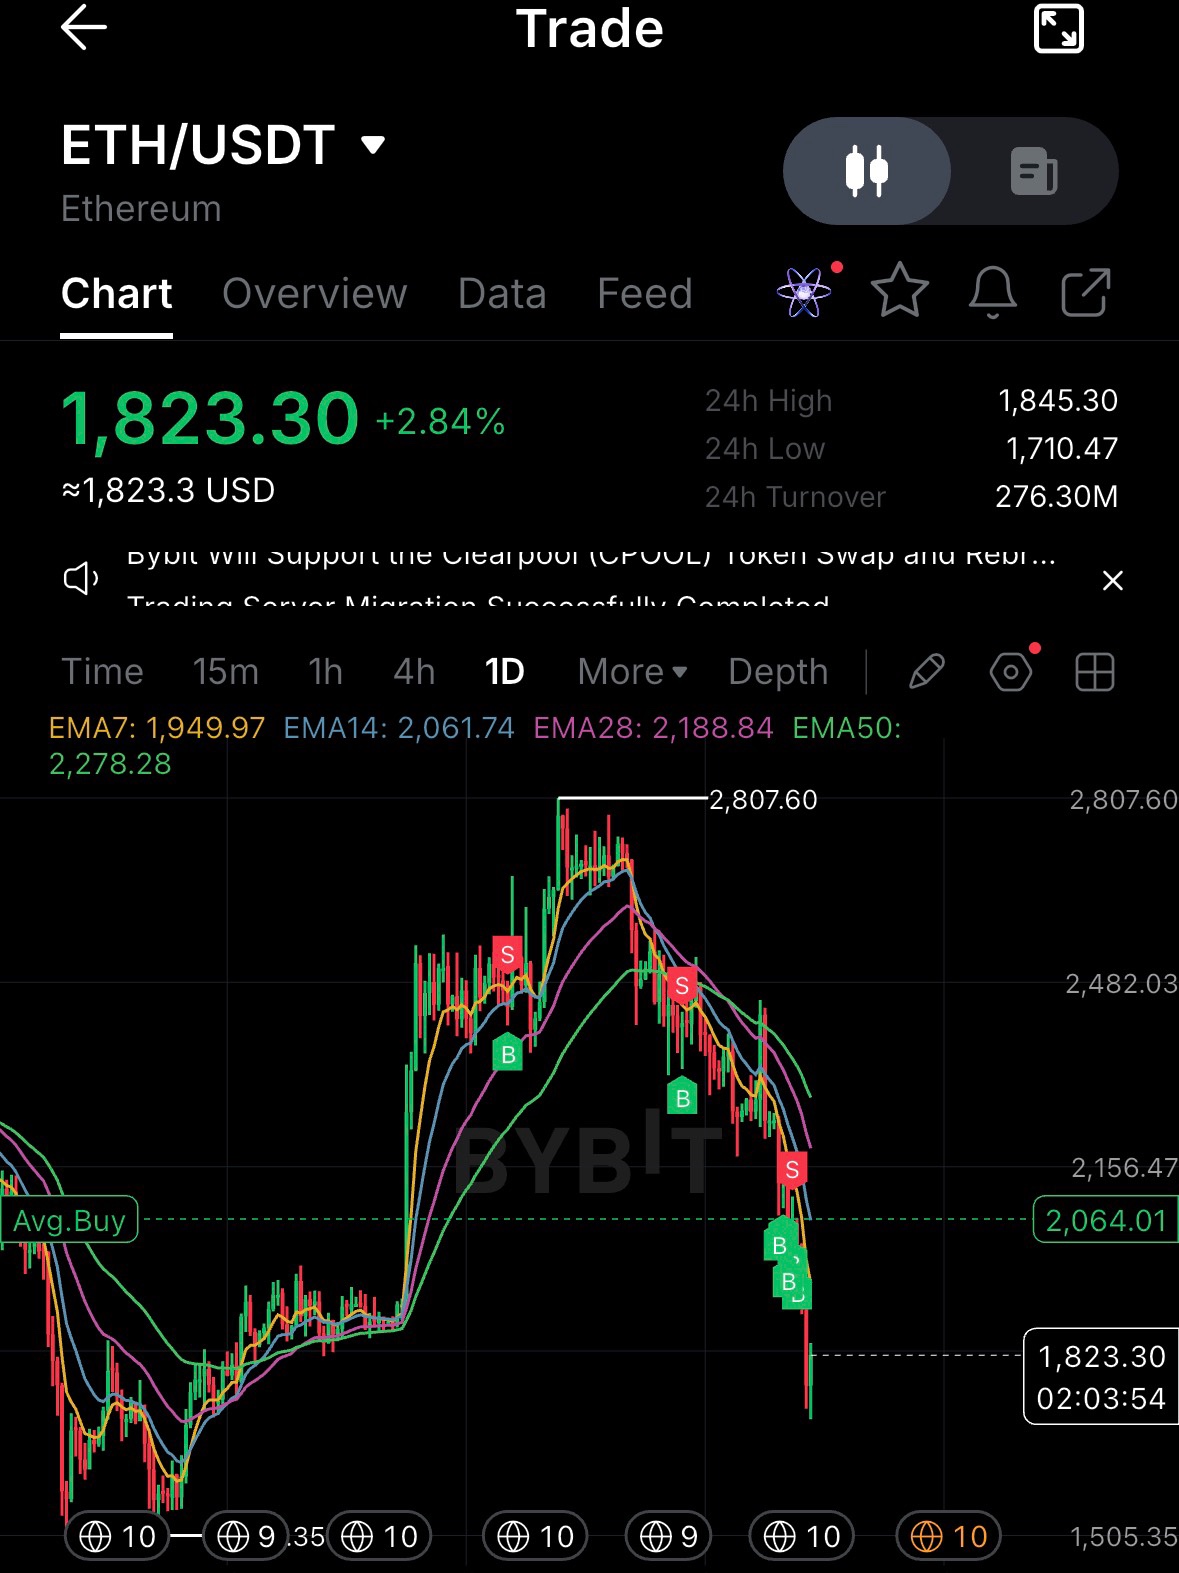
⚠️ $ETH: INSTITUTIONAL MONEY IS LEAVING ETFs, BUT EXCHANGE RESERVES ARE FALLING TOO — WHAT IS REALLY HAPPENING? Ethereum is facing a challenging market environment, but there is more to this situation than a simple price decline. As of November 15, ETH is trading around the $1,800 area after experiencing significant selling pressure. What makes this situation particularly interesting is the contrast between institutional fund outflows and declining exchange reserves. Let's look beyond the candles and examine the bigger picture. 🔴 1. THE MARKET IS UNDER PRESSURE Ethereum has been moving lower alongside Bitcoin and the broader cryptocurrency market. Several factors are contributing to the weakness: - Higher interest-rate expectations. - Marketwide selling pressure. - Forced liquidations in derivatives markets. - Weak institutional demand through spot ETH ETFs. This suggests that the current decline is not necessarily caused by a new fundamental problem within Ethereum itself. 📉 2. INSTITUTIONAL FLOWS: A WARNING SIGNAL One important development is the approximately $398.9 million in net outflows recorded by US spot Ethereum ETFs between November 9 and November 13. This indicates that institutional investment products experienced meaningful selling pressure during that period. However, ETF outflows should not automatically be interpreted as proof that long-term confidence in Ethereum has disappeared. They are one part of a much larger market picture. 📊 3. THE EXCHANGE RESERVE PARADOX Here is another development worth watching. Ethereum reserves on Binance have reportedly declined to approximately 2.9 million ETH, reaching their lowest level in nearly five years. This creates an interesting contrast: - ETF outflows indicate pressure on institutional investment demand. - Declining exchange reserves indicate that fewer ETH are held in exchange-labelled wallets. Could this reflect longer-term withdrawals and reduced immediately available exchange supply? Possibly. But exchange withdrawals do not automatically prove accumulation or fresh buying. This is precisely why on-chain data needs to be interpreted carefully. ⚡ 4. THE TECHNICAL LEVELS THAT MATTER Based on the November 15 market analysis, these are the key areas I am monitoring: Support zone: $1,790–$1,814 Holding this area could allow ETH to attempt a recovery. First recovery resistance: $1,838–$1,868 A sustained reclaim of this zone would improve the short-term technical outlook. Critical downside reference: $1,712 A breakdown below the support structure could expose ETH to another significant test. These are monitoring levels, not guaranteed targets. 🧠 5. WHAT WOULD CHANGE MY MARKET VIEW? I would become more constructive if: - ETH maintains support around $1,790–$1,814. - Price reclaims $1,838–$1,868. - Spot buying activity improves. - ETF outflows begin to stabilize. - Derivatives positioning becomes healthier. On the other hand, a sustained breakdown below support, accompanied by increasing selling pressure, would invalidate the short-term recovery scenario. 🎯 6. A DISCIPLINED APPROACH Rather than buying simply because ETH has declined, I would separate potential exposure into conditional stages: 1. Observe whether support holds and selling pressure weakens. 2. Look for confirmation through price recovery and stronger participation. 3. Evaluate additional exposure only after resistance is reclaimed. Total exposure should be determined by a predefined risk limit. If support fails, the correct response is to reassess the thesis rather than automatically increase exposure. 🔥 MY BIGGER PICTURE Ethereum is currently facing two competing forces. On one side, institutional ETF outflows and marketwide liquidations are creating pressure. On the other, declining exchange reserves raise an interesting question about the movement and availability of ETH supply. Neither development alone determines the next market direction. The real confirmation must come from price action, liquidity, institutional flows, and sustained demand. I believe the coming sessions will be important in determining whether Ethereum can stabilize or whether sellers still have more room to push. What is your interpretation of ETH right now? Are we witnessing a temporary liquidity-driven correction, or is the market entering a deeper bearish phase? Let's discuss the data, not just the predictions. $ETHUSDT $ETHUSDC #ByXIMPACT


NVIDIA'S BOARD IS LEARNING HOW HARD IT IS TO REPLACE A FOUNDER AND CRYPTO HAS SEEN THIS MOVIE BEFORE The Nvidia saga took a surprising turn this week. After Jensen Huang resigned following reports of extramarital relationships, a petition to bring him back climbed toward 150,000 signatures, with Elon Musk, several tech CEOs and two large investors holding more than two billion dollars of stock publicly backing a return or at least a rethink. The signatures are self reported, the board has not responded, and shareholders do not get a direct vote on who runs the company, so this is pressure and not a process. Nvidia also faces a lawsuit and a CEO search right as earnings approach. What makes it relevant here is the key person problem. Nvidia's stock dropped hard on the news because the market priced in how much of the AI story was tied to one face. Crypto knows this feeling well. Strategy leans on Michael Saylor, Binance has leaned on CZ, and every time a founder wobbles, the token or the stock attached to them wobbles with him. For traders the lesson is that governance risk is real risk. A board can move faster than anyone expects, public campaigns can swing sentiment overnight, and when the leader of the market's favorite theme is suddenly in question, risk assets tend to feel it, including crypto which has been trading like tech. On the positive side of the week's ledger, Coinbase received final approval for its national trust bank charter, putting its institutional custody under a single federal regulator, and Deutsche Bank is moving ahead with its own custody service in Europe. Those developments keep stacking up in the background while prices fall, and they are the reason I stay constructive on the long game even when the short term looks ugly. I'm watching Nvidia's earnings and the board's next move closely, because a messy resolution would keep the AI and crypto risk mood fragile. Do you think the board should bring Huang back or move on, and does losing a founder hurt a company's token or stock more than people admit? #ByXIMPACT

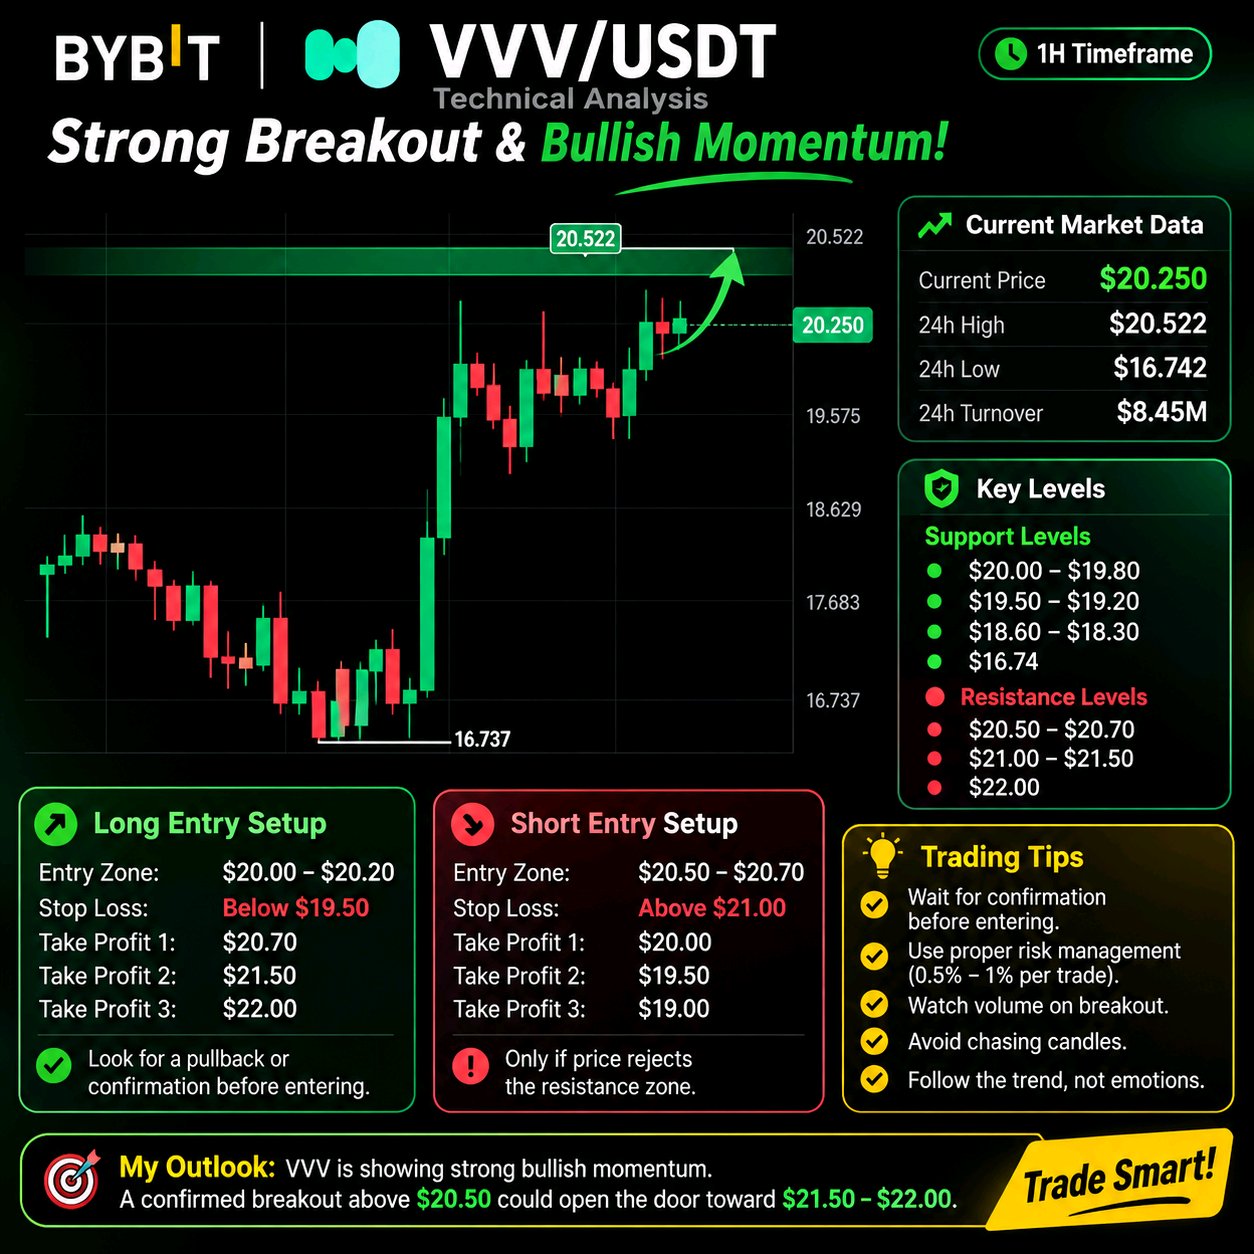
🚀 $VVVUSDT Bulls Are Taking Control! Is $22 the Next Target? VVV is showing strong bullish momentum after recovering from the $16.737 support area. The price has climbed toward $20.250, recording an impressive 19.54% gain. Buyers are clearly showing strength, but the next resistance zone will be very important for the continuation of this move. Let's look at the important levels and possible trading opportunities. 📊 Current Market Overview Pair: VVV/USDT Current Price: $20.250 24H Change: +19.54% 24H High: $20.522 24H Low: $16.742 24H Turnover: $8.45M Timeframe: 1H 🟢 Important Support Zones $20.00 – $19.80: Immediate support and potential pullback entry area. $19.50 – $19.20: Secondary support where buyers may attempt to defend the price. $18.60 – $18.30: Important demand zone and previous consolidation area. $16.74: Major recent swing low. 🔴 Important Resistance Zones $20.50 – $20.70: Immediate resistance and breakout area. $21.00 – $21.50: Next potential resistance zone. $22.00: Psychological upside target if bullish momentum continues. 📈 LONG Trading Strategy Setup 1: Pullback Entry Entry Zone: $19.80 – $20.10 Stop Loss: Below $19.40 Take Profit 1: $20.50 Take Profit 2: $21.00 Take Profit 3: $21.50 Wait for bullish confirmation around support before entering. Avoid buying simply because the price is moving up. Setup 2: Breakout Entry Entry: Above $20.55 after a confirmed 1H candle close. Retest Zone: $20.40 – $20.55 Stop Loss: Below $20.00, adjusted to the retest structure. Take Profit 1: $21.00 Take Profit 2: $21.50 Take Profit 3: $22.00 A breakout supported by strong volume would provide better confirmation. 📉 SHORT Trading Strategy If VVV fails to break the $20.50 – $20.70 resistance zone and forms a strong bearish rejection, a short setup may develop. Entry Zone: $20.45 – $20.70 after bearish confirmation. Stop Loss: Above $21.00 Take Profit 1: $20.00 Take Profit 2: $19.50 Take Profit 3: $19.20 Do not open a short position if buyers successfully break and hold above resistance. 🧠 Professional Trading Tips 1. Watch the 1H candle close around $20.50. 2. Check trading volume before trusting a breakout. 3. Wait for retests instead of chasing green candles. 4. Use a stop loss on every trade. 5. Risk only 0.5%–1% of your trading capital per setup. 6. Consider taking partial profits at each target. 🎯 My Market Outlook VVV currently has a bullish short-term structure after its strong recovery from $16.737. The $20.50 level is the most important area to watch. A confirmed breakout could create an opportunity toward $21.50 and potentially $22.00. However, rejection from resistance could bring a healthy correction toward $20.00 or $19.50. My approach would be to wait for confirmation rather than chase the current pump. Trade the setup, not the excitement. What do you think? Will VVV break above $20.50 and move toward $22, or will sellers push the price back toward $19.50? #ByXIMPACT #WSOTShowYourAITradeToEarn10USDT #JensenHuangExitTestsNvidiasAILeadership #USPPITestsTheHigherForLongerTrade #USInflationRunsHotAndRateHikeBetsRise $BTCUSDT
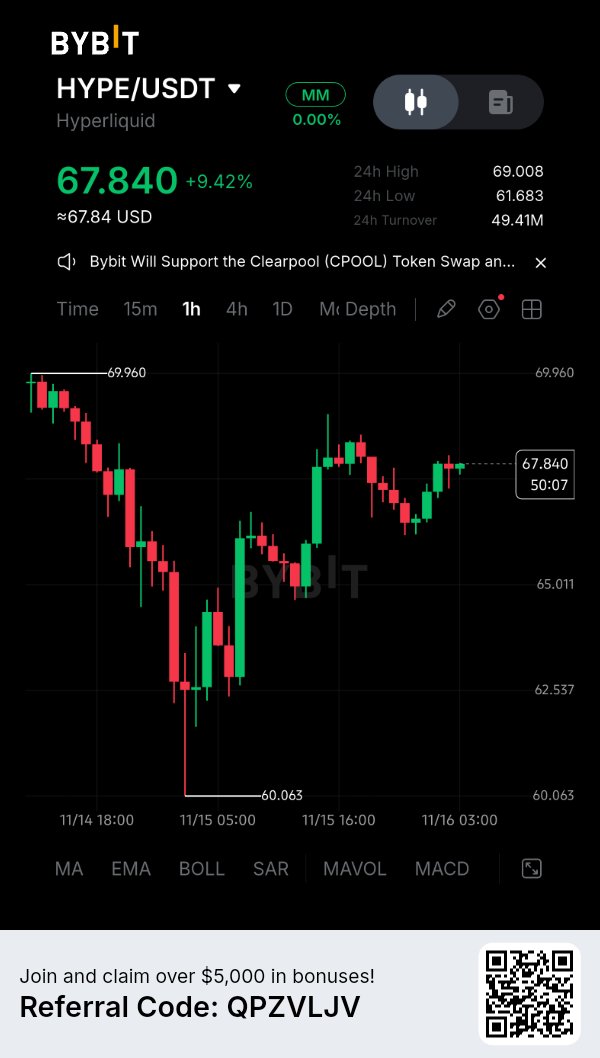
🚨 $HYPEUSDT Technical Analysis – Bulls Are Fighting Back! HYPE is showing a strong recovery after dropping toward the $60.06 support area. Buyers have stepped in aggressively, pushing the price back to $67.84, with approximately 9.42% gains visible in the chart. However, the next move will be very important. Price is approaching a major resistance zone, and traders should watch for confirmation before entering a position. 📊 Current Market Structure (1H Chart) Current Price: $67.84 24H High: $69.00 24H Low: $61.68 Major Chart Low: $60.06 The market has recovered strongly from its recent low. Short-term momentum looks bullish, but the $68.50–$69.00 region could create selling pressure. 🎯 Important Support Levels 1. $67.00 – $66.50: Immediate support and potential pullback zone. 2. $65.50 – $65.00: Important support area for buyers. 3. $63.00 – $62.50: Major demand zone from the previous recovery. 4. $60.06: Recent chart low and major downside reference. 🔴 Major Resistance Levels 1. $68.50 – $69.00: Immediate resistance zone. 2. $69.90 – $70.50: Potential upside target after a confirmed breakout. 3. $72.00: Next psychological target if bullish momentum continues. 📈 Potential LONG Entry Setups Setup 1 – Pullback Entry Entry Zone: $66.50 – $67.20 Stop Loss: Below $65.80 Take Profit 1: $68.00 Take Profit 2: $69.00 Take Profit 3: $70.00 Wait for a bullish rejection candle or a confirmed support retest before entering. Setup 2 – Breakout Entry Entry: Above $69.10 after a confirmed 1H candle close. Confirmation: Wait for a successful retest of $69.00. Stop Loss: Below the retest structure. Take Profit 1: $70.00 Take Profit 2: $70.50 Take Profit 3: $72.00 Avoid chasing a breakout without confirmation. 📉 Potential SHORT Entry Setup If HYPE fails to break the $68.50–$69.00 resistance zone and produces a clear bearish rejection: Entry Zone: $68.30 – $68.90 after bearish confirmation. Stop Loss: Above $69.50 Take Profit 1: $67.20 Take Profit 2: $66.50 Take Profit 3: $65.00 A short position should only be considered if sellers regain control. A strong breakout above resistance invalidates this setup. 🧠 Professional Trading Strategy Here are five things I would watch before taking a trade: 1. Watch the 1H candle close around $69.00. 2. Check volume during any breakout. 3. Avoid entering in the middle of a resistance zone. 4. Wait for retests instead of chasing green candles. 5. Keep risk between 0.5% and 1% of trading capital per setup. My Market Outlook HYPE currently has positive short-term recovery momentum, but the $69.00 level is the key decision point. A confirmed breakout could open the door toward $70–$72. On the other hand, rejection from resistance could bring another pullback toward $67 or even $65. The best trade is not always the first trade. Patience, confirmation and proper risk management matter more than predicting every candle. What is your expectation for HYPE? Will bulls break $69 and push toward $72, or will sellers defend resistance again? Share your analysis below. #ByXIMPACT

ETHUSDT Bulls Weigh a Retest
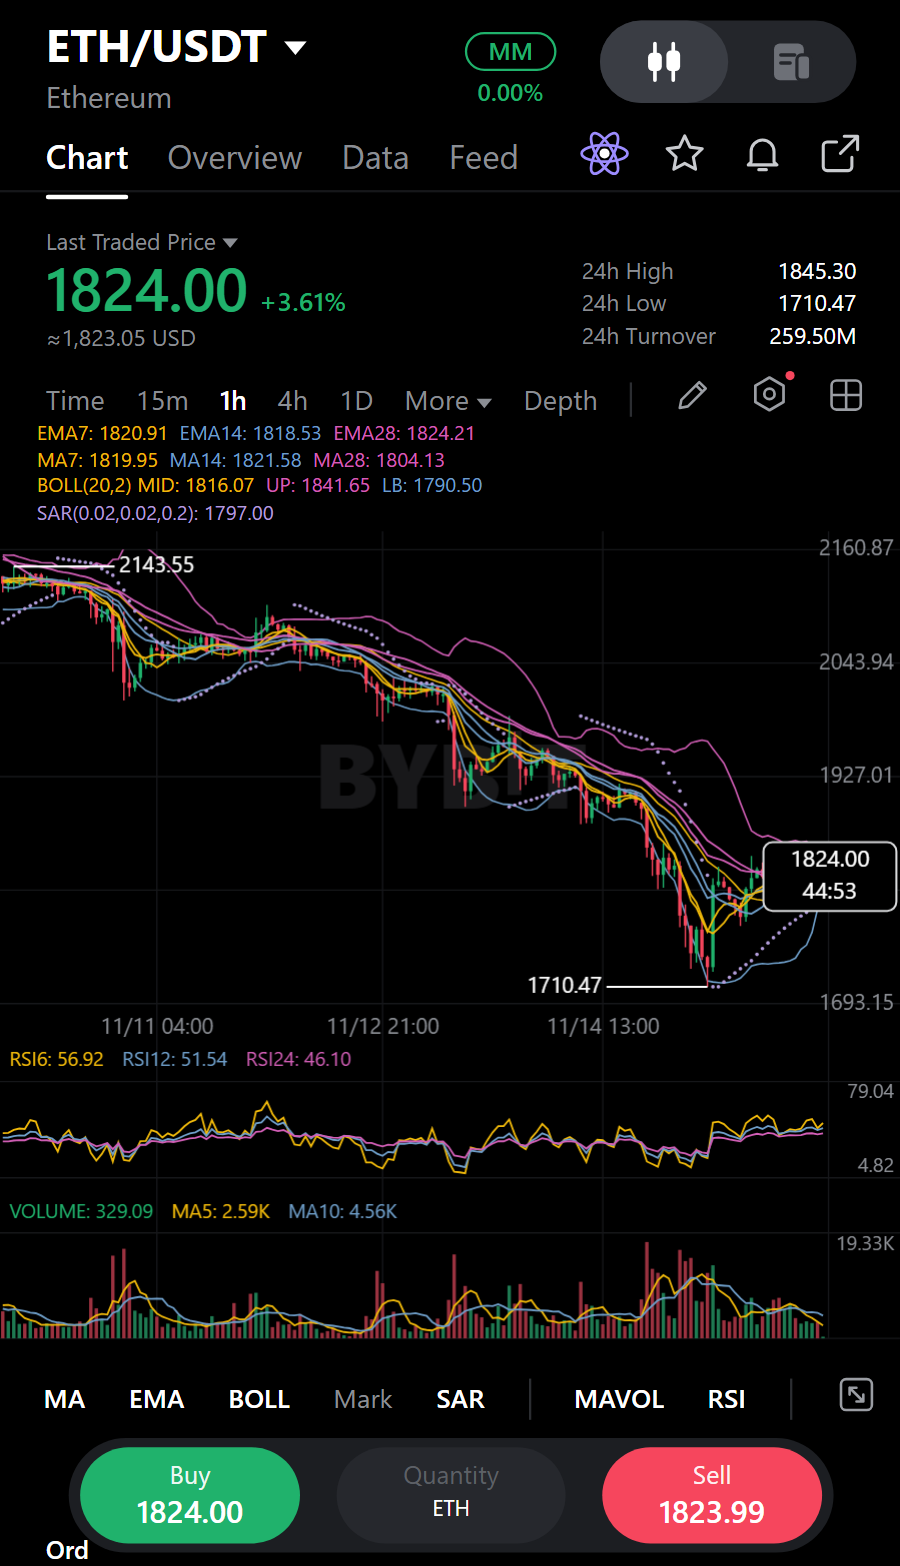
The sharpest clue in this sequence is the contrast between the selloff and the recovery attempt. At 21:00, the red candle closed at 1,807.04 on the sequence’s heaviest volume; by 04:00, after several green candles, price closed at 1,819.45. That shows buyers responded, though the latest candle was red. $ETHUSDT is near the MA7 and MA14 and above the MA28, a mildly supportive arrangement, not proof that the rebound will continue. The bullish lean also has the 24h move in its favor, while the mixed moving-average picture and lower traded volume keep me from treating the move as confirmed. I hold ETH spot, and my chart read depends on whether buyers can maintain the recent recovery rather than on assuming the earlier selloff is finished. The candle sequence shows both demand and selling pressure, so I’d look for follow-through before giving the rebound more weight. My long setup is a possible retest of the Entry Zone at 1,817.20 - 1,830.68, with the Stop Loss at 1,783.49 as the level that invalidates this setup. TP1 is 1,857.65 and TP2 is 1,891.36. From the middle of the zone, the supplied risk-reward is about 0.8 to 1 and 1.7 to 1, respectively, so the first target offers less room relative to the stated risk. A hold around the entry area would support my bullish read; a move through the stop would change it. The recent heavy-volume candle is a reminder that volatility can be uneven around these levels, so I’d account for liquidity and possible wicks when assessing a break. Moving averages describe the current chart, but they don’t guarantee what price does next. Trade Plan (LONG / Bullish): • Support: 1,710.47 / 1,710.47 | Resistance: 1,845.30 / 2,103.98 • Entry Zone: 1,817.20 - 1,830.68 • Stop Loss (SL): 1,783.49 • Targets: TP1 1,857.65 | TP2 1,891.36 When a rebound follows a heavy-volume selloff, what helps you decide whether buyers have regained control? Just my read, not advice.#ByXIMPACT


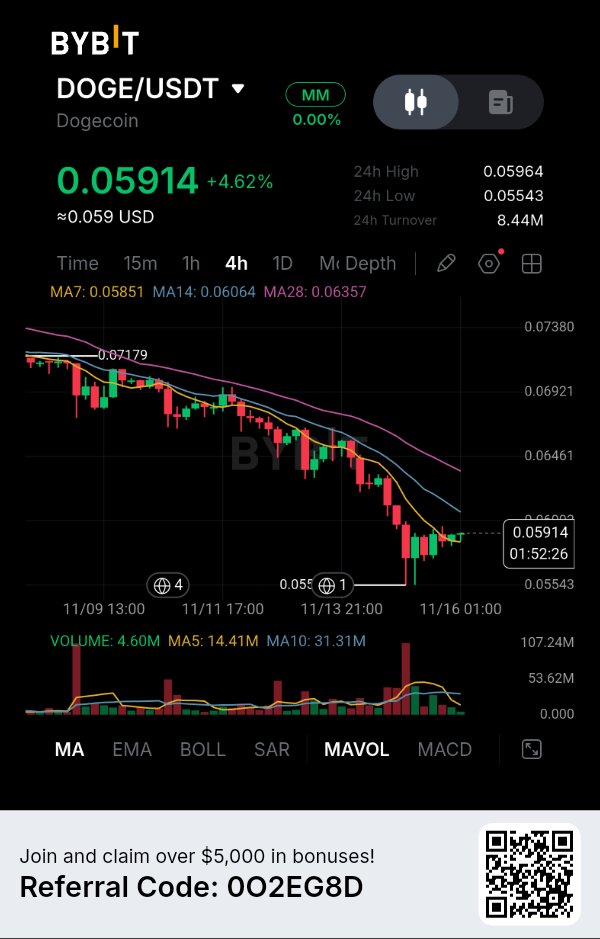
$DOGEUSDT — Dogecoin Is Recovering, But the Bigger Trend Has Not Changed Yet. Dogecoin has gained 4.62% in your 4H screenshot, but I am not convinced that buyers have regained control. The interesting part is that DOGE has bounced from its recent low while remaining below two important moving averages. At the same time, something is changing behind the project: developers are working to give DOGE more practical uses through an application ecosystem. This creates an interesting contrast between improving utility and a technically weak market structure. MARKET DATA — BYBIT 4H CHART According to your chart: * Price: $0.05914 * 24H change: +4.62% * 24H high: $0.05964 * 24H low: $0.05543 * 24H turnover: $8.44M * MA7: $0.05851 * MA14: $0.06064 * MA28: $0.06357 For today's separate market snapshot, November 16, CoinMarketCap reports DOGE around $0.05895, approximately $9.24 billion market capitalization and $1.15 billion in 24H volume. Circulating supply is approximately 156.76 billion DOGE, with no fixed maximum supply. WHAT THE CHART IS REVEALING DOGE has been moving inside a declining structure, falling from the visible $0.07179 region toward $0.05543. Buyers have recently defended the lower area and pushed price back above MA7 at $0.05851. However, MA14 at $0.06064 and MA28 at $0.06357 remain overhead resistance. Another detail deserves attention: displayed volume is 4.60M, compared with MA5 volume of 14.41M and MA10 volume of 31.31M. This suggests the latest recovery has not yet attracted participation comparable to previous trading activity. For me, $0.06064 is the first important level buyers need to reclaim. THE DEVELOPMENT MOST PEOPLE SHOULD WATCH Dogecoin's ecosystem is attempting to move beyond simple transfers and payments. On November 11, DogeOS announced that its first version was developed and audited, with mainnet described as very close, although no confirmed launch date was provided. The project aims to introduce an Ethereum-compatible application layer supporting DeFi, trading, lending and gaming. More than 100 builders are reportedly working on applications. What makes this particularly interesting is that DogeOS intends to use DOGE for transaction fees rather than introducing another native token. However, there is an important limitation: DogeOS is a separate application layer, not a direct upgrade to Dogecoin's base blockchain. Its current security model still relies on selected validators, while a proposed upgrade for native zero-knowledge proof verification has not been approved. THE TOKEN VALUE QUESTION I keep coming back to one issue. If DogeOS successfully attracts developers and applications, DOGE could gain additional utility through transaction fees and application activity. But development completion does not guarantee user adoption. The real evidence will come from actual application usage, transaction demand and the amount of DOGE circulating through these new services. Dogecoin has an established network and substantial liquidity, but its inflationary supply structure also means demand needs to remain relevant over time. MY TRADING PLAN — CONDITIONAL SHORT The broader 4H structure still favors sellers, despite the recent bounce. Trigger: Rejection around $0.0600–$0.0606, followed by a 4H close below $0.0585. Entry: $0.0582–$0.0585. Stop-loss: $0.0600. TP1: $0.0565. TP2: $0.05543. TP3: $0.0535. Using a representative entry of $0.05835: Potential downside to TP3: 8.32%. Defined risk: 2.83%. Estimated risk-to-reward: 2.94:1. This setup is conditional. I would not enter without the resistance rejection and subsequent breakdown. MY FINAL VIEW Dogecoin is entering an interesting development phase. DogeOS could give DOGE additional financial applications, but the market still needs evidence that developers can turn this infrastructure into consistent user activity. I don't think the most important question is whether Dogecoin can attract more attention. It's whether Dogecoin can evolve from an asset people primarily hold and transfer into one they have additional reasons to actively use. That transition could become more important for DOGE's long-term value than another short-lived price recovery. $DOGEUSDT #ByXIMPACT


🇺🇸 Anduril Industries начинает производство боевых дронов FURY, опередив Boeing, Northrop Grumman и Lockheed Martin. Компания фокусируется на создании автономных орудий с использованием ИИ.

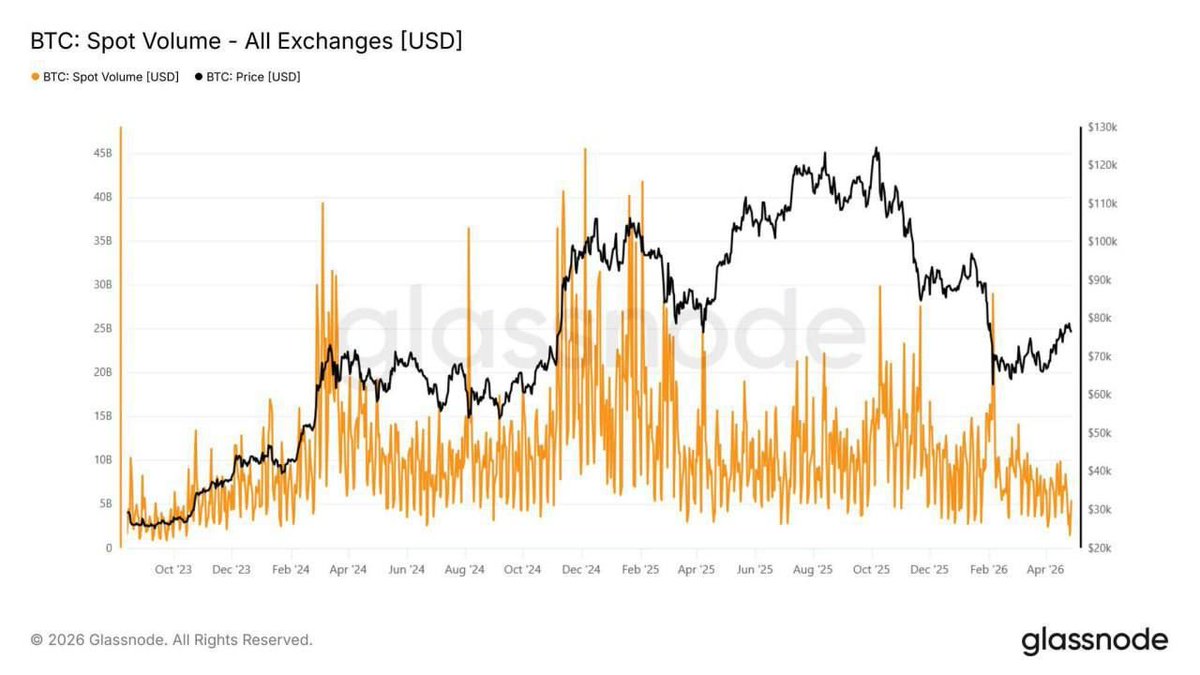
Спотовые объёмы торгов BTC сейчас на минимуме с октября 2023 года. Рынок затих и по опыту скажу, в такие моменты он обычно готовится к движению. Я часто вижу одну и ту же ошибку: люди начинают разбираться уже после роста, заходят на эмоциях и в итоге теряют депозиты. Если вы только присматриваетесь к крипте, то сейчас лучшее время спокойно понять базу, без спешки.
И в трейдинге не надо путать развитие с постоянным напряжением. Если ради сделки ты перестаёшь спать, возможно, ты взял риск, который не вывозишь. Купить десять монет не значит убрать общий риск. Если они падают по одной причине, разные названия тебя не спасут. Потерял половину капитала? Чтобы вернуться в ноль, теперь нужно заработать 100%. Поэтому сначала считай возможный убыток, а не будущую прибыль. До сделки реши, сколько готов потерять и при каких условиях выйдешь. Твоя задача не доказать рынку свою правоту, а сохранить возможность продолжать.


$BTC
precise and accurately $BTCUSDT
$btc
when your fake gurus were calling buy at 78k i told you all that blood bath is due its not done yet $BTCUSDT going to find a support at 62k if failed quick flush

gn CT A different kind of meme culture starts with a different kind of discovery. That's what makes @onlystreetsfun interesting to me. Most meme coin creation happens online, where people recycle popular images or follow whatever trend is already getting attention. OnlyStreets introduces a real-world starting point. You have to go outside, find something worth capturing, and use the app's camera to create your submission. I think this adds an interesting layer to the experience. It encourages people to become observers instead of simply copying what everyone else is posting. And the best part is that inspiration doesn't have to come from somewhere famous. It could be your local street, a funny situation, or an unexpected everyday moment. Not every discovery will become a successful coin, but originality is a good place to start. Let's see what the OnlyStreets community discovers next.

🤖 Группа пользователей получила несанкционированный доступ к модели Mythos от Anthropic, предназначенной для поиска уязвимостей в ПО. Они обошли защиту через аккаунт подрядчика, подбор URL и данные из утечек — и уже тестируют систему. Сообщают, что Mozilla с помощью этой модели нашла сотни уязвимостей в Firefox.
One detail about @sight_hood that I think deserves more attention is the difference between its current prediction markets and SightEVM. They are connected, but they serve different purposes. Right now, Sight's prediction markets operate on Robinhood Chain, with ETH used for positions, payouts and transaction fees. SightEVM is the next infrastructure layer being developed specifically for prediction markets. And this is where $SGT becomes important. Sight has identified $SGT as the native gas token of SightEVM. Developers will also be able to deploy Solidity contracts using familiar EVM tools. Why does this matter? Because a dedicated network creates a direct connection between the token and the infrastructure powering the ecosystem. I'm particularly interested in seeing how the upcoming testnet, DEX and cross-chain bridge develop. For me, the real thing to watch isn't just token attention. It's whether Sight can turn its infrastructure plans into actual usage. Keeping $SGT on my watchlist.
Во времена, когда мы жили с Ксенией, теоретически обсуждали работу в СК. По этой причине, хочу обратить ваше внимание на одно событие из мира большого бизнеса. Я думаю кто следит за новостной повесткой, уже догадался про что речь. В России задержали гендиректора «Эксмо» Евгения Копьева и нескольких топ-менеджеров холдинга. Для контекста: Эксмо АСТ контролирует около 70% всего книжного рынка страны. Причина: продажа ЛГБТ литературы после того как движение признали экстремистским в 2023 году. Год назад Копьев уезжал за границу, когда посадили менеджеров дочернего импринта «Попкорн Индивидуум». Потом вернулся, потому что решил что раз год прошёл и не пришли, значит пронесло. Не пронесло. Те кто давал показания раньше, теперь дают их на тех кто остался или вернулся. Это классическая механика следственного давления правоохранителей, которая масштабируется на следующий уровень иерархии. Отдельно интересна регуляторная архитектура которую государство выстроило вокруг книжного рынка: официального списка запрещённых книг не существует, издатель обязан самостоятельно угадывать что является экстремизмом, рассылать по магазинам черные списки и утилизировать тиражи, после чего государство приходит и констатирует что он недоугадал. Это compliance-ловушка с нулевым шансом на выход через непонимания правил игры.

My addiction 📉📈

One detail about @IPXExchange that deserves more attention is what happens when a project fails to reach graduation. A creator raising funds should not automatically receive the money just because people contributed. IPX uses milestone-based escrow for graduated projects. The production budget is released as approved milestones are completed, rather than being handed over all at once. The funding process also has conditions. A project needs to meet its required production budget and IPX market-opening target before graduation. This matters because supporting a creative project involves more than believing in the idea. Fans also need to understand how their contributions are handled and what happens if the project does not meet its targets. That is one of the practical mechanics I want people to understand about IPX.
Сторонники Дженсена Хуанга в Кремниевой долине, включая Илона Маска и главу Epic Games Тима Суини, добиваются его возвращения на пост CEO Nvidia и рассчитывают на поддержку Белого дома.
Why Gems Matter Beyond Collecting Them in Ryfinite Collecting Gems is one thing. Understanding what they are used for is another. Within Ryfinite Gems are more than a number displayed on your account. They play a role in connecting user participation to other activities across the ecosystem. One clear example is the $RFN Launchpool. Users can earn Gems through Quests and other ecosystem activities then commit them during available Claim Periods to participate in the Launchpool distribution process. This gives Gems a purpose beyond simply tracking activity. It also creates a connection between different parts of Ryfinite. Your participation through Quests can contribute towards accessing another feature of the ecosystem. What I find important is that users should understand this relationship instead of focusing only on how many Gems they have collected. The real question is not just how many Gems you can earn but what opportunities they allow you to participate in. That's what makes their utility worth understanding as Ryfinite develops. Explore:


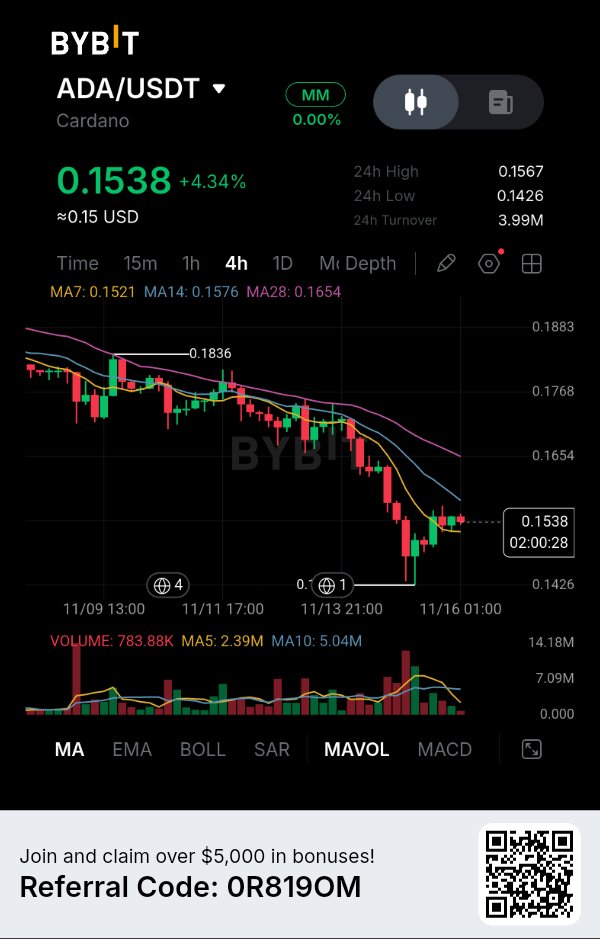
$ADAUSDT — CARDANO HAS REBOUNDED 4.34%, BUT THE REAL TEST IS WHETHER BUYERS CAN RECLAIM $0.1576. I'M NOT CONFUSING A RELIEF BOUNCE WITH A TREND REVERSAL. ADA is finally showing some buying interest after an extended decline. Price has recovered from the $0.1426 region and is now trading around $0.1538. The reaction is encouraging, but one important detail keeps me cautious: buyers have recovered the shortest moving average, yet the larger resistance structure remains overhead. THE TECHNICAL PICTURE The 4H moving averages are telling an interesting story: MA7: $0.1521 MA14: $0.1576 MA28: $0.1654 ADA has reclaimed MA7, showing short-term improvement. However, MA14 and MA28 remain above the current price. The broader structure still favors sellers until buyers demonstrate a stronger recovery. THE DETAIL I'M WATCHING The $0.1426 level is where the latest selling pressure attracted a buying response. But the recovery has one weakness I don't want to ignore. Current volume is approximately 783.88K, compared with MA5 at 2.39M and MA10 at 5.04M. Buying participation remains relatively weak compared with both volume averages. This makes the $0.1576 resistance particularly important. I want to see whether buyers can reclaim it with stronger participation or whether sellers defend it again. MY EXECUTION STRATEGY I'm watching ONE conditional SHORT opportunity. Entry zone: $0.1575–$0.1600 Confirmation: 4H bearish rejection from this region. Stop Loss: $0.1665 TP1: $0.1500 TP2: $0.1426 TP3: $0.1380 (projected extension) I'm not entering immediately after the recovery. I want price to approach resistance and show clear selling pressure before considering this setup. WHAT COULD INVALIDATE MY IDEA? A convincing 4H breakout above $0.1654 would weaken my bearish continuation thesis. If ADA establishes sustained acceptance above $0.1665, I would invalidate this short setup and reassess the market. MY PERSPECTIVE What interests me about ADA is the battle between improving short-term momentum and the still-unrecovered larger trend. Buyers have defended $0.1426, but now they need to prove they can overcome the resistance above them. I'm watching $0.1576 as the next important decision point. I would rather miss an entry than chase a recovery without confirmation. Would you trust this ADA bounce and look for a breakout above $0.1576, or wait for sellers to confirm another rejection? $ADAUSDT #ByXIMPACT


An AI agent shouldn't be active all the time. Sometimes, it should wait. Sometimes, it should stop. One interesting part of @meetmotes is its documented strategy state system. An agent can move through different states: → Draft – Strategy is not approved yet. → Authorised – Owner has approved the policy. → Active – The agent can perform permitted actions. → Paused – New execution is suspended. → Restricted – A risk or external issue blocks new risky actions. → Expired – Permission has ended and needs renewal. → Settling – Only specific actions needed to close positions and obligations are allowed. I like this approach because autonomy doesn't mean an agent should keep trading without limits. Knowing when an agent can act is just as important as knowing what it can do.


Marble is expanding its team across the US, Europe, and APAC. 🌍 They're building across @marblegroupxyz Markets, Marble Compute, and the core platform powering the ecosystem. If you're passionate about technology, infrastructure, markets, and innovation, this is an opportunity worth exploring. Explore open roles and apply:


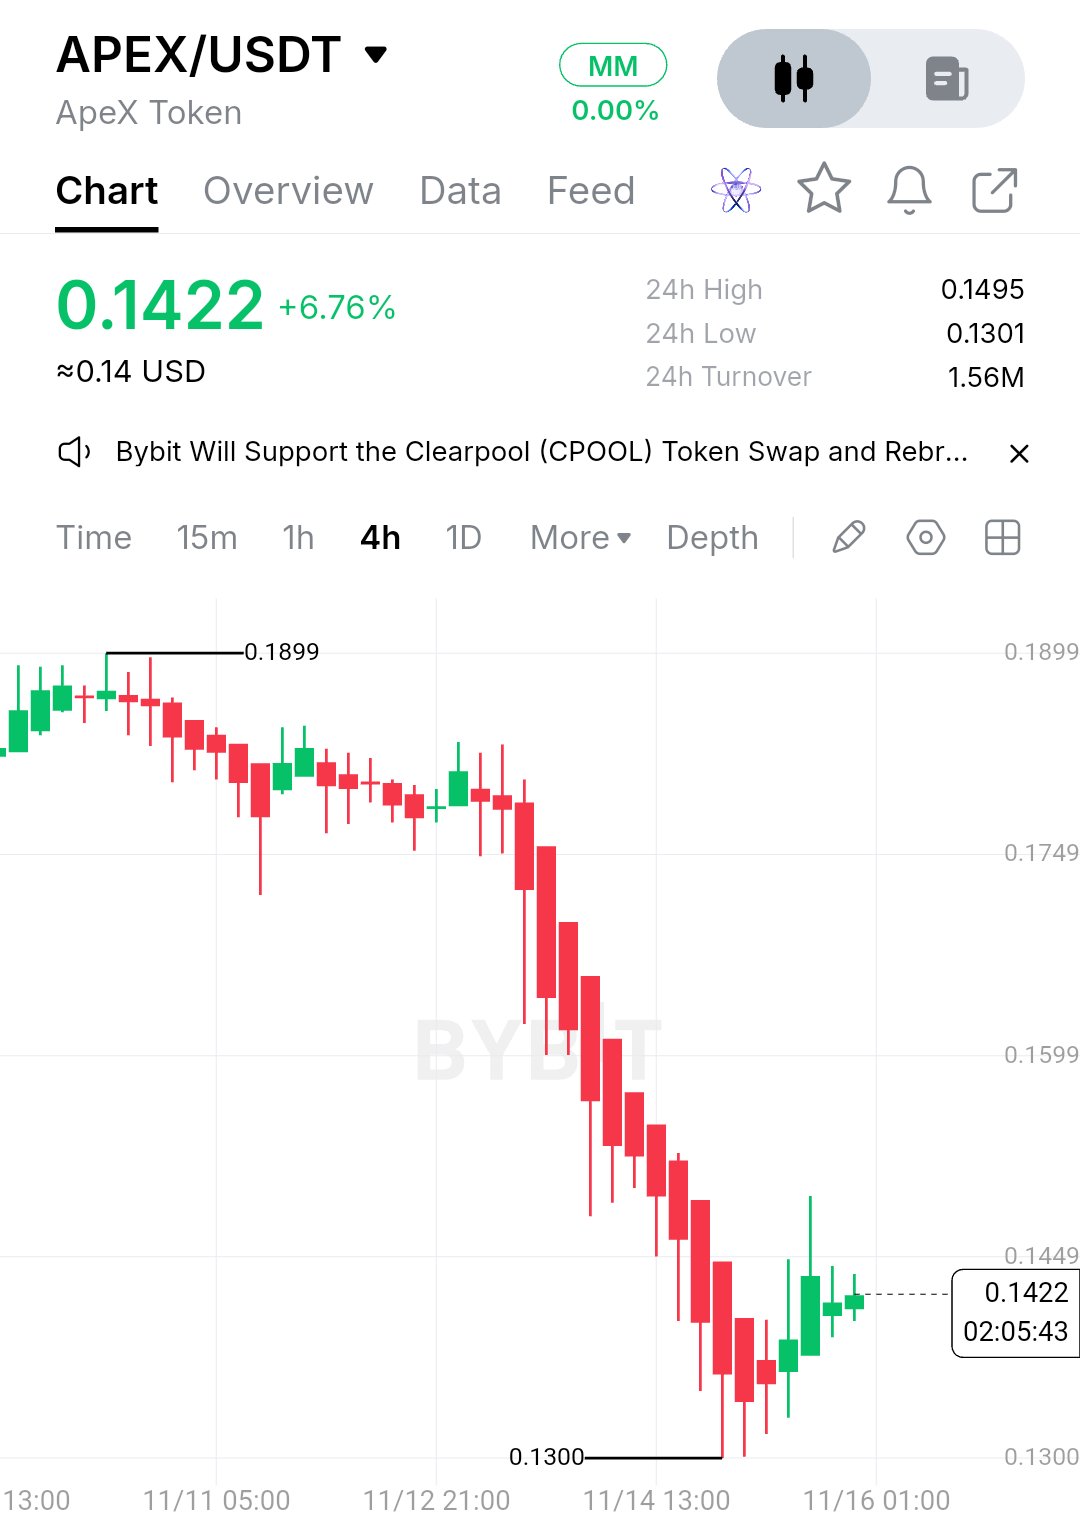
$APEXUSDT is an Ethereum-based token, not a standalone blockchain, and that distinction matters when looking at its economics. There is no native APEX network transaction count, median transaction size, miner fee revenue or hashrate figure to compare against block rewards. So the payments usage is not the right way to measure this asset. APEX is tied to ApeX Protocol, a decentralized derivatives trading ecosystem. APEX has staking, governance and protocol incentive utility, and that is the point. Token holders can earn APEX rewards, but current validator revenue, staking yield and fee-to-reward ratios are not independently established by the available data. There is no APEX mining halving or native block reward reduction to price in. I don't think that's a design flaw. When someone quotes the transaction count, the number that matters for this token is different: actual protocol activity, fee generation and whether that activity creates sustainable demand for APEX. The latest available market data shows APEX around $0.1422, up roughly 6.8% in 24 hours but still down 22.6% over seven days. The 4H chart shows a sharp selloff from the $0.18 area toward $0.1300, followed by a recovery. Underneath is ApeX Omni's expansion into perpetual markets, including crypto, US stocks and prediction markets. ApeX was also reported to have recorded $11.661 billion in 30-day trading volume in the October 22 DEX market comparison. That explains the attention, not a guaranteed token-price catalyst. No directional call from the middle of a box after a move this size. Levels instead: Above $0.1495: a daily close over it turns the recent ceiling into a support test. The next major resistance area is around $0.1599–$0.1749. Below $0.1300: a daily close under it says the recovery is failing. The next downside area needs fresh price discovery. $0.1300–$0.1495: the immediate range, roughly 15% wide. Window: the next several daily closes. APEX needs sustained protocol activity and stronger buying pressure to support a recovery. The breakout case is invalid on acceptance below $0.1300. #IMPACTbyTrade
$ETHUSDT tapped the $1,700-$1,720 support zone before bounceback. This is a major level for Ethereum, and losing this could push it down to 2018 highs.

Your Stop Loss Should Have a Reason One thing I pay serious attention to before opening a position is where my stop loss belongs. I don't like placing it randomly just to have one. For a long setup, I usually look below the swing low or the structure that supports my trade idea. For a short setup, I consider the area above the relevant swing high. I also check whether the stop distance makes sense for my position size. A stop loss placed too tightly can take me out because of normal market fluctuations, while risking too much can damage my account. The goal isn't to avoid every loss. It's to make sure one wrong trade doesn't cost more than it should. #MyByXTake

💸💵💎🪙💲💲💲
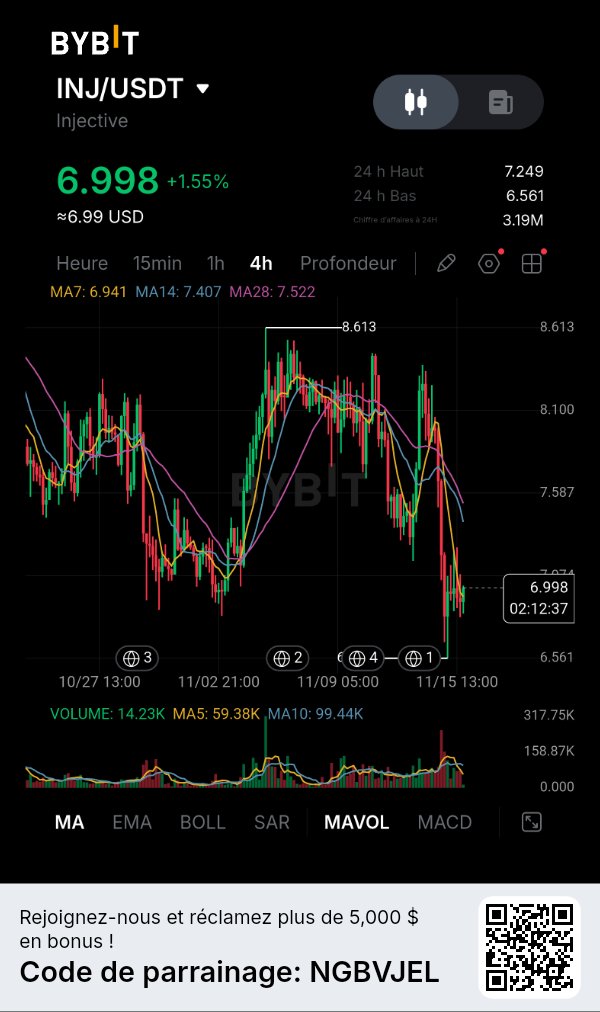

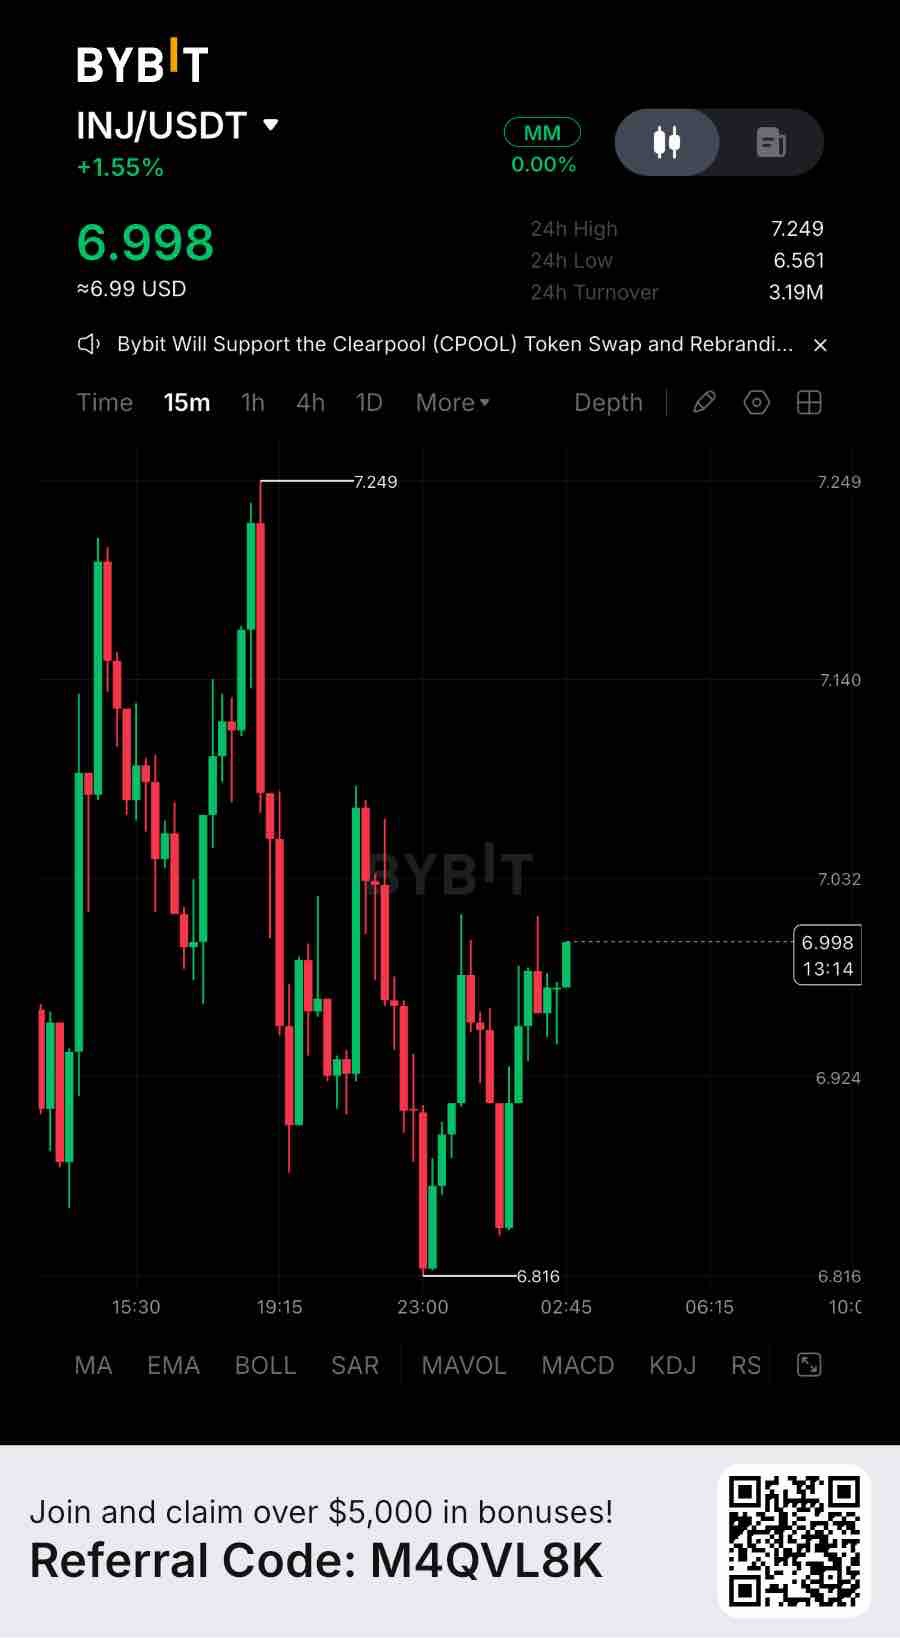
Injective now reports more than $11B in assets issued through its tokenization infrastructure, while its on-chain orderbook processed $12.86B in trading volume between November 2025 and November 2026. RWA perpetuals alone generated nearly $1.8B in volume. That’s real usage, not narrative. But valuation tells a different story. INJ carries a reported circulating market cap of approximately $690M against just $16.36M in DeFi TVL, putting its market-cap-to-TVL multiple around 42.2x. For comparison, Maple trades around 0.052x and Pendle around 0.255x on the same metric. INJ therefore screens roughly 814x richer than Maple and 165x richer than Pendle. These are not perfectly comparable businesses, since Injective is a Layer 1 rather than a standalone yield protocol, but the difference highlights how much future ecosystem growth is already reflected in its valuation. The underlying expansion is meaningful. Tokenized stocks established new monthly volume records from July through October, while RWA perpetuals expanded into equities, foreign exchange, commodities and indices. Pineapple Financial has also migrated more than $1B in residential mortgage records onto Injective, with 2,079 records visible on its public dashboard. Importantly, these mortgage records represent tokenized data infrastructure, not $1B of liquid collateral or traditional mortgage securities. Injective has additionally secured SEC transfer-agent registration and expanded INJ access to Solana. There is also a supply consideration. SEC filings show total INJ supply reached approximately 122.9M by September 15, 2026, against the commonly reported 100M initial supply. Annualized issuance stood at 4.4%. The Supply Squeeze proposal strengthens the deflationary mechanism, but actual supply reduction still depends on ecosystem revenue and buyback activity exceeding issuance. From a market perspective, INJ is trading around $6.89. Immediate support sits near $6.44, with resistance around $7.15. I would avoid chasing the current movement without confirmation. A 4H close above $7.15 followed by a successful retest could open $7.85 and eventually $8.76. However, losing $6.44 on a confirmed 4H breakdown would weaken the structure and expose $6.01, followed by $5.18. The short-term trend remains under pressure despite stronger higher-timeframe momentum. None of this says the token is wrong. It says the on-chain growth story and the price story are running on separate clocks right now. Worth asking which one catches up to the other first — and whether more chains, institutional products and tokenized assets alone are enough to close a valuation gap that size. #ByXIMPACT $INJUSDT

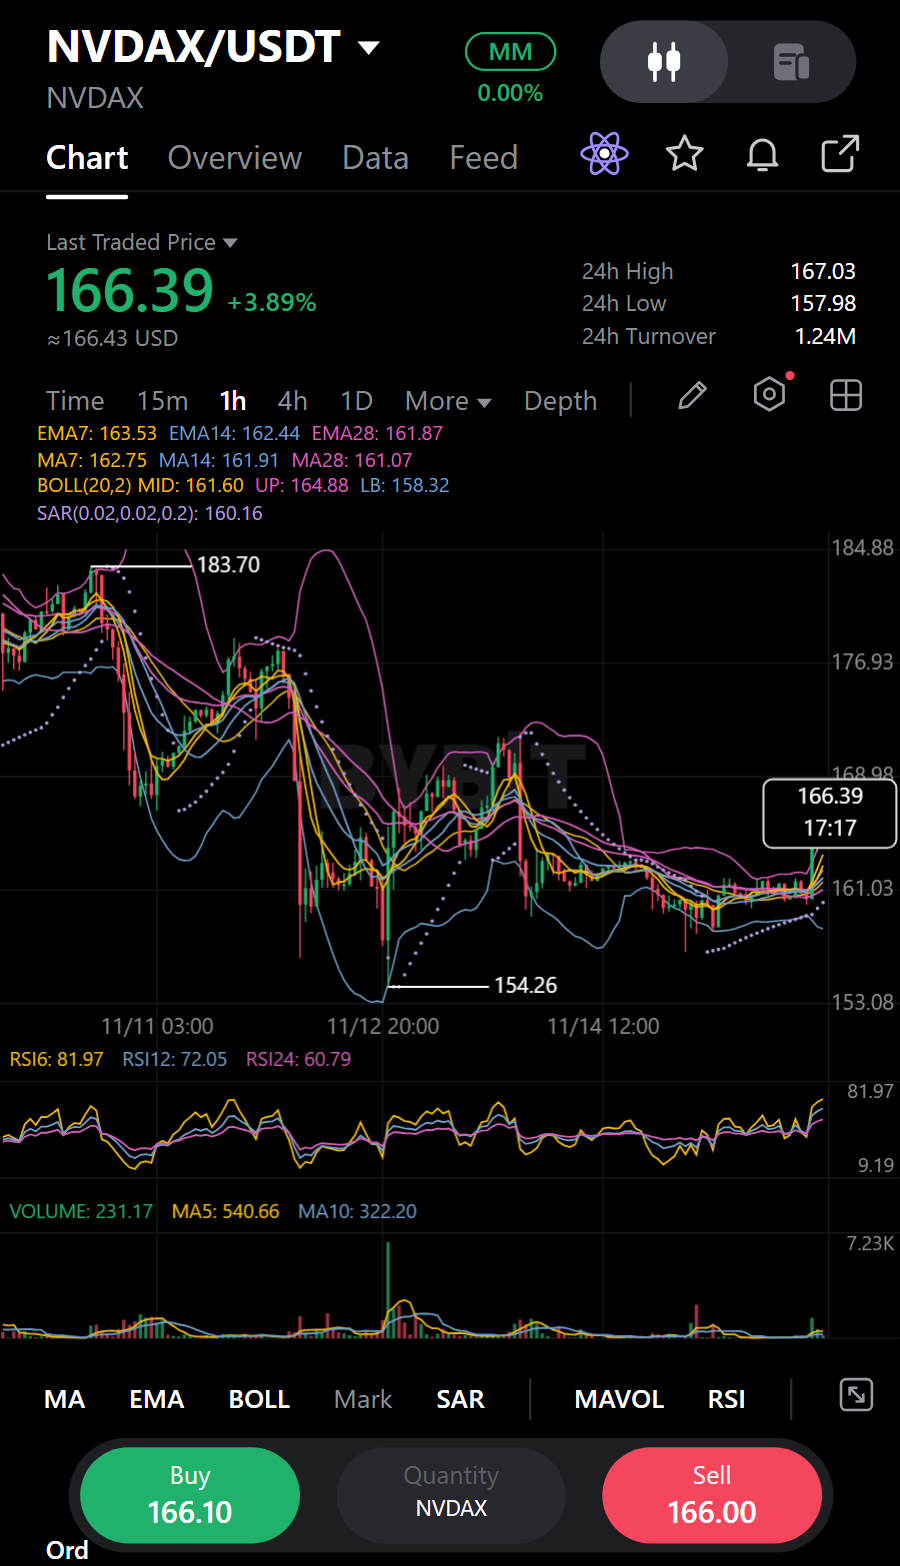
NVDAXUSDT: Buyers Have a Reclaim to Defend
A sharp green hourly burst has put $NVDAXUSDT back above its moving-average cluster. The 01:00 red candle closed at 160.39; then the 02:00 candle surged from 160.39 to 166.52 before closing at 164.04. The 03:00 green candle followed through with a 165.4 close. That reads like buyers stepping in with force and keeping pressure on rather than giving the whole move back. Price is now above MA7, MA14, and MA28, supporting the bullish case, though the averages remain close together rather than widely separated. The 24h move is positive, and volume has increased from the preceding day, adding participation to the push. I like that backdrop, but the earlier small candles had light activity, so I want the breakout to prove it can hold. My long setup is to see price hold or retest the Entry Zone at 165.8575 - 166.7625; I hold NVDAX spot, while the native holding card carries the position details. A move below the Stop Loss at 163.595 would invalidate this attempt. TP1 is 168.5725 and TP2 is 170.835, with about 0.8 to 1 and 1.7 to 1 risk-to-reward from the middle of the zone, respectively. I favor the bulls while price stays above the invalidation level and buyers defend the retest; losing that level would change my view, not just make the setup look less tidy. The burst also raises volatility risk, so I’d be careful with execution in a thin book and wouldn’t assume the first push keeps running. Trade Plan (LONG / Bullish): • Support: 157.98 / 154.26 | Resistance: 167.03 / 178.7 • Entry Zone: 165.8575 - 166.7625 • Stop Loss (SL): 163.595 • Targets: TP1 168.5725 | TP2 170.835 Would you trust this high-volume breakout, or wait for a cleaner hold of the entry zone? Just my read, not advice.#IMPACTbyTrade


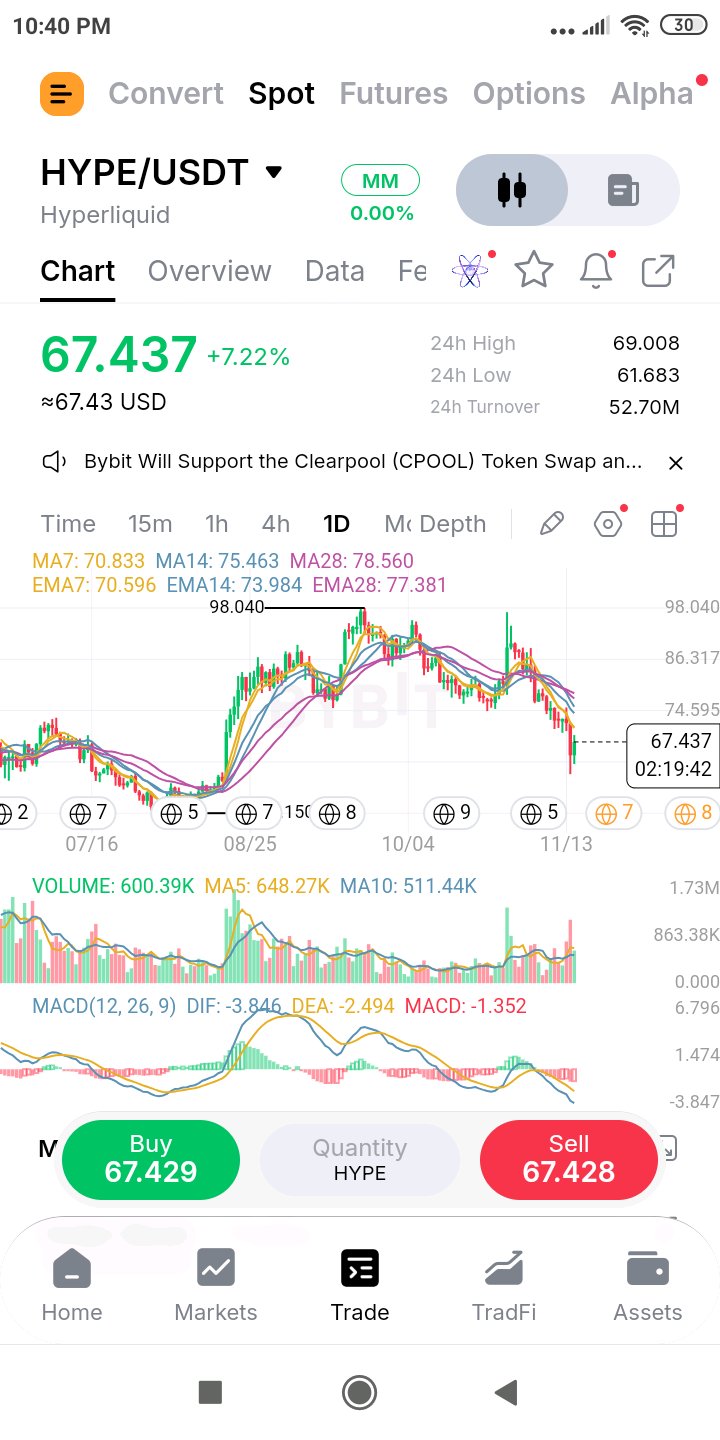
$HYPEUSDT bounced 9% off a low that held just above the 0.786 and stalled 0.05 under the broken 0.618, so now the retest decides. Context HYPE wicked to 61.683, only 0.5 above the 0.786 retracement at 61.18, then rallied to a 69.008 high, 0.05 short of the broken 0.618 at 69.06, and trades at 67.437 (+7.22% on the rolling 24h). That is about 31% under the 98.04 peak, with roughly 65% of the advance from 51.15 retraced. All six averages are still overhead: EMA7 70.596, MA7 70.833, EMA14 73.984, MA14 75.463, EMA28 77.381 and MA28 78.560, with the 7s 4.7-5% above price, the 14s 10-12% and the 28s 15-16%. MACD (DIF -3.846, DEA -2.494, histogram -1.352) is at its lowest reading on this chart, so momentum hasn't turned. The daily candle is green so far, with a long lower wick. Turnover and volume 24h turnover is 52.70M USDT (roughly 800K HYPE) on a 24h range of 61.683 to 69.008, about 12%. That rolling total is about 1.6x the 10-day average, mostly from the heavy selling earlier in the window. Today's own candle is 600.39K with about 2.3 hours left, on pace for roughly 665K, in line with the 5-day (648.27K) and above the 10-day (511.44K). So the bounce is on ordinary volume, not a surge. Holding a key fib and bouncing is good, but a bounce that can't take the broken 0.618 on a strong day is not yet a reversal. Support and resistance Support: 61.68 (24h low), 61.18 (0.786), 60.00 (round number), then the 51.15 base. Resistance: 69.01 (24h high), 69.06 (the broken 0.618), 70.00 (round number), 70.60-70.83 (EMA7 and MA7), 73.98 (EMA14), 74.595 (0.5), 75.46 (MA14), 77.38-78.56 (the 28s), 80.13 (0.382), 86.97 (0.236), then 97-98.04. Level to watch 61.18 below and 69.06-70.00 above. A daily close above 70.9 clears the 0.618, the 70 round number and both 7s in one move. A daily close under 61.18 gives up the 0.786 zone. Consideration Retesting a broken level from below is where downtrends often fail, and this one stalled by a few cents. The 7s sit right above it at 70.6-70.8, so there is a stacked ceiling within about 2.5 points. I'd treat the 9% bounce as a reaction at support, not a trend change, until a daily close clears 70.9. Trade plan Low retest: buy 61.7-63.0 (the sweep zone and the 0.786), stop under 59.9, about 2.4 of risk from 62.3. Targets are 69.06 and 74.6, roughly 2.8R and 5.1R. Reclaim: wait for a daily close above 70.9, buy the retest of 70.0-70.9, stop under 68.3, about 2.2 of risk from 70.5. Targets are 74.6 and 80.13, roughly 1.9R and 4.4R. I'm not buying 67.4 under the 0.618 and the 70 round number. A stop under 61.2 would risk about 6.2 to make about 1.6 to the 0.618 and 3.2 to the 7s, about half an R at best. Invalid if A daily close under 61.18 gives up the 0.786 zone, with 51.15 next, about 16% lower, and I'd stand aside rather than average down. The low-retest idea is dead under 59.9, and the reclaim idea is dead on a daily close back under 68.3. The bear case stays in charge until a daily close above 75.5, the MA14. Risk note HYPE has been ranging around 10-12% a day lately, so cut size and use limit orders. Today's candle still has about 2 hours left, so volume and price will shift by the close. Fib levels are zones, not guarantees. Levels are read off my chart. Idea only, not financial advice. Reversal or a retest that fails? A daily close above 70.9 or under 61.18 will say. #ByXIMPACT
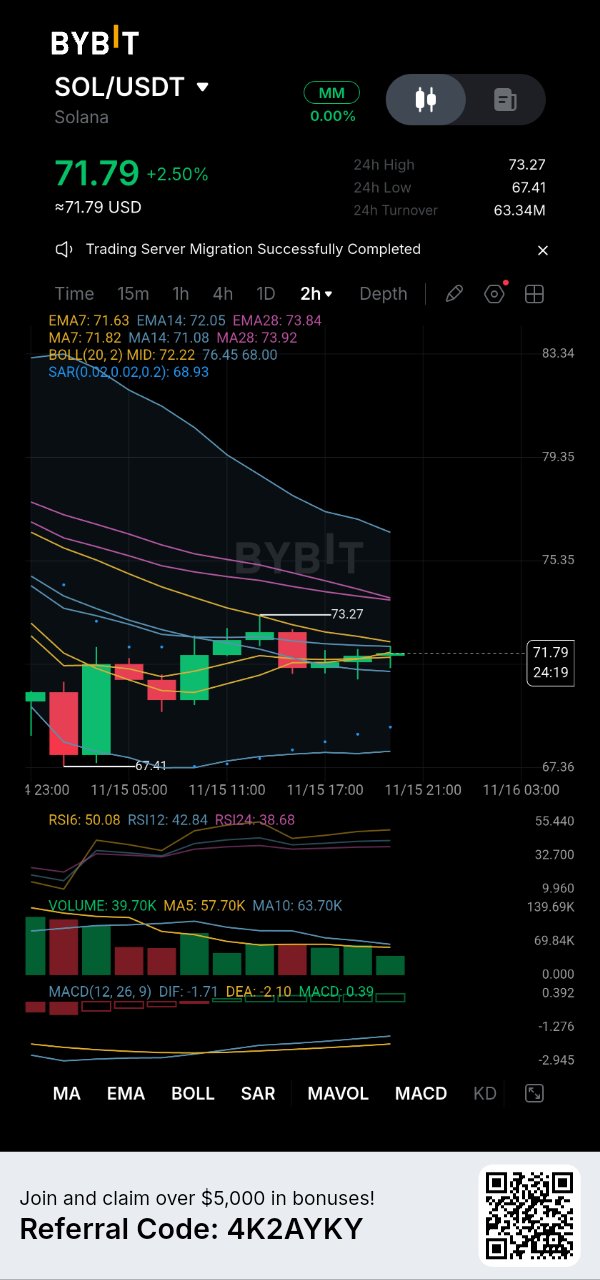
SOL is trading around $71.79, up 2.50% on the 2H chart, after recovering from the $67.41 low. What interests me is not the rebound itself, but whether buyers can turn this recovery into a more sustainable structure. There are some early improvements. RSI6 has returned to 50.08, and the MACD histogram has moved into positive territory at 0.39. Price is also holding near the short-term moving averages. However, the recovery still faces obstacles. The Bollinger midline around $72.22 and EMA14 near $72.05 form the first resistance zone. Above that, $73.27 is the recent local high, while the EMA28 around $73.84 remains another hurdle. Volume is the main caution: approximately 39.7K, below both the MA5 at 57.7K and MA10 at 63.7K. The price is recovering, but participation has not yet strengthened enough to confirm the move. My levels are straightforward: - Above $72.22: recovery gains credibility. - Above $73.27: buyers have a stronger case for continuation. - Below $71: momentum could weaken again. - Below $67.41: the current recovery structure would be invalidated. I would rather see SOL reclaim resistance with stronger volume than assume that one green move has changed the trend. The next few 2H candles should tell us more. Is SOL building a genuine recovery, or does it still need a deeper test of support? Not financial advice. $SOLUSDT $AAVEUSDT #ByXIMPACT

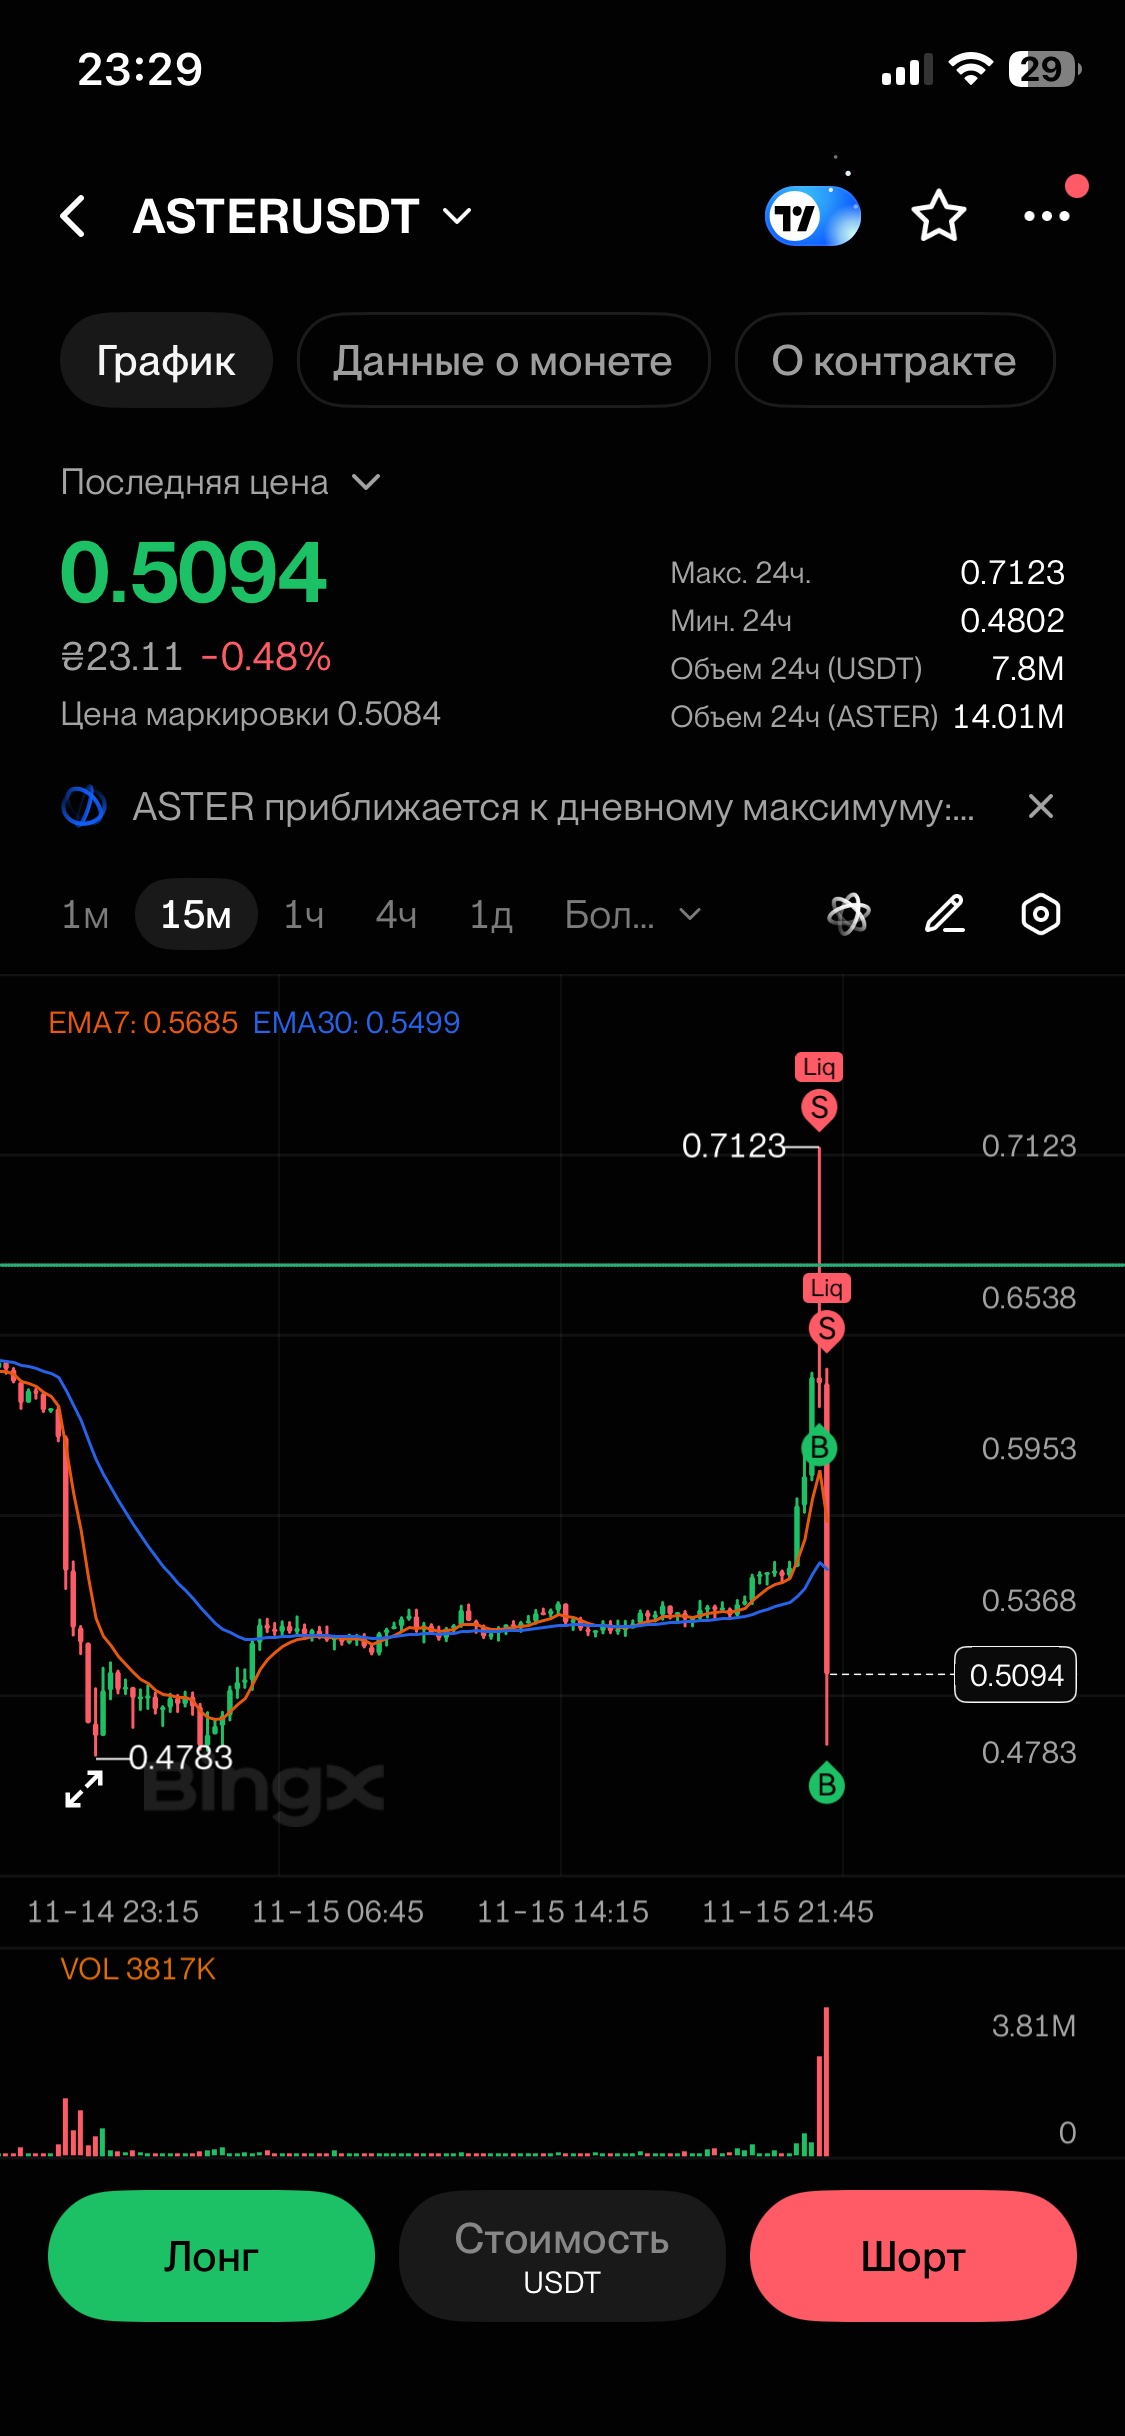
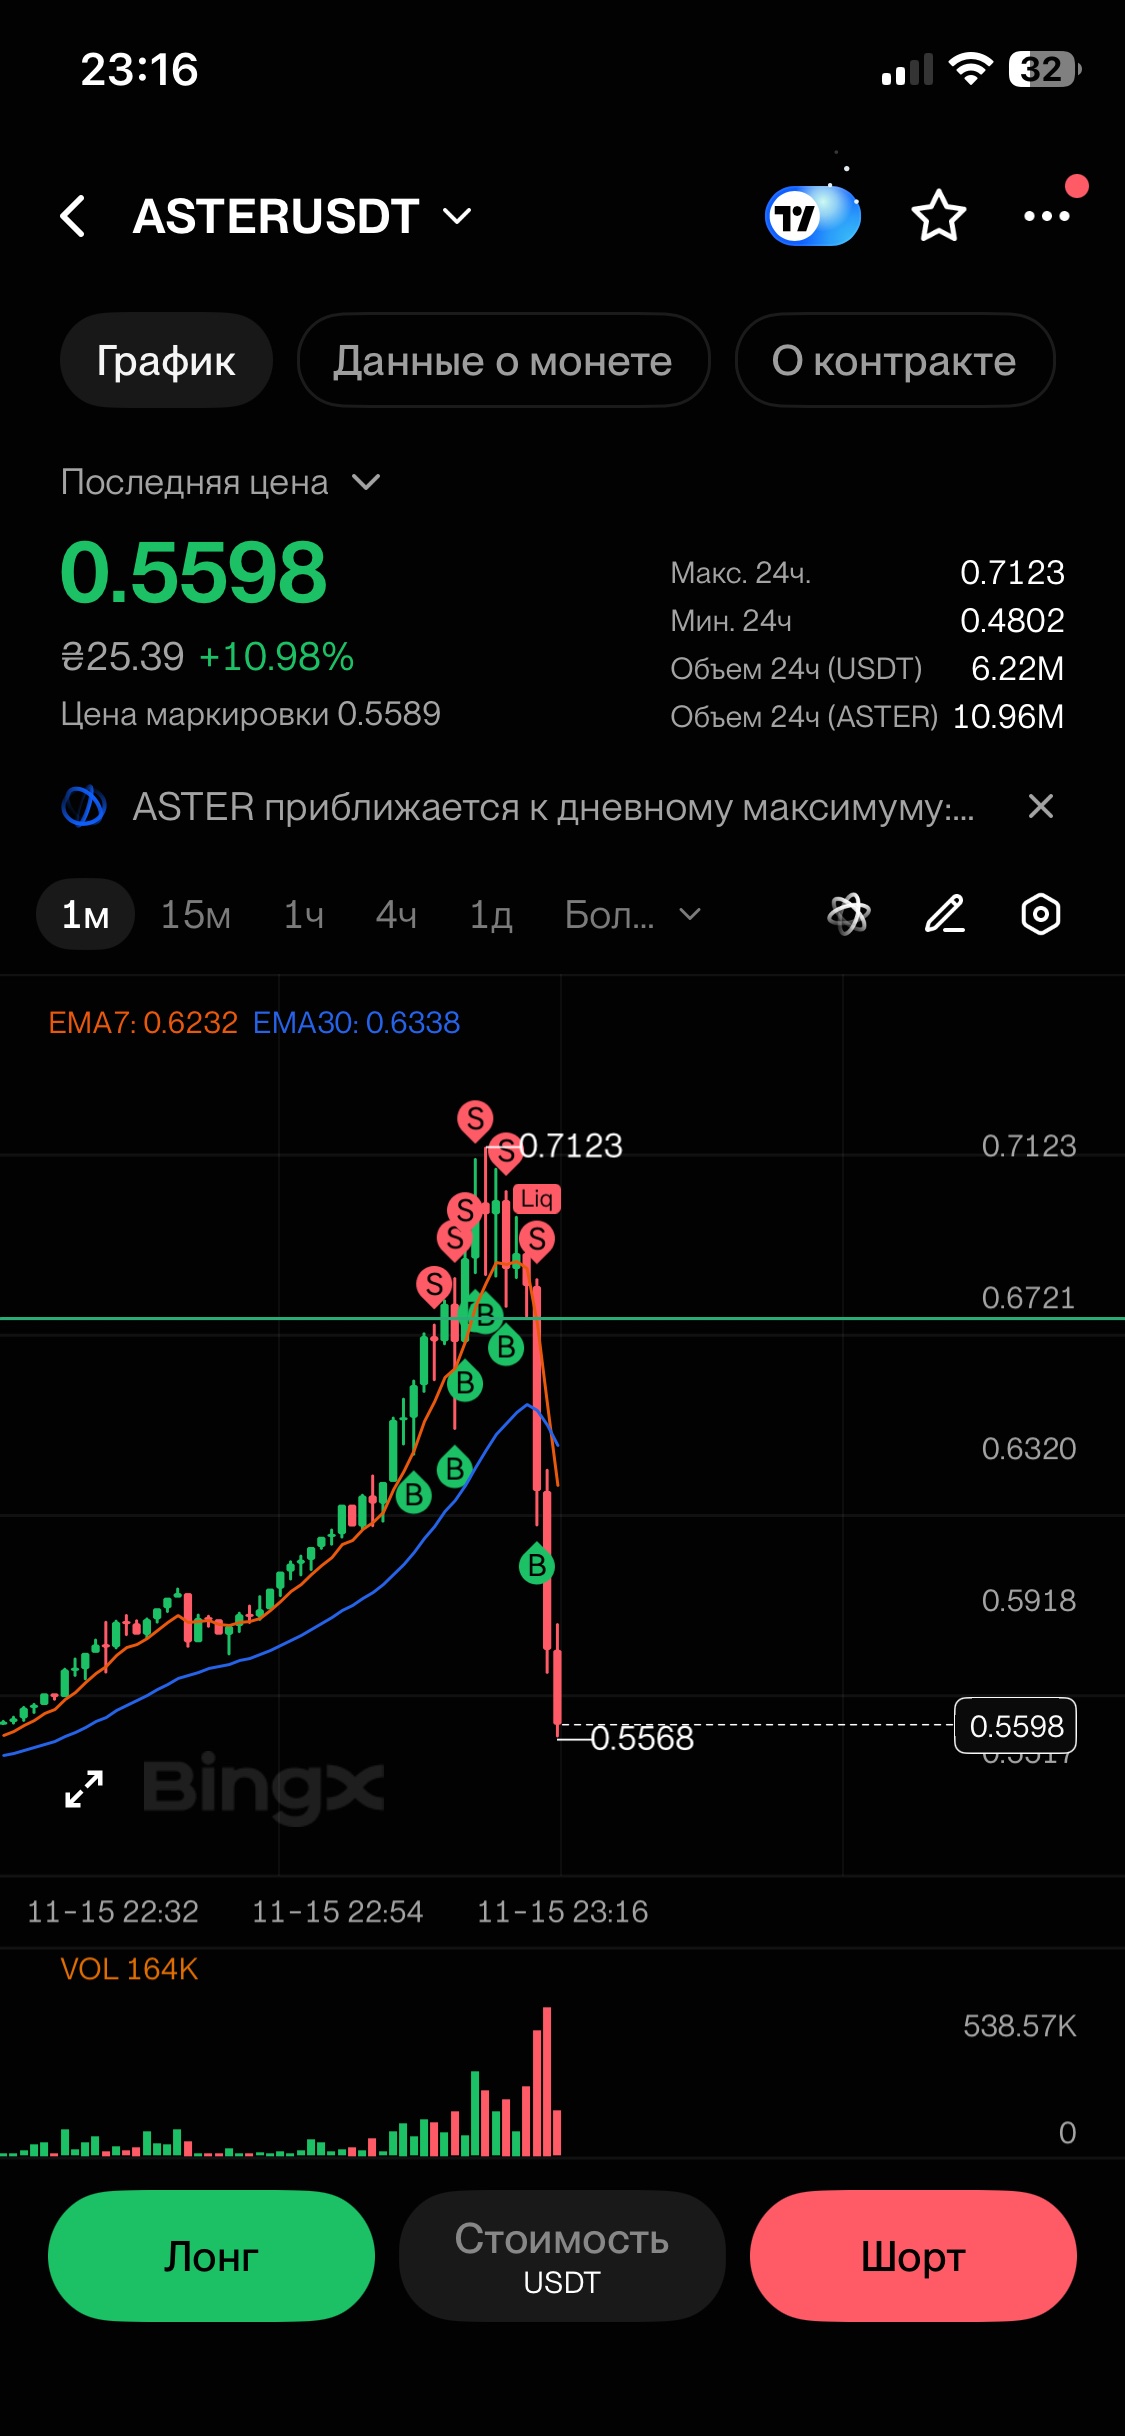
яка красива манипуляція под воздействиям азарта навіть не замітив як це сталося хоть на хололну голову там було снятия ліквідності раніх шортистів та резким пробойом лонгістов проста манипуляция на мало ліквідних монетах $ASTERUSDT
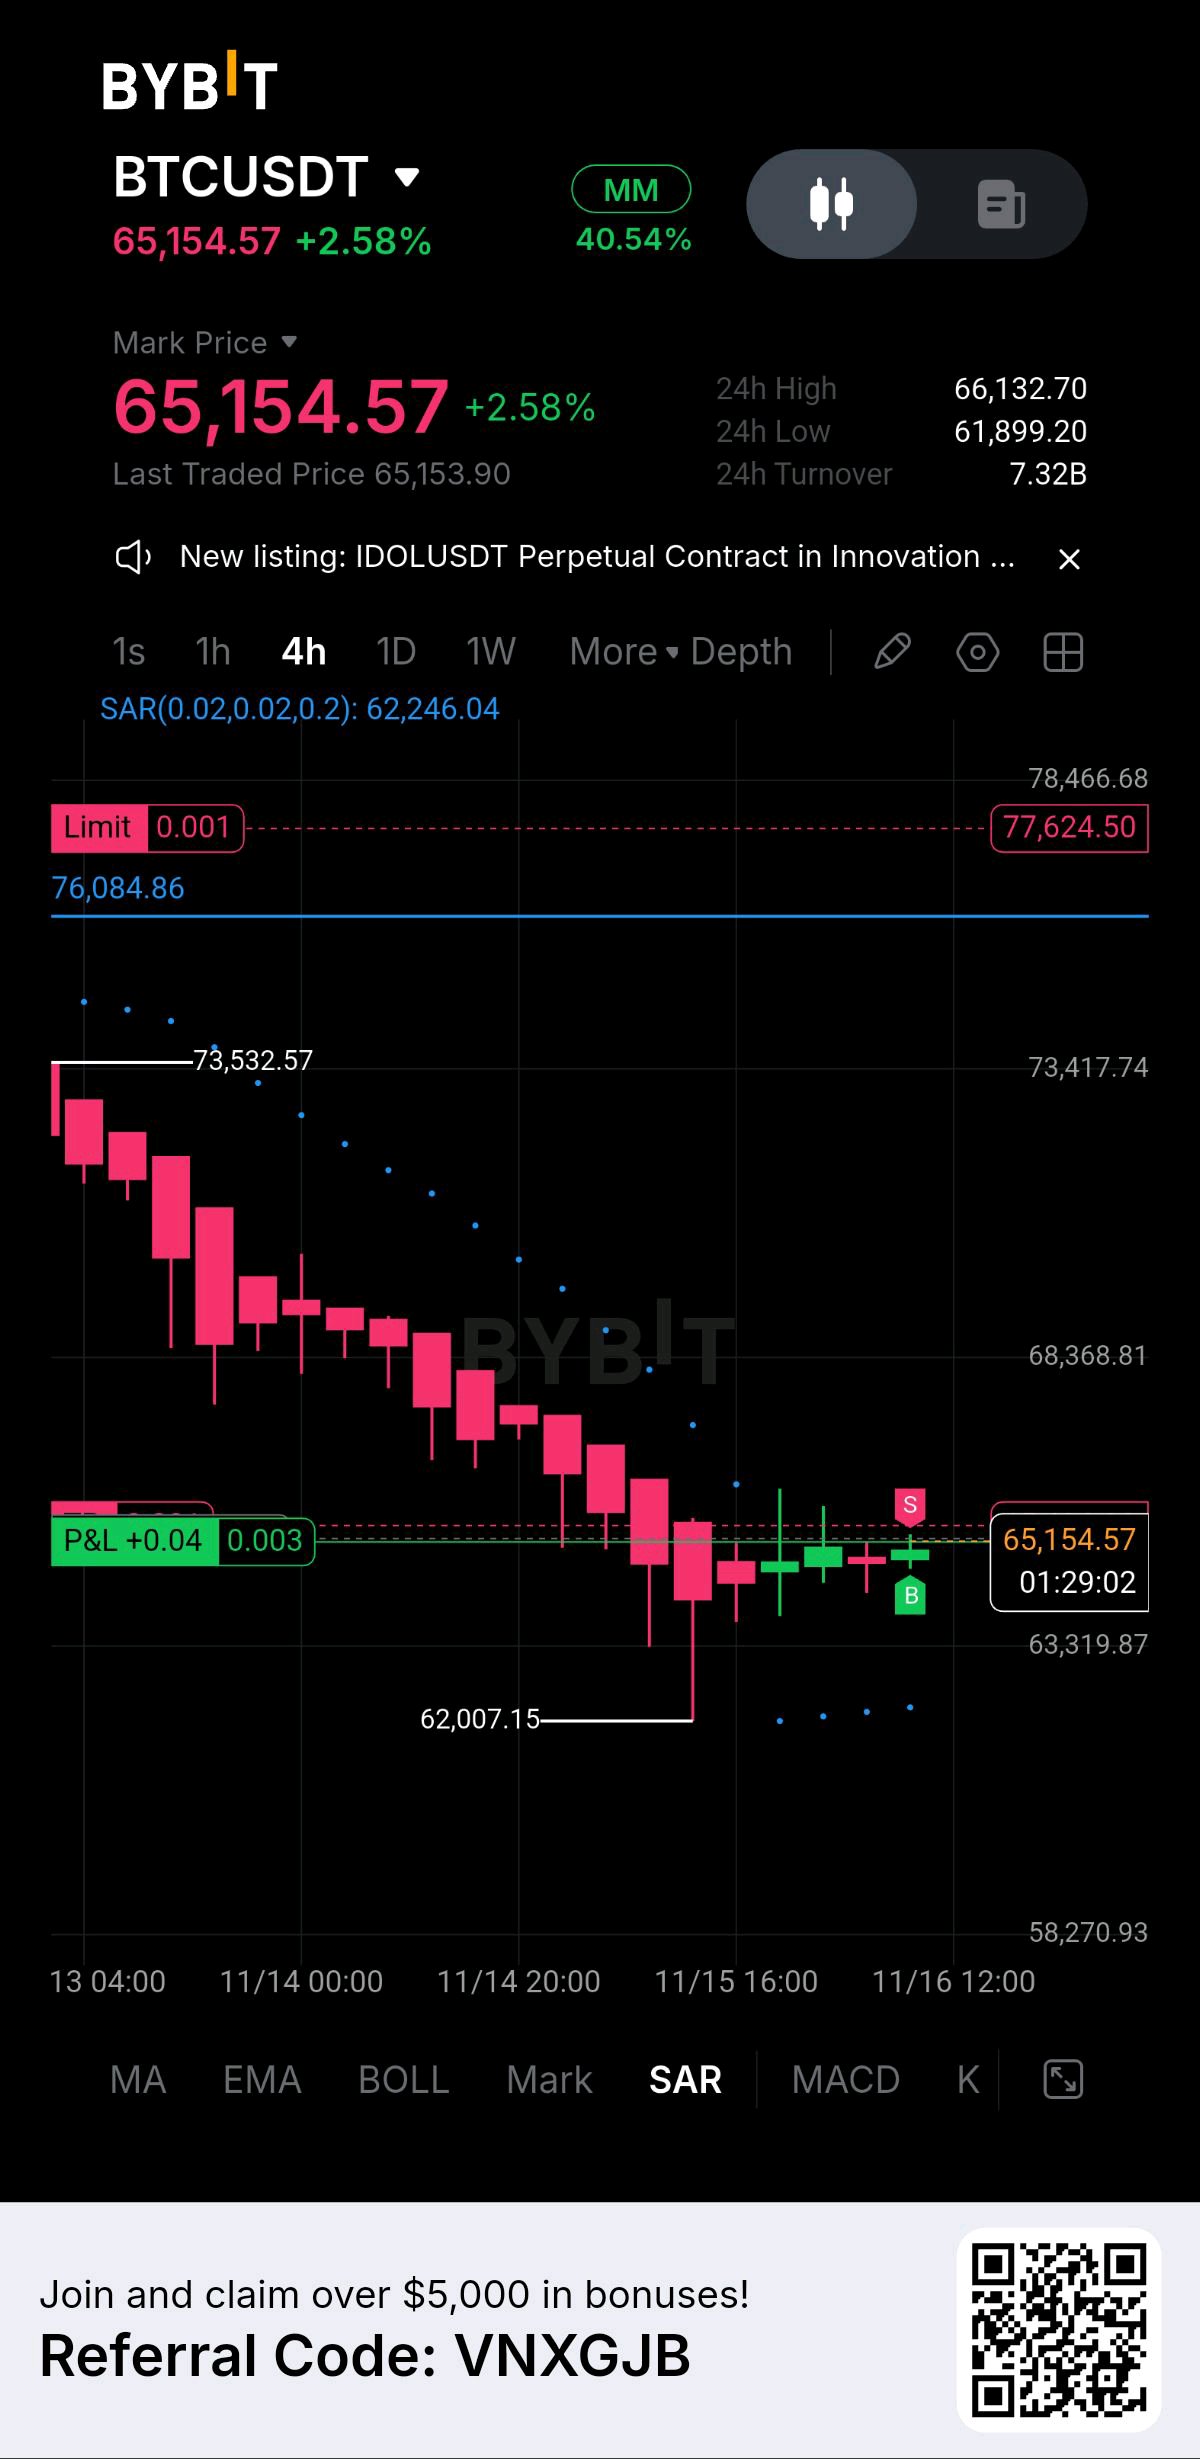
Bitcoin is still at its most important demand zone. If Bitcoin loses $60K from here, things could get even more ugly. $BTCUSDT

#QNT #Quant #CryptoAnalysis #MDFUNDS
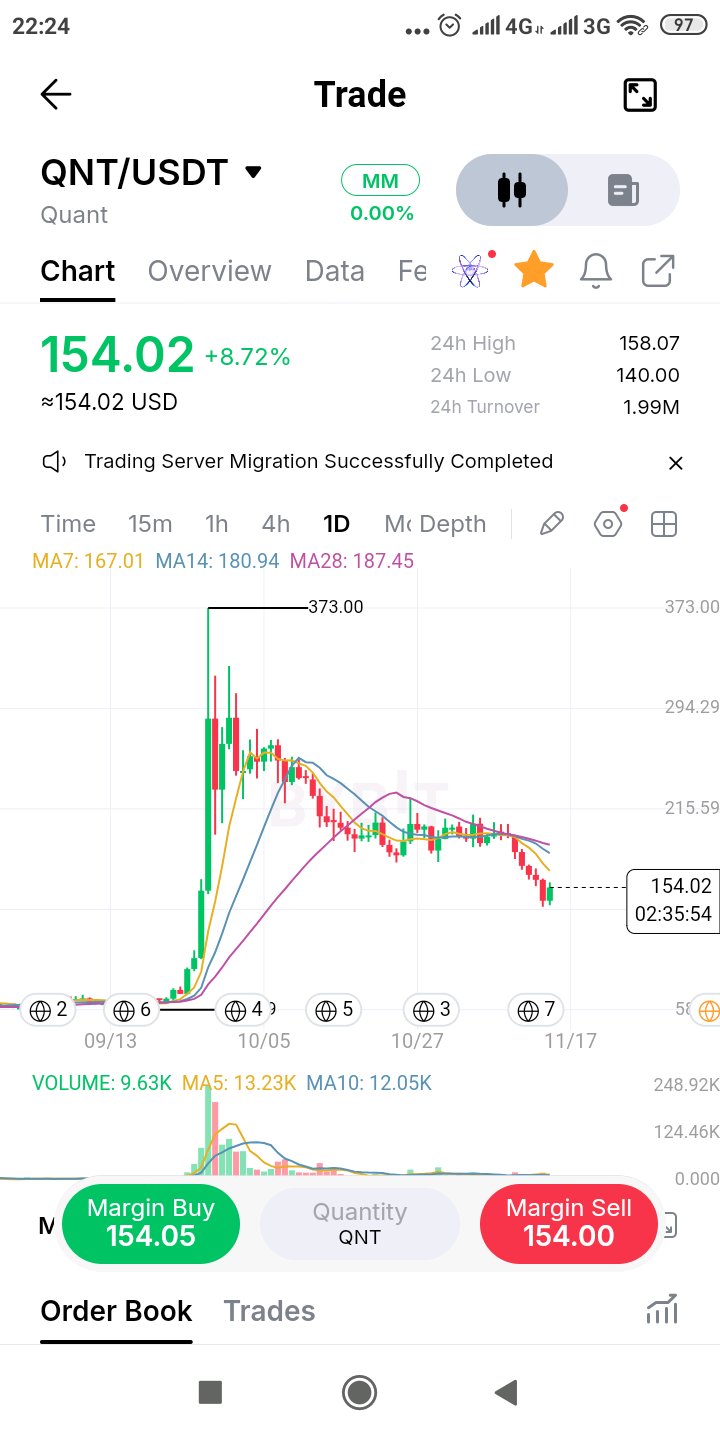
$QNTUSDT — A relief rally is not yet a trend reversal QNT has bounced sharply from the $140 region, gaining 8.72% and reaching an intraday high of $158.07. That reaction is significant, but I wouldn't rush to interpret it as a bullish structural shift. Look at the bigger picture. Since its explosive expansion towards $373, QNT has progressively surrendered its gains. The market moved through an extended distribution and declining phase, attempted to stabilise around the $200 region, and has now experienced another leg lower. Today's rebound shows that buyers are responding to lower prices. What remains uncertain is whether that demand is strong enough to reverse the prevailing structure. The moving averages provide an important perspective: MA7: $167.01 MA14: $180.94 MA28: $187.45 Price remains beneath all three. This means the current recovery is still happening below the market's major daily trend references. I'm particularly interested in three price areas: $140: The immediate downside reference established by the latest daily low. $158–$167: The first recovery challenge. Holding above this region and reclaiming the MA7 would improve the short-term picture. $180–$187: A more substantial recovery zone where the next two moving averages converge. Volume also deserves attention. The displayed 9.63K remains below both the MA5 and MA10 volume averages. Until participation improves, the rebound needs to prove itself. There is a lesson here from Dow Theory: a meaningful reversal requires more than a strong green candle. The market must begin establishing a different sequence of highs and lows. My question: Are buyers beginning to defend QNT at $140, or are we simply witnessing a temporary relief rally inside a larger bearish structure? $QNTUSDT #ByXIMPACT