Block Best
4679點贊0分享76粉絲71關注
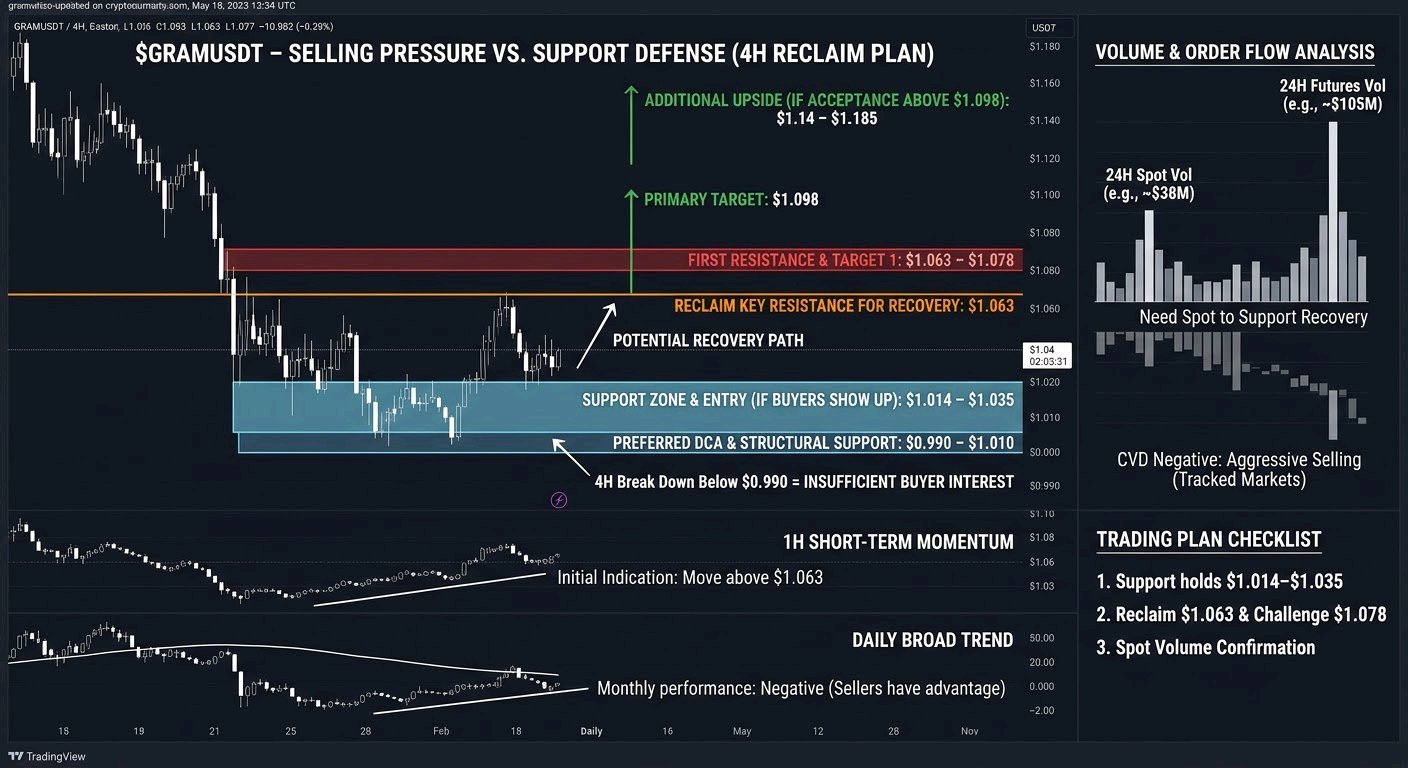
$GRAMUSDT – SELLING PRESSURE IS STILL PRESENT, BUT I'M WATCHING THE $1.06 RECLAIM FOR A POSSIBLE RECOVERY $GRAM is approaching an important decision zone, and I'm paying close attention to how price reacts around the $1.01–$1.04 support area. The market is showing mixed signals. While the 4H structure has some recovery potential, the 1H and daily trends remain under pressure. I don't want to assume a bullish reversal before buyers prove they can take control. Market Overview GRAM is trading around $1.04–$1.05, with recent price action showing continued weakness after a significant decline. On the broader timeframe, the monthly performance remains negative, suggesting that sellers still have the advantage in the bigger picture. I'm monitoring the 1H and 4H charts closely. A sustained move above $1.063 would be the first indication that short-term momentum is improving. The next important resistance sits around $1.078, followed by the $1.098–$1.14 region. Volume Analysis GRAM has maintained meaningful trading activity, with recent market data showing approximately $105M in futures volume and $38M in spot volume over 24 hours in one reported snapshot. However, trading activity alone doesn't confirm accumulation. Recent order-flow data also showed negative cumulative volume delta, indicating that aggressive selling has been outweighing buying across tracked markets. For me, the important signal will be whether spot buyers start supporting the recovery rather than relying entirely on futures activity. My Trading Plan I'm interested in a potential recovery setup, but I want confirmation before committing to a position. Initial Entry Zone: $1.014–$1.035 Preferred DCA Level: $0.990–$1.010, only if support holds and buyers show a clear reaction. First Resistance: $1.063–$1.078 Primary Target: $1.098 Additional Upside Potential: $1.14–$1.185 if momentum strengthens and price establishes acceptance above the previous resistance zones. My preferred confirmation is a strong 4H recovery followed by a successful retest. I don't want to chase a sudden green candle without evidence that buyers are taking control. What Could Go Wrong? The biggest risk is another breakdown below the $1.014 support area. If sellers push price below this level, the $0.990 region becomes an important structural support to watch. A sustained 4H breakdown below $0.990 would significantly weaken my recovery expectations and could open the door to another downward move. I also want to see improving spot demand. If futures activity increases while spot buying remains weak, any recovery could struggle to maintain momentum. Risk management remains essential. I would rather miss an entry than hold a position through a confirmed structural breakdown. My Perspective GRAM is interesting because price is approaching a major support region while trading activity remains relatively strong. However, I don't see enough confirmation to call this a confirmed bullish reversal yet. My focus is on three things: 1. Whether $1.014–$1.035 attracts genuine buying interest. 2. Whether GRAM can reclaim $1.063 and challenge $1.078. 3. Whether spot volume starts supporting upward price movement. My expectation is a possible short-term recovery if buyers defend the current support region. A move toward $1.098 and potentially $1.14 becomes more interesting after resistance is reclaimed. For now, I'm staying patient. The support reaction and the $1.063 breakout will tell me much more than simply guessing the next direction. $GRAMUSDT #IMPACTbyTrade
$NVDAXUSDT – 這檔代幣化資產遭遇沈重拋壓,我正密切關注一個關鍵價位 市場概覽 NVDAX 是 NVIDIA 股票的代幣化追蹤資產,目前的走勢與整體加密市場截然不同。雖然主流數位資產相對穩定,但 NVDAX 正面臨沈重壓力,反映了 NVIDIA 標的股票的劇烈拋售。該代幣最近單日跌幅超過 5%,7 天內累計跌幅近 19%,這告訴我這不僅是加密貨幣市場常見的波動,而是對股權曝險部位的重新定價。 觀察圖表,市場結構已明顯轉為看跌。價格跌破了此前維持支撐的 172 美元關鍵位置,隨後的跌勢進一步加劇。日線技術指標顯示強烈的賣出訊號,價格處於所有主要移動平均線下方。20 日 EMA 已向下穿過 200 日 SMA,這是一個我絕不會忽視的結構性警訊。 成交量分析 這裡的成交量結構才是真正吸引我注意的地方。近期 NVIDIA 標的股票的成交量約為平時平均水準的 3 到 4 倍,這看起來更像是恐慌性拋售,而非有序的獲利了結。在代幣化資產方面,24 小時現貨成交量相當龐大,但各交易所的期貨成交量變化並不穩定——部分交易場所的參與度出現了巨大的百分比波動。當我看到這種成交量配合跌破關鍵支撐的情況時,這意味著賣方掌握了主導權。在成交量縮減且價格企穩之前,我沒有興趣去接這把下墜的刀。 我的交易計畫 我不會急於進場做多。市場結構已經破壞,且 11 月 17 日即將公佈財報,這增加了事件風險。我的策略是反應式,而非預測式。 · 初始進場區間:我正關注 164–166 美元區域。這與今年早些時候的多月低點相符,代表下一個合理的支撐需求區。我希望看到價格在此處企穩,且賣壓成交量萎縮,才會考慮建立部位。 · 首選 DCA(平均成本法)區間:如果 164 美元失守,價格下探至 155–158 美元區間,我有意分批進場,但前提是必須看到明顯的拒絕長下影線和成交量背離。那將是拋壓耗盡的訊號。 · 第一壓力位:172–174 美元。這是之前的支撐位,現已轉為壓力位。收復此區域將是短期跌勢趨緩的第一個跡象。 · 主要目標價:188–190 美元,這與近期跌破後的缺口區域及先前的盤整區間相符。 · 進一步上漲潛力:200–205 美元。這是已跌破的 200 SMA 和 20 EMA 所在位置。若能收復此處,將是真正的趨勢修復,但在 NVIDIA 財報未傳出驚喜利多前,我不會指望這一點。 有什麼潛在風險? 顯而易見的風險在於,這可能不是底部,而只是暫停。日線 RSI 處於極度超賣狀態,但在強勁的下跌趨勢中,超賣可能會持續,且 ADX 顯示為單邊看跌趨勢。如果 164 美元被強力跌破,下一個結構性支撐位會低得多,且幾乎沒有先前的價格行為能緩衝跌勢。 更大的風險來自於 11 月 17 日的財報事件。如果 NVIDIA 下調指引,或提到供應限制與資料中心能見度問題,NVDAX 可能會出現劇烈跳空下跌。我會據此調整部位規模並嚴格執行停損。跌破 155 美元將使我整個看漲回升的論點失效。 我的觀點 NVDAX 之所以有趣,正是因為現在的局勢令人感到不安。這類代幣化股票讓加密貨幣交易者能直接參與股票波動,而這正是我們現在所看到的。拋售雖然猛烈,但激進的拋售往往會創造出強勁反彈的條件——尤其是當標的股票已經如此超賣,且分析師對於「是否反應過度」與「下調目標價」之間意見分歧時。 我還不是買家。我正在觀察 164 美元,看看是否有買盤進駐。如果有,我會建立小部位並嚴格停損,讓市場自我驗證。如果沒有,我就會等待。11 月 17 日的財報催化劑可能會決定下一個重大走勢,我寧願針對市場的裁決做出反應,也不願去猜測它。 #ByXIMPACT
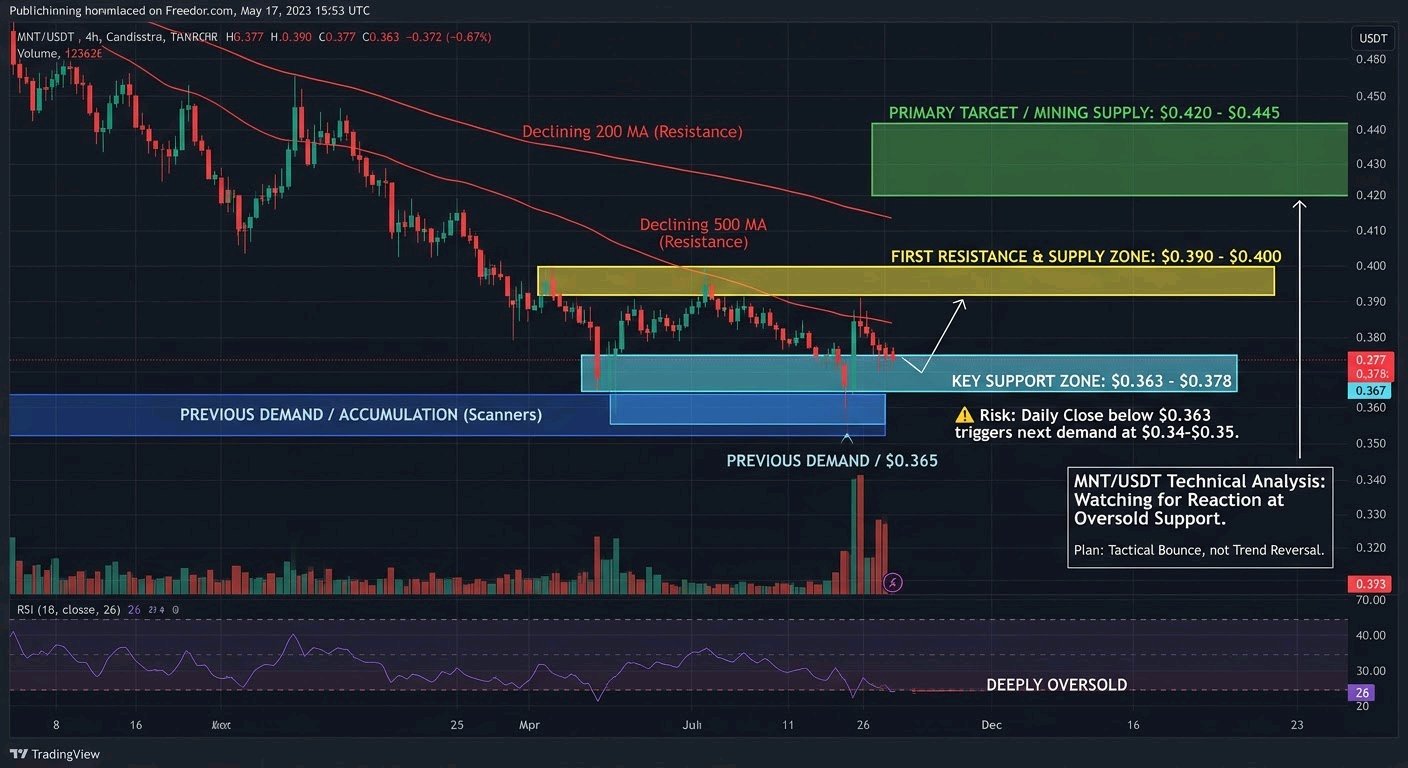
$MNTUSDT - PRICE IS DEEPLY OVERSOLD NEAR KEY SUPPORT, AND I’M WATCHING FOR A REACTION.** Mantle continues to lag the broader market in this risk-off environment. While Bitcoin and the majors have shown occasional stabilizations, MNT has kept grinding lower, printing a clear series of lower highs and lower lows. On the daily and 4-hour timeframes the structure remains bearish, with price sitting well below the major moving averages. The 24-hour range has been roughly $0.3635–$0.4002, and we’re currently hovering near the lower end of that range around $0.376–$0.378. RSI on the higher timeframes has dropped into the mid-20s, which is deeply oversold territory. That doesn’t guarantee a bounce, but it does increase the odds of at least a short-term relief reaction if buyers step in at these levels. **Volume Analysis** 24-hour trading volume is running around $43 million. Participation has picked up during the latest leg lower, which is typical of continuation selling rather than quiet accumulation. The increased volume on the downside confirms that sellers are still in control for now. Any meaningful rebound will need to show a clear shift in volume character—higher volume on green candles and absorption at support—rather than just a low-volume bounce that gets sold into. **My Trading Plan** I’m treating this as a potential mean-reversion / relief-bounce setup only, not a trend reversal. - **Initial Entry Zone**: $0.370 – $0.378 (current area and just above the 24h low). I’m only interested on signs of stabilization or a higher low forming on the lower timeframes. - **Preferred DCA Level**: $0.355 – $0.365. This aligns with the recent accumulation zone identified by several scanners and sits just above the deeper structural support near $0.34–$0.36. - **First Resistance**: $0.390 – $0.400. This is the upper end of the recent daily range and the first real supply area. A clean reclaim and hold above $0.400 would be the first sign of improving structure. - **Primary Target**: $0.420 – $0.445. This is where I expect the first meaningful supply to appear on any bounce. - **Additional Upside Potential**: $0.48 – $0.50 if the broader market stabilizes and MNT starts showing relative strength. I’m not chasing. I want confirmation of buying interest (absorption, higher lows, or a break of short-term structure) before sizing up. **What Could Go Wrong?** The primary risk is straightforward continuation of the downtrend. A clean break and daily close below $0.363 would open the door to the next demand zone around $0.34–$0.35. Below that, the path of least resistance remains lower toward the $0.30–$0.31 area that has acted as longer-term support in the past. As long as price remains below the declining moving averages and fails to reclaim $0.40 with conviction, the bearish bias stays intact. Oversold conditions can persist longer than expected in a risk-off environment, so any long positions need tight risk management and clear invalidation levels. **My Perspective** MNT is interesting right now precisely because it is stretched to the downside and sitting near a zone that previously attracted demand. The oversold RSI and proximity to recent lows create a reasonable risk/reward for a tactical bounce trade. That said, the higher-timeframe structure is still clearly bearish, and the coin is showing relative weakness versus the broader market. I’m watching two things closely: 1. Whether buyers can defend the $0.36–$0.37 area and force a higher low. 2. Whether any bounce is accompanied by expanding volume or simply gets sold into at the first resistance. Until we see a shift in market structure and relative strength, I’m treating upside as corrective rather than the start of a new trend. Patience and strict risk management remain the priority here. #IMPACTbyTrade
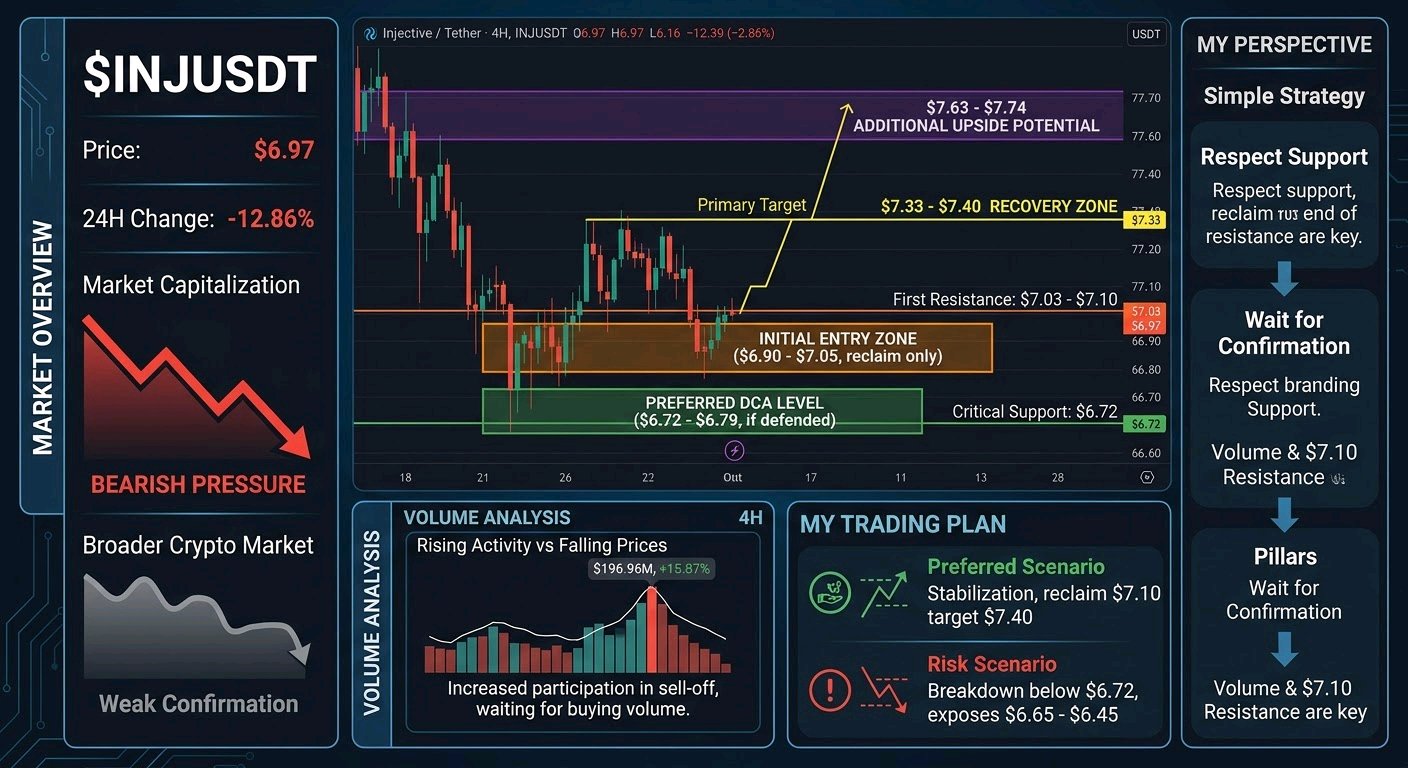
$INJUSDT – SELLING PRESSURE IS RISING, BUT I'M WATCHING THE $7.40 RECOVERY ZONE Injective ($INJ) is showing a challenging price structure right now. The recent decline has increased volatility, and I'm watching closely to see whether buyers can defend the current demand area or whether another leg down is developing. Market Overview INJ is trading around $6.97, with a sharp decline of approximately 12.86% over the last 24 hours. The recent price action shows that sellers have taken control of the short-term structure. On the 4H timeframe, bearish pressure remains visible, while the daily structure also needs stronger buying confirmation before I consider a meaningful trend reversal. Compared with the broader crypto market, I would avoid calling this relative strength without further confirmation. For now, my focus is on how INJ reacts around its nearby support levels. Volume Analysis 24-hour trading volume is approximately $196.96M, with reported volume growth of around 15.87%. What interests me here is the combination of rising trading activity and falling prices. This suggests increased participation during the sell-off, meaning buyers still need to prove that they can absorb the available selling pressure. I want to see buying volume return alongside a recovery in price before considering a stronger bullish continuation. My Trading Plan I'm keeping the following levels on my watchlist: • Initial Entry Zone: $6.90 – $7.05 (only after bullish confirmation and a successful reclaim). • Preferred DCA Level: $6.72 – $6.79 (if buyers defend this demand zone). • First Resistance: $7.03 – $7.10. • Primary Target: $7.33 – $7.40. • Additional Upside Potential: $7.63 – $7.74. My preferred scenario is a stabilization above the $6.72–$6.79 support area, followed by a reclaim of $7.10. A sustained move above that resistance could create room for a recovery toward $7.40. If momentum improves further, the next area I'm watching is $7.63–$7.74. I don't want to chase a bounce without confirmation. A successful retest of reclaimed resistance would make the setup more interesting. What Could Go Wrong? The biggest risk is that INJ fails to hold its nearby demand zone. A breakdown below $6.72 would weaken the immediate recovery scenario and could expose the market to additional downside pressure. I'm also watching the $6.65–$6.45 area as a deeper support region. Losing that zone would suggest that sellers are still controlling the larger price movement. For me, a bullish setup becomes considerably weaker if price continues making lower lows without a meaningful increase in buying participation. My Perspective I'm interested in INJ because the current volatility is creating an important decision area for both buyers and sellers. However, I don't see enough confirmation to blindly call this a reversal. The short-term structure remains under pressure, and buyers need to reclaim $7.10 before I become more confident about a recovery. My immediate expectation is a possible consolidation around current levels, followed by an attempt to recover toward $7.33–$7.40 if demand holds. I'm watching volume, support reactions, and the $7.10 resistance closely. My strategy is simple: respect the support, wait for confirmation, and let price action decide the next move. $INJUSDT #ByXIMPACT
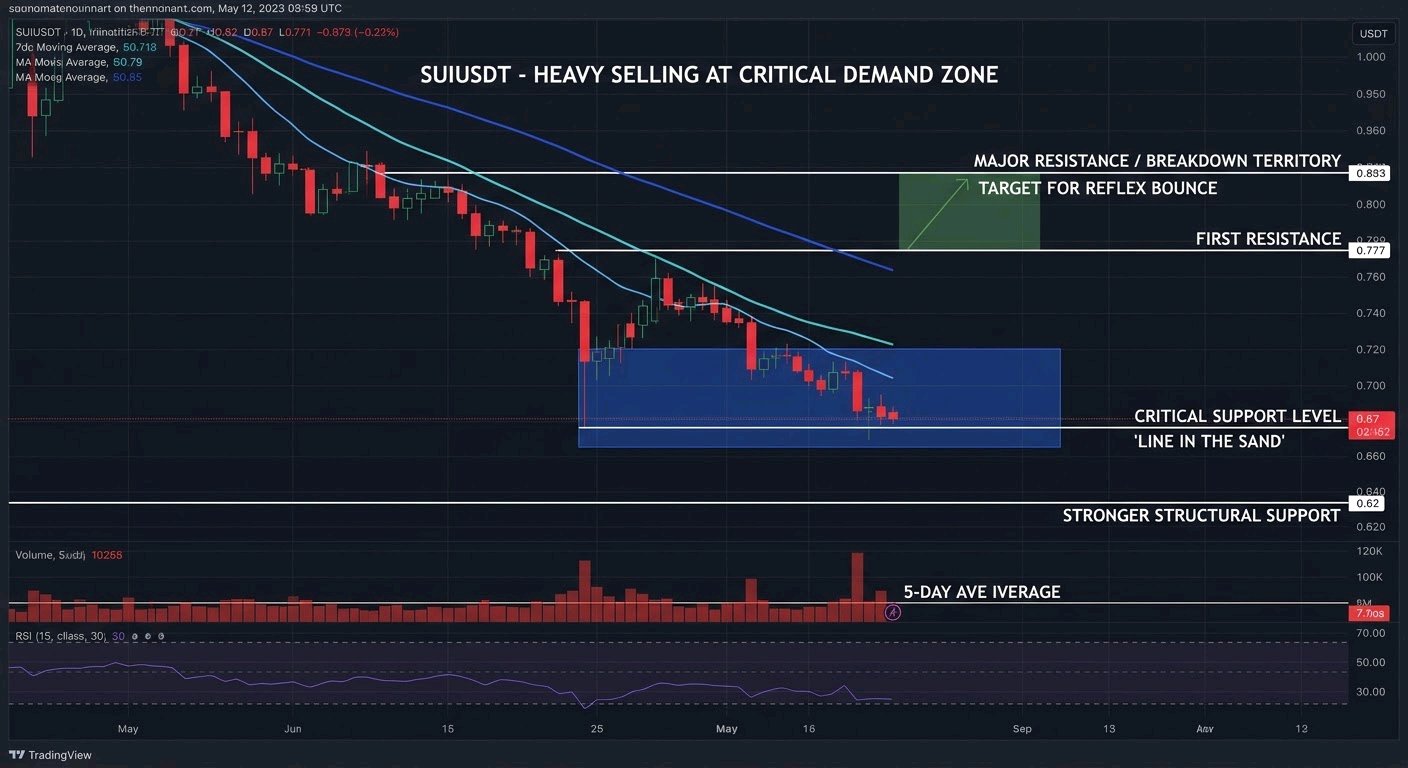
$SUIUSDT – HEAVY SELLING HAS PUSHED PRICE INTO A CRITICAL DEMAND ZONE, AND I’M WATCHING FOR A REACTION HERE. Sui has taken a serious hit over the past 24 hours, dropping over 12% at one point to trade near $0.70 before settling around the $0.71–$0.72 region . This move stands out because it’s not just a mild pullback—it’s a decisive break below the short-term structure that had been forming earlier in the month. While the broader crypto market has seen its own volatility, SUI’s decline feels heavier, showing clear relative weakness. The daily chart shows price now sitting well below the 7-day, 20-day, and 50-day moving averages, with the 7-day at $0.79 and the 20-day at $0.85 acting as overhead supply . What I’m monitoring closely is the $0.67 level—this is the immediate line in the sand. A clean loss of that zone would expose the $0.62 area next, which is the stronger structural support . The volume picture here is interesting but not yet conclusive. Binance spot volume has been around $50 million, and the volume-price regime sits at roughly 0.53x versus the 5-day average . That tells me this pullback has been a relatively low-volume decline rather than a panic-driven capitulation. In one sense, that’s constructive—sellers haven’t forced a disorderly flush. But it also means we haven’t seen the kind of high-volume absorption that often marks a durable bottom. I’m not seeing a surge in buying participation yet, which keeps me cautious about calling this a clean reversal. The funding rate on Binance Futures is slightly negative at -0.0170%, meaning shorts are paying longs . That can hint at crowded short positioning, but it’s not a standalone signal. My trading plan is built around patience and levels. I’m interested in an initial entry zone between $0.70 and $0.72, which is where price is currently stabilizing. If we see a deeper flush, my preferred DCA level sits near $0.67—this is the immediate support that needs to hold to keep the oversold bounce thesis alive. The first resistance I’m watching is $0.77; reclaiming that would be the first sign that sellers are losing grip. Above that, $0.83 is the more meaningful hurdle, aligning with the 20-day average and prior breakdown territory . My primary target for a reflex bounce is the $0.81–$0.83 region, with additional upside potential toward $0.87 if momentum genuinely shifts. What would confirm the setup for me is a hold above $0.67 followed by a volume-backed reclaim of $0.77. The risk here is real and needs to be respected. The daily RSI is around 30, which is near oversold but not a guaranteed reversal signal . If $0.67 breaks decisively, the setup weakens quickly and $0.62 becomes the next demand zone to watch. A breakdown below that would invalidate the bounce thesis entirely and suggest the broader downtrend is resuming. I’m also mindful that open interest has been falling across most venues during this drop, which means traders are cutting positions rather than adding fuel for a sharp rebound . That lowers the probability of a violent short squeeze. My perspective is that SUI is in a weak trend with oversold conditions underneath it—a combination that leaves room for a reflex bounce but not enough technical repair to call the decline finished . The $0.67 level is what I’m watching next. If buyers defend it and volume starts to expand on the upside, I’ll be interested in the bounce toward $0.83. If it fails, I’ll step aside and wait for the $0.62 area to see if a more durable base forms. This is a setup that requires discipline, not conviction betting. $SUIUSDT #ByXIMPACT
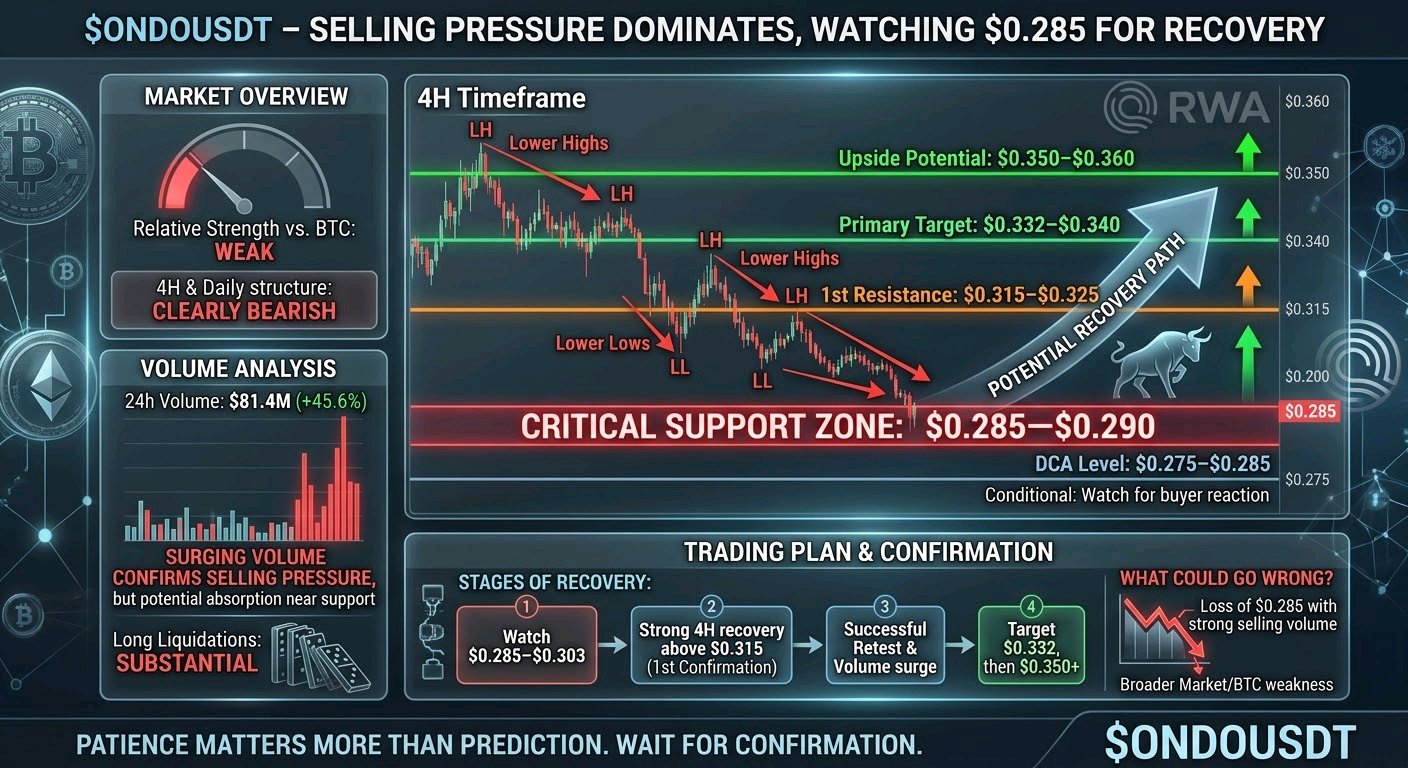
$ONDOUSDT – 拋壓依然主導市場,但我正密切關注 $0.285 的支撐位,尋找潛在的反彈機會。 市場概況 ONDO 目前面臨巨大的拋壓,在過去 24 小時內下跌約 8–9%,目前交易價格在 $0.30 左右。 與比特幣相比,ONDO 表現出相對弱勢。雖然 BTC 也出現了下跌,但 ONDO 的下行力度明顯更強。 在 4 小時和日線圖上,我觀察到一個明顯的看跌結構。價格持續形成更低的高點和更低的低點,先前的支撐區間均未能守住。 目前關鍵的區域是 $0.285–$0.290。如果 ONDO 想要建立一個有意義的短期反彈,買方必須守住這個區域。 成交量分析 在此次下跌過程中,交易活躍度有所增加。 現貨市場聚合數據顯示,24 小時成交量約為 8,140 萬美元,較上一期間增長了約 45.6%。期貨市場的活動也很活躍,伴隨著大量的多單清算。 這告訴我,最近的走勢不僅僅是一次平靜的價格修正。拋壓背後有明確的市場參與度。 然而,僅憑成交量增加並不能確認反轉。在考慮更強勁的看漲走勢之前,我希望看到買方吸收賣單。 我的交易計劃 我對潛在的反彈感興趣,但在市場結構仍然看跌的情況下,我不想追高。 我關注的點位: - 初始進場區間:$0.292–$0.303 - 首選 DCA(平均成本法)點位:$0.275–$0.285,僅在買方出現明確反應時才考慮。 - 第一阻力位:$0.315–$0.325 - 主要目標位:$0.332–$0.340 - 進一步上漲空間:$0.350–$0.360 我的第一個確認信號將是強勁的 4 小時線收盤價高於 $0.315,隨後進行成功的回測。 如果這種情況發生且買盤成交量有所改善,我會更有興趣持有至 $0.332–$0.340 的阻力區。 若能持續突破該區域,可能會打開通往 $0.350–$0.360 的大門。 可能會出錯的地方? 最大的風險是再次跌破 $0.285。 如果 ONDO 在強大的賣盤成交量下失守該區域,當前的反彈預期就會減弱,我會避免強行建立多頭倉位。 $0.275 區域是我下一個下行的參考點,但我需要新的價格行為來確認買方是否願意捍衛該區域。 我也在密切關注比特幣。如果整體市場持續疲軟,即使 ONDO 自身的拋壓開始放緩,它也可能難以反彈。 我的觀點 ONDO 在這些水平上很有趣,因為價格在經歷了長時間的下跌後正接近一個重要的短期支撐區。 不過,我不認為目前的價格走勢是已確認的看漲反轉。 我的策略是觀察價格在 $0.285–$0.303 附近的表現。如果買方進場、成交量改善,且 ONDO 開始收復阻力位,我預計它會嘗試向 $0.332 甚至 $0.350 反彈。 目前,耐心比預測更重要。 我會關注支撐位的反應,並等待確認信號,然後再投入更強的看漲預期。 機會就在那裡,但市場需要證明買方已經重新掌控局勢。 #ByXIMPACT
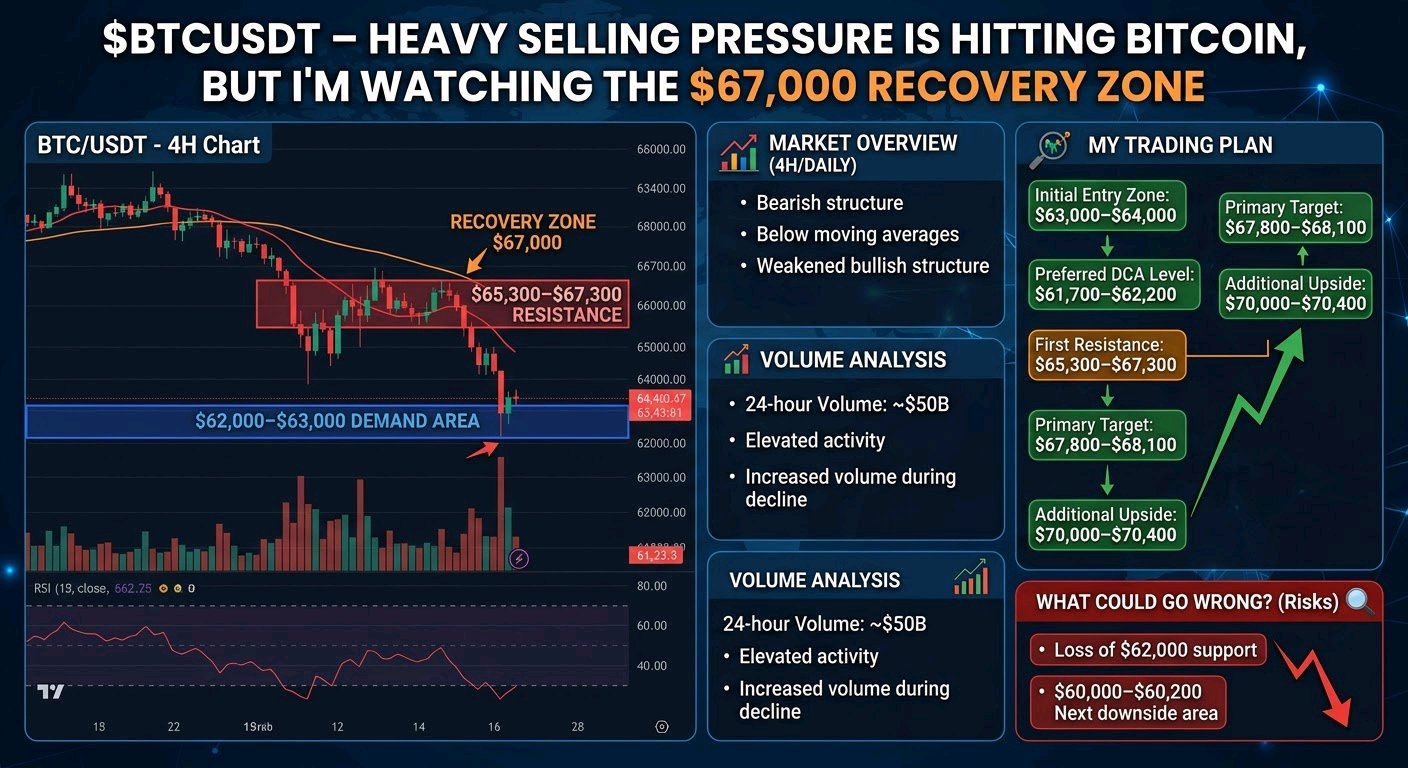
$BTCUSDT – 比特幣正遭受強勁的拋售壓力,但我正在密切關注 $67,000 的回升區 比特幣正在經歷顯著的回調,目前的價格走勢值得注意。BTC 目前交易價格在 $64,400 左右,過去 24 小時內下跌約 4%。賣方目前仍控制著短期結構,但近期的下跌也將動量指標推向了超賣區域。 我正密切關注 $62,000–$63,000 的需求區,因為該區域對於下一次的回升嘗試可能變得至關重要。 市場概況 在 4 小時和日線級別上,比特幣呈現看跌結構,價格低於重要的移動平均線。 近期的拋售壓力削弱了看漲結構,且 BTC 一直難以維持其之前的交易區間。 目前,我不會將每一次的反彈都視為趨勢逆轉。比特幣需要收復重要的阻力位,並建立更高的低點(higher lows)和更高的高點(higher highs),我才會對看漲延續更有信心。 成交量分析 比特幣的 24 小時交易量約為 500 億美元,顯示出顯著的市場參與度。 近期的市場數據也顯示交易活動較 30 天平均水平有所上升。 這告訴我,目前的走勢正在吸引大量參與。然而,下跌期間成交量增加並不自動意味著積累。我希望看到更強勁的買入成交量和令人信服的回升,然後才會確認買方正在掌控局面。 我的交易計畫 我對 BTC 採取謹慎策略,而不是追逐目前的走勢。 初始入場區:$63,000–$64,000 首選平均成本法 (DCA) 水平:$61,700–$62,200 第一阻力位:$65,300–$67,300 主要目標:$67,800–$68,100 額外上行潛力:$70,000–$70,400 我首選的劇本是 BTC 守住 $62,000–$63,000 區域,建立一個更高的低點,並收復 $65,300。 如果能在強勁買入成交量的支撐下,於 4 小時級別收於該水平上方,將改善回升前景。 如果買方成功突破 $67,300,我會考慮可能延續至 $68,000,最終目標為 $70,000。 可能會出什麼問題? 最大的風險是另一波拋售壓力。 如果比特幣在成交量放大的情況下失守 $62,000 的支撐區,目前的回升劇本將會顯著變弱。 若跌破該區域,我會關注 $60,000–$60,200 作為下一個重要的下行區域。 如果市場結構持續走低,我不想盲目攤平。若確認跌破,我會重新評估整個佈局,而不是強行建立看漲倉位。 我的觀點 比特幣正處於一個重要的技術點位。 短期結構依然看跌,我尊重這一點。然而,超賣狀況和活躍的交易活動使得 $62,000–$63,000 附近的下一次反應特別值得關注。 我正在觀察買方如何應對這一需求區,以及 BTC 是否能以令人信服的動量收復 $65,300。 我首選的劇本是回升至 $67,000–$68,000,但確認信號比預測更重要。 目前,我保持耐心,尊重下行風險,並等待買方證明其實力。 #ByXIMPACT
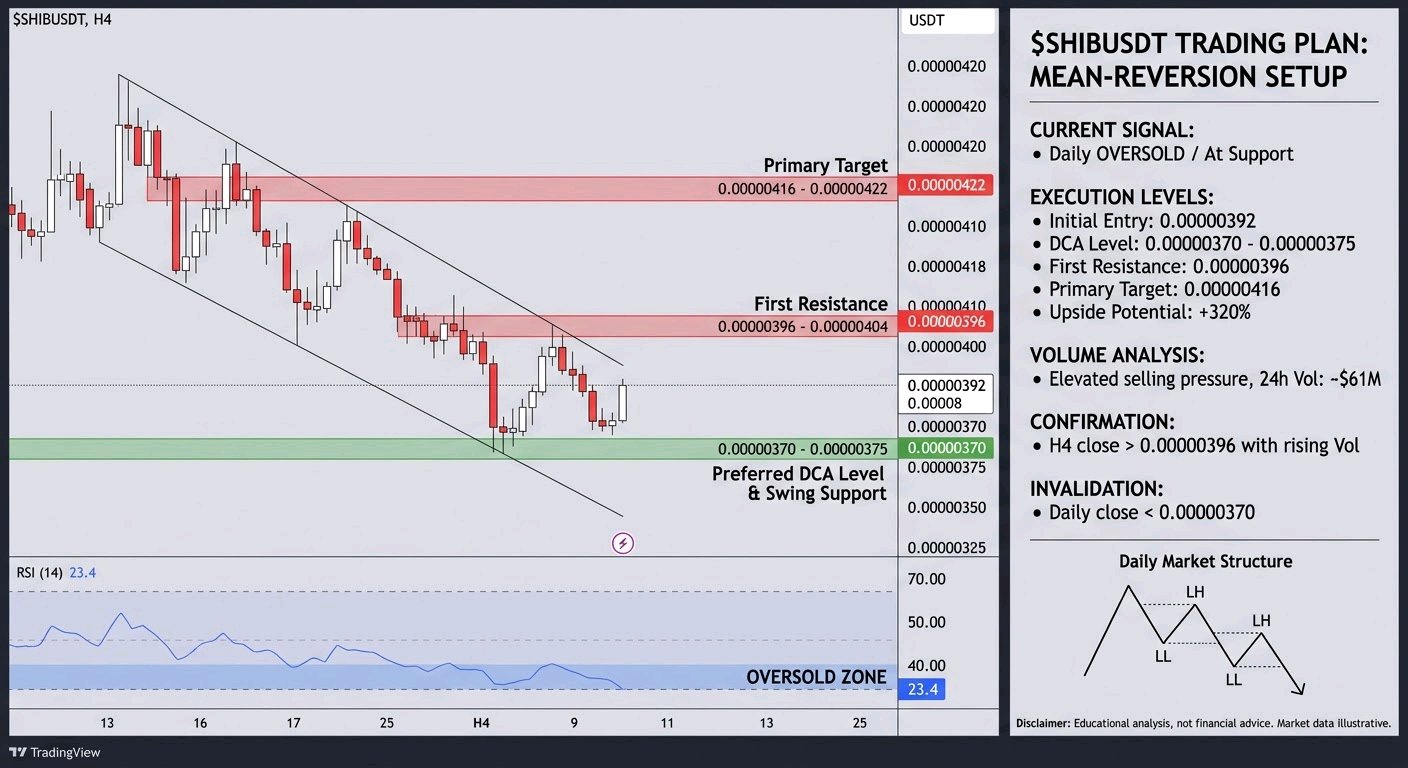
$SHIBUSDT - OVERSOLD ON THE DAILY, PRESSURE AT KEY SUPPORT, AND I’M WATCHING THE REACTION CLOSELY.** SHIB is trading near 0.00000390–0.00000392 after another weak session, down roughly 6–7% in the last 24 hours. The broader market has been soft, but SHIB is showing clear relative weakness, sitting well below its recent range and under most short- and medium-term moving averages. On the daily and 4-hour charts the structure remains lower highs and lower lows. Price has been grinding lower for weeks and is now pressing into a zone that multiple swing pivots and technical levels have marked around 0.00000370–0.00000374. I’m monitoring the 4-hour and daily timeframes most closely right now. The daily RSI has dropped into the mid-20s, which is oversold territory and the lowest readings we’ve seen in recent months. That alone does not reverse a trend, but it does raise the chance of at least a short-term relief bounce if buyers step in at this support. **Volume Analysis** 24-hour volume across major pairs has been elevated relative to the quieter sessions earlier in the week, with figures commonly reported in the $50–70 million range. The increase has largely accompanied the downside move, which tells me participation is still skewed toward sellers. Rising volume on a decline is not ideal for an immediate reversal, but if we start to see volume expand on any bounce off the current support while RSI holds or turns higher, that would be a constructive shift. Until then, the volume profile still favors caution on the long side. **My Trading Plan** I’m treating this as a potential mean-reversion setup rather than a trend-following long. - **Initial Entry Zone:** 0.00000385 – 0.00000395 (current area if support holds and we see a higher low form on the 4-hour). - **Preferred DCA Level:** 0.00000370 – 0.00000375. This is the nearest confirmed swing support. I’m only interested in adding if price tests it with clear rejection and volume does not accelerate lower. - **First Resistance:** 0.00000396 – 0.00000404. A clean reclaim and hold above this area would be the first sign that short-term selling pressure is easing. - **Primary Target:** 0.00000416 – 0.00000422. This zone lines up with recent swing highs and prior resistance. - **Additional Upside Potential:** 0.00000426 – 0.00000438 if momentum builds and the broader market cooperates. Confirmation for me would be a 4-hour close back above the immediate resistance cluster with rising volume and RSI turning higher from oversold. Without that, I’m not forcing size. **What Could Go Wrong?** The path of least resistance has been down. A daily close below 0.00000370–0.00000374 would open the door to further downside toward the 0.00000354–0.00000356 area and potentially deeper. That would invalidate the short-term bounce thesis and force me to step aside. Even if support holds temporarily, any bounce that fails quickly under the 0.00000400–0.00000404 zone would still leave the larger structure bearish. Liquidity is thinner at these levels, so sharp moves in either direction remain possible. **My Perspective** SHIB is interesting here purely because of the oversold daily conditions and the proximity to a well-defined support zone. The market structure is still clearly bearish, so I’m not looking for a major trend reversal. What I’m watching is whether this support can produce a tradable bounce and whether volume starts to favor the buyers on any rebound. If we get a clean reaction and reclaim of the first resistance cluster, the risk-reward for a short-term long becomes more attractive. If support breaks with conviction, I’ll stay on the sidelines. Right now the evidence points to a market that is stretched to the downside but still controlled by sellers. I’m patient, defined in my levels, and ready to adjust if the price action changes. #IMPACTbyTrade
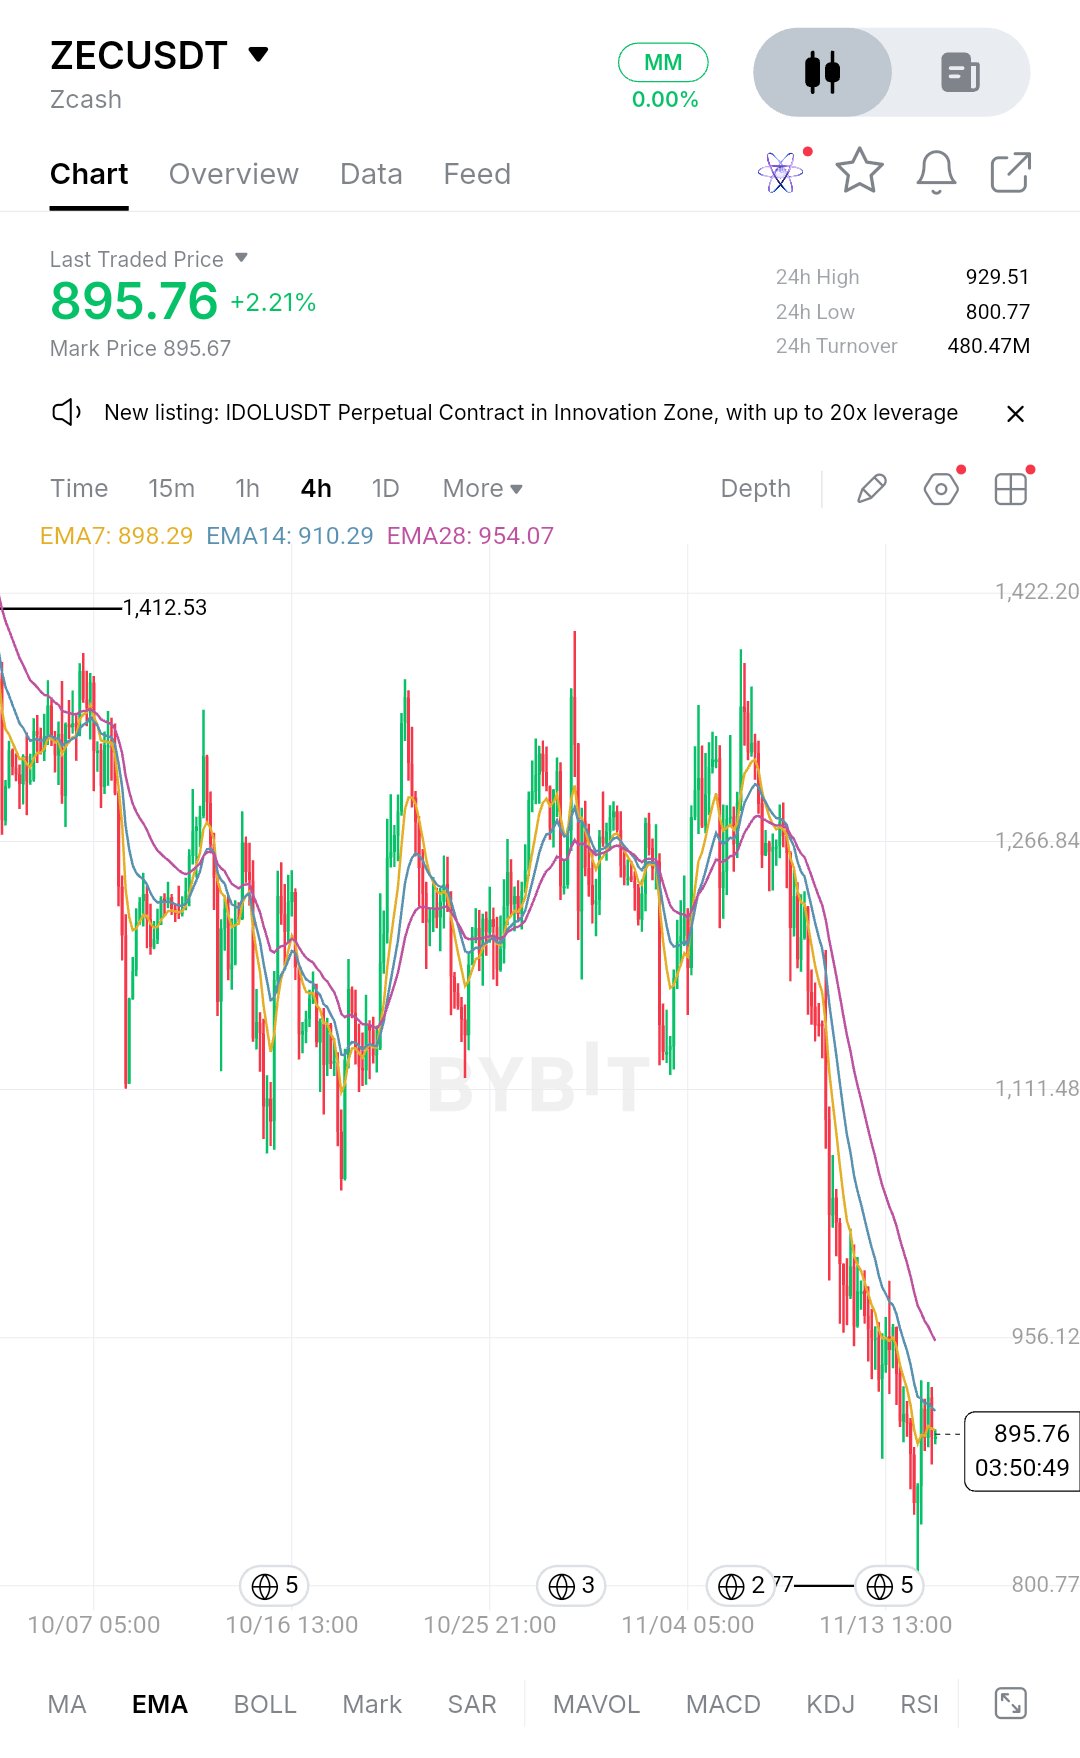
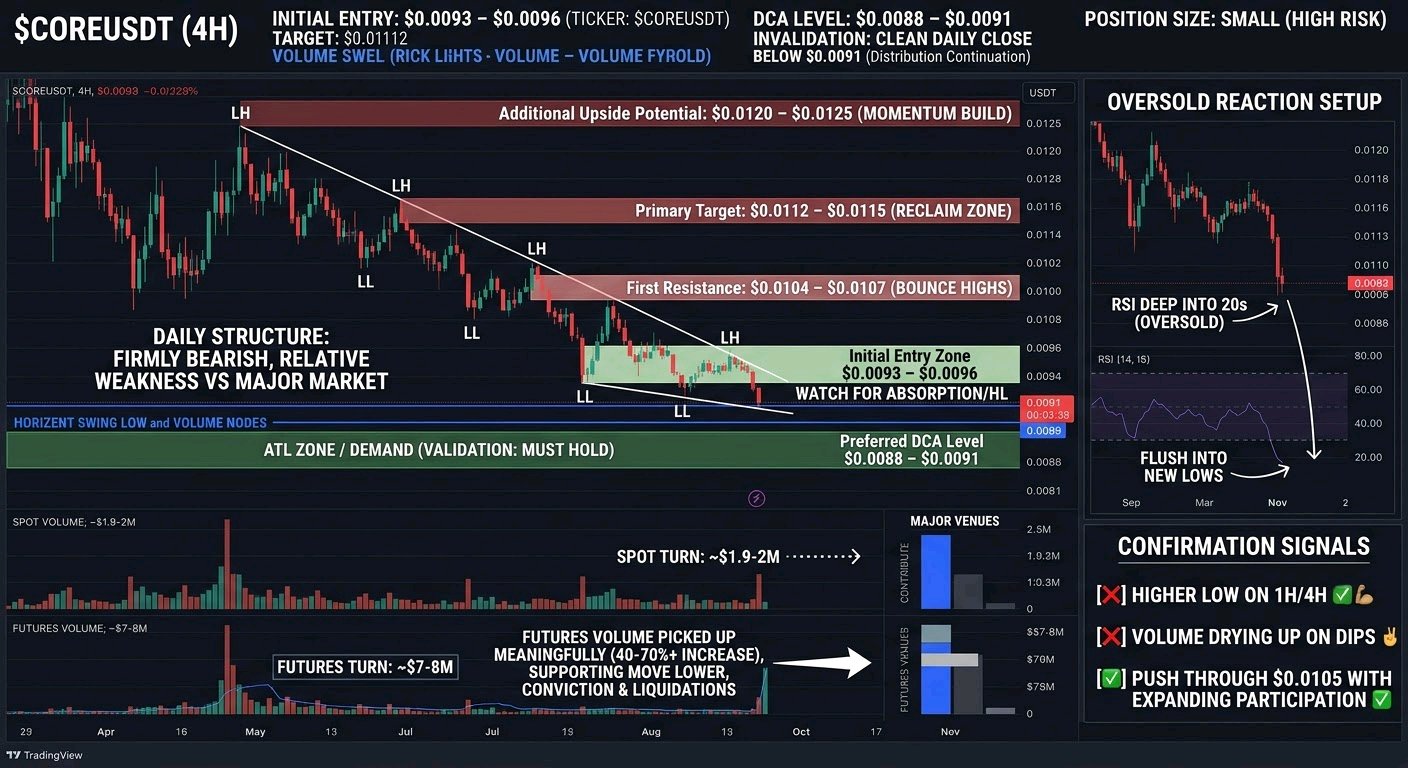
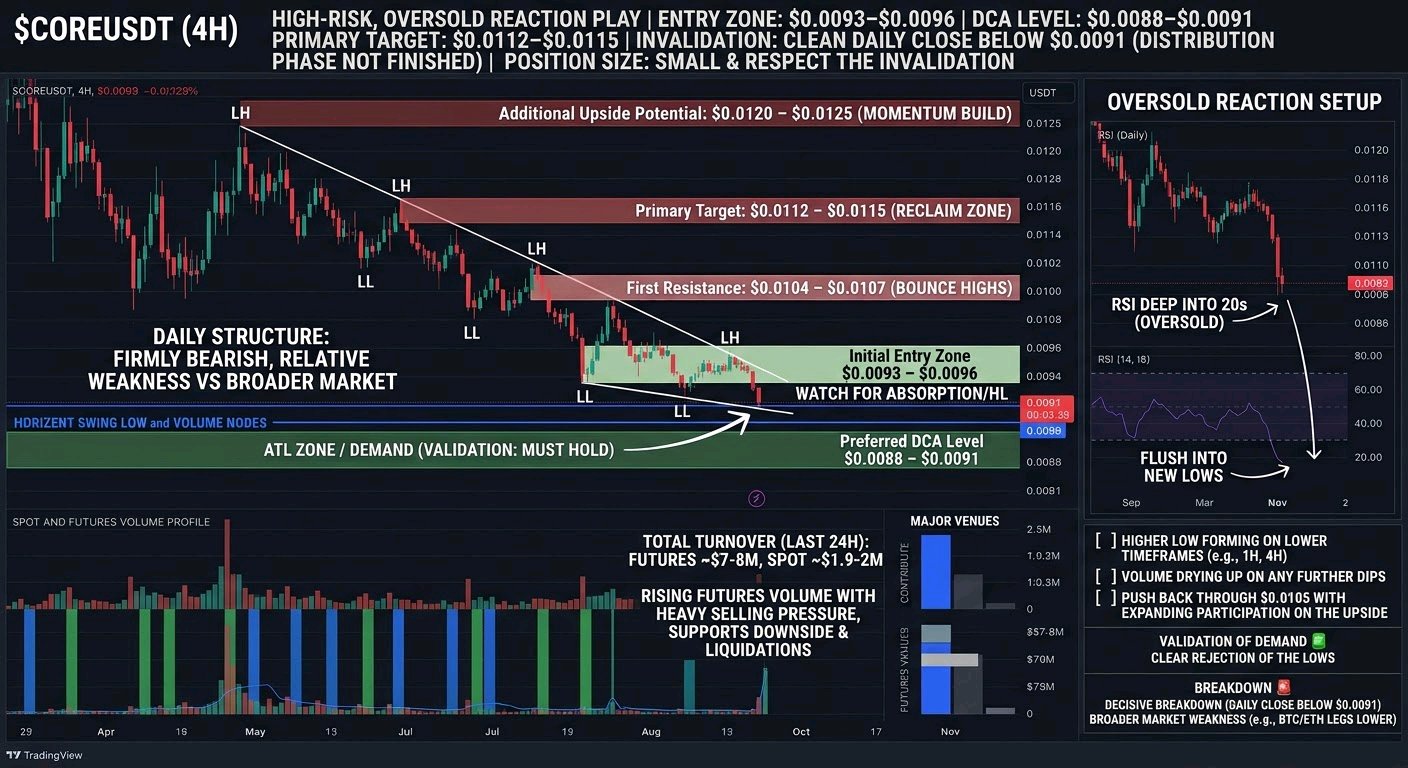
COREUSDT 相對於大盤明顯偏弱。儘管主流幣種近期波動劇烈,但 CORE 在更高時間週期上持續走出更低的高點與更低的低點,日線結構依然看跌。我目前主要觀察 4 小時和日線圖。價格近期向下探至 $0.0091 附近(新的數月/歷史低點區間)後出現了小幅反彈嘗試,但賣方總體上仍掌控局面。目前的市場結構顯示更多是派發(Distribution)而非吸籌(Accumulation)。 ## 成交量分析 過去 24 小時合約交易量顯著增加(各大交易所報告顯示增加了 40-70% 以上,合約總成交額約在 700-800 萬美元,現貨則接近 190-200 萬美元)。這種下跌趨勢中的參與度提升,顯示這是真正的拋售而非緩慢磨損。下跌過程中的高成交量意味著賣方意圖明確,且伴隨清算(多頭平倉占強制平倉的大多數)。此類活躍度增加可能會加速後續走勢,或者若買方在極端位置強勢介入,也可能引發更劇烈的軋空反彈。目前成交量分佈仍有利於空頭。 ### 我的交易計畫 我將此視為高風險的「超賣反彈」策略,而非明確的趨勢跟隨型做多。 - **初始進場區間**:$0.0093 – $0.0096(接近近期的閃崩低點與當前交易區間)。我只會在更小時間週期出現明顯的買盤吸收或形成更高低點時才感興趣。 - **首選分批加倉(DCA)水位**:若價格測試或輕微跌破近期低點且成交量萎縮,將落在 $0.0088 – $0.0091。 - **第一阻力位**:$0.0104 – $0.0107(近期反彈高點與先前盤整區)。 - **主要目標價**:若成功收復並站穩第一阻力位,上看 $0.0112 – $0.0115。 - **額外上行潛力**:若動能增強且大盤企穩,則上看 $0.0120 – $0.0125。 這些點位之所以重要,是因為它們與近期的波段結構和成交量節點相符。對我而言,確認信號將是 1 小時/4 小時級別出現更高低點,同時隨後的下跌過程中成交量萎縮,接著放量突破 $0.0105。 ### 風險所在? 考慮到 RSI 指標已極度超賣(日線級別深入 20 以下),短線反彈是有可能的,但大趨勢依然向下。$0.0091 區間必須守住作為需求區;若日線明確收盤跌破此位,將開啟進一步下跌空間,並否定近期的做多傾向。更深層的結構支撐位在下方,若持續出現放量拋售,將證實派發階段尚未結束。大盤疲軟或 BTC/ETH 的另一波下跌也會進一步對 CORE 構成壓力。這裡的風險管理不容妥協——部位要小,並尊重止損條件。 ### 我的觀點 CORE 目前值得關注,純粹是因為在經歷了激烈的拋售和高合約成交量後,具有戰術性超賣反彈的機會。由於價格相對於大盤疲軟且結構看跌,我不會強行建立強烈的方向性偏見。在證明情況改變前,延續下跌仍是高機率的路徑;但隨著成交量放大跌破新低,這種極端狀況下往往會迅速出現緩解性反彈。 我正在觀察低位是否出現明確的拒絕訊號(伴隨成交量確認)或是否會決定性破位。總體而言,預期短期內價格波動將劇烈且混亂,而非單邊持續走勢。保持耐心,讓價格點位說話。 IMPACTbyTrade
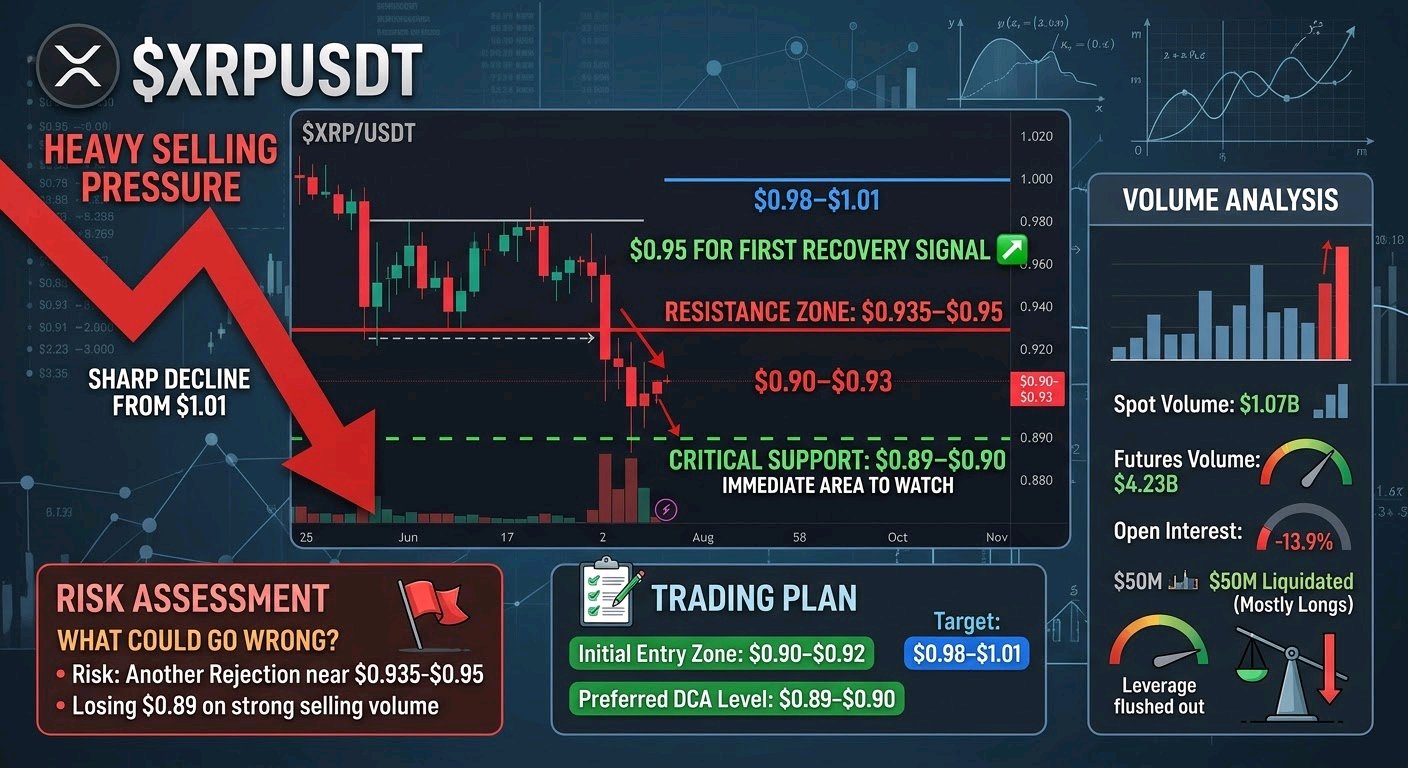
$XRPUSDT – 市場正遭遇沉重的拋售壓力。我正在密切關注 $0.95 作為第一個復甦訊號。 市場概覽 XRP 正面臨顯著的賣壓,短期市場結構依然看跌。 繼從 $1.01 區域急劇下跌後,價格目前在 $0.90–$0.93 左右震盪。在過去 24 小時內,XRP 下跌了約 9–11%,表現比同期下跌約 5% 的比特幣更顯弱勢。 從日線圖來看,賣方目前仍主導著大盤走勢。近期跌破支撐位已削弱了看漲結構,在沒有確認訊號前,我不會貿然進場抄底。 我目前關注的關鍵區域是 $0.89–$0.90。若能守住該區間,或可為短期復甦奠定基礎。 成交量分析 拋售期間交易活動有所增加。 近期市場數據顯示,過去 24 小時內,追蹤市場的現貨交易量約為 10.7 億美元,期貨交易量約為 42.3 億美元。 未平倉合約減少了約 13.9%,同時有近 5000 萬美元的期貨倉位遭到清算,其中大部分為多頭倉位。 這顯示市場已清洗了大量槓桿。然而,下跌過程中的交易量增加並不自動代表市場正在累積籌碼。 我希望看到現貨買盤強勢回歸,才會考慮將此波動視為確認的反轉。 我的交易計畫 我對 XRP 採取謹慎態度,尋求確認訊號,而非追逐下跌中的市場。 - 初始進場區間:$0.90–$0.92,前提是買方需守住支撐區域,且小週期結構開始改善。 - 首選 DCA(平均成本法)水準:$0.89–$0.90,前提是市場顯示出對低價區的明確拒絕。 - 第一阻力位:$0.935–$0.95。 - 主要目標位:$0.98–$1.01。 - 進一步上漲潛力:若能確認突破並穩固在 $1.01 上方,可能會開啟更大的復甦空間。 我偏好的確認訊號是 4 小時圖出現更高的低點(Higher Low),隨後伴隨成交量放大,強勢收復 $0.95。 若無此確認訊號,我寧可保持耐心,也不會強行進場。 什麼情況可能出錯? 最大的風險是在即時阻力區附近再次遇阻。 若 XRP 在強勁的拋售量下失守 $0.89,目前的復甦預期將減弱。持續跌破將顯示賣方仍掌控市場,且需要測試更深層的買盤需求。 我同時也在觀察更廣泛的比特幣市場,因為主流加密貨幣的持續疲軟可能會對 XRP 造成額外壓力。 目前,我會避免激進使用槓桿,並嚴格控制倉位大小。唯有當價格走勢確認買方正在防守時,支撐位才有其實際意義。 我的觀點 XRP 在此處值得關注,因為近期的拋售創造了一個關鍵的決策區。 雖然已有大量槓桿多頭倉位被清算,但這不足以斷定看漲反轉已經確立。 我正密切觀察 $0.89–$0.90 作為買方必須介入的即時區域。如果 XRP 能穩定下來,構築一個更高的低點,並收復 $0.95,我會更有興趣佈局看向 $0.98–$1.01 的行情。 由於整體結構仍處於壓力之下,我目前的偏向依然謹慎。 我並不打算預測確切的底部。我是在尋找賣方失去控制、買方終於重新進場的證據。 #IMPACTbyTrade
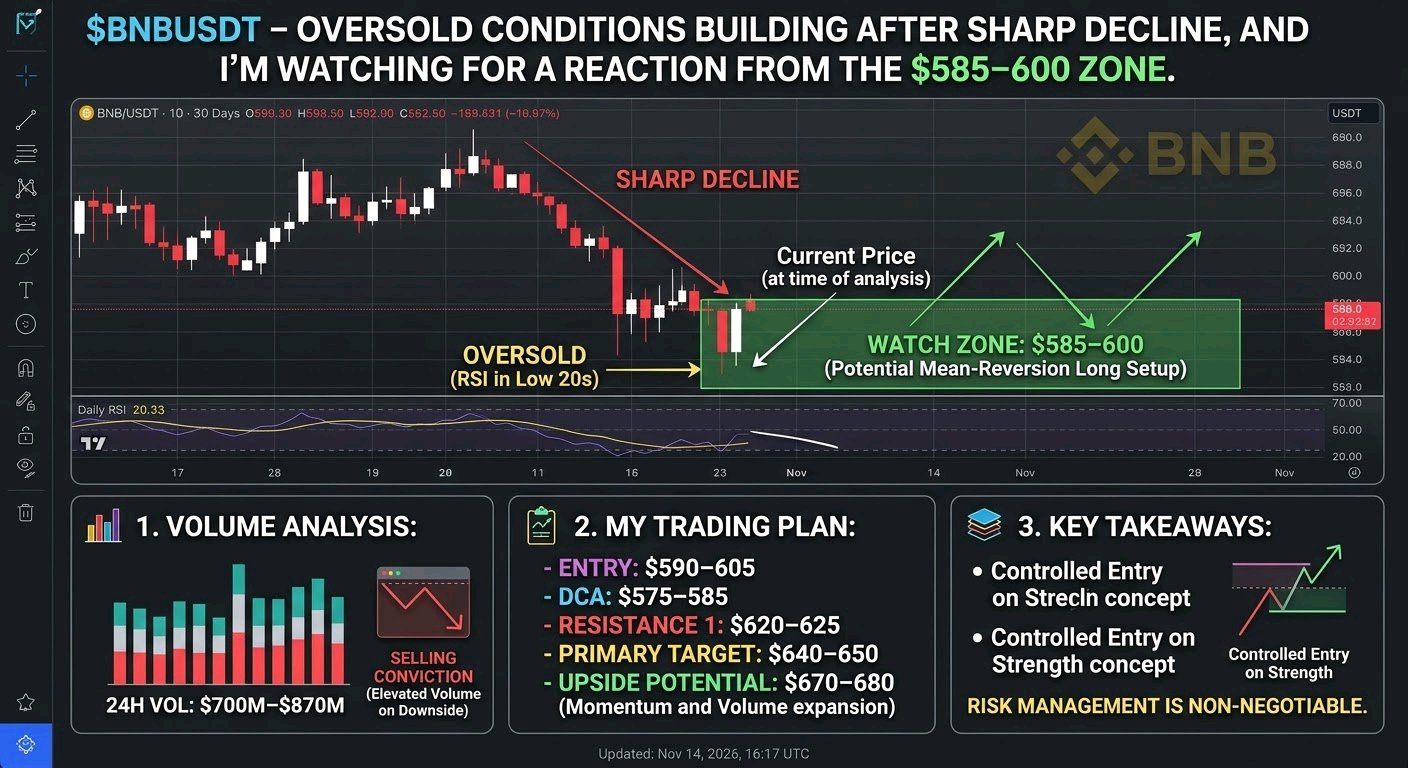
*-$BNBUSDT 在急劇下跌後,超賣情況正在形成,我正在關注 $585–600 區間的反應。** BNB 今天承受明顯壓力,在又一波下跌後,交易價格接近 $595–615 區域。整體市場表現疲軟,BNB 在下行過程中充分參與,並未表現出相對強勢。在日線圖和 4 小時圖上,結構依然看跌——高點降低、低點降低,價格遠低於關鍵移動平均線,動能指標也依然向下。值得注意的是,這波拋售已經變得相當過度。 日線 RSI 處於深度超賣區域(20 多),多個震盪指標也發出類似訊號。價格在 620 多至 630 多區間中段遭遇拒絕,目前正在測試近期區間的下緣。$600–605 區域已成為短期樞紐;若持續跌破此位,將開啟通往下一需求區間的路徑。 ## 成交量分析 各大交易對的 24 小時成交量維持在 $700M–$870M 的高位。拋售伴隨著有意義的參與,而非安靜地緩慢下跌。下行時的高成交量證實了賣方目前的確信,但也意味著任何真正的反轉嘗試都需要類似或更高的成交量才具備可信度。在這種環境下,安靜的反彈往往會迅速失敗。 ### 我的交易計畫 我將此視為潛在的均值回歸設置,而非趨勢跟隨的長線操作。 - **初始入場區間**:$590–605 —— 觀察價格是否能在這裡穩定並顯示出一些吸籌跡象。 - **首選 DCA(定期定額)水平**:$575–585 —— 如果當前區間失敗,我們可能會進一步跌入更強的歷史需求區。 - **第一阻力位**:$620–625 —— 近期的波動區和最近的上檔供應區。若能乾淨俐落地收復並企穩於此之上,將是第一個積極訊號。 - **主要目標價**:$640–650 —— 之前的盤整區,也是任何緩解性反彈中獲利了結的合理區域。 - **額外上漲潛力**:如果反彈時動能和成交量擴大,目標為 $670–680。 在加大倉位之前,我會等待明確的價格行為確認(出現較高低點、收復短期結構位,或反彈時伴隨成交量激增)。盲目追漲殺跌並非此處的策略。 ### 可能出現的問題? 下行風險是真實存在的。如果 $585–590 無法在成交量配合下守住,下一個有意義的支撐位會更低,且超賣狀況的持續時間可能會超出大多數人的預期。決定性的破位將使反彈論點失效,並保持看跌結構不變。大盤疲軟或持續的避險資金流將加速這種情況。在這種環境下,倉位管理和明確的止損水平是不可妥協的。 ### 我的觀點 BNB 現在很有意思,正是因為拋售看起來已經過度。主流幣在具有穩健底層應用價值的情況下出現超賣,通常會產生可交易的反應,即使是在較大的下跌趨勢中。我並非斷言這就是大底——較大時間週期的結構仍然看跌——但在當前需求區進行戰術性做多的風險回報比,開始看起來比幾天前更加平衡了。 我正在監控買方是否會在 $590–600 附近堅決介入,以及成交量是否證實了任何上漲嘗試。反彈失敗並持續出現較低的高點,會讓我保持觀望,或者在阻力位測試時尋找做空機會。目前,我最感興趣的策略是在這些水平上,配合嚴格的風險管理,進行受控的進場操作。 保持紀律。市場很快就會告訴我們,這究竟只是下跌趨勢中的又一次暫停,還是一波有意義的反彈行情的開始。 $HYPEUSDT #IMPACTbyTrade
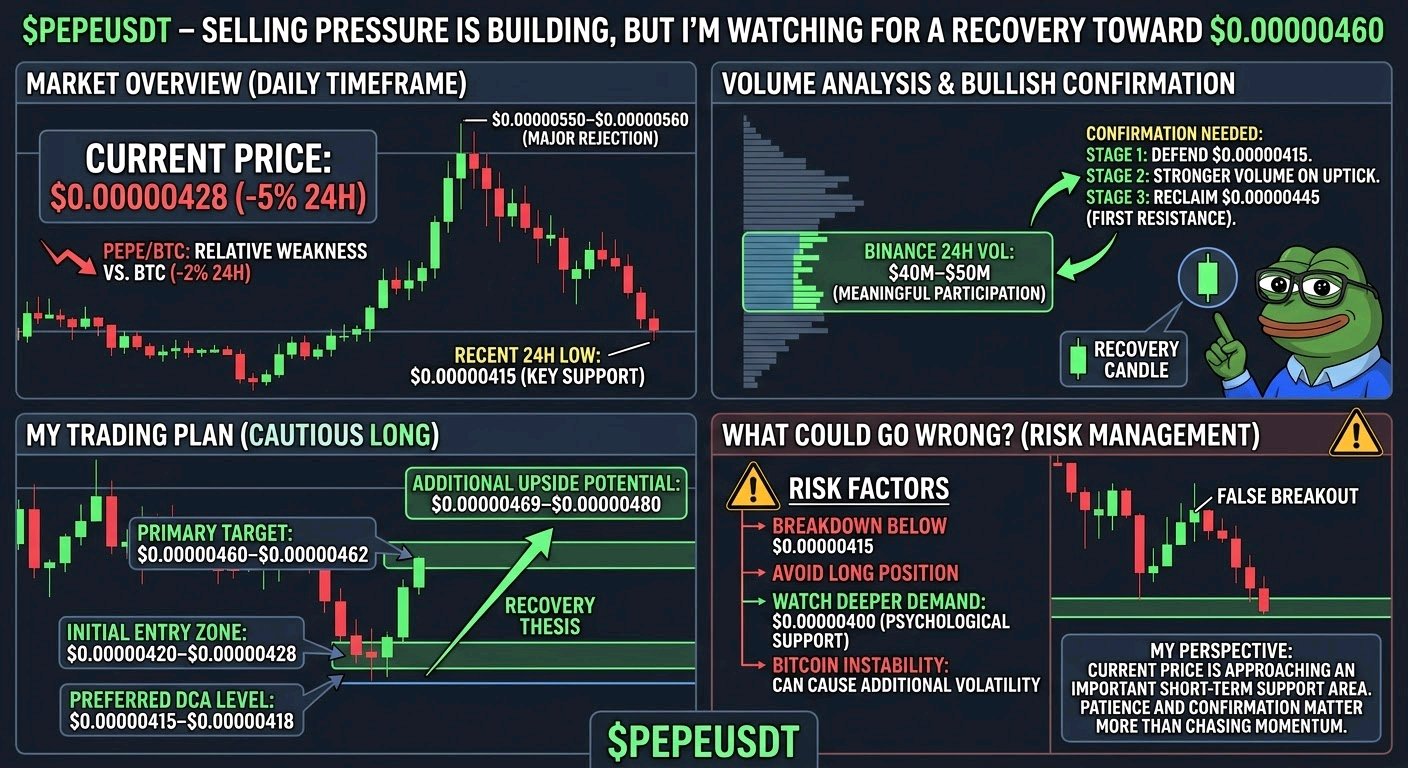
$PEPEUSDT – 拋售壓力正在累積,但我正觀察是否會回升至 $0.00000460 市場概況 PEPE 面臨顯著的拋售壓力,目前交易價格約在 $0.00000428,過去 24 小時內下跌約 5%。 與同期下跌約 2% 的比特幣相比,PEPE 表現出相對弱勢。這告訴我買方尚未展現足夠的力量來引領復甦。 在日線圖上,隨著 $0.00000550–$0.00000560 附近的受阻,近期結構仍處於壓力之下。 我現在正觀察 PEPE 是否能在近期低點上方建立穩固的基礎,或者賣方是否會將其推向另一個需求區。 成交量分析 根據近期的市場快照,Binance 上 PEPE/USDT 的 24 小時交易量約為 $4,000 萬至 $5,000 萬美元。 這證實了下跌期間有顯著的交易參與。然而,單憑交易量並不能證實累積的情況。 在將此走勢視為確認的看漲反轉之前,我希望看到買方以更強的成交量介入,並出現令人信服的復甦蠟燭圖。 我的交易計劃 我對謹慎的多頭倉位感興趣,但在拋售壓力依然活躍時,我不想盲目追高。 - 初始進場區:$0.00000420–$0.00000428 - 首選 DCA(平均成本法)水準:$0.00000415–$0.00000418 - 第一阻力位:$0.00000445 - 主要目標:$0.00000460–$0.00000462 - 額外上行潛力:$0.00000469–$0.00000480 $0.00000415 區域特別重要,因為它代表了近期 24 小時的低點。 為了確認看漲,我希望看到 PEPE 守住該區域,收復 $0.00000445,並將買壓維持在該水準之上。 成功的突破可能會開啟通往 $0.00000460–$0.00000469 阻力區間的道路。 可能會出錯的地方? 最大的風險是再次受阻並跌破 $0.00000415。 如果發生這種情況,我將避免強行建立多頭部位,並觀察心理關卡 $0.00000400 附近是否存在更深的需求。 若持續跌破該區域,將會削弱復甦的論點,並可能使 PEPE 面臨進一步下行的風險。 我也希望看到比特幣趨於穩定。如果大盤拋售持續,像 PEPE 這樣的迷因幣可能會經歷額外的波動。 我的觀點 我正在密切關注 PEPE,因為當前價格正接近一個重要的短期支撐區。 近期的下跌創造了一個有趣的潛在復甦機會,但我認為看漲反轉尚未得到確認。 我的計劃是觀察價格在 $0.00000415–$0.00000428 附近的反應。 如果買方守住該區域並收復附近的阻力位,我預計可能會回升至 $0.00000460,甚至可能達到 $0.00000480。 就目前而言,耐心和確認信號比追逐勢頭更重要。 我正密切關注支撐位的反應。下一個強勁的走勢將取決於買方是否最終能掌控局面。 #IMPACTbyTrade
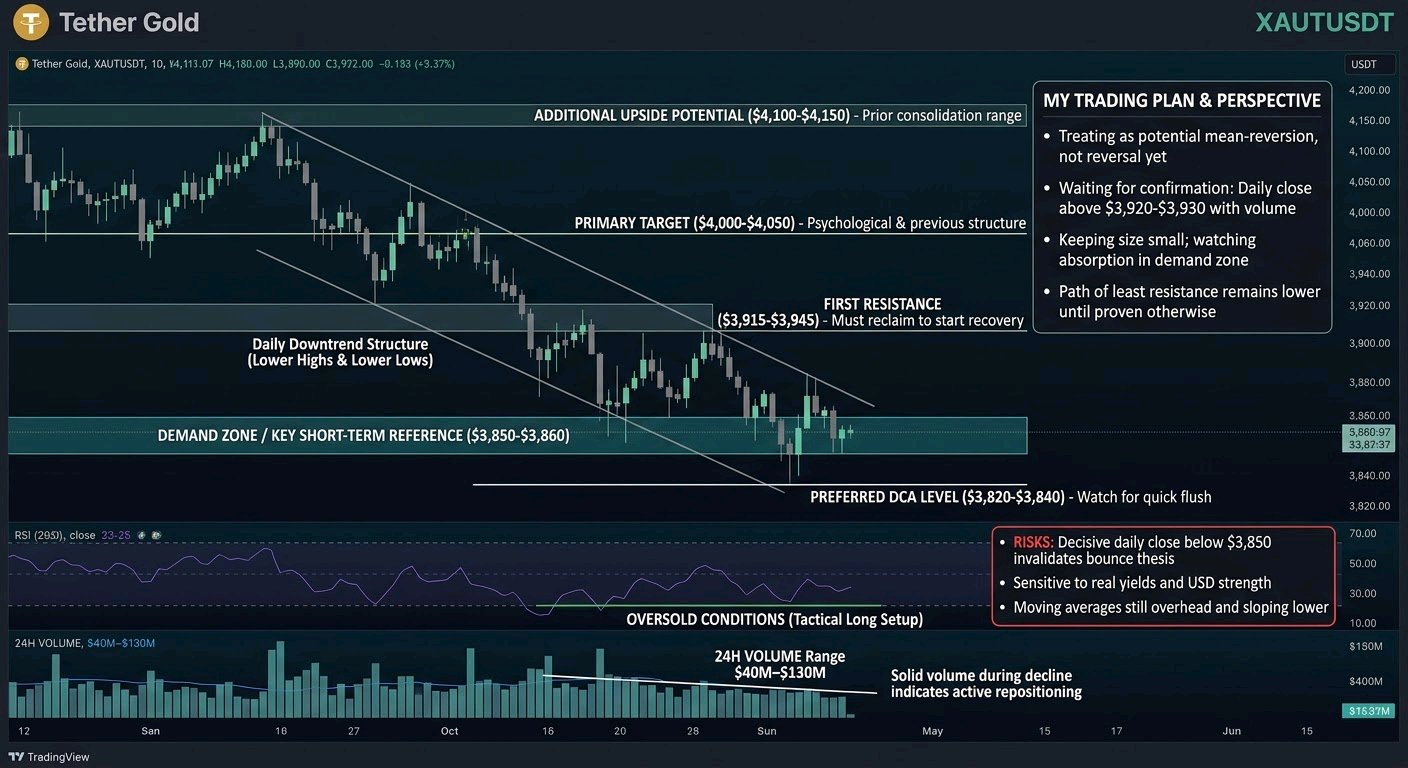
- $XAUTUSDT 守在近期低點附近,且拋售後我正在觀察這個需求區的表現。** Tether Gold 目前在 $3,860–$3,870 附近交易,經歷了明顯的多週下跌。雖然整體加密貨幣市場表現分歧,但 XAUT 顯得相對疲弱,過去一週下跌約 4.8%,仍遠低於本月初所在的 $4,000–$4,100 區間。在日線圖上,結構仍為高點與低點持續下移的下降趨勢,價格目前正測試標誌著近期波段低點的 $3,850–$3,860 區域。 該區域是關鍵的短期參考點。在此處穩守並反彈將是拋售後的第一個正面訊號。若未能守住,則將打開進一步下跌的空間。 # 成交量分析 現貨市場的 24 小時成交量在 $40M–$130M 範圍內表現穩健(計入期貨則更高)。參與度並未崩潰,這意味著下跌走勢是真實的,而非低流動性下的緩跌。下跌過程中的成交量放大通常意味著市場仍在積極進行重新佈局。除非我們看到價格在收復高位時伴隨成交量放大,否則我將保持謹慎的偏向。 ## 我的交易計畫 我將其視為超賣狀態下(日線 RSI 約 33–35)的潛在均值回歸設置,而非具備高信念的趨勢反轉。 - **初始進場區:$3,855–$3,870** 當前價格走勢正在測試此需求區。我對市場出現買盤吸收跡象(留下影線、小週期形成更高低點)時的控倉進場感興趣。 - **首選定投(DCA)區間:$3,820–$3,840** 如果低點被快速殺盤擊穿,這就是我考慮加倉的位置,前提是整體黃金市場沒有出現劇烈破位。 - **第一阻力位:$3,915–$3,945** 這是最接近的供應區,也是在任何有意義的反彈敘事開始前,需要收復並站穩的區域。 - **主要目標價:$4,000–$4,050** 整數心理關卡及之前的結構位。價格重回此區域將確認短期買家正積極進場。 - **進一步上漲空間:$4,100–$4,150** 僅在突破 $4,000 後動能與成交量雙雙放大時才考慮。這將使價格回到之前的盤整區間。 我的確認標準是日線收盤價回到 $3,920–$3,930 以上且伴隨成交量上升。若未達成,我將保持小倉位。 ### 可能出現的問題? 有效跌破並日線收盤低於 $3,850 將使短期反彈論點失效,並可能指向更下方的結構性需求區。黃金本身對實質利率和美元強勢仍然敏感,因此任何風險規避情緒或美元走強都可能進一步對 XAUT 造成壓力。日線趨勢仍然向下,RSI 雖然超賣但仍可能維持在超賣區,且移動平均線(20/50)仍在上方並向下傾斜。若此處失守,將僅僅是延續既有結構。 ### 我的觀點 XAUT 此刻之所以引人注目,恰恰是因為它在短期圖表上過度下跌,同時又追蹤實體黃金。$3,850–$3,860 區間是最明確的近期決策點。我正在觀察它是否會伴隨成交量出現穩健反彈,或是跌破並迫使市場進行更深度的重測。除非另有證明,否則持續下跌仍是阻力最小的路徑,但超賣讀數與近期低點的接近,使得從這裡進行戰術性做多值得以嚴格的風險管理來觀察。 我會保持耐心並嚴格控倉。未來幾天的日線收盤價將告訴我們,買家是否準備好防守,或者阻力最小的路徑是否仍然向下。 #IMPACTbyTrade
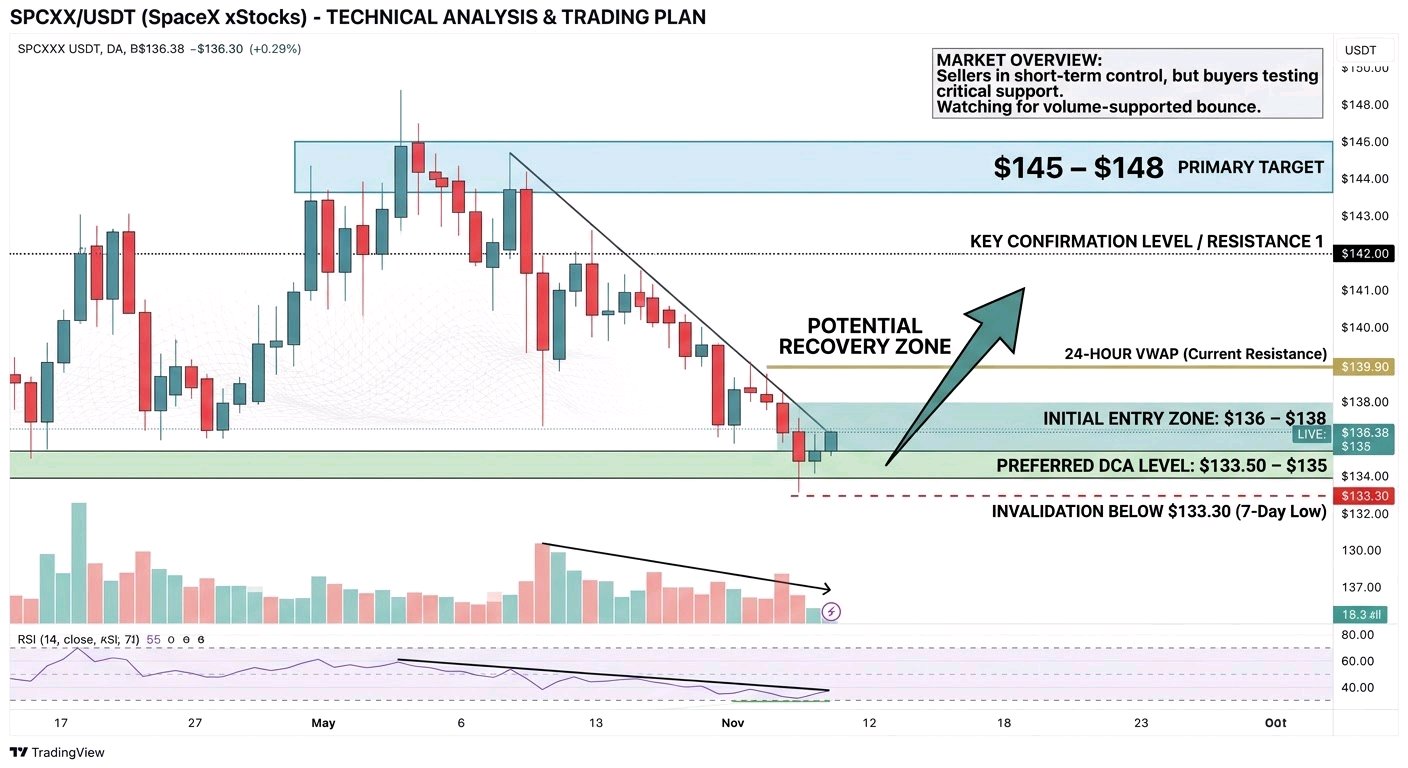
$SPCXXUSDT – SELLING PRESSURE IS TESTING KEY SUPPORT, AND I'M WATCHING FOR A RECOVERY TOWARD $142–$148. Market Overview I'm keeping a close eye on SPCXXUSDT because its recent price action is showing an important battle between buyers and sellers. SPCXX, which represents tokenized SpaceX equity through the xStocks framework, is currently trading around $136.38 based on the latest available market snapshot. Over the last 24 hours, price has declined approximately 3.20%, while the broader 7-day performance remains slightly positive at around 1%. The recent trading range is between $135.98 and $141.42. This tells me that sellers currently have short-term control, but buyers are approaching an important support area. I'm particularly interested in how price reacts around the $136 zone before considering a stronger directional move. Volume Analysis SPCXX has recorded approximately $5.64 million in 24-hour trading volume, representing a decline of around 10.10% compared with the previous day. This reduction in volume is worth monitoring. The current decline is not accompanied by increasing overall trading participation, which means I want to see stronger buying activity before treating this move as a confirmed bullish reversal. For me, a recovery supported by increasing volume would provide a much stronger indication that buyers are returning. My Trading Plan I'm approaching this setup with patience rather than chasing price after the recent decline. Initial Entry Zone: $136–$138 Preferred DCA Level: $133.50–$135 First Resistance: $139.90–$142 Primary Target: $145–$148 Additional Upside Potential: $150–$155, if buyers reclaim resistance with convincing volume. The $139.90 area is particularly important because it represents the reported 24-hour VWAP region. A sustained move above this area could improve short-term momentum. My preferred confirmation would be a strong recovery above $142, followed by a successful retest of that level as support. What Could Go Wrong? The biggest risk is that sellers continue controlling the market and push price below the $136 support area. If that happens, I would watch the $133–$135 region for the next potential demand reaction. A sustained breakdown below the recent 7-day low around $133.30 would significantly weaken my recovery outlook. I don't want to average down blindly if market structure continues deteriorating. Protecting capital is more important than forcing an entry. My Perspective What makes SPCXX interesting right now is the combination of its recent price correction, relatively strong weekly performance, and the important support zone currently being tested. I'm not calling this a confirmed bullish reversal yet. My expectation is that SPCXX could attempt a recovery toward $140–$142 if buyers defend the current area and trading participation improves. A convincing breakout could then open the way toward $145–$148. For now, I'm watching the $136 support zone closely. I would rather wait for confirmation than enter without a clear signal. Patience, volume confirmation, and disciplined risk management will determine my next move. #ByXIMPACT
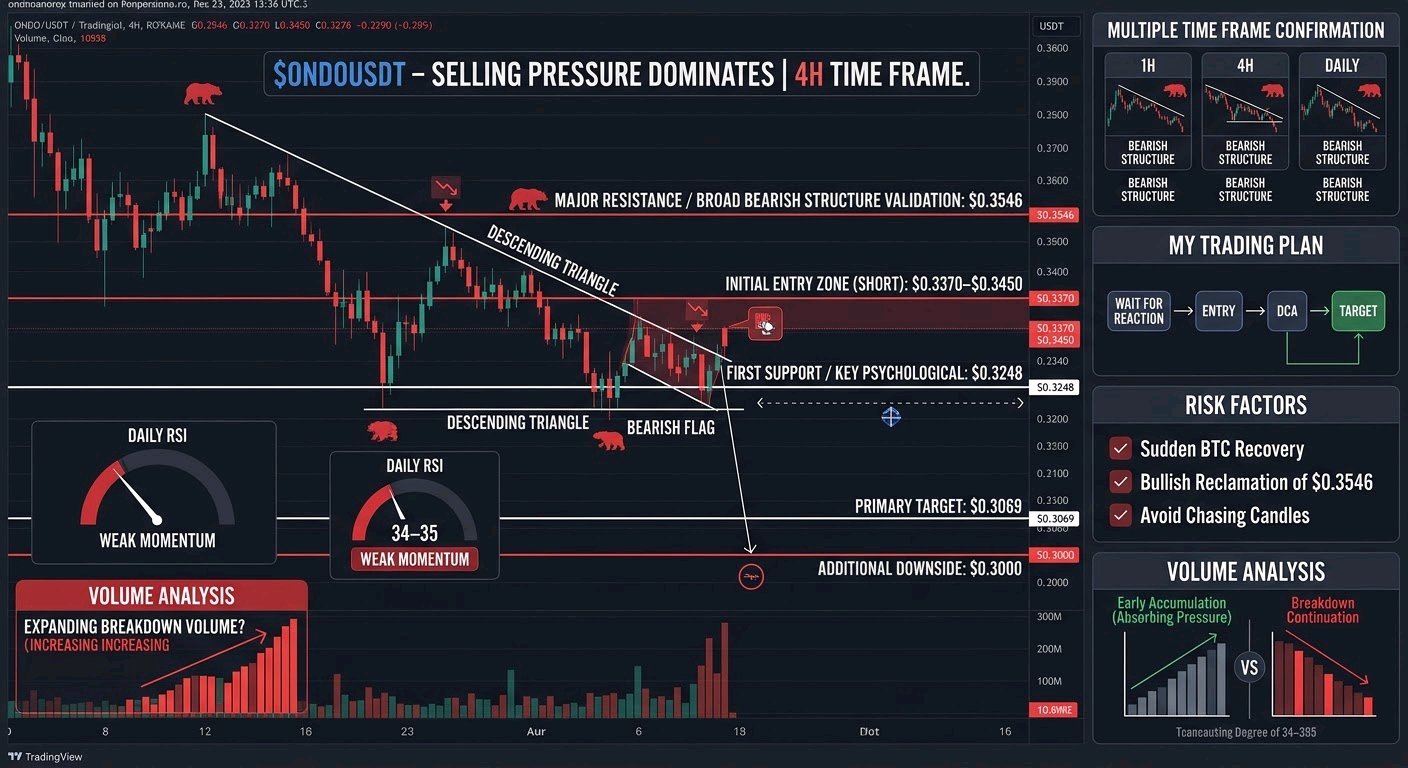
$ONDOUSDT – SELLING PRESSURE IS STILL DOMINATING, AND I'M WATCHING $0.3248 AS THE NEXT IMPORTANT LEVEL. I'm keeping a close eye on ONDO because its recent price action suggests that buyers are still struggling to regain control. The market is trading around $0.332, and the broader technical structure remains under pressure. Market Overview ONDO has been making lower highs, showing that sellers are maintaining control on the 1H, 4H, and daily timeframes. The price is trading below important trend-recovery levels, and the daily RSI is around 34–35, indicating weak momentum. One level I'm particularly interested in is $0.3372. A sustained recovery above this area could provide the first indication that buyers are returning. However, until ONDO reclaims the $0.3546 resistance zone, I don't consider the broader bearish structure invalidated. Volume Analysis Reported aggregated 24-hour trading volume is approximately $106 million, although volume figures can differ between exchanges and data providers. I'm watching whether selling volume starts declining near support. If buyers begin absorbing sell pressure while trading activity increases, that could indicate early accumulation. On the other hand, expanding volume during a breakdown would increase the possibility of further downside. My Trading Plan I'm not interested in chasing price at current levels. I'd rather wait for a meaningful reaction around resistance before considering an entry. Initial Entry Zone (Short): $0.3370–$0.3450 Preferred DCA Level: $0.3540–$0.3595, only if price shows a clear rejection. First Support: $0.3248 Primary Target: $0.3069 Additional Downside Potential: $0.3000 For a bullish recovery, I want to see ONDO reclaim $0.3546 with convincing volume. If that happens, the next upside areas I'm monitoring are $0.3752 and $0.3958. What Could Go Wrong? The biggest risk for bearish positions is a strong recovery above $0.3546. If ONDO reclaims this level and maintains acceptance above it, selling pressure could weaken considerably. On the downside, $0.3248 is an important support area. A decisive breakdown could expose $0.3069, followed by the psychological $0.3000 zone. I'm also keeping the broader market in consideration because a sudden Bitcoin recovery could change ONDO's short-term direction. I would avoid adding to a losing position without fresh confirmation. My Perspective ONDO remains interesting, but I don't see enough confirmation to call this a bullish reversal yet. The current structure favors caution, with sellers holding the advantage across multiple timeframes. My focus is on the reaction around $0.3248 and whether buyers can reclaim $0.3372. If support breaks with increasing selling pressure, I expect the market to explore lower demand areas. If buyers reclaim $0.3546 with strong participation, I'll reconsider the bearish outlook. For now, patience and confirmation matter more than trying to predict the exact bottom. I'm watching the levels, not chasing the candles. #IMPACTbyTrade
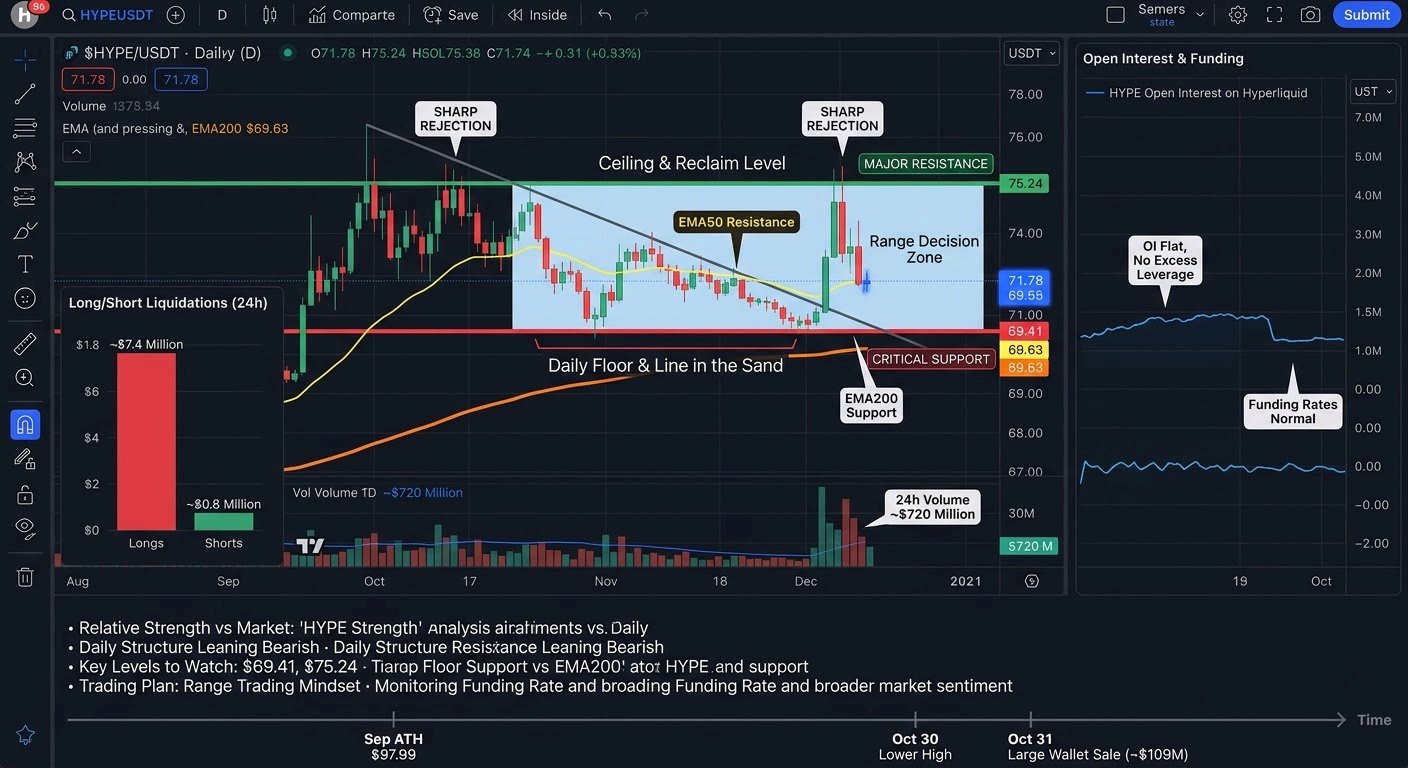
* $HYPEUSDT 在經歷了又一輪壓力後,目前在 68–71 美元區間附近交易,較 9 月約 98 美元的歷史高點 (ATH) 下跌了約 28%。整體市場表現疲軟,比特幣也面臨壓力,但 HYPE 相對於其體量而言,仍持續吸引大量參與。在我密切關注的日線和 4 小時圖上,價格在明顯的短期下跌趨勢中持續走低,同時仍維持在 10 月回調期間形成的某些較深層結構水平之上。最近的波動範圍大約在 67–75 美元,且多次測試下限。 # 成交量分析 24 小時成交量依然處於高位,在各大主要來源中頻繁顯示在 10 億至 12 億美元之間。對於一種前十大資產來說,這樣的週轉率相當可觀,顯示出積極的雙向興趣,而非純粹的冷清。下跌期間成交量升高,暗示賣方仍然存在,但也為買方在支撐位介入時所需的更劇烈反彈創造了流動性。一旦某個水平最終守住或乾脆突破,持續的高參與度往往會預示著更大的方向性走勢。 # 我的交易計劃 我將此視為潛在的支撐反應設置,而不是現在追高。 - **初始進場區間**:67–69 美元。這是近期日線低點和短期需求聚集的區域。我有興趣看到買方在更低的時間框架上通過更高的低點在此進行防守。 - **首選 DCA(定期定額)水平**:64–66 美元。如果第一個區間失守,這個更深的口袋與之前的反應區間相吻合,如果日線結構看起來仍然具有建設性,這將改善平均入場成本。 - **第一阻力位**:72–75 美元。收復並站穩在近期盤中高點之上,將是賣方失去控制的第一個跡象。 - **主要目標**:78–82 美元。如果能乾脆地突破並站穩 75 美元上方,將開啟通往本月初可見的下一個供應區間的空間。 - **額外的上漲潛力**:若動能擴大且整體市場趨穩,可達 88–92 美元。該區域包含之前的波段高點,這將代表從當前跌幅中實現更有意義的復甦。 我正在尋找任何反彈時成交量擴大的確認,以及 4 小時圖上從「低點降低/高點降低」轉向「低點抬高」的跡象。如果沒有這些,我會保持耐心。 # 可能出現的問題? 若日線決定性收盤跌破 66–67 美元,將削弱即時的反彈論點,並可能導致價格進一步跌向 60–62 美元的區域,那裡有更強的歷史需求。如果下行過程中成交量持續高企而沒有被吸收,則表明短期趨勢仍牢牢掌握在賣方手中。整體市場疲軟(特別是如果比特幣跌破關鍵水平)也會降低 HYPE 乾脆復甦的機率。在這種情況下,該設置將簡單地失效,我會選擇退場,而不是強行交易。 # 我的觀點 HYPE 仍然是較有趣的市值型代幣之一,原因在於其持續的成交量,以及它先前在擴大漲幅前吸收拋壓的方式。目前的價格走勢是典型的 ATH 後消化階段——沒什麼特別的,但也沒什麼好強求的。目前跡象顯示短期內壓力持續或維持震盪,但高參與度以及接近近期低點的事實,讓我保持對反應的關注。 接下來的幾個交易時段,我會密切監控 67–69 美元的區域。如果在該處有強有力的防守配合成交量改善,將使做多方更具吸引力;若乾脆跌破,我將把重心轉向等待更好的結構。無論哪種方式,水平都很明確,風險也已定義。 $ByXIMPACT
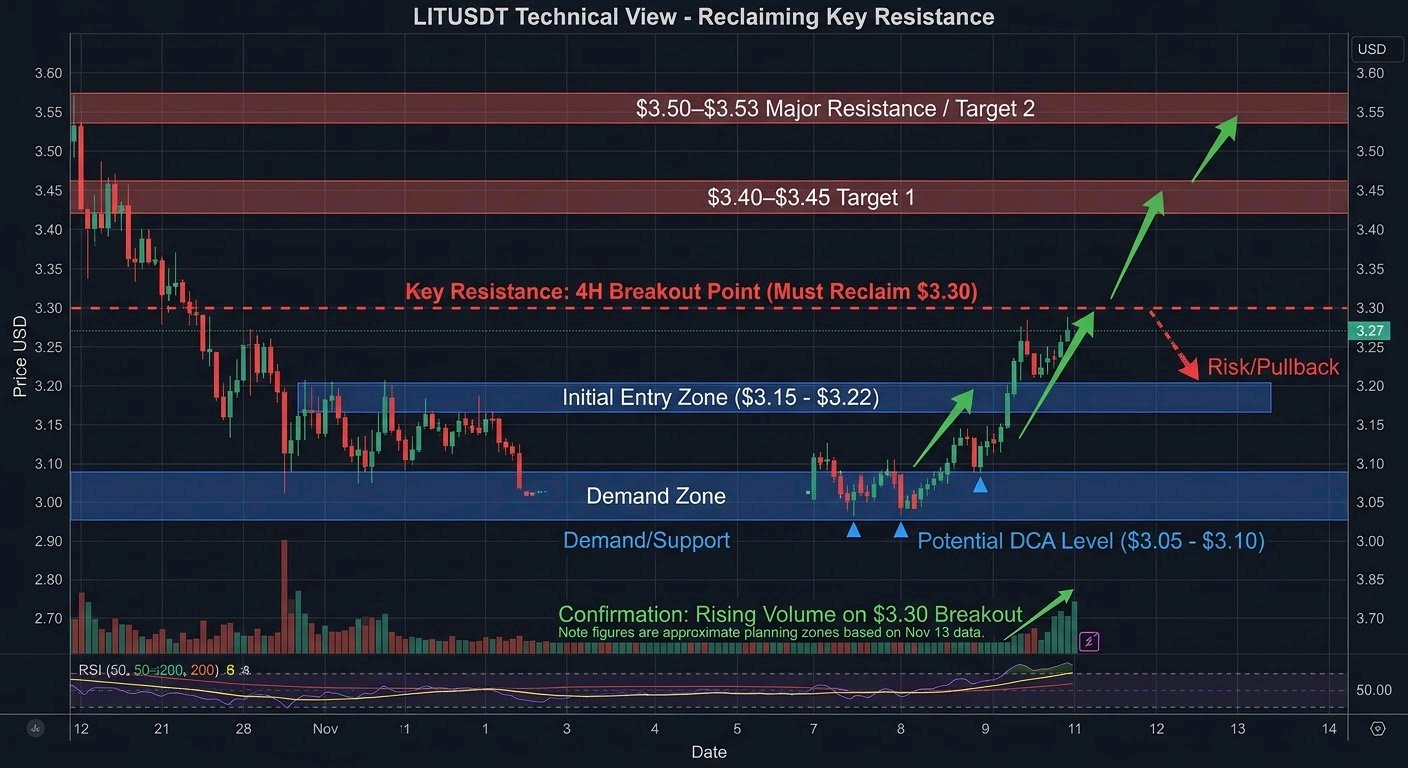
$LITUSDT 買方正在守護 $3.00 區間,我正在觀察是否會向 $3.50+ 突破。 LITUSDT 在經歷了近期的賣壓後顯示出復甦跡象,但我不想將短期的反彈誤認為是趨勢反轉的確認。 我正密切關注 $3.00–$3.10 的需求區。該區域吸引了買盤興趣,而 $3.30 區域仍然是買方需要奪回的重要阻力位。 我的重點在於 LIT 能否建立更強的結構並維持買盤壓力,而不是僅僅再次出現短暫的反彈。 市場概況 近期的價格結構顯示,LIT 在 $3.50 附近經歷了回調,隨後在 $3.00–$3.10 附近找到支撐。 最新市場快照顯示 LIT 的交易價格在 $3.20–$3.27 左右。$3.30 水準是當前的上行阻力,而 $3.40–$3.53 則是下一個重要的阻力區。CoinGlass +2 在日線級別上,近期的下跌表明賣方尚未完全失去控制。不過,從 $3.00 區域出現的復甦值得密切觀察。 我也在觀察 4 小時線的結構,看是否能出現更高的低點 (higher lows) 並持續奪回阻力位。這將為看漲延續提供更有力的證據。 成交量分析 LIT 保持了顯著的衍生品交易活動。 幣安 (Binance) 最新的永續合約快照顯示,24 小時交易量約為 5,164 萬美元,未平倉合約約為 4,437 萬美元。未平倉合約在 24 小時內下降了約 0.74%。CoinGlass 這表明交易參與度仍然活躍,但未平倉合約的下降尚不能確認有激進的新倉位建立。 對我來說,重要的確認訊號將是成交量增加,同時價格持續維持在 $3.30 上方。 我的交易計畫 我以謹慎看漲的態度對待 LIT,同時尊重附近的阻力位。 * 初始進場區間:$3.15–$3.22 * 首選 DCA(分批買入)水準:$3.05–$3.10 * 第一阻力位:$3.30 * 主要目標:$3.40–$3.45 * 額外上行潛力:$3.50–$3.53 我希望看到買方能守住進場區間並確立更高的低點,然後再增加曝險。 如果 4 小時線收盤能有效站穩 $3.30,且有更強的成交量支持,將提高價格向 $3.40 甚至 $3.50 移動的可能性。 # 可能出現的問題? 最大的風險是在 $3.30 附近再次遭到拒絕。 如果買方無法維持動能,LIT 可能會再次測試 $3.15 區域。跌破 $3.05 將削弱復甦結構,並暴露出更深層的 $3.00 需求區。 如果價格持續跌破 $3.00,將使我短期的看漲觀點失效,並表明賣方正在重新獲得控制權。 我寧願等待確認,也不願在沒有足夠買盤壓力的情況下追逐突破。 #我的觀點 LIT 很有趣,因為市場已經對 $3.00 的需求區做出了反應。 我還不能稱這為已確認的看漲反轉。我希望看到更強的成交量、更健康的 4 小時結構,以及成功奪回 $3.30。 我首選的劇本是盤整後向 $3.40–$3.50 突破。 目前,我正密切關注 $3.15–$3.30 的區間。下一個突破此區間的決定性走勢可能會提供更明確的交易機會。 我的策略很簡單:尊重需求區,等待確認,讓價格走勢決定下一步。 市場數據說明:數據基於 2026 年 11 月 13 日的最新可用快照,而非 11 月 14 日的即時確認報價。這些水準為大約的技術規劃區間,而非保證的執行價格。 #ByXIMPACT
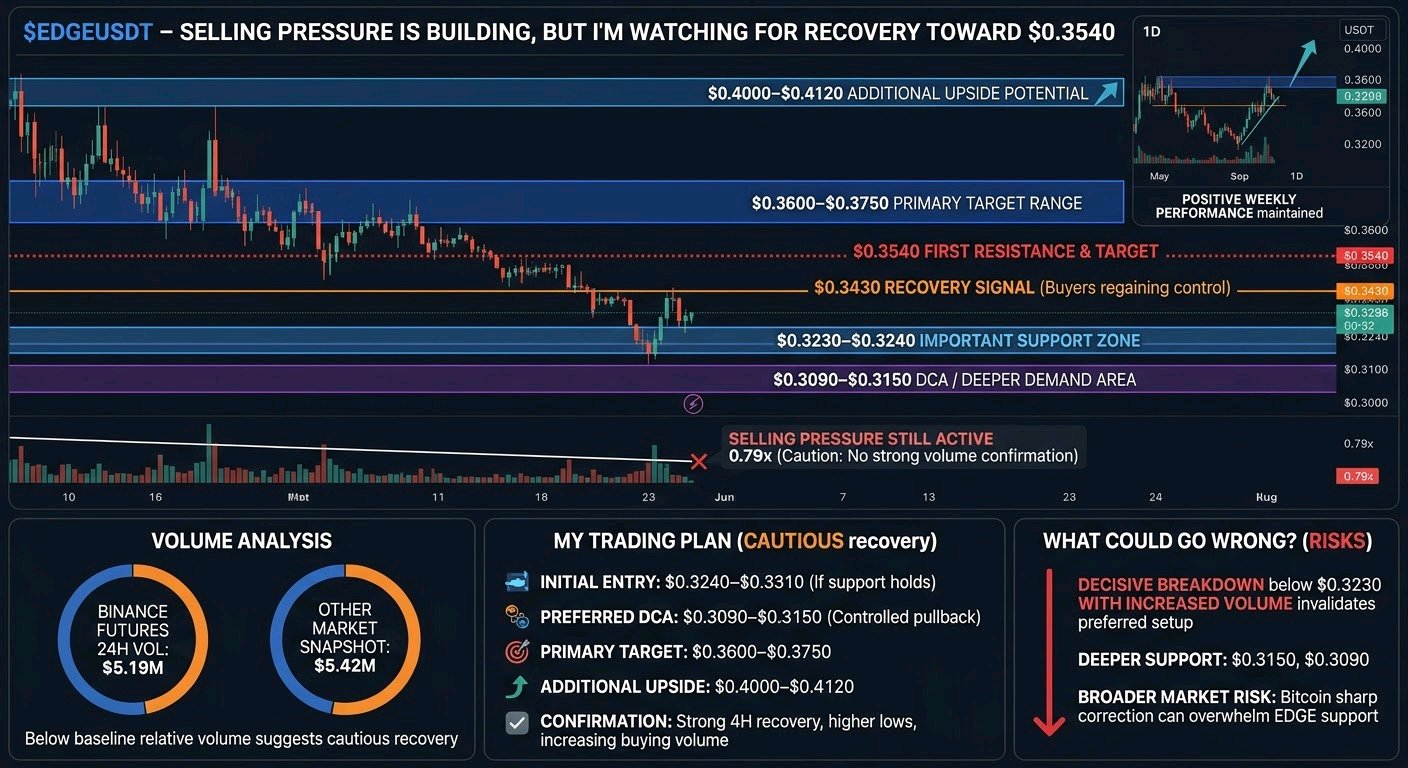
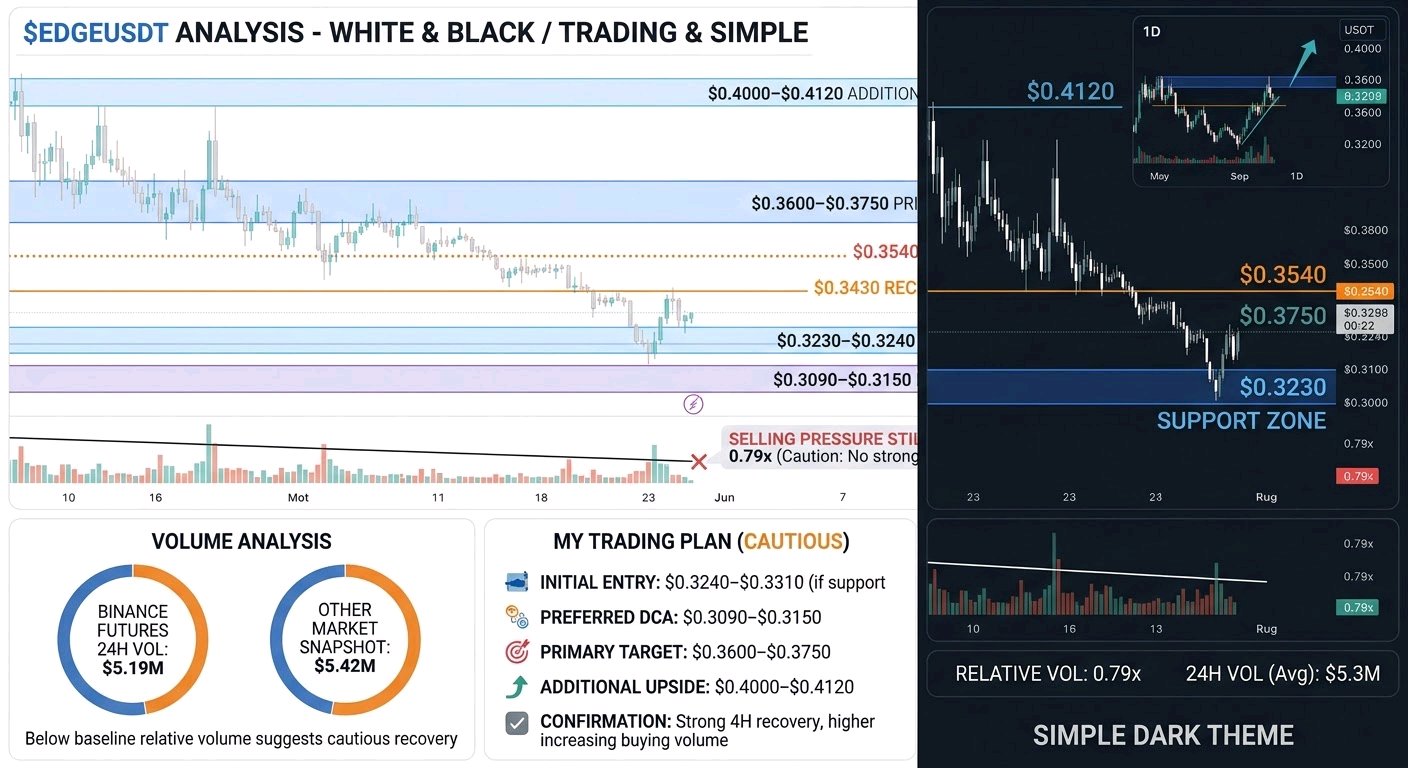
$EDGEUSDT – SELLING PRESSURE IS BUILDING, BUT I'M WATCHING FOR A RECOVERY TOWARD $0.3540 Market Overview EDGE is showing mixed price action. The broader short-term structure remains under pressure, even though the coin has maintained a positive weekly performance. The available November 13 market snapshot places EDGE around $0.3361–$0.3279, with a 24-hour decline of approximately 3–4%. I'm paying particular attention to the 4H and 1D timeframes. The recent pullback suggests sellers are still active, but the $0.3230–$0.3240 area is an important support zone to watch. A recovery above $0.3430 would be an early sign that buyers are regaining control. Volume Analysis Available Binance Futures data shows approximately $5.19M in 24-hour trading volume, while another market snapshot reports around $5.42M. Relative volume was reported at approximately 0.79x its baseline, suggesting participation was below the usual reference level. This is important because the current recovery does not yet have convincing volume confirmation. I want to see stronger buying activity before treating this pullback as a confirmed bullish reversal. My Trading Plan I'm approaching EDGE with a cautious bullish recovery scenario rather than chasing the price. • Initial Entry Zone: $0.3240–$0.3310, only if support holds and buyers show a clear reaction. • Preferred DCA Level: $0.3090–$0.3150, if the market experiences another controlled pullback. • First Resistance: $0.3430–$0.3540. • Primary Target: $0.3600–$0.3750. • Additional Upside Potential: $0.4000–$0.4120. These are conditional technical zones based on the available market snapshots, not guaranteed execution levels. My confirmation would be a strong 4H recovery, higher lows, and increasing buying volume. Without those signals, I would rather wait than enter aggressively. What Could Go Wrong? The biggest risk is a decisive breakdown below $0.3230. If sellers push through this support with increasing volume, the recovery scenario becomes weaker. In that situation, $0.3150 and the deeper $0.3090 demand area become important levels to monitor. A sustained breakdown below $0.3090 would invalidate my preferred short-term bullish setup and could expose EDGE to further downside. I also don't want to ignore broader market conditions. If Bitcoin experiences another sharp correction, EDGE could struggle to recover even if its own support initially holds. My Perspective EDGE is interesting because its weekly performance has remained positive despite the recent short-term selling pressure. However, I don't consider the current price action a confirmed breakout. I'm watching how price behaves around $0.3230–$0.3310. If buyers defend this region and volume starts increasing, I would expect a recovery attempt toward $0.3430, followed by $0.3540. For now, patience is more important than chasing momentum. I want confirmation from price action and volume before increasing exposure. My focus: Support holding first, volume confirmation second, and then a potential move toward $0.3750. $EDGEUSDT #IMPACTbyTrade
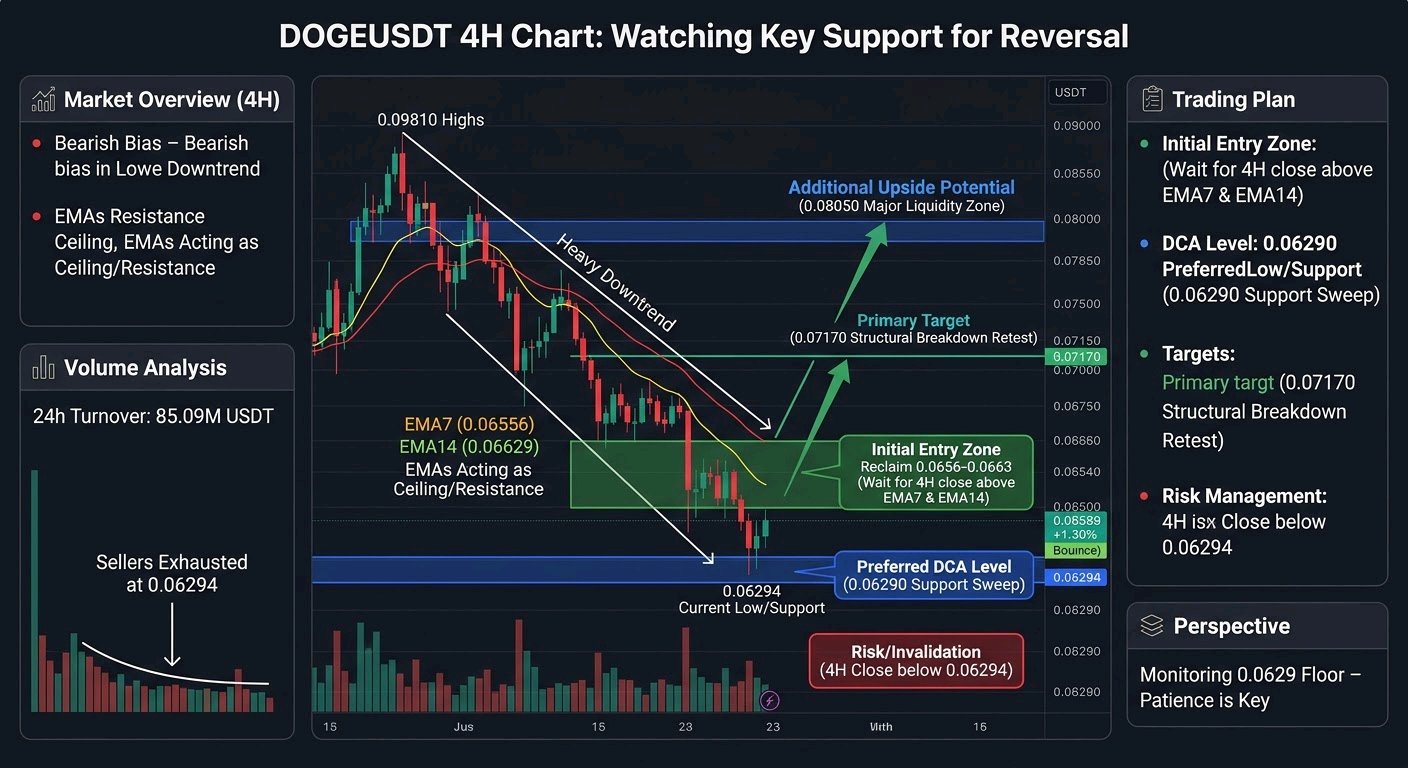
$DOGEUSDT – 看跌壓力持續存在,但我正密切關注此關鍵支撐區的潛在反轉。 B. 市場概覽 觀察 4 小時圖表,狗狗幣 (Dogecoin) 明顯處於強勁的下跌趨勢中。自 0.09810 的高點以來,價格持續走跌,形成了一連串更低的高點和更低的低點。目前,DOGE 徘徊在 0.06589 附近,雖有 24 小時小幅反彈 +1.30%,但整體市場結構仍然非常疲軟。 目前的即時阻力位由 4 小時 EMA 形成,這就像是一個天花板。具體來說,EMA7 在 0.06556,EMA14 在 0.06629,而 EMA28 則位於更高的 0.06762。價格難以在這些動態阻力位上方獲得動能,除非我們看到價格突破並收盤於該 EMA 密集區上方,否則空頭將完全掌控此時間週期。 C. 交易量分析 24 小時成交額為 85.09M USDT,24 小時價格區間在 0.06294 至 0.06665 之間。我密切關注的是目前低點處的成交量表現。我們看到有一些參與者正試圖防守 0.06294 的支撐位,這導致了那根輕微的綠色日線蠟燭出現。然而,這些成交量尚未強勁到足以顯示趨勢發生決定性轉變。與其說買方積極進場,不如說看起來更像是賣方在短期內力竭。 D. 我的交易計劃 鑑於強烈的下跌趨勢,我不會盲目地去接掉下來的刀子。我的計劃是等待短期底部的確認。 · 初始進場區:如果價格收復 EMA7 和 EMA14,大約在 0.0656 至 0.0663 之間,我會有興趣進行投機性做多。4 小時線收盤於此區間上方將標誌著動能的暫時轉變。 · 首選 DCA(平均成本法)水準:如果我們看到價格跌破近期低點,我首選的 DCA 水準就在 0.06290 支撐位附近。 · 第一阻力位:眼前的障礙是 0.06762 的 EMA28。 · 主要目標:如果設定確認,我的第一個實際目標是回測近期結構性破位區,大約在 0.07170 附近。 · 額外的上行潛力:如果整體市場情緒轉為看漲,下一個主要的流動性區域位於 0.08050 附近。 E. 可能出錯的地方? 這仍然是一個看跌的圖表,因此風險管理至關重要。主要風險在於這次小幅反彈只是另一波下跌前的「逃命波」。如果價格未能守住 0.06294 的支撐位,該設定即告失效,我們可能會看到價格快速衝向更深的需求區。4 小時線收盤低於 0.06294 將確認看跌壓倒性優勢延續,屆時我會立即離場,而不是試圖猜測下一個底部。 F. 我的觀點 雖然整體 4 小時結構看起來很糟糕,但我發現 DOGE 在此處很有意思,單純是因為它正處於一個關鍵的流動性水平。近期市場對山寨幣進行了懲罰,DOGE 也不例外。不過,我們看到的小幅反彈表明短期賣方可能正後繼無力。我不期待會出現奇蹟般的 V 型反轉,但如果買方能夠收復這些 EMA,回測 0.07 中段的逃命波是一個非常現實的劇本。目前,我正像老鷹一樣盯著 0.0629 的地板。如果它守住了,我就會尋找我的進場訊號。如果它破位,我就等待。耐心才是這筆交易的關鍵。 #ByXIMPACT
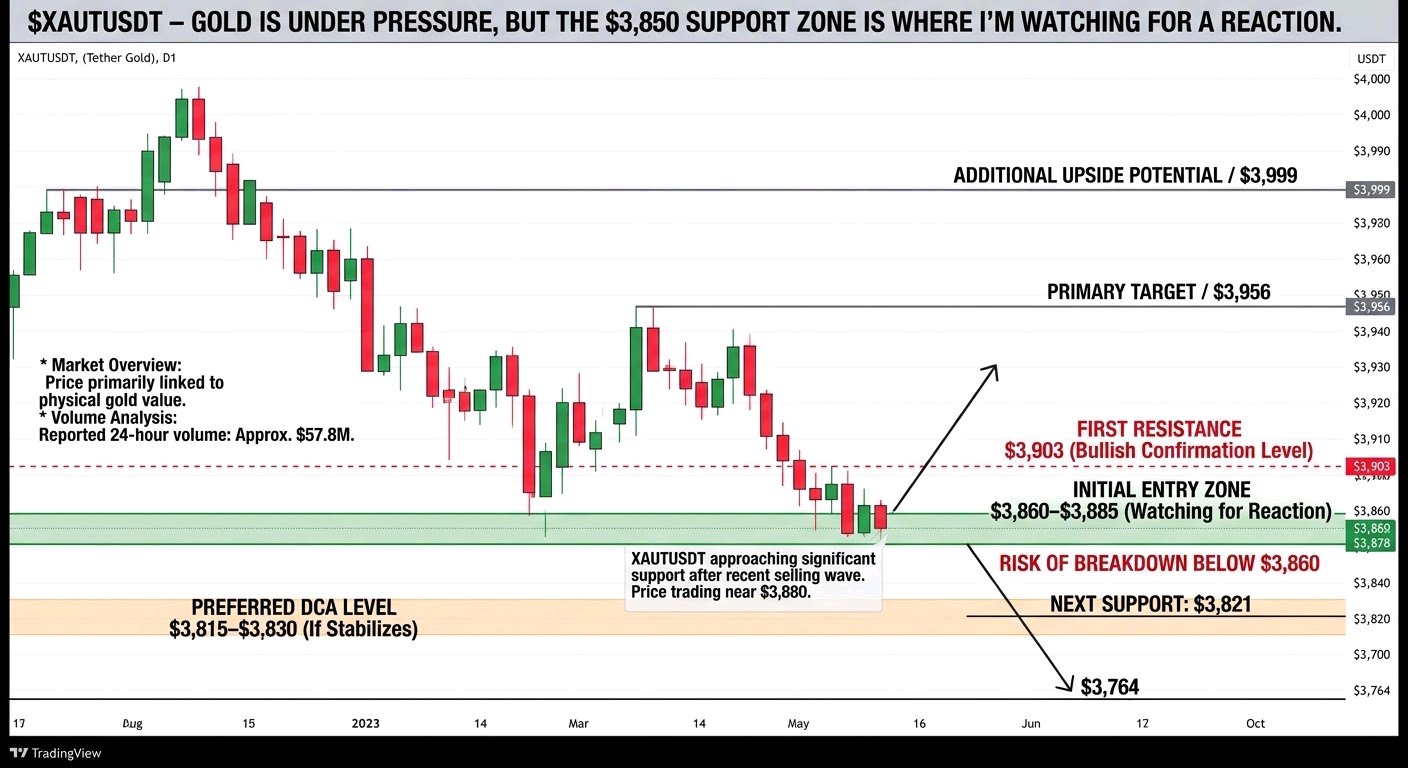
$XAUTUSDT – GOLD IS UNDER PRESSURE, BUT THE $3,850 SUPPORT ZONE IS WHERE I'M WATCHING FOR A REACTION. XAUTUSDT is showing some weakness after another selling wave, with price trading around the $3,880 area. What interests me here is that the market is approaching an important support region after several consecutive sessions of downside pressure. I'm not looking to chase a move in either direction. I want to see how buyers react around the recent lows because that reaction could determine whether XAUT starts recovering or extends its correction. Market Overview XAUT, also known as Tether Gold, is different from most crypto assets because it represents tokenized gold rather than a typical speculative cryptocurrency. Its price is primarily linked to the value of physical gold. The recent market structure is showing weakness. XAUT has declined from the $4,000 area and is now testing the lower part of its recent trading range. The latest available Binance market snapshot shows approximately $3,878, with a 24-hour decline of around 2.15%. Interestingly, Bitcoin also experienced a larger decline over the same reported period. This highlights why I prefer analyzing XAUT through gold-market conditions rather than treating it exactly like a regular altcoin. My attention is on the daily and 4H structure, particularly whether price can reclaim nearby resistance. Volume Analysis The reported 24-hour Binance trading volume is approximately $57.8M. This indicates meaningful market participation, but volume alone doesn't confirm that buyers are taking control. I'm watching for stronger buying activity around support and whether the next recovery attempt can hold its gains. If volume expands during an upward move and price reclaims resistance, that would give me more confidence in a potential recovery. My Trading Plan I'm approaching XAUT with a cautious bullish recovery scenario, but I want confirmation before committing to a position. Initial Entry Zone: $3,860–$3,885 This is the immediate support region I'm watching. I would prefer to see buyers defend the area and establish a bullish reaction before considering an entry. Preferred DCA Level: $3,815–$3,830 This is a deeper support area near the next daily support reference. I would only consider adding if the market stabilizes rather than breaking down aggressively. First Resistance: $3,903 This is the first important recovery level. A sustained move above it would be an encouraging sign that short-term selling pressure is easing. Primary Target: $3,956 If buyers reclaim $3,903, this becomes the next resistance area I'd monitor. Additional Upside Potential: $3,999 A stronger breakout above $3,956 could bring the psychological $4,000 region back into focus. For confirmation, I want to see a solid 4H close above resistance followed by a successful retest. I don't want to mistake a temporary bounce for a confirmed trend reversal. What Could Go Wrong? The biggest risk is that sellers continue controlling the market and push XAUT below its current support region. A sustained breakdown below $3,860 would weaken the immediate recovery setup. If that happens, I'm watching $3,821 as the next important support reference, followed by the $3,764 area. A failure to hold these levels would suggest that the correction still has room to develop. I also want to avoid adding positions simply because the price looks cheaper. Support must produce a reaction, and risk should remain controlled if the market continues lower. My Perspective XAUT is interesting because its current weakness comes at a time when the market is testing an important gold-linked support region. I'm not expecting an immediate recovery without confirmation. The first thing I want to see is buyers defending $3,860 and pushing price back above $3,903. If that happens, $3,956 and eventually $3,999 become reasonable upside areas to monitor. For now, my bias is cautiously bullish only if support holds and buyers regain short-term control. Otherwise, I would rather wait for a better setup than force a trade. My key focus is simple: watch $3,860 for support and $3,903 for confirmation. The next meaningful move will depend on which side takes control of this range. #IMPACTbyTrade $MNTUSDT