TUWALLIYE
3997點贊0分享92粉絲40關注
Technical Analysis and Risk management
Technical Analysis and Risk management
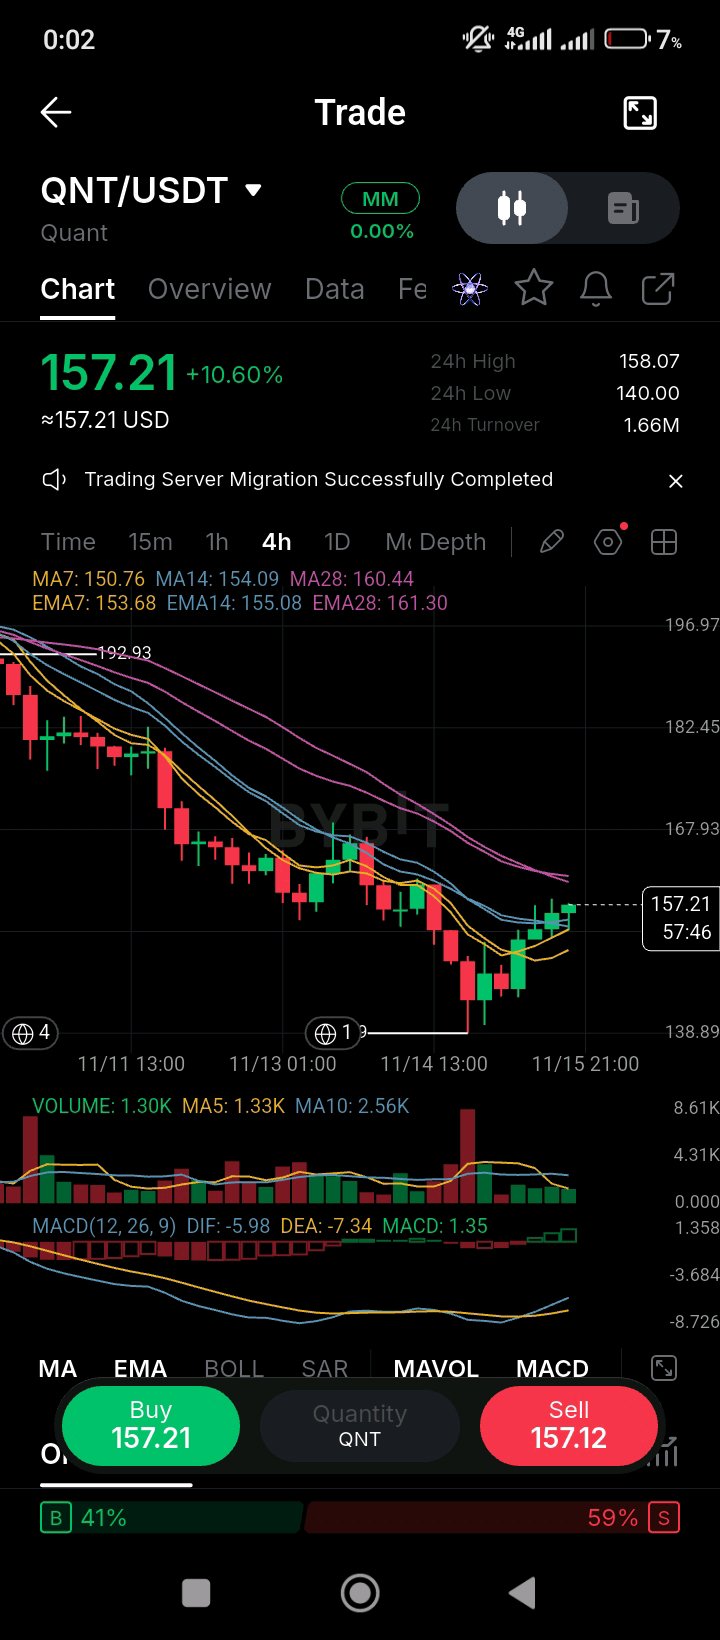
QNT bounced 10.6% off a 140 low today to 157.21, but it's still about 19% below where it traded at the start of the week and the order book is leaning sell. The November 5 move was a market-wide selloff: CoinMarketCap put QNT's 5.7% drop that day at roughly the same size as a 5.2% fall in total crypto market cap, with no Quant-specific news. The same day, COINOTAG reported a 6.9% rally on reports that The Clearing House was moving tokenized-deposit payments onto Quant's network. So the token is still trading on two different stories: the banking adoption that drove September's surge, and the risk appetite that sets the day-to-day moves. The bank pilots haven't been reversed, but they haven't produced steady buying either. On the chart, QNT is up 10.60% to 157.21, with a 24-hour range of 140.00 to 158.07. Price is above the MA7 (150.76), MA14 (154.09) and EMA7 (153.68) and EMA14 (155.08), but still under the MA28 (160.44) and EMA28 (161.30). MACD is positive (1.35), with the DIF (-5.98) crossing above the DEA (-7.34). Volume (1.30K) is roughly level with the MA5 (1.33K) and well below the MA10 (2.56K), so the bounce isn't drawing much buying. The order book is 59% sell-side. The 160.4 to 161.3 MA28 and EMA28 are the level to clear. A close above them on rising volume would bring the 165 area back into view. A loss of 140 would reopen the early-week lows. $QNTUSDT #ByXIMPACT
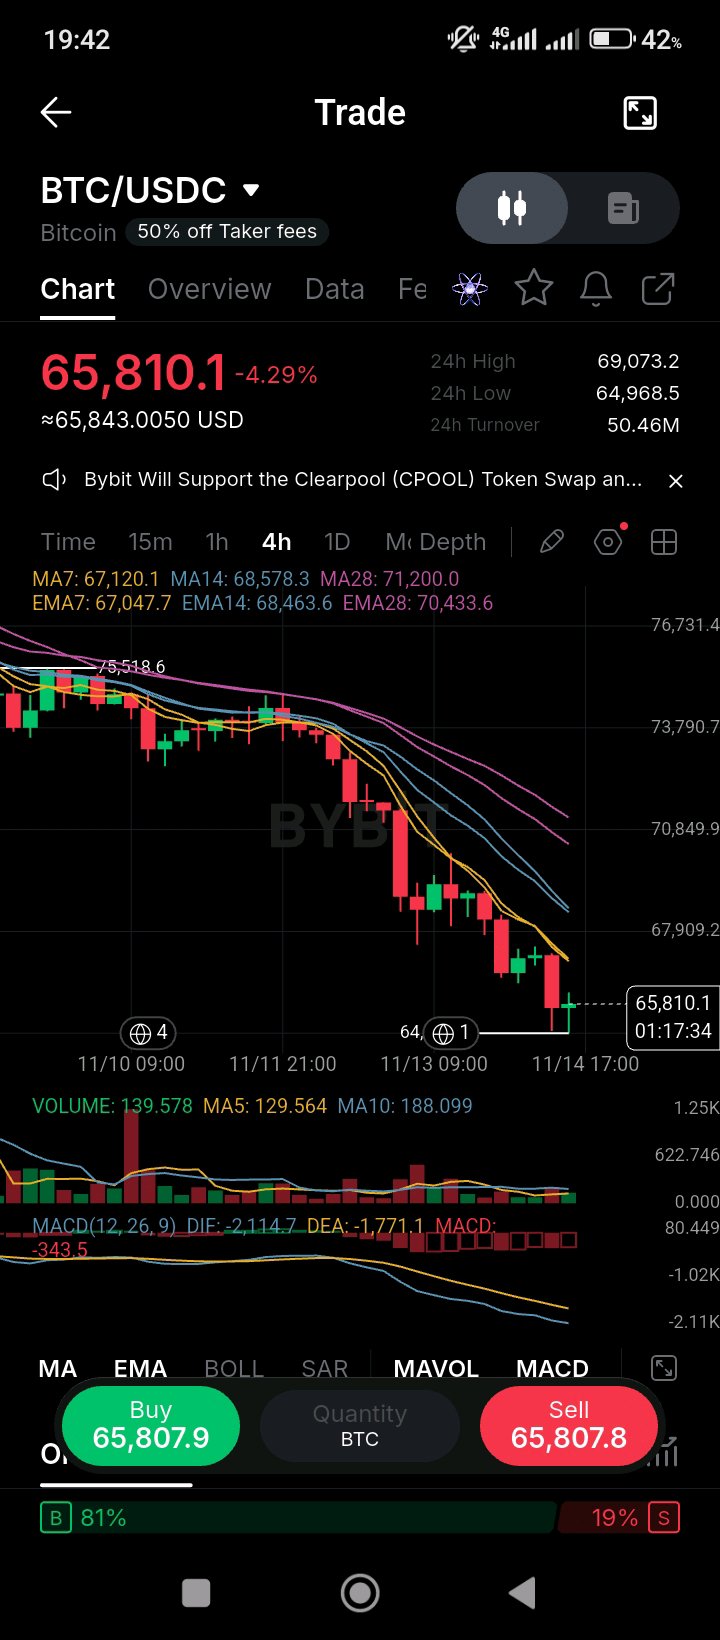
比特幣今日跌破 66,000 美元,在一小時內有 2.15 億美元的槓桿部位遭到清算,這顯示走勢已進入強制拋售的範疇。 11 月 9 日,比特幣自 9 月以來首次收於 50 週移動平均線(約 75,488 美元)下方,且 24 小時內有超過 10 億美元的加密貨幣多頭部位遭到清算。今日的走勢延續了這一跌勢:據 24/7 Wall St 報導,比特幣在美東時間上午 9:56 左右跌破 66,000 美元,同時間以太幣也跌破 1,850 美元。現貨 ETF 的資金流向是另一關鍵因素。據 The Block 報導,11 月 9 日前後出現大量資金外流,這消除了支撐夏季漲勢的機構買盤。我目前無法核實今日拋售的單一觸發因素,因此不將其歸咎於特定事件。 從圖表來看,BTC 下跌 4.29% 至 65,810.1,24 小時價格區間為 64,968.5 至 69,073.2。價格低於圖表中顯示的所有移動平均線:MA7 (67,120.1)、MA14 (68,578.3) 和 MA28 (71,200.0),以及 EMA7 (67,047.7)、EMA14 (68,463.6) 和 EMA28 (70,433.6)。MACD 指標呈深度負值(DIF 為 -2,114.7,低於 DEA 的 -1,771.1),柱狀圖為 -343.5 且仍在擴大。成交量 (139.578) 高於 MA5 (129.564) 但低於 MA10 (188.099),這意味著這波跌勢是由清算而非廣泛參與所推動的。訂單簿顯示買盤掛單佔 81%,這與目前的 K 線走勢不符。 64,968 的低點是目前最關鍵的水平。若跌破該價位,將開啟通往分析師先前標示的 60,000 美元區域之路。若能重新站上 67,050 的 EMA7 和 68,460 的 EMA14,將是清算浪潮結束的首個跡象。 $BTCUSDT #ByXIMPACT
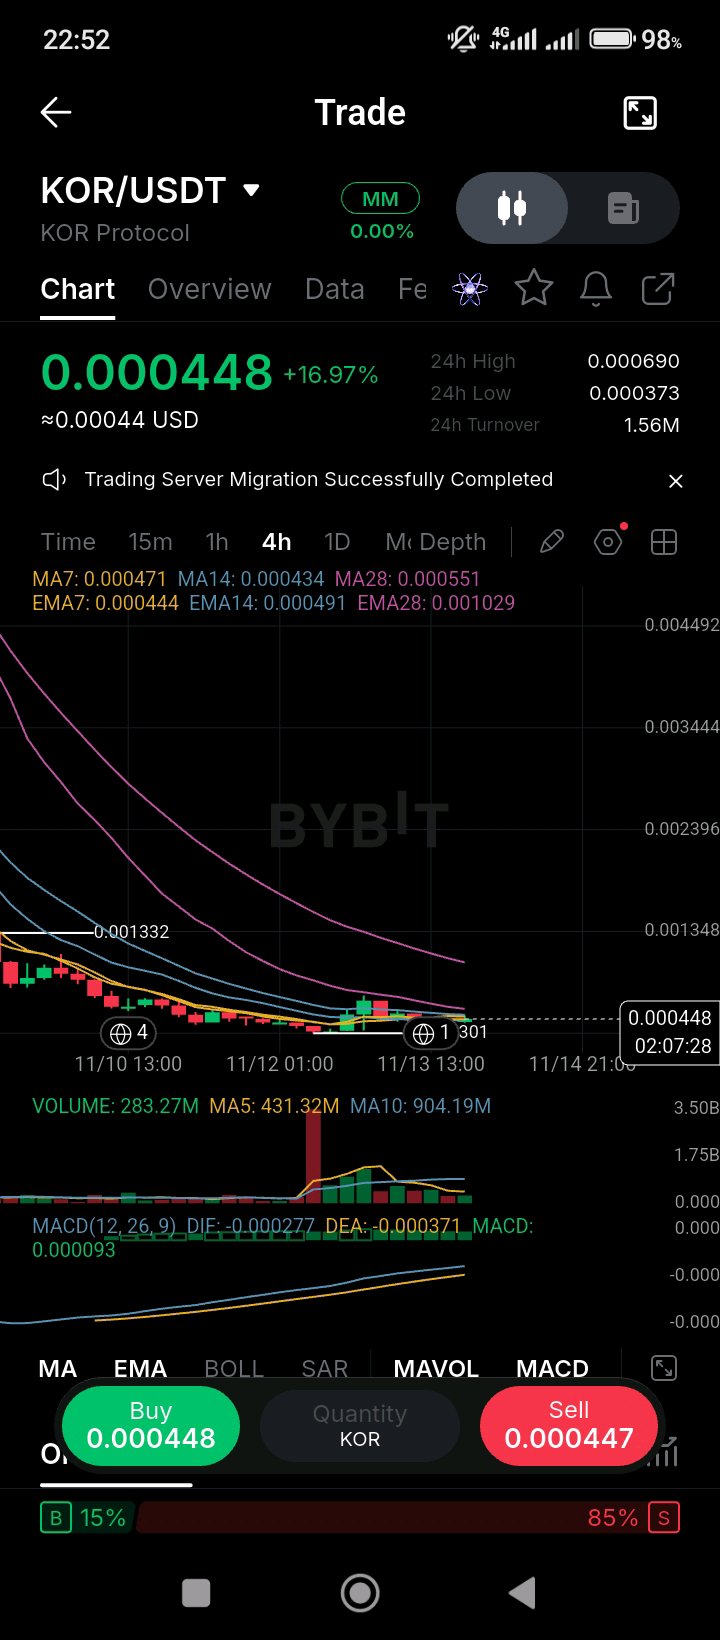
KOR is up 17% today at 0.000448, but it's still about 97% below its November 4 launch high of 0.032, and the token has been dominated by airdrop and reward supply since listing. KOR listed on November 4 and hit an all-time high of about $0.032 that day, then fell hard as the Kor Protocol airdrop claim opened. The claim window closed on November 9 at 14:00 UTC. A CoinMarketCap-linked AI note put the drop down to profit-taking and Launchpool rewards, and KuCoin's two reward campaigns, worth 1.8 million KOR together, run through November 20. Circulating supply is about 2.28 billion of 10 billion, so the unlocked float is small and the pressure from rewards is outsized. Sources disagree on the all-time low, with figures ranging from $0.0005 to $0.0012, and on where the token trades now, so use the chart rather than any single quote. The protocol itself, an onchain clearinghouse for creative assets on Base, and any Binance listing are both unconfirmed. On the chart, KOR is up 16.97% to 0.000448, within a 24-hour range of 0.000373 to 0.000690. Price sits above the MA7 (0.000471)? No, it is below the MA7 but above the MA14 (0.000434) and EMA7 (0.000444), and well below the MA28 (0.000551) and EMA28 (0.001029), so the longer averages are far overhead. MACD is slightly positive (0.000093), with the DIF (-0.000277) still under the DEA (-0.000371). Volume (283.27M) is well below the MA5 (431.32M) and MA10 (904.19M), so the bounce is coming on light volume. The order book is 85% sell-side, which is the main reason to be cautious on this move. The 0.000434 to 0.000444 averages are the level holding this bounce. A loss of the 0.000373 low would reopen the November lows. Rebuilding toward the 0.000551 MA28 would need volume the chart isn't showing yet. $KORUSDT $BTCUSDT #ByXIMPACT
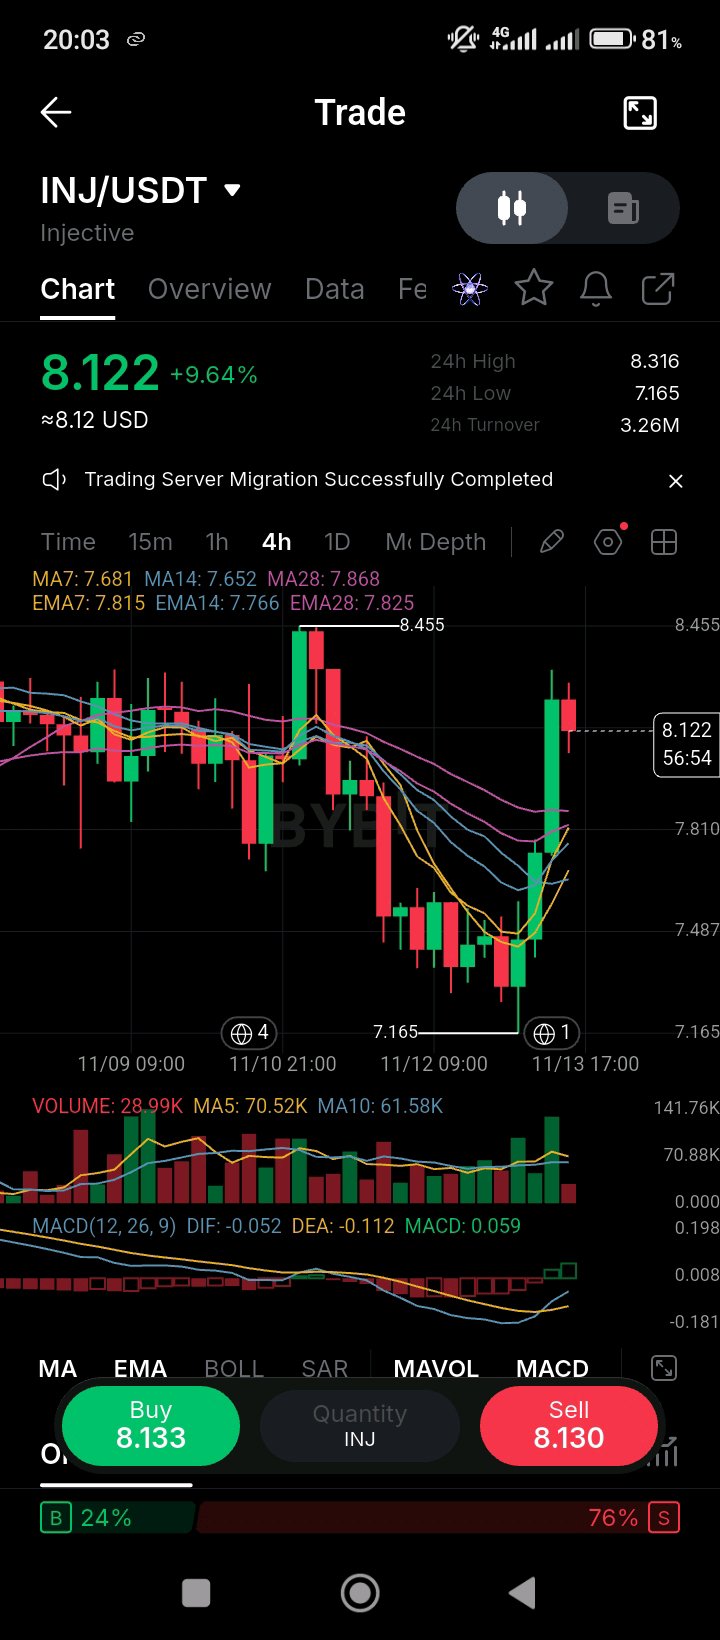
INJ is up 9.64% today to 8.122, the first move above its MA stack since the October high, and the order book is still 76% sell-side. The catalyst is the Canary Staked INJ ETF (INJC), which started trading on Nasdaq on November 5. The fund holds and stakes INJ, and CoinMarketCap credited it with a 3.18% move over the next two days. The launch was the first US product in the category, and the SEC shows a second INJ application, from 21Shares, still pending. On November 8, Injective marked its fifth anniversary and reported $12.86 billion of onchain trading from November 2025 to November 2026, with $1.8 billion of that in perpetuals on real-world assets. Issuance was also cut to 2.2% to 4.4% a year in January, which tightens supply over time. The ETF seeding, though, didn't involve much new spot buying, which is why the move has been choppy. One CMC note said the early INJC inflows looked like seed capital rather than fresh demand, so the staking flows are worth tracking over the next few weeks. On the chart, INJ sits above the MA7 (7.681), MA14 (7.652) and MA28 (7.868), and above the EMA7 (7.815), EMA14 (7.766) and EMA28 (7.825), so the candle has cleared every average shown. The 8.455 high from this week is the next level to clear. MACD is positive (0.059), with the DIF (-0.052) crossing up through the DEA (-0.112). Volume (28.99K) is well under the MA5 (70.52K) and MA10 (61.58K), so the rally is coming on light participation. The order book is 24% buy and 76% sell. The 7.87 MA28 is the nearest support on any pullback, and the 7.65 to 7.82 average band is the cushion below it. A close above 8.46 on rising volume would show buyers chasing the ETF story. A loss of 7.65 would bring the mid-week low of 7.17 back into view. $INJUSDT #ByXIMPACT
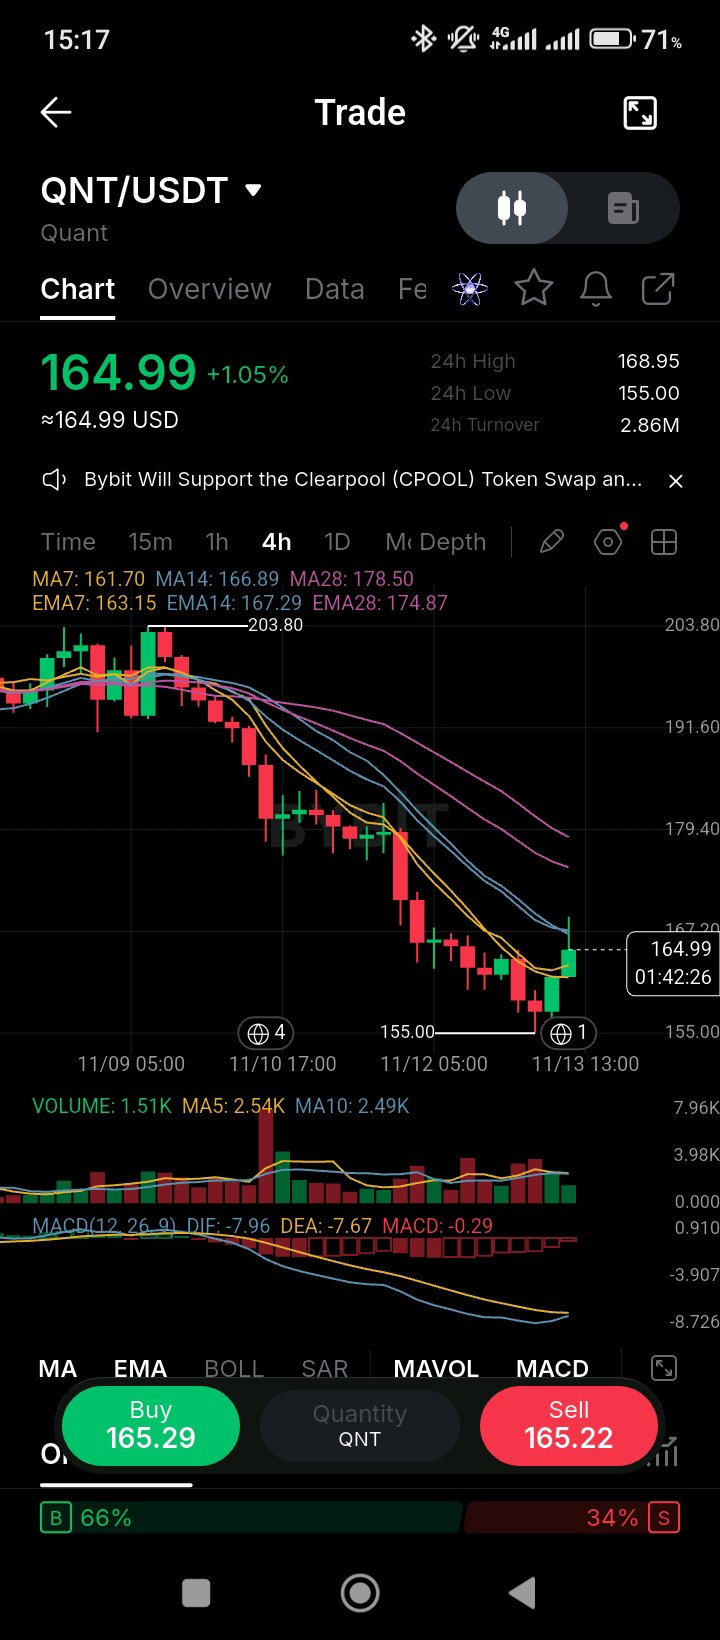
QNT 目前價格為 164.99,較 11 月 9 日的 203.80 高點下跌了約 19%。此次跌勢主要是跟隨大盤走勢,而非 Quant 本身發布了任何消息。 11 月 5 日,CoinMarketCap 將 QNT 的 5.7% 跌幅歸因於整個加密貨幣市場的拋售,該拋售導致整體加密貨幣總市值在 24 小時內下跌了約 5%,並指出 Quant 並無特定的新聞、上幣、代幣解鎖或安全漏洞。11 月 10 日,跌幅進一步擴大:Coinotag 報導稱 QNT 在 24 小時內下跌了 6.89% 至 187.57 美元,未平倉合約快速上升,這被解讀為新增的空頭倉位,而非多頭平倉。比特幣在同一時段僅下跌 0.59%,因此 QNT 的走勢明顯脫離了大盤。同一天也是美國 CPI 數據發布的日子,這是主要的宏觀事件。9 月份的結算所(Clearing House)合作夥伴關係和銀行代幣化試點項目仍然有效,但 11 月份代幣的交易表現是受市場情緒和倉位影響,而非這些公告。 圖表顯示明顯的下跌趨勢。QNT 上漲 1.05% 至 164.99,24 小時波動區間為 155.00 至 168.95。價格位於 MA7 (161.70) 和 EMA7 (163.15) 之上,但低於 MA14 (166.89)、MA28 (178.50)、EMA14 (167.29) 和 EMA28 (174.87),因此所有較長週期的均線都在上方形成壓力。MACD 為負值 (-0.29),DIF (-7.96) 低於 DEA (-7.67),且兩條線皆在下跌。成交量 (1.51K) 低於 MA5 (2.54K) 和 MA10 (2.49K)。訂單簿顯示買盤佔 66%,但這根綠色柱狀圖仍遠低於均線水準。 155 的低點是必須守住的水平,而 167 至 167.3 的 MA14 與 EMA14 密集區是首個需要突破的阻力位。若跌破 155,將開啟下一波下跌行情。 $QNTUSDT #ByXIMPACT
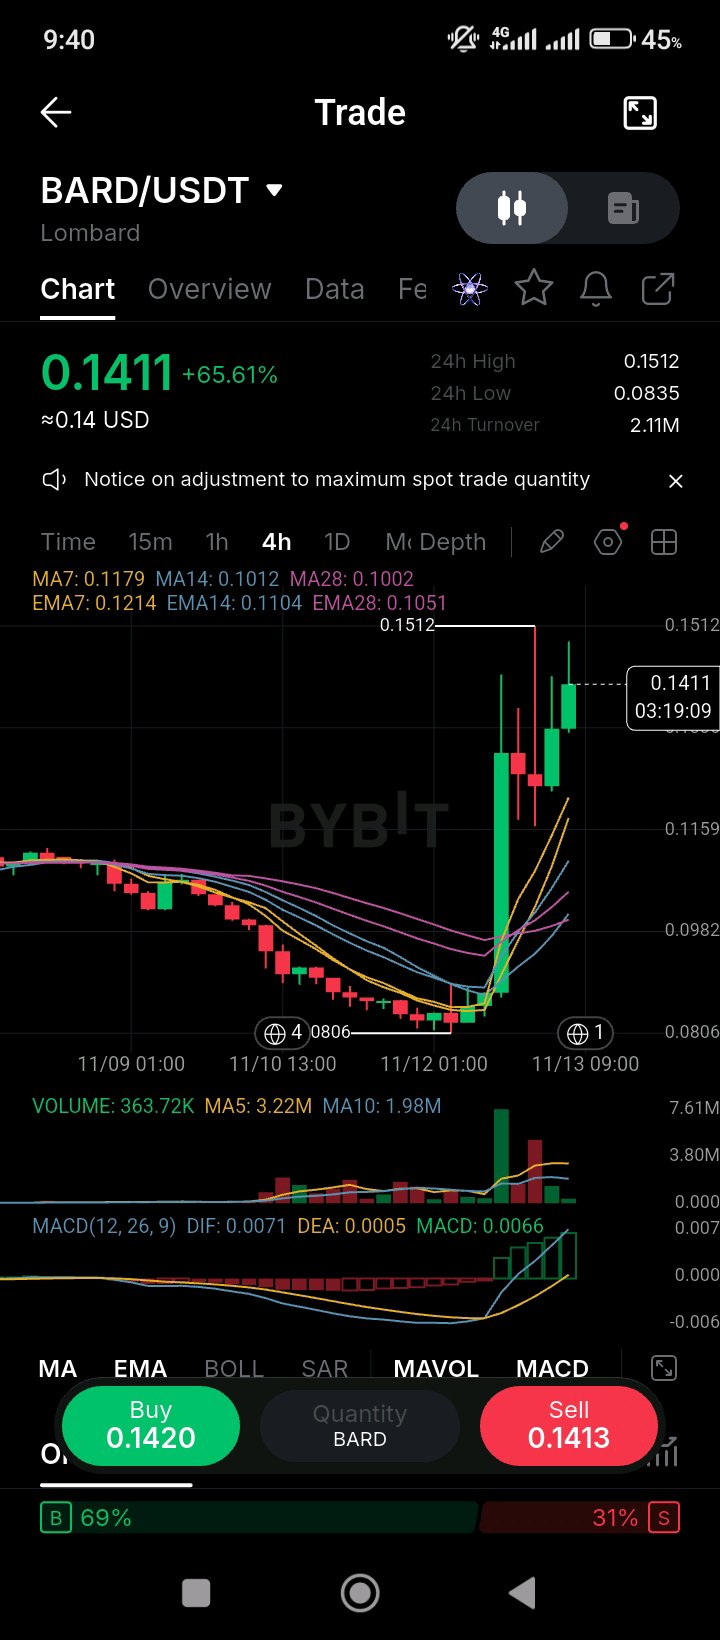
BARD 今天上漲了 65%,但我無法確認導致此次波動的催化劑,且五天後即將迎來代幣解鎖。 Lombard 的 BARD 於 3 月初推出,3 月 5 日觸及 $1.70 的高點後,於 8 月 3 日跌至 $0.1029 的低點。該協議於 9 月 28 日進行了 Chainlink CCIP 2.0 遷移,進行了安全性升級,並且第三季空投領取已於 10 月 29 日結束。該代幣自身的供應計劃是迫在眉睫的風險:RootData 顯示 11 月 18 日將有 1,375 萬枚 BARD 解鎖,按當前價格計算價值約 150 萬美元,且同等規模的釋放將每月重複,直至 2027 年初。相對於 3.4 億的流通量來說,這是一個小規模的解鎖,但它發生在 65% 的漲幅之後,因此市場將考驗買方是否能吸收這些拋壓。我找不到任何解釋今天波動的新聞項目,所以我沒有將其歸因於任何特定事件。 在圖表上,BARD 上漲了 65.61% 至 0.1411,24 小時價格區間為 0.0835 至 0.1512。價格遠高於 MA7 (0.1179)、MA14 (0.1012) 和 MA28 (0.1002),也高於 EMA7 (0.1214)、EMA14 (0.1104) 和 EMA28 (0.1051)。MACD 強勁為正 (0.0066),DIF (0.0071) 遠高於 DEA (0.0005)。成交量 (363.72K) 是否高於 MA10 (1.98M)?不,它遠低於 MA5 (3.22M) 和 MA10 (1.98M),因此目前的K線並未吸引到與近期平均水平相當的成交量。掛單簿顯示 69% 為買單。 0.1179 的 MA7 和 0.1214 的 EMA7 是決定此次漲勢能否維持的支撐位。若收盤價跌回 0.1012 以下,將抹去大部分漲幅。 $BARDUSDT #ByXIMPACT
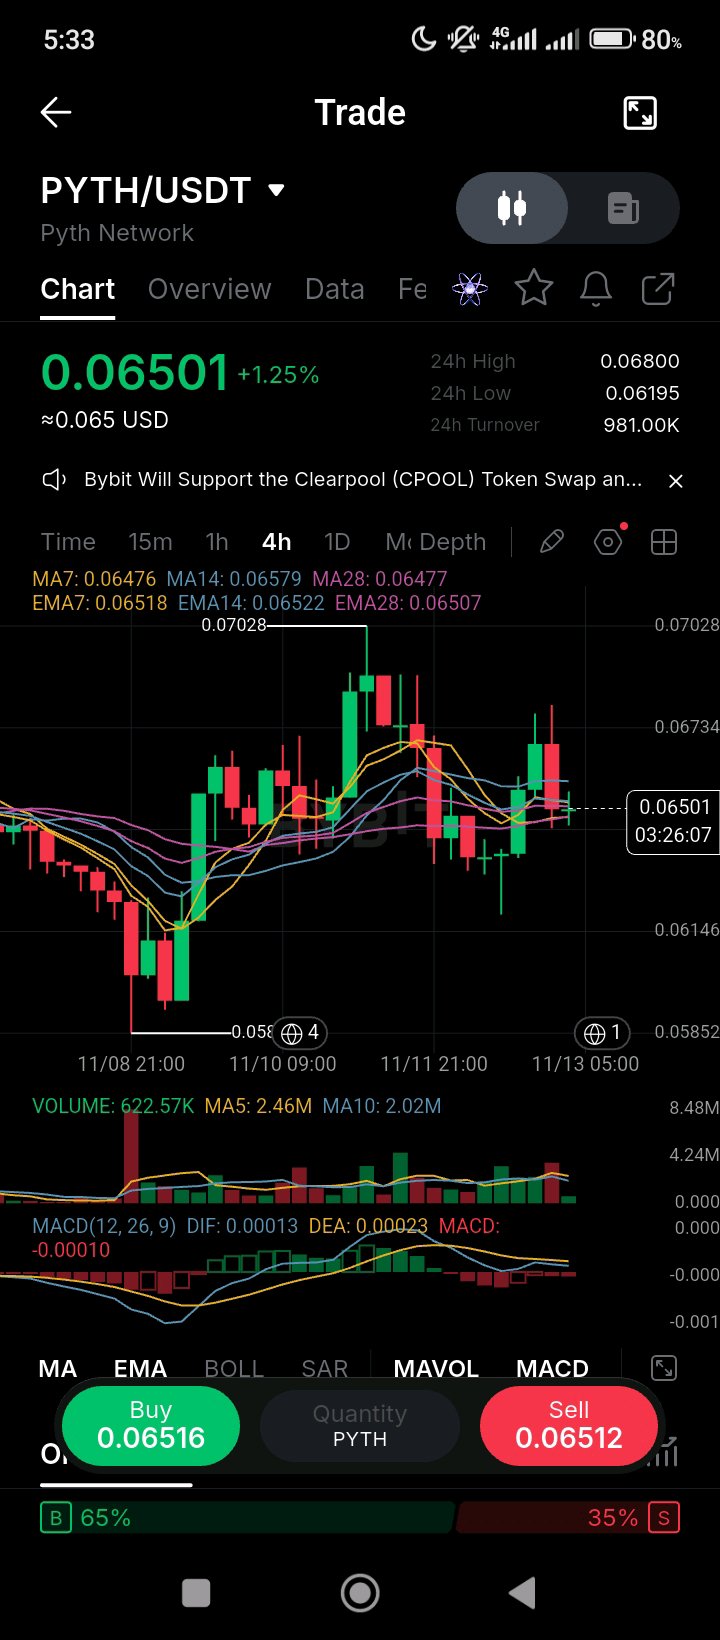
Pyth 的收入成長速度一直超過其代幣價格,而回購計畫正是旨在將兩者連結起來的機制。 Pyth 於 11 月 3 日發布的 2026 年 10 月報告顯示,年化訂閱收入為 1,367 萬美元,較 9 月增長了 18.9%。對於一個長期依賴市場情緒交易的代幣來說,這是本串討論中最具體的數字。這些收入來自機構級市場數據產品,且該協議在現實世界資產(RWA)永續合約方面的工作,已讓 Pyth 的數據饋送在大部分代幣化資產交易中扮演重要角色。回購計畫是值得關注的重點:於 2025 年 12 月啟動的 PYTH 儲備庫將 DAO 金庫 33% 的資金用於每月公開市場購買,並由協議收入提供資金。更大的考驗在於收入是否能持續複利成長,因為只有在收入持續挹注的情況下,回購才有意義。 在圖表上,PYTH 上漲 1.25% 至 0.06501,24 小時波動區間為 0.06195 至 0.06800。價格目前位於 MA7 (0.06476) 與 MA28 (0.06477) 以及 EMA7 (0.06518) 之上,但略低於 MA14 (0.06579) 與 EMA14 (0.06522),因此均線在目前價格處呈現糾結狀態。MACD 略呈負值 (-0.00010),DIF (0.00013) 正向上穿越 DEA (0.00023)。成交量 (622.57K) 遠低於 MA5 (2.46M) 與 MA10 (2.02M),顯示今日的 K 線缺乏市場參與。訂單簿買盤佔 65%。 0.0658 的 MA14 是決定下一步走勢的關鍵水平。若能帶量收於此上方,將開啟通往 11 月高點 0.0703 的道路。若跌破 0.0619 的低點,則會使此次反彈失效。 $PYTHUSDT #ByXIMPACT
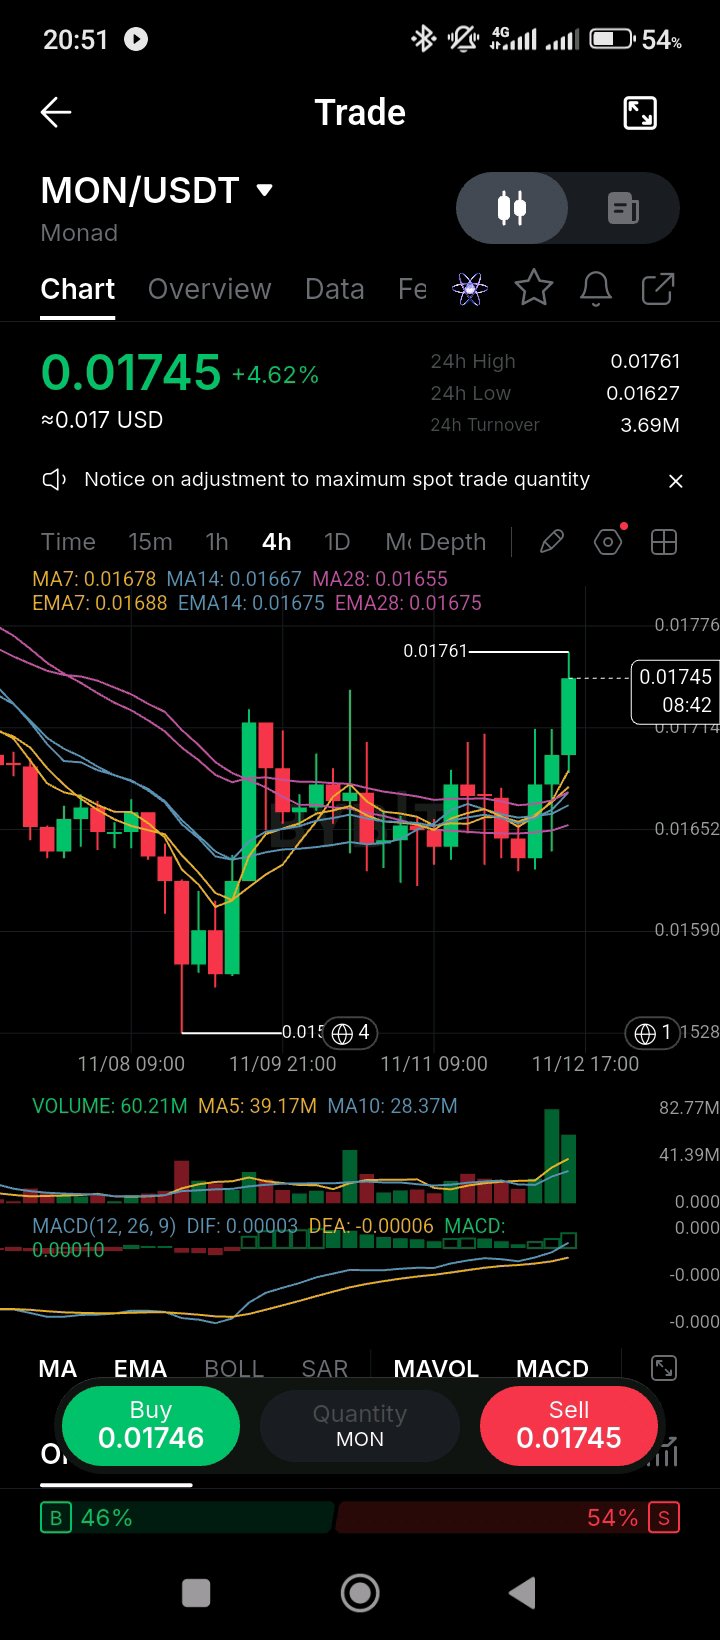
MON is up 4.6% at 0.01745, roughly 35% below its late-September level, and the first insider unlock lands on November 24, twelve days from now. Monad's mainnet and MON token went live on November 24, 2025, with more than 50% of the 100 billion supply locked at launch and vesting through 2029. The first large insider unlock is scheduled for November 24, 2026. Coinspeaker's German coverage puts the release at about 16.8 billion MON, while Cryptorank's coverage describes monthly unlocks of around 1.16 billion after the initial release, and I couldn't reconcile those two figures, so check the vesting schedule before sizing a position. On the positive side, Monad's DeFi TVL passed $1 billion in September, and the network has had at least two upgrades in 2026. On September 29, MON traded near $0.027 with a circulating market cap around $316 million, which means most of the valuation is still in the locked supply, and the unlock is the main variable for the next few weeks. The chart shows a bounce from the 0.01627 low, with the price up 4.62% to 0.01745 and a 24-hour range that tops out at 0.01761. Price is above the MA7 (0.01678), MA14 (0.01667) and MA28 (0.01655), and above the EMA7 (0.01688), EMA14 (0.01675) and EMA28 (0.01675), so the averages are stacked in a tight band below the candle. MACD is barely positive (0.00010), with the DIF (0.00003) above the DEA (-0.00006). Volume (60.21M) is above both the MA5 (39.17M) and MA10 (28.37M), so this push has real participation behind it. The order book is 54% sell-side. The 0.01761 intraday high is the level to clear. The 0.01655 to 0.01688 average band is the support to hold. A loss of 0.01627 would signal the unlock is starting to weigh on the price. $MONUSDT #ByXIMPACT
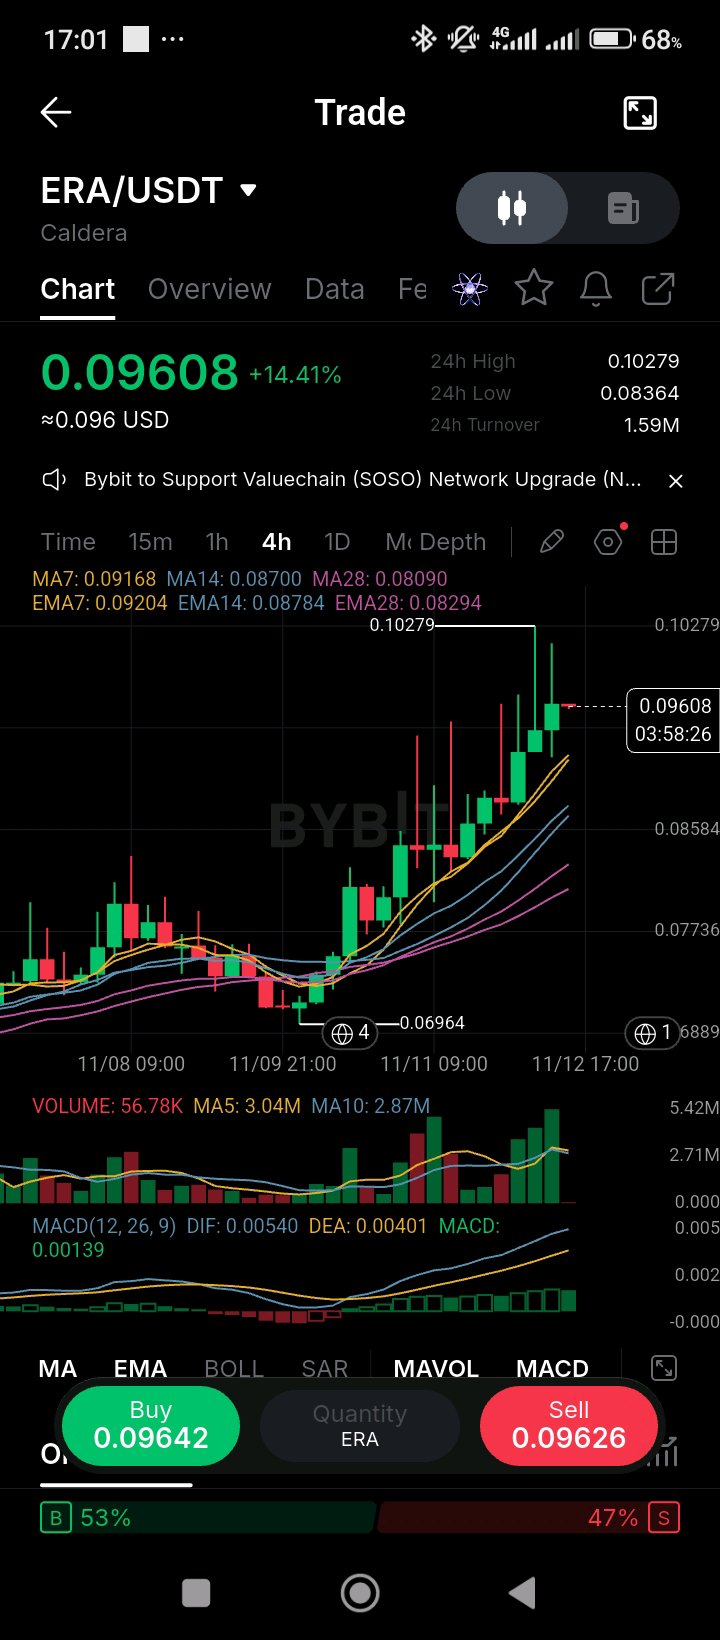
ERA is up 14% today, roughly 40% above its November low of 0.06964, and the move sits against a supply backdrop that's been heavy all summer. Caldera's ERA token, the native token of its Metalayer network for connecting Ethereum rollups, has been dominated by unlocks since July. A July 17 release put between 26.4 million and 77.5 million tokens into the market, which CoinMarketCap put at 12.6% to 52% of market capitalization, and another 26.4 million went to private investors in August. CMC's circulating figure is about 148.5 million out of a 1 billion total, roughly 15% of supply, so the unlock schedule still has a long way to run. The token set its all-time low of about $0.0545 on August 19. Caldera's own announcements haven't tied the November move to a specific catalyst, and CMC's November 10 overview describes the role of ERA only in general terms, so there's no news event to point to here. On the chart, ERA is up 14.41% to 0.09608, on a 24-hour range of 0.08364 to 0.10279. Price is above the MA7 (0.09168), MA14 (0.08700) and MA28 (0.08090), and above the EMA7 (0.09204), EMA14 (0.08784) and EMA28 (0.08294). The 0.10279 high is the level to clear. MACD is positive (0.00139), with the DIF (0.00540) above the DEA (0.00401), so momentum is building. Volume (56.78K) is well under the MA5 (3.04M) and MA10 (2.87M), so this surge is running on very thin participation. The order book is 53% buy-side. The 0.0917 MA7 and 0.0920 EMA7 are the support to hold. A close above 0.1028 on rising volume would be a real breakout. A loss of 0.0870 would undo the move. $ERAUSDT #ByXIMPACT
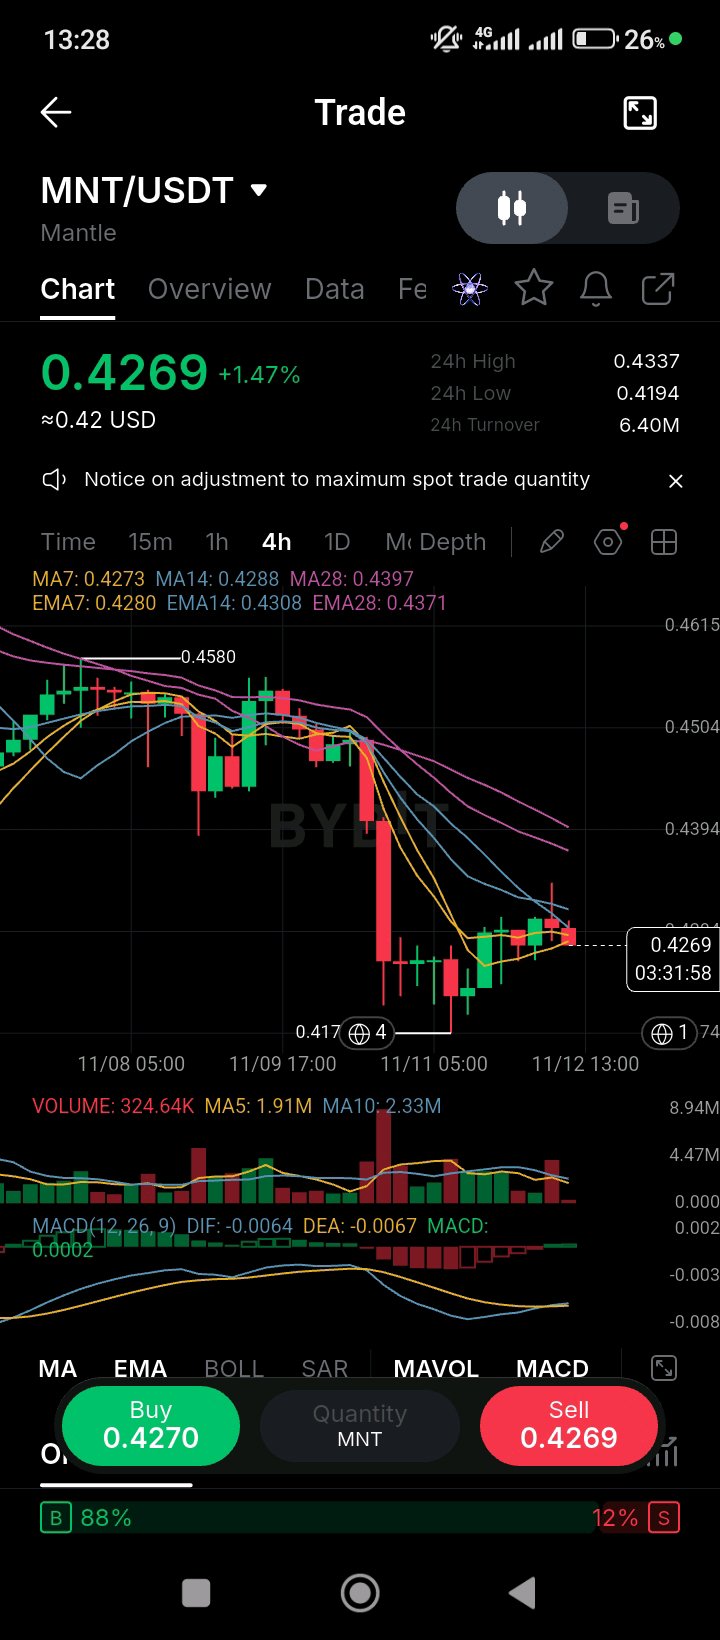
MNT is at 0.4269, down about 60% over the year, and the protocol's next budget cycle is the newest supply item on the table. On October 28, Mantle's core team proposed a fourth budget cycle covering July 2026 to June 2027, with $40 million in USDx and 150 million MNT allocated to operations and ecosystem growth. The plan renews automatically every 12 months, and it can't go to a vote until delegators finish allocating their MNT. The 150 million MNT figure is a meaningful amount of supply directed at ecosystem spending, so the vote outcome matters for the token's supply picture. In July, the Mantle Super Portal moved from LayerZero to Chainlink CCIP, which strengthened MNT's cross-chain security, and the market has largely ignored that upgrade. CoinMarketCap's October 29 note put the 5 to 6% drop that week down to an altcoin selloff rather than anything Mantle-specific, and the CMC coverage from September had credited the USDG integration for a 3.7% gain. On the chart, MNT is up 1.47% to 0.4269, on a 24-hour range of 0.4194 to 0.4337. Price sits above the MA7 (0.4273) and EMA7 (0.4280), but below the MA14 (0.4288), MA28 (0.4397), EMA14 (0.4308) and EMA28 (0.4371), so the overhead averages are still stacked above the price. MACD is essentially flat (0.0002), with the DIF (-0.0064) just above the DEA (-0.0067), so the cross is only starting. Volume (324.64K) is well under the MA5 (1.91M) and MA10 (2.33M), so this bounce is coming on very thin participation. The order book is 88% buy-side. The 0.4288 MA14 and 0.4308 EMA14 are the level to clear. A close above the 0.4397 MA28 would be the first sign of a trend change, and a loss of the 0.4170 low would reopen the November lows. $MNTUSDT #ByXIMPACT
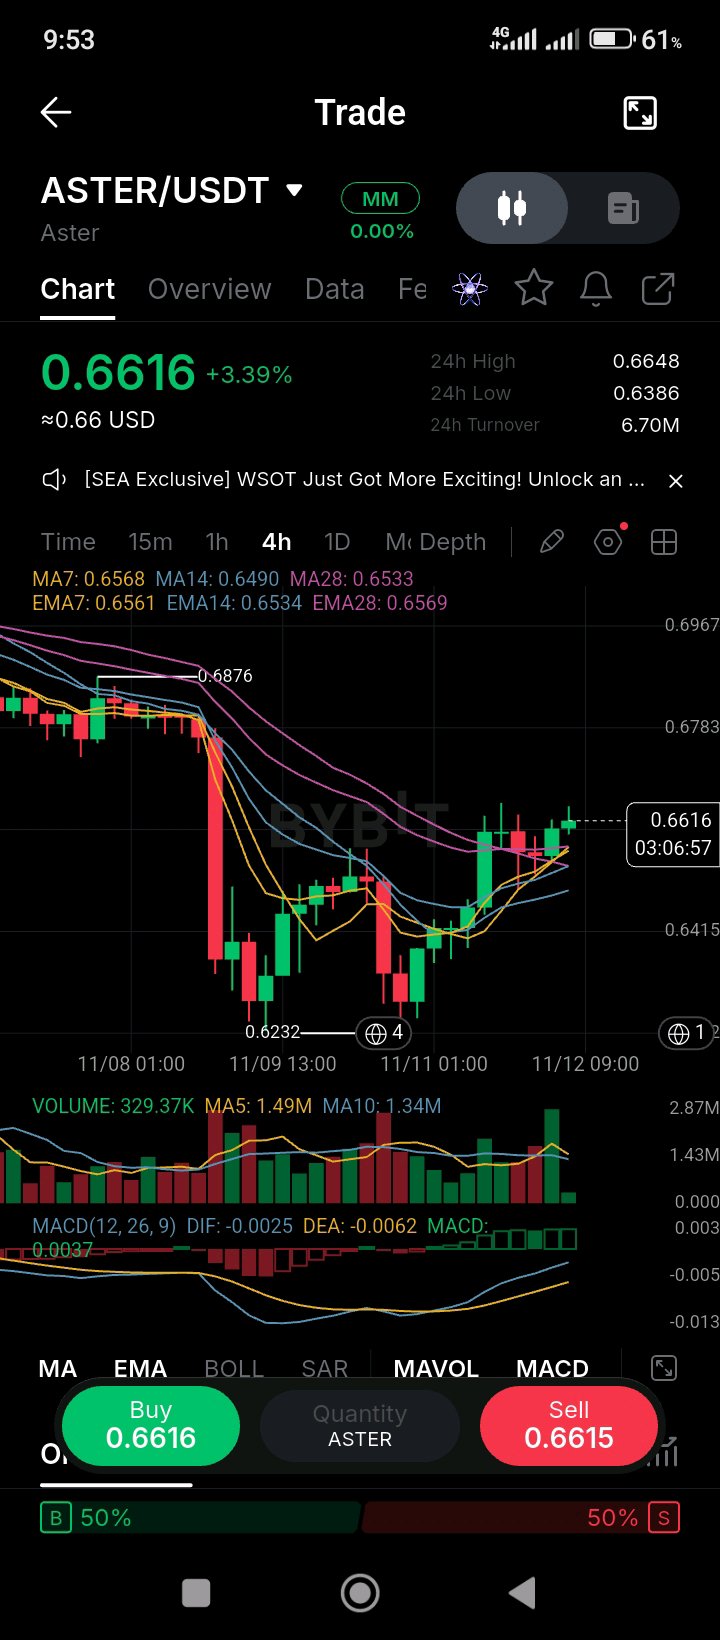
the Stage 6 airdrop is in its claim window through December 4, so the token has a known supply event running alongside the price action. On November 4 at 12:00 UTC, Aster opened the Stage 6 claim for holders who picked the six-month vesting option, letting them claim their full allocation in one step. The claim window runs to December 4, and the allocation page shows how much of the airdrop is still locked. That means a block of tokens that was vesting over months can reach the market within the next few weeks, and claimants who want to take profit will have that option. On the buyback side, the program has been routing up to 99% of daily fees to repurchases since June, and a matching team-allocation burn was added then too. Those buybacks and burns are the offset to that claim supply, and the tug-of-war between them is the main thing to watch this month. On the chart, ASTER is up 3.39% to 0.6616, on a 24-hour range of 0.6386 to 0.6648. Price sits above the MA7 (0.6568), MA14 (0.6490) and MA28 (0.6533), and above the EMA7 (0.6561) and EMA14 (0.6534). The EMA28 (0.6569) is just overhead, which makes it the nearest level to clear. MACD has turned positive on the histogram (0.0037), with the DIF (-0.0025) above the DEA (-0.0062). Volume (329.37K) is well under the MA5 (1.49M) and MA10 (1.34M), so this rebound is coming on light participation. The order book is split 50/50. The 0.6569 EMA28 and 0.6876 November high are the two levels to watch. A close above 0.6569 on rising volume would open the way back toward 0.69 to 0.70. A loss of the 0.6232 low, which came in on November 10, would put the bounce in doubt. $ASTERUSDT #ByXIMPACT
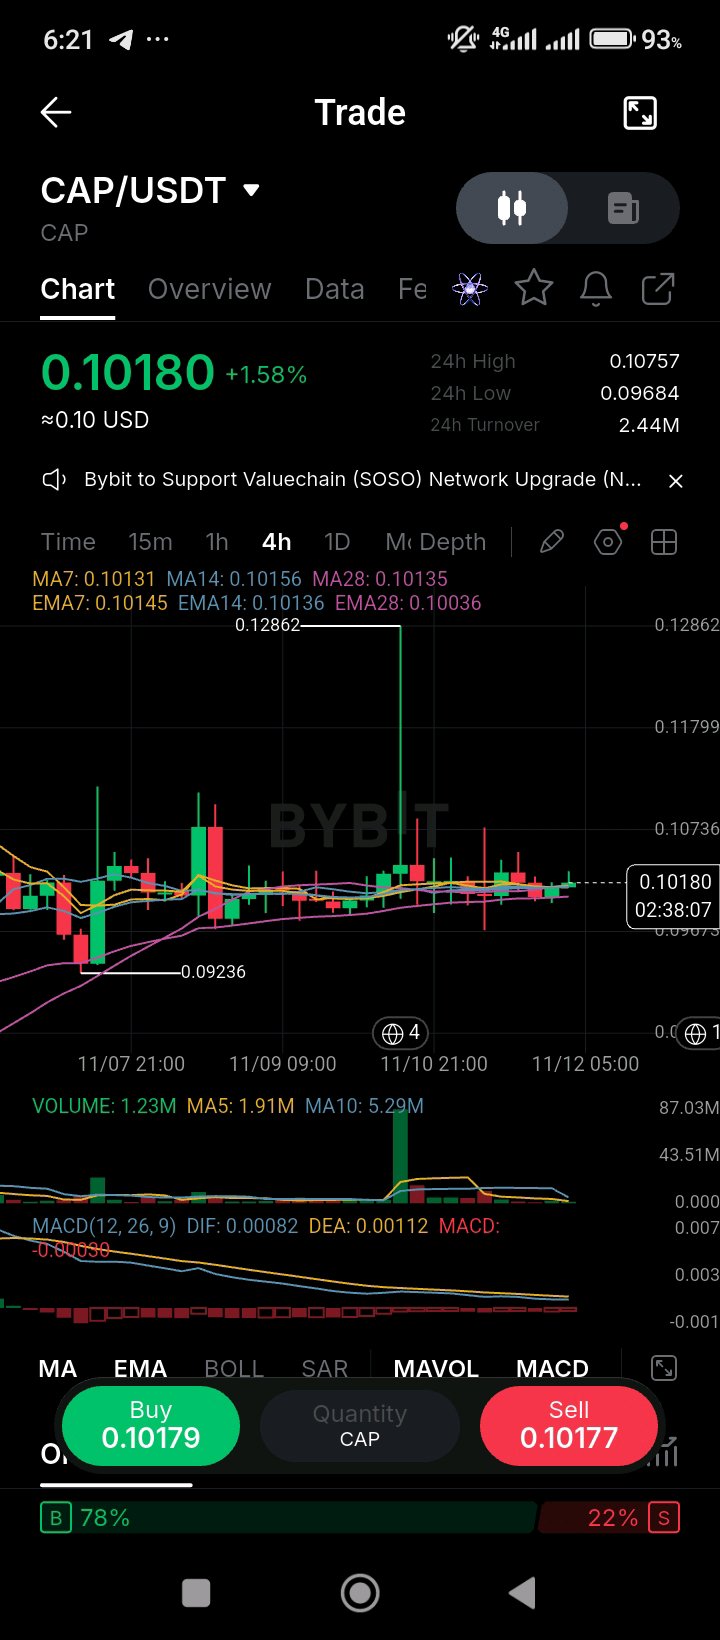
CAP is at 0.1018, about nine and a half times its June auction price, and the chart is holding the averages after a November 10 wick to 0.12862. The auction cleared at $0.011 in late June, a $106 million fully diluted valuation, with $16.4 million of bids from 1,002 participants and 5.5 times oversubscription. Trading began June 26, and by early July the token had posted nearly $900 million of volume in its first 10 days, with a first-day close near a $325 million FDV. The Block lists 1.6 billion CAP circulating out of 10 billion total. At today's price that is roughly a $163 million circulating market cap against about a $1.02 billion fully diluted value, so most of the valuation is still unlocked-in-the-future supply. The governance rights cover risk parameters, borrower whitelisting and fee models, so the token's value depends on protocol decisions rather than on a fixed revenue stream. The chart shows a range after the spike. CAP is up 1.58% to 0.10180, with a 24-hour range of 0.09684 to 0.10757. Price sits on the averages: the MA7 (0.10131), MA14 (0.10156) and MA28 (0.10135) are bunched within a few hundredths of a cent, and the EMA7 (0.10145), EMA14 (0.10136) and EMA28 (0.10036) are in the same band. The 0.09236 low is the level below which this range breaks. MACD is slightly negative (histogram -0.00030), with the DIF (0.00082) above the DEA (0.00112) and the lines close together. Volume (1.23M) is well under the MA5 (1.91M) and MA10 (5.29M), so the range is trading quietly. The order book is 78% buy-side. The 0.1014 to 0.1016 averages are the level to reclaim above. A close above the 0.1286 spike high would be a real breakout. A loss of 0.0924 would undo the range. $CAPUSDT #ByXIMPACT
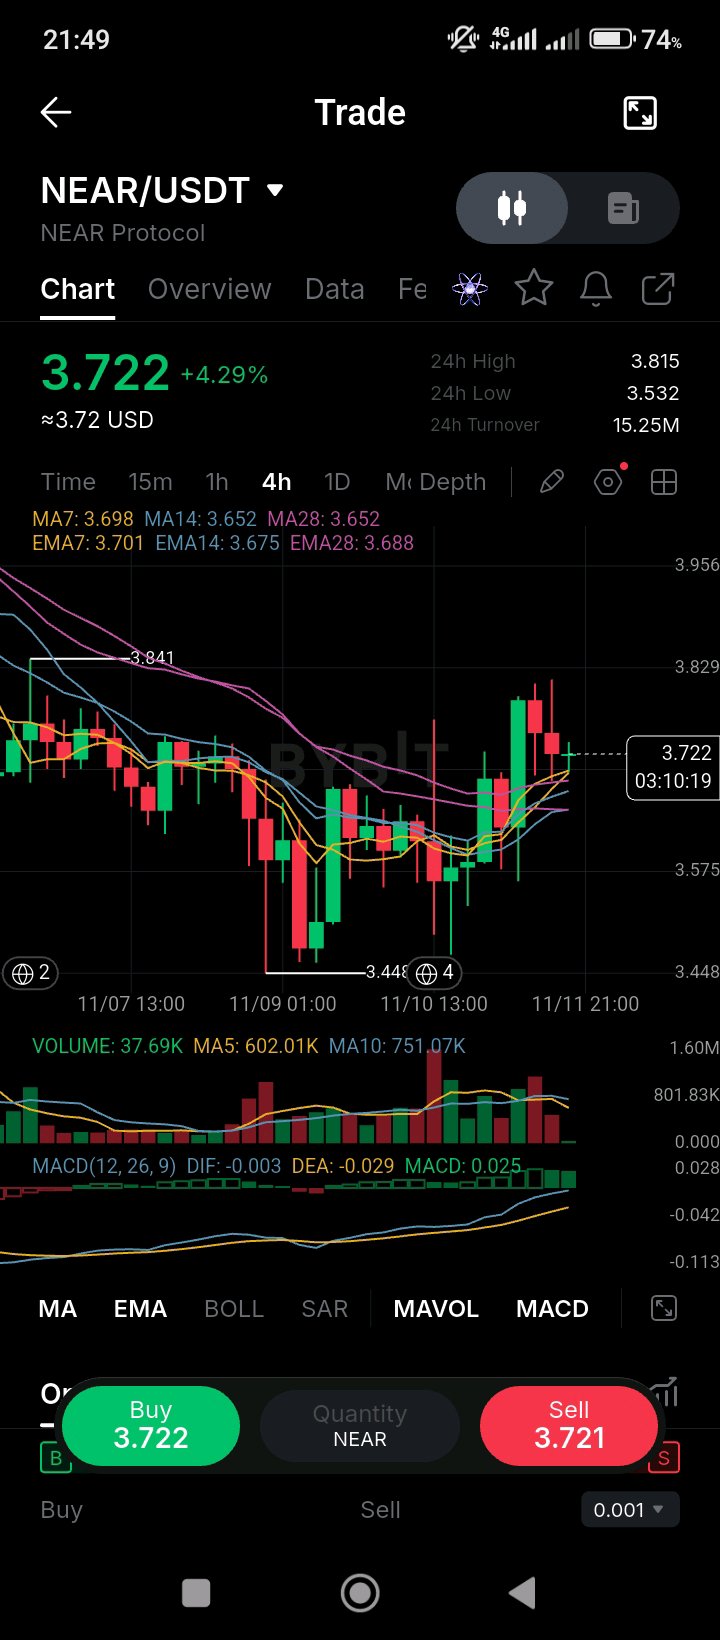
NEAR 已回調至 3.72,但本月供給端發生了實質性變化,且 Intents 業務仍在持續增長。 11 月 2 日,NEAR 持有者批准了 HSP-029 提案,以 99.9% 的參與投票權比例通過了削減年度代幣發行量的決議。據 Cointelegraph 報導,儘管投票通過,但該代幣在 11 月 3 日仍下跌了 7%,顯示市場將此次供給削減視為長期變革,而非短期催化劑。據 Todayonchain 報導,該協議的跨鏈交易層產品 Intents 在 11 月創下超過 40 萬美元的單日手續費紀錄,累計手續費已突破 1,000 萬美元。但在受監管的部分則表現較為疲軟。Bitwise NEAR ETF (NRR) 在截至 11 月 8 日當週出現連續第二週淨流出,總額達 438 萬美元。NEAR 在 11 月第一週下跌約 15%,CoinMarketCap 將 200 日均線(約 3.60 美元)視為關鍵支撐位。 在圖表方面,NEAR 上漲 4.29% 至 3.722,24 小時波動區間為 3.532 至 3.815。價格目前高於 MA7 (3.698)、MA14 (3.652) 和 MA28 (3.652),並高於 EMA7 (3.701)、EMA14 (3.675) 和 EMA28 (3.688),這意味著圖表上的所有均線目前皆低於價格。MACD 為正值 (0.025),其中 DIF (-0.003) 高於 DEA (-0.029)。成交量 (37.69K) 遠低於 MA5 (602.01K) 和 MA10 (751.07K),顯示此次反彈是在成交量非常低的情況下進行的。 3.65 至 3.70 區間是必須守住的水平,因為這是 MA14、MA28 和 EMA7 的匯合處。若能收在 3.84 高點上方,將顯示買方回歸。若失守 3.60 的支撐位,則可能會再次測試 11 月的低點。 $NEARUSDT #ByXIMPACT
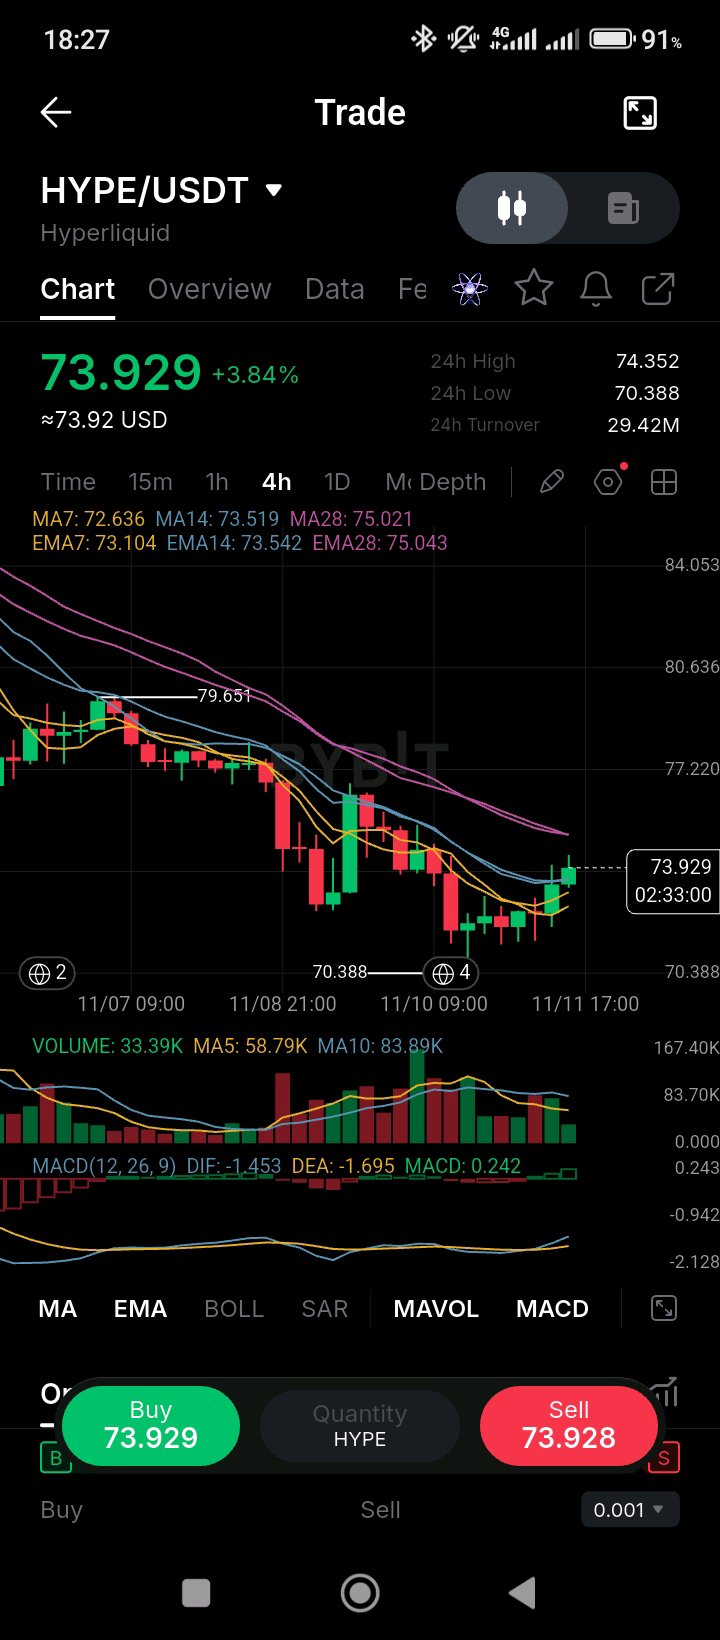
代幣概況:Hyperliquid ($HYPE) Hyperliquid ($HYPE) 是推動 **Hyperliquid** 的原生實用型、治理及質押資產。Hyperliquid 是一個專為去中心化永續衍生品交易而建的高性能 Layer-1 應用鏈。Hyperliquid 利用其客製化的高吞吐量共識引擎,每秒可處理數萬筆訂單並實現秒級結算,結合了中心化交易所的速度與使用者體驗,以及 DeFi 的非託管透明度。在固定的代幣經濟學結構支撐下,HYPE 透過原生的權益證明 (PoS) 共識機制保護網路安全、支付協議級別的交易 Gas 費用,並驅動其不斷擴展的現貨與衍生品訂單簿基礎設施的生態治理。 技術分析:HYPE/USDT — 4 小時 (4H) 局部反彈與移動平均線測試 在 4 小時圖上,HYPE 目前交易價格約為 **$73.929** (+3.84%)[span_0](start_span)[span_0](end_span),繼從其波段高點 **$79.651**[span_2](start_span)[span_2](end_span) 進行了數日的回調修正後,目前正從其最近的局部掃蕩低點 **$70.388**[span_1](start_span)[span_1](end_span) 進行緩解性反彈。 * **移動平均線動態壓力位:** 價格目前正在測試由移動平均線帶所形成的直接上方阻力[span_3](start_span)[span_3](end_span)。價格已推升至 **$72.636 (MA7)**[span_4](start_span)[span_4](end_span) 和 **$73.104 (EMA7)**[span_5](start_span)[span_5](end_span) 之上,並正直接挑戰 **$73.519 (MA14)**[span_6](start_span)[span_6](end_span) 和 **$73.542 (EMA14)**[span_7](start_span)[span_7](end_span)。更高的上方阻力位於 **$75.021 (MA28)**[span_8](start_span)[span_8](end_span) 和 **$75.043 (EMA28)**[span_9](start_span)[span_9](end_span)。若 4 小時線能明確收在 $73.55 以上,則確認結構發生轉變,目標將指向 $77.22–$79.65 的流動性區域[span_10](start_span)[span_10](end_span)。 * **支撐基礎與底部掃蕩:** 即時的局部支撐位穩固地錨定在 **$70.388** 的掃蕩低點(24 小時低點亦為 $70.388)[span_11](start_span)[span_11](end_span)。維持在此水準之上的價格走勢將保持短期整理區間的完整性[span_12](start_span)[span_12](end_span);若跌破 $70.38,則有可能進一步向下延伸,挑戰更深層的宏觀需求區[span_13](start_span)[span_13](end_span)。 * **成交量與 MACD 概況:** 4 小時成交量為 **33.39K HYPE(24 小時成交額 $29.42M USDT)**[span_14](start_span)[span_14](end_span),顯示從低點處有穩定的買盤吸收(5 週期成交量 MA 為 58.79K,10 週期基線為 83.89K)[span_15](start_span)[span_15](end_span)。4 小時 MACD (DIF: -1.453, DEA: -1.695) 已出現看漲交叉,直方圖為正 (**MACD: +0.242**)[span_16](start_span)[span_16](end_span),隨著價格挑戰 14 週期移動平均線阻力,顯示動能正轉向正值區域[span_17](start_span)[span_17](end_span)。 你是在 $70.38 支撐位附近掛單買入 HYPE 現貨,還是在等待 4 小時線確認收在 $73.55 移動平均線集群之上? $HYPEUSDT #ByXIMPACT
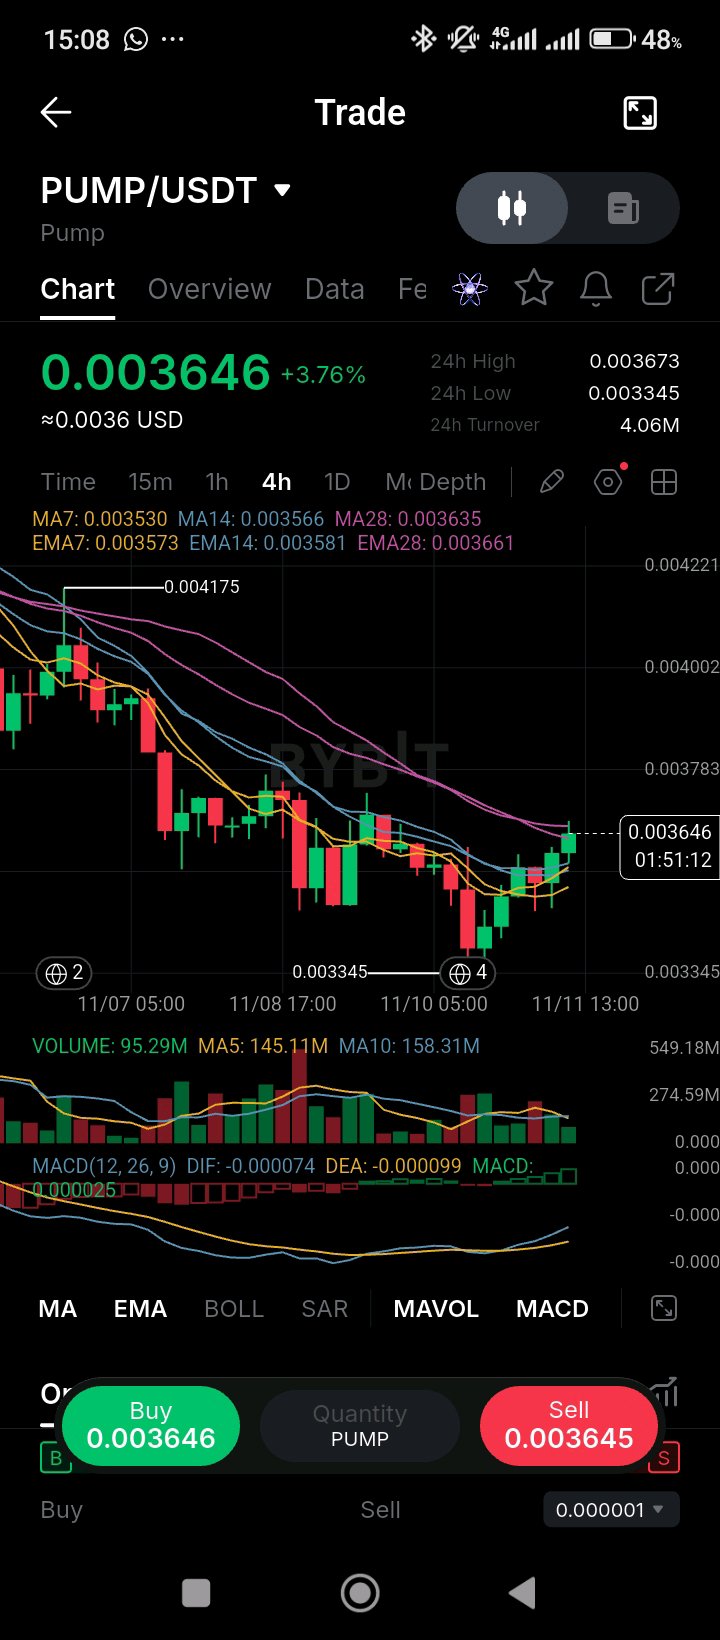
PUMP 今日上漲 3.76%,但更大的話題是該平台自身的國庫拋售,這對代幣造成了壓力。 根據 CoinMarketCap 在 11 月 7 日摘要的一份 crypto.news 報告,Pump.fun 於 11 月 6 日又將 76,111 枚 SOL(價值約 685 萬美元)轉移至 Kraken 的充值地址。這使其累計估計 SOL 拋售量達到約 555 萬枚 SOL,總值約 8.82 億美元,平均價格約為 158.88 美元。當天,在疲軟的市場中,PUMP 下跌了 3.32%,CoinMarketCap 將此舉歸因於 Beta 測試和風險控制,而非平台特定的崩盤。這些 SOL 的拋售究竟是國庫管理還是其他因素仍有爭議,且 Pump.fun 未提供完整說明,因此這些數據最好被視為報告數值。該代幣的供應政策則更為明確:4 月時,該平台銷毀了約 36% 的流通供應量(約 3.7 億美元的 PUMP),並轉向 50% 的收入回購模式。 從圖表來看,PUMP 上漲 3.76% 至 0.003646,24 小時波動區間為 0.003345 至 0.003673。價格位於 MA7 (0.003530)、MA14 (0.003566)、EMA7 (0.003573) 與 EMA14 (0.003581) 之上,但原先以為在 MA28 (0.003635) 之下?不,價格其實也在它之上,所以價格目前位於圖表上所有均線之上,僅除了 EMA28 (0.003661),這也是目前的上方阻力。MACD 正在轉正 (0.000025),DIF (-0.000074) 略低於 DEA (-0.000099)。成交量 (9529 萬) 遠低於 MA5 (1.4511 億) 和 MA10 (1.5831 億),因此這次反彈並未吸引太多買盤。11 月 7 日的高點 0.004175 是待收復的關鍵位。 位於 0.003661 的 EMA28 是需突破的關卡。若能伴隨成交量放大突破此位,將會測試 0.004175 的高點。若失守 0.003345,將使賣壓重新掌控局勢。 $PUMPUSDT #ByXIMPACT
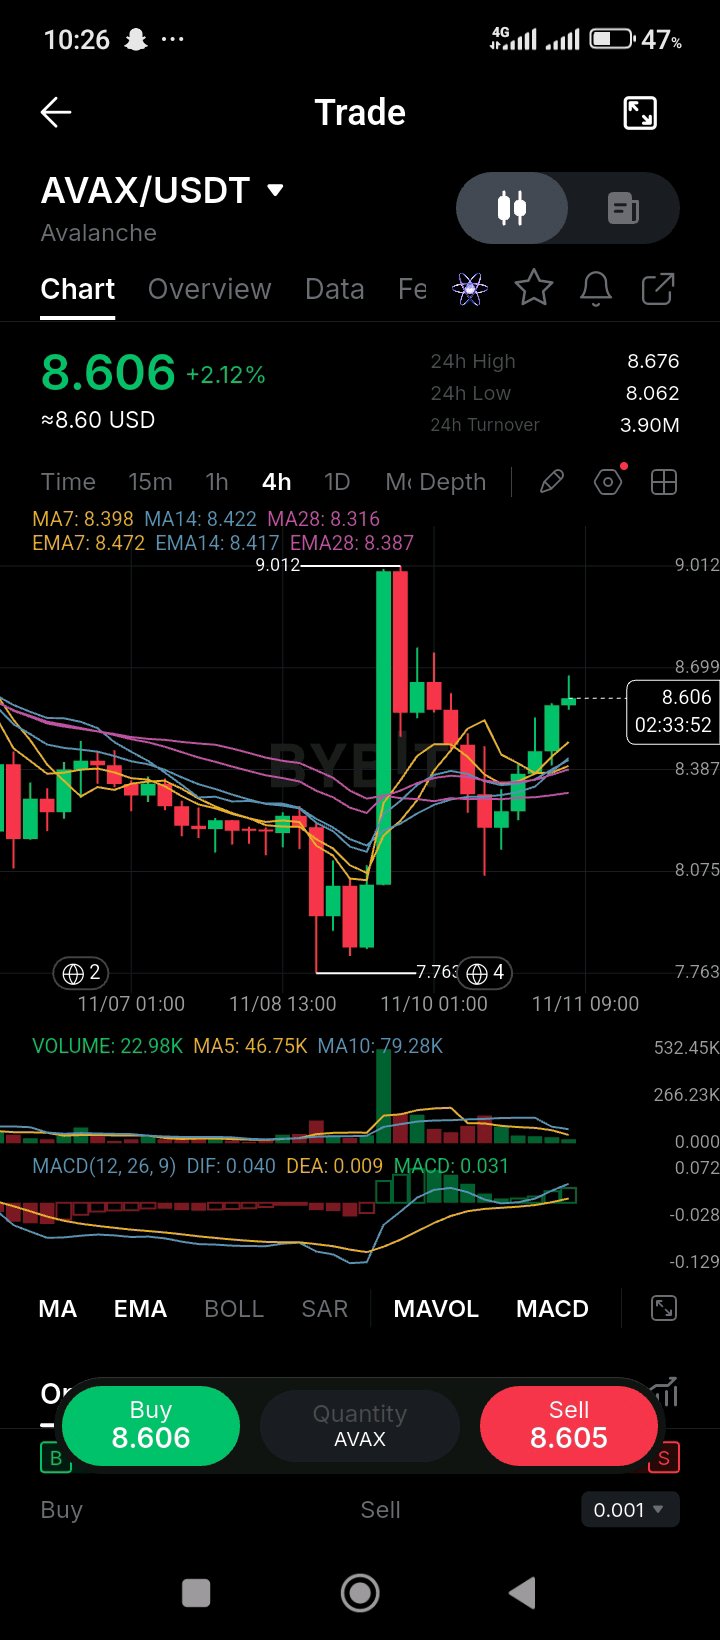
AVAX/USDT — AVAX is back above $8.60 after falling below $8 on November 8, and the chart is now sitting between two groups of moving averages with the next unlock already behind it. On November 8, the Avalanche Foundation's scheduled vesting released 1,666,800 AVAX, worth about $14 million at October 31 prices and under 0.4% of the 444 million in circulation. It was a planned step on the published schedule, not a new decision, so its direct price impact is small. The bigger context is the drop: per cryptonews, AVAX fell 27.6% over the 28 days ended November 8, which left it below $8 and lagging both Bitcoin and Ether. On the treasury side, AVAT's preliminary Q3 report from November 5 shows 13.31 million AVAX held as of September 30, with about 91% staked, which means most of its position is earning yield rather than sitting idle. Full Q3 results and a call are due on November 19. On the chart, AVAX is up 2.12% to 8.606 on a 24-hour range of 8.062 to 8.676. Price sits above the MA7 (8.398), MA14 (8.422) and MA28 (8.316), and above the EMA7 (8.472) and EMA14 (8.417), but still under the EMA28 (8.387)? No, above it too, so price is above every average on the chart. The spike high is 9.012 and the low is 7.763. MACD is positive (0.031), with the DIF (0.040) above the DEA (0.009). Volume (22.98K) is under half the MA5 (46.75K) and well below the MA10 (79.28K), so this bounce isn't drawing much participation. The 8.42 MA14 and 8.47 EMA7 are the first levels to hold. A close back above 9.01 would open the November spike high, and a loss of 8.32 would put the 7.76 low in view. $AVAXUSDT #ByXIMPACT
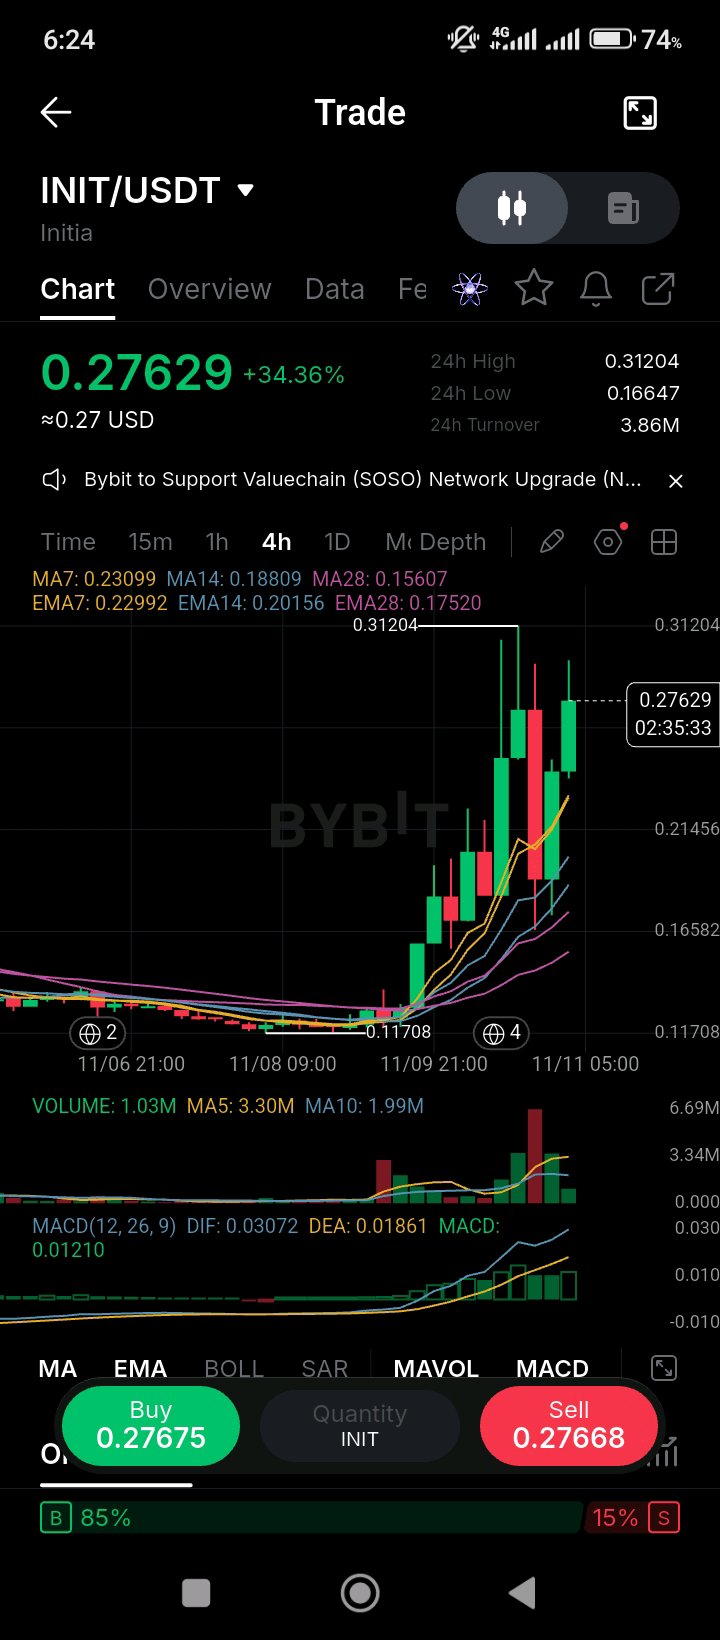
$INITUSDT Initia rallied more than 34% today even after its L1 was halted following a $615K exploit, which makes this a rally that the market is treating as separate from the security risk. On November 10, Initia halted its layer-1 chain after compromised rollup keys let an attacker drain about $615K, according to Whale Alert and Crypto News. The network's native token reportedly surged more than 60% at one point, while the exploit itself is still being reported as it develops. This is the second security incident in the past few weeks, following an October 23 event where reports said an attacker minted tokens. The team's unlock delay, which moved investor vesting to April 2027, was the main supply-side positive earlier this year. Holding a halted chain is still a bigger issue than a price spike, and any restart, post-mortem, or compensation plan will matter more than the current candle. The chart shows the move from the 0.11708 low to a 0.31204 high, and today's bar is up 34.36% to 0.27629. Price sits well above its MA7 (0.23099), MA14 (0.18809) and MA28 (0.15607), and above the EMA7 (0.22992), EMA14 (0.20156) and EMA28 (0.17520). MACD is positive (0.01210), with the DIF (0.03072) above the DEA (0.01861). Volume (1.03M) is under the MA5 (3.30M) and MA10 (1.99M), so the candle is running on lighter participation than the earlier spike. The order book is 85% buy-side, but that is a thin book after a halt, so its reading is less useful than usual. The 0.31204 high is the level to clear, and the 0.23 MA7 is the first support on any pullback. A loss of the 0.20 cluster would signal that the post-exploit buying has faded. #ByXIMPACT
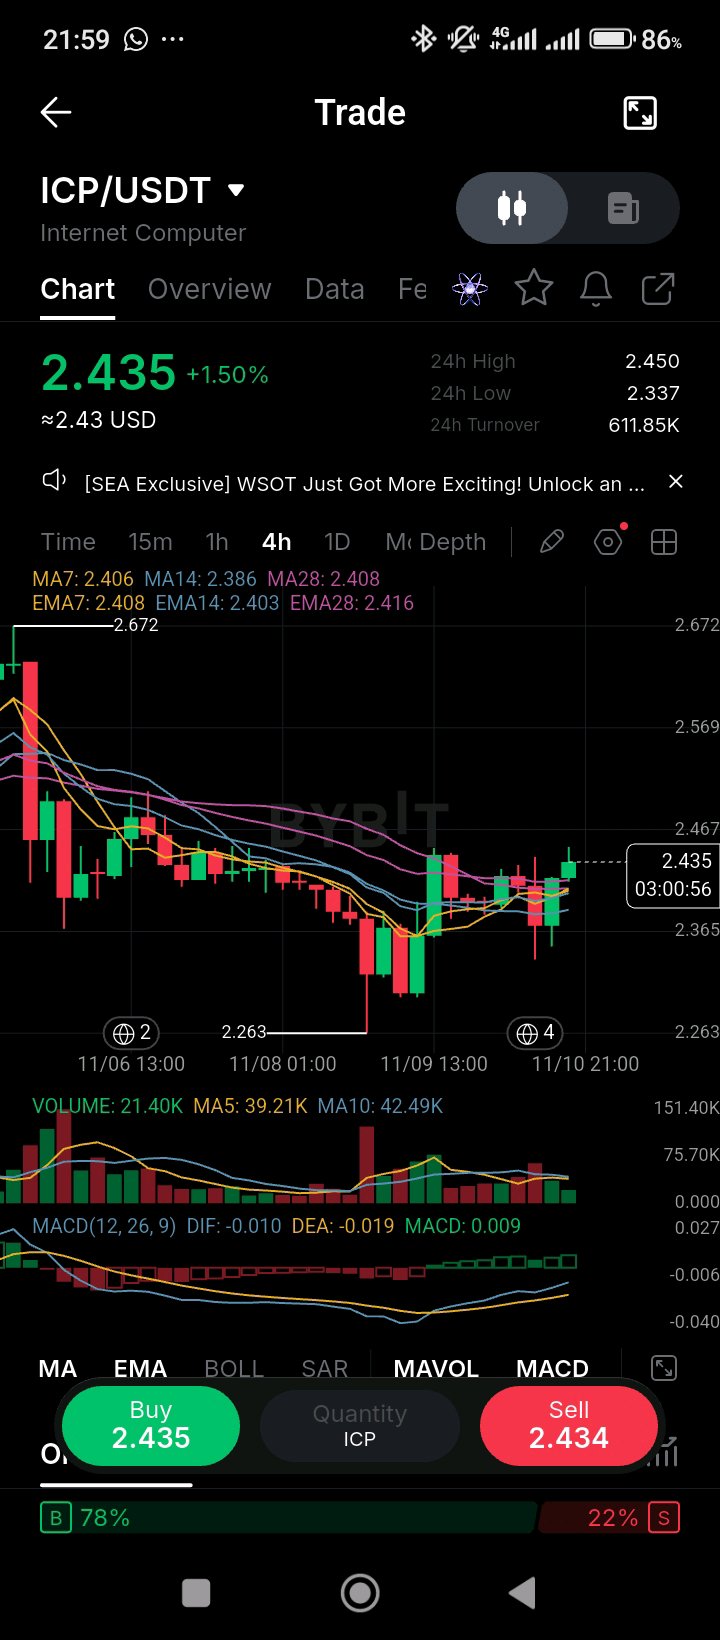
Internet Computer is back above all its moving averages on a day the broader market sold off, and the protocol's supply reform is the part most traders are still pricing in. In March, DFINITY announced a "Mission 70" economic revision that cuts ICP's inflation by about 70%, with cloud engine revenue split 80% to node providers and 20% burned. That makes the token's value depend on real usage fees rather than on new issuance, which is a meaningful change. The distribution side moved too: Upbit listed ICP with KRW pairs in March, adding one of the most active retail markets in crypto. On November 2, the MULTI/DEX play-mode update went live, a fully on-chain order book in test mode with no real funds, and the price barely reacted at about $2.50. CoinMarketCap's note from November 5 found no ICP-specific news behind a 5.6% drop that day, which points to the wider market rather than the protocol. The chart shows ICP holding above its averages. It's up 1.50% to 2.435, on a 24-hour range of 2.337 to 2.450. Price sits above the MA7 (2.406), MA14 (2.386) and MA28 (2.408), and above the EMA7 (2.408), EMA14 (2.403) and EMA28 (2.416). MACD is positive (0.009), with the DIF (-0.010) crossing up through the DEA (-0.019). Volume (21.40K) is about half the MA5 (39.21K) and MA10 (42.49K), so the bounce isn't drawing much participation. The order book is 78% buy-side. The 2.41 to 2.42 averages, where the MA28 and EMA28 sit, are the first level to hold. A close above the 2.45 intraday high would test the 2.67 November high. A loss of 2.41 would bring the 2.26 low back into view. $ICPUSDT #ByXIMPACT
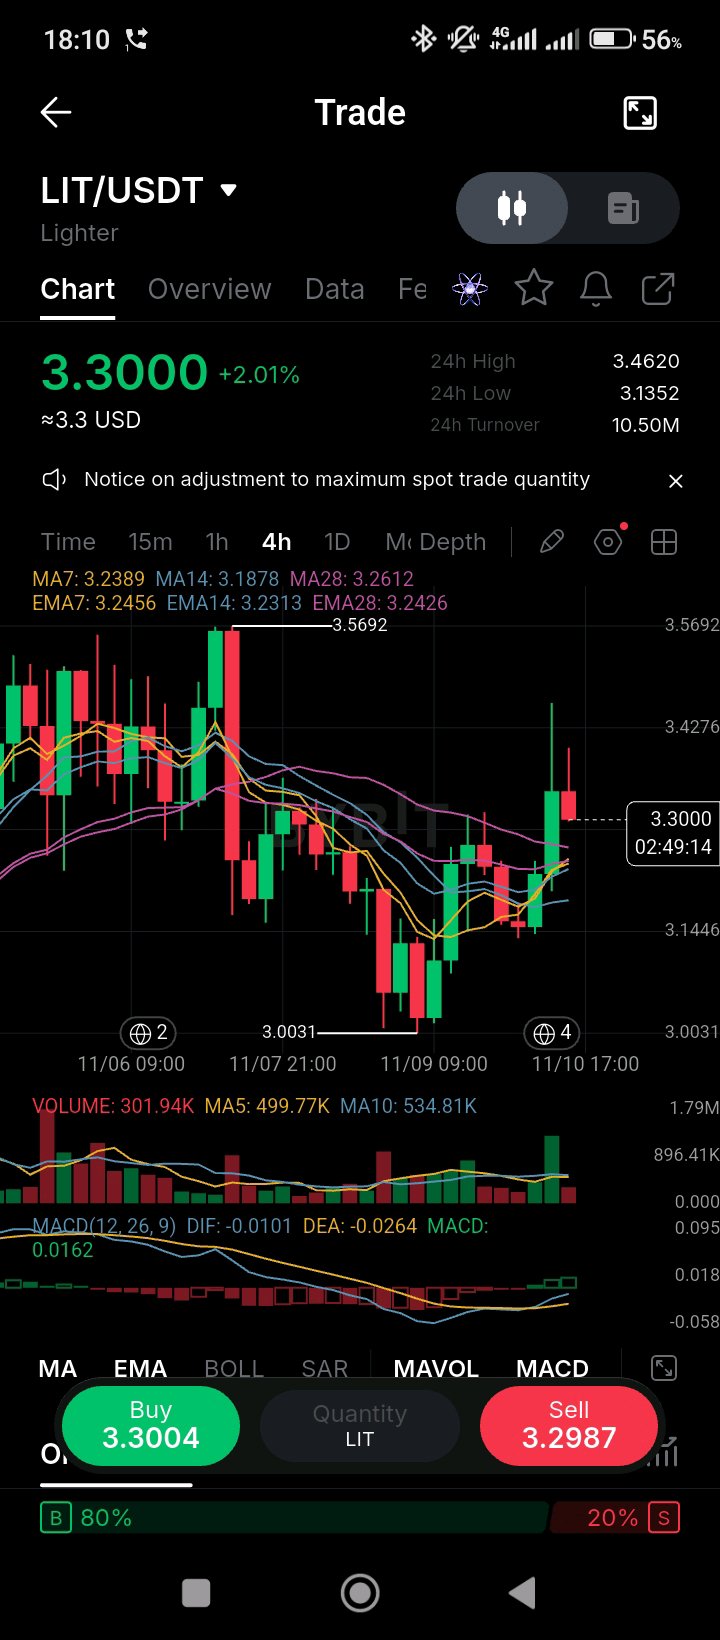
look at Lighter, and the token is now above all three averages after the November bounce, but the protocol's security setup is the part traders rarely check. A DataWallet explainer updated in October 2026 puts Lighter's annual protocol revenue near $26 million, which goes toward public-market buybacks for holders. That's consistent with the buyback story from the earlier posts, and the monthly figure works out to roughly $2 million to $3 million. The same piece flags a security item worth knowing: an October upgrade added two guardian roles that can pause batches and withdrawals for up to 72 hours, and neither role has been assigned yet. Lighter is still classed as a Stage 0 rollup, because its security council can bypass the 21-day upgrade delay. Users can still exit to Ethereum if the system freezes, but the team has a fast path for upgrades that hasn't been tested with an exit window. None of that is a red flag on its own, but it's the kind of detail to track before sizing a position. The chart has turned up. LIT is up 2.01% to 3.3000 on a 24-hour range of 3.1352 to 3.4620. Price is above the MA7 (3.2389), MA14 (3.1878) and EMA7 (3.2456), EMA14 (3.2313) and EMA28 (3.2426), but still under the MA28 (3.2612), which sits just overhead. MACD is positive (0.0162), with the DIF (-0.0101) crossing up through the DEA (-0.0264). Volume (301.94K) is under the MA5 (499.77K) and MA10 (534.81K), so this leg is coming in on light participation. The order book is 80% buy-side. The 3.26 MA28 is the level that matters. A close above it on rising volume would open the way back to the 3.57 high. A fall back below the 3.13 low would undo the November bounce. $LITUSDT #ByXIMPACT
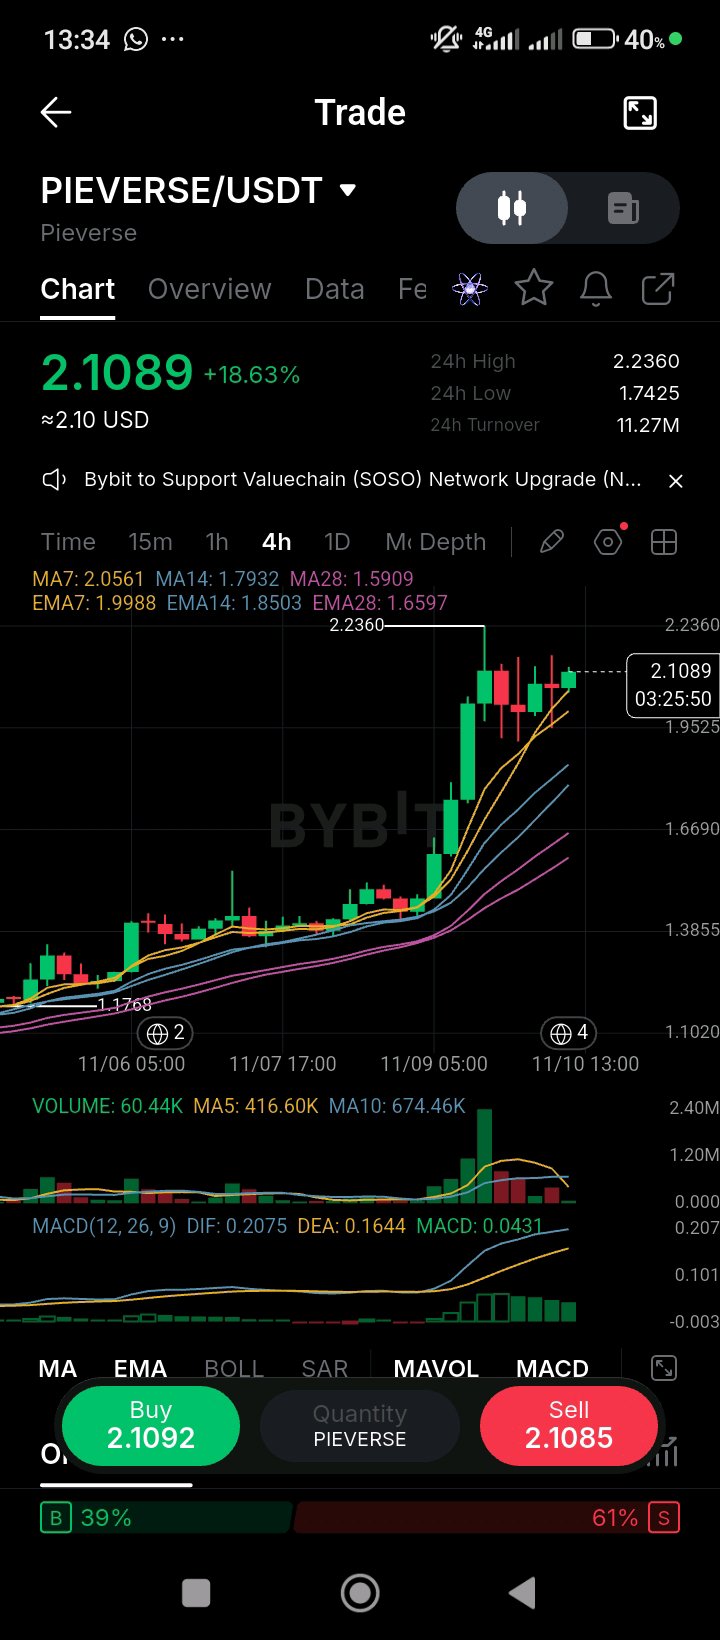
Token Profile: Pieverse ($PIEVERSE) Pieverse ($PIEVERSE) is a decentralized multi-chain ecosystem token powering interactive virtual experiences, digital asset marketplaces, and community-driven Web3 applications. Operating with specialized utility across immersive virtual worlds and tokenized reward protocols, connects creator economies with decentralized liquidity rails. Designed with an ecosystem-focused tokenomics model, the native token underpins platform governance, cross-chain marketplace settlements, staking incentives, and ecosystem growth allocations across participating virtual infrastructure networks. Technical Breakdown: PIEVERSE/USDT — 4-Hour (4H) Bullish Expansion & Moving Average Support On the 4-hour chart, PIEVERSE is trading around **$2.1089** (+18.63%)[span_0](start_span)[span_0](end_span), maintaining strong upside momentum after staging an aggressive parabolic markup leg toward its local high of **$2.2360**[span_1](start_span)[span_1](end_span) from a previous consolidation base around **$1.1768**[span_2](start_span)[span_2](end_span). * **Moving Average Dynamic Support Ribbon:** Price action is well-supported above a strongly bullish, upward-sloping moving average stack[span_3](start_span)[span_3](end_span). Immediate dynamic support is rising sharply at **$2.0561 (MA7)**[span_4](start_span)[span_4](end_span) and **$1.9988 (EMA7)**[span_5](start_span)[span_5](end_span), with broader trend support trailing at **$1.8503 (EMA14)**[span_6](start_span)[span_6](end_span), **$1.7932 (MA14)**[span_7](start_span)[span_7](end_span), **$1.6597 (EMA28)**[span_8](start_span)[span_8](end_span), and **$1.5909 (MA28)**[span_9](start_span)[span_9](end_span). Sustaining a 4-hour close above the $1.99–$2.05 dynamic support zone keeps the active bullish continuation structure fully intact[span_10](start_span)[span_10](end_span). * **Support Base & Resistance Defenses:** Immediate upside resistance is anchored at the recent swing peak of **$2.2360**[span_11](start_span)[span_11](end_span). Structural floor support is firmly established at the multi-day base low of **$1.1768**[span_12](start_span)[span_12](end_span), with intermediate local pullbacks supported around the 24h low of **$1.7425**[span_13](start_span)[span_13](end_span). * **Volume & MACD Profile:** 4-hour turnover registers at **11.27M USDT**[span_14](start_span)[span_14](end_span), backed by strong historical volume spikes during the primary impulse leg (with a 5-period MA volume of 416.60K and 10-period baseline of 674.46K)[span_15](start_span)[span_15](end_span). The 4-hour MACD (DIF: 0.2075, DEA: 0.1644) remains firmly positive above zero[span_16](start_span)[span_16](end_span), accompanied by expanding green histogram bars (MACD: 0.0431)[span_17](start_span)[span_17](end_span), confirming robust buying momentum during this consolidation phase below highs[span_18](start_span)[span_18](end_span). Are you riding the momentum continuation toward a break of the $2.23 high, or waiting to bid a pullback retest near the $2.00 dynamic support ribbon? $PIEVERSEUSDT $TRXUSDT #ByXIMPACT