BitXenMaster
30097點贊37分享342粉絲14關注
Honest and simple 💖📈
Honest and simple 💖📈
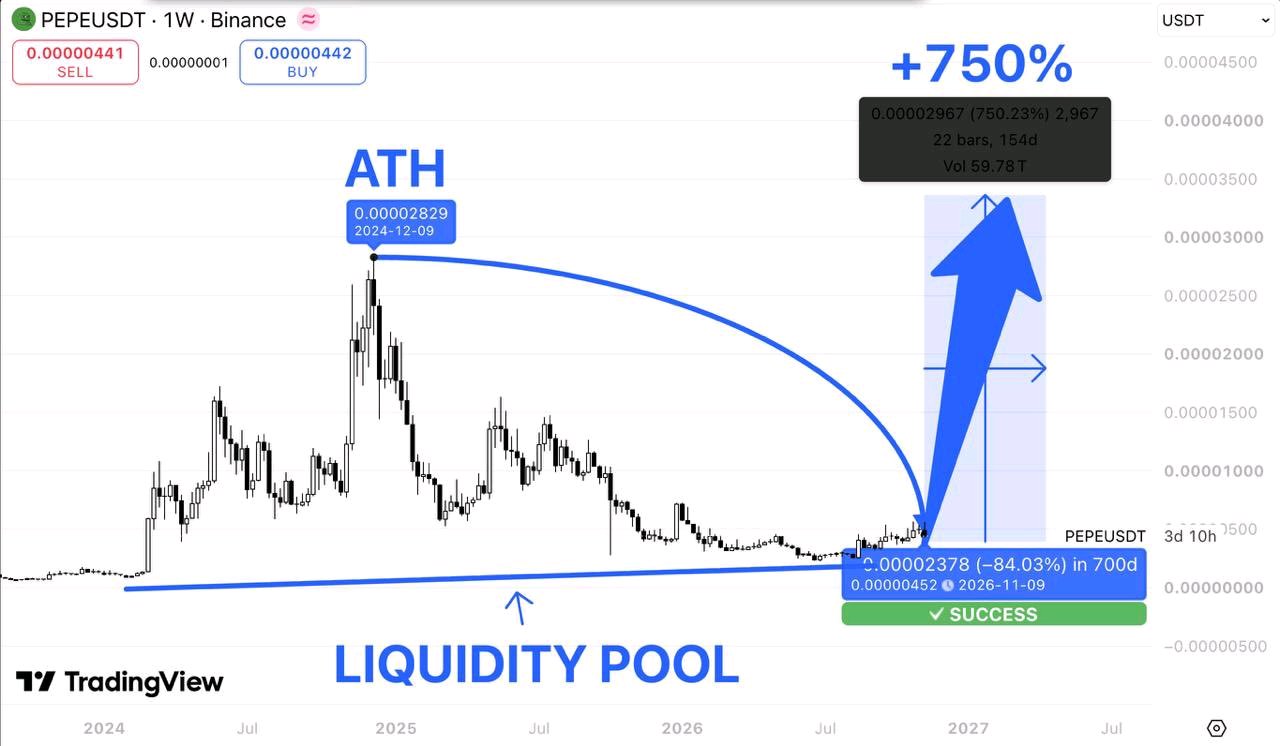
$PEPE is trading around $0.0000044.
And this weekly chart is showing a setup that could become very interesting. Remember when $PEPE reached its all-time high near $0.0000283 in December 2024? Since then, it's been a brutal correction. Lower highs. Failed recoveries. Months of persistent selling pressure. Now price is down more than 84% from its previous peak. But look at where we're sitting. $PEPE has returned to a major long-term liquidity zone, near the same historical price region that preceded its earlier explosive rallies. And that's what caught my attention. After months of declining prices, the market is beginning to stabilize near its lows. Could this be the foundation for another major expansion? Possibly. But buyers still need to confirm it. Here's my roadmap. $0.000007 — First resistance to reclaim. $0.000010 — Important psychological level. $0.000016 — Major historical resistance. $0.0000283 — Previous ATH. And $0.000034? That's my aggressive bull scenario. The chart illustrates a potential 750% rally from its marked historical reference point. But here's the important part. A return to historical support doesn't automatically mean the bottom is in. I want to see $PEPE establish higher lows, reclaim $0.000007, and eventually break above $0.000010 with sustained buying volume. That would provide stronger evidence that the weekly structure is shifting. Without those confirmations, the broader downtrend remains intact. Still, the psychology is fascinating. When $PEPE was trading near its all-time high, everyone wanted exposure. Now it's more than 80% below that peak, and sentiment looks very different. But meme coins can remain depressed for much longer than traders expect. The 750% projection is a speculative scenario, not a guaranteed outcome. For now, I'm watching whether buyers can defend this historical base. If the weekly structure finally reverses, $PEPE could become one of the more interesting recovery setups to follow.
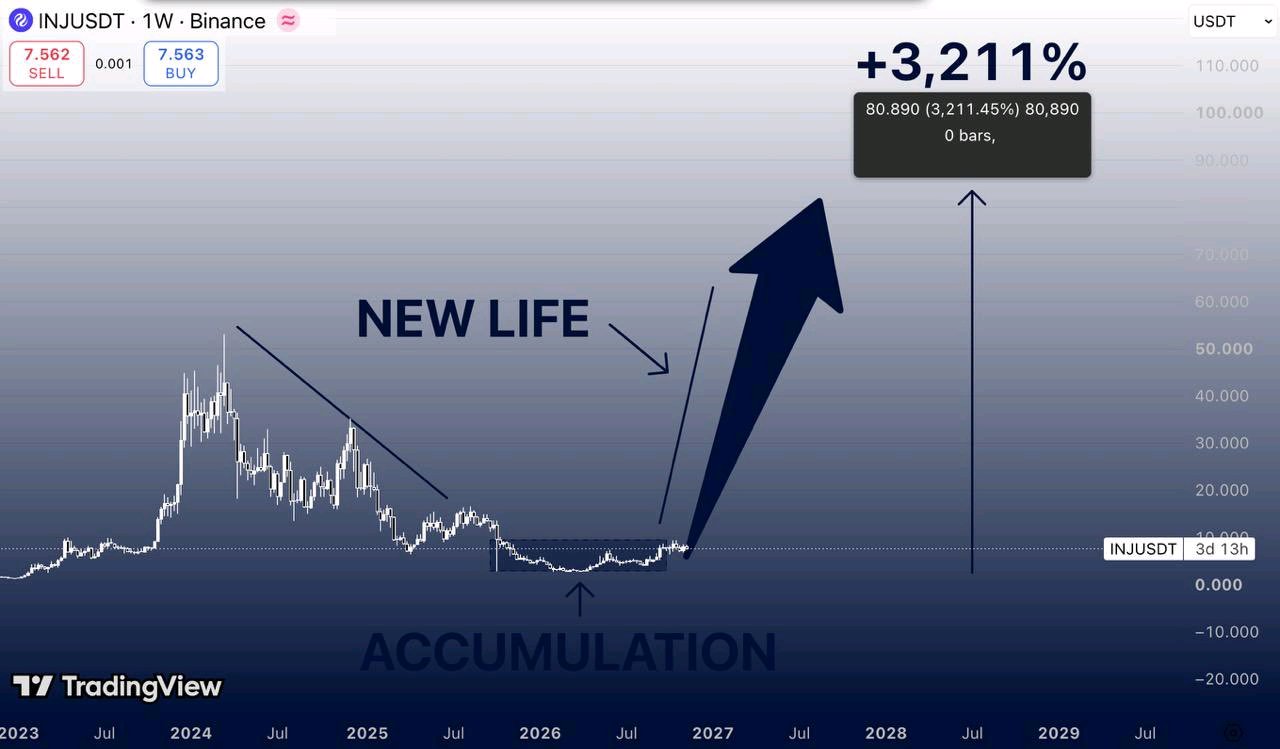
$INJ 目前的交易價格在 7.56 美元左右。 而這張週線圖開始顯示出一些非常有趣的東西。 還記得當 $INJUSDT 交易價格高於 50 美元的時候嗎? 回顧 2024 年,Injective 是山寨幣市場中表現最強勁的幣種之一。 然後一切都變了。 低點不斷下移。反彈失敗。近三年持續的拋售壓力。 但看看現在的價格位在哪裡。 經過大幅修正後,$INJ 已回到接近其歷史低點的長期積累區。 而且有些有趣的事情正在醞釀。 價格已在這個區間內盤整了好幾個月,而之前的下跌趨勢已開始失去動能。 這會是一個新市場週期的開始嗎? 有可能。但結構仍然需要確認。 這是我的路線圖: 10 美元 — 第一個需要收復的阻力位。 15–18 美元 — 下一個重要的復甦區間。 30–35 美元 — 主要的歷史阻力位。 45–50 美元 — 上一週期的歷史高點。 60 美元 — 潛在的突破延續位。 還有 80–85 美元?那是我極度看漲的情境。 該圖表顯示從其標記的歷史底部可能會有 3,211% 的漲幅。 聽起來很野心勃勃? 絕對是。 但請記住,$INJ 已經證明了當市場條件轉好時,它的走勢可以有多強勁。 不過,潛在的積累區和已確認的看漲反轉之間存在巨大的差異。 首先,我希望看到 $INJ 收復 10 美元,並在週線圖上建立明確的高點不斷墊高、低點也不斷墊高的走勢。 若能持續突破 15–18 美元區間,將能強化結構性大反轉的論點。 若沒有這些確認訊號,廣泛的下跌趨勢仍然是一個風險。 但這就是這個佈局有趣的地方。 2024 年時,交易者還在 40 美元以上追逐 $INJ。 現在它的交易價格低於 8 美元,市場熱度幾乎完全消失了。 這並不自動代表底部已經出現。 但如果買家最終能守住這個長期底部並打破看跌結構,市場情緒的轉變可能會比大多數人預期的快得多。 80 美元的目標純屬推測。 首先重要的是,$INJ 是否能將這次盤整轉化為真正的看漲趨勢。 我正在密切關注這個積累區。 下一個重大走勢值得留意。
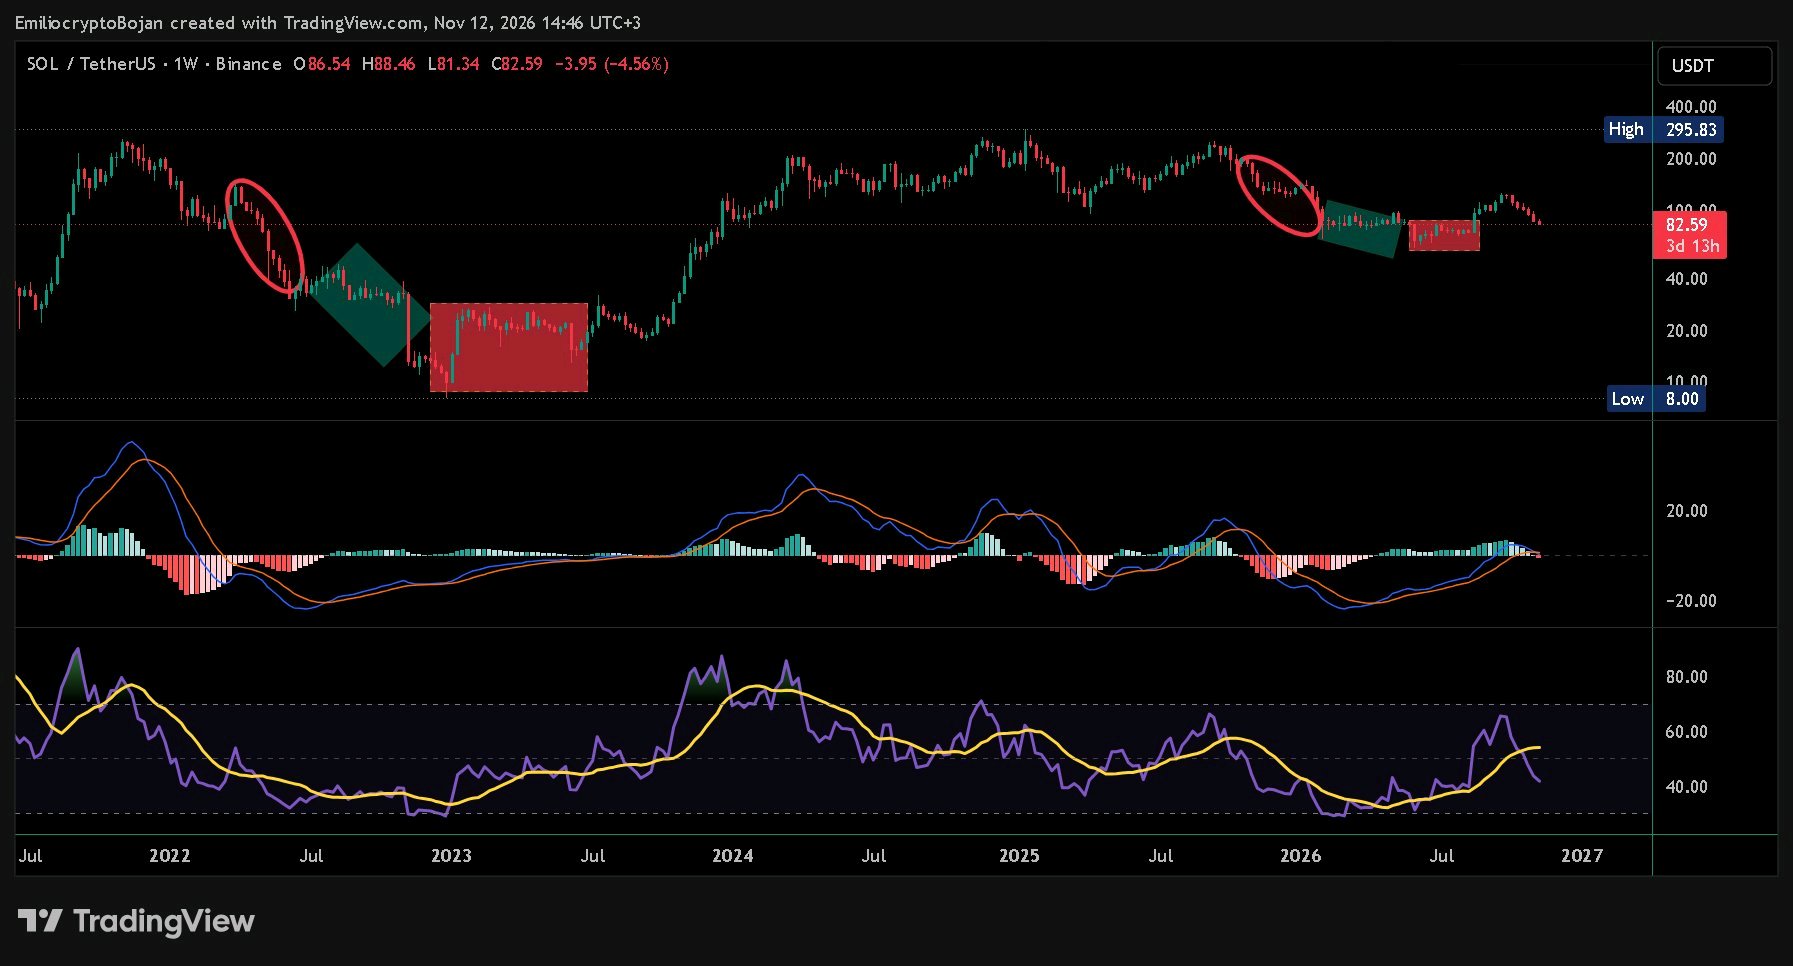
$SOLUSDT bulls are facing a huge blow today on the MACD. For the first time, we're seeing a negative histogram print on the weekly chart, signalling that sellers are gaining momentum and pushing for a bearish crossover. When the bears get their moment, we let them shine. But don't mistake that for abandoning the bigger picture. One thing I'm convinced of in this cycle is that we may not revisit the kind of lows we witnessed in May and June. That period marked a major transition for altcoins, moving from a bearish market structure toward a bullish phase. Take a closer look at my chart. I've drawn trend lines highlighting a repetitive pattern in how $SOL has behaved. We've seen a similar structure play out before, particularly in 2023. History doesn't have to repeat itself perfectly, but these similarities are worth watching. The market is testing conviction right now. Many will give up during this phase, while others will stay focused on the bigger picture. Whoever survives this dump deserves a 1,000x pump. 🚀 #WSOT2026 #USInflationRunsHotAndRateHikeBetsRise #SanDiskAnnounces8For1StockSplit #AnthropicIPOTestsTheAIBoom #BitcoinHitsTwoMonthLowAfterUSMidterms $BTCUSDT
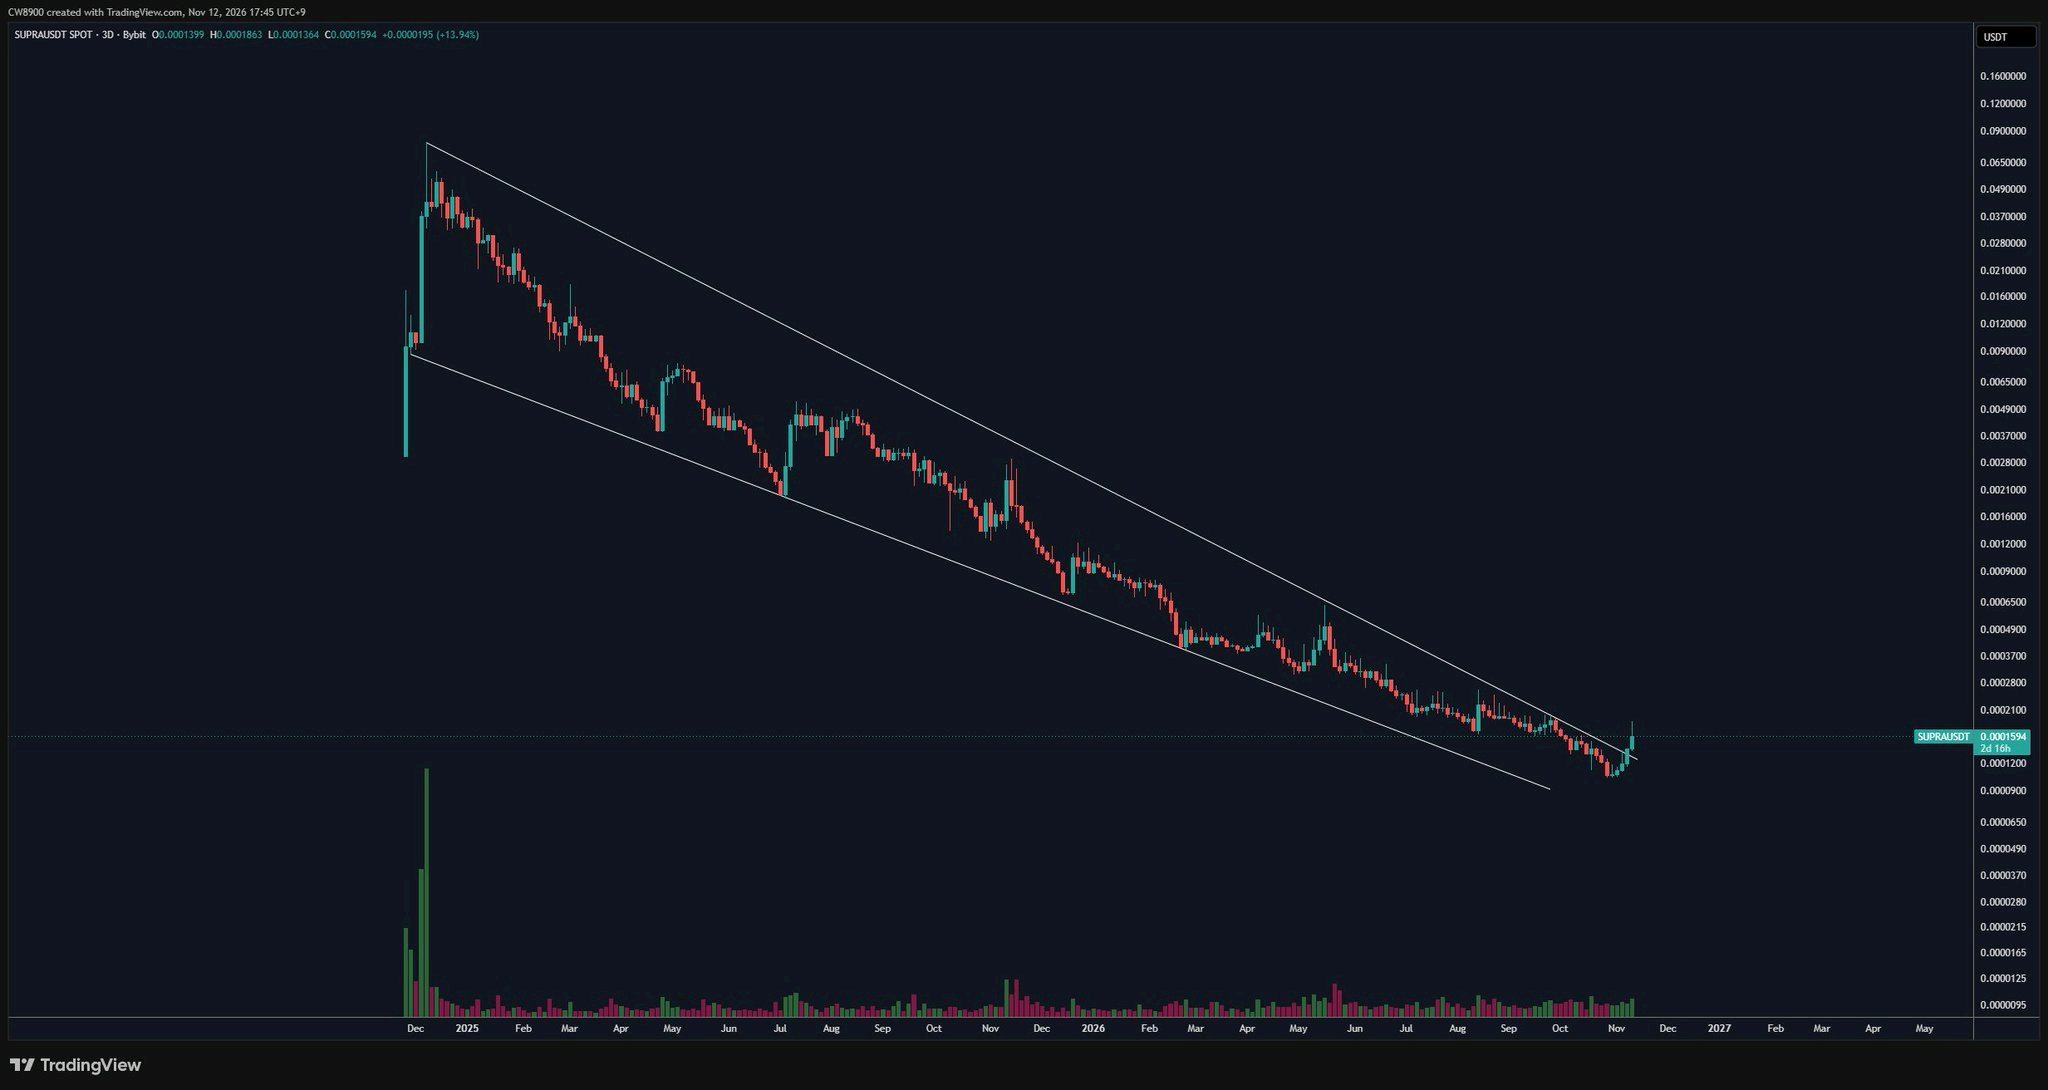
$SUPRAUSDT has broken out of a massive falling wedge pattern. The downtrend has ended, and an uptrend is beginning. #USPayrollsAndRateDecisionsDriveMacroWeek #NovUSCPIWatch #DeutscheBankLaunchesDigitalAssetCustody #AITechSelloffErases2Point5TrillionFromNasdaq100 #PiecesOf8
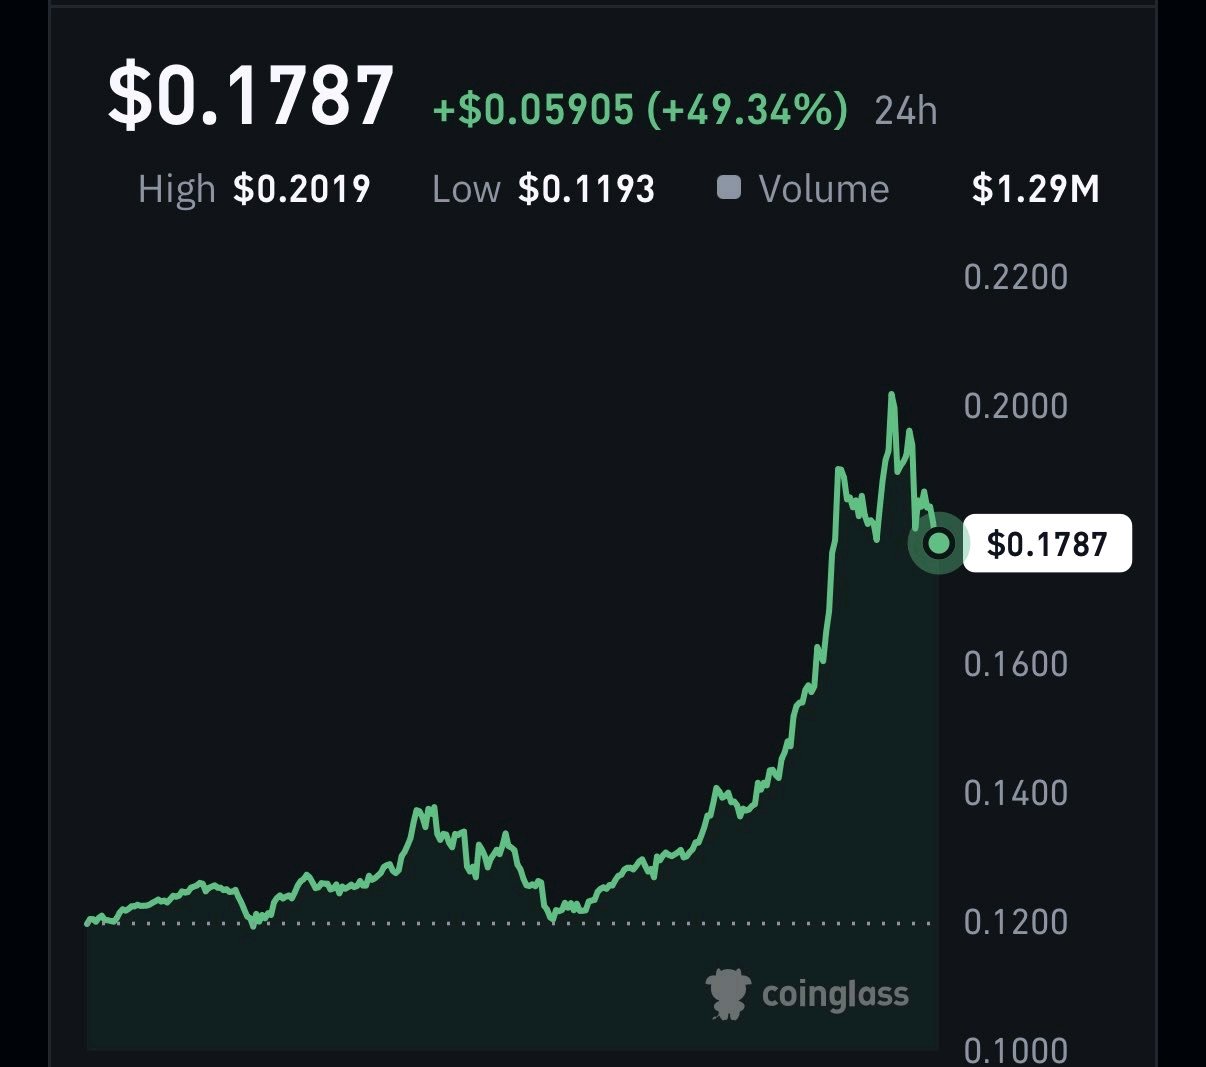
Let Me Tell You What I’m Watching on $INITUSDT First, look at the Open Interest.We can see that $INIT Open Interest is around $20.1M, up 130.65% in the last 24 hours. This is a significant increase in open positions. Trading activity and volume are also picking up, suggesting that market participation is increasing. But here’s what makes things interesting. The funding rates are extremely negative. Binance is showing around -1.3648%, Bybit around -2.0254%, and Hyperliquid around -2.6507%. This indicates that short positions are paying funding to long positions. At the same time, the short-term long/short ratio shows that around 58% of traders are short, while only 42% are long. So, we have sharply rising Open Interest, increasing volume, deeply negative funding rates, and more traders positioned short. In my view, if buying pressure continues, these heavily crowded short positions could create conditions for a short squeeze. However, with Open Interest rising so quickly, volatility and sudden price swings are also possible.Keep an eye on the next move. NFA. DYOR. #NovUSCPIWatch #WSOTPicktoEarn10U #WSOT2026 #USPayrollsAndRateDecisionsDriveMacroWeek #OilVolatilityTracksIranPeaceTalks
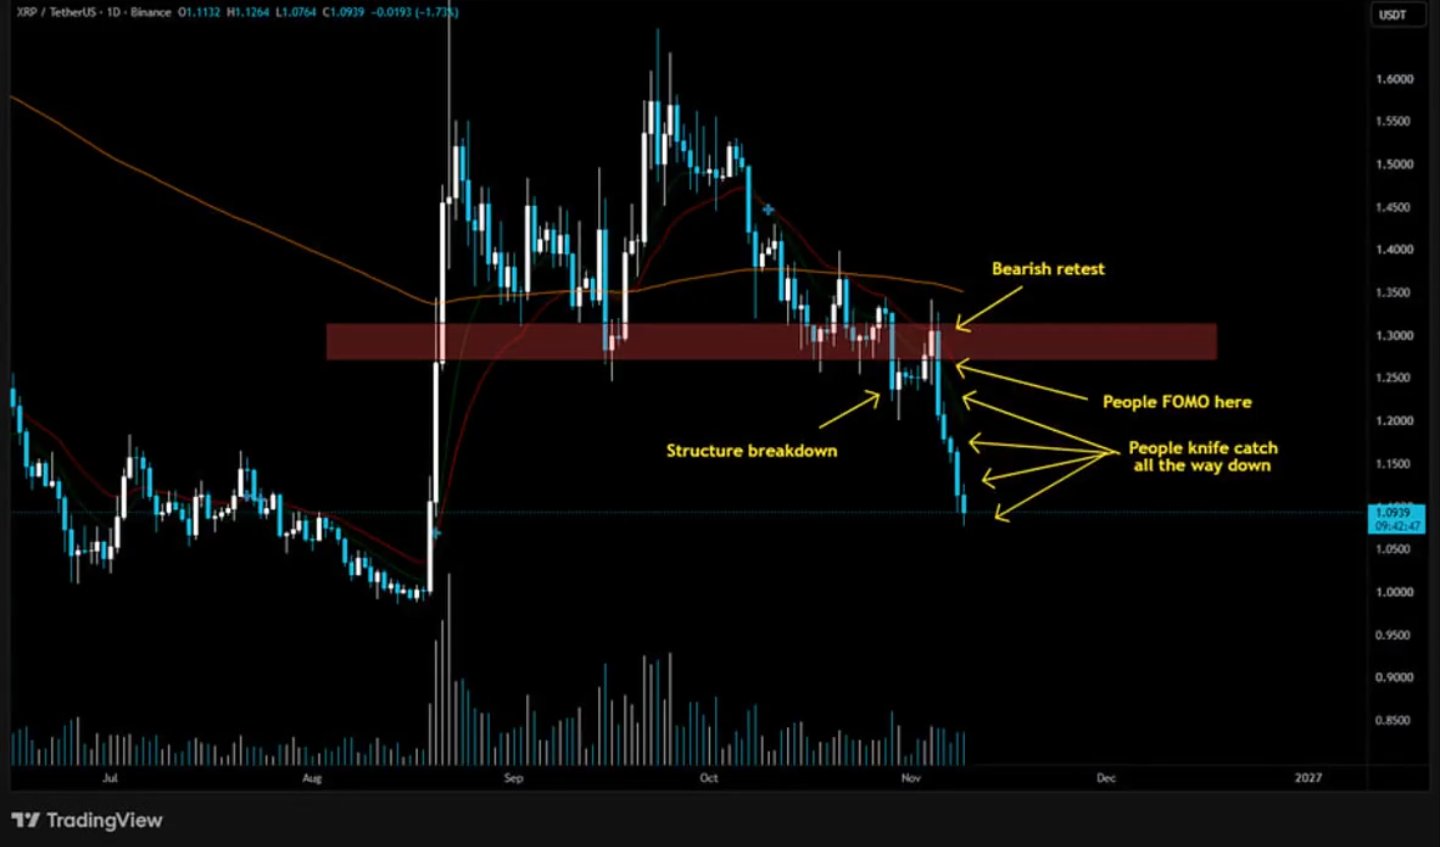
Just because $XRPUSDT is cheap doesn’t mean it’s a good buy. This recent downturn has taught the market an important lesson. When key support levels are decisively broken, a lower price does not necessarily represent a better buying opportunity. On the contrary, it often signals that sellers have taken control and that the market’s adjustment phase may not yet be over. Personally, I prefer to wait for the price to reclaim key levels and for buying interest to return before considering an entry. Levels to watch: $1.10 → $1.05 → $1.00 If support fails to hold, don’t rush to "buy the dip." Only look for potential rebound opportunities if the price manages to climb back above key resistance levels. Don’t try to catch a falling knife just to nail the absolute bottom. Protect your capital and wait for a genuine opportunity. #WSOT2026 #NovUSCPIWatch #WSOTPicktoEarn10U #USPayrollsAndRateDecisionsDriveMacroWeek #OilVolatilityTracksIranPeaceTalks $MNTUSDT
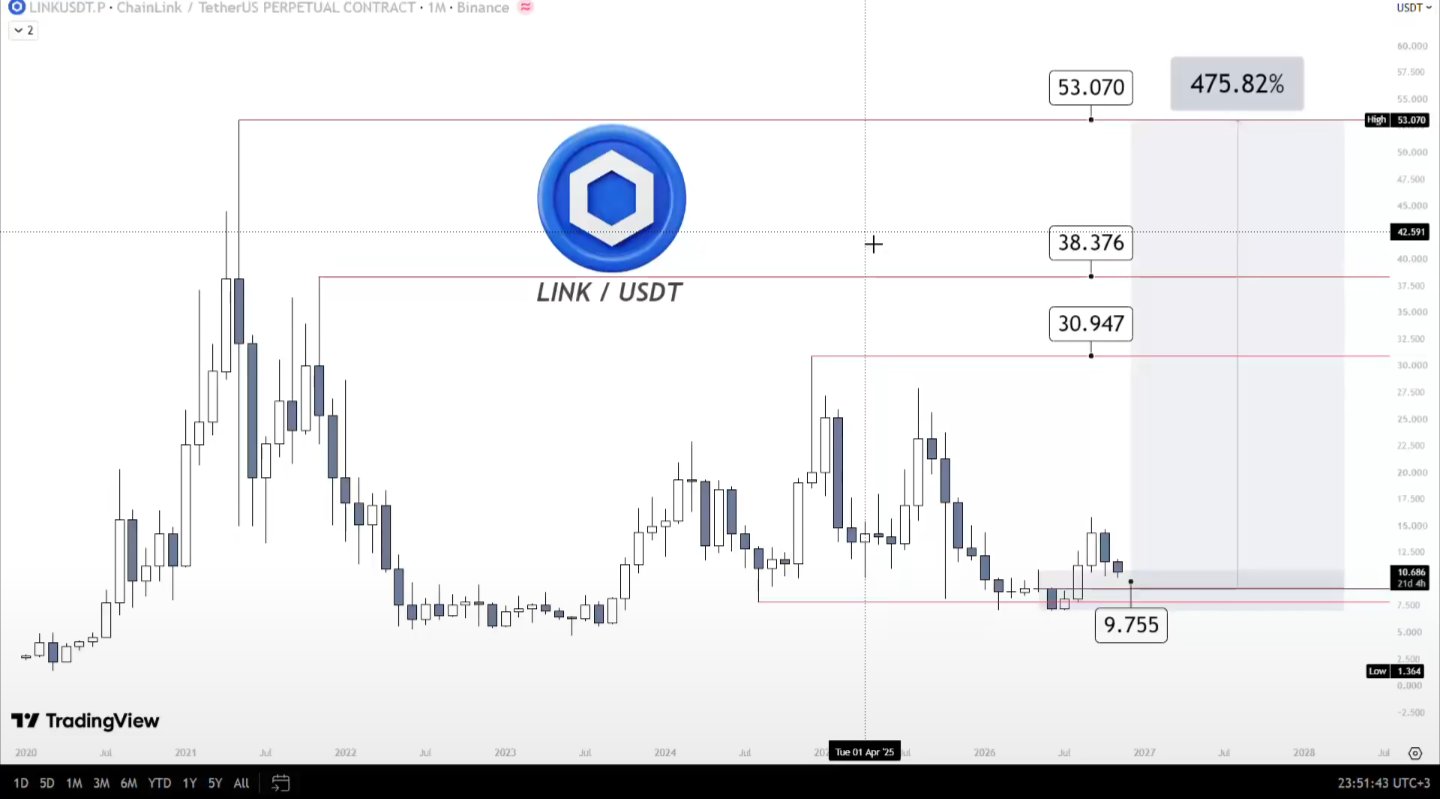
$LINKUSDT - 一個潛在 500% 的機會🚀 我相信 Chainlink 是在下一次主要山寨幣擴張前,最值得積累的基礎建設項目之一。 什麼是 Chainlink? Chainlink 是一個去中心化的預言機網路,將區塊鏈與現實世界數據及傳統金融基礎設施連接起來。 其技術使智能合約能夠訪問外部數據、在不同區塊鏈之間傳輸信息,並支持現實世界資產(RWA)的代幣化。 為什麼選擇 LINK?主要催化劑 RWA 的採用。股票、債券和其他金融資產的代幣化,創造了對可靠區塊鏈基礎設施的需求。 機構採用。Chainlink 已與 SWIFT、Mastercard 及各大金融機構建立了整合與合作關係。 CCIP。其跨鏈基礎設施實現了不同區塊鏈網絡之間的安全通信與轉移。 Chainlink 儲備。來自網絡服務的收入可轉換為 LINK,創造了代幣需求的額外來源。 市場心理 大多數散戶投資者是在資產已經出現顯著漲幅後才開始感興趣。 我傾向於在市場關注度較低的時期識別項目,此時基本面持續發展,但價格走勢尚未反映出這些進展。 這就是我認為 LINK 目前存在有趣機會的地方。 聰明錢 (Smart Money) 分析 我主要的積累興趣點在 9.75 美元附近。 我正在監控當前價格下方的流動性,以及在下一次擴張前出現更深回調的可能性。 然而,價格不一定非要達到 9.75 美元。如果流動性提前被收集且看漲結構形成,反轉可能發生在此價位上方。 我不會追高。我希望在風險回報比合理的價位進行積累。 我的目標:53 美元 從 9.75 美元的積累區間計算,代表大約 443% 的上漲空間。 我的論點基於三個因素: 日益增長的機構採用。 RWA 和跨鏈基礎設施的擴張。 流動性可能回流至基本面強勁的山寨幣。 目標很簡單:在下一次重大擴張之前進行積累,而不是之後。 #WSOT2026 #NovUSCPIWatch #WSOTPicktoEarn10U #美國就業數據與利率決策主導本週宏觀市場 #石油波動追蹤伊朗和平談判 $ETHUSDT
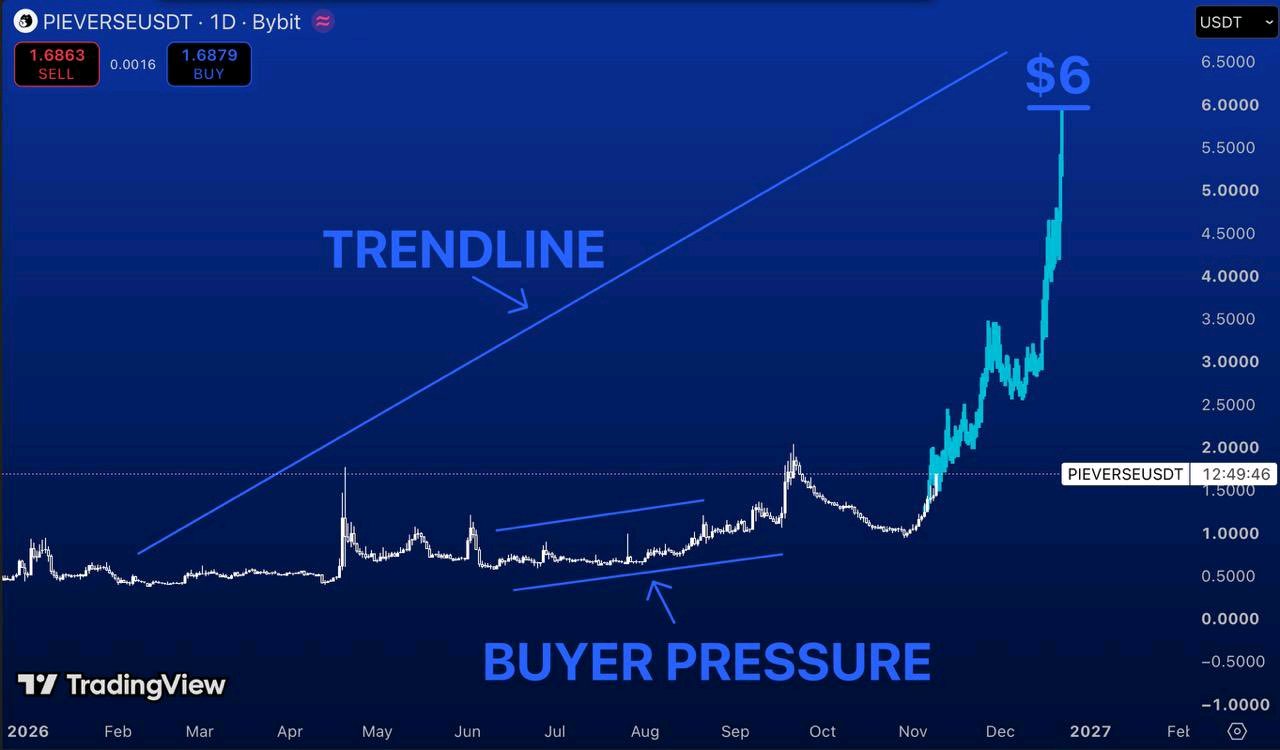
$PIEVERSEUSDT is trading around $1.69. And unlike most altcoins, this chart is actually showing signs of strength. Look at the daily timeframe. After months of consolidation, buyers started stepping in around $0.50–0.70. Higher lows began forming. Selling pressure weakened. Then price broke out and made a strong move toward $2. What's interesting is the structure behind that move. We're no longer looking at a coin stuck in a downtrend. We're looking at an asset attempting to establish a new bullish trend. Here's what I'm watching. $2 - The first major resistance to reclaim. $3–3.50 - The next area where sellers could step in. $4.50 - A potential continuation target. And $6? That's my aggressive bull scenario. The chart illustrates a possible move toward the upper trendline, but that doesn't make the target guaranteed. I want to see $PIEVERSE hold above $1.50 and continue building higher lows. Lose that structure, and the bullish thesis starts weakening. Because the most important part of this chart isn't the $6 target. It's whether buyers can keep control after the initial breakout. And right now, that's exactly what I'm watching. #WSOT2026 #NovUSCPIWatch #WSOTPicktoEarn10U #USPayrollsAndRateDecisionsDriveMacroWeek $MNTUSDT #OilVolatilityTracksIranPeaceTalks
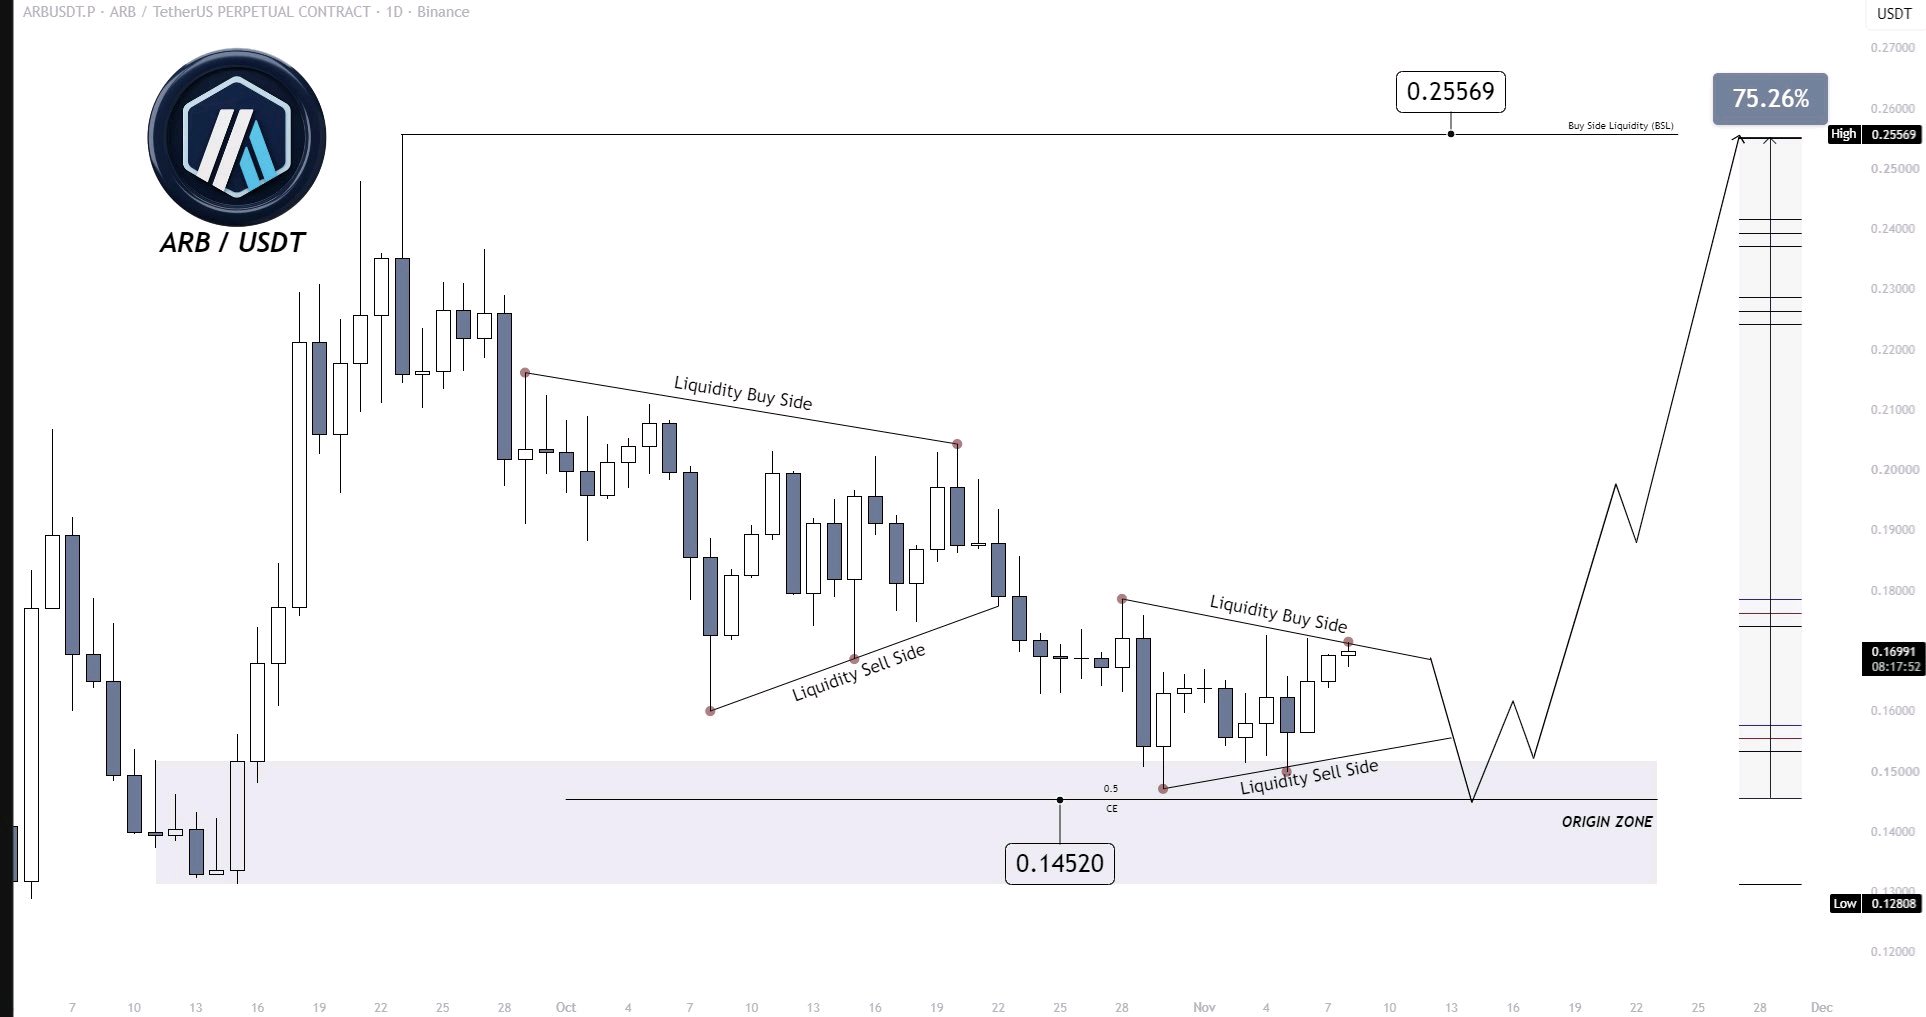
$ARBUSDT – Another liquidity manipulation before a potential reversal?👀 Previously, ARB formed a similar accumulation pattern, broke below the structure, but never retested our key 0.1452$ level Now, price appears to be forming almost the same setup again. The interesting part is what happens next. Will ARB break out and start moving higher, or are we about to see another liquidity sweep to the downside before a full reversal? My current expectation is a move lower, but I’m not rushing to open short positions. If price manages to reclaim the structure and establish itself above it, I’ll start looking for long opportunities instead. My targets: Short-term: 0.2557$ Long-term: 0.60$ #NovUSCPIWatch #WSOTPicktoEarn10U #USPayrollsAndRateDecisionsDriveMacroWeek #WSOT2026 #OilVolatilityTracksIranPeaceTalks $DOGEUSDT
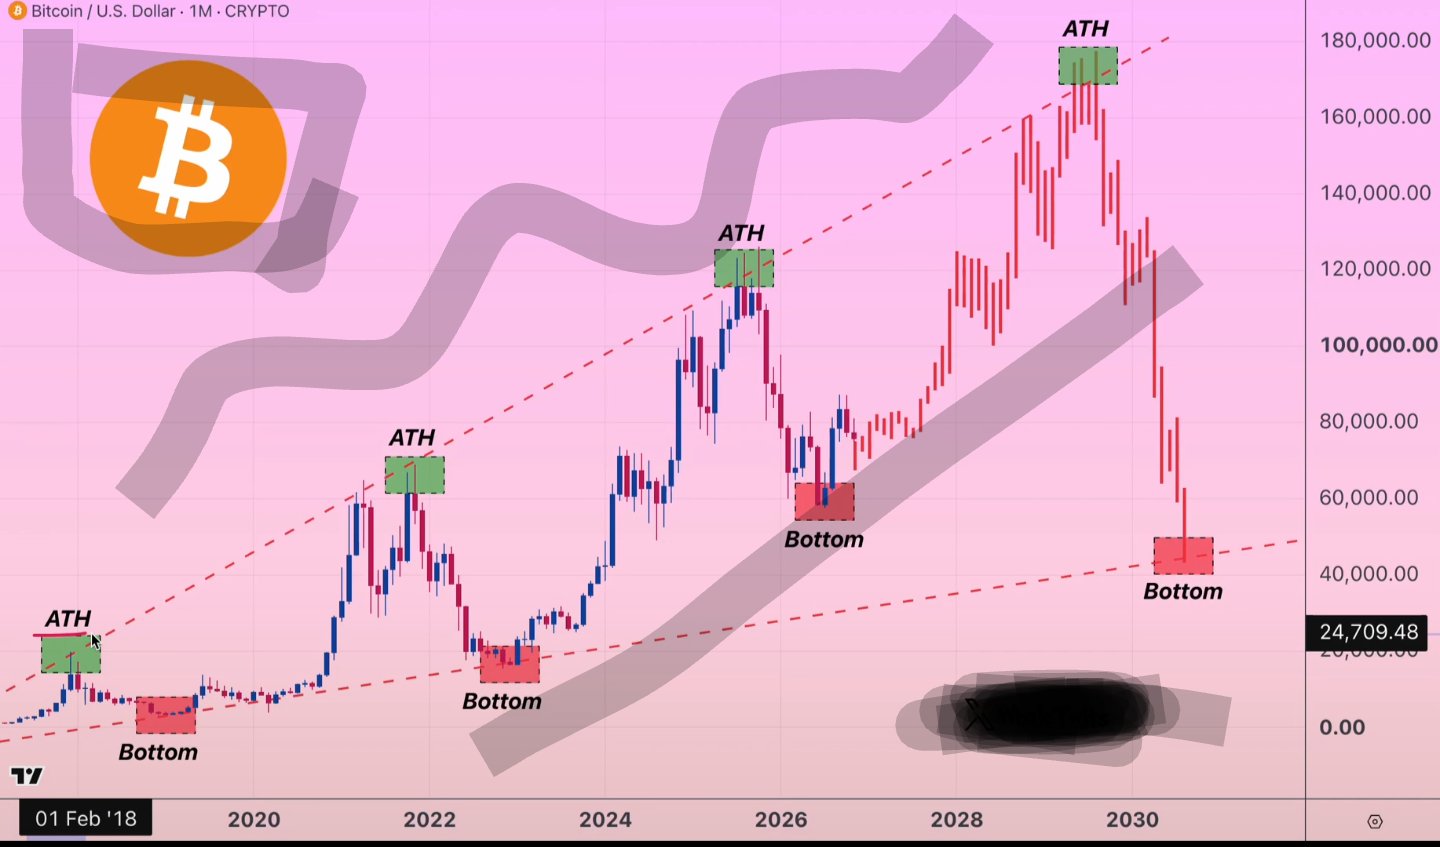
🚨 比特幣 $BTCUSDT 正在設下與 2018 年和 2022 年讓散戶投資者血本無歸時一模一樣的陷阱。 而我相信,下一步走勢可能會造就百萬富翁。 看看這張圖表。 2018 年:崩盤 → 復甦 → 創下歷史新高。 2022 年:崩盤 → 復甦 → 創下歷史新高。 2026 年:崩盤 → 復甦 → 創下歷史新高? 年份不同。但市場心理是一樣的。 首先,比特幣崩盤。 散戶投資者恐慌。 每個人都大喊加密貨幣已死。 然後,賣壓開始減弱。 $BTC 緩慢復甦。 但沒人相信。 「這不過是死貓反彈。」 接著,比特幣突破阻力位。 漲勢加速。 突然間,當初害怕買入的同一群人開始追高。 這時候,最佳的進場機會可能早已錯過。 大多數投資者不明白的是: 最大的機會通常不會出現在每個人都信心滿滿的時候。 它們出現在恐懼蔓延的時候。 當買入感覺像是最愚蠢的決定時。 我見過這種情況。 2022 年 11 月,我告訴所有人比特幣將在 16,000 美元見底。 我還預測了 2025 年 10 月 126,000 美元的週期頂部。 現在,我正在為下一個大機會做準備。 但我不會盲目買入。 我仍然認為可能還有最後一次投降式拋售。 在進行下一步操作之前,我想看到賣方精疲力竭、關鍵支撐位守住,並確認出現反轉。 因為如果歷史週期重演,今天每個人都害怕的價格,可能會變成他們渴望買入的價格。 歷史並不能保證未來。 但忽視再次出現重大復甦的可能性,可能會付出慘痛代價。 保存這張圖表。 追蹤並開啟通知。 當我看到下一個大買入訊號時,我會先在這裡分享。 大眾要等到看到比特幣再創新高時才會轉為看漲。 我正在等待那之前的機會。 別讓恐懼替你做決定。 #WSOT2026 #NovUSCPIWatch #WSOTPicktoEarn10U #美國就業數據與利率決策主導本週宏觀市場 #BybitAIEvolving
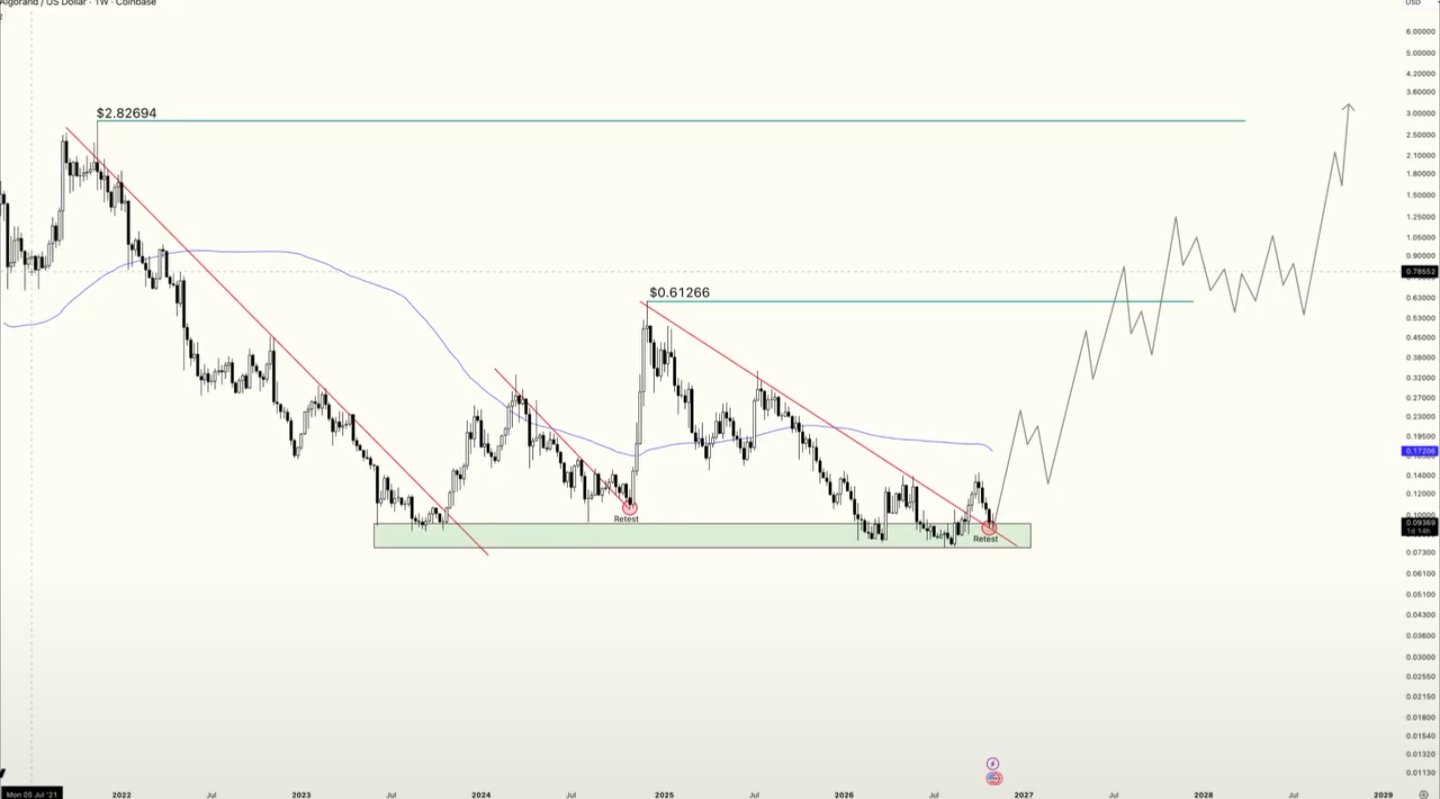
🚨 $ALGO IS TESTING ONE OF ITS MOST IMPORTANT LEVELS SINCE OCTOBER 2024. There's a historical pattern in Algorand that I'm watching closely: Break above a major bearish trendline. Retest that broken trendline. Strong rally follows. We've seen similar setups play out before. Right now, $ALGOUSDT has broken its long-term downtrend and is testing that trendline again. This is the level that matters. If support holds and buyers step in, the setup could become very interesting. I'm still confident in $ALGO's long-term potential, but I want to see confirmation before getting ahead of the market. $ALGO is one of the few altcoins I'm monitoring closely right now. Follow me and turn on notifications for more market updates. #ALGO #Algorand #Crypto #Altcoins #WSOTPicktoEarn10U #NovUSCPIWatch #USPayrollsAndRateDecisionsDriveMacroWeek #WSOT2026
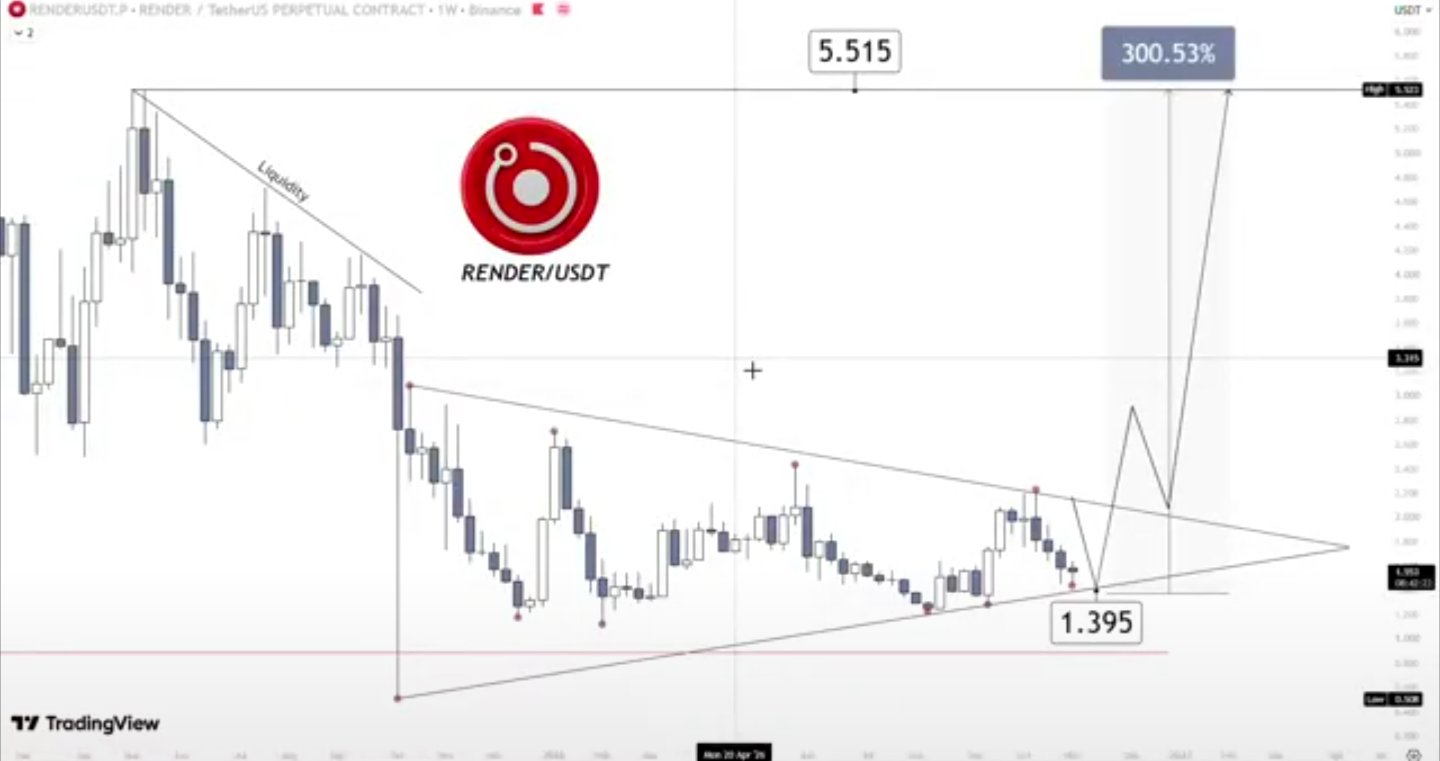
$RENDER – 這個結構值得你關注🚨
這是我目前觀察到最有趣的圖表之一。 在週線級別上,$RENDERUSDT 正在形成一個巨大的對稱三角形,價格正逼近該結構的頂點。 我們同時也觀察到當前價格上方堆積了龐大的流動性。 以下是我關注的原因: 1. 價格正接近一個關鍵決策區,可能會出現重大的突破。 2. 針對 1.395$ 的潛在流動性掃蕩,可能會在看漲反轉前提供最後的操縱走勢。 3. 若確認突破下降阻力位,可能會引發強勁的上漲,朝向更高的流動性水平邁進。 但我對 $RENDER 感興趣還有另一個原因。 基本面正在發展: 1. 該網絡已經處理了超過 8,250 萬幀的渲染。 2. SaladCloud 已經引入了 RENDER 支付和獎勵機制,擴大了生態系統內的實際需求。 3. 11 月 16 日,Render 將展示「Quantum Stargate」,這是一件由其去中心化 GPU 網絡驅動的沉浸式 8K 藝術作品。 這正是為什麼我認為 RENDER 值得放入你的觀察名單。 我的圖表顯示潛在的上漲空間約為 300%,目標價位看向 5.515$。 當然,確認訊號是一切的關鍵。在考慮看漲情境啟動前,我希望看到結構被突破。 別忽視這張圖表。下一次的大行情可能比許多人預期的還要近🚀 #期中選舉市場觀察 #AnthropicIPOValuationTest #英國央行利率決策 #BybitAIEvolving #石油波動追蹤伊朗和平談判
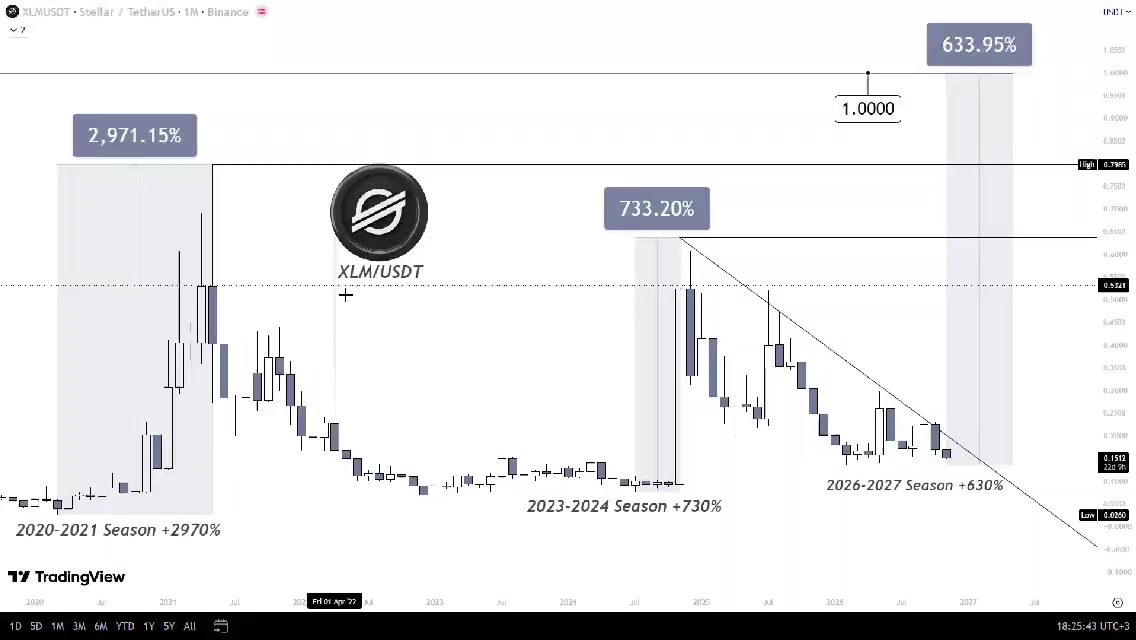
$XLMUSDT – Could Stellar be preparing for another 600%+ rally🚀 Let’s look at its historical performance. During the 2020–2021 bull market, XLM delivered an incredible +2970% rally. During the 2023–2024 season, it gained another +733% Now, heading into the 2026–2027 cycle, something interesting is developing. XLM is forming a large descending triangle on the monthly timeframe and is currently trading near its key historical lows. Here’s what I’m watching: 1. A breakout above the descending resistance. 2. A confirmed change in market structure. 3. Strong buying pressure and increasing volume. 4. A potential retest of the breakout zone before continuation. If this structure breaks to the upside, my chart maps a potential move of approximately +630% with 1$ as the target. But there’s one important factor I want everyone to pay attention to: Institutional adoption. Stellar is positioning itself as infrastructure for global payments and real-world asset tokenization. Its growing connections with major financial institutions could significantly strengthen the long-term ecosystem. If institutional adoption accelerates and capital flows back into the crypto market, XLM could become one of the interesting altcoin plays of the 2026–2027 cycle. History doesn’t guarantee a repeat, but this chart deserves attention. $XAUTUSDT
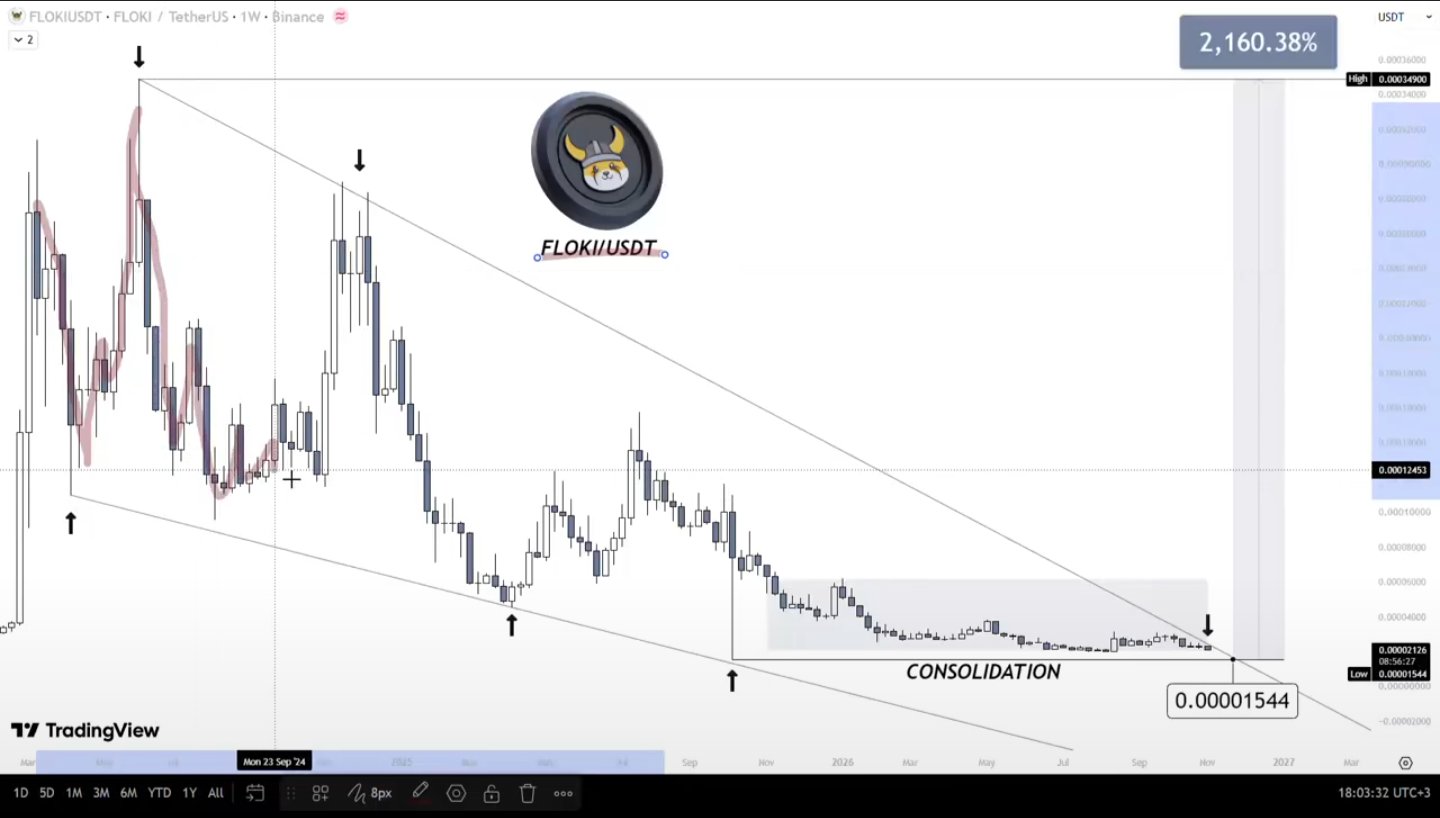
$FLOCKUSDT – Could this memecoin deliver a 2,000% rally during the 2026/27 bull run? 🚀 Here are 5 factors that could trigger a massive upside move: Massive meme coin season If capital starts flowing aggressively into the meme coin sector, FLOKI could become one of the major beneficiaries thanks to its established brand and large community. Valhalla ecosystem growth Valhalla is FLOKI flagship blockchain gaming project. If user adoption increases and the game attracts a larger audience, it could create additional demand for the ecosystem. Growing real utility FLOKI is building beyond the traditional memecoin narrative, with products such as FlokiFi, TokenFi, and its Trading Bot. Greater adoption could strengthen its long-term fundamentals. Exchange and institutional exposure Listings on major platforms, including Robinhood, alongside European ETP exposure, could help attract new investors and increase market accessibility. Token burns and growing demand Parts of the ecosystem’s revenue contribute to token burns. If product adoption grows while market demand increases, this could create a stronger supply-demand dynamic. My take: FLOKI already has something many new memecoins lack: brand recognition, an established community and a growing ecosystem. If the next bull run brings massive liquidity back into altcoins and meme coins, I believe FLOKI deserves a place on the watchlist. A 2000% move is an aggressive speculative scenario, not a guaranteed target. But this is exactly the kind of potential I will be watching during the next cycle. What do you think? Can $FLOKI deliver 20x+ in the next bull run?👀 #MidtermsMarketWatch #AnthropicIPOTestsTheAIBoom #BOERateDecision #BybitAIEvolving #OilVolatilityTracksIranPeaceTalks
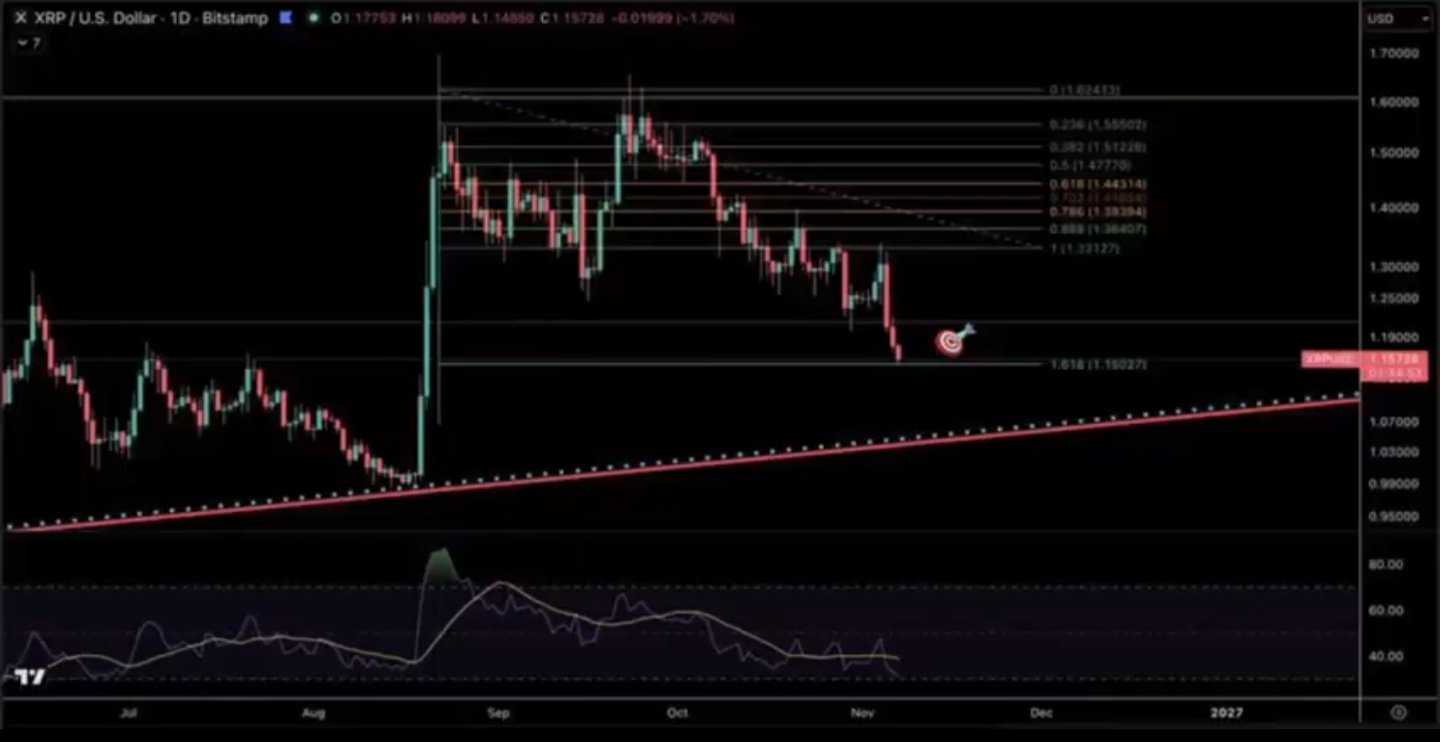
$XRPUSDT:$1.15 是目前值得關注的關鍵支撐位! 觀察日線圖,XRP 經歷了顯著回調,目前正在測試接近 $1.15 的 1.618 斐波那契擴展位。 這是多頭必須守住的關鍵區域。 如果 $1.15 能守住並出現明確的買盤回應,預計價格有潛力逐步反彈: $1.15 → $1.20 → $1.33 → $1.44 值得注意的是,收復 $1.20 將是短期趨勢好轉的第一個訊號。 如果 $1.15 失守,我們應看向下方的長期上升趨勢線——並小心不要過早預判底部。 在我看來,$1.15 是值得密切關注的點位,但真正的反轉仍需要透過價格行為來確認。 #XRP #Ripple #Crypto #Byximpact
不要讓短期的波動動搖您對 $XRPUSDT 部位的信心。 觀察圖表結構,$XRP 正在形成更高的高點,並不斷測試上方的水平阻力位。隨著支撐位逐漸上移,價格可能正準備迎接重大的方向性突破。 我的預測價格路徑: $1.40 → $1.55 → $1.85 → $2.20+ 如果價格帶量突破該水平阻力位,並成功將其轉化為支撐位,可能會為進一步上漲打開大門。 然而,在突破確認之前,請對潛在的「假突破」和回調保持謹慎。 避免因短期恐慌而做出衝動決策,也永遠不要忽視風險管理。 保持耐心,等待趨勢確認,讓市場證明多頭的實力。 #IMPACTbyTrade
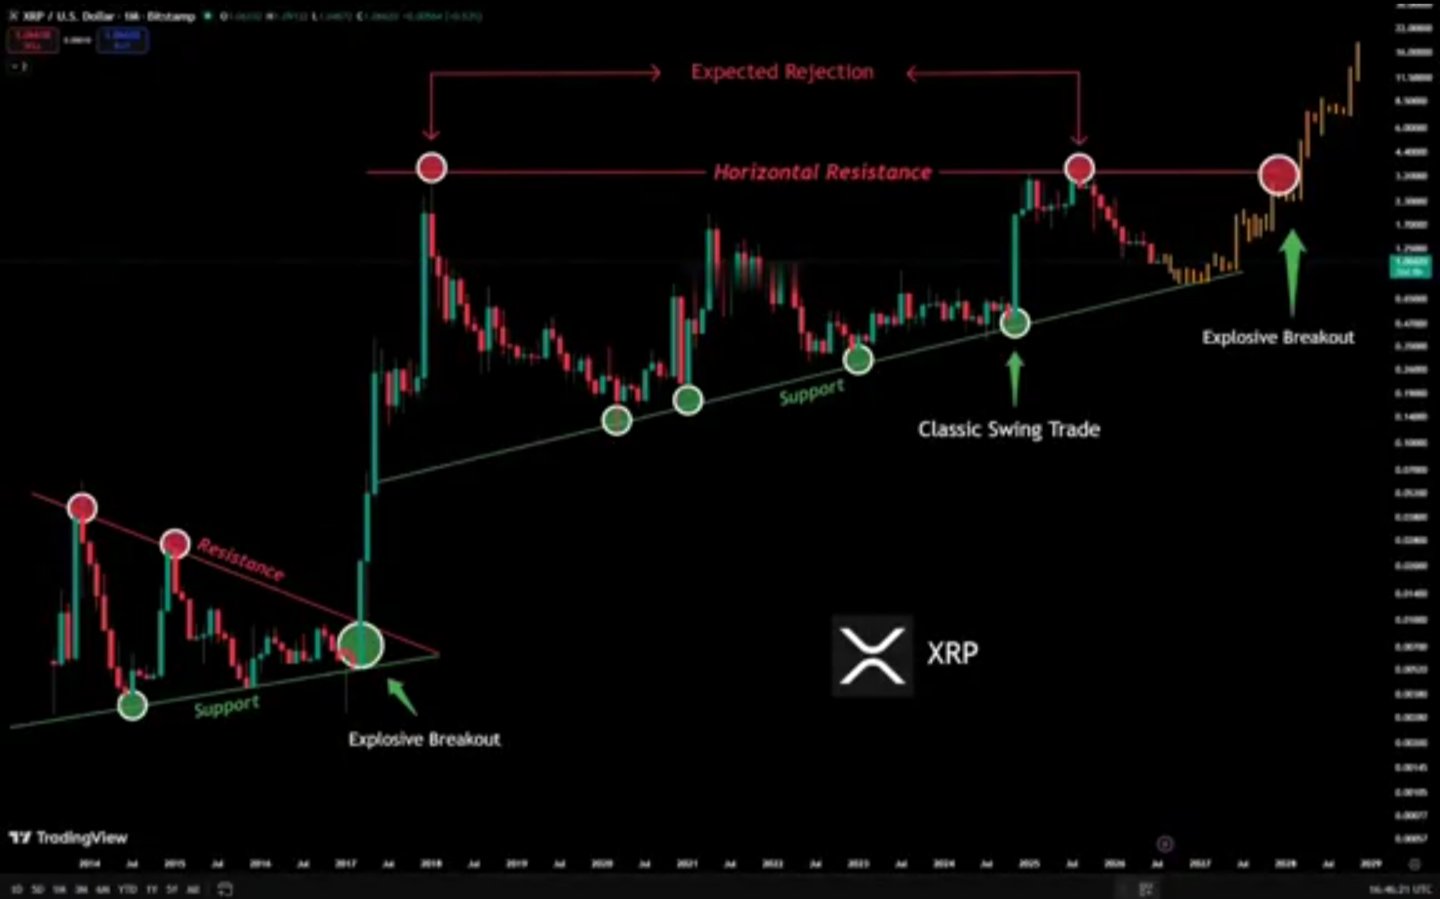
🚨 如果你已年滿 18 歲,請仔細閱讀 接下來的 12 個月可能是你財務生涯中最關鍵的時刻。 因為市場正在醞釀歷史上最大規模的財富轉移之一。 首先,股市進入最後的瘋狂拉升階段。 接著,加密貨幣將迎來那種讓人誤以為週期「永遠不會結束」的行情。 就在每個人都深信自己已經致富時…… 經濟衰退來襲。 這將是財富創造與毀滅並存的時刻。 接下來的 12 個月可能會創造出「破紀錄」的新晉百萬富翁。 別浪費這個機會。 大多數人還是會錯過。 該買入時猶豫不決,該賣出時卻 FOMO(錯失恐懼)。 直到一切結束後,才意識到發生了什麼。 這樣的機會極其罕見。 如果你現在正在讀這篇文章,你還沒遲到。 我不只追蹤價格。 我追蹤市場情緒、流動性,以及資金的下一個流向。 我現在告訴你: 你仍然很早。 但機會稍縱即逝。 提醒:我曾準確預測比特幣上一個週期的頂部為 126,000 美元,並在你 6 月份比特幣價格在 6 萬美元時建議買入。 下一次的預測可能會更重要。 我會像往常一樣在這裡公開發布。 開啟通知。 如果你還沒追蹤,之後你就會明白為什麼這是一個錯誤。 $BTCUSDT #IMPACTbyTrade
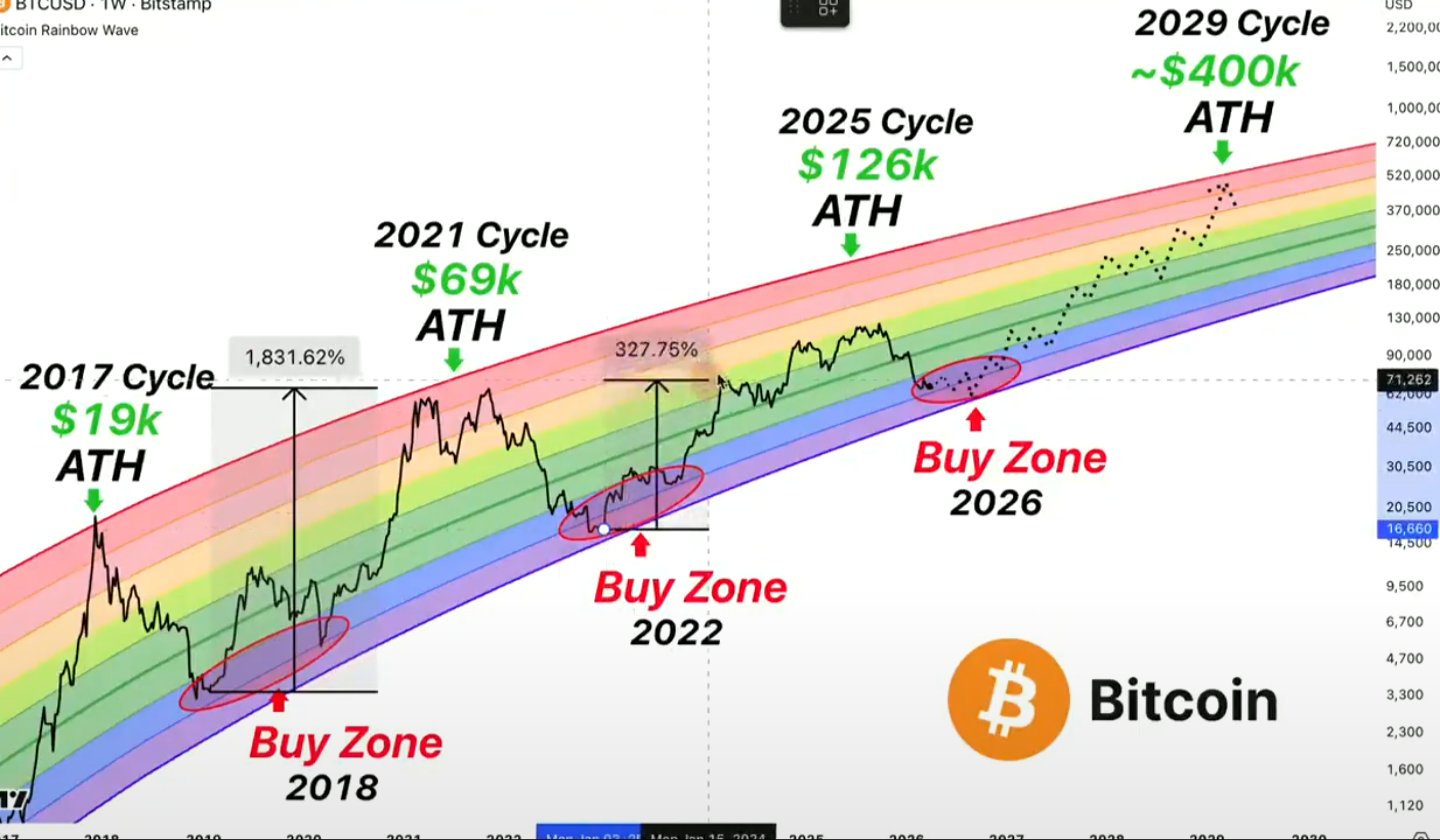
🚨 比特幣的四年週期即將讓數百萬投資者後悔莫及。 而我相信 2026 年可能會帶來這十年來最大的買入機會之一。 看看這個規律。 2013 年:賣出 2017 年:賣出 2021 年:賣出 2025 年:賣出 每四年,從歷史上看,比特幣都會進入一個主要的週期頂部窗口。 而且每一次,隨後的熊市都創造了大多數投資者因恐懼而不敢把握的機會。 現在看看完整的週期。 2011 年:買入 2012 年:持有 2013 年:賣出 2014 年:熊市 2015 年:買入 2016 年:持有 2017 年:賣出 2018 年:熊市 2019 年:買入 2020 年:持有 2021 年:賣出 2022 年:熊市 2023 年:買入 2024 年:持有 2025 年:賣出 2026 年:熊市 看到發生什麼事了嗎? 如果歷史規律持續下去,接下來可能會發生什麼。 2027 年:買入 2028 年:持有 2029 年:賣出 2030 年:熊市 而這正是事情變得有趣的地方。 大多數投資者都拼命希望比特幣不要再跌了。 我卻希望出現相反的情況。 因為最大的財富不是在每個人都在慶祝歷史新高時買入所創造的。 它們是在市場看起來徹底絕望時積累而成的。 記住我之前的觀點。 我曾在 2022 年公開預測過比特幣 1.6 萬美元的底部。 我在 2025 年 10 月警告過 12.6 萬美元的週期頂部。 而在 2026 年 6 月,我將 6 萬美元區間視為買入機會。 現在,我正在為我的下一個重大進場點做準備。 但這是大多數人所不了解的。 四年週期是一個歷史規律,而不是保證。 我不會僅僅因為日曆顯示是 2027 年就盲目買入。 我想看到真正的拋售投降。 賣方力竭。 主要支撐區。 以及賣壓終於消失的確認信號。 那時我才會準備好。 同樣那些在熊市期間不敢買入比特幣的人,可能在下一輪牛市開始時,追漲在 10 萬美元之上。 而到那時,最大的機會可能已經消失了。 保存這張圖表。 2027 年再回來看看。 關注 + 開啟通知。 當我看到下一個主要底部形成時,我會公開分享我的觀點。 今天每個人都害怕的比特幣價格,可能是他們明天希望當初已經買入的價格。 $BTCUSDT #IMPACTbyTrade
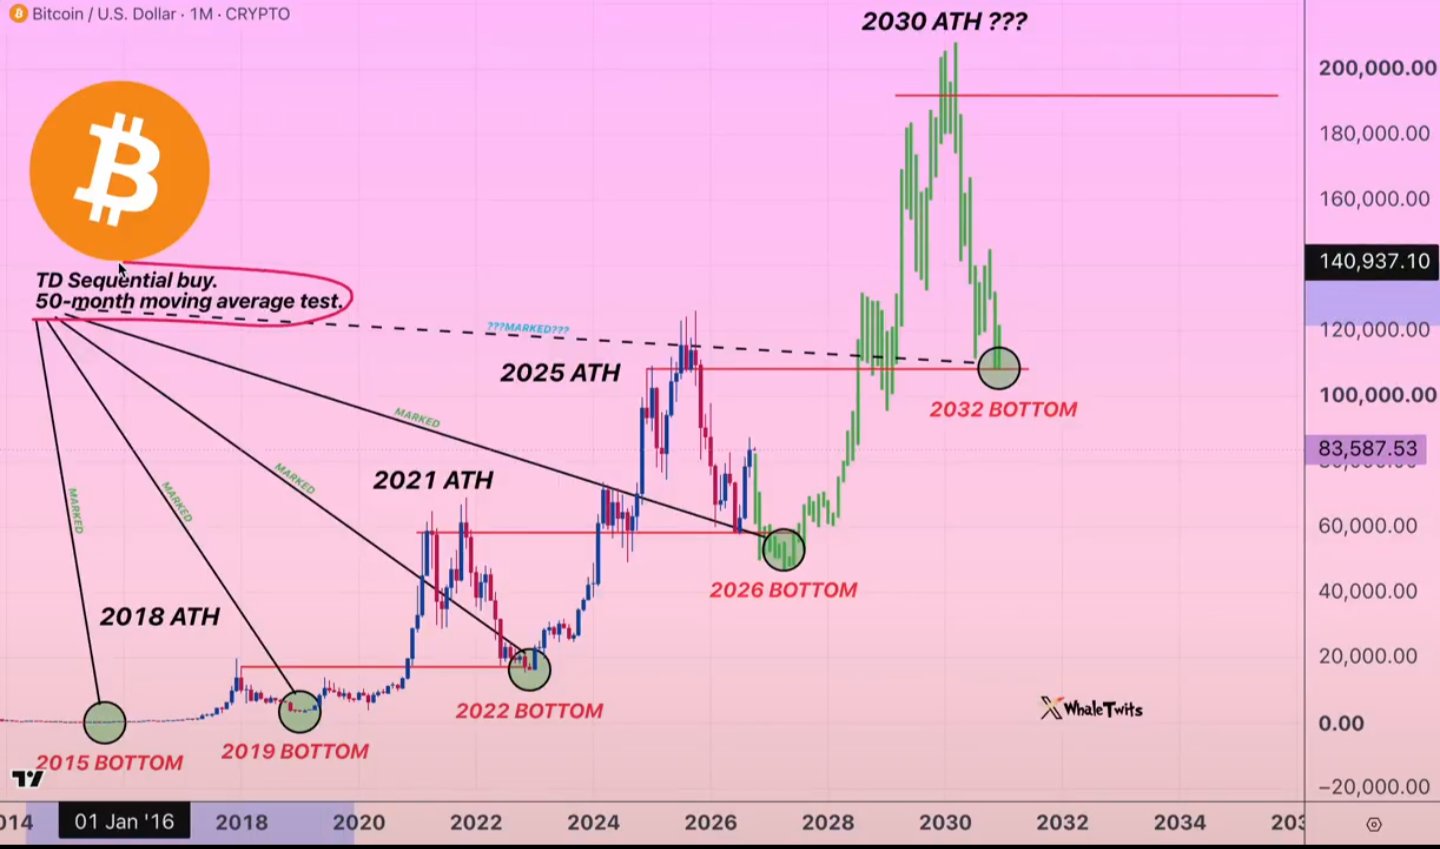
$PYTHUSDT 2 兆美元交易量,正在回測中 👀 Pyth Network 正在日線圖上重新測試一個已完成的圓底頸線。 - Pyth 預言機已保護超過 31 億美元的資產。 - 第三季支援了 2 兆美元的交易量。 - 剛為機構客戶新增了美國國債數據源。 基礎設施已經建構完成,現在就等價格反彈了。 目標價位: 🎯 $0.072 🎯 $0.094 🎯 $0.112
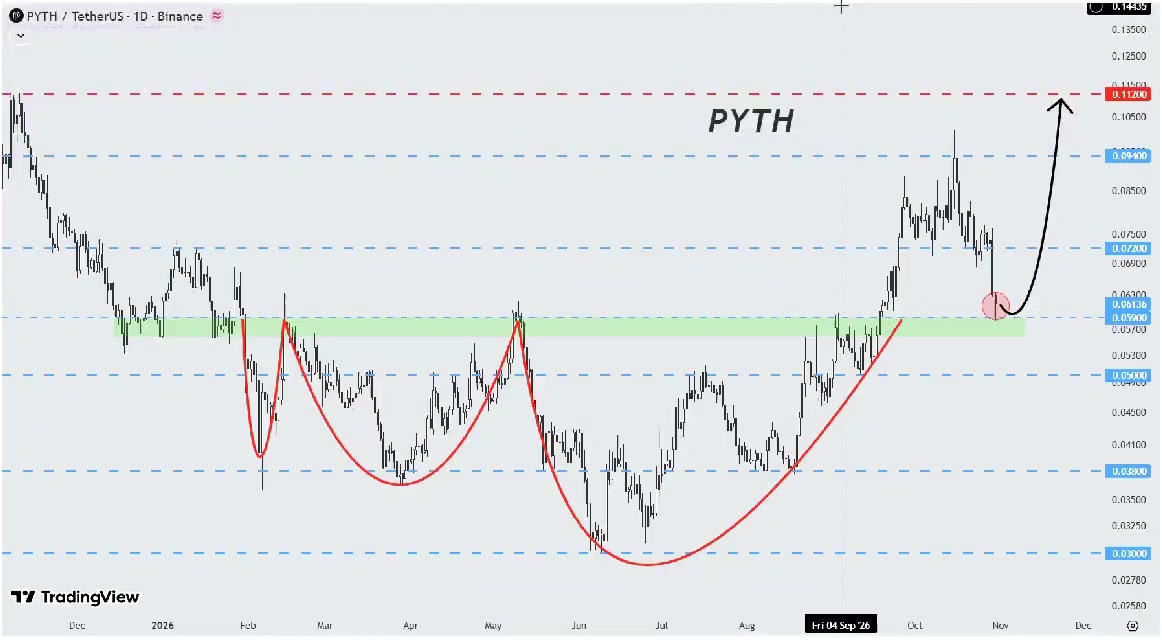
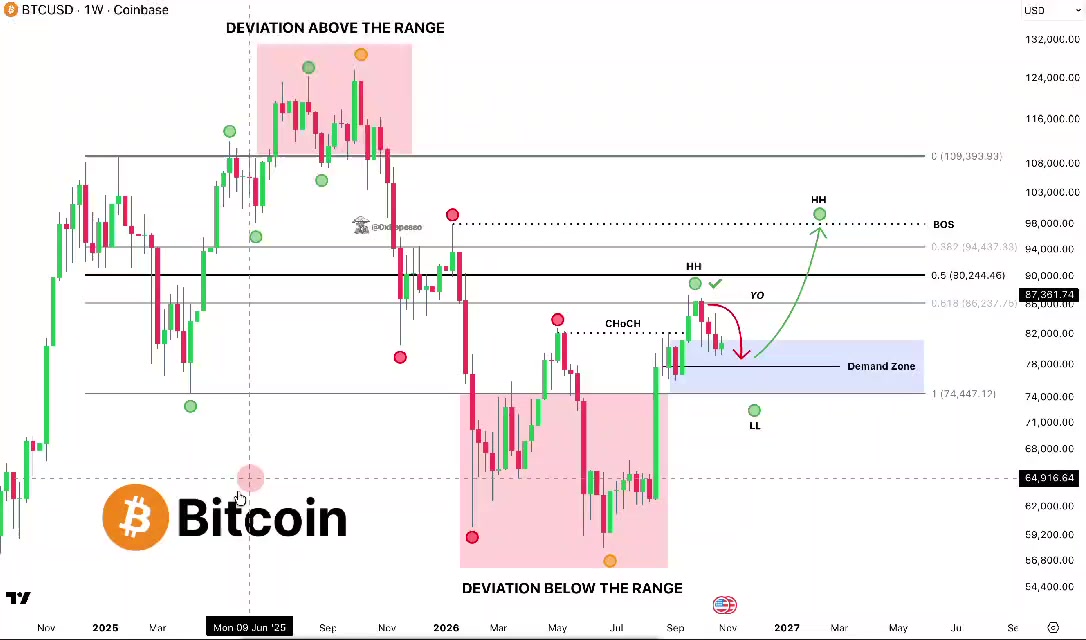
🚨 比特幣 ($BTCUSDT) 正進入我幾個月前規劃的精準買入區 60k 美元的底部、CHoCH(趨勢反轉)反彈、年度開盤價(Yearly Open)處的高點拒絕 每個階段都按部就班地發生了 現在價格正回調至 78k 到 82k 美元的需求區 這就是我打算加倉現貨的地方 目前的結構與之前的週期很相似: 60k 美元底部 -> CHoCH -> 年初高點 -> 回調至需求區 -> 更高低點 (HL) -> 反彈至新高 (ATH) 我對這裡出現更高低點(HL)很有信心,而突破 94k 美元將確認市場擴張 我不是在猜測,也不是在追高 該區域正在逼近,我會隨時更新我的進場點 #ByXIMPACT