Sambojr10
2481點贊0分享51粉絲48關注
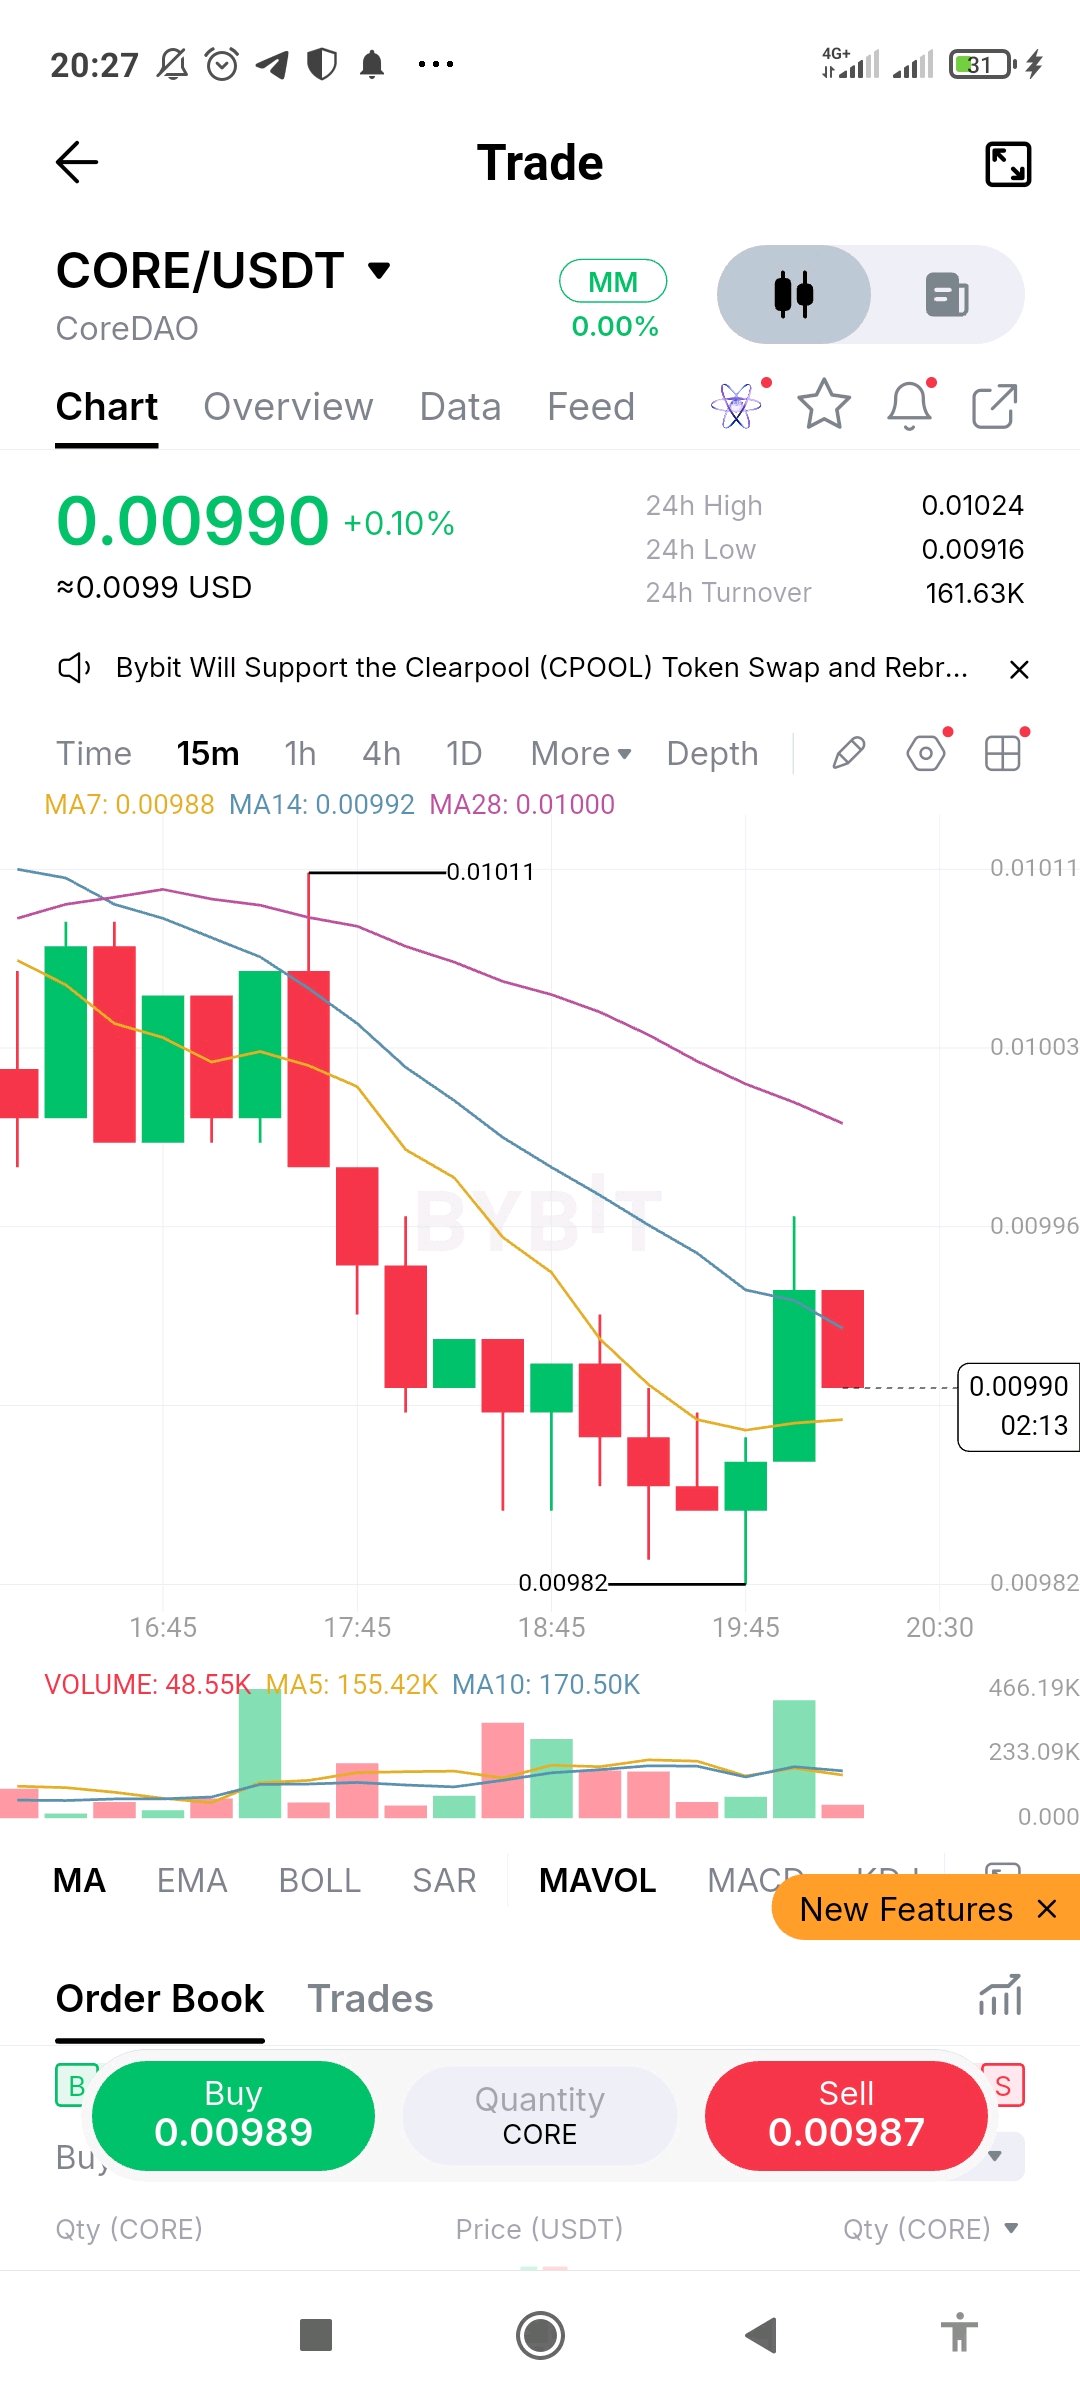
$COREUSDT 在 15 分鐘線圖上報 0.00990,日內僅微漲 0.1%,但短期趨勢向下。價格從 0.01011 區域滑落至 0.00982 的低點,隨後出現一根強勁的綠 K 棒反彈,但緊接著在下行的移動平均線下方出現一根紅 K 棒。MA7 (0.00988)、MA14 (0.00992) 和 MA28 (0.01000) 皆呈空頭排列並向下傾斜。 0.00982 的低點是關鍵觀察點。若跌破此水位,代表賣方仍掌控局面;而若能收在 0.00992 附近的 MA14 之上,將是反彈力道初步浮現的訊號。反彈時成交量雖激增,但隨後的紅 K 棒成交量卻萎縮,顯示買方尚未持續跟進。目前尚未確認任何走勢。 教訓:持平的日內漲跌幅可能掩蓋了圖表持續出現低點不斷下移的事實。下跌趨勢中的單根綠 K 棒只是反彈嘗試,並非反轉,因此請等待低點墊高後再進場,並保持小倉位。 #IMPACTbyTrade $COREUSDT $BTCUSDT
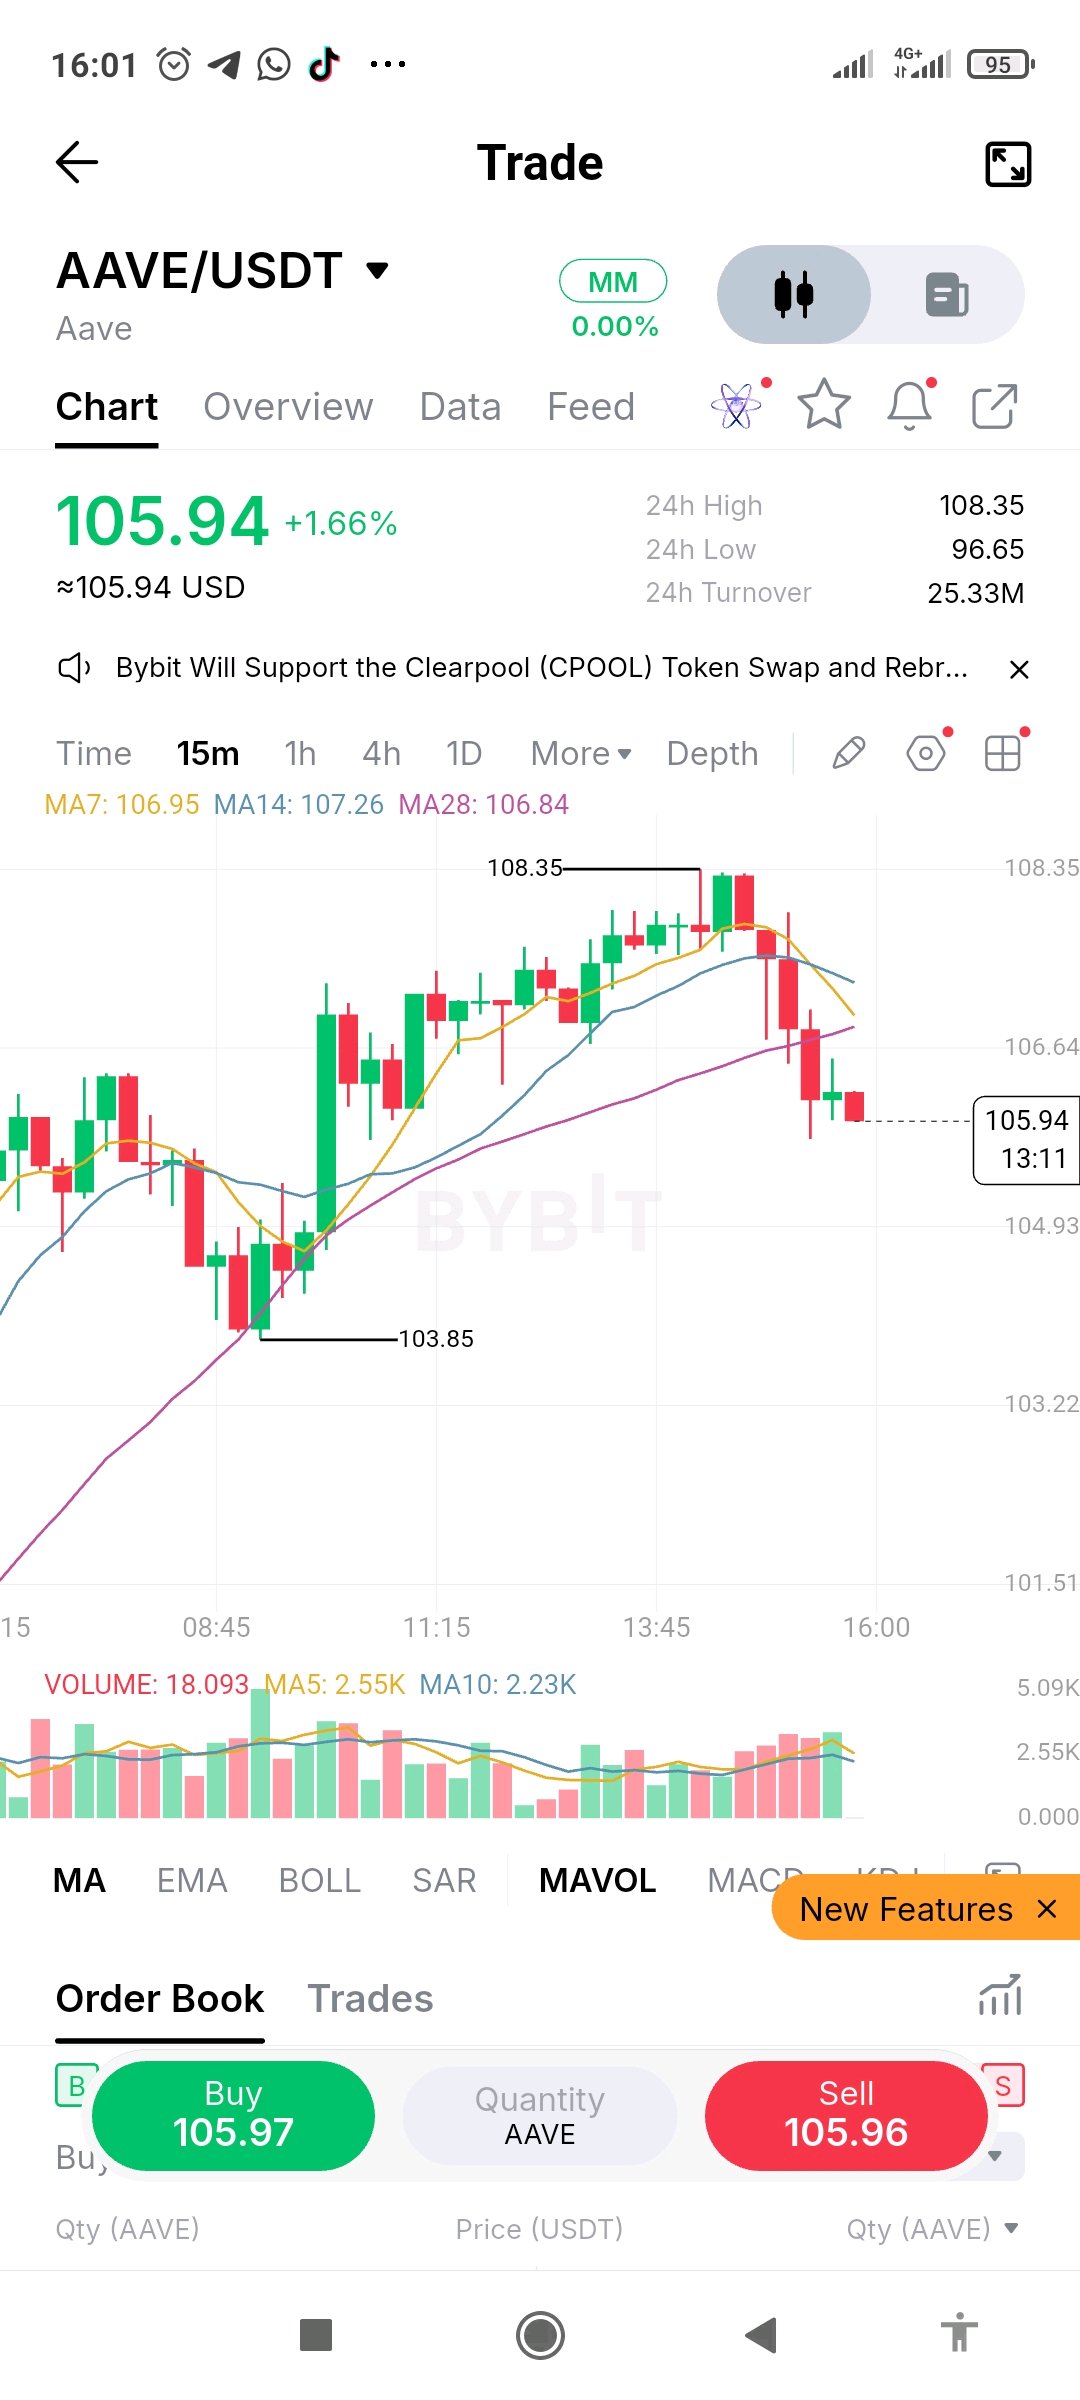
$AAVEUSDT is at 105.94 on the 15m chart, up about 1.7% on the day, but the short-term picture has turned down. Price climbed from the 103.85 area to a high of 108.35, then rolled over with a rejection and a run of red candles. It has dropped through MA7 (106.95), MA14 (107.26) and MA28 (106.84), and MA7 and MA14 are now curling down above price. The next reference points are the 105 area, close to the 104.93 gridline, and the 103.85 low. A bounce would likely meet resistance near MA28 around 106.84, and a close back above it would show sellers losing control. Volume on the drop is steady rather than heavy, so conviction is moderate. Nothing here is confirmed. Lesson: when price falls back through all its moving averages after a rejection at the high, the short-term structure has changed, even inside a green day. Wait for a higher low or a reclaim before acting, and keep your size small enough to survive being wrong. #IMPACTbyTrade $AAVEUSDT $BTCUSDT
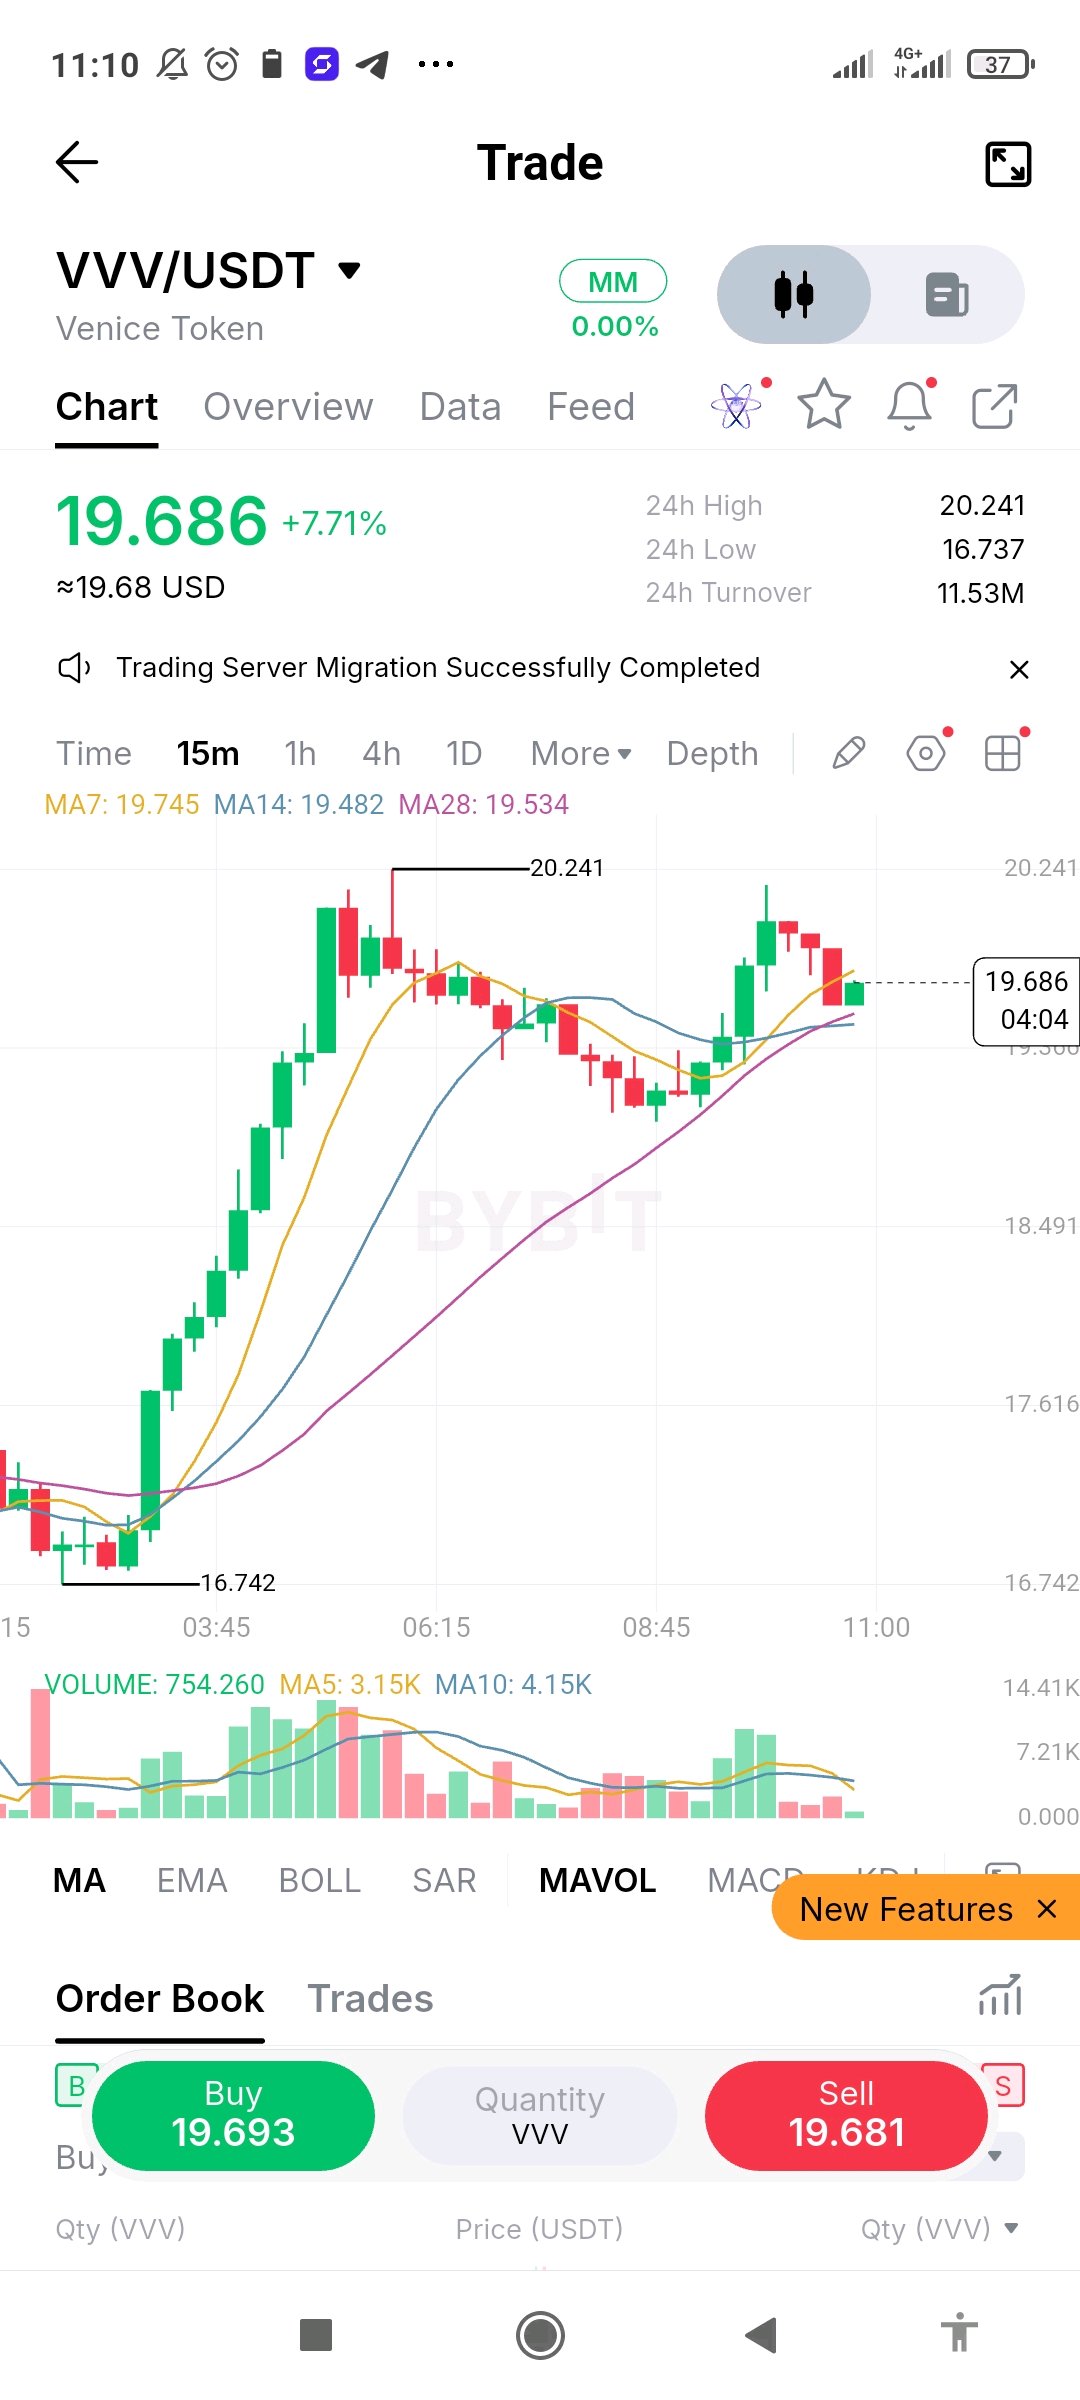
$VVVUSDT 在 15 分鐘線圖上報 19.686,單日漲幅約 7.7%。此前從 16.742 區域強勁上漲至 20.241 高點。價格隨後回調,發起了第二次衝刺,目前正回落至均線上方進行盤整。MA7 (19.745)、MA14 (19.482) 和 MA28 (19.534) 糾結在一起,價格正落在這些均線上。 早期的上升趨勢依舊存在,但均線開始糾結,顯示漲勢正在暫歇。第一波上漲時成交量最強勁,兩次回調中成交量皆有所衰退,這代表買方並未持續加碼。若能守住 19.5 附近的均線密集區,則能維持「更高低點」的走勢;若跌破該區間,則須留意先前回調的低點。若能收在 20.241 之上,將有利於買方。目前尚未有明確訊號。 經驗分享:若第二次衝刺因量能不足而無法突破前高,這是一個警訊而非進場訊號。請等待價格收在壓力位之上,並控制好倉位,確保即便突破失敗也不至於造成過大損失。 #IMPACTbyTrade $VVVUSDT $BTCUSDT
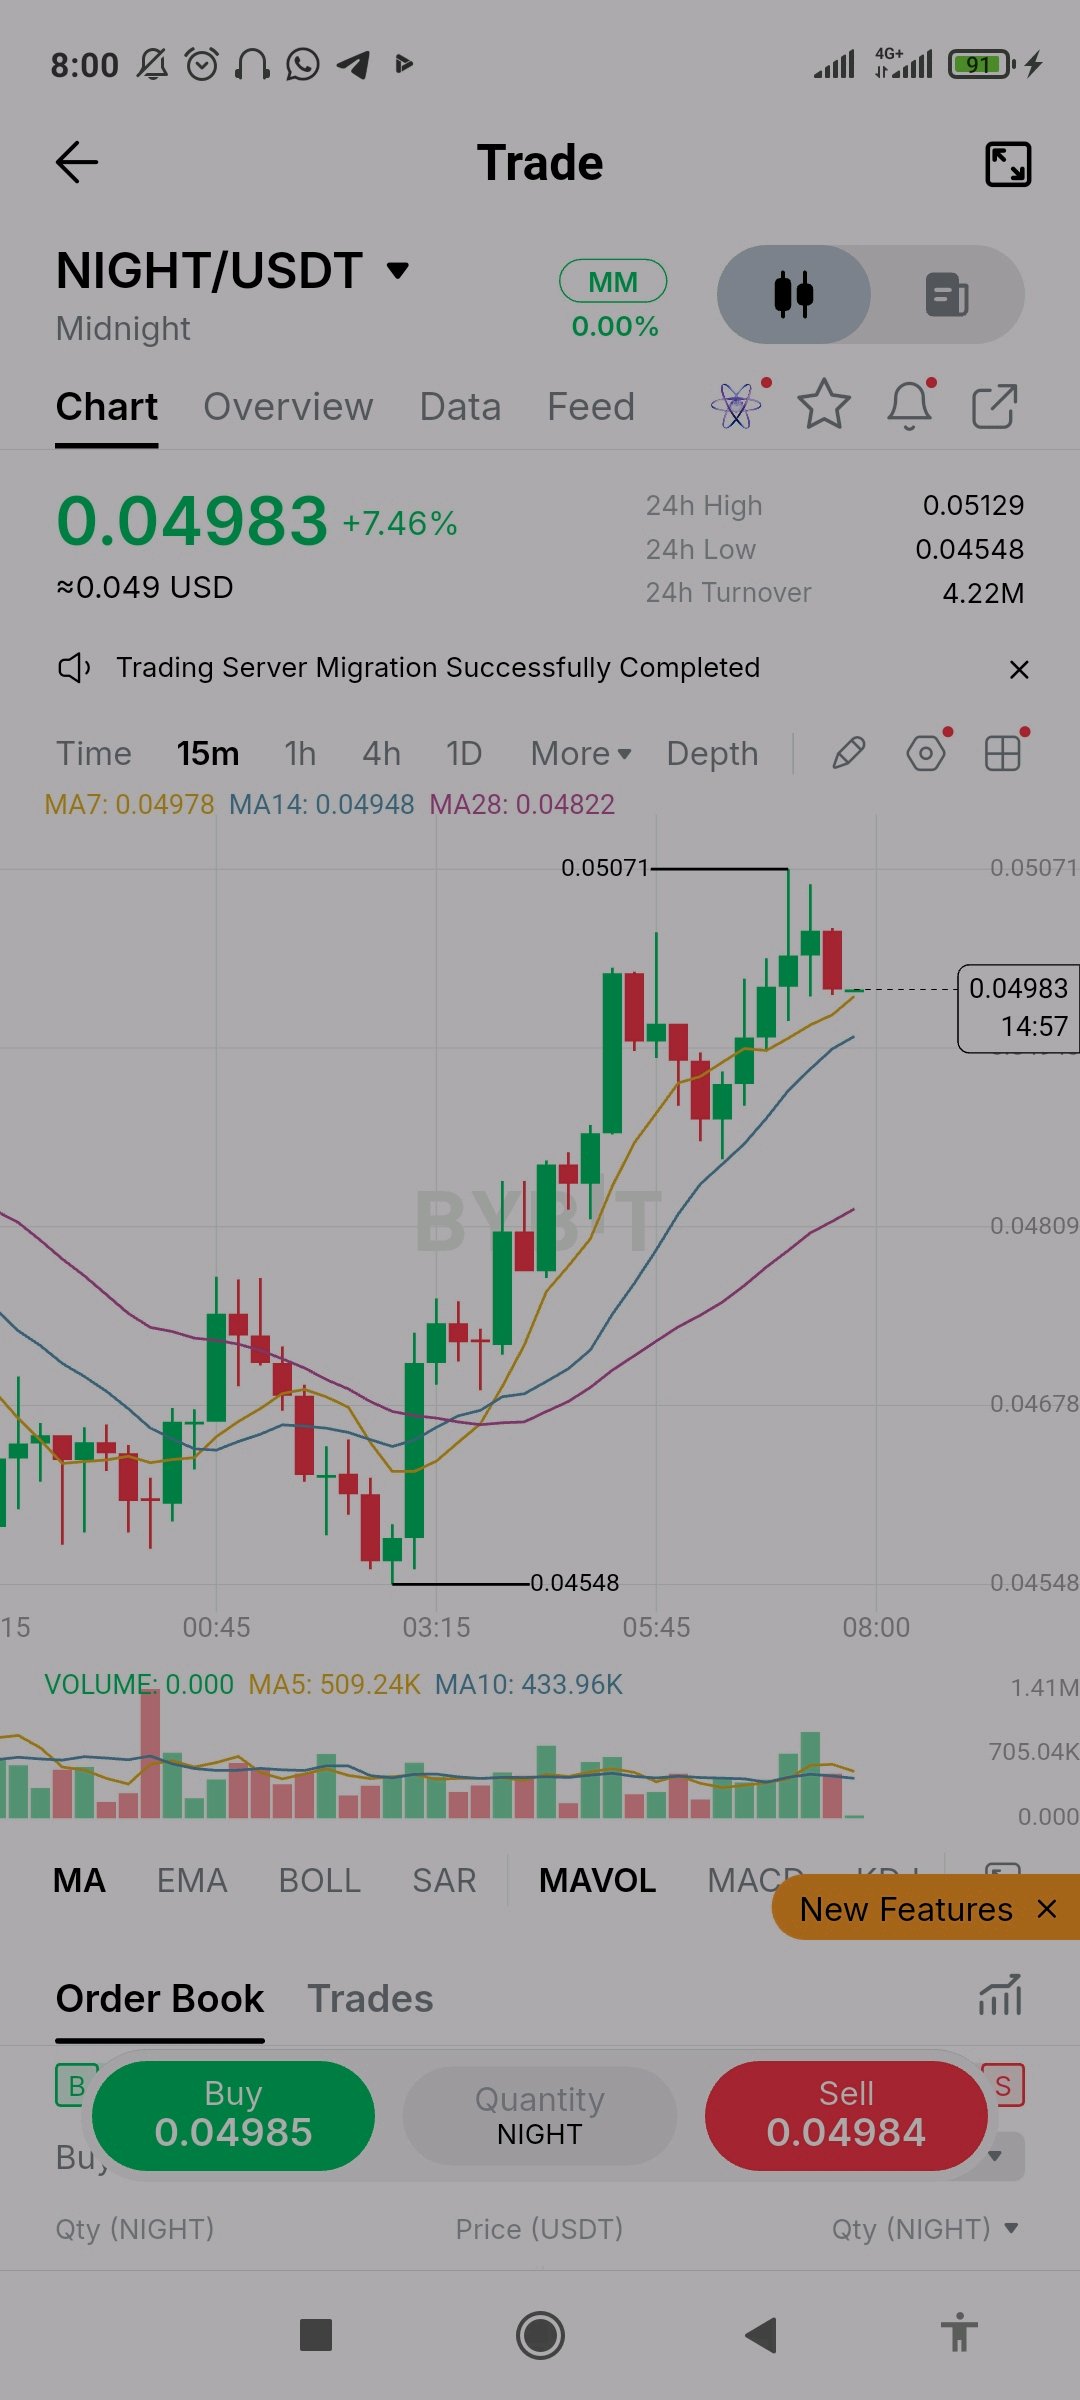
$NIGHTUSDT is at 0.04983 on the 15m chart, up about 7.5% on the day after a steady climb from the 0.04548 low to a high of 0.05071. MA7 (0.04978), MA14 (0.04948) and MA28 (0.04822) are stacked in bullish order and sloping up, with price sitting right on MA7 after a red pullback candle under the high. The trend is constructive, but momentum is pausing just below 0.05071. Volume was strongest during the main push and has been mixed on the latest candles, so buyers are active without a fresh surge. A close above 0.05071 would favor bulls, while a drop below MA7 would be the first warning and a pullback toward MA14 near 0.0495 would not be unusual. Nothing here is confirmed. Lesson: a healthy uptrend can still stall just under a recent high. Entering right at resistance leaves little room for error, so wait for a close above it or a pullback, and keep your size small. #IMPACTbyTrade $NIGHTUSDT $BTCUSDT
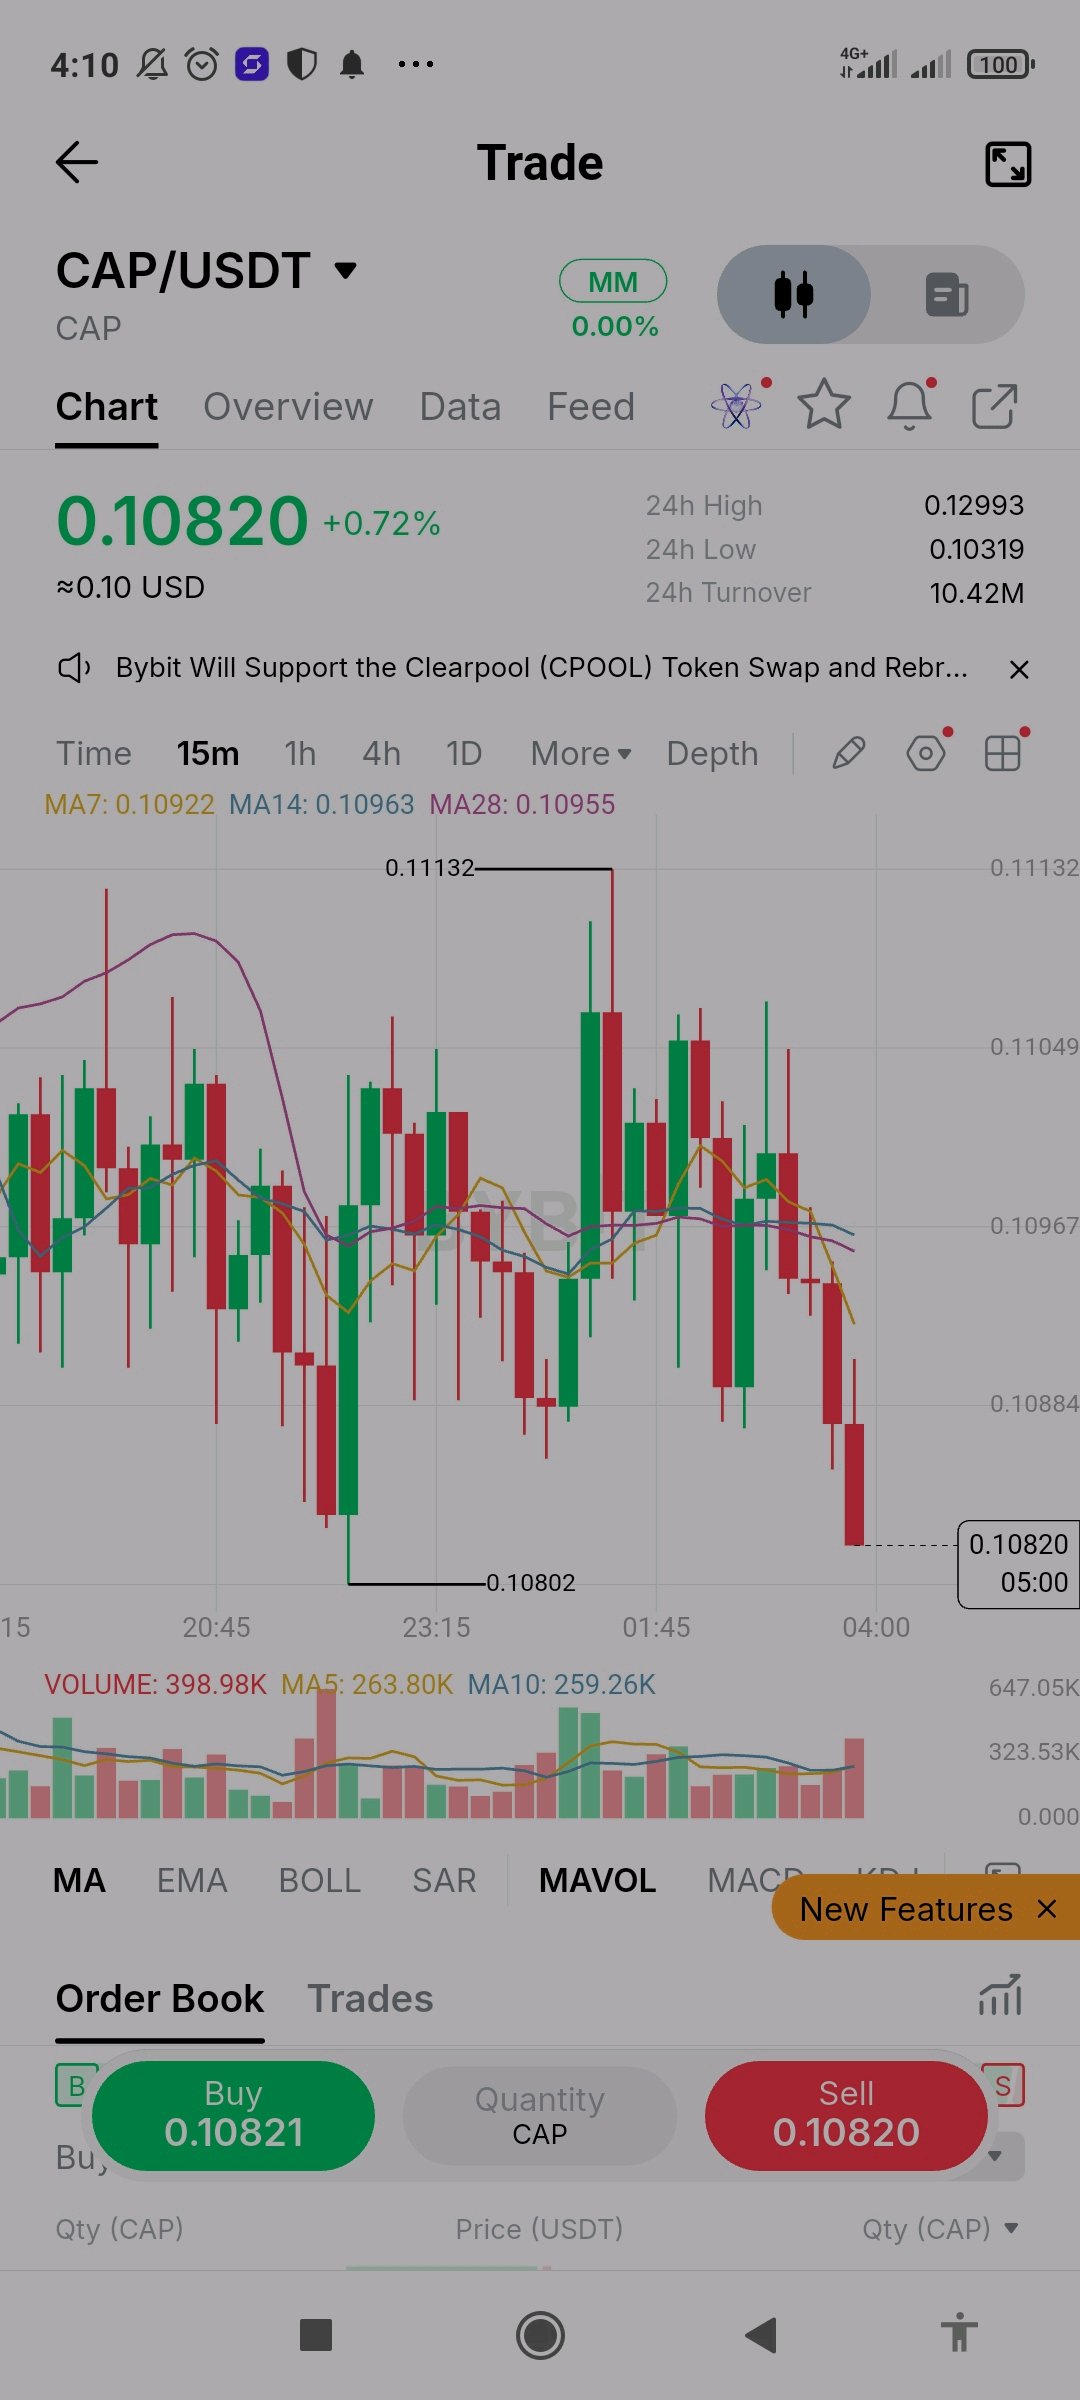
$CAPUSDT 在 15 分鐘圖表上報 0.10820,日內漲幅約 0.7%,但短期走勢已轉弱。價格在 0.10802 到 0.11132 之間震盪了數小時,隨後出現一根大陰線將價格直接壓低至該區間底部。MA7 (0.10922)、MA14 (0.10963) 和 MA28 (0.10955) 在價格上方聚集,且開始向下傾斜。 0.10802 的低點是需要關注的關鍵水平。跌破該點位將顯示賣方開始控制區間,而反彈則可能在 0.1092 至 0.1096 附近的均線群組遇阻。最新一根 K 線的成交量是近期最高的,說明這次下跌有真實的市場參與,儘管單根 K 線不能確認趨勢。目前一切尚未成定局。 經驗教訓:當價格在一個區間內震盪數小時,隨後在成交量放大下向邊緣突破時,請認真對待這一警訊。等待收盤價低於支撐位或重新站上均線後再採取行動,並將部位控制在可承受的風險範圍內。 #IMPACTbyTrade $CAPUSDT $BTCUSDT
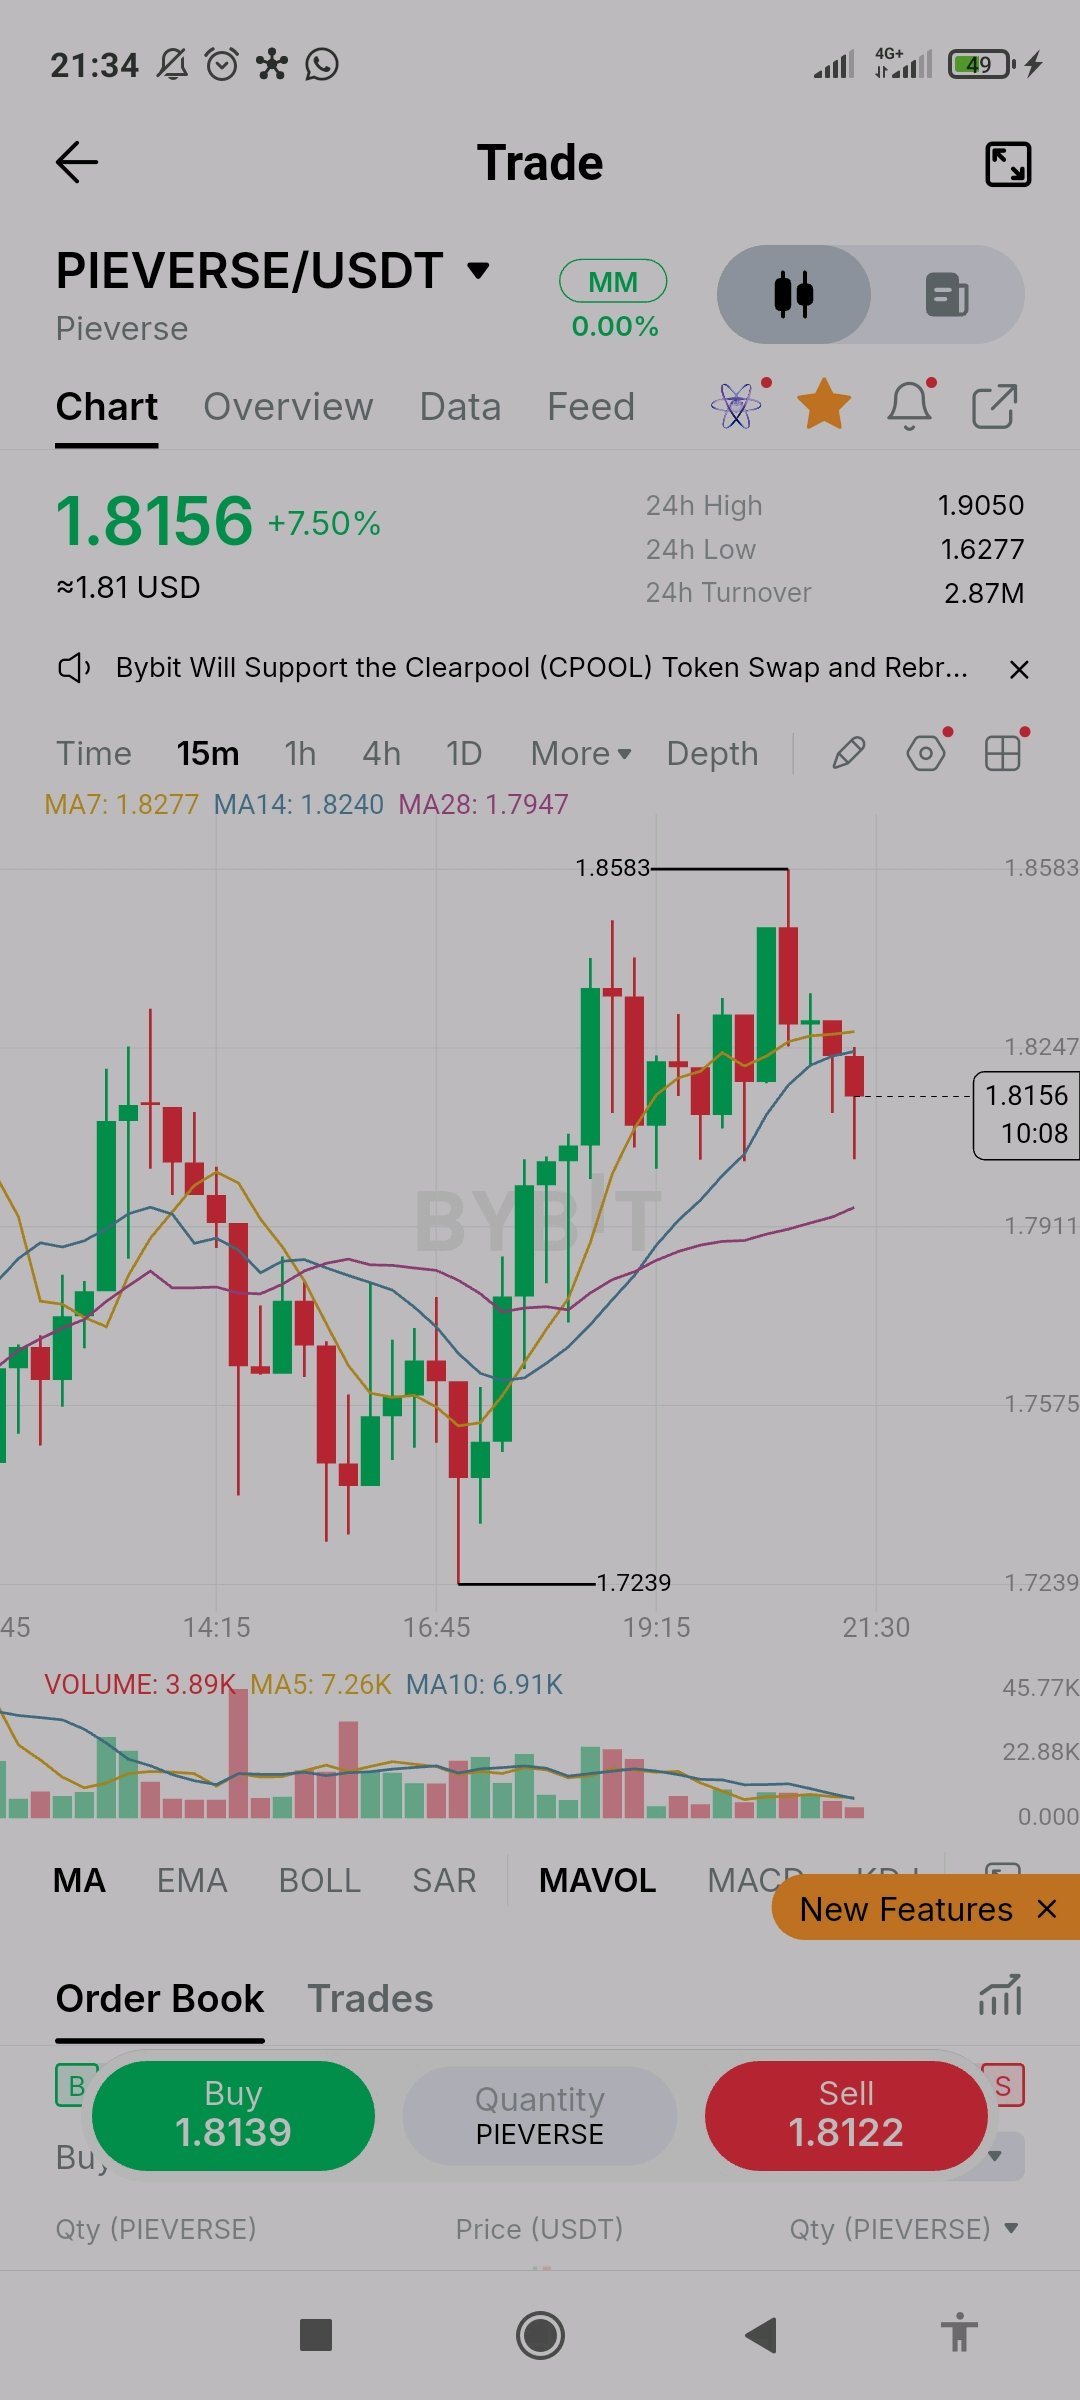
$PIEVERSEUSDT 在 15 分鐘線圖上位於 1.8156,日內漲幅約 7.5%,從 1.8583 的高點回調。價格從 1.7239 的低點反彈並創下更高低點,隨後在高處出現阻力影線並轉弱。目前價格剛好低於 MA7 (1.8277) 並運行在 MA14 (1.8240) 附近,而下方的 MA28 (1.7947) 則作為下一個支撐位持續上升。 目前的結構依然偏向多頭,但最近幾根 K 線顯示動能正在冷卻,回調過程中的成交量也較小。這可能只是一次暫停,但也無法確定。若能守住 MA28,將保持更高低點的趨勢;反之,若跌破該位置,焦點將重新回到 1.7239 的低點。若能收盤高於 1.8583,則有利於買方。目前一切尚未定論。 經驗教訓:回調至移動平均線是對支撐的測試,而非反彈的保證。務必等待 K 線收盤再採取行動,並控制好倉位大小,確保即便支撐失敗,損失也在可控範圍內。 #IMPACTbyTrade $PIEVERSEUSDT $BTCUSDT
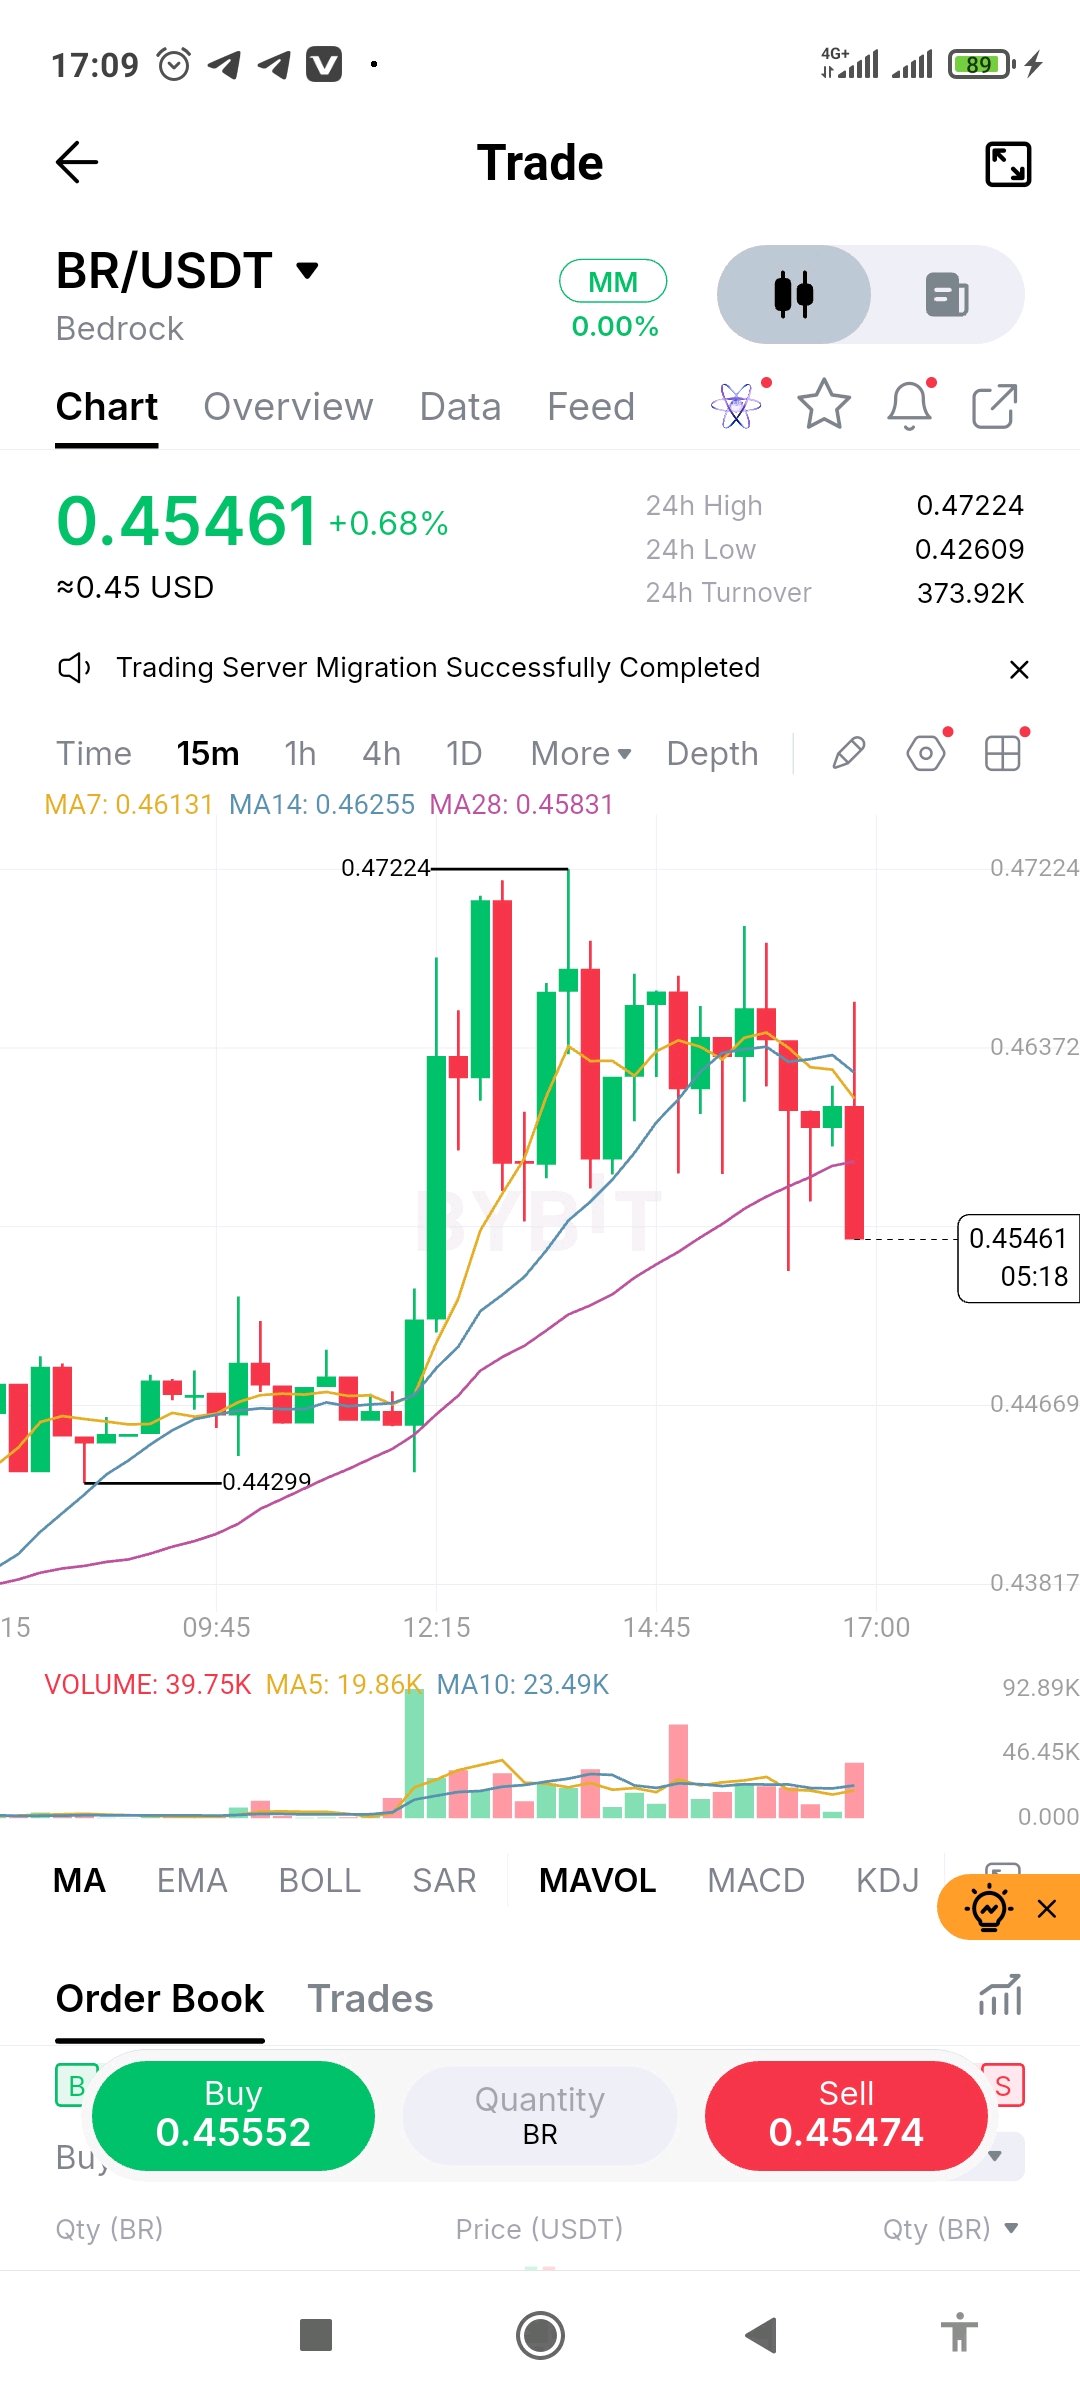
$BRUSDT 在 15 分鐘線圖上報 0.45461,日內漲幅約 0.7%。此前價格從 0.44299 區域突破,最高觸及 0.47224。隨後價格在寬幅震盪區間內盤整了數小時,剛出現一根大陰線跌破 MA7 (0.46131) 和 MA14 (0.46255),目前接近 MA28 (0.45831)。 MA28 是需要關注的關鍵位。若失守此位,0.443 至 0.444 的底部將再次成為焦點;而若能重回 MA14 之上,則顯示買方正在捍衛漲勢。成交量在最初突破時最強,之後表現不均,因此這次下跌背後的賣壓僅為中等。目前走勢尚未定論。 經驗教訓:當突破無法維持且價格回落至均線下方時,結構已轉弱。等待出現更高的低點或明確收復關鍵均線後再信任反彈,並控制倉位大小,確保即使看錯方向也能承受風險。 #IMPACTbyTrade $BRUSDT $BTCUSDT
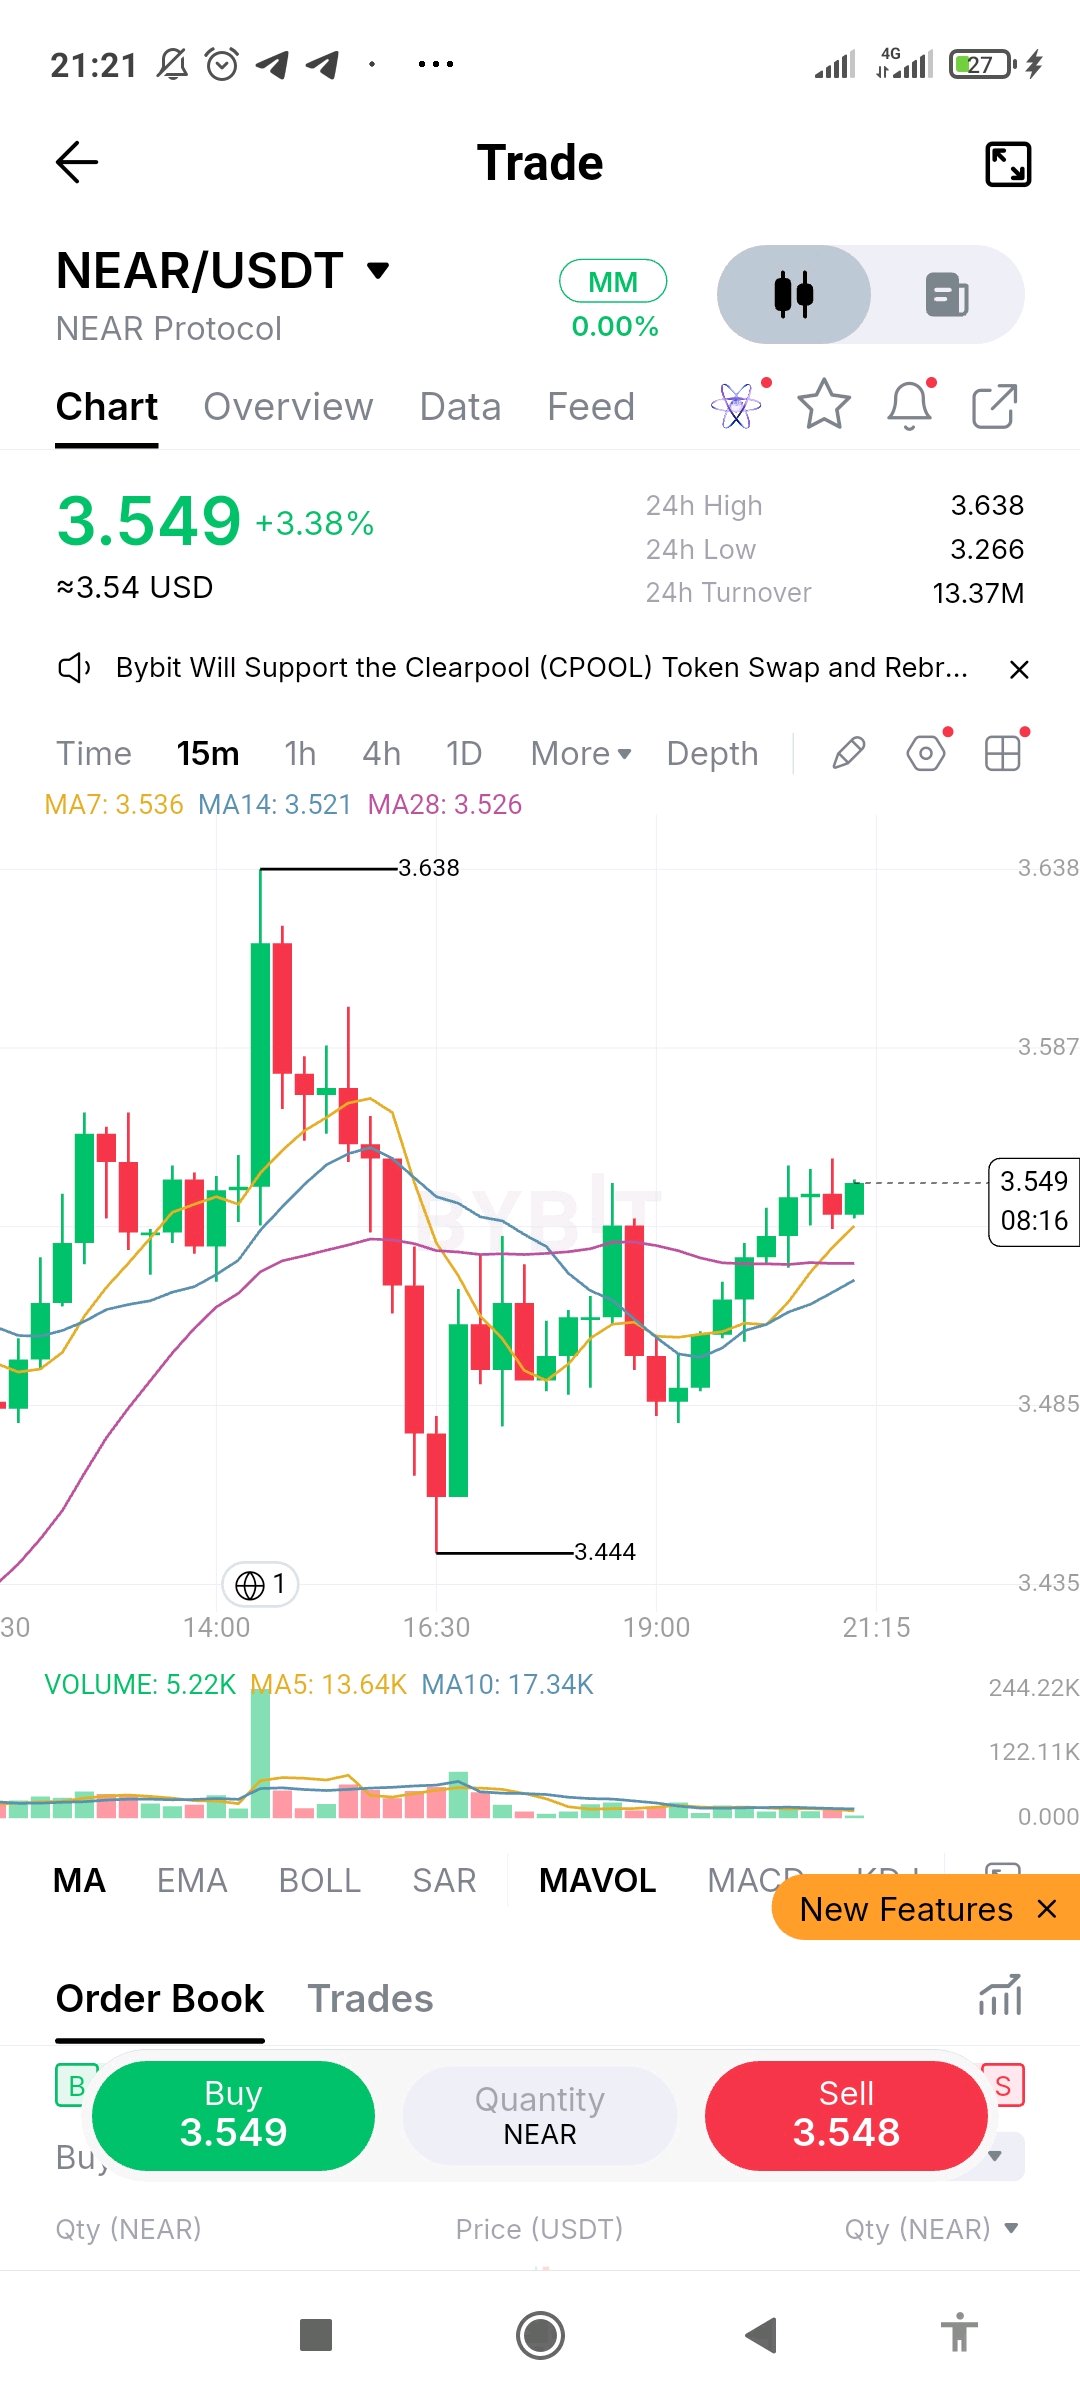
$BMTUSDT is at 0.02312 on the 15m chart, up about 4% on the day after a drop from the 0.02465 area to a low of 0.02153, followed by a recovery. MA7 (0.02278), MA14 (0.02268) and MA28 (0.02272) are bunched together and flattening, and price has just pushed above all three with a run of green candles. The bounce is constructive, but the averages are tangled, so a clean trend has not formed yet. Volume was heavy during the earlier selloff and is much lighter on this recovery, so buyers are not showing strong conviction. A hold above the MA cluster near 0.0227 would support the move, while a drop back under it would suggest the bounce is failing. A close above 0.02465 would be a stronger sign for buyers. Nothing here is confirmed. Lesson: a recovery that reclaims the moving averages on light volume is a test, not a trend change. Wait for follow-through candles, and size your trade so a failed bounce stays small. #IMPACTbyTrade $BMTUSDT $BTCUSDC
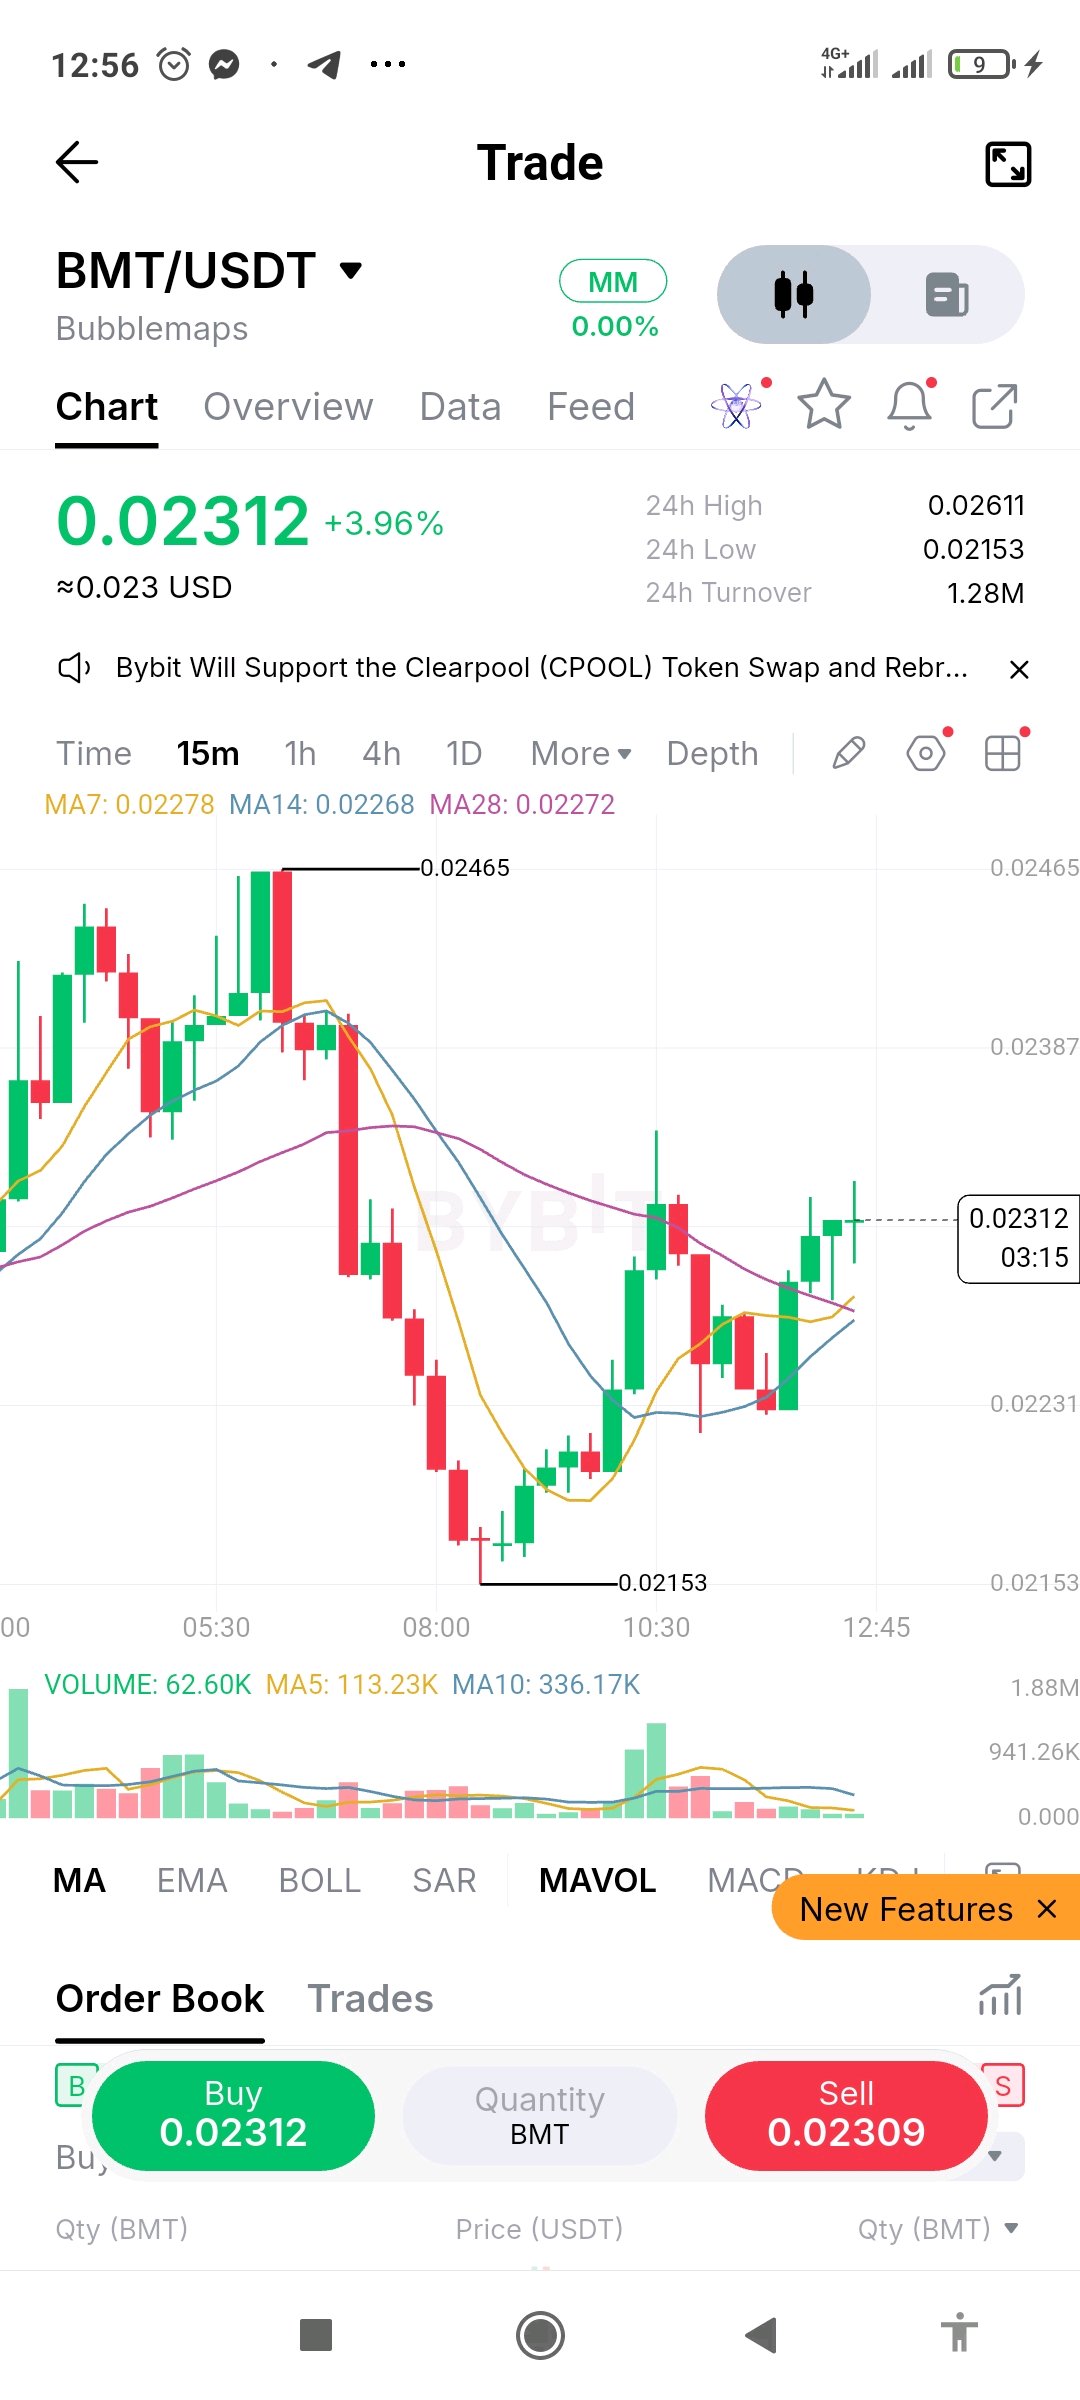
$TRXUSDT is at 0.3132 on the 15m chart, up about 0.9% on the day after a V-shaped recovery from the 0.3109 low to a high of 0.3134. MA7 (0.3129), MA14 (0.3125) and MA28 (0.3119) have turned up and are stacked in bullish order, with price riding just above MA7 after a small pullback and a fresh green push. The recovery is constructive, but the whole move is tiny. The 24h range is only 0.3103 to 0.3136, so price is now pressing right against the top of it. Volume was strongest during the middle of the climb and has softened on the latest candles, so buyers are not adding fresh pressure at the high. A close above 0.3134 would favor bulls, while a drop below MA7 would be the first warning and a pullback toward MA14 near 0.3125 would not be unusual. Nothing here is confirmed. Lesson: a clean bounce can stall right at the top of a narrow range. Entering at the high leaves little room for error, so wait for a close above resistance or a pullback, and keep your size small. #IMPACTbyTrade $TRXUSDT $BTCUSDT
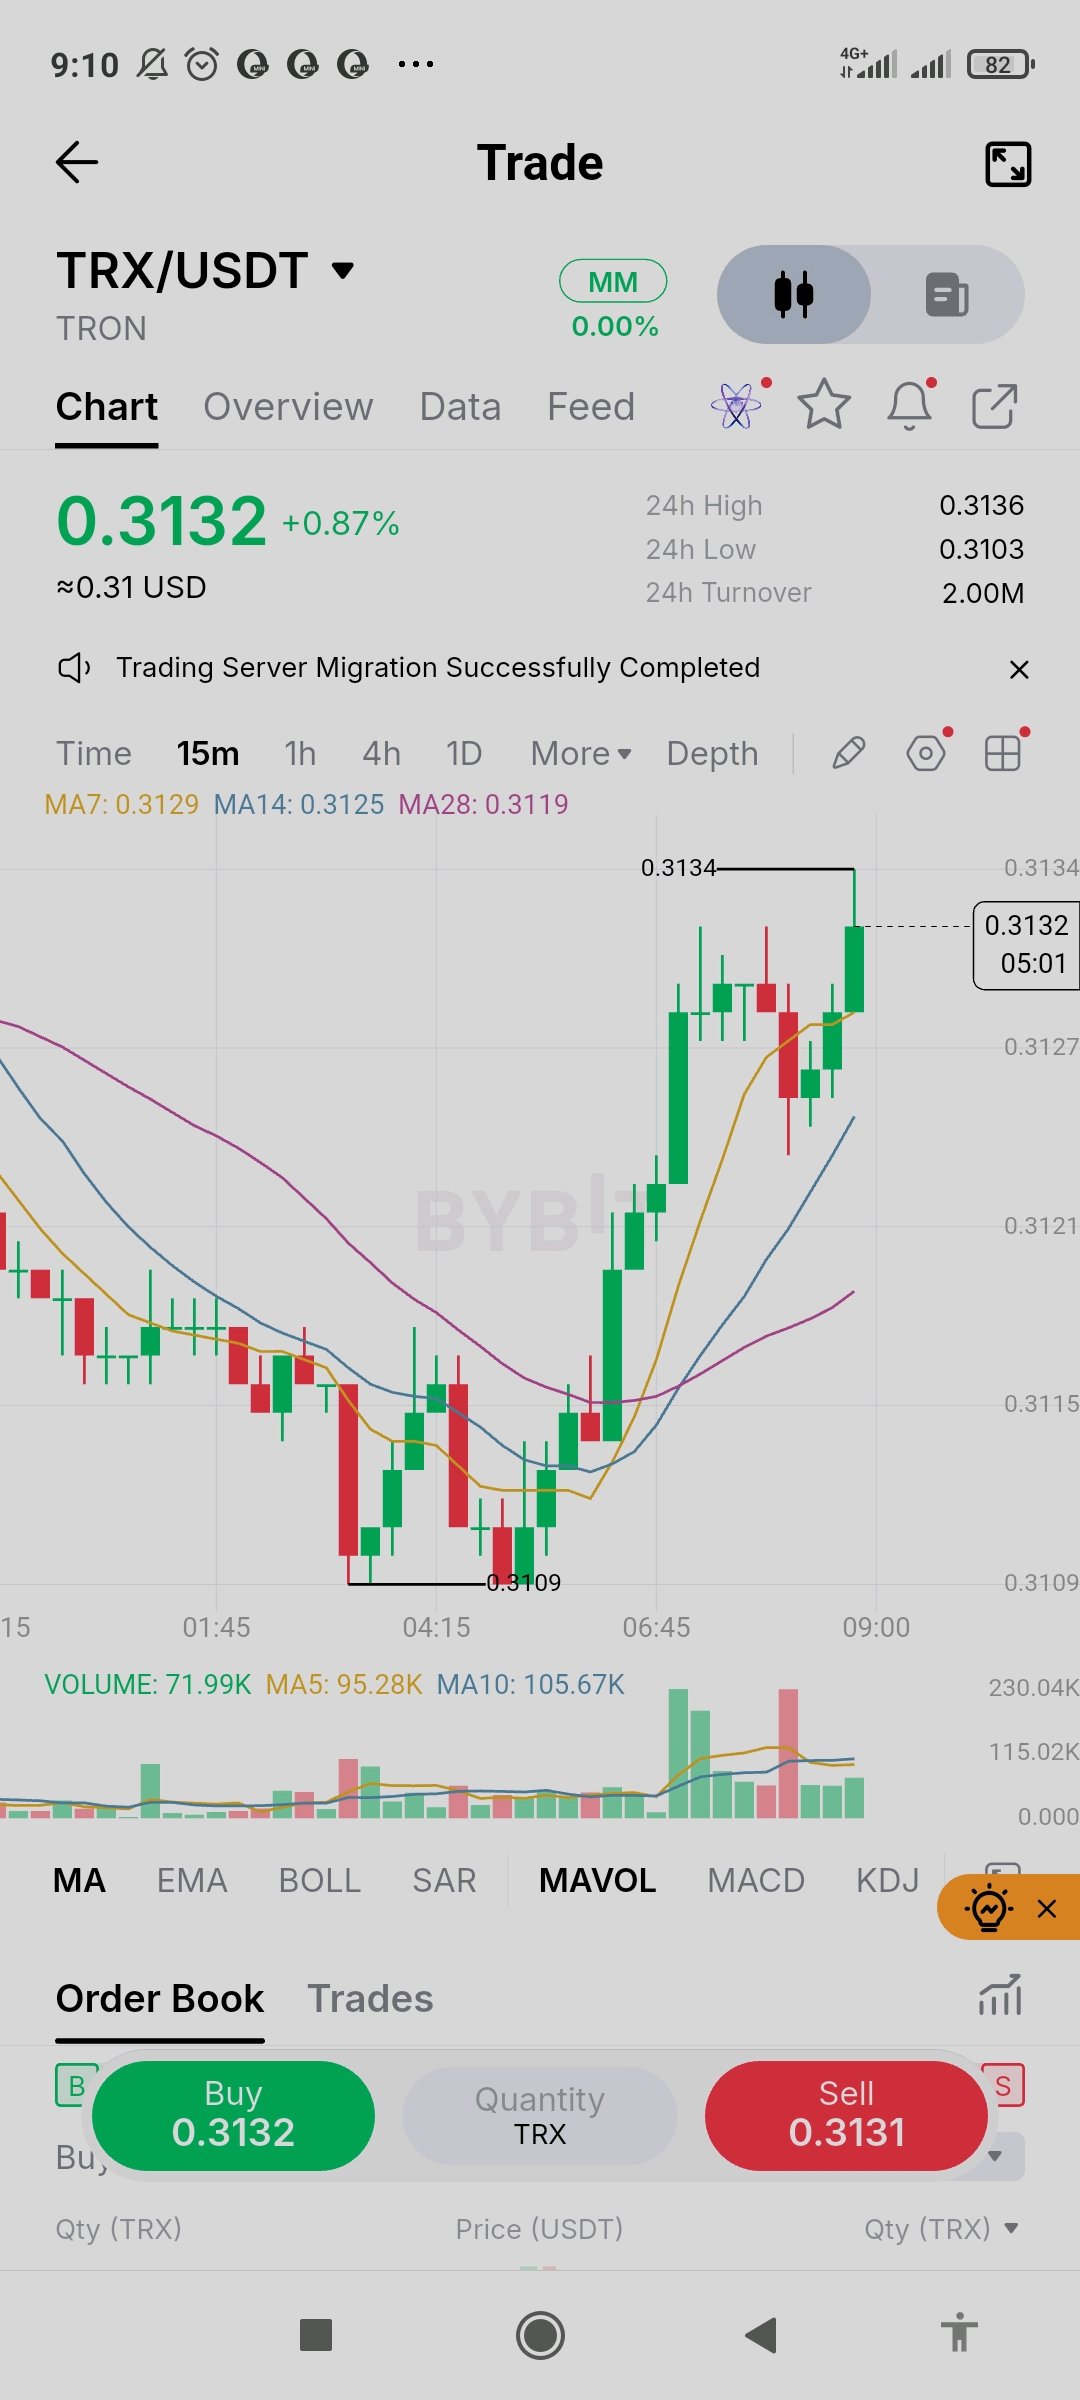
$INJUSDT 目前在 15 分鐘線圖上報 8.002,日內漲幅約 7.6%,但短期趨勢已轉跌。價格曾一度衝高至 8.382,隨後一路出現連續的低點下移,跌至 7.888 的低位。MA7 (8.017)、MA14 (8.056) 與 MA28 (8.056) 均位於價格上方且呈下行趨勢,最新的 K 線剛好在 MA7 下方停滯。 7.888 的低點是值得關注的關鍵位。若出現反彈,可能會在下行的 MA7 以及 8.05 附近的 MA14/MA28 區間遭遇阻力;若明確跌破 7.888,則顯示賣方仍掌握主導權。近期波動的成交量偏低,顯示多空雙方信心皆不足。目前的訊號尚未確認。 經驗教訓:亮眼的單日漲幅可能會掩蓋價格不斷創下低點的疲軟走勢。在採取行動前,請耐心等待出現更高的低點,或是價格重新站上移動平均線。同時,請控制倉位大小,確保即使看錯方向,損失也在可控範圍內。 #IMPACTbyTrade $INJUSDT $BTCUSDT
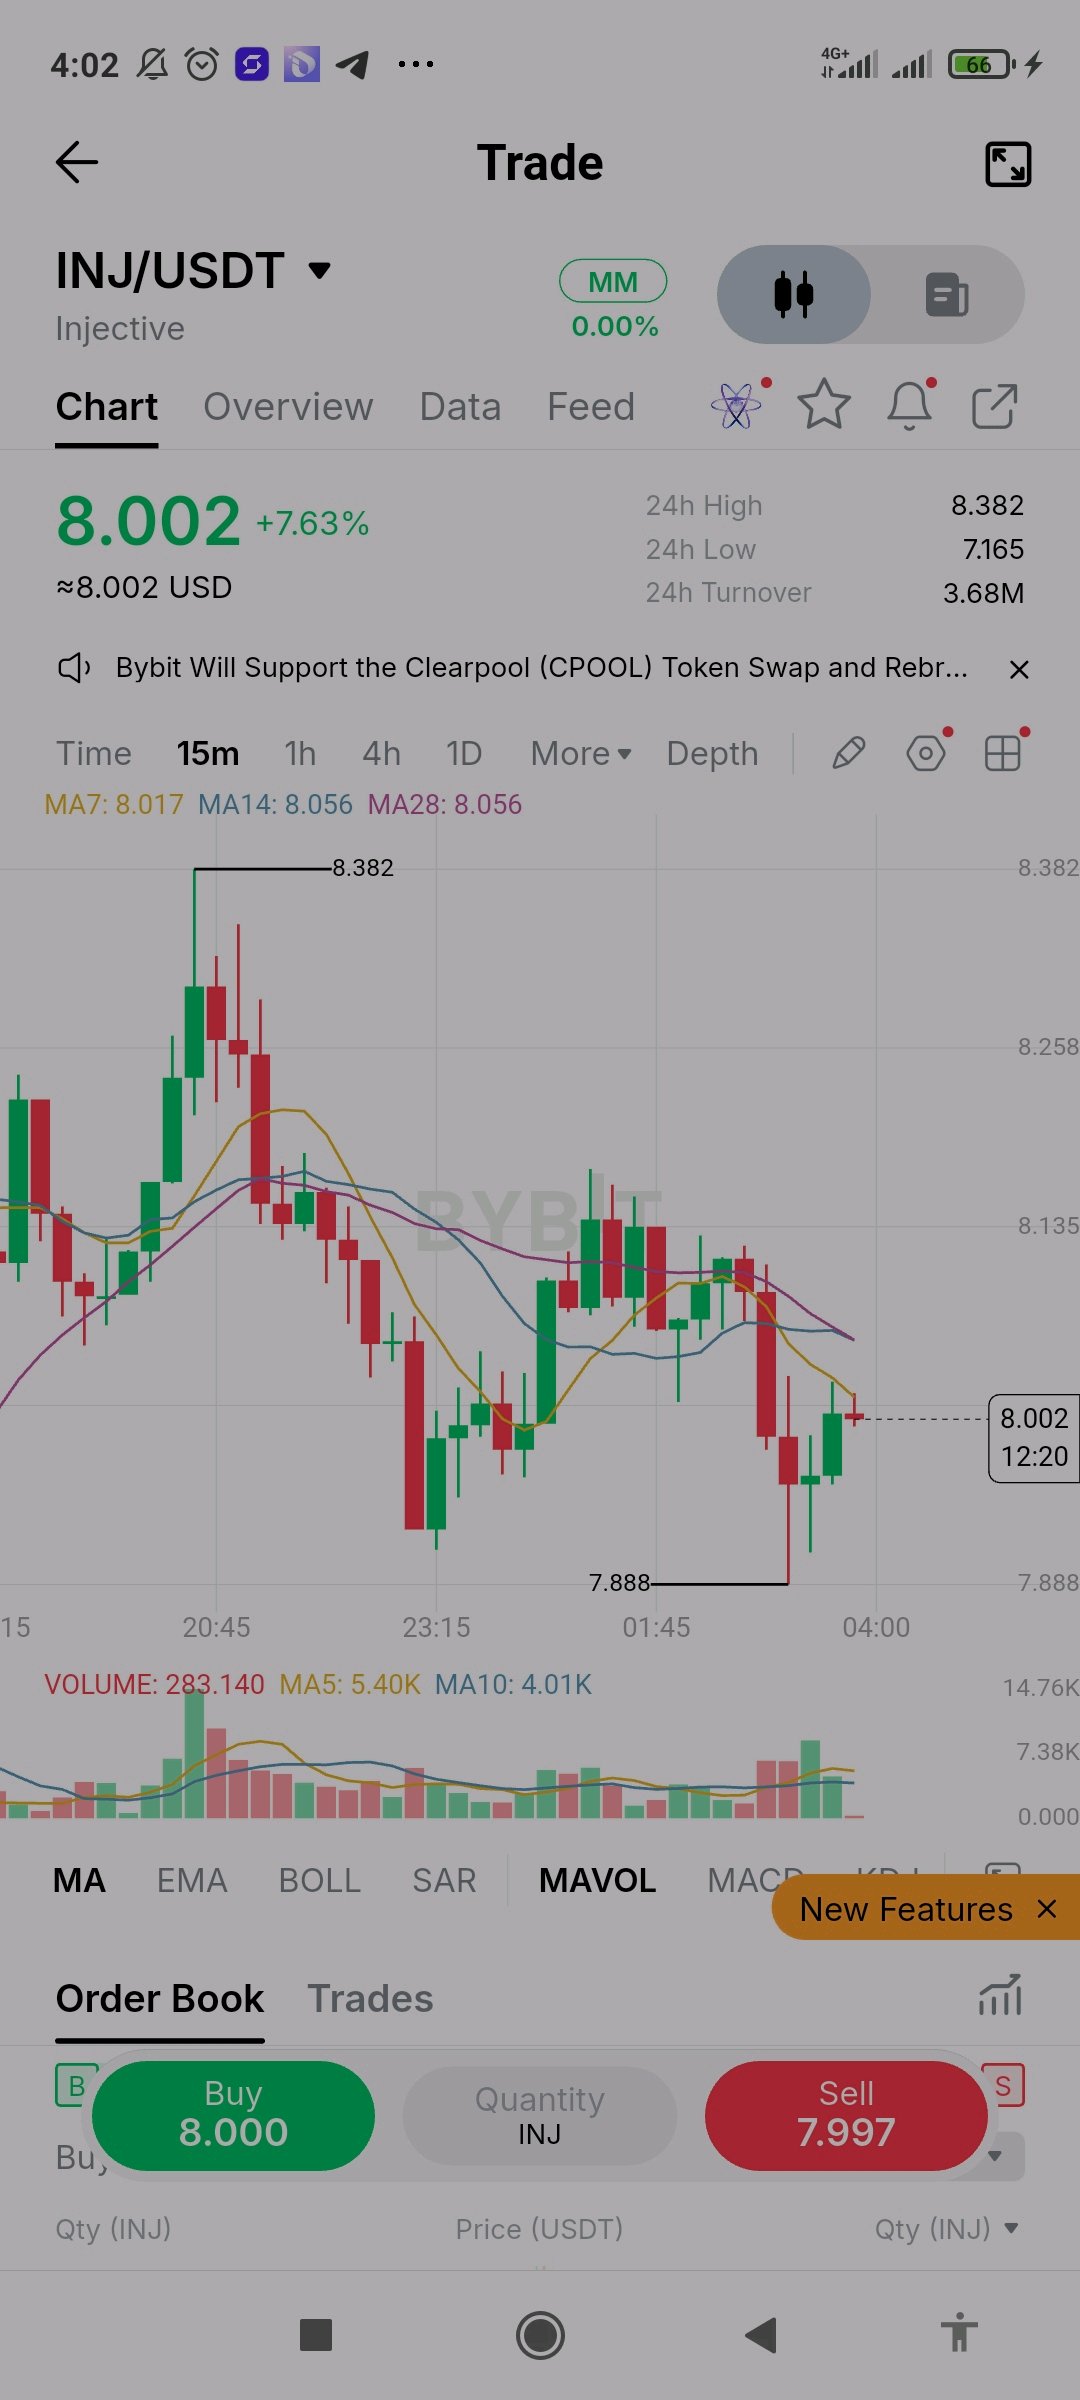
$NEARUSDT is at 3.549 on the 15m chart, up about 3.4% on the day and recovering after a dip to 3.444. Price spiked to a high of 3.638 early, sold off, then built a series of higher lows. MA7 (3.536), MA14 (3.521) and MA28 (3.526) are tightly bunched, and price now sits above all three after a run of green candles. The recovery is constructive, but the averages are still flat and tangled, so a clean trend has not formed yet. Volume has stayed light since the early spike, which means buyers are not showing strong conviction. A close above 3.638 would favor bulls, while a drop back under the MA cluster near 3.52 would suggest the bounce is failing. Nothing here is confirmed. Lesson: a recovery on light volume is a test, not a trend. Wait for price to clear resistance with a candle close, and size your trade so a failed breakout stays small. #IMPACTbyTrade $NEARUSDT $BTCUSDT
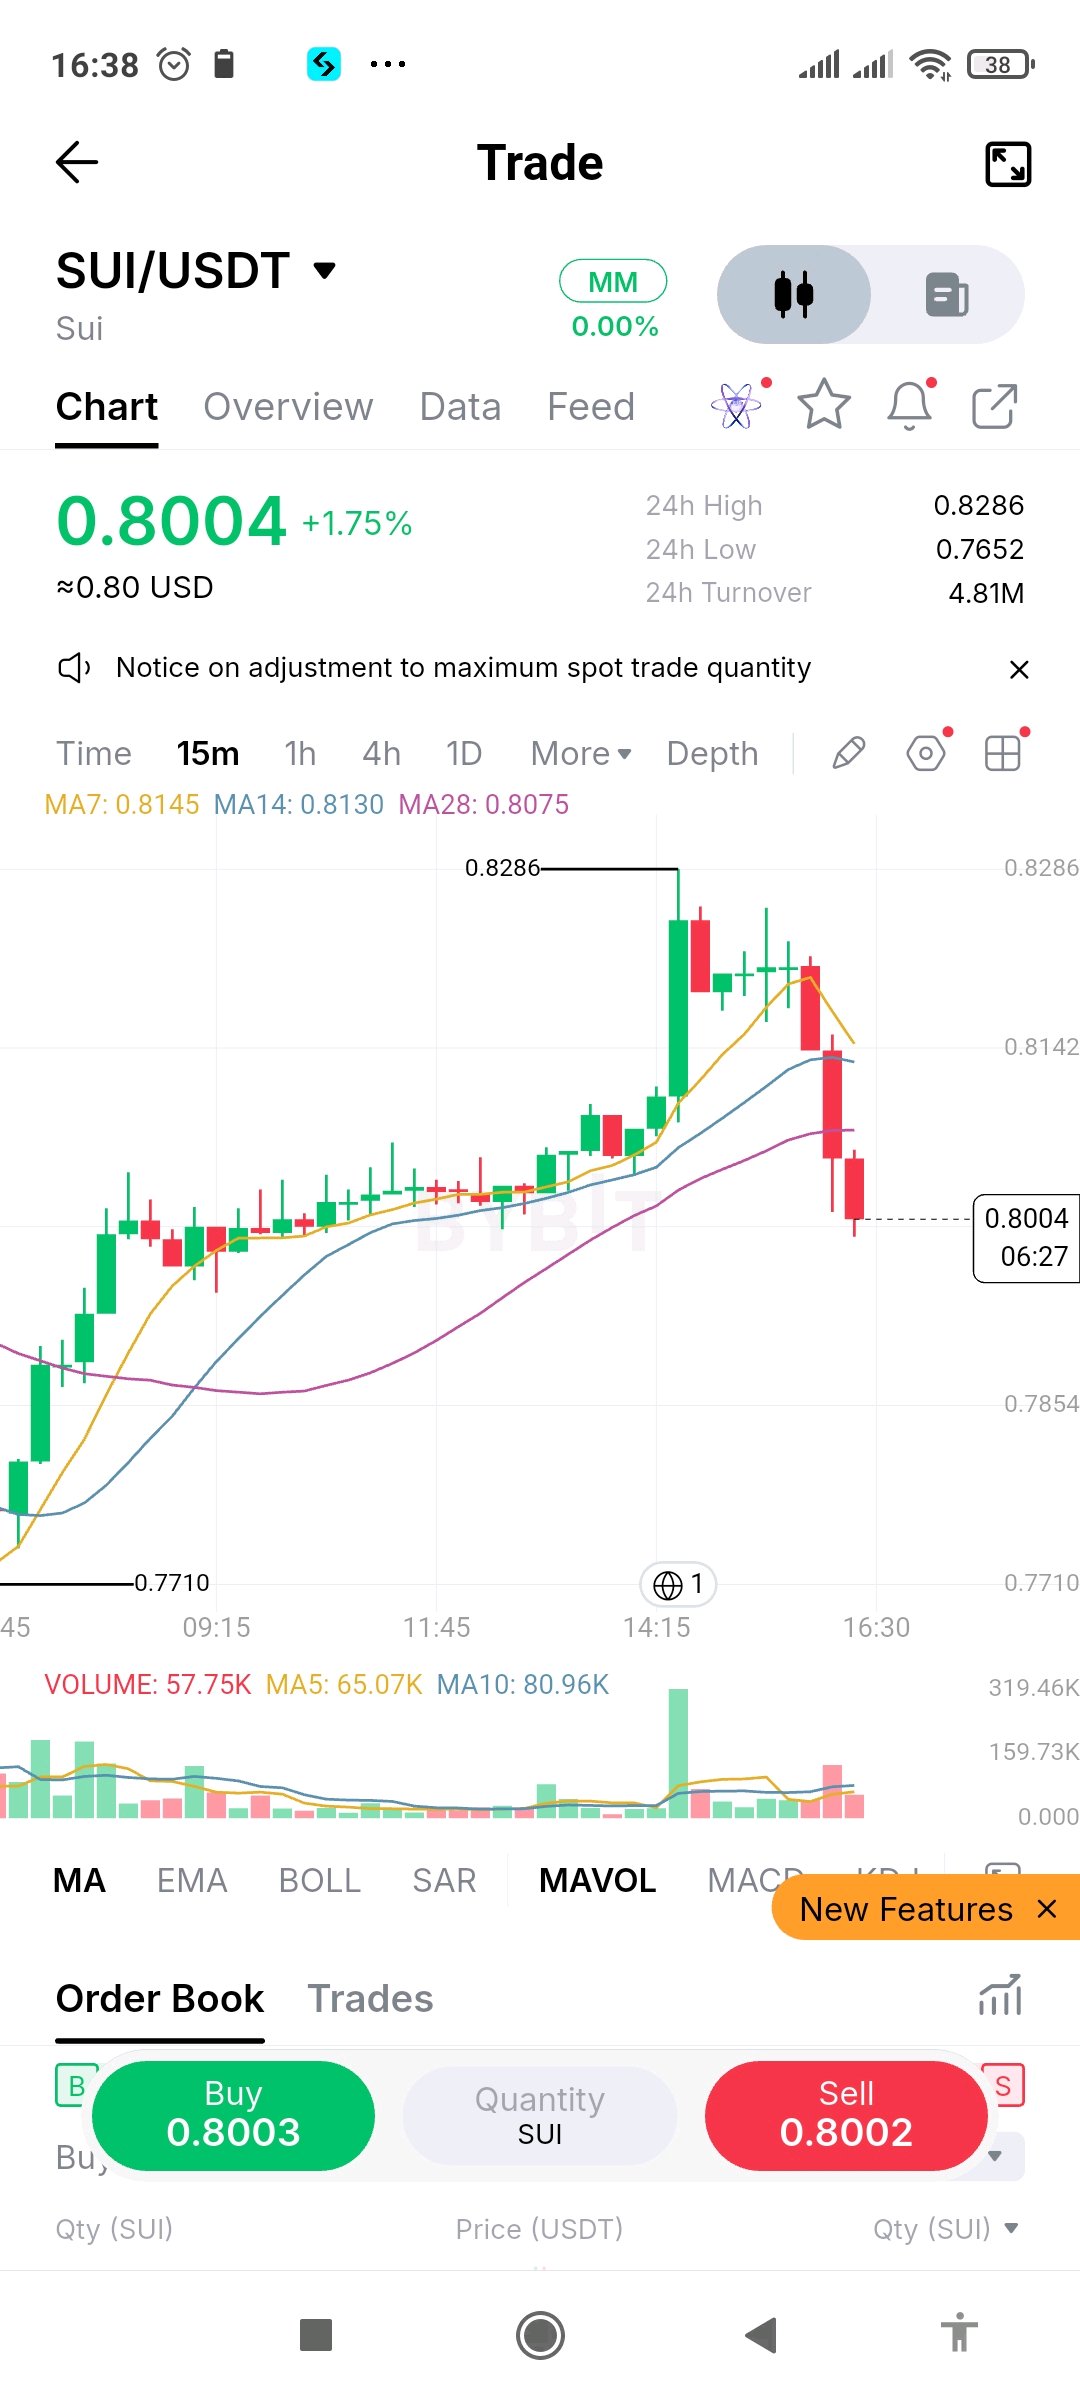
$SUIUSDT 在 15 分鐘線圖上報 0.8004,日內漲幅約 1.8%,但短期走勢已急轉直下。價格從 0.7710 附近一路攀升至 0.8286 高點,隨後在一連串的綠K下殺中跌破 MA7 (0.8145)、MA14 (0.8130) 與 MA28 (0.8075)。目前這三條均線皆在價格上方,且 MA7 已開始下彎。 若賣壓持續,下一個參考點位為 0.7710 低點與 0.7854 網格線。若出現反彈,可能會在 MA28 附近的 0.8075 遭遇阻力;若能收在該位置之上,則顯示賣方正失去控制。下跌過程中成交量溫和,遠低於高點時的爆量,因此跌勢信心似乎有限。目前沒有任何訊號確認。 教訓:當價格同時跌破所有均線時,即便在整體上漲的一天內,結構也已經改變了。不要盲目去接下墜的刀子。等待一個更高的低點出現,並保持倉位大小,確保即便判斷錯誤也不會傷及元氣。 #IMPACTbyTrade $SUIUSDT $BTCUSDT
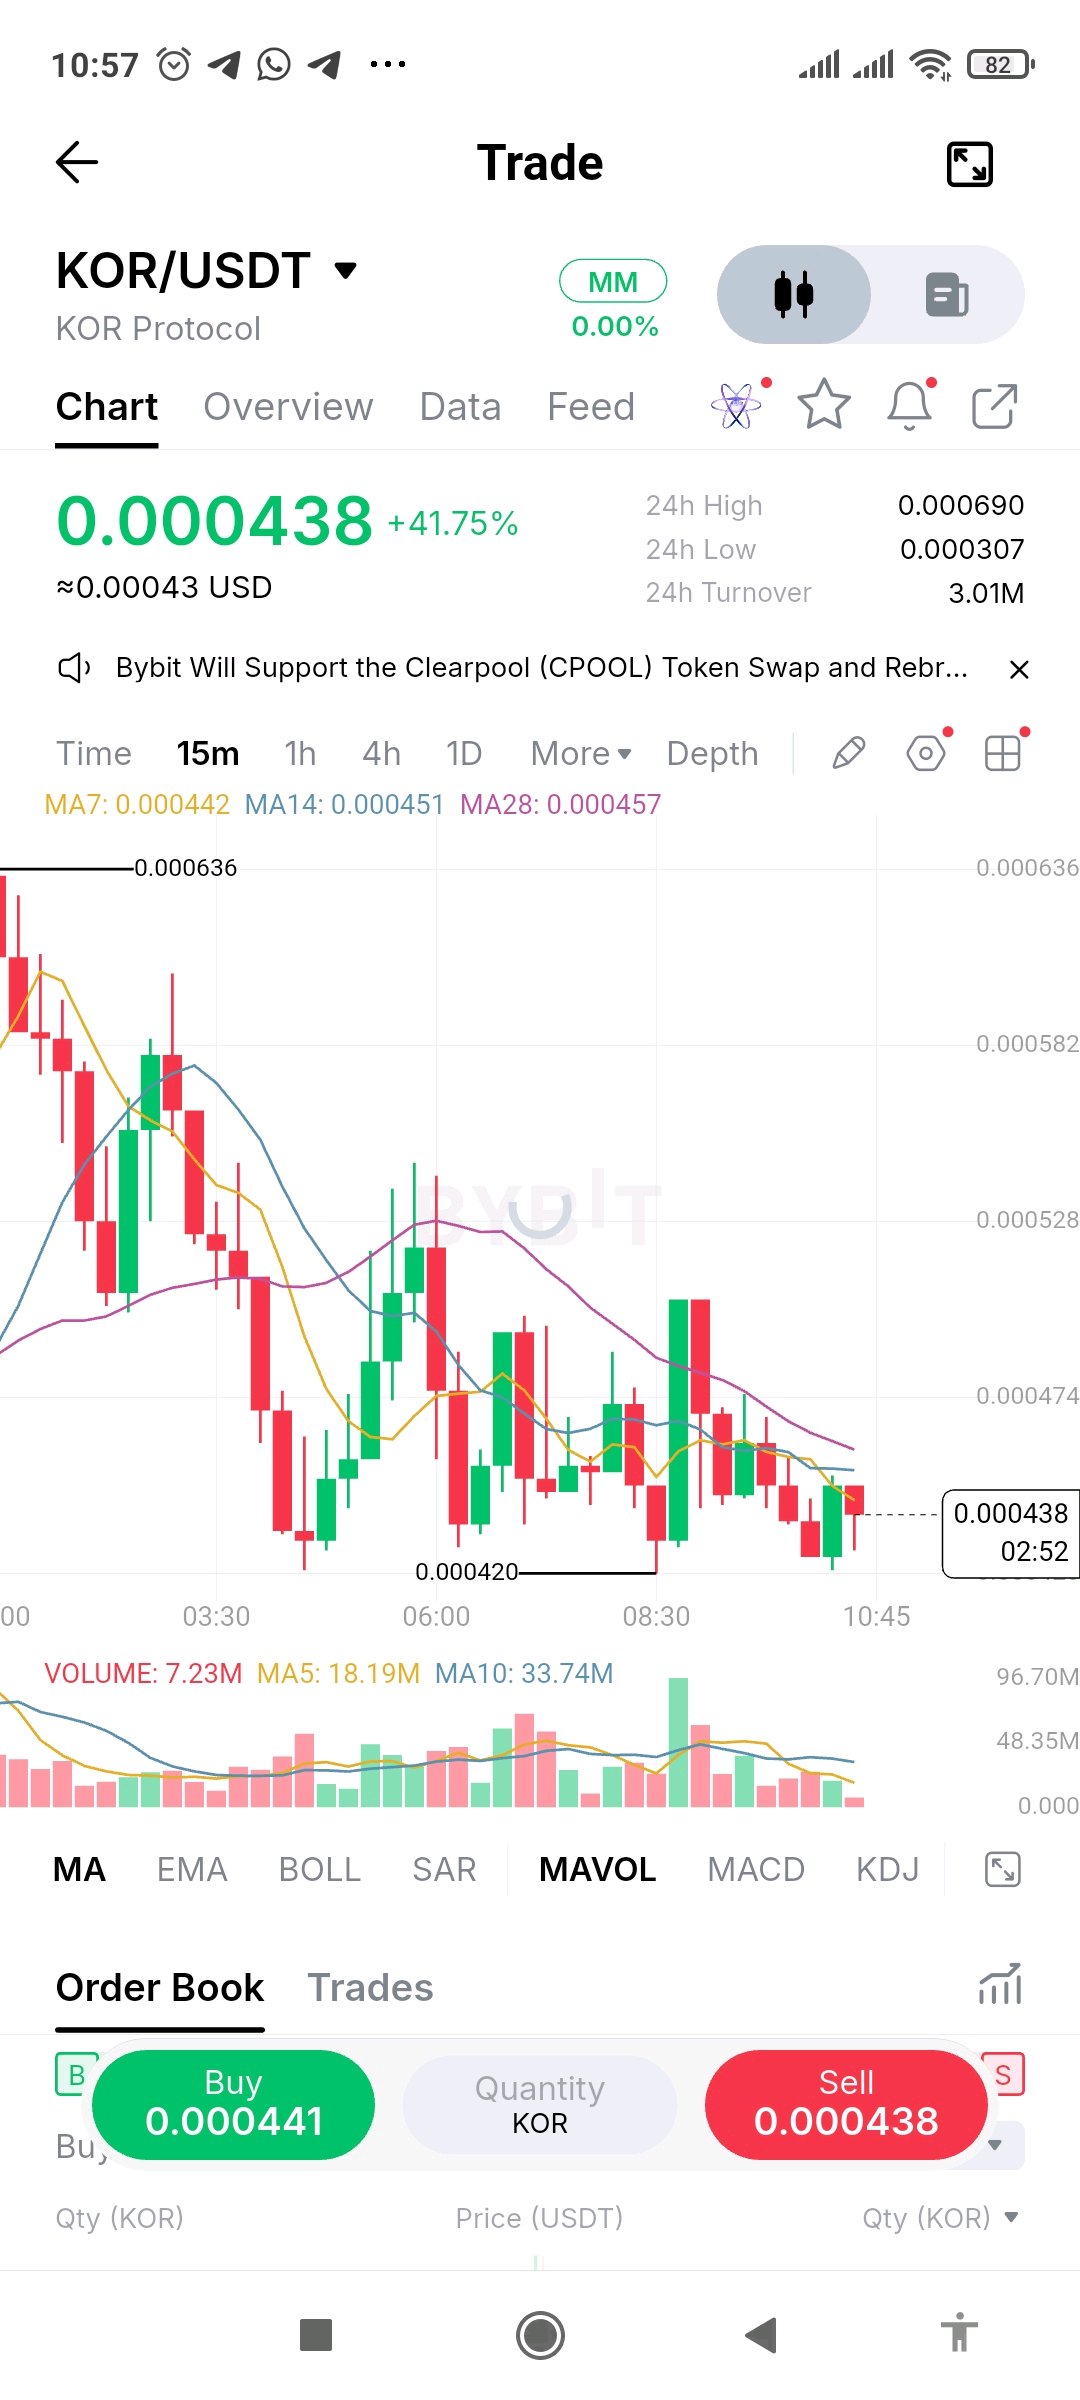
$KORUSDT is at 0.000438 on the 15m chart, up about 42% on the day, but the short-term picture is weak. The 24h range is huge (0.000307 to 0.000690), and price has since slid from the 0.000636 area in a series of lower highs. MA7 (0.000442), MA14 (0.000451) and MA28 (0.000457) are stacked in bearish order and sloping down, with price trading below all three. The 0.000420 low is the level to watch. Holding it could lead to a bounce toward MA7, but a clean break below would suggest sellers are still in control. Volume has faded a lot from the earlier bursts, so the recent drift lower is happening on thinner participation. Nothing here is confirmed. Lesson: a big green daily percentage can hide a chart that is already falling. After a wild 24-hour range, swings can be sharp and stops can fill worse than planned. Judge the trade by where price is now, wait for a higher low, and keep your size small. #IMPACTbyTrade $KORUSDT $BTCUSDT
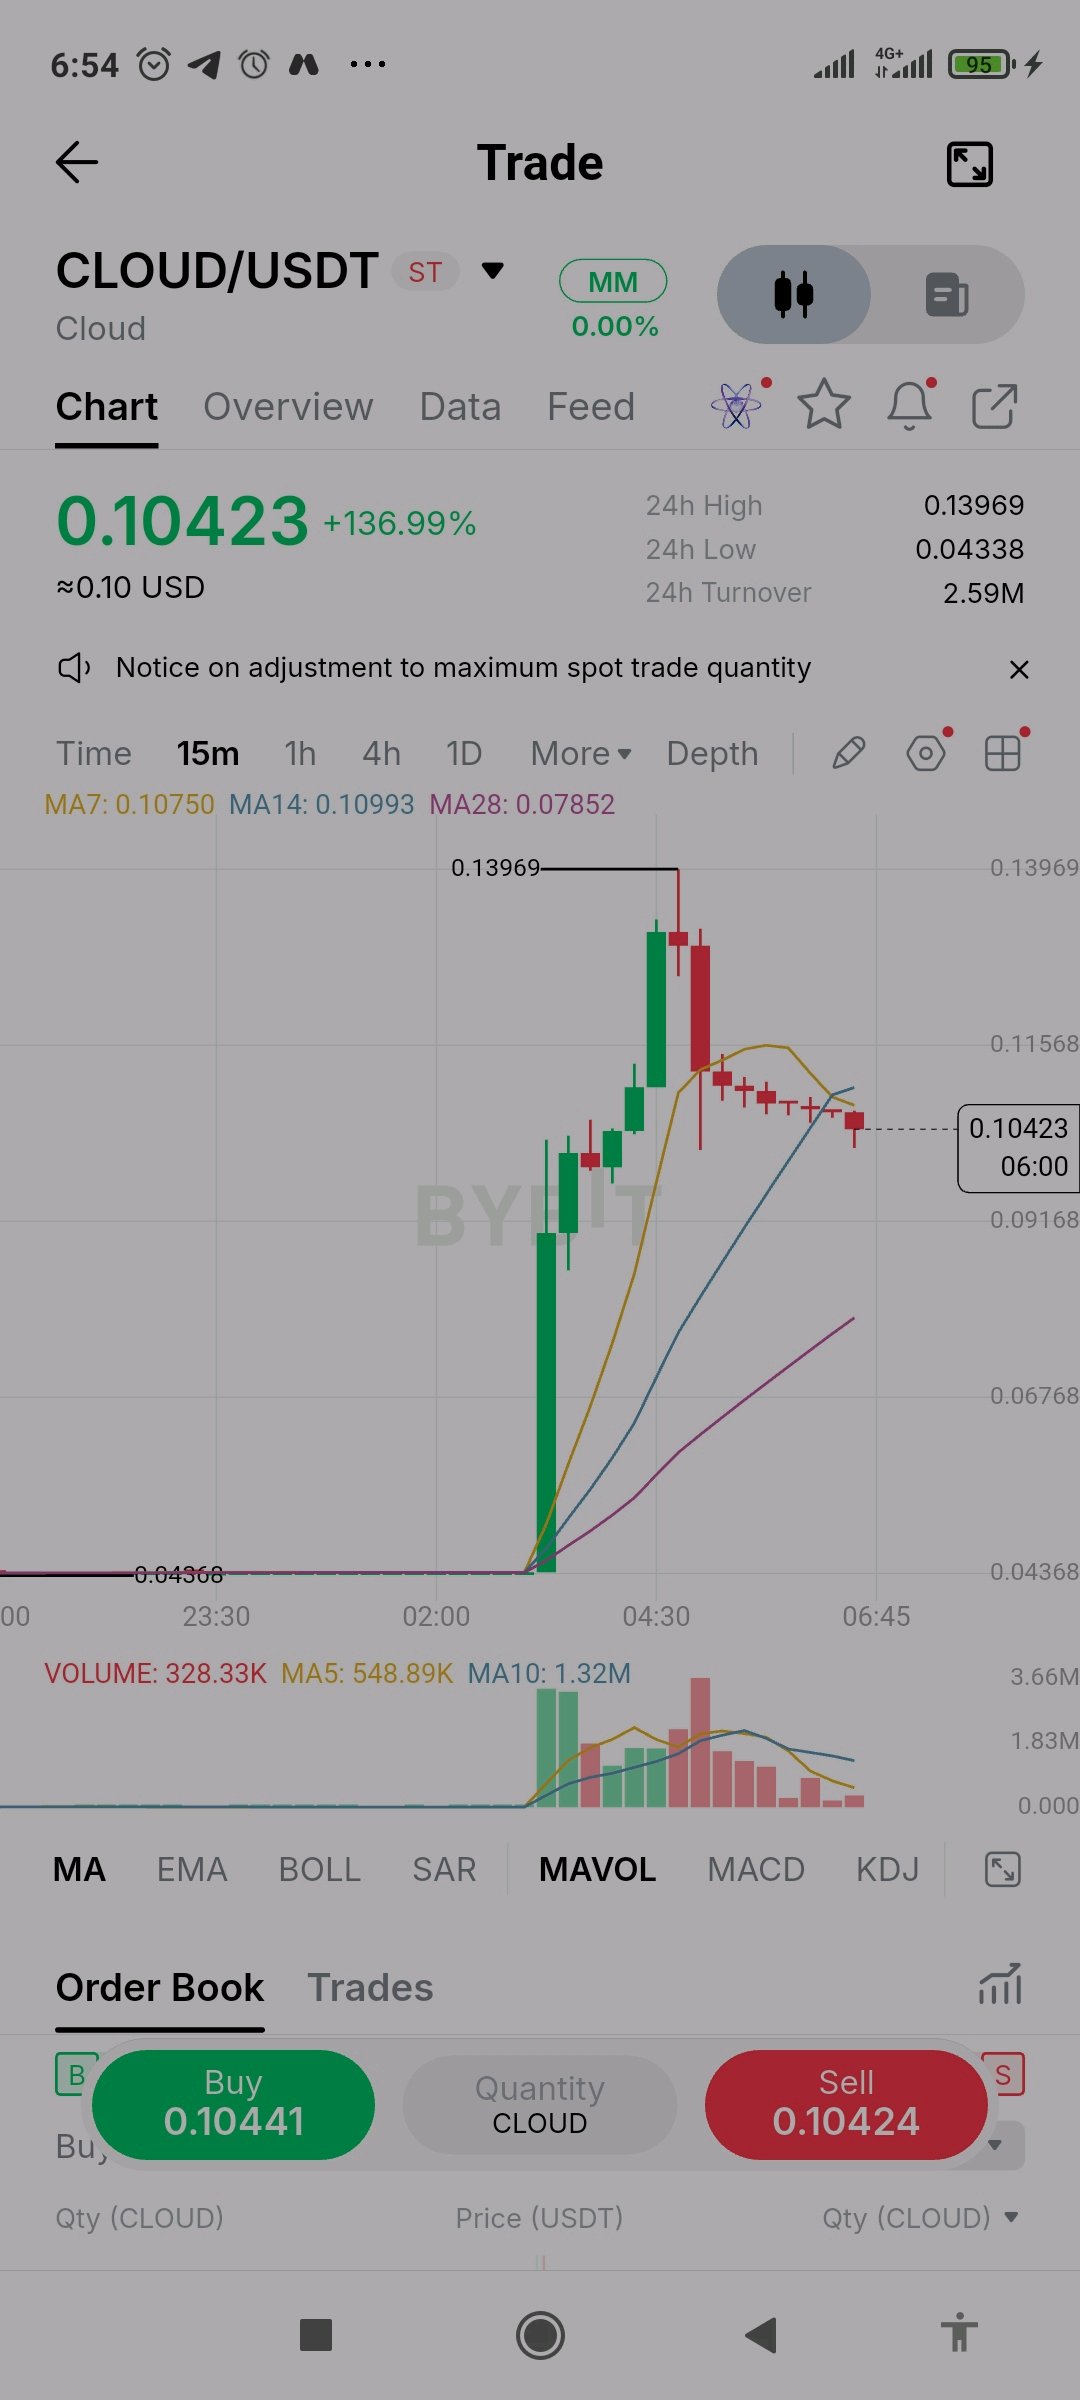
$CLOUDUSDT 目前在 15 分鐘線圖上報 0.10423,日內漲幅約 137%,此前從 0.04368 附近的平整底部垂直拉升至 0.13969 的高點。價格隨後回落,出現一連串小陰線,目前正跌破 MA7 (0.10750) 和 MA14 (0.10993),而 MA28 (0.07852) 仍處於遠下方。 成交量在突破時爆發,並在回調期間持續萎縮,因此賣壓目前看來相對冷靜而非恐慌,但這僅是一種可能性。跌向 MA28 的巨大缺口顯示走勢已相當過度延伸,若跌破均線密集區,該缺口可能會成為下一個目標。若能收復 MA14,則顯示買盤回歸。目前一切尚未確認。 經驗教訓:在單日漲幅達到 137% 後,即便圖表看起來很強勢,風險依然處於最高點。如此快速的走勢反轉起來也同樣快,且流動性不足可能導致止損成交價格不如預期。避免追高,倉位務必控制得非常小,且永遠不要冒險投入超過你能承受損失的資金。 #IMPACTbyTrade $CLOUDUSDT $BTCUSDT
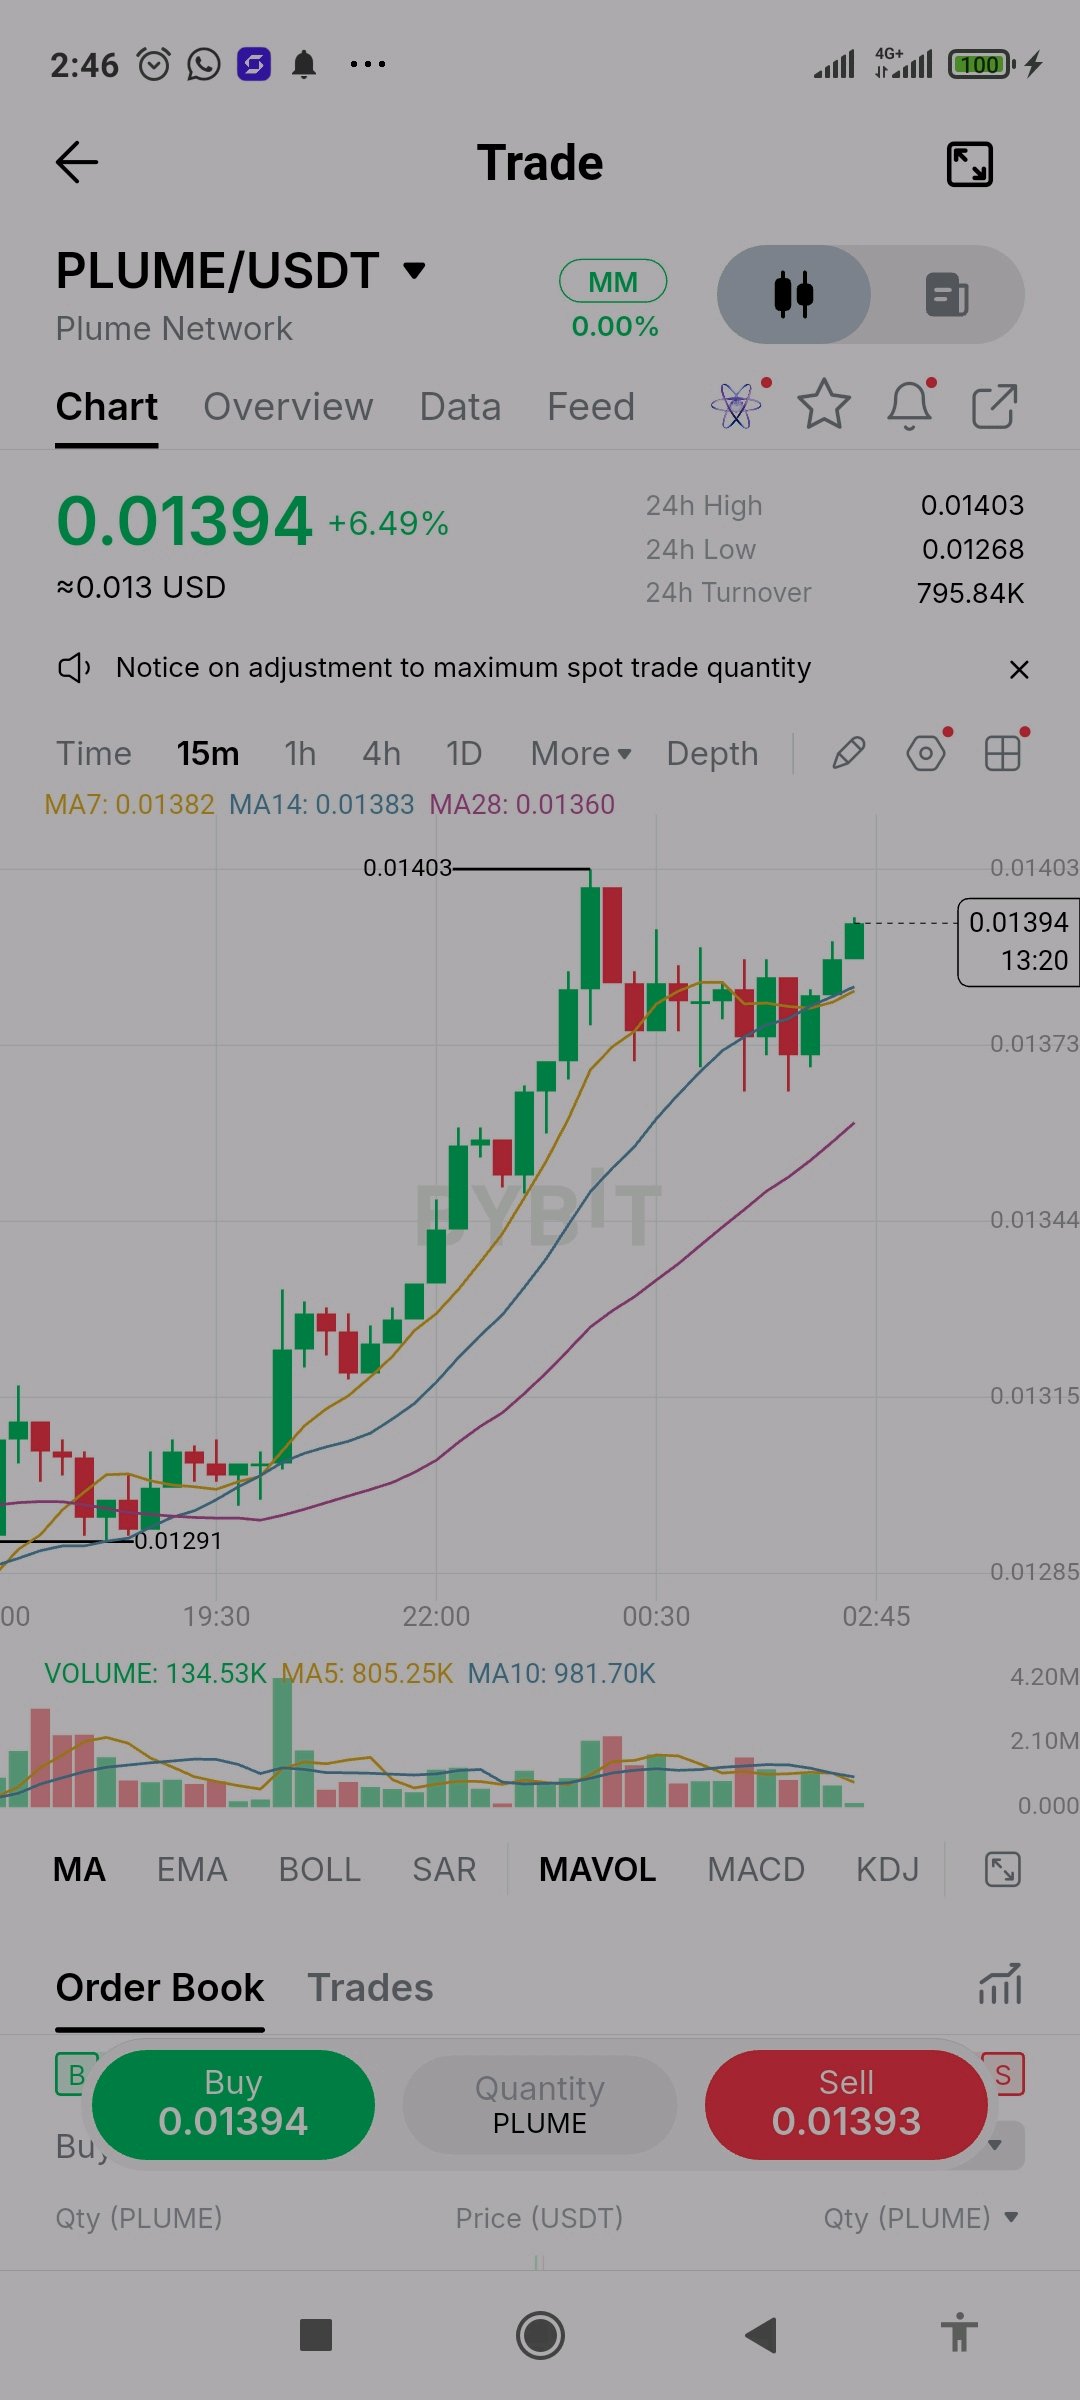
$PLUMEUSDT 在 15 分鐘線圖上報 0.01394,今日漲幅約 6.5%,此前從 0.01291 區域穩步攀升至 0.01403 的高點。MA7 (0.01382)、MA14 (0.01383) 和 MA28 (0.01360) 均呈上升趨勢,其中 MA7 與 MA14 幾乎重合在價格下方。在觸及高點後,價格有所回調並呈現橫盤整理,隨後最新的一根陽線將價格再次推向高點。 目前的結構表現建設性,但價格目前正逼近 0.01403 的阻力位,此前已在此處受阻一次。自主要漲勢以來成交量有所減弱,因此這一波二次推升目前缺乏足夠的支撐。若價格收盤高於 0.01403 將有利於多方,而若跌破 0.0138 附近的 MA7/MA14 區域則為初步警示。目前一切尚未確認。 經驗教訓:在成交量減弱的情況下進行阻力位的二次測試,失敗的可能性與突破的可能性同樣大。請等待 K 線收盤站穩關鍵點位之上,並控制好倉位大小,以確保假突破時的損失維持在可控範圍內。 #IMPACTbyTrade $PLUMEUSDT $BTCUSDT
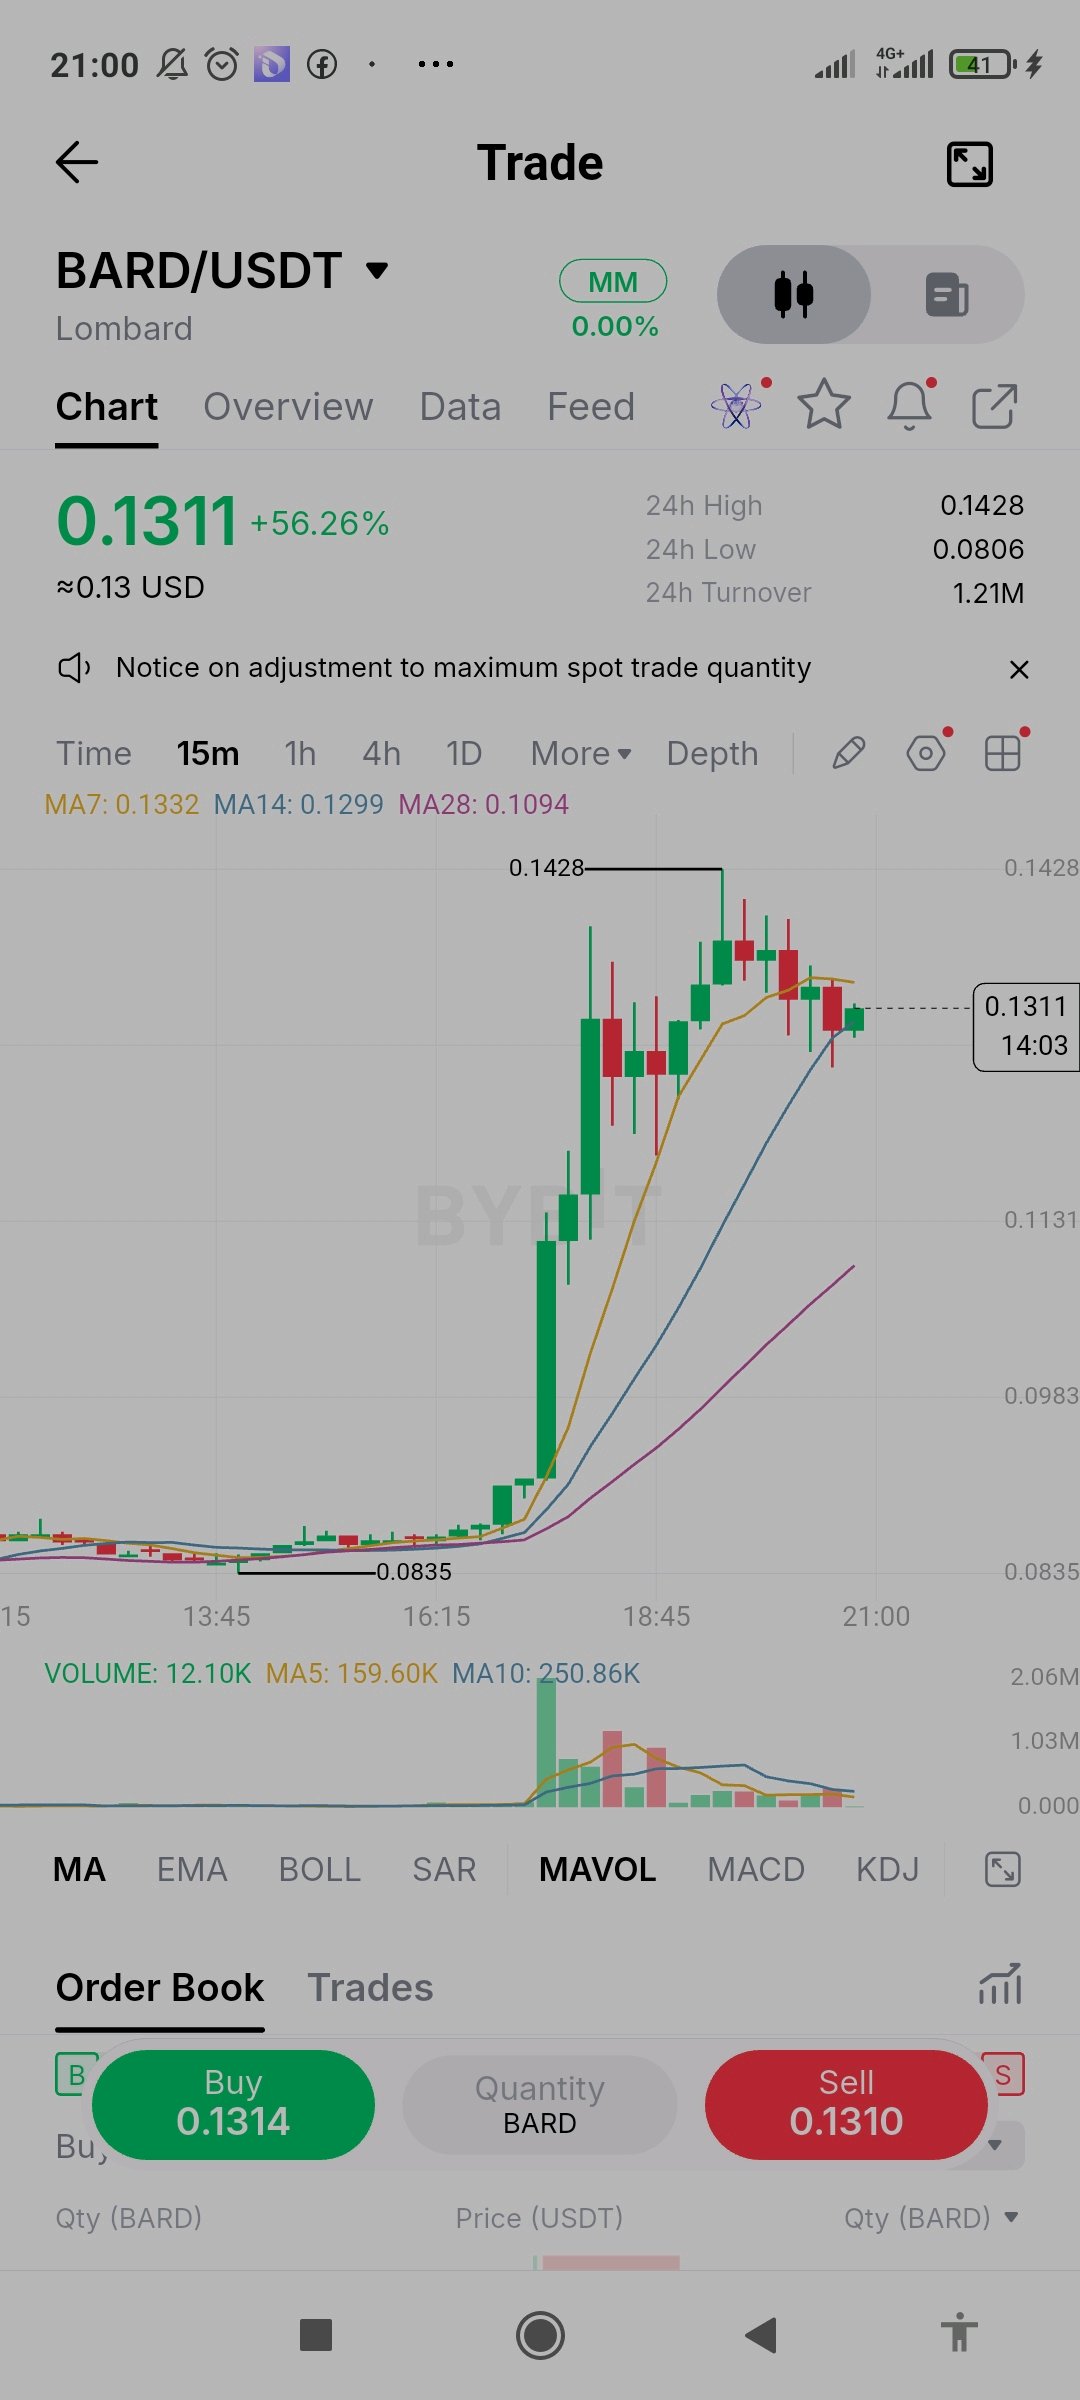
$BARDUSDT is at 0.1311 on the 15m chart, up about 56% on the day after a near-vertical move from a flat base around 0.0835 to a high of 0.1428. MA7 (0.1332), MA14 (0.1299) and MA28 (0.1094) are in bullish order and sloping up, but MA28 is far below price, which shows how stretched the move is. Price is now pulling back and sitting right between MA7 and MA14. Volume exploded during the breakout and has faded a lot since, so the pullback is happening on much lighter participation. That may be profit-taking, but it is only a possibility. A close back above 0.1428 would favor buyers, while a drop below MA14 near 0.1299 would be the first sign the move is cooling and would put the wide gap down to MA28 in play. Nothing here is confirmed. Lesson: after a 56% day, risk is at its highest even when the chart looks strong. The further price is from its averages, the more a pullback can cost late buyers. Avoid chasing, keep your size small, and set your exit before you enter. #IMPACTbyTrade $BARDUSDT $BTCUSDT
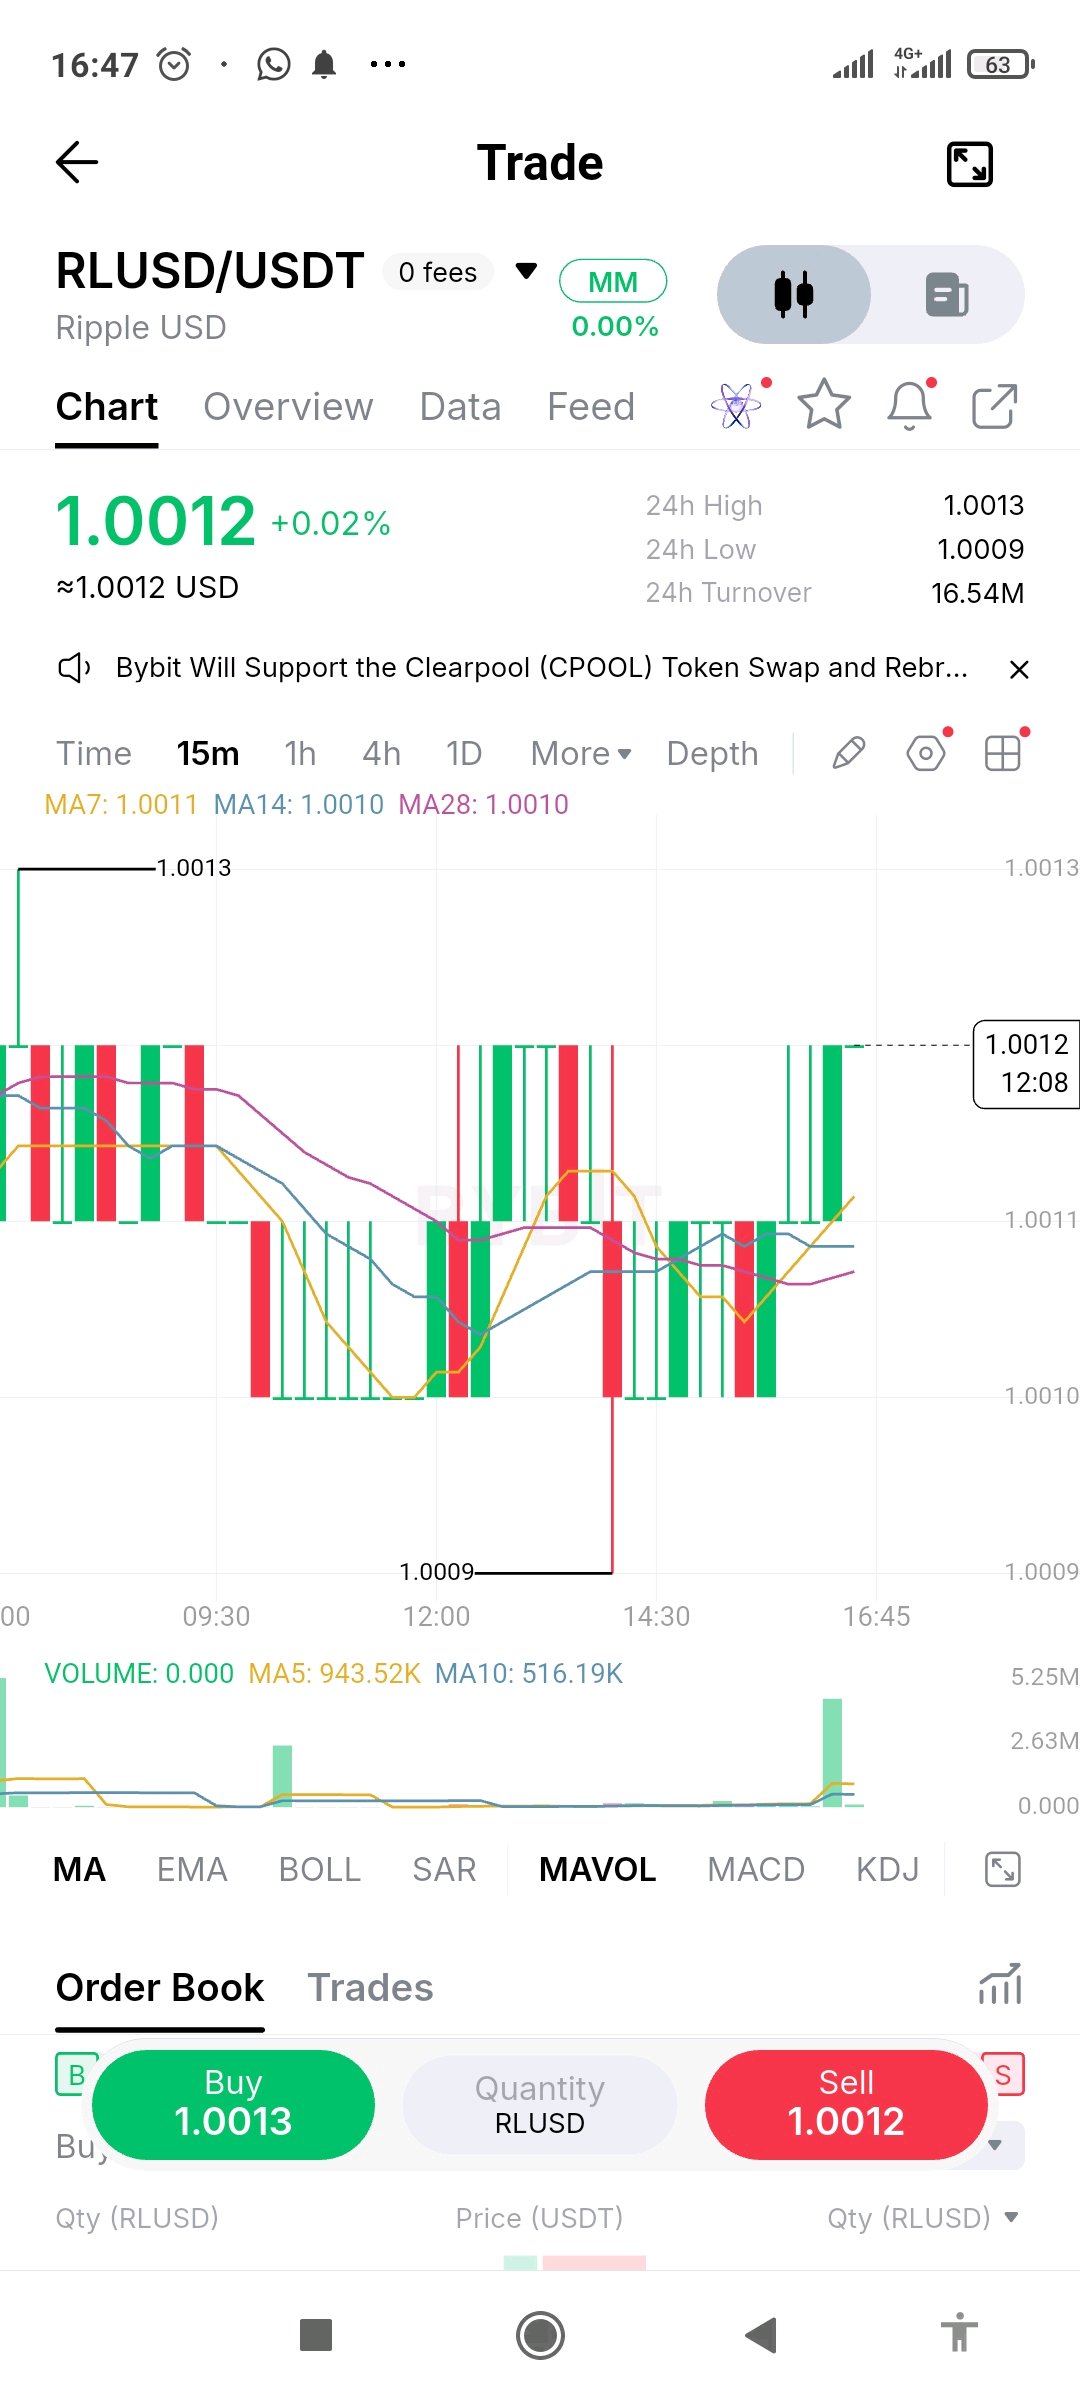
$RLUSDUSDT 在 15 分鐘線圖上價格為 1.0012,日內僅上漲 0.02%,且在 1.0009 到 1.0013 的極窄區間內波動。這是一個穩定幣類型的交易對,因此那些看似塊狀的蠟燭圖和劇烈的波動,僅僅是因為價格座標軸放大所致。MA7 (1.0011)、MA14 (1.0010) 和 MA28 (1.0010) 幾乎完全相同,價格在大約 1.0010 和 1.0012 之間震盪。 唯一一次短暫跌至 1.0009 也很快回升。除了少數幾根孤立的柱狀圖外,大多數蠟燭圖的交易量接近於零,這顯示是清淡、平靜的交易,而非趨勢行情。這裡百分之零點零幾的波動只是雜訊,而非訊號。任何真正的警訊應該是脫離 1.00 的大幅且持續的移動,而這張圖表上並未顯示任何跡象。 教訓:在解讀圖表前,請務必先檢查價格座標軸的比例。對於穩定幣交易對,手續費和點差很容易就超過這些微小波動帶來的收益,所以不要將戲劇性的蠟燭線誤認為是投資機會。 #IMPACTbyTrade $RLUSDUSDT $BTCUSDT
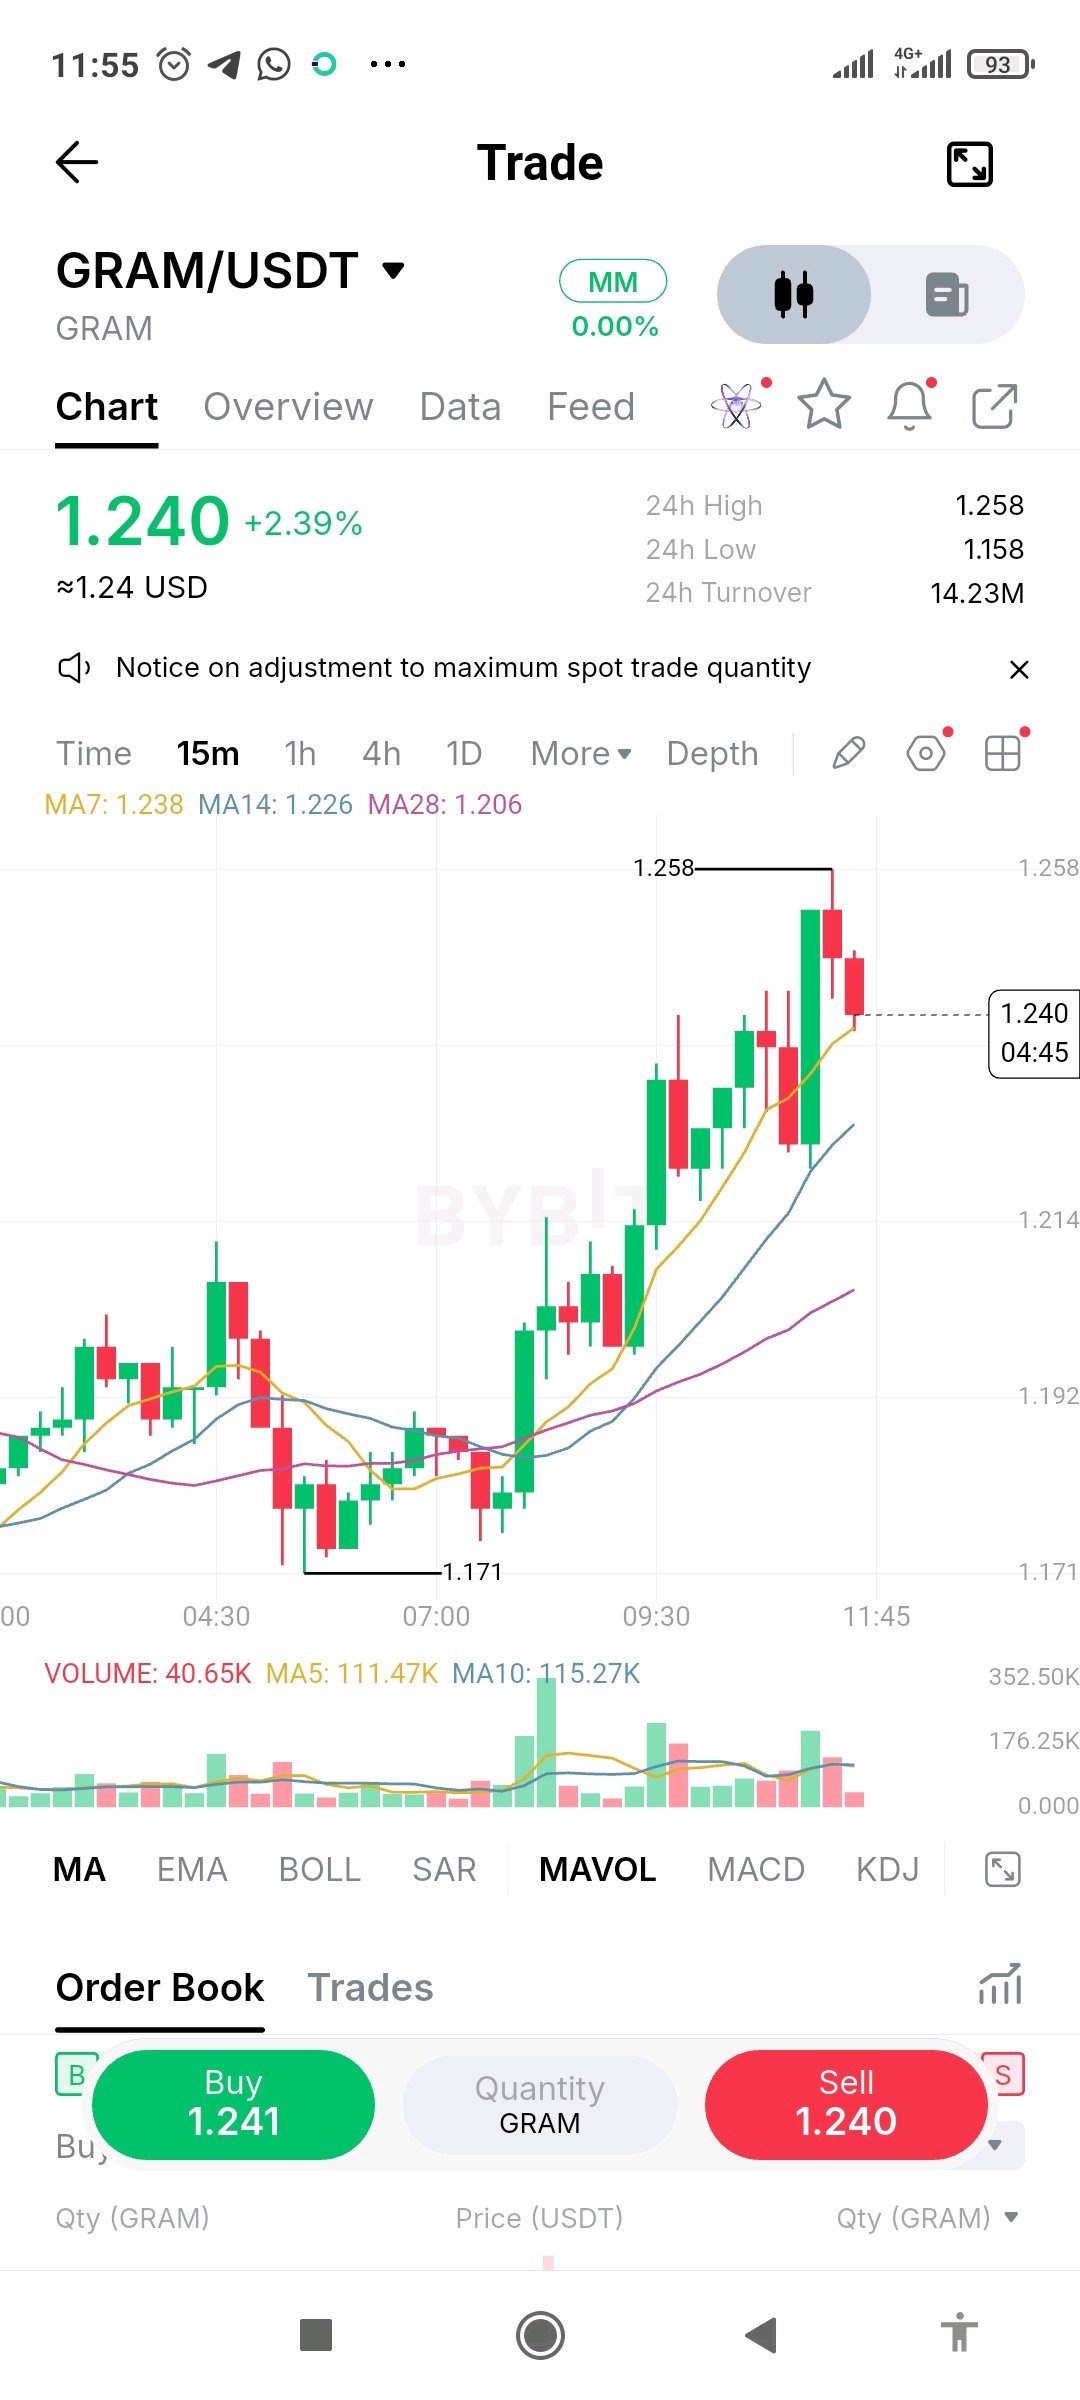
$GRAMUSDT is at 1.240 on the 15m chart, up about 2.4% on the day after a clean climb from the 1.171 area to a high of 1.258. MA7 (1.238), MA14 (1.226) and MA28 (1.206) are stacked in bullish order and fanning upward, with price sitting right on MA7 after two red candles and a rejection wick near the high. The trend is constructive, but momentum is cooling. Volume was strongest during the mid-chart push and has been fading on the last few candles, so buyers are not adding fresh pressure at the top. A close above 1.258 would favor bulls, while a drop below MA7 would be the first warning and a pullback toward MA14 near 1.226 would not be unusual. Nothing here is confirmed. Lesson: when price stalls at a high on fading volume, entering late leaves little room for error. Let the pullback show you where buyers defend, set your exit before you enter, and keep your size small. #IMPACTbyTrade $GRAMUSDT $BTCUSDT
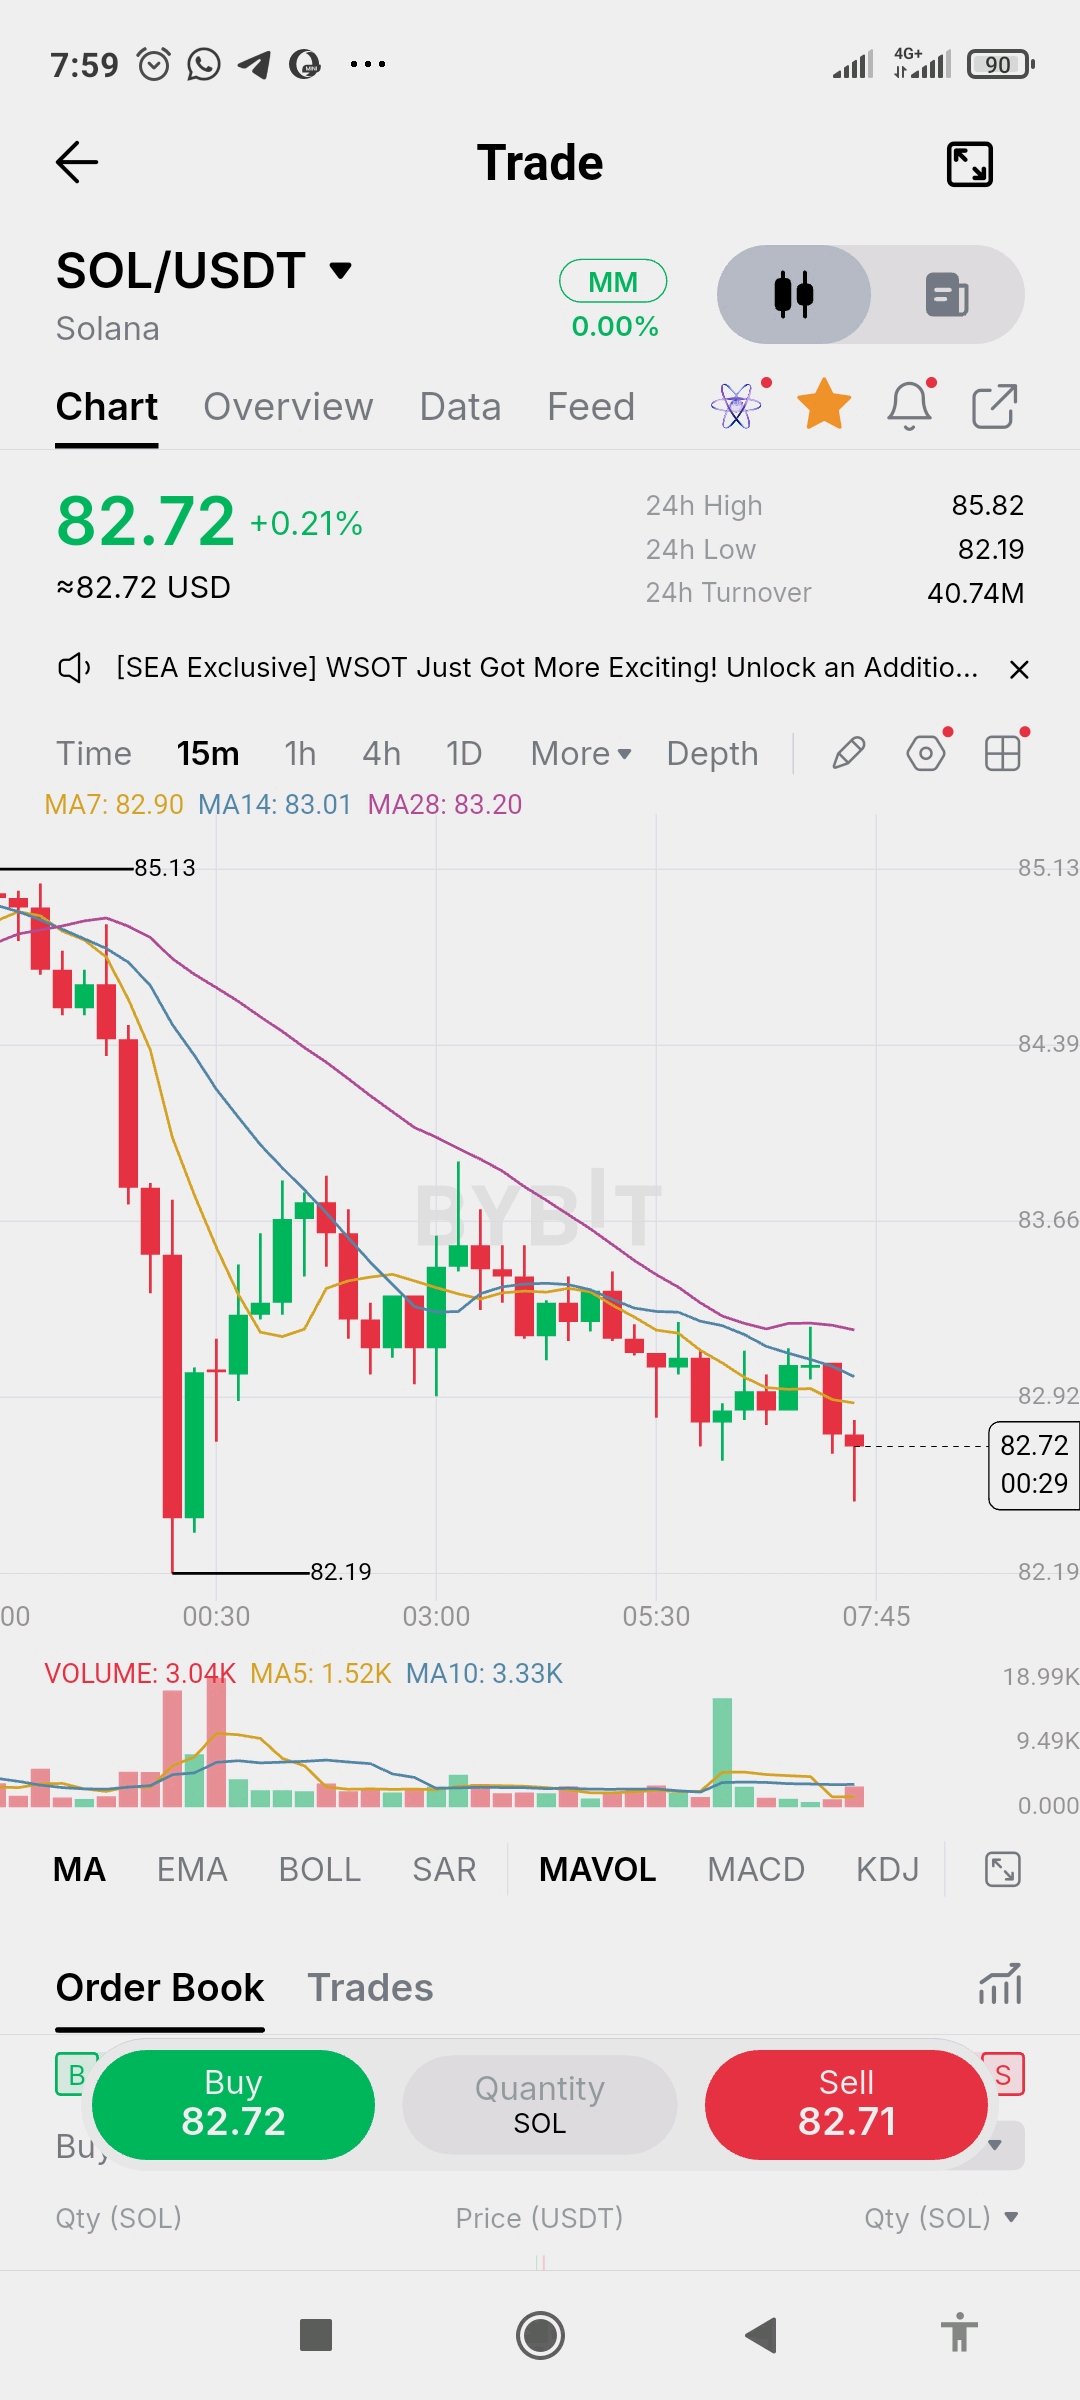
$SOLUSDT 在 15 分鐘線圖上位於 82.72,日內上漲約 0.2%,但短期趨勢明顯向下。價格從 85.13 區域滑落至 82.19 的低點,反彈後再次轉跌,形成更低的高點。MA7 (82.90)、MA14 (83.01) 和 MA28 (83.20) 以看跌順序排列且全部向下傾斜,價格交易於它們下方。 82.19 的低點是需要關注的水平。跌破該水平將顯示賣方仍掌控局面,而反彈可能會在 82.90 附近的 MA7 下降趨勢線遭遇阻力。近期走低期間成交量清淡,因此雙方信心都不足。目前沒有任何訊號得到確認。 教訓:持平或綠色的日內漲跌幅可能會掩蓋不斷創出更低高點的圖表走勢。在採取行動前,請等待更高低點的出現或重新站上移動平均線,並控制倉位大小,確保一次錯誤的猜測也不會造成太大損失。 #IMPACTbyTrade $SOLUSDT $BTCUSDT
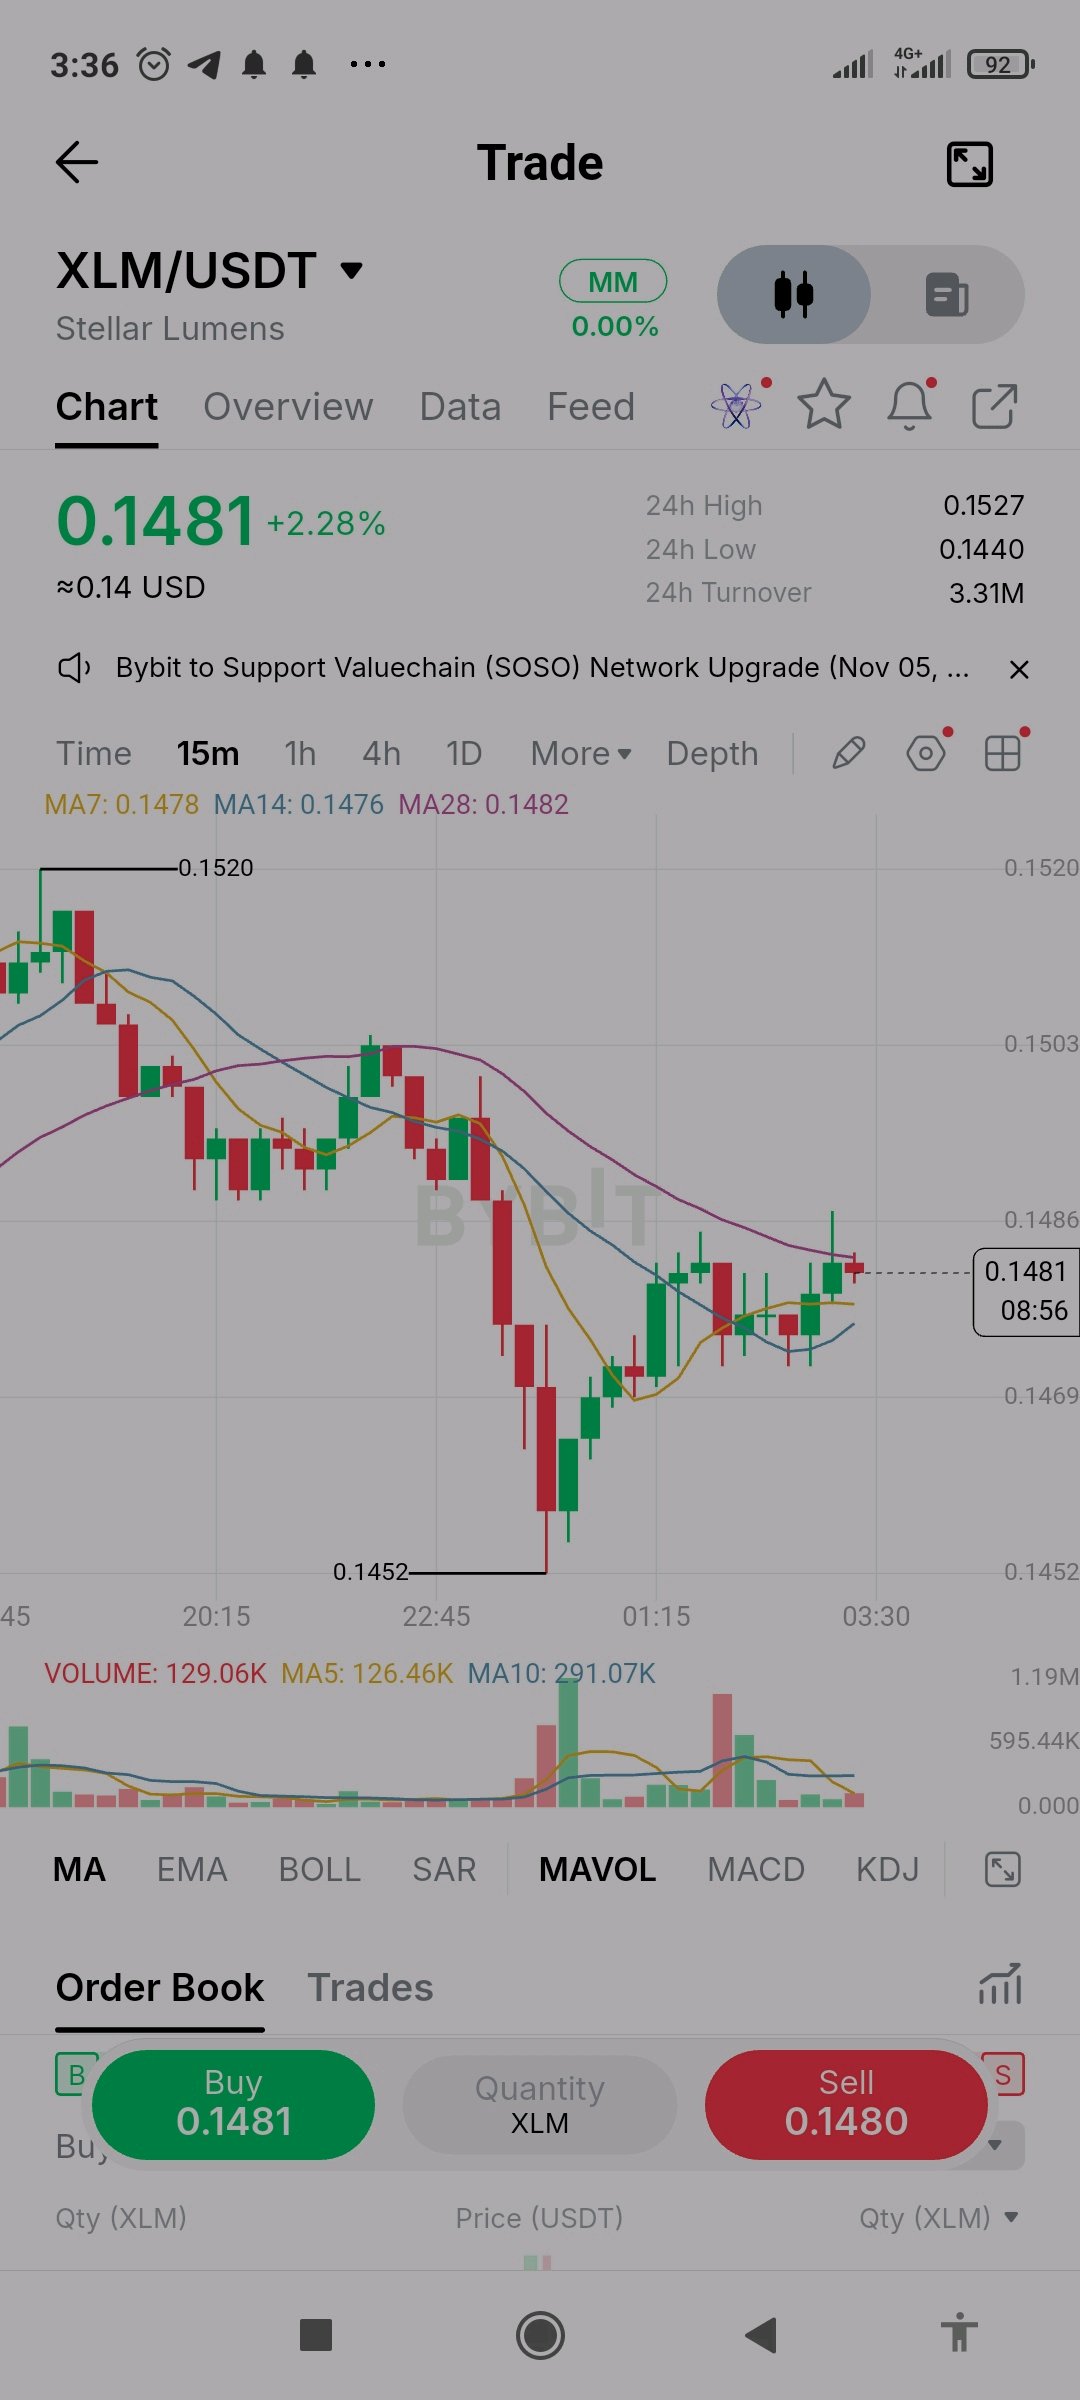
$XLMUSDT 在 15 分鐘圖表上報 0.1481,日內漲幅約 2.3%,但早盤趨勢向下。價格從 0.1520 區域滑落至 0.1452 的低點,隨後反彈,目前正處於 MA7 (0.1478)、MA14 (0.1476) 和 MA28 (0.1482) 的交匯處,這三條均線非常接近。MA28 仍呈下行趨勢,充當最近的阻力位。 反彈是真實存在的,但尚未扭轉趨勢。價格需要收在 MA28 上方才能顯示賣方正在失去控制,而若跌回該均線集群下方,則會再次聚焦於 0.1452 的低點。拋售期間成交量很大,但在復甦過程中成交量減弱,顯示買方信心不足。這裡沒有任何訊號得到確認。 經驗教訓:遇到下跌阻力的復甦只是測試,而非反轉。等待價格收在其上方,並調整交易規模,確保反彈失敗時損失有限。 #IMPACTbyTrade $XLMUSDT $BTCUSDT