Btc星辰
4020點贊0分享95粉絲2關注
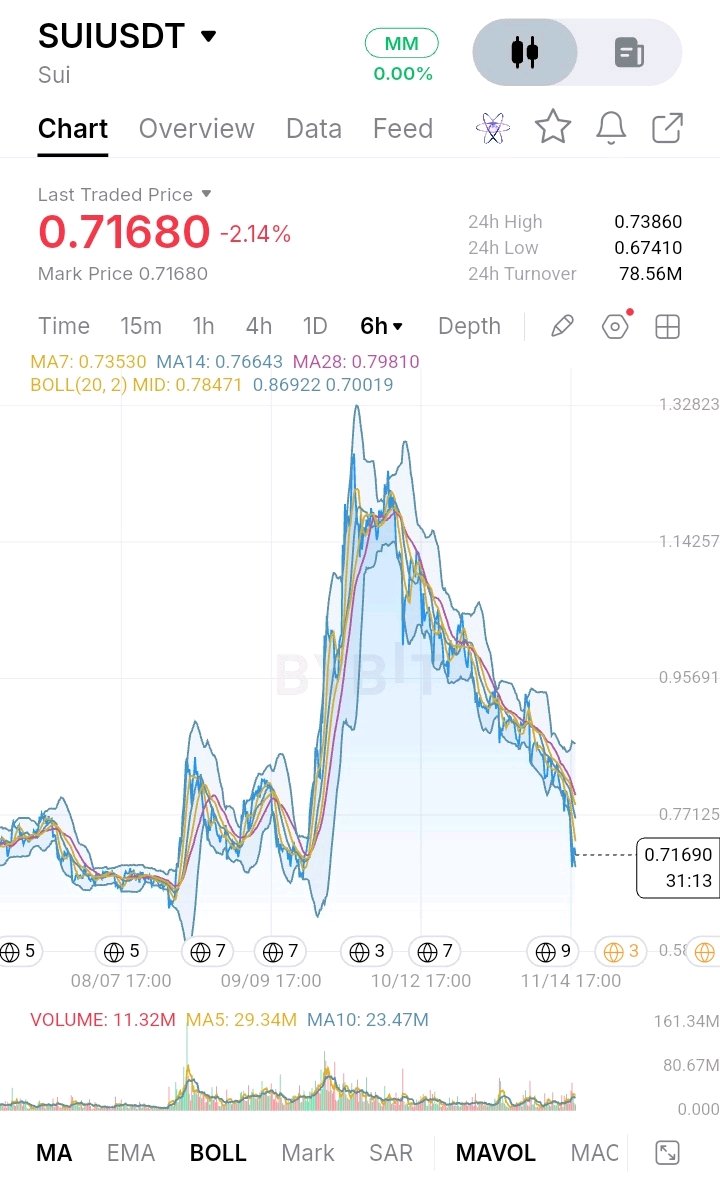
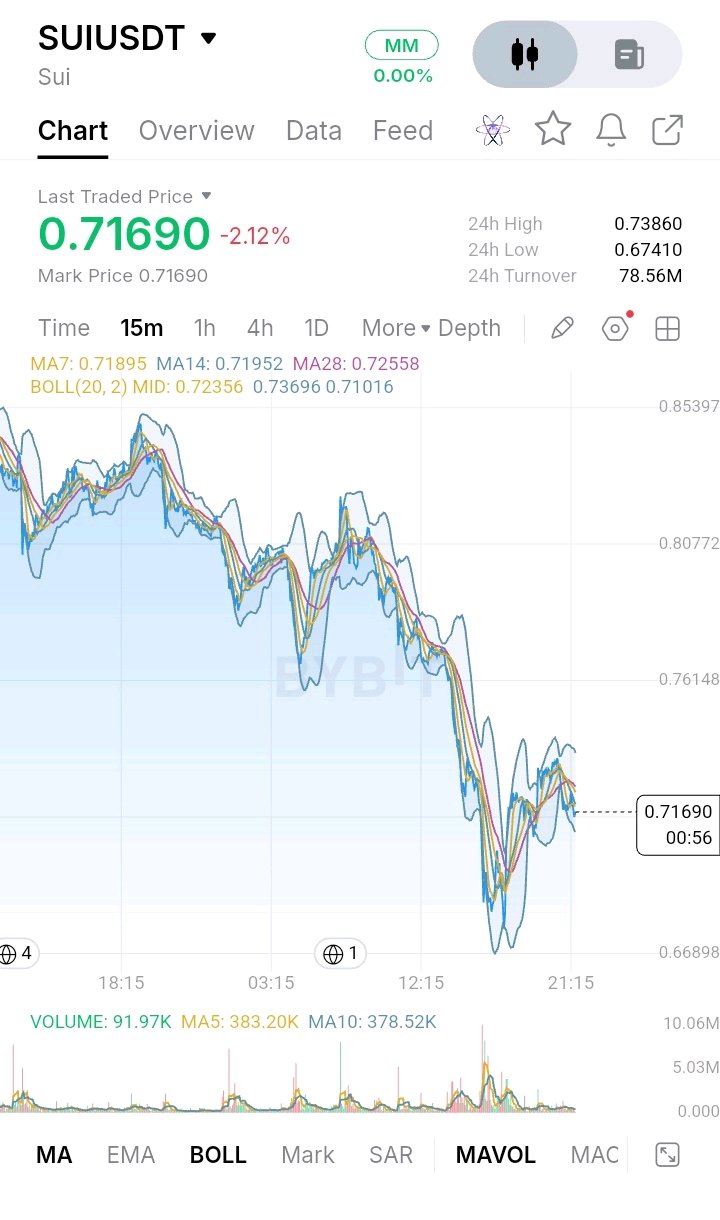
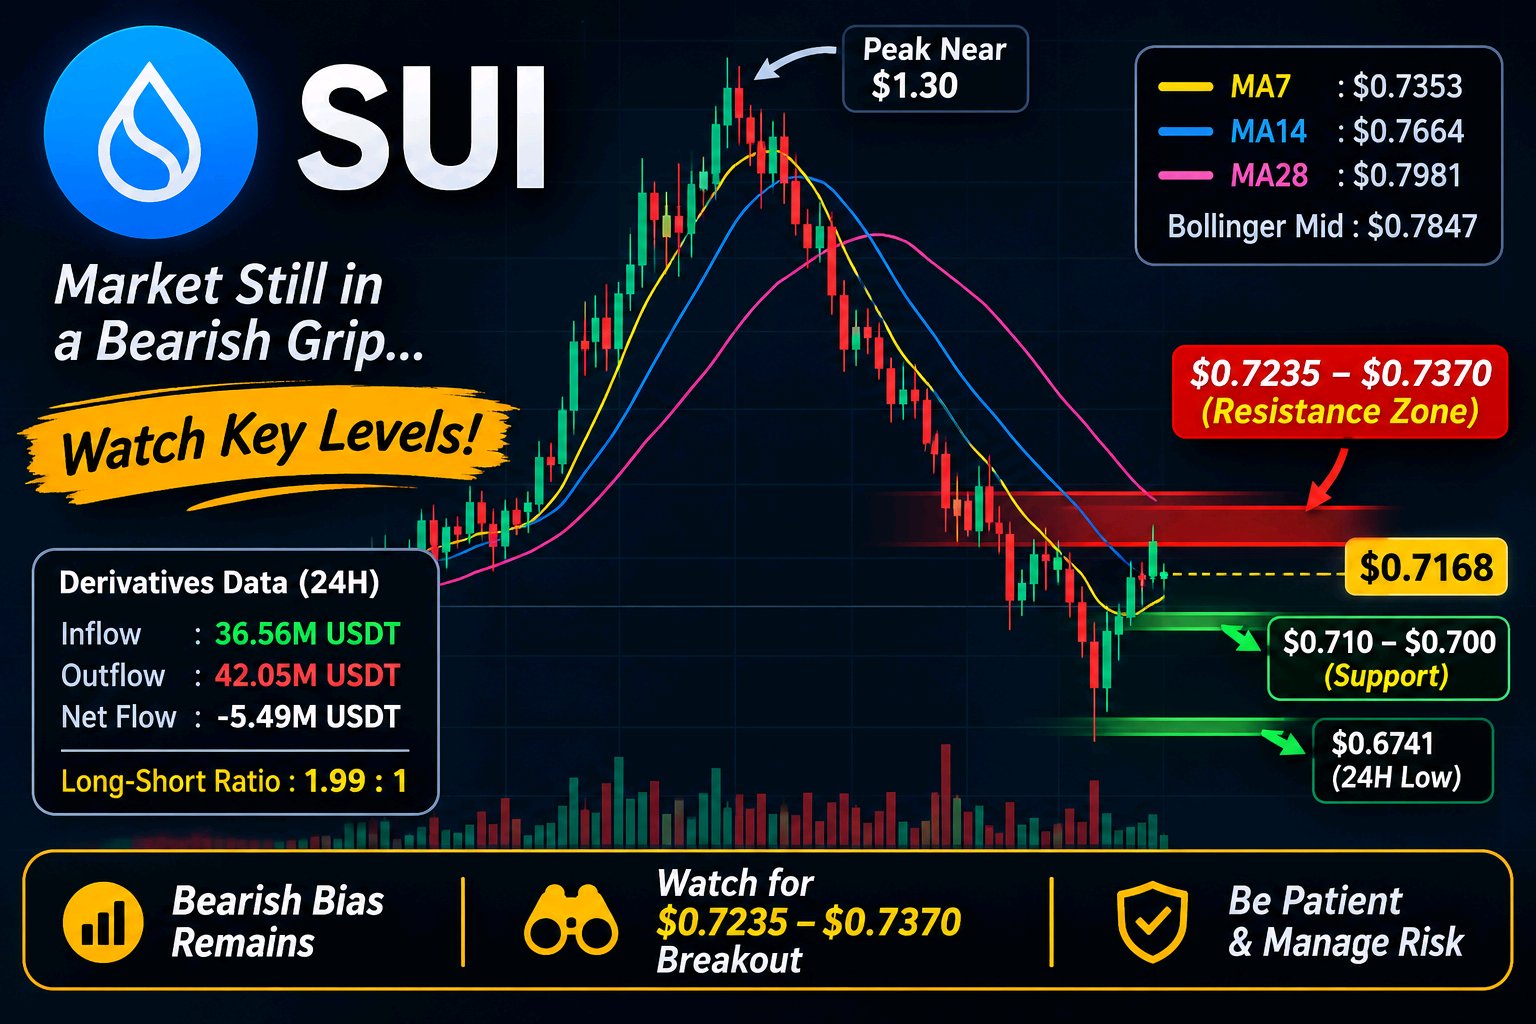
I've been watching $SUIUSDT closely, and what concerns me most right now is that the price is still struggling to build a strong recovery. Trading around $0.7168, SUI remains under selling pressure, and the overall market structure hasn't shown any convincing signs of a bullish reversal yet. There is a small recovery on the lower timeframe, but I don't think it's enough to change the bigger picture. Looking at the 6H chart, the downtrend is quite clear. SUI previously reached around $1.30, but since then, sellers have maintained control, pushing the price into a pattern of lower highs and lower lows. The moving averages support this bearish outlook. MA7 is around $0.7353, MA14 is near $0.7664, and MA28 stands at approximately $0.7981. With the current price trading below all three, buyers still have some work to do before the market can regain strength. Another level I'm paying attention to is the Bollinger middle band around $0.7847. If SUI manages to recover and hold above this area, it could be an early sign that buying momentum is improving. Until then, I would remain cautious. On the 15M chart, SUI has bounced after dropping toward $0.669. However, the recovery is facing resistance around $0.7235–$0.7370. This zone matters because it brings together the short-term moving averages and the upper part of the immediate recovery area. If buyers fail to reclaim it, the current bounce could simply develop into another lower high rather than the beginning of a new uptrend. The derivatives data adds another interesting perspective. The long-short ratio is approximately 1.99:1, showing that long positions are considerably higher than short positions. Meanwhile, 24H derivatives inflows are around 36.56M USDT, while outflows have reached 42.05M USDT, leaving a negative net flow of approximately 5.49M USDT. This suggests that more capital is leaving the derivatives market than entering it. With long positioning already elevated, another downward move could create additional liquidation pressure. For the downside, I'm watching $0.710–$0.700 first, followed by the previous 24H low at $0.6741. On the upside, $0.7386 is the first important level buyers need to reclaim. A stronger recovery would require sustained buying pressure rather than just a temporary bounce. Personally, I'm staying patient with SUI. I'm not treating this as an active long or short position. I want to see how price reacts around these levels before making a decision. Right now, protecting capital and waiting for confirmation makes more sense to me than rushing into a trade. #IMPACTbyTrade
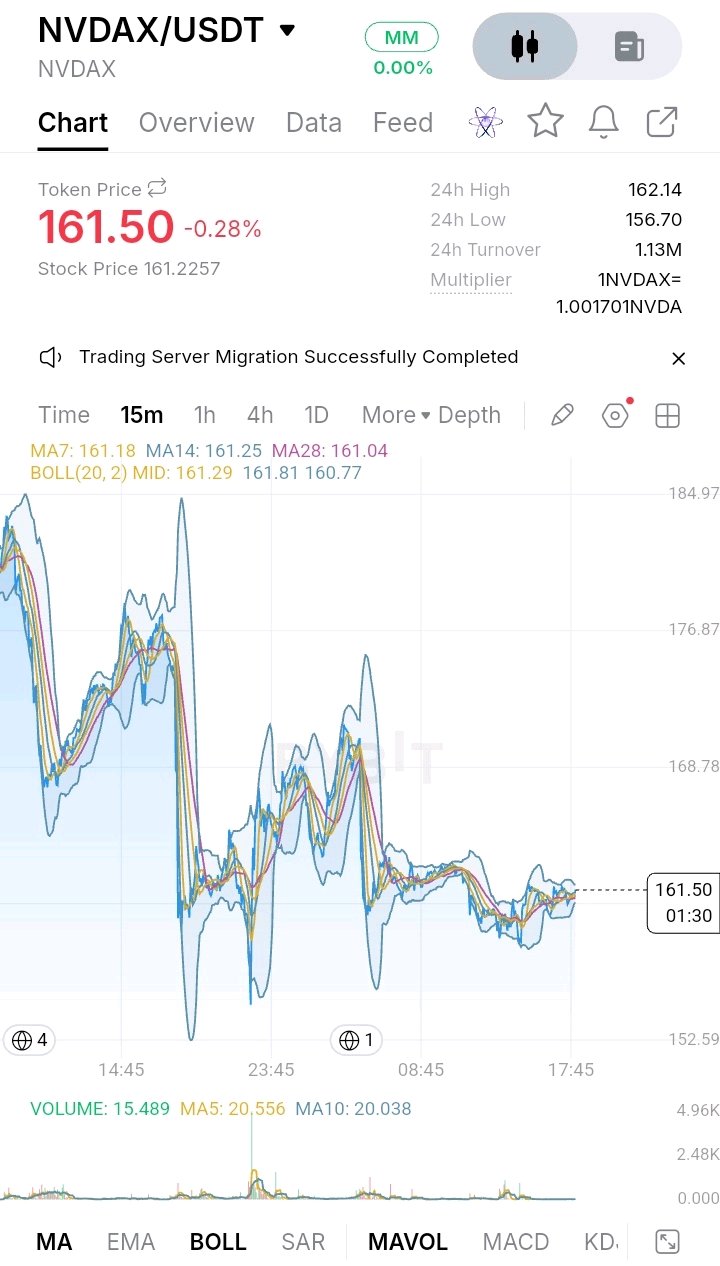
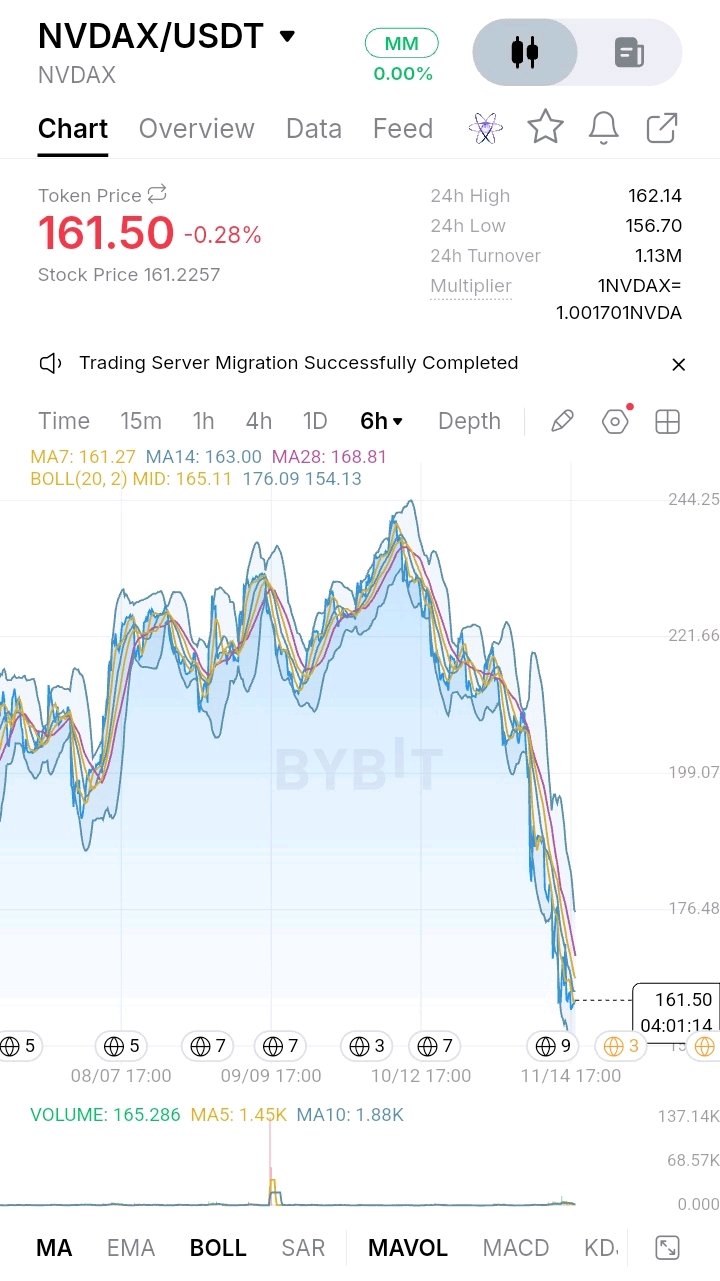
$NVDAXUSDT – 拋售壓力終於減弱了嗎?** 我一直密切關注 NVDAX,目前最引起我注意的是,在 6 小時線圖經歷急劇下跌後,價格走勢明顯放緩。此刻 NVDAX 交易價格約為 $161.50,下跌 0.28%。雖然市場出現了一些企穩跡象,但我認為現在斷定為真正的看漲反轉還為時尚早。 從大局來看,6 小時線的結構仍面臨壓力。價格已從前期高點大幅回落,目前在三條移動平均線下方運行:MA7 ($161.27)、MA14 ($163.00) 和 MA28 ($168.81)。布林通道中軌也位於 $165.11 附近,這是一個值得關注的重要關口。在多頭設法收復這些區域之前,對於預期持續的復甦,我會保持謹慎。 然而,在較短的 15 分鐘線週期上,情況看起來有趣一些。價格在 $161.50 附近橫盤整理,MA7 處於 $161.18,MA14 為 $161.25,MA28 為 $161.04。布林通道也相對收窄,中軌位於 $161.29。這表明波動性已經下降,市場可能正在醞釀更強勁的走勢。 就近期上行空間而言,$162.14 是我關注的第一個水平,隨後是 $163.00 以及 6 小時線圖上的 $165.11 布林通道中軌。若能有效突破這些水平,將改善復甦前景。下行方面,$160.77 是近期的短期支撐位,而 $156.70 仍是重要的 24 小時低點。若跌破該低點,可能會帶來新一輪拋售壓力,並看向 $154.13 的 6 小時線布林通道下軌。 我還注意到的一個細節是 Bybit 的資金流數據。顯示的五分鐘流入量為 1.36 NVDAX,其中包含 1.30 的大額交易和 0.06 的中額交易。這值得持續監測,但單一短時間區間不足以確認持續的累積趨勢。 24 小時高點為 $162.14,低點為 $156.70,成交額約為 113 萬 USDT。顯示的乘數為 1 NVDAX = 1.001701 NVDA,因此標的 NVIDIA 股票價格仍然具有相關性。 基於此圖表,我目前沒有持有倉位。現在,我想觀察多頭能否收復 $163 並在 $165 上方建立動能。在那之前,我會保持耐心。有時候,保護資本並等待明確的確認信號,遠比試圖抓住每一次反彈要明智得多。 **讓我們看看 NVDAX 能否將這次盤整轉化為真正的復甦,還是賣方還有後手。** #IMPACTbyTrade

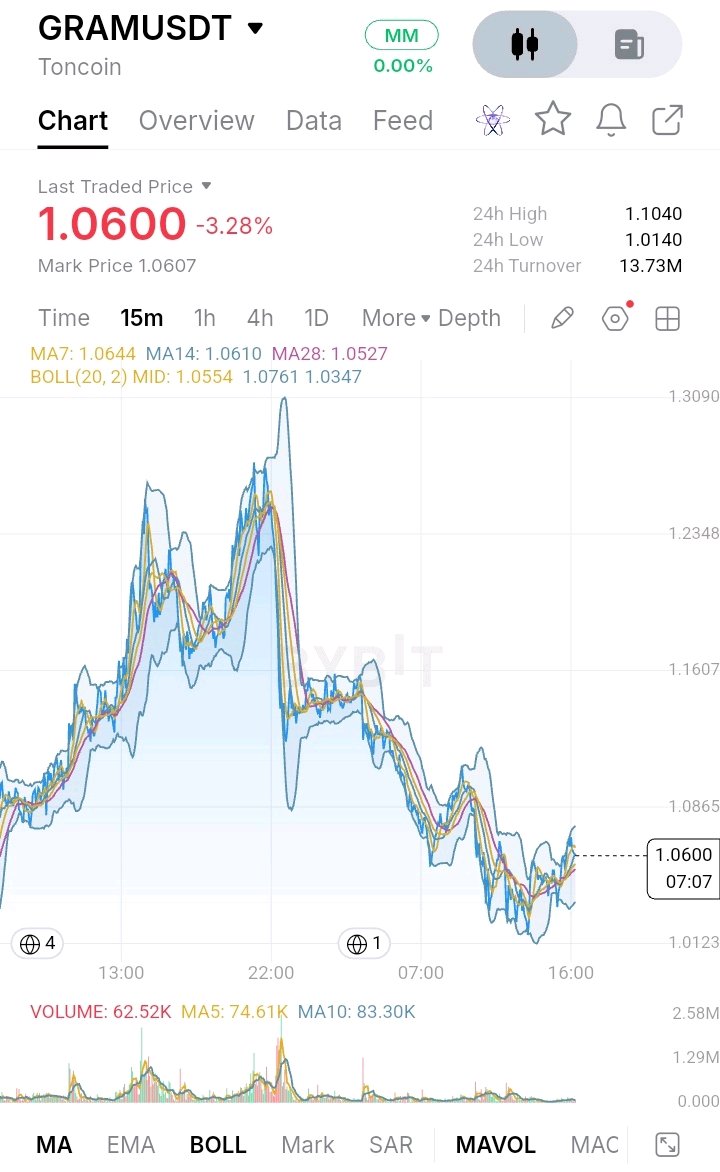
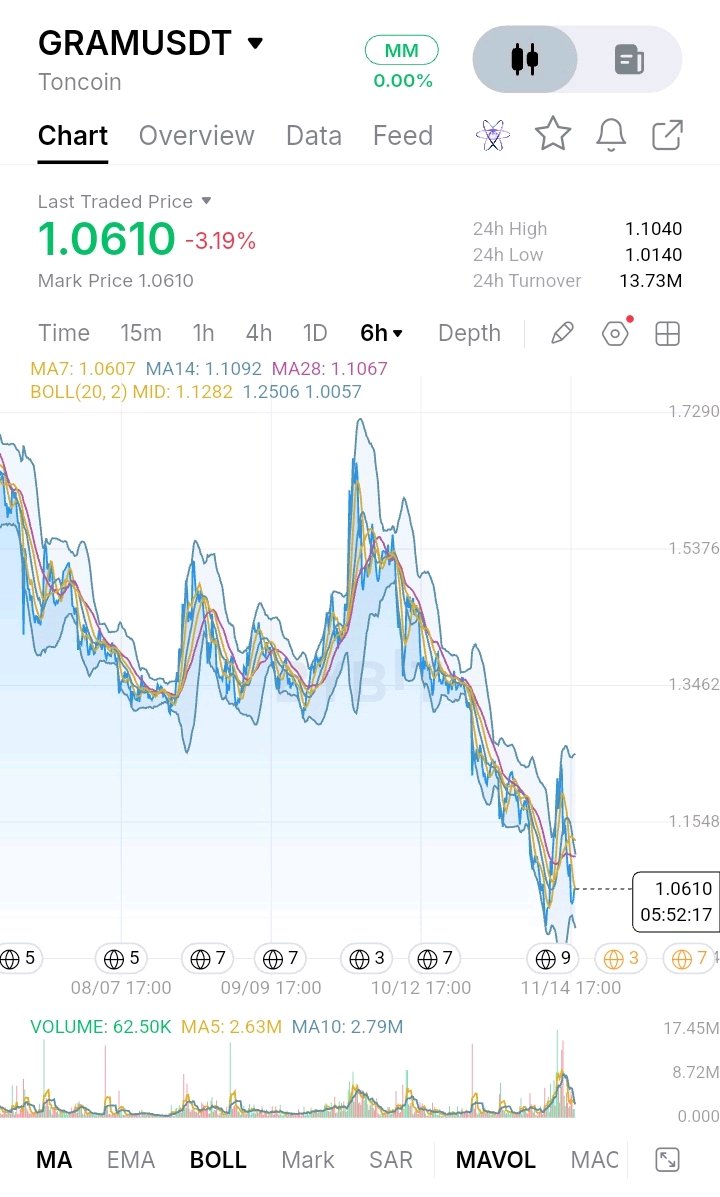
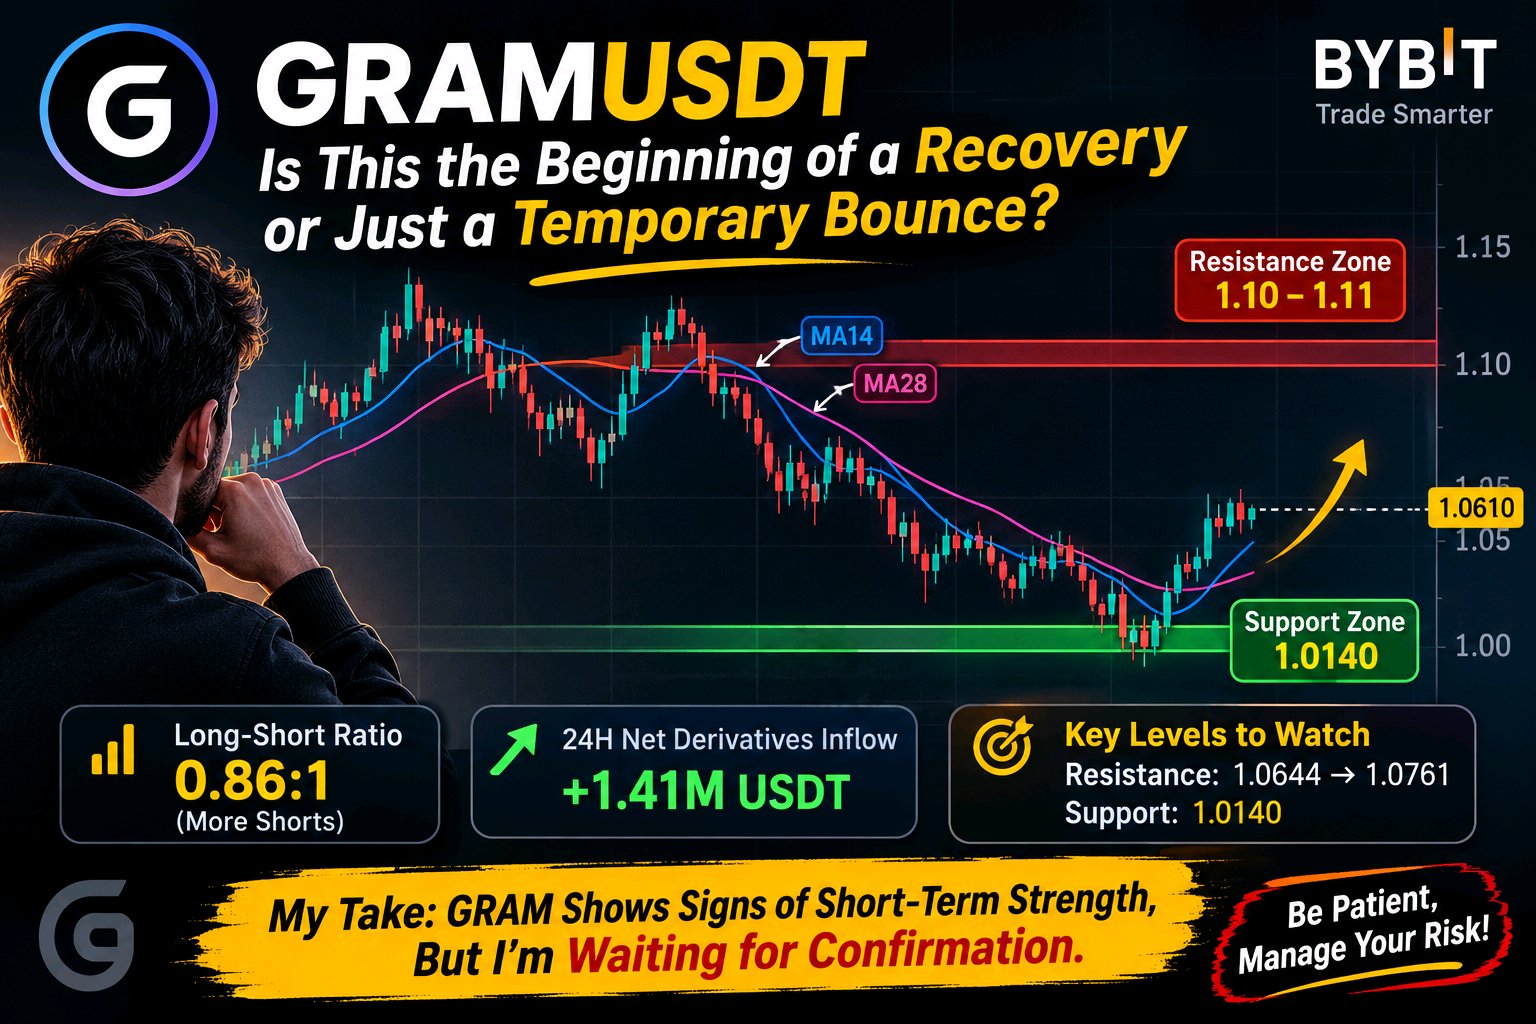
**$GRAMUSDT : Is This the Beginning of a Recovery or Just a Temporary Bounce?** I've been watching GRAM closely, and one thing that stands out to me is how price is trying to recover after a prolonged period of selling pressure. At the moment, GRAM is trading around 1.0610, showing some buying interest near the recent lows. However, I'm not ready to call this a trend reversal just yet. Looking at the 6H chart, the overall structure is still bearish. Price has been making lower highs and lower lows, which tells me sellers have maintained control for quite some time. Another important observation is that GRAM is still trading below MA14 (1.1092) and MA28 (1.1067). This makes the 1.10–1.11 area an important resistance zone to watch. If buyers manage to push price back above this region and hold it, the broader structure could start looking healthier. On the other hand, the recent low around 1.0140 deserves attention. Buyers have stepped in around this area, helping price recover toward 1.06. That's encouraging, but I would like to see whether this buying pressure can actually sustain itself rather than turning into another short-lived bounce. The 15M chart is showing some improvement. Price is trading near the short-term moving averages, with MA28 around 1.0527 and the Bollinger middle band near 1.0554. The immediate resistance is around 1.0644, followed by 1.0761. A convincing move above these levels could give the recovery more credibility. The derivatives data is also interesting. The long-short ratio stands at 0.86, while 24H net derivatives inflow is approximately 1.41M USDT. This suggests some positive capital movement, although it doesn't guarantee that the market is ready to reverse. Personally, I'm staying patient here. I don't have a confirmed active position based on this setup. For me, the priority is seeing GRAM hold its recent support and reclaim resistance with convincing price action. If that fails, another move toward the recent lows remains possible. **My takeaway:** GRAM is showing signs of short-term strength, but the bigger trend is still under pressure. I'd rather wait for confirmation than rush into a trade. Protecting capital matters more than catching every bounce. *This is my personal market analysis, not financial advice. Always manage your risk.* #IMPACTbyTrade
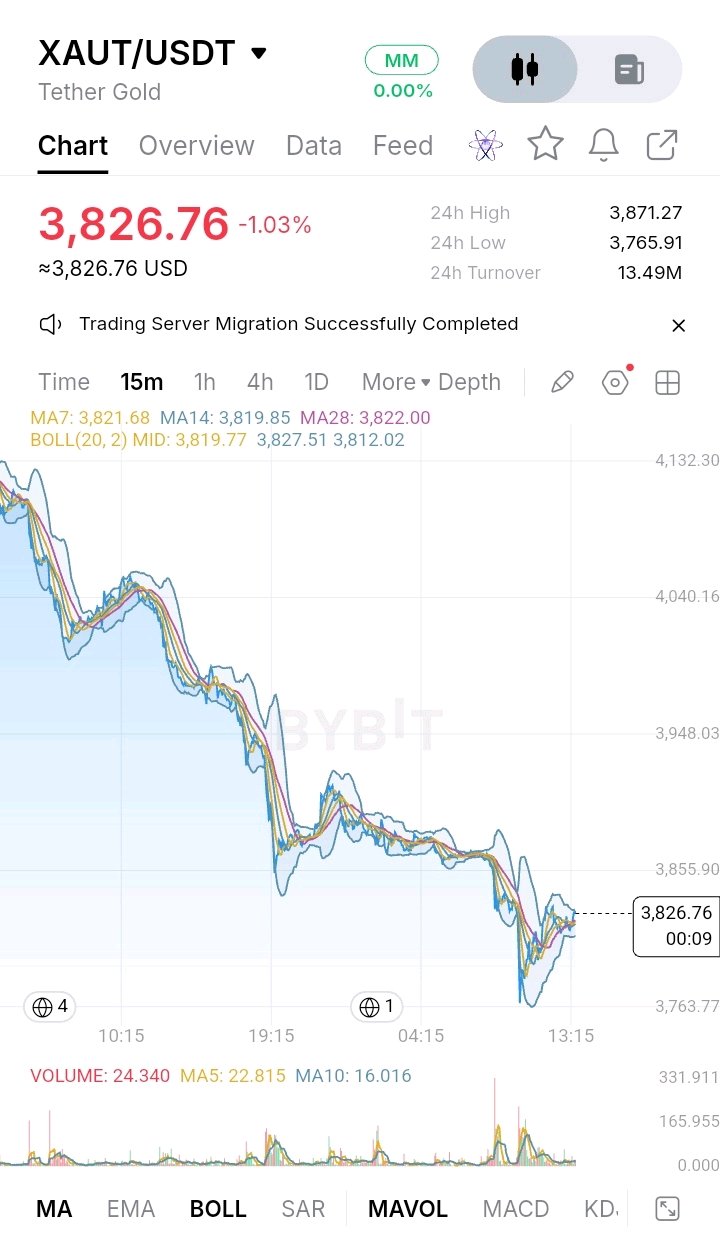
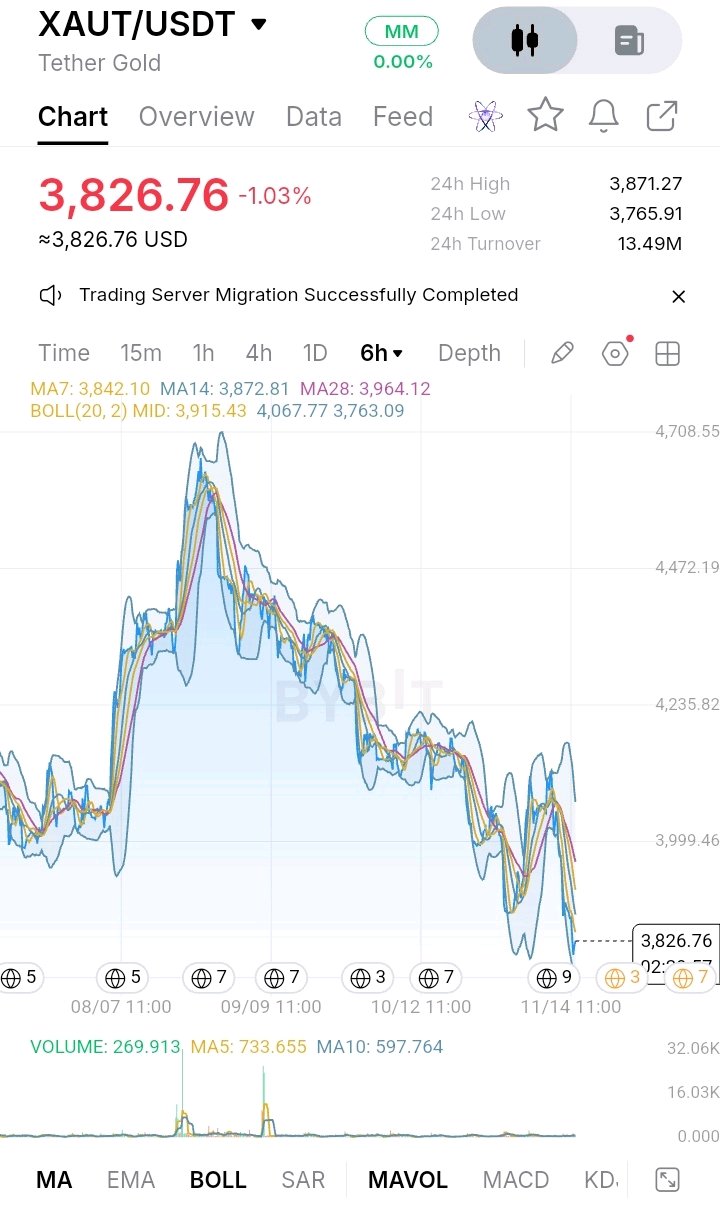
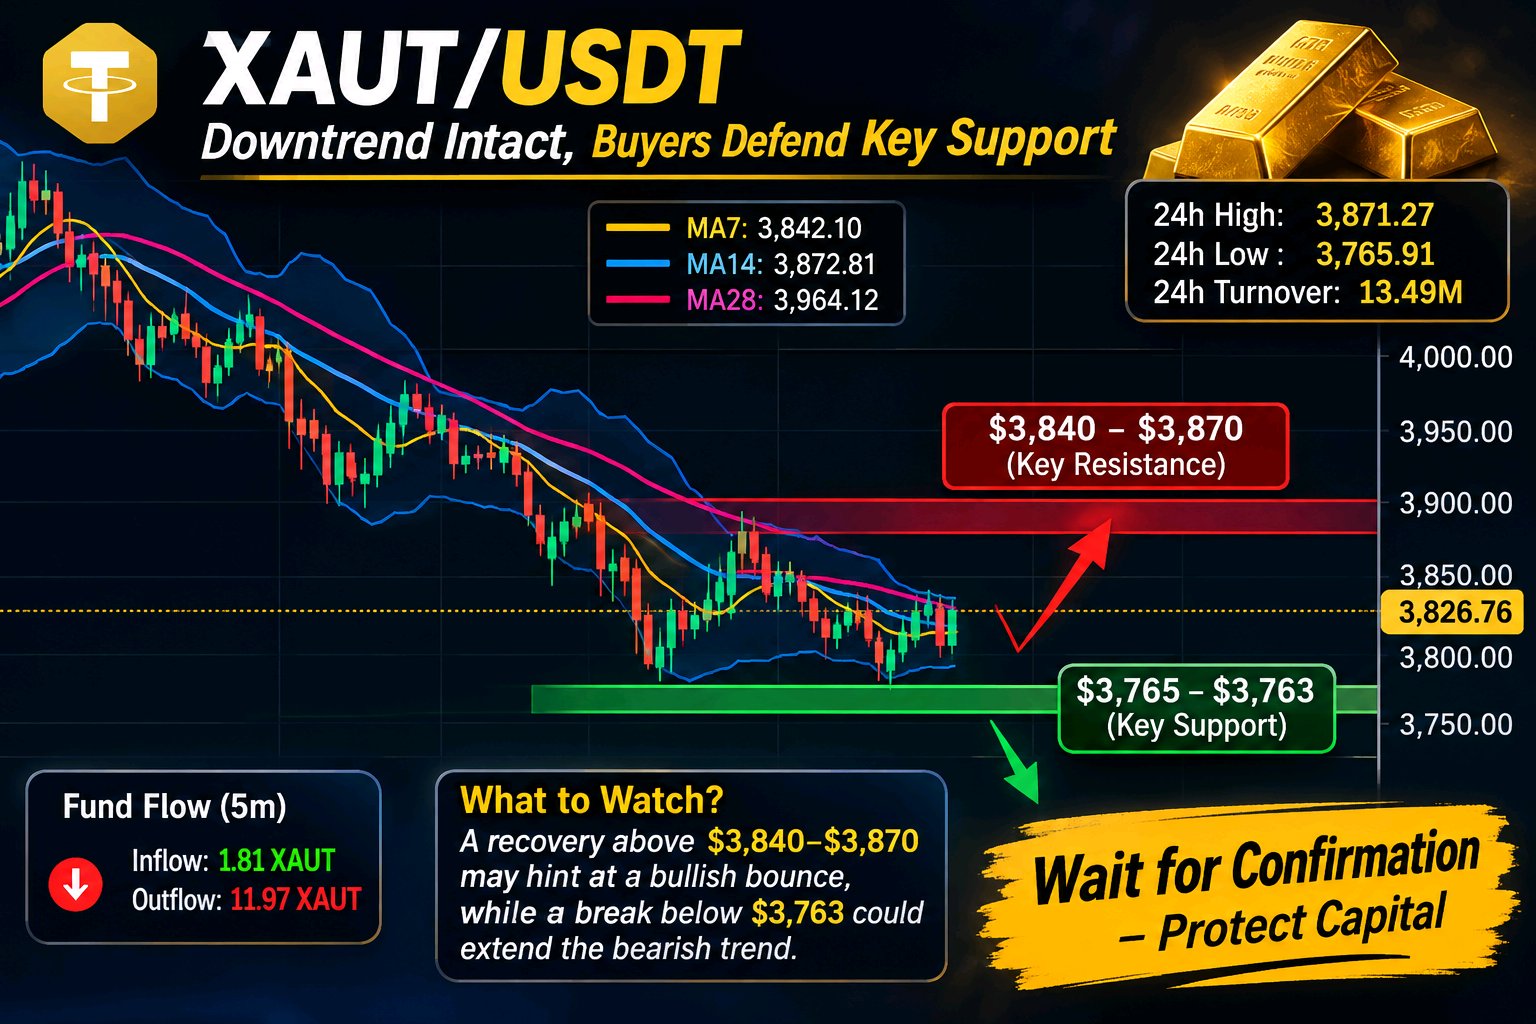
$XAUTUSDT 下跌趨勢依然佔據主導,但買方正試圖守住下方支撐區。 觀察 XAUT/USDT,我認為市場在經歷長時間下跌後,仍難以建立實質性的反彈。目前價格在 3,826.76 美元左右,儘管 15 分鐘線顯示近期低點出現小幅回升,但我並不認為這是趨勢真正反轉的開始。 最令我擔憂的是更寬廣的 6 小時結構。價格持續形成更低的高點與更低的低點,且移動平均線仍位於當前市價上方。MA7 約在 3,842 美元,MA14 近 3,872 美元,而 MA28 則在 3,964 美元左右。這種排列反映的是持續的拋售壓力,而非確定的看漲復甦。 我關注的一個重要區域是 3,765 至 3,763 美元區間。該區域之所以重要,是因為它同時包含了近期 24 小時低點 3,765.91 美元以及 6 小時布林通道下軌 3,763.09 美元附近。買方曾試圖防守此區域並引發了短期反彈。然而,暫時的支撐防守並不代表賣方已失去控制權。 在上行方面,3,840 至 3,870 美元區間值得關注。短期 MA7 和 24 小時高點皆位於此處。若價格能回升至該區間上方並企穩,我們或許能看到動能轉強。不過,先前在 3,855 美元附近的支撐在跌破後可能已轉為阻力,使得任何復甦都變得更具挑戰性。 資金流向數據也值得留意。在顯示的五分鐘週期內,流出量達到 11.97 XAUT,而流入量僅為 1.81 XAUT。這種不平衡顯示拋售壓力依然沉重,儘管單一的短期數據無法判定下一個大趨勢的方向。 目前,我將任何看漲設置視為理論討論,而非實際操作。在考慮做多機會之前,我傾向於等待價格持續回升至附近的阻力位上方。反之,若確認跌破 3,763 美元,可能會加劇看跌的延續情境。 我的結論很簡單:XAUT 顯示出短期止穩的跡象,但大趨勢仍偏向看跌。比起過早預測反轉,我寧願等待確認訊號。對我而言,保護資本和尊重市場結構比捕捉每一次短期反彈更為重要。 #IMPACTbyTrade
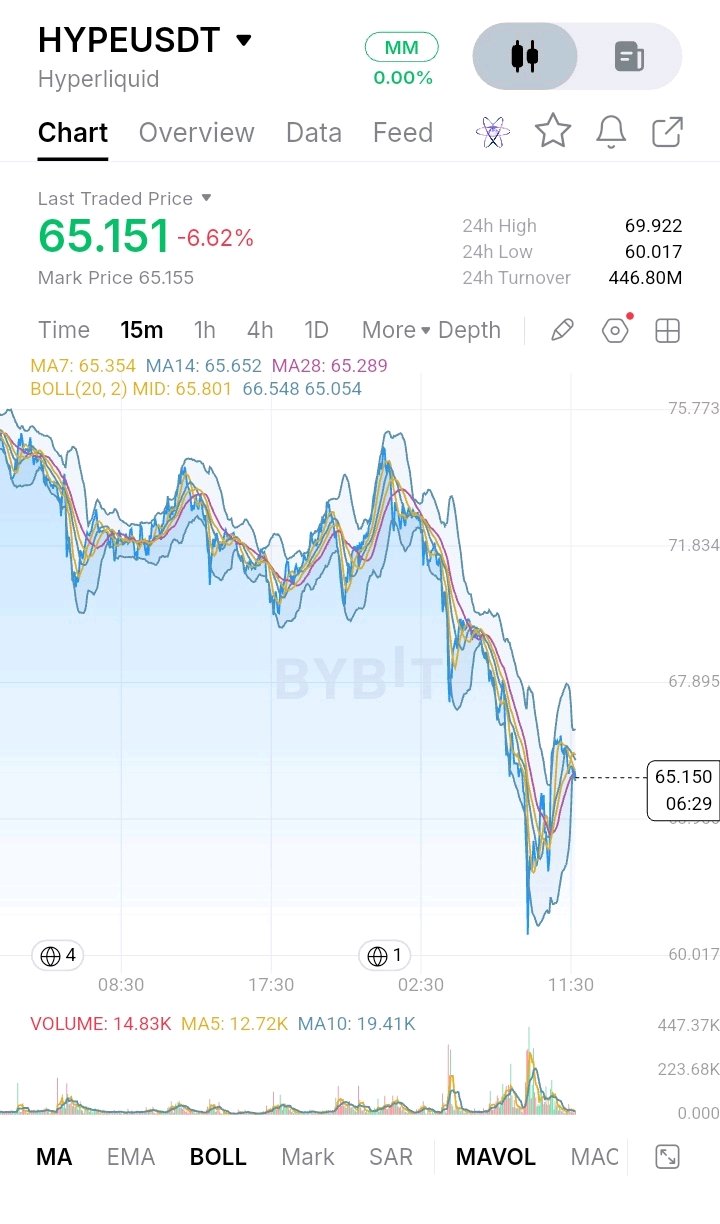
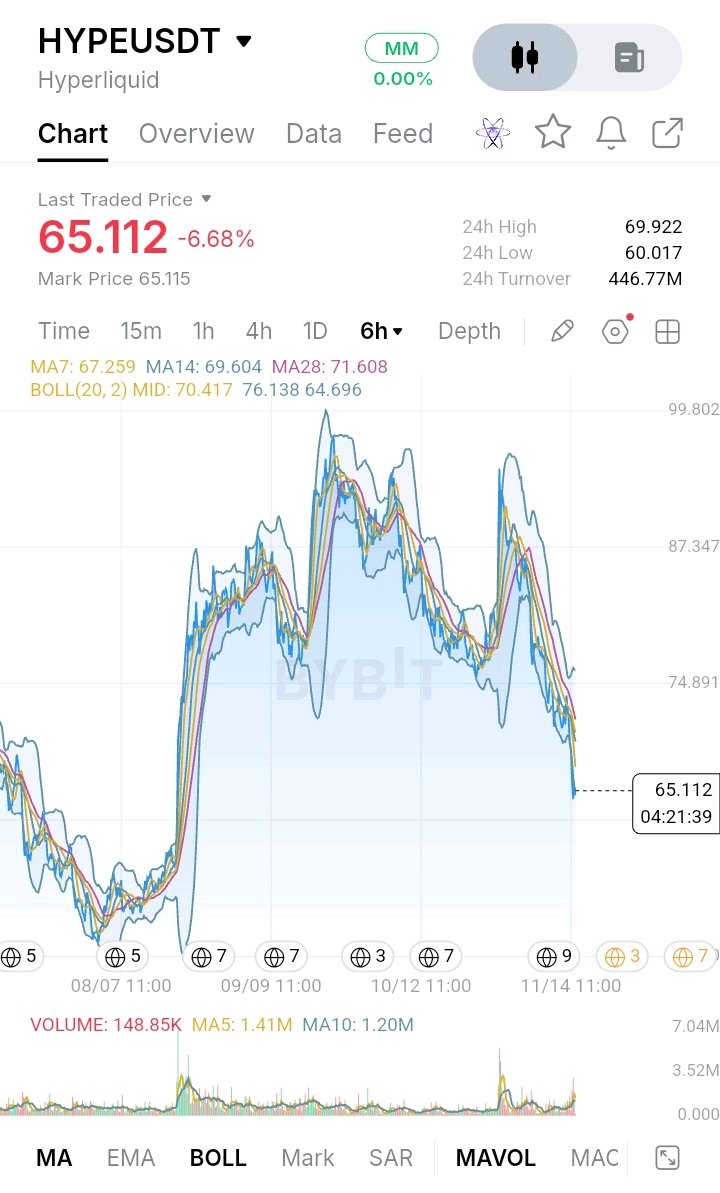
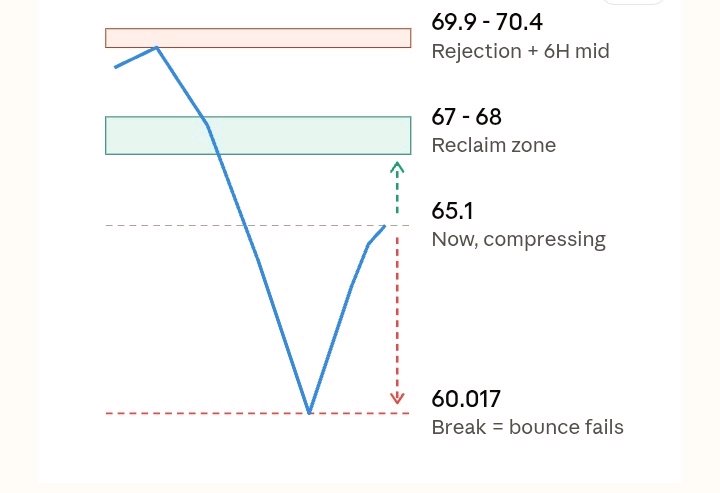
$HYPEUSDT 今天遭遇重挫,我對這次走勢持謹慎態度,不會急於斷定這就是底部。價格目前在 65.1 左右,在 69.9 附近遇阻後,日內下跌約 6.6%。24 小時最低點 60.017 出現了一根急劇的長下影線,而此處的反彈是買方仍願意捍衛該區域的第一個明顯跡象。 從 6 小時圖來看,整體結構仍然是建設性的。HYPE 從 8 月初的底部反彈至近 99.8,留下了很大的消化空間。但 90 多美元處出現的低點走低,以及隨後持續的下滑,顯示動能已經冷卻。價格目前低於 MA7、MA14 和 MA28(分別為 67.2、69.6、71.6),且 70.4 附近的布林通道中軌已轉變為上方阻力。隨著這些均線疊加在價格上方,我預計反彈至 67-70 區域會遇到拋壓,難以直接突破。 15 分鐘圖顯示,這次下跌是從 75 區域到 60.0 的一波長而猛烈的走勢,底部伴隨著成交量激增。這看起來更像是洗盤(flush)而非緩慢的流血。此後,價格回升至 65 左右,並在布林通道收窄的情況下圍繞短期均線(65.3-65.6)震盪。市場目前尚未決定方向,一切都還沒定論。 倉位數據增添了一些細微差別。1.73:1 的多空比顯示,儘管價格下跌,交易者仍傾向於做多。這可能會推高價格,但也意味著如果反彈失敗,可能會引發更多多頭清算。淨衍生品資金流為負值,約為 3350 萬 USDT,流出大於流入,顯示資金正在離場,而不是湧入抄底。 我目前沒有任何倉位,也不會強行去編造圖表不支持的策略。理論上,看漲的情況需要重回 67-68 並站穩,下一個考驗則是 69.9 的高點。看跌的情況則是明確跌破 60.0,這將使本次反彈失效並暴露更低的水平。無論哪種情況,止損都必須設在這些極端位置之外,且倉位大小必須足夠小,以應對劇烈的影線波動。 目前,我正在觀察價格在 67 附近的表現,以及下一波推升時成交量是萎縮還是放大。如果買方不能儘快收復該區域,我寧願保持耐心,也不願去接下墜的刀子。這是我個人的解讀,並非投資建議,請自行管理風險。 #IMPACTbyTrade
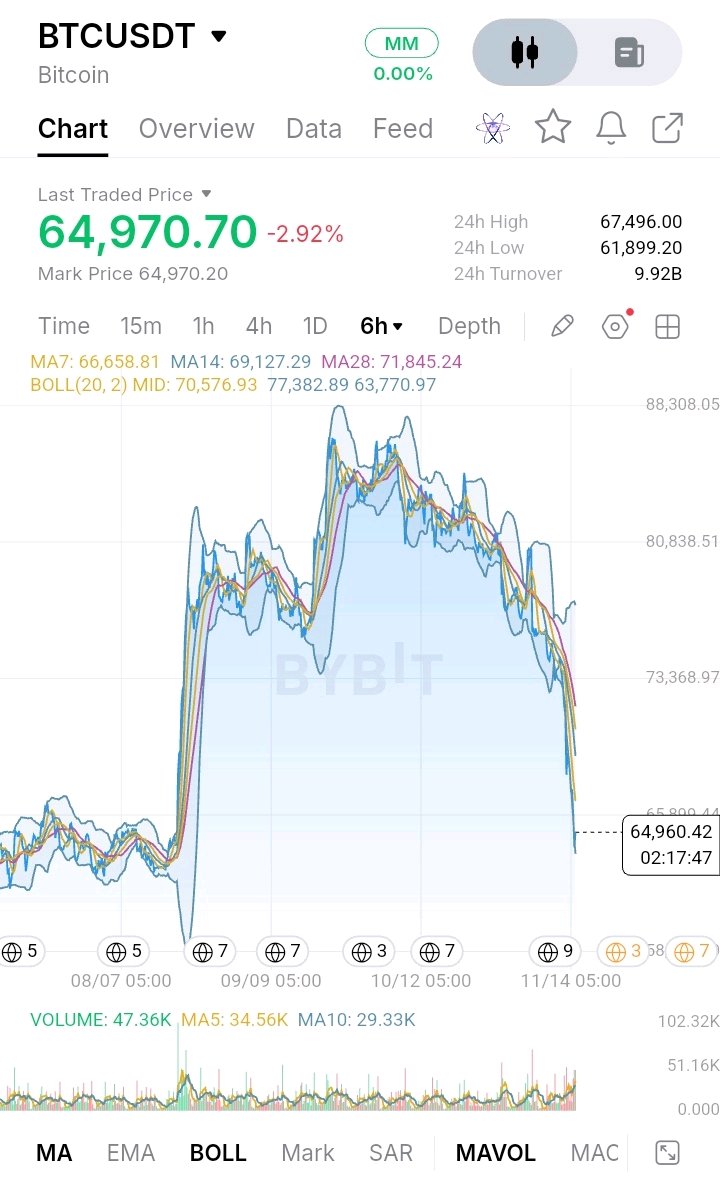
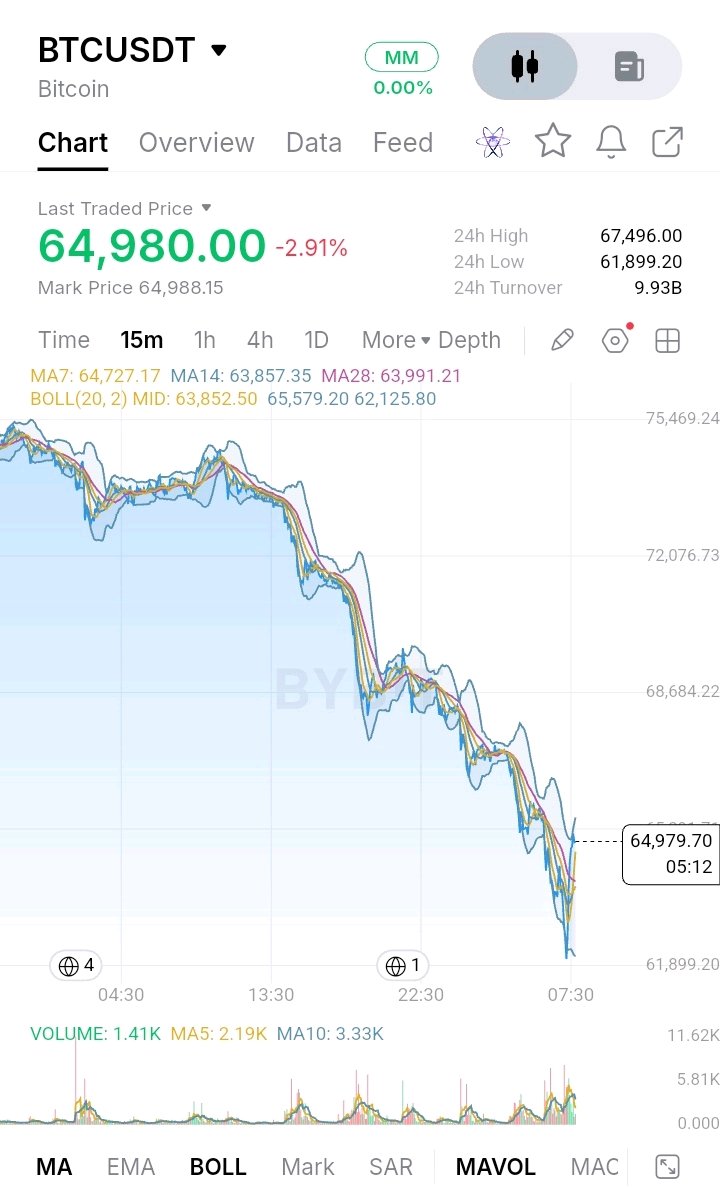
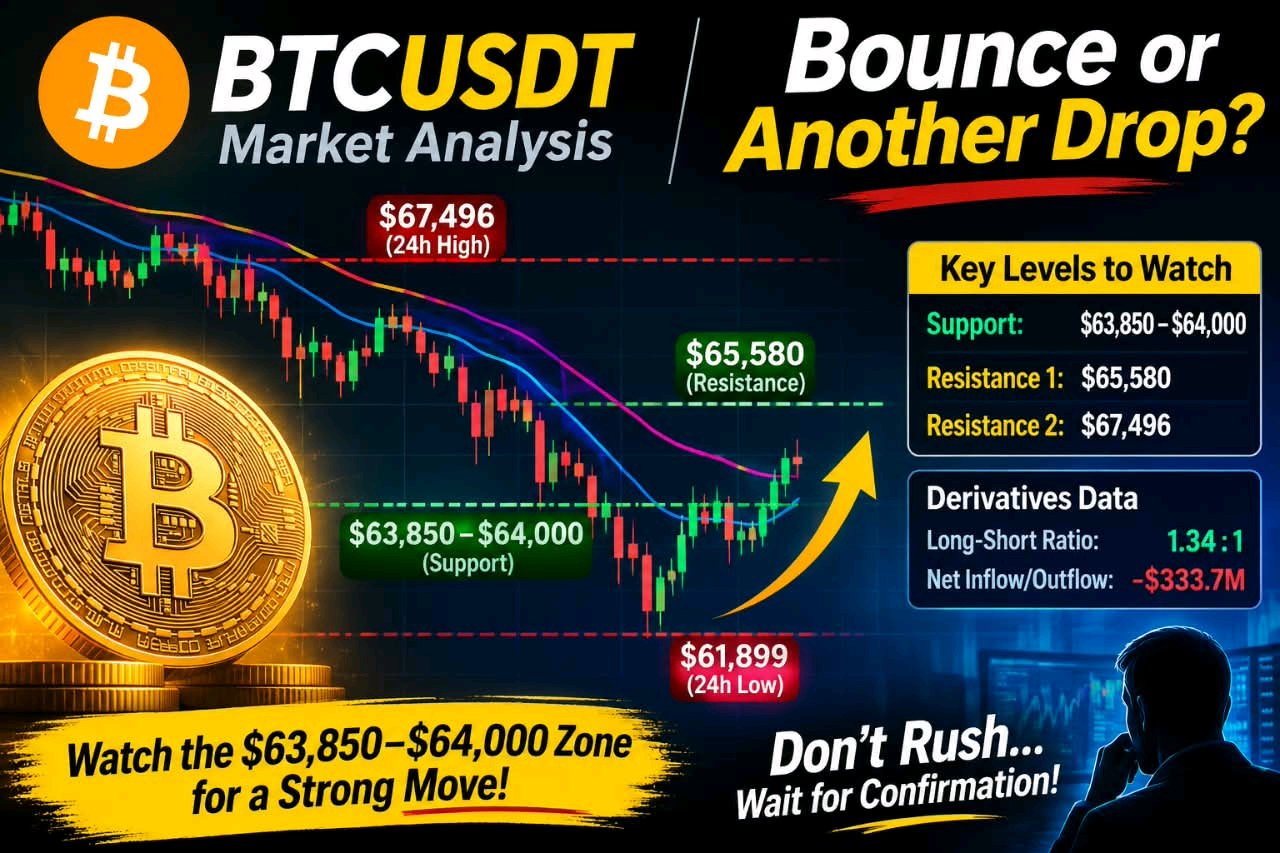
📉 比特幣正試圖反彈,但這究竟是復甦的開始,還是拋售潮中的短暫停歇? 觀察 $BTCUSDT 圖表,我看到市場雖然遭受重創,但已開始出現短期買盤興趣的跡象。比特幣目前的交易價格約為 64,970 美元,過去 24 小時內下跌了約 2.92%。價格近期曾跌至 61,899 美元,隨後反彈回 65,000 美元附近。這一反彈值得關注,但我還不會稱其為趨勢逆轉。 從 6 小時圖來看,整體結構依然偏空。BTC 已從 70,000 至 73,000 美元的區間急劇下跌,跌破了幾個先前支撐市場的重要價格區域。移動平均線也反映了同樣的情況:MA7 約在 66,659 美元,MA14 約在 69,127 美元,MA28 約在 71,845 美元。比特幣目前的交易價格低於這三條均線,而布林通道中軌則位於 70,577 美元附近。對我來說,這意味著市場結構要恢復健康,整體復甦之路還有很長一段路要走。 🔎 以下是我正在關注的短期點位: 支撐位:63,850 – 64,000 美元 這是我想看到買方防守的第一個區域,它與 15 分鐘圖上的短期移動平均線一致。如果 BTC 重新測試該區域並站穩,買方可能會獲得再次推高價格的機會。然而,如果 15 分鐘 K 線收盤明確跌破 63,850 美元,將削弱復甦預期,並使近期 61,899 美元的低點再次成為焦點。 第一阻力位:65,580 美元 此點位標示著 15 分鐘圖上的布林通道上軌。如果價格能持續站上該位置,隨後進行成功的重測,將顯示短期動能正在改善。如果 BTC 在此處受阻並回落至 64,000 美元以下,我會對此次反彈的強度持更加謹慎的態度。 下一個阻力位:67,496 美元 這是報道的 24 小時高點。若能收復此點位,將提供更強的復甦證據,儘管比特幣仍需克服更高的阻力位,才能挑戰更廣泛的下跌趨勢。 📊 衍生品數據同樣值得關注。多空比約為 1.34:1,多頭佔優。與此同時,衍生品資金流入約為 48.2 億美元,流出約為 51.5 億美元,淨流出約 3.337 億美元。這些數據雖無法確認下一步走勢,但也凸顯了我為何不會僅憑這次反彈就貿然行動的原因。 我的策略:我選擇觀察,而不是倉促進場。63,850 – 64,000 美元區間是買方眼前的考驗,而 65,580 美元則是多頭需要克服的第一道障礙。任何潛在的進場都需要確認訊號、明確的止損設定,以及合理的盈虧比。 比特幣可能正在尋找暫時的支撐,但真正的考驗在於買方能否維持復甦力道。在那之前,我會對兩種情況都保持開放態度,讓價格走勢指引我的下一個決定。 #IMPACTbyTrade
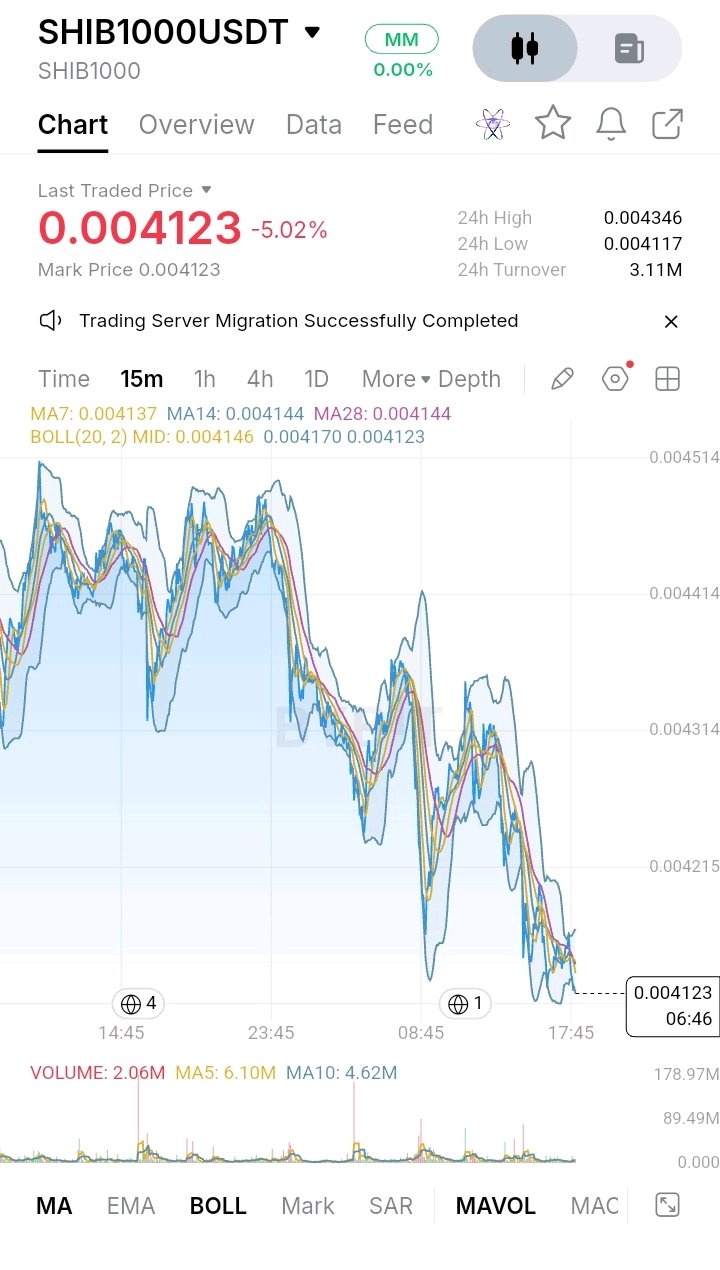
$SHIBUSDT 沒有獨立的區塊鏈、儲備金或中央運營商來擔保其價格;它依賴於市場需求和託管它的網絡。它的核心選擇是不構建單獨的 Layer 1:SHIB 是一種以太坊代幣,而 Shibarium 增加了一條低成本的 Layer 2 路徑。這避免了運行競爭性的基礎鏈,但安全性繼承自外部基礎設施。獨立驗證以太坊需要高性能的硬件、存儲、帶寬和技術能力;大多數持有者轉而信任錢包、交易所、RPC 提供商和橋接器。與追求速度的高吞吐量鏈不同,SHIB 依賴以太坊已建立的結算機制。哪種風險更讓您擔心:依賴性還是碎片化? #IMPACTbyTrade

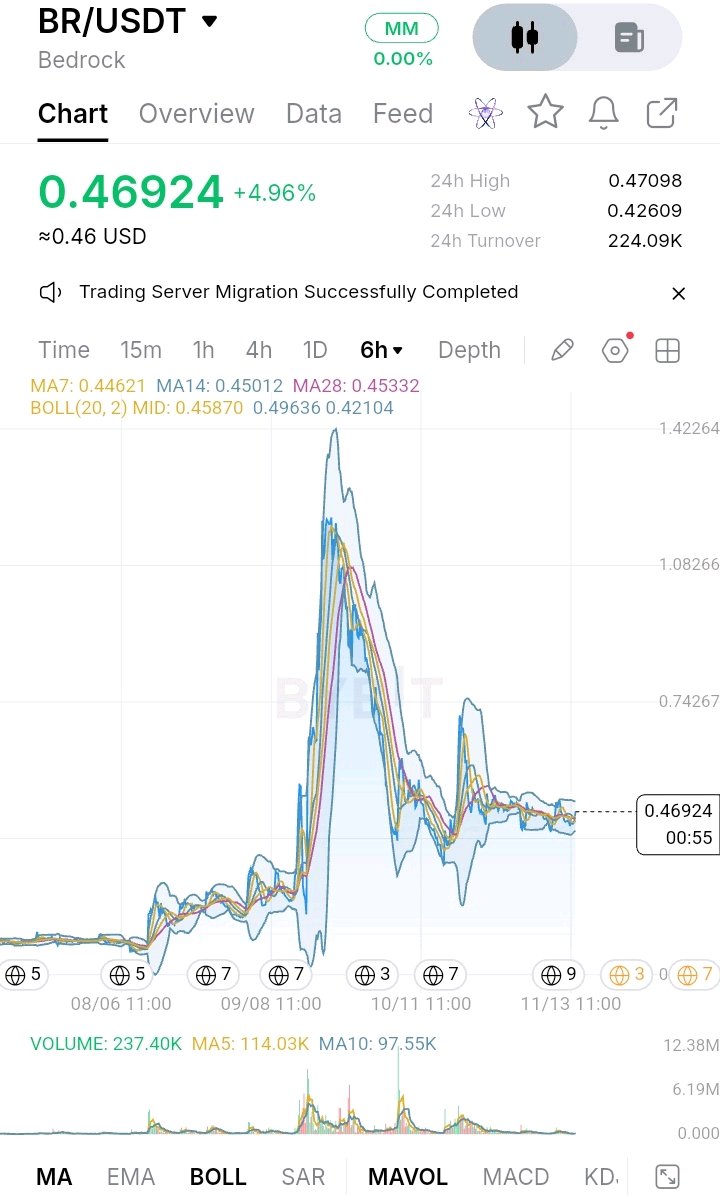
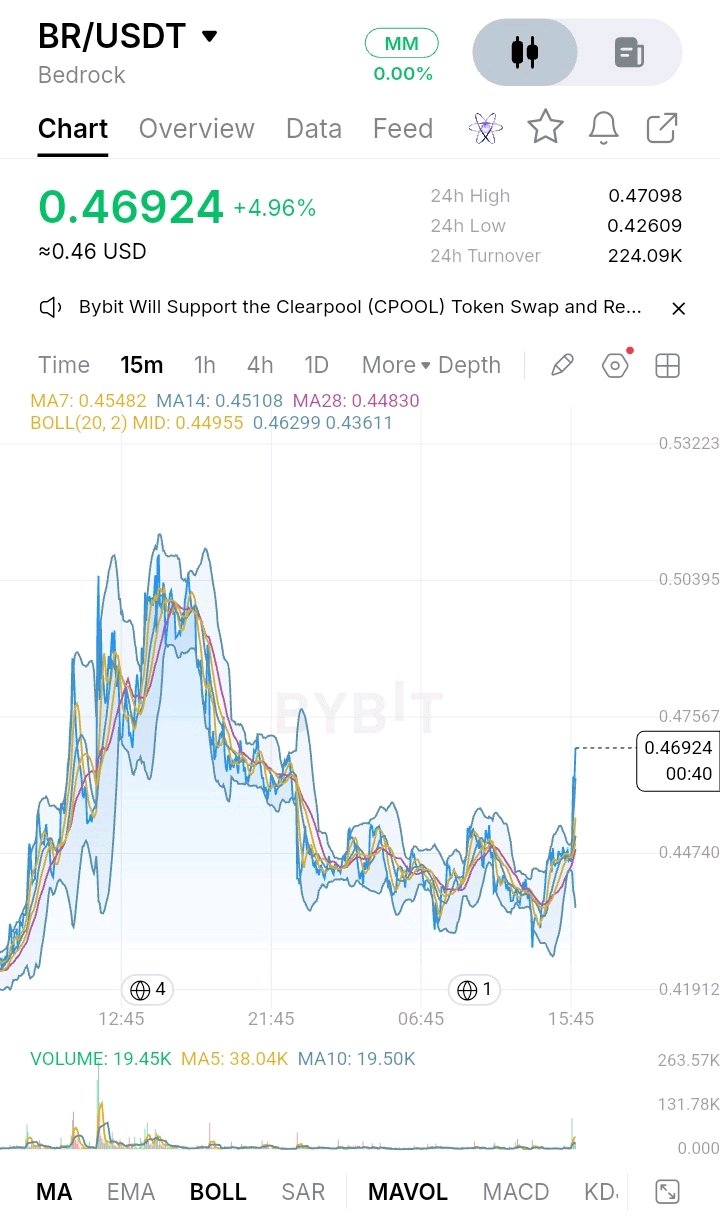
$BRUSDT 本身沒有鏈,沒有共識機制,也沒有驗證者集來進行審計。它依賴的是借來的安全性:底層依賴以太坊和其他網路,上層則依賴 Bedrock 的合約、營運商和託管合作夥伴。 這種設計選擇是為了在不建立新基礎層的情況下,讓閒置的 BTC 和 ETH 產生收益。其代價是層層疊加的信任風險。驗證鏈本身並不能驗證協議;你必須閱讀合約、審計報告和託管協議,而大多數用戶僅僅是信任儀表板顯示的資訊。 以太坊式的基礎層將風險推向了共識機制。再質押層則將風險推向了中介機構。 你更擔心哪一個:基礎層的故障,還是其上層架構的故障? #IMPACTbyTrade

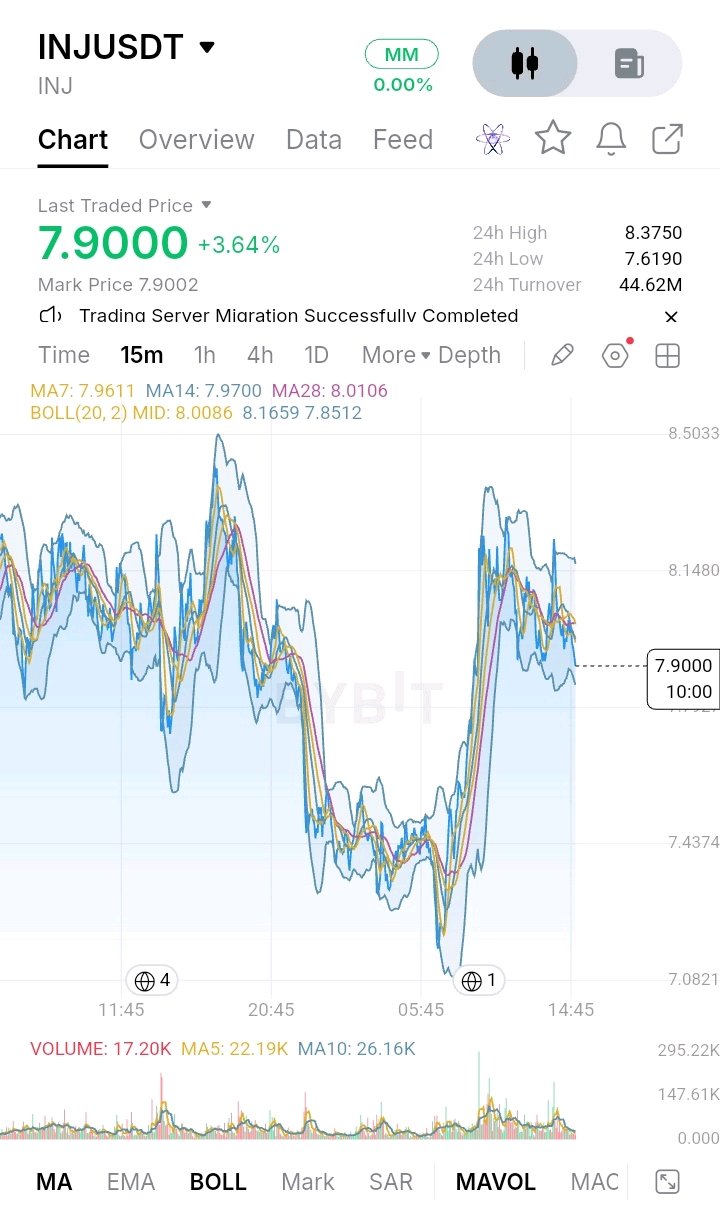
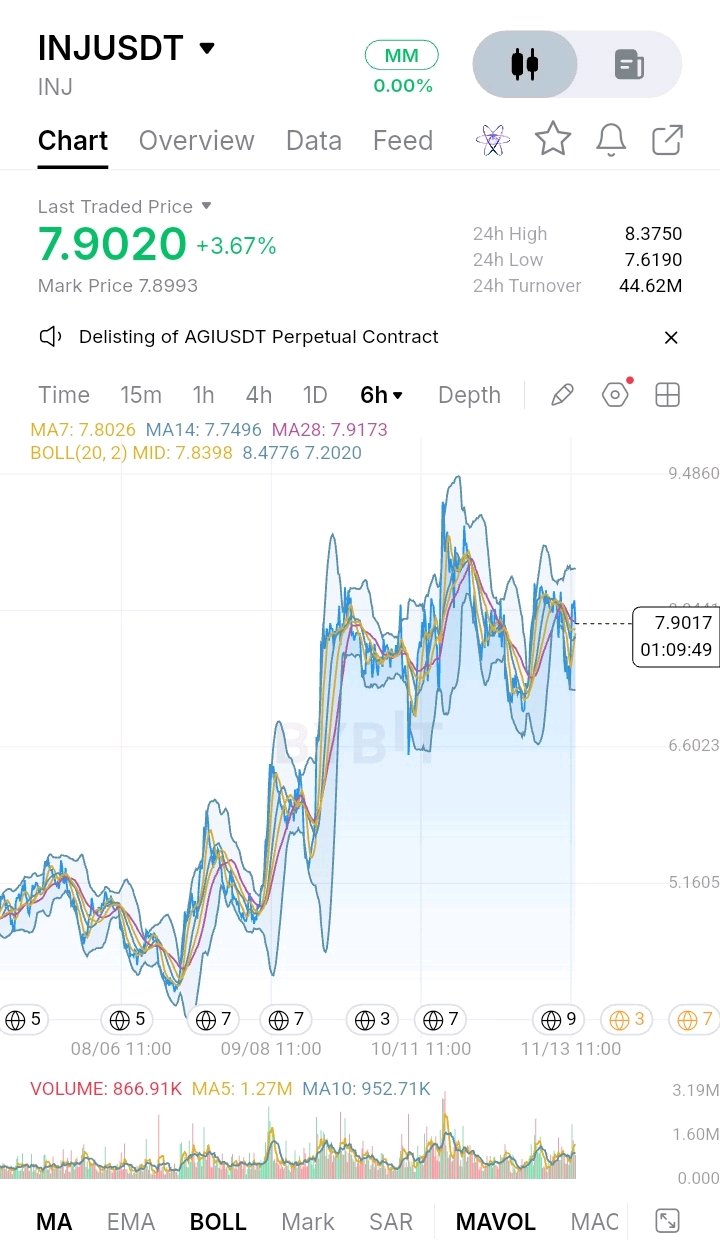
$INJUSDT 沒有發行方、沒有儲備金,也沒有審計機構為其市場背書。它依賴於一個基於 Cosmos 的鏈,由一組小規模的權益證明驗證節點達成共識。 Injective 選擇了速度:次秒級的最終確認和鏈上訂單簿。代價是有限的驗證節點數量、專業級的硬體要求,以及極少數人能自行驗證該鏈。大多數用戶透過 RPC 提供商、跨鏈橋和前端介面讀取狀態,因此信任轉移到了第三方。 以太坊則採取了截然相反的路徑:以犧牲最終確認速度為代價,換取更龐大的驗證節點基礎和更輕量級的節點要求。 你更擔心哪種風險:快速但中心化,還是去中心化但緩慢? #IMPACTbyTrade

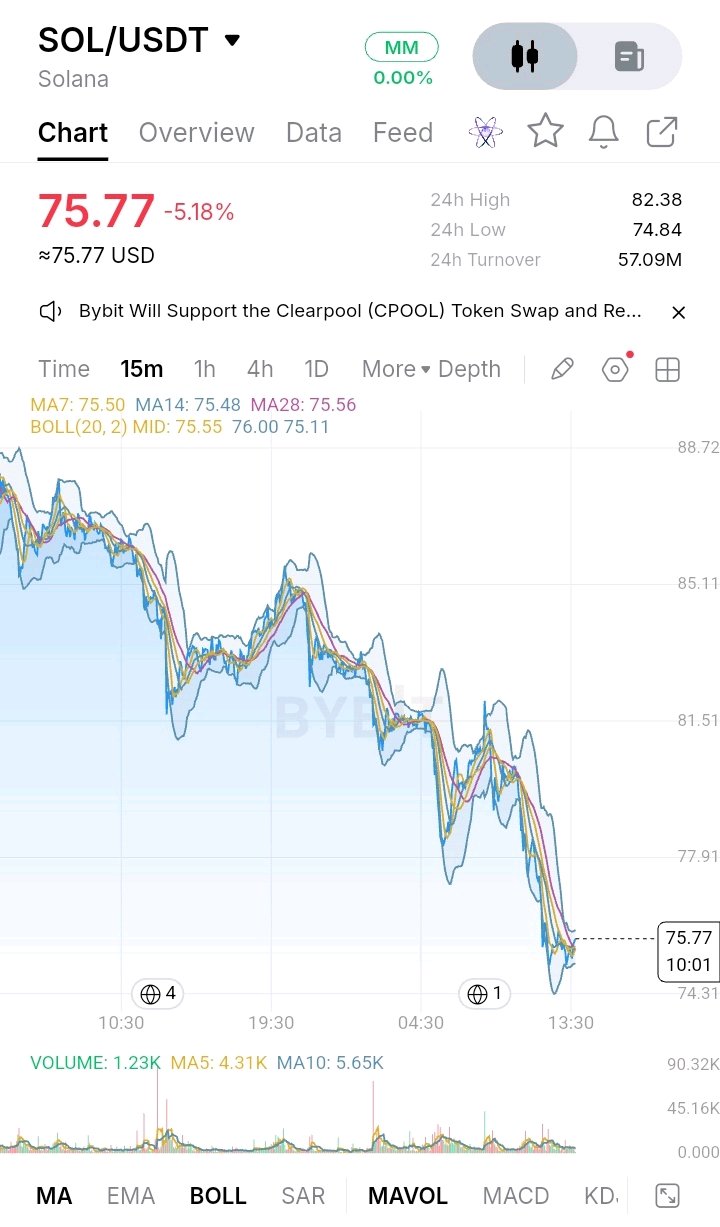
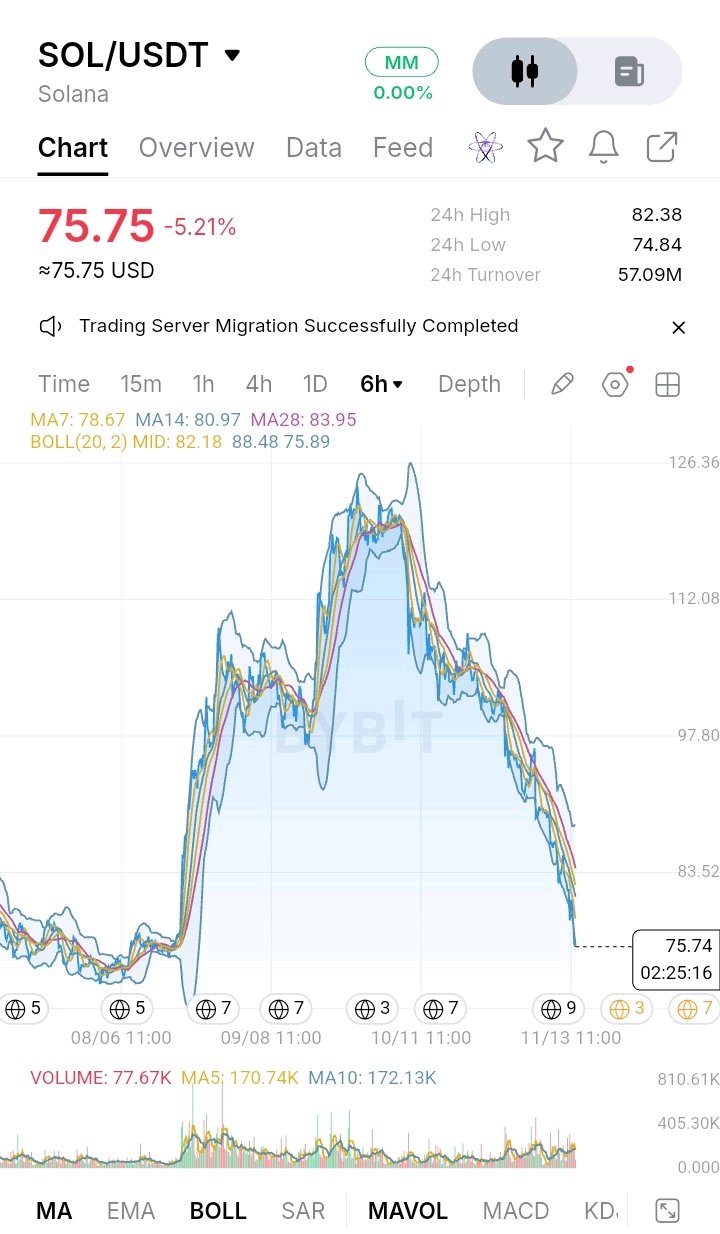
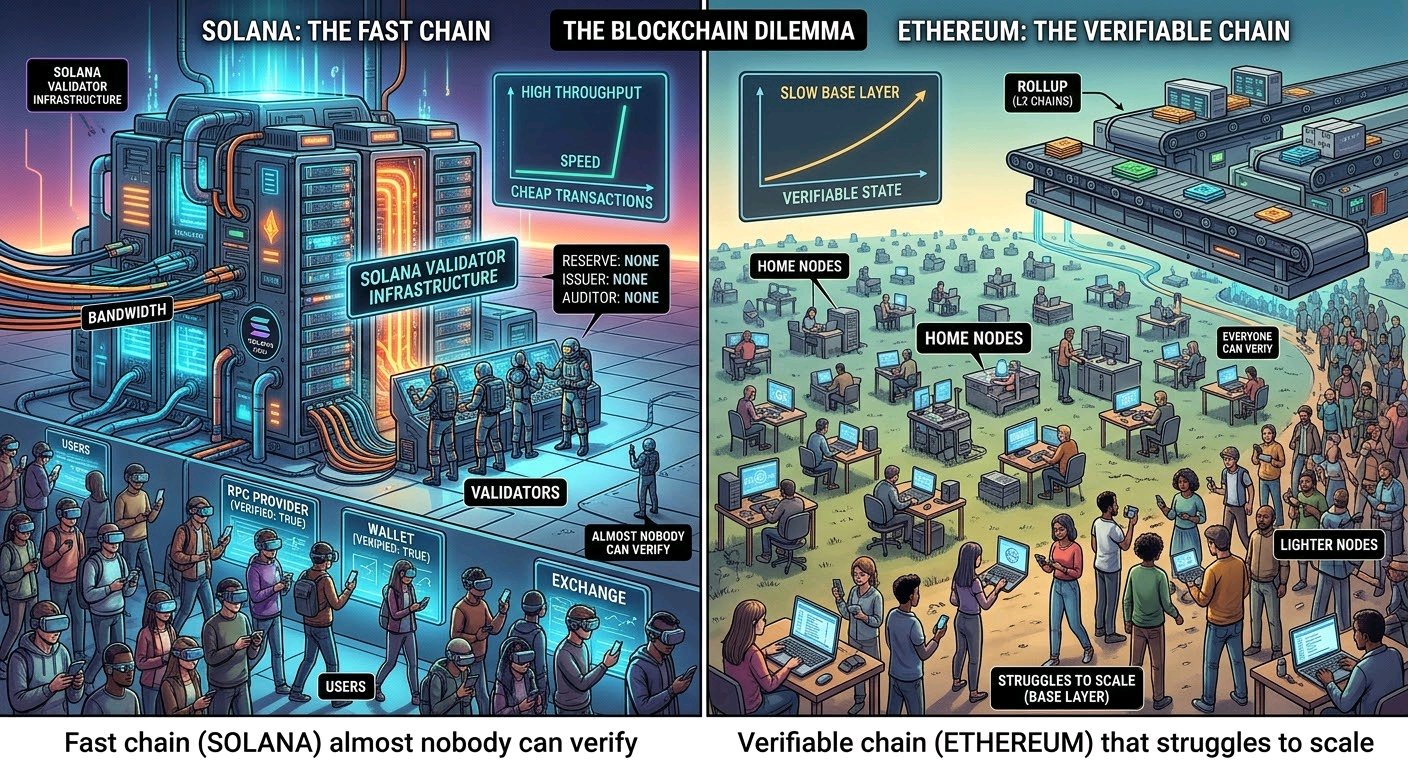
$SOLUSDT 沒有發行方、沒有儲備金,背後也沒有審計機構。它擁有的只是權益加權共識,以及一場關於「是否有足夠多的驗證者保持誠實且在線」的賭注。 Solana 選擇了速度:低廉的交易費用、高吞吐量、單一共享狀態。代價是硬體成本。運行驗證節點需要強大的伺服器、大量的記憶體、高速儲存設備和極高的頻寬,因此很少有人能親自驗證鏈上的數據。我們大多數人只能聽信 RPC 提供商、錢包和交易所的一面之詞。 以太坊則走了另一條路:較慢的基礎層、更輕量的節點,並將擴容需求轉移到 Rollups 上。 那麼,哪一個更讓你擔心:是一條幾乎沒人能驗證的高速鏈,還是一條難以擴容但可驗證的鏈? #IMPACTbyTrade
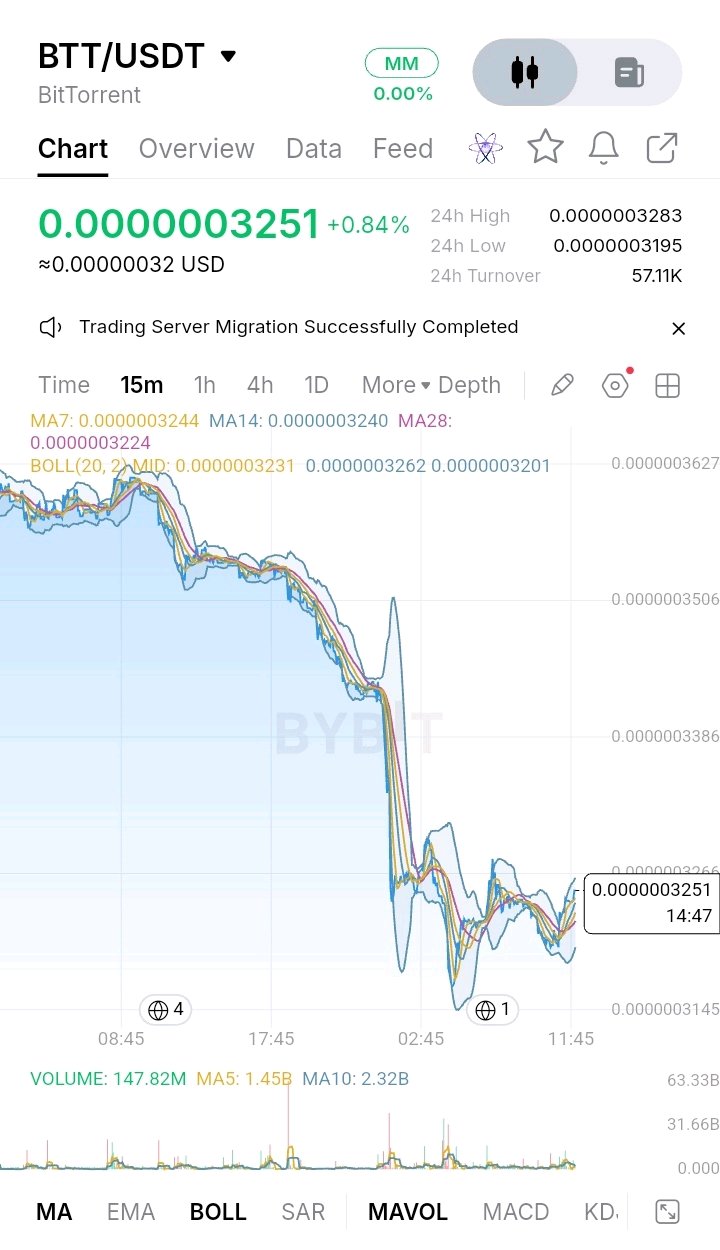
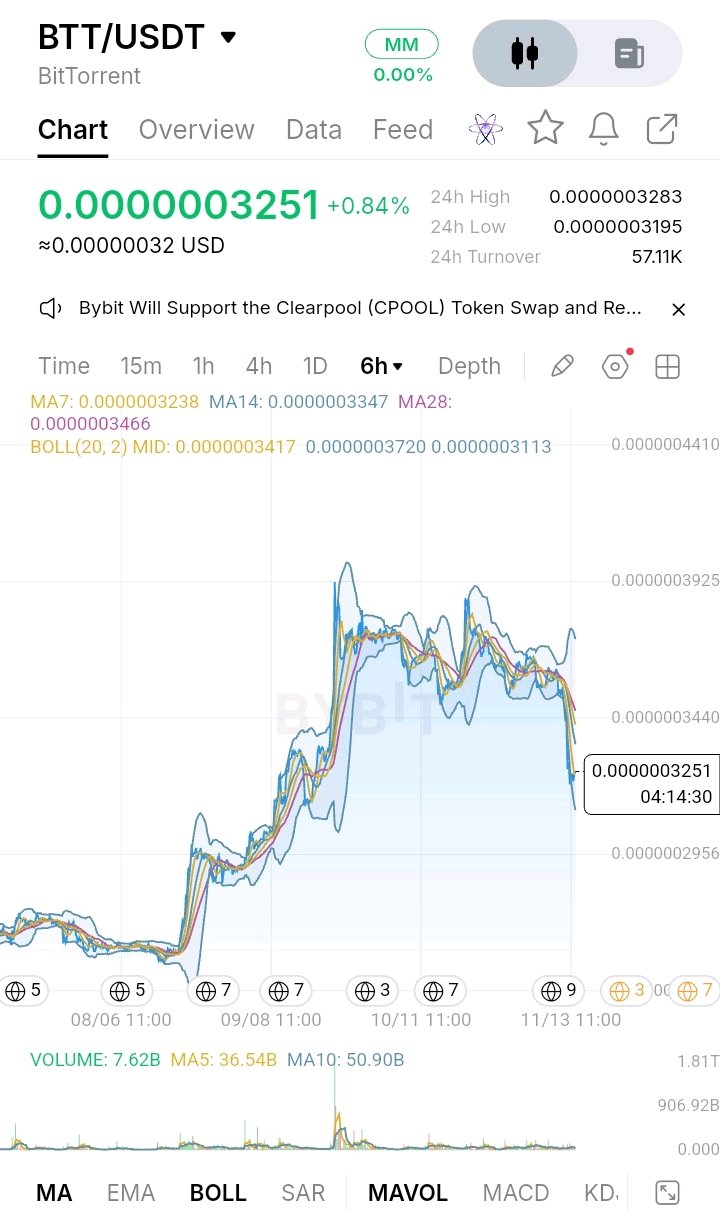
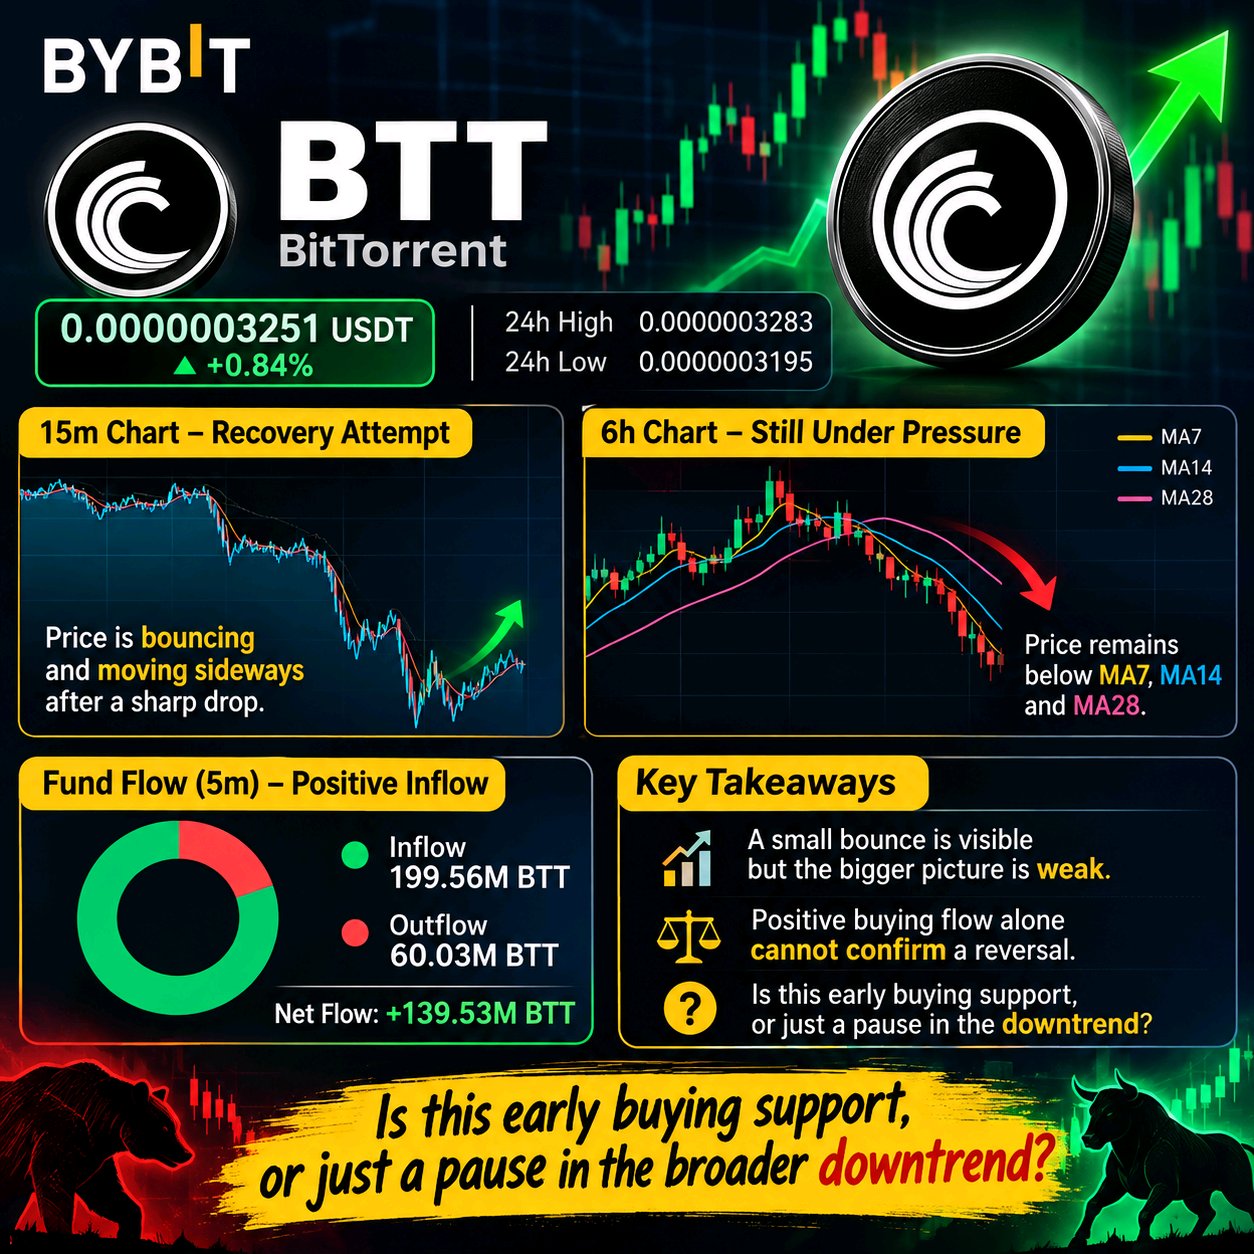
$BTTUSDT 顯示出小幅反彈,但整體趨勢看起來依然疲軟。在 Bybit 上,價格約為 0.0000003251 USDT,上漲了 0.84%,24 小時價格區間在 0.0000003195 到 0.0000003283 之間。15 分鐘線圖顯示價格在急劇下跌後正在恢復並進入橫盤整理。然而,6 小時線圖仍面臨壓力,價格低於 MA7、MA14 和 MA28 水平。Bybit 的五分鐘資金流向數據顯示,BTT 淨流入 1.9956 億,流出 6003 萬,呈現淨流入狀態。僅憑淨流入無法確認反轉。這是早期的買盤支撐,還是大跌勢中的暫時停頓? #IMPACTbyTrade
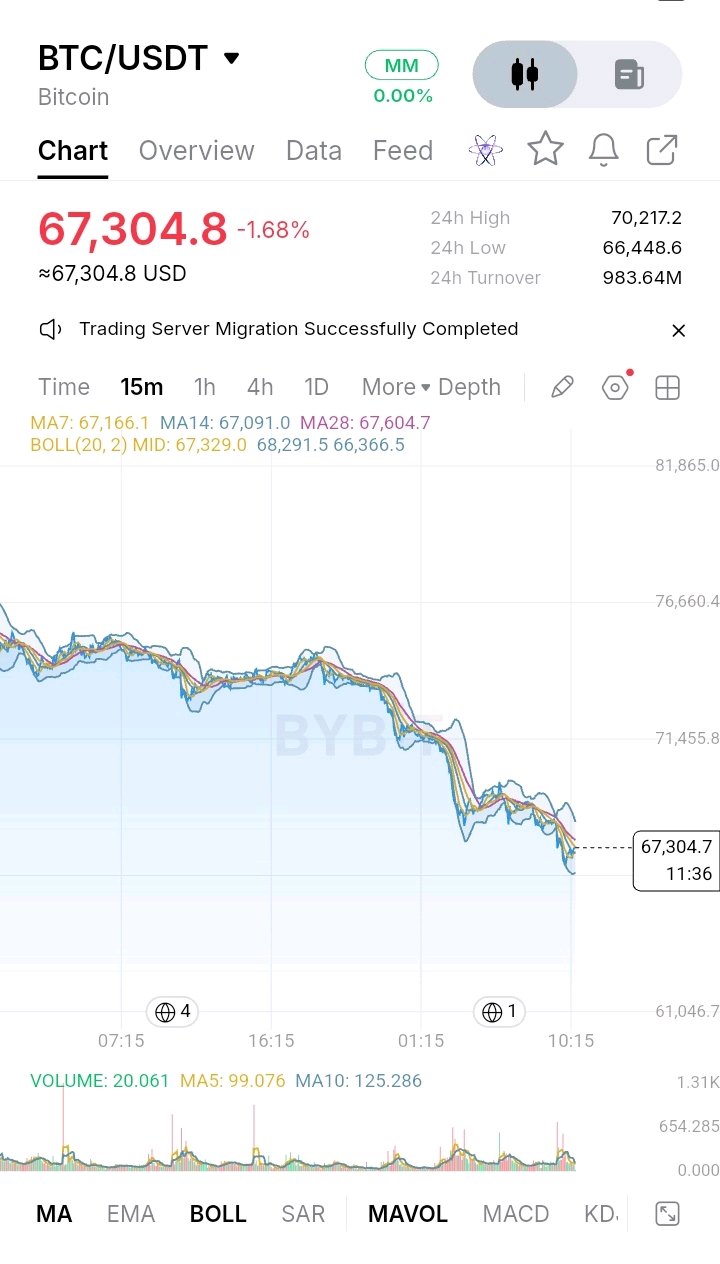
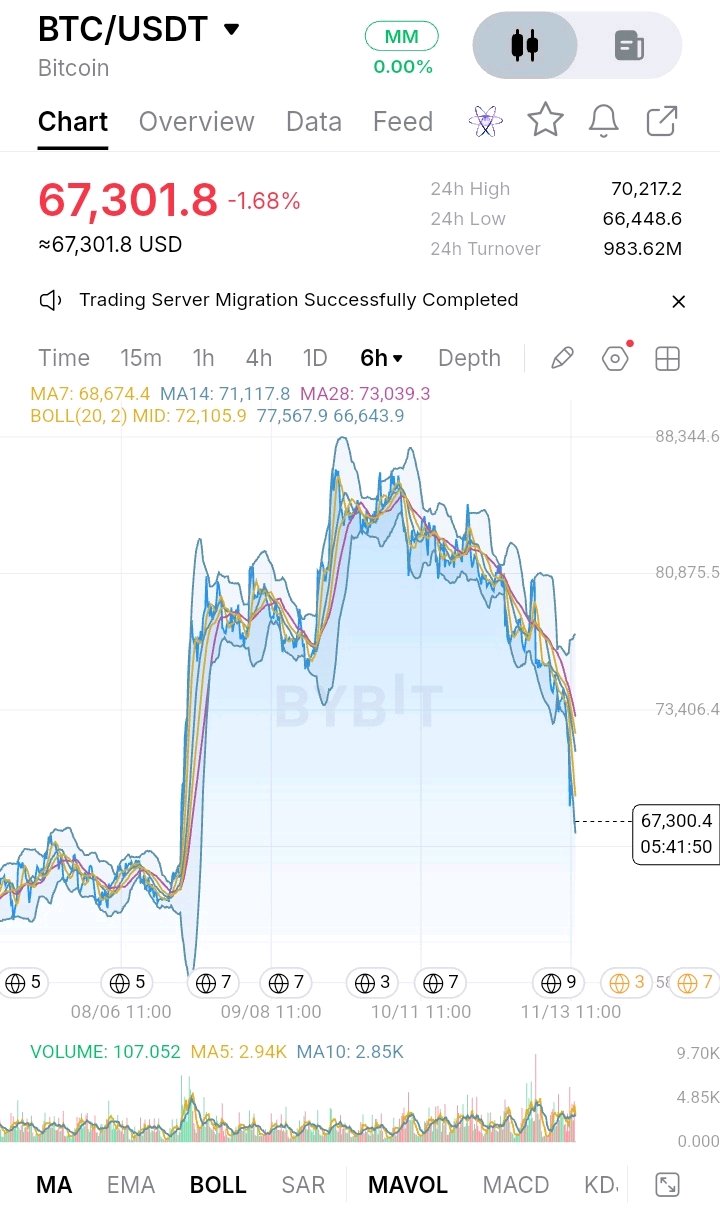
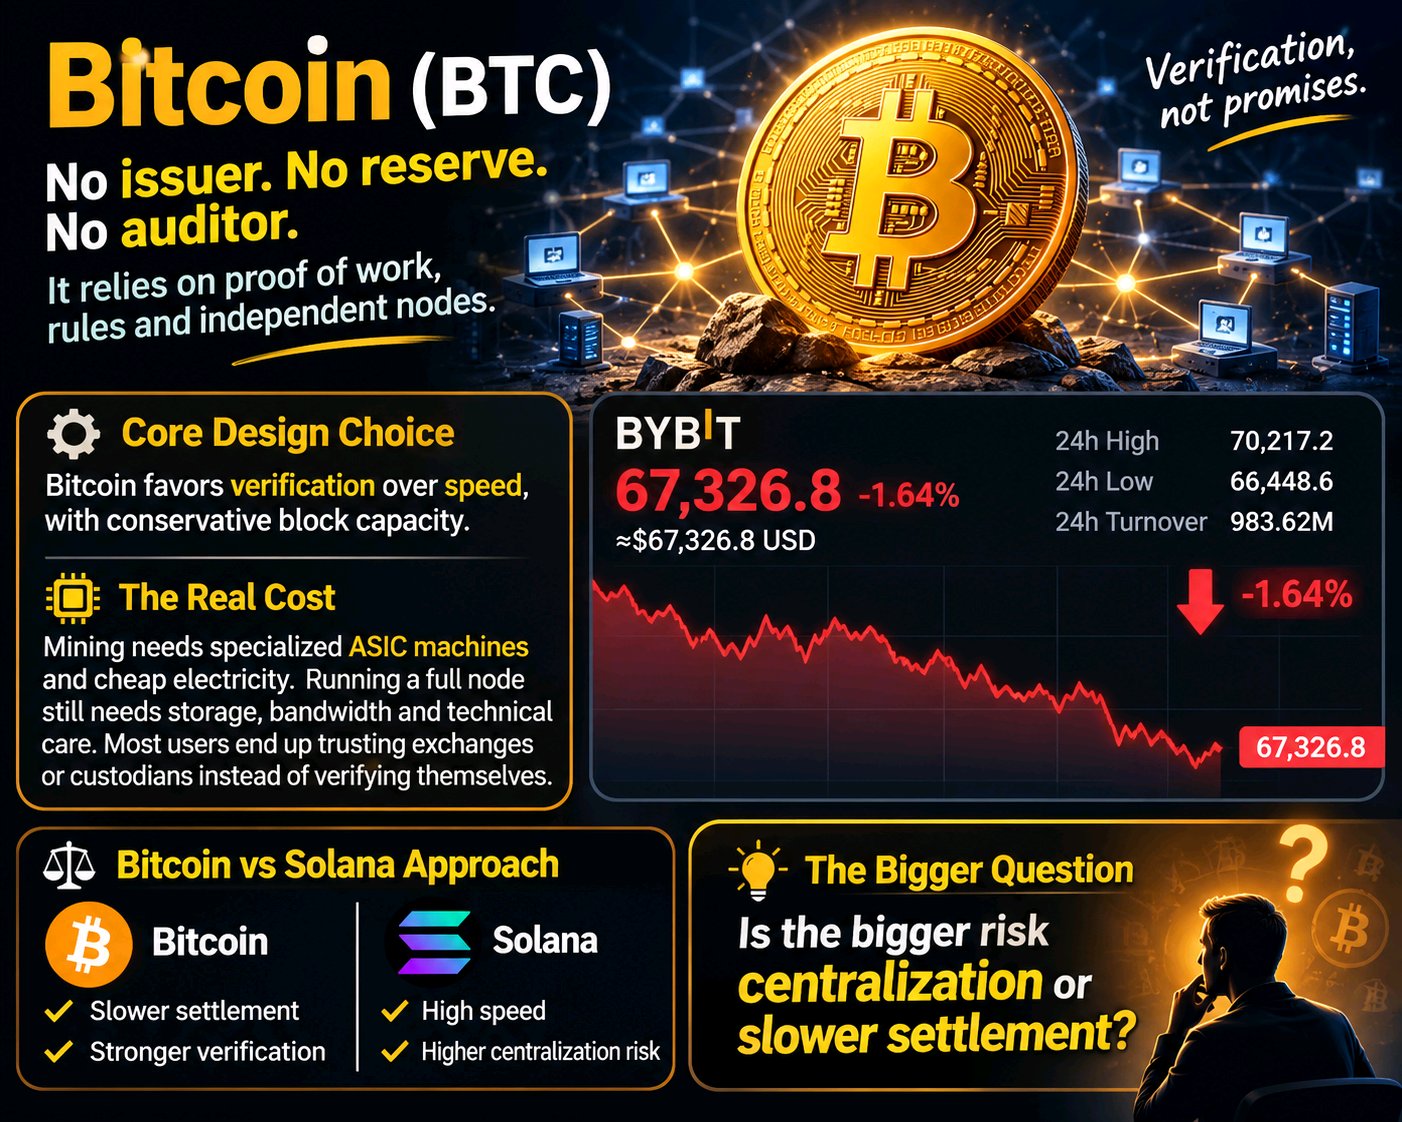
$BTCUSDT 比特幣背後沒有公司、儲備金或中央審計機構。它依靠工作量證明 (Proof of Work)、規則和獨立節點來維持帳本的誠實。與那些速度至上的鏈不同,比特幣更看重驗證而非速度。挖礦需要專用的 ASIC 礦機和廉價電力;使用者雖然仍能透過全節點進行驗證,但這需要考慮儲存空間、頻寬和設置問題。大多數人使用交易所或輕錢包,因此他們選擇信任第三方來檢查鏈上數據。Bybit 11 月 14 日的快照顯示 BTC 價格接近 67,326 美元,下跌 1.64%,低於關鍵移動平均線,且五分鐘內的流出量大於流入量。更大的風險究竟是中心化還是結算速度較慢呢? #IMPACTbyTrade
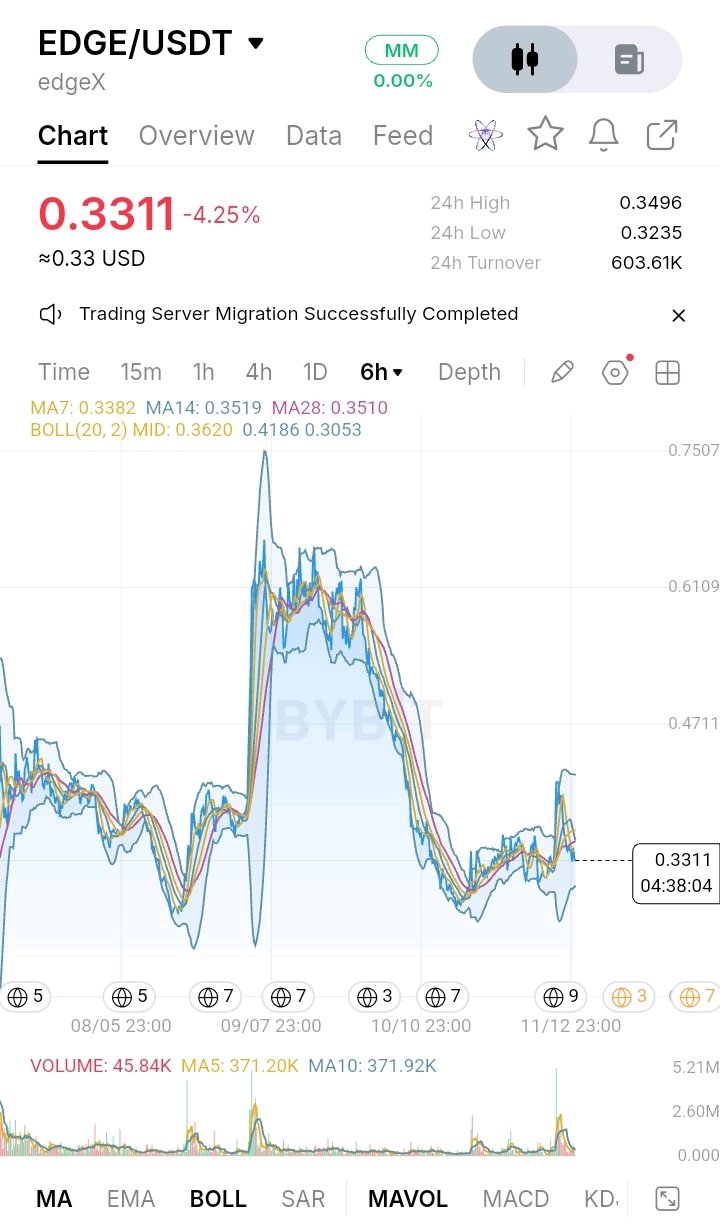
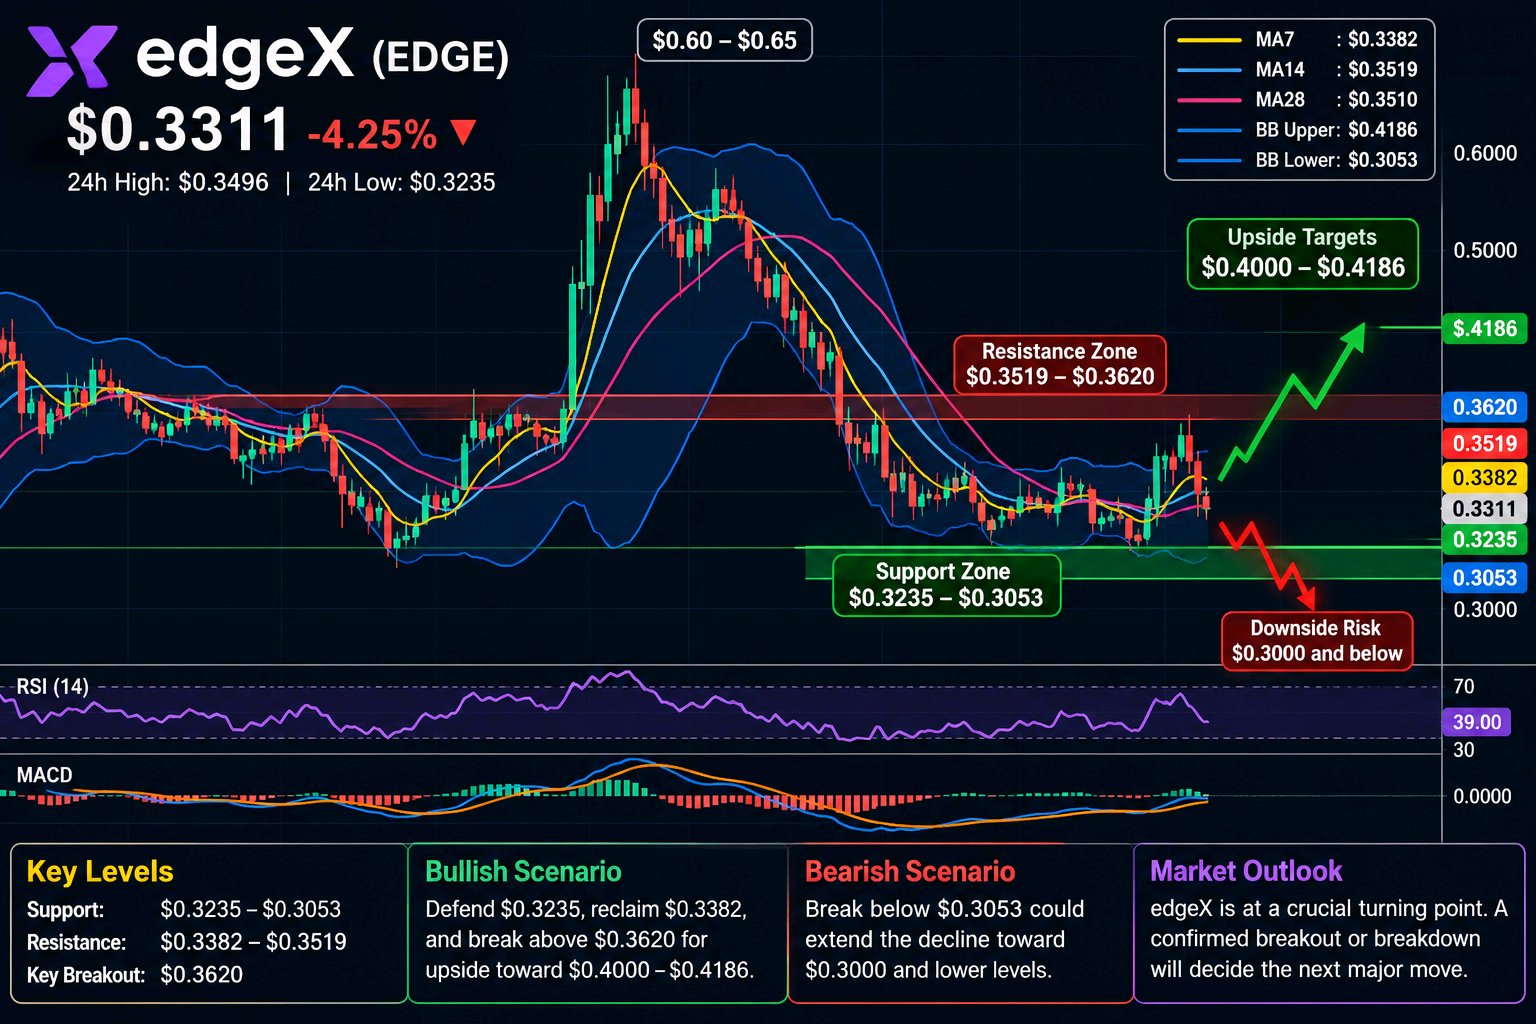
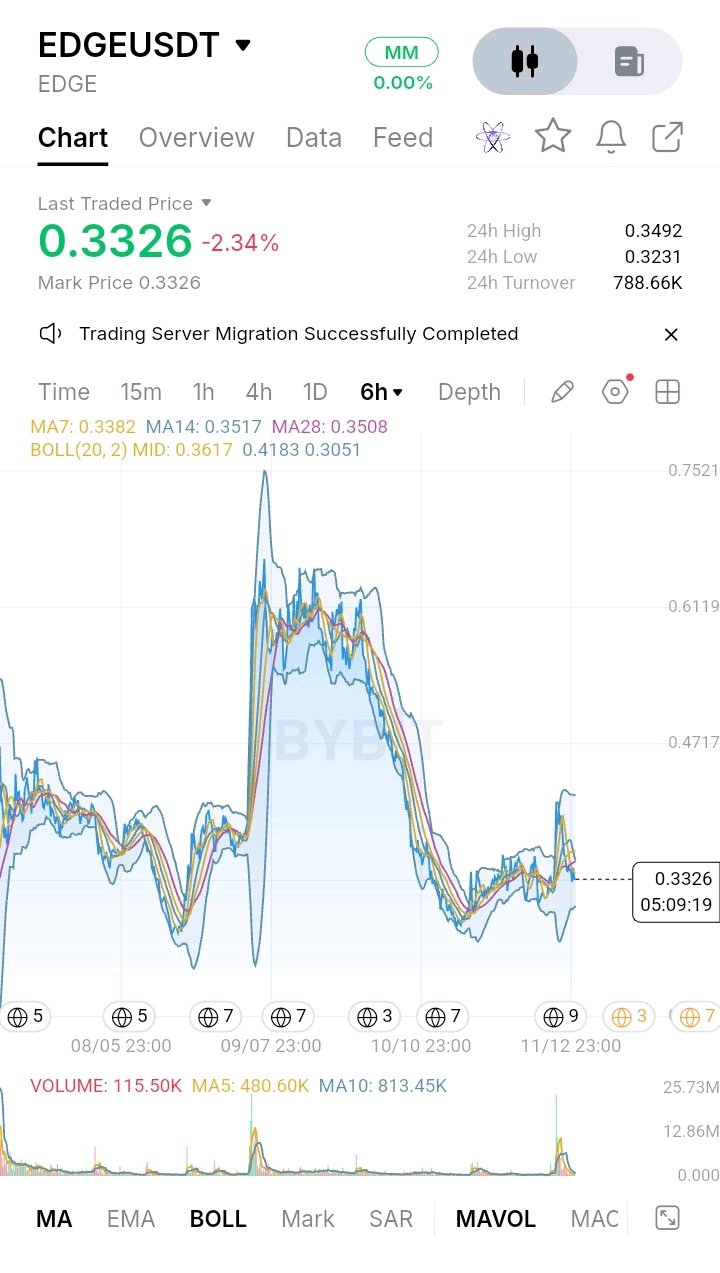
edgeX ($EDGEUSDT ) 目前交易價格約為 $0.3311,從圖表來看,過去 24 小時下跌了 4.25%。價格波動相當劇烈,日內高點為 $0.3496,低點為 $0.3235。從更廣的 6 小時結構來看,該代幣在先前漲至 $0.60–$0.65 附近後經歷了顯著回調,隨後出現延續性下跌,目前正試圖在 $0.30–$0.34 區間建立反彈基礎。儘管買方設法穩住了價格,但最近一次的上漲受阻顯示賣壓依然存在。 從市場結構來看,edgeX 在經過長時間的看跌修正後,目前正處於盤整階段。近期的反彈嘗試雖然引發了短暫的價格飆升,但買方難以在附近的阻力位上方維持動能。目前價格低於 6 小時 MA7 ($0.3382)、MA14 ($0.3519) 及 MA28 ($0.3510)。這種排列顯示短期動能依然疲軟,賣方目前佔據優勢。布林通道顯示中軌位於 $0.3620,上軌位於 $0.4186,下軌位於 $0.3053,凸顯了更廣泛的波動區間。 在小時級別時間框架上,現有的技術指標顯示 edgeX 仍低於 EMA200,這使其成為一個關鍵的結構決策區域。由於目前的 1 小時 EMA200 確切數值未經獨立驗證,因此指定具體價格可能會產生誤導。可用的小時級動能指標顯示 RSI 約為 39,反映出買盤力道相對疲弱,而 MACD 則維持看跌訊號。這些訊號顯示,持續的反彈需要更強勁的動能,而非零星的上漲 K 線。 即時支撐區間位於 $0.3235 至 $0.3053 之間。第一個價位代表近期日內低點,第二個則對應布林通道下軌。若跌破 $0.3053,可能會測試 $0.3000 的心理關卡,並可能將修正行情進一步延伸至更低的歷史盤整區域。在上行方面,$0.3382 是第一個反彈阻礙,隨後是 $0.3496–$0.3519。若能收復該阻力集群,將有助於改善短期結構,而 $0.3620 仍是確認更強看漲動能的重要水位。 對於買方而言,看漲情境需要守住 $0.3235,收復 $0.3382,並在 $0.3519 上方建立持續的交易。若能確認突破 $0.3620,則可能開啟通往 $0.4000 甚至 $0.4186 的空間。然而,若在這些水平附近受阻,則顯示賣方仍掌握主導權。 若 edgeX 失守 $0.3235,並隨後在賣壓增加的情況下跌破 $0.3053,看跌情境將會增強。此舉將破壞正在形成的盤整結構,並增加下行風險。 總體而言,edgeX 仍處於重要的技術轉折點。下一個重大走勢很可能取決於買方能否守住 $0.3235–$0.3053 的支撐區間,並收復移動平均線阻力集群。在此之前,對於反彈嘗試應保持謹慎,需等待確認性的突破或跌破以獲得更明確的方向訊號。 #IMPACTbyTrade
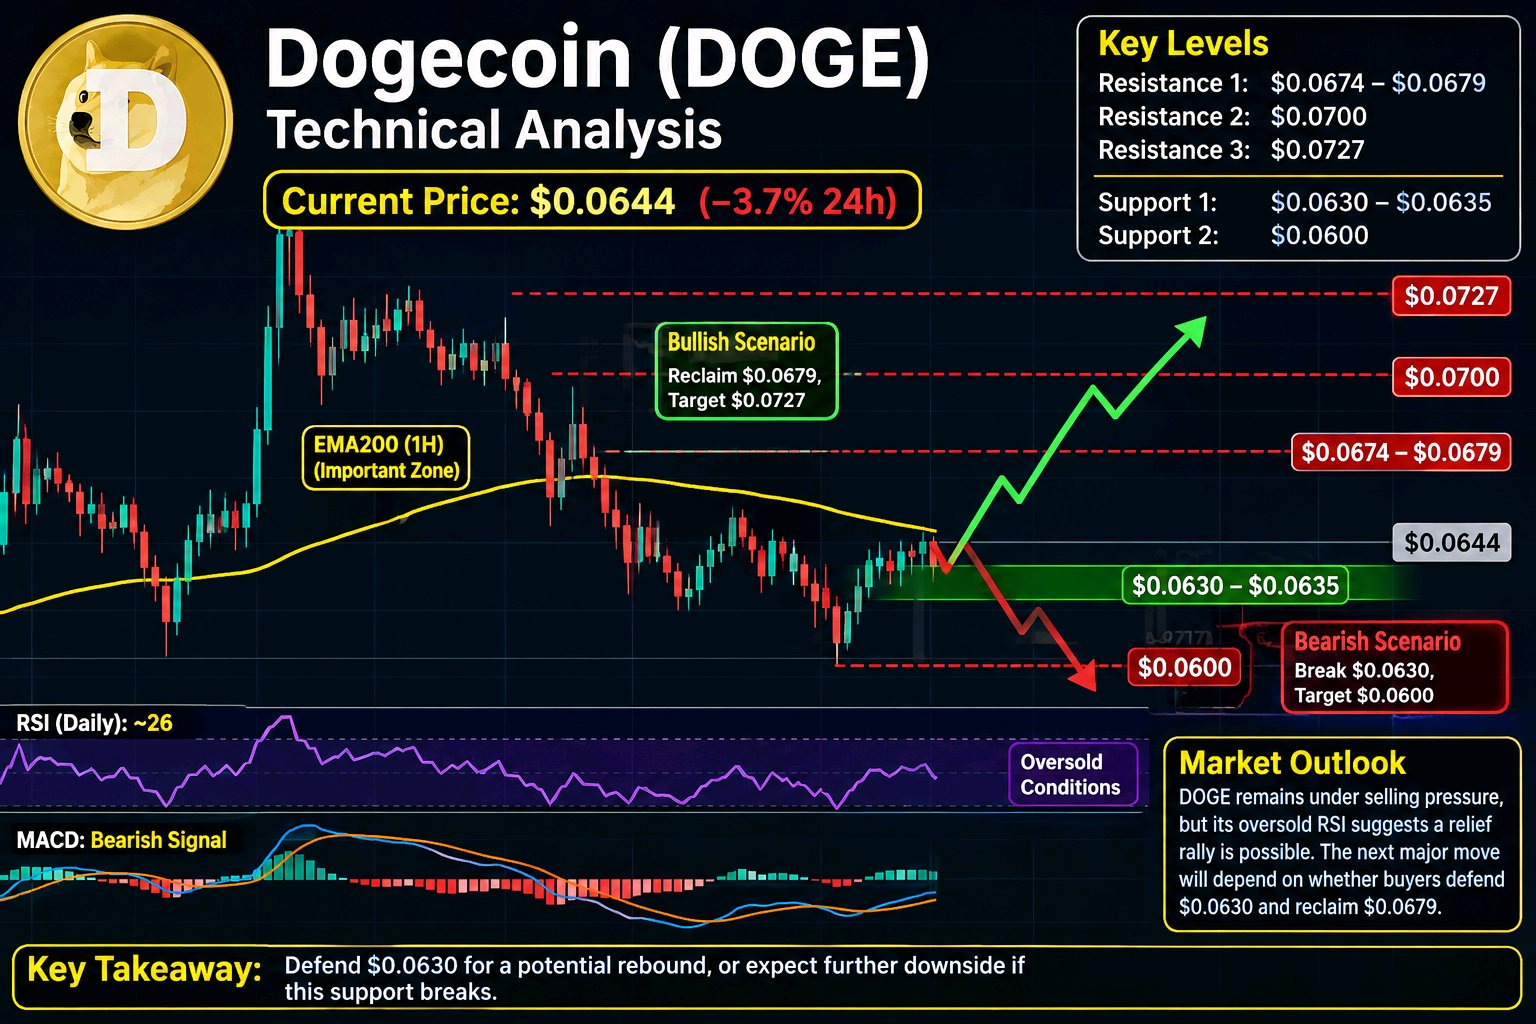
Dogecoin ($DOGEUSDT ) is currently trading around $0.0644, showing a decline of approximately 3.7% over the past 24 hours. The latest market data places its daily trading range between $0.0631 and $0.0674, highlighting continued selling pressure and elevated short-term volatility. DOGE has struggled to maintain its previous recovery attempts, with the broader price structure showing consecutive lower daily closes. After trading near $0.0727 on November 7, the price gradually weakened, moving toward the $0.0630 region. This decline indicates that sellers remain in control, although the latest movement near support suggests buyers are beginning to defend lower levels. CoinGlass +1 From a market-structure perspective, DOGE remains bearish in the short term. The recent decline from approximately $0.0727 toward $0.0631 demonstrates weakening momentum and a lack of sustained buying participation. The immediate consolidation area is developing between $0.0630 and $0.0675. Buyers need to establish higher lows and recover the upper boundary before a meaningful structural improvement can be considered. Meanwhile, sellers will attempt to keep the price below resistance and prevent a sustained recovery. The one-hour EMA200 is particularly important because it helps identify the broader intraday trend and acts as a potential dynamic resistance or support zone. However, a verified current one-hour EMA200 reading is unavailable in the supplied information, so assigning it an exact value would be unreliable. The same limitation applies to precise short-term moving-average and MACD readings. The available daily RSI is approximately 26, indicating deeply oversold conditions. This increases the possibility of a technical rebound, but oversold conditions alone do not confirm a trend reversal. CoinGlass +1 The $0.0630–$0.0635 region is the first important support zone because it contains the latest daily lows. A sustained breakdown below this area could expose DOGE to further downside, with $0.0600 acting as the next psychological level to monitor. On the upside, $0.0655 is an initial recovery threshold, followed by resistance around $0.0674–$0.0679. These levels matter because reclaiming them would demonstrate improving demand and potentially weaken the current bearish structure. A stronger recovery toward $0.0700 would provide additional evidence of renewed buying interest. For the bullish scenario, DOGE needs to defend $0.0630, establish higher lows, and reclaim $0.0679 with convincing trading volume. Successful acceptance above $0.0700 could open the way toward $0.0727, the recent swing-high region. Conversely, rejection near $0.0675–$0.0700 followed by a breakdown below $0.0630 would strengthen bearish continuation. Overall, DOGE remains under selling pressure, but its oversold daily RSI makes a relief rally increasingly possible. The next major move will likely depend on whether buyers can defend $0.0630 and generate enough volume to reclaim resistance. Until that happens, rallies should be treated cautiously rather than interpreted as confirmed reversals. #IMPACTbyTrade
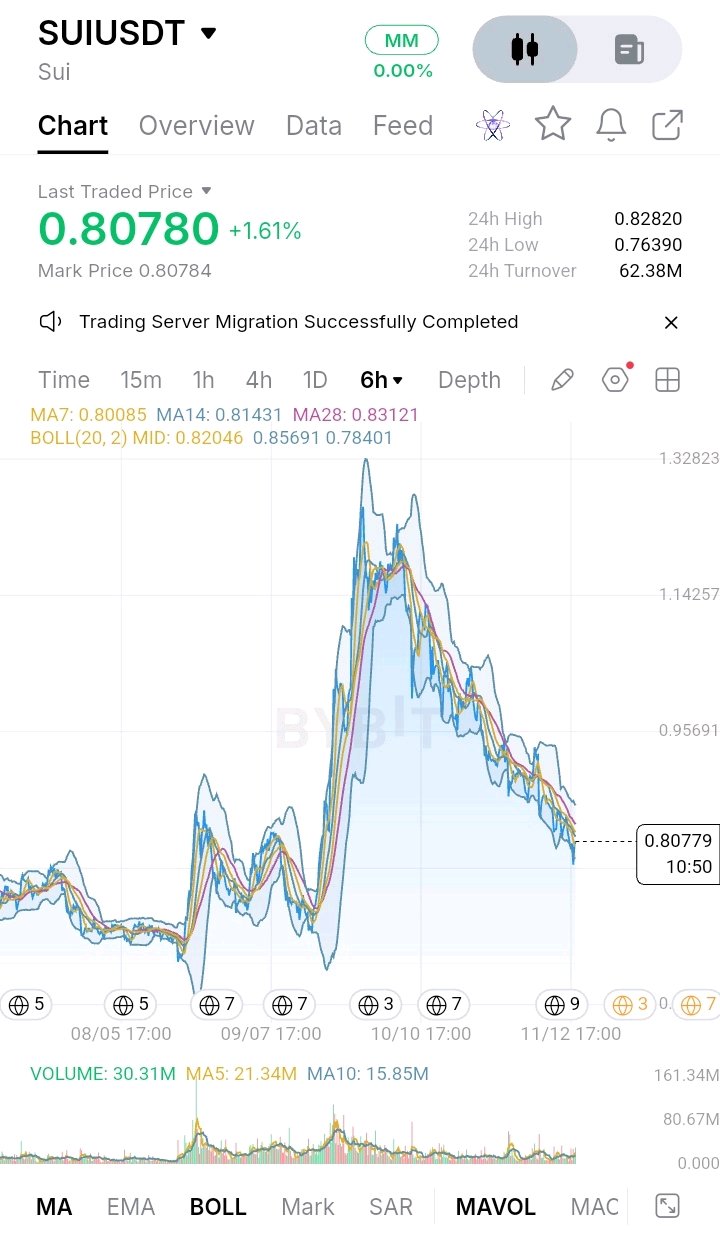
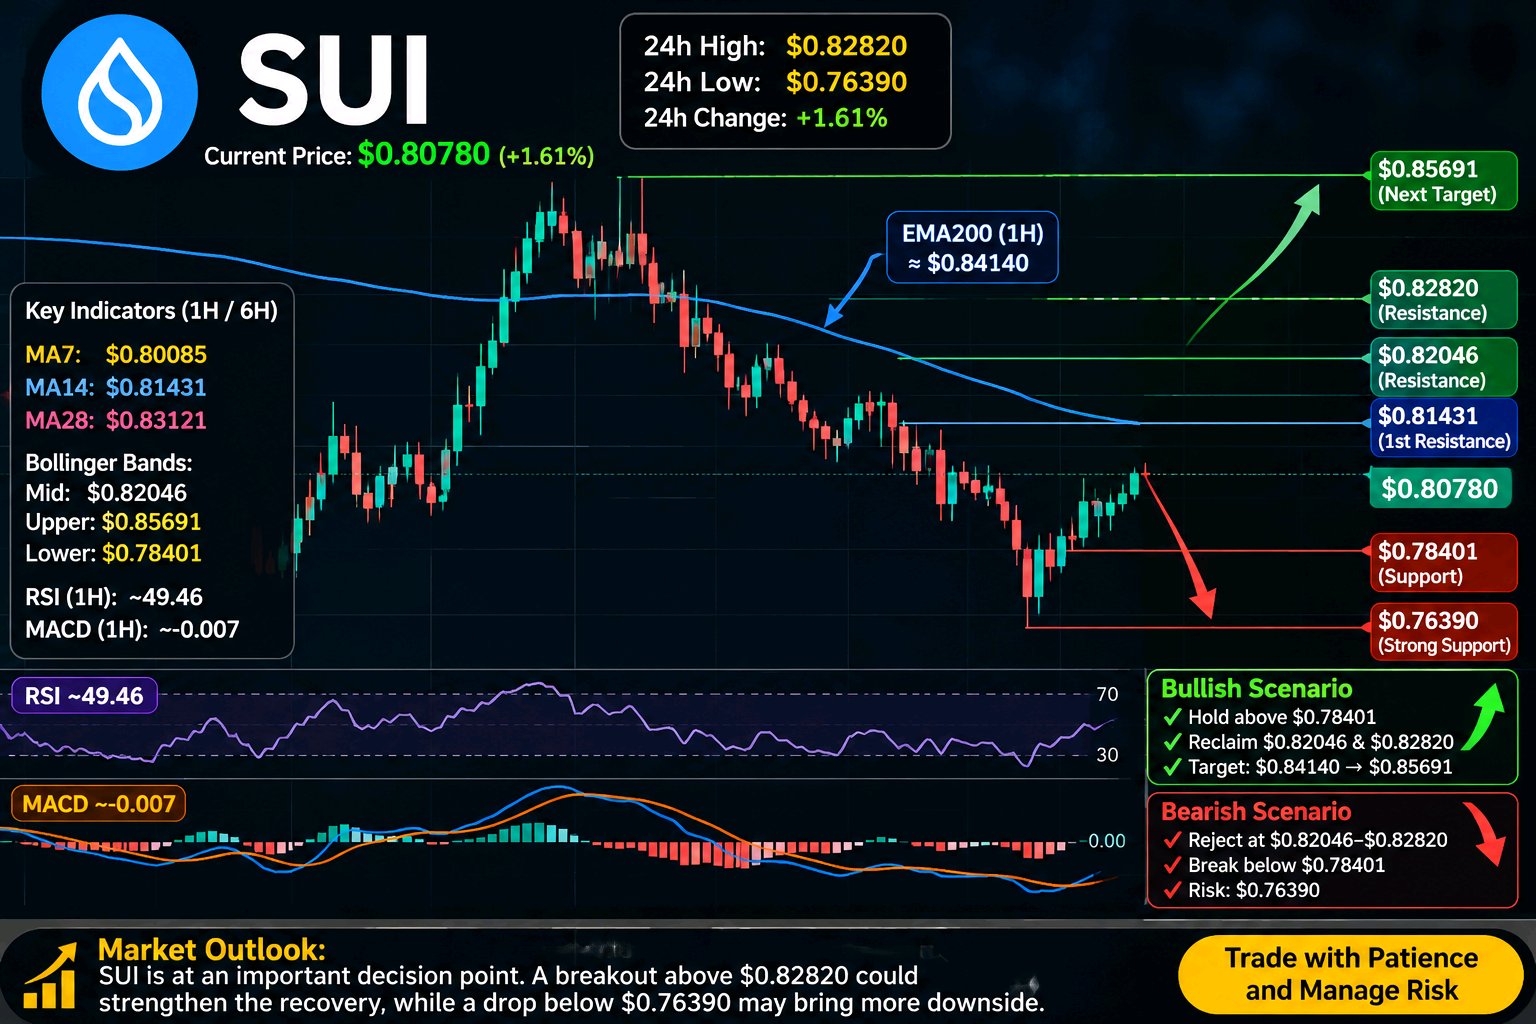
$SUIUSDT is currently trading around $0.80780, up 1.61% over the last 24 hours, showing an attempt to recover after a prolonged period of selling pressure. The latest 24-hour high stands at $0.82820, while the low is $0.76390. Looking at the broader 6-hour chart, SUI previously experienced a powerful rally toward approximately $1.30, but that move was followed by a sustained correction, with sellers gradually pushing the price into a series of lower highs and lower lows. The current recovery is encouraging, but buyers still need stronger confirmation before the overall market structure can be considered bullish. At the moment, SUI is trading above its 7-period moving average at $0.80085, but remains below the 14-period MA at $0.81431 and the 28-period MA at $0.83121. This shows that short-term buying activity is improving, although the medium-term trend continues to face resistance. The Bollinger Bands provide additional insight, with the middle line at $0.82046, the upper boundary at $0.85691, and the lower boundary at $0.78401. These levels are particularly important because they identify the current trading structure and potential areas where buyers and sellers may become more active. On the 1-hour timeframe, the EMA200 is around $0.84140, making it an important structural decision zone. SUI remains below this average, meaning the broader hourly trend has not yet confirmed a bullish reversal. The RSI is approximately 49.46, indicating relatively neutral momentum, while the MACD remains negative at approximately -0.007, suggesting that bearish pressure has not completely disappeared. However, the recent recovery from lower levels indicates that buyers are attempting to regain control. Investing.com India From a price-action perspective, $0.80000 is the first important psychological support, followed by $0.78401 and the recent low of $0.76390. Holding these levels would help buyers establish a stronger foundation. A breakdown below $0.76390 could invite further selling pressure and weaken the recovery. On the upside, $0.81431 is the first resistance, followed by $0.82046 and $0.82820. A convincing breakout above $0.82820, supported by stronger trading volume, could open the door toward $0.84140 and eventually $0.85691. For the bullish scenario, buyers need to defend current support, reclaim the important moving averages, and establish sustained momentum above $0.82820. Conversely, repeated rejection around $0.82046–$0.82820 would suggest that sellers remain in control. Overall, SUI is approaching an important turning point. The next significant move will depend on whether buyers can turn this recovery into a confirmed breakout or whether sellers push the price back toward lower support levels. Until resistance is convincingly reclaimed, patience and careful risk management remain essential. #IMPACTbyTrade
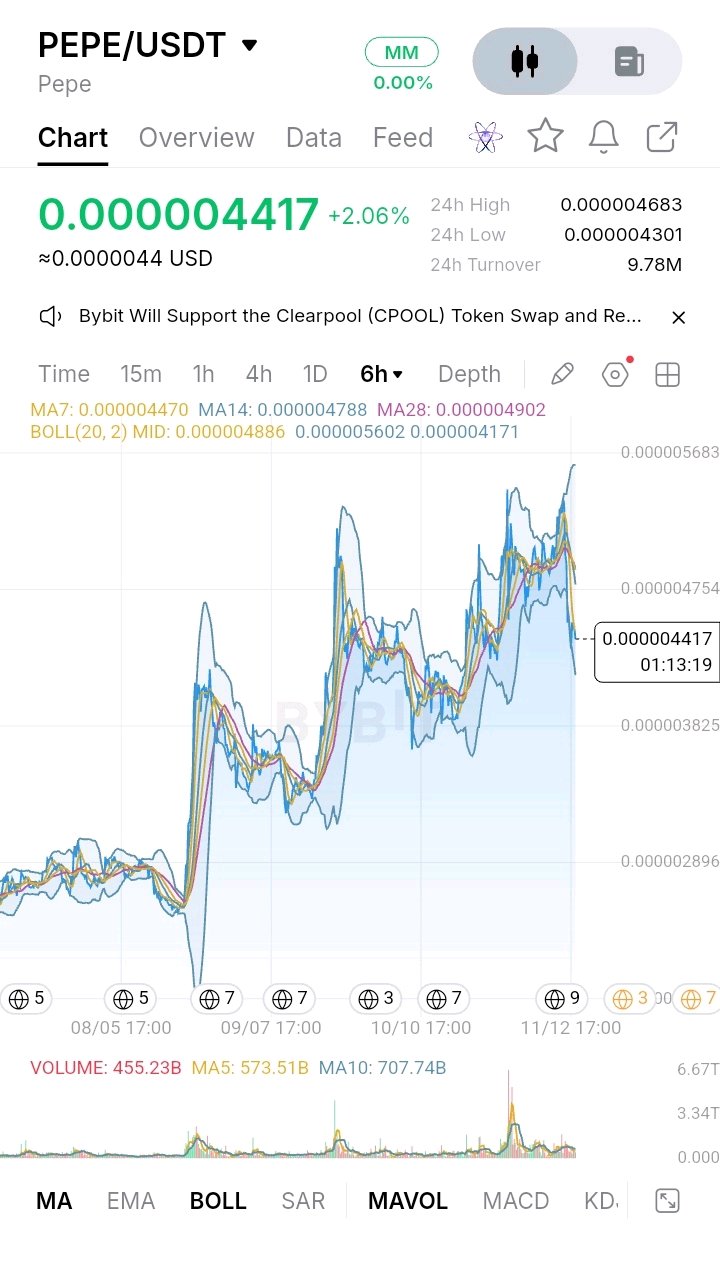
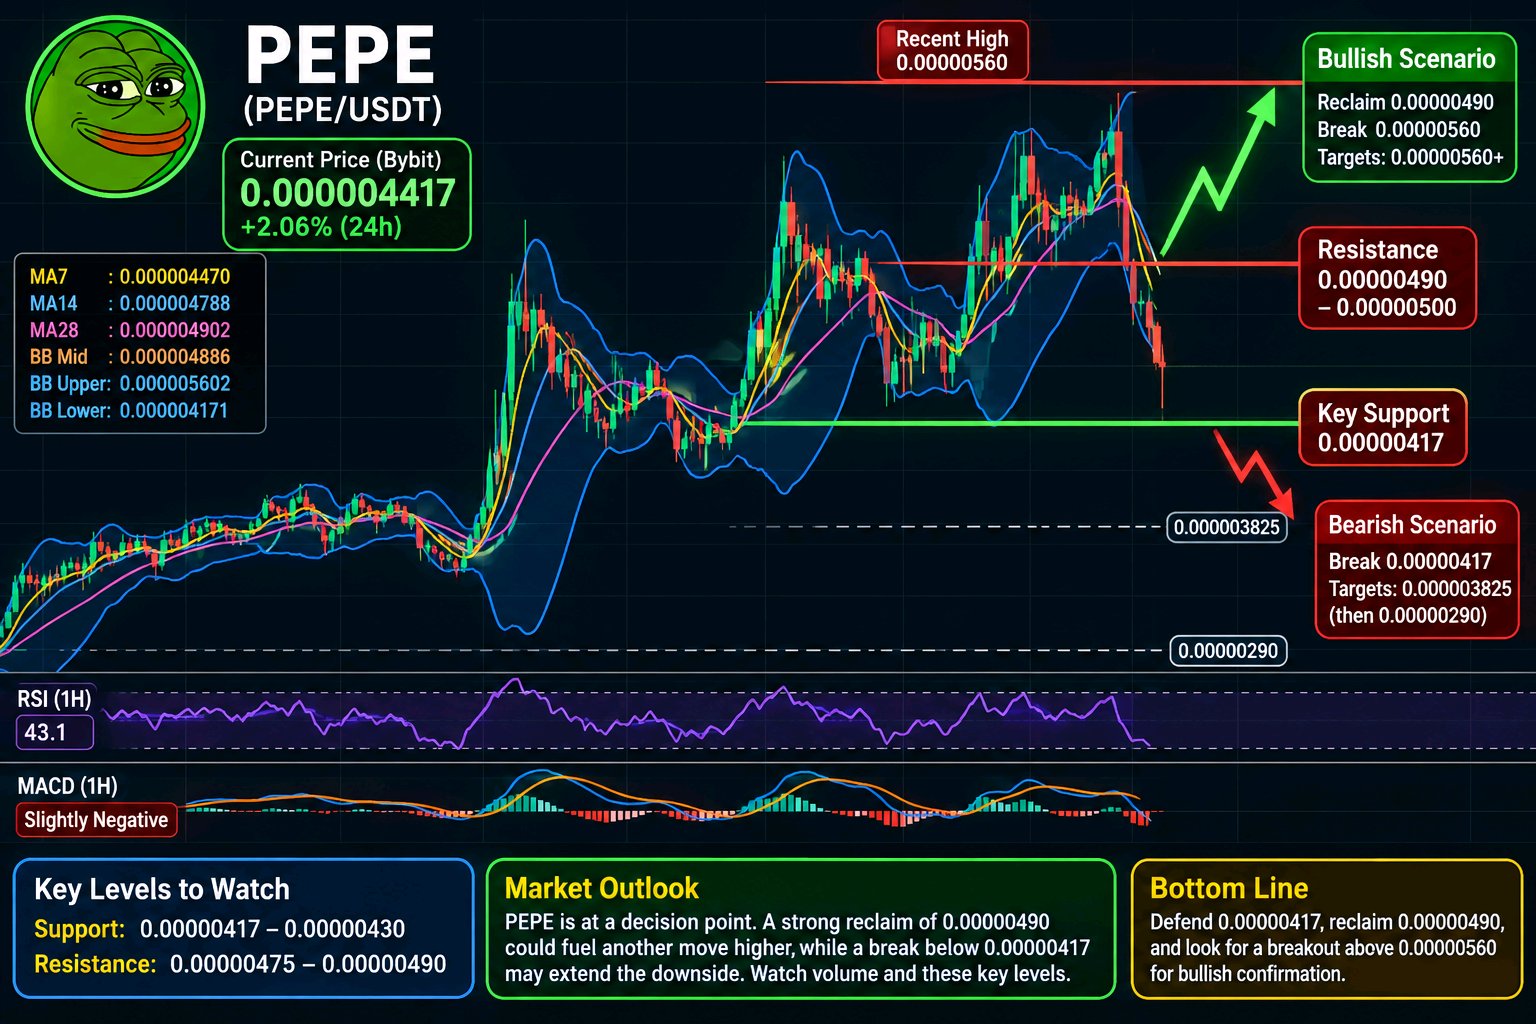
$PEPEUSDT 在最新的市場快照中交易價格約為 0.00000455 USDT,而提供的 Bybit 圖表記錄為 0.000004417 USDT,24 小時漲幅為 2.06%。這種差異反映了不同的更新時間與平台,因此截圖仍為其指標讀數的參考依據。其更廣泛的實時波動範圍約在 0.00000429 至 0.00000469 之間,顯示出顯著的盤中波動。在六小時圖上,PEPE 從 0.0000029 附近的底部上漲,連續波動至 0.0000048 至 0.0000056 區間,目前已從最新高點大幅回調。 因此,目前的結構屬於正在失去短期動能的復甦,而非已確認的持續突破。截圖顯示價格低於 MA7(0.000004470)、MA14(0.000004788)和 MA28(0.000004902)。這種排列顯示賣方已重新掌控短期趨勢。布林通道中軌 0.000004886 是另一個重要的收復水平;上軌 0.000005602 標示了一個延伸阻力區,而下軌 0.000004171 是近期的波動支撐位。目前的報價接近該下軌,因此在此處的反應至關重要。 在一小時時間週期上,最新發布的指標快照報告 RSI 為 43.1,這是一個低於 50 的疲弱動能讀數,且 Supertrend 顯示看跌。MACD 略微負值,儘管其柱狀圖為正,顯示下行動能可能正在減弱,但尚未確認看漲反轉。同一份快照顯示 PEPE 低於其一小時 EMA200 約 8.26%。由於未提供精確的 EMA200 價格,因此不應憑空捏造;該均線仍然是一個主要的結構決策區,買方需要收復該均線才能改善小時級別的趨勢。 直接支撐位位於 0.00000430 至 0.00000417 左右,結合了近 24 小時的低點區域與圖表的布林下軌。若持續跌破 0.00000417,將會測試 0.000003825 圖表區域,隨後是 0.0000029 附近的前期底部。在上行方面,PEPE 首先需要收復 0.00000447,然後突破 0.00000475 至 0.00000490 的均線簇。若在成交量放大的支撐下,能令人信服地收盤高於 0.00000490,將開啟重新測試 0.0000050 及隨後的 0.00000560(近期上軌與波動高點區域)的機會。 看漲情境需要買方守住 0.00000417,收復短期均線並將 0.00000490 轉化為支撐。若未能做到這一點,特別是若在賣盤成交量上升的情況下決定性地跌破支撐位,將使復甦變得脆弱,並強化看跌延續的情境。總體而言,PEPE 正處於決策點:支撐位附近的壓縮價格走勢可能會產生劇烈波動,但方向仍需確認。請密切關注成交量、0.00000417 底線以及 0.00000490 的收復情況;這些水平將顯示需求是否正在回歸,或者賣方是否正在準備下一波下跌。 $IMPACTbyTrade
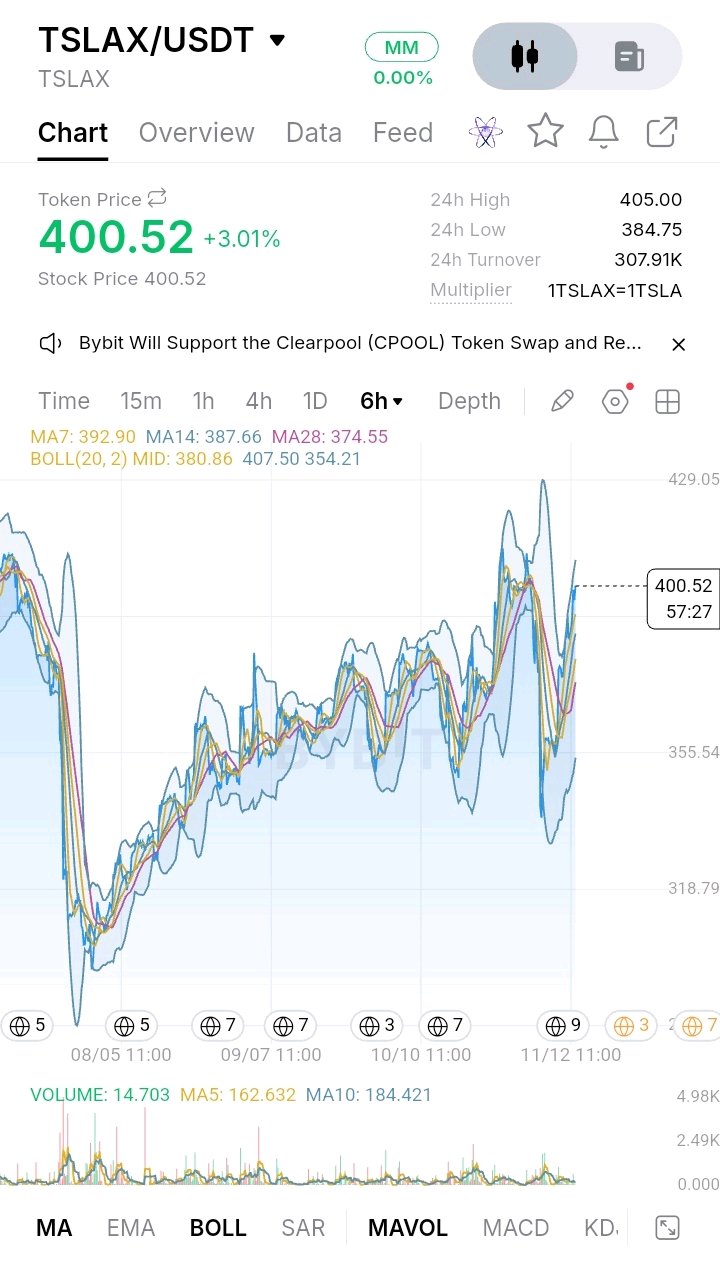
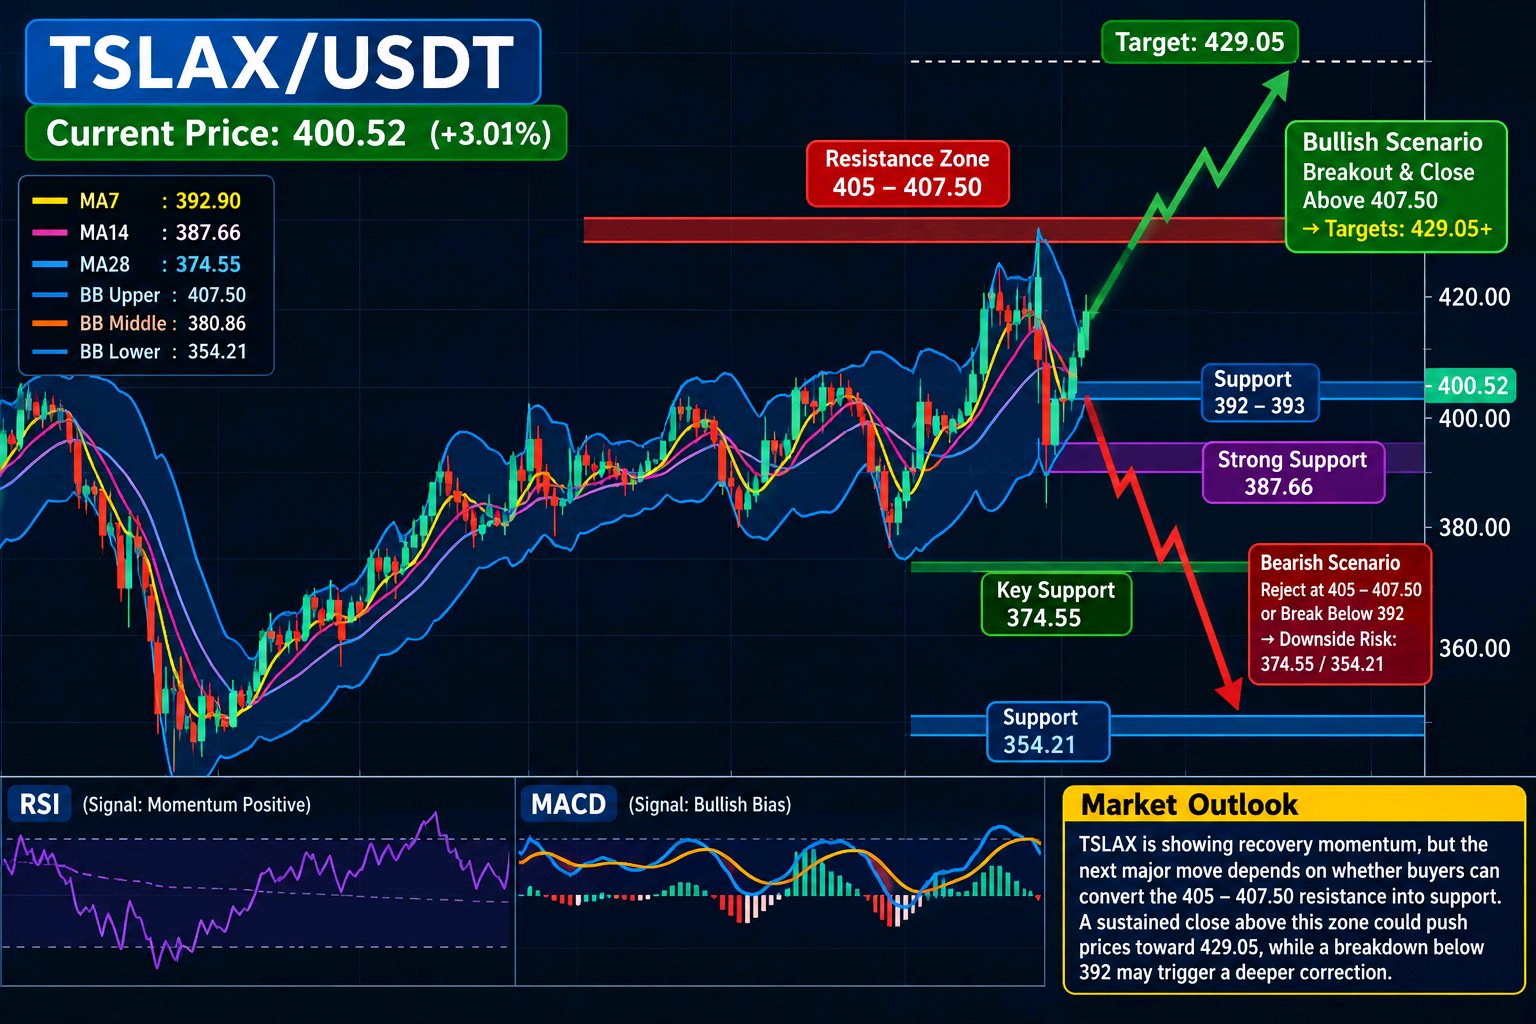
$TSLAXUSDT is currently trading at 400.52, showing a 3.01% gain over the last 24 hours. The chart reflects a recovering market structure, with buyers attempting to regain control after a previous period of significant selling pressure. The 24-hour high of 405.00 and low of 384.75 establish the immediate trading boundaries, while the recent price action suggests improving short-term momentum. On the 6-hour chart, TSLAX has recovered considerably from its earlier decline, which pushed the price toward the 300–320 region. Since that major swing low, the market has developed a broader recovery structure, with higher trading levels and repeated attempts to challenge overhead resistance. However, volatility remains elevated. The chart also shows several sharp upward and downward movements, indicating that buyers and sellers are still competing aggressively around important price zones. The moving-average structure supports the recovery. The displayed MA7 at 392.90, MA14 at 387.66 and MA28 at 374.55 are all below the current price. This alignment indicates positive short-term positioning, with the 392–393 area becoming the first important support zone. The Bollinger Bands show a middle line at 380.86, an upper band at 407.50 and a lower band at 354.21. Price approaching the upper band highlights the possibility of continued expansion, but also increases the risk of a temporary pullback. The 405–407.50 region is the immediate resistance area. A convincing 6-hour close above 407.50, supported by stronger trading volume, would improve the bullish structure and potentially open the way toward the previous chart high near 429.05. Beyond that level, further upside would require sustained buying pressure. On the downside, losing 392 would weaken immediate momentum, while a break below 387.66 could expose 380.86. A deeper correction toward 374.55 or the 354.21 Bollinger lower band would become possible if selling pressure accelerates. The 1-hour EMA200 value is not displayed in the supplied screenshot, so its exact level cannot be verified. It remains an important structural decision zone: buyers should establish price above it to strengthen the broader bullish case, while rejection below it would indicate continued trend risk. Similarly, RSI and MACD readings are unavailable, meaning overbought conditions, momentum divergence and potential crossover signals cannot be confirmed. The bullish scenario depends on defending 392–393, reclaiming 405 and establishing acceptance above 407.50. Conversely, repeated rejection around 405–407.50, followed by a loss of 392, would favor consolidation or another downward move. Overall, TSLAX is showing encouraging recovery momentum, but the next major move depends on whether buyers can convert the 405–407.50 resistance into support. Volume expansion, sustained 6-hour closes and confirmation from the 1-hour EMA200 will be important. Until those conditions appear, maintaining a balanced outlook and respecting the support structure is more sensible than assuming an immediate breakout. #IMPACTbyTrade
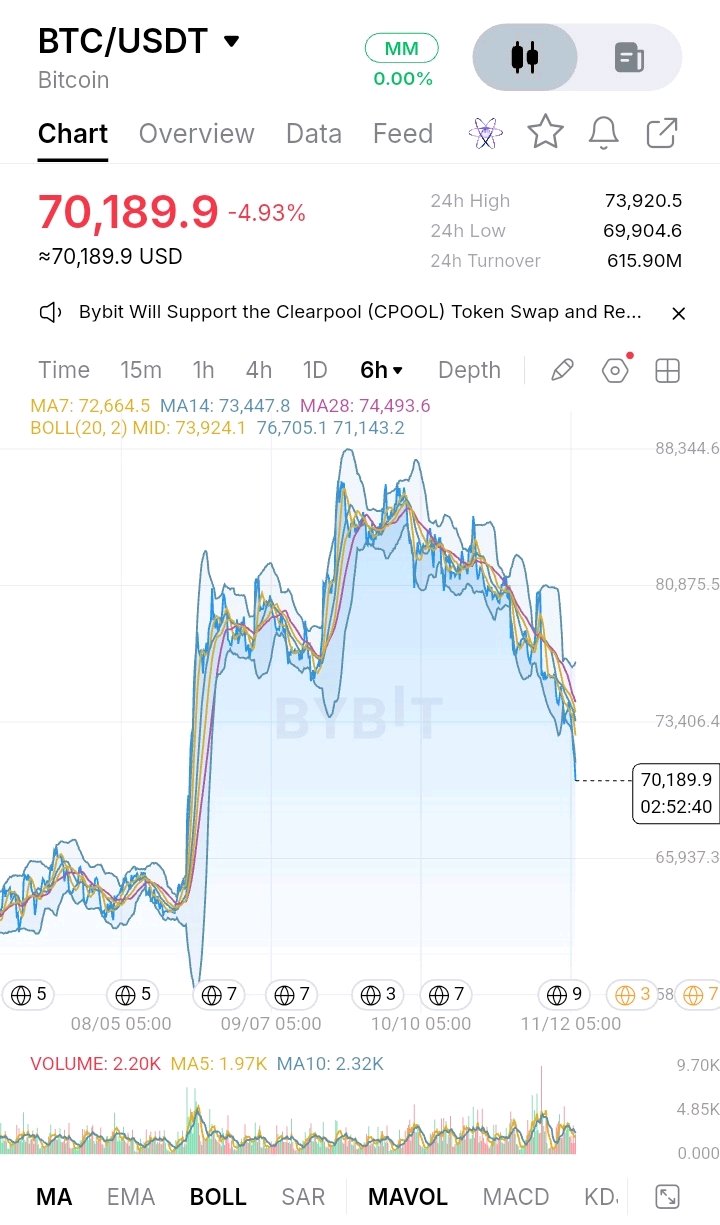
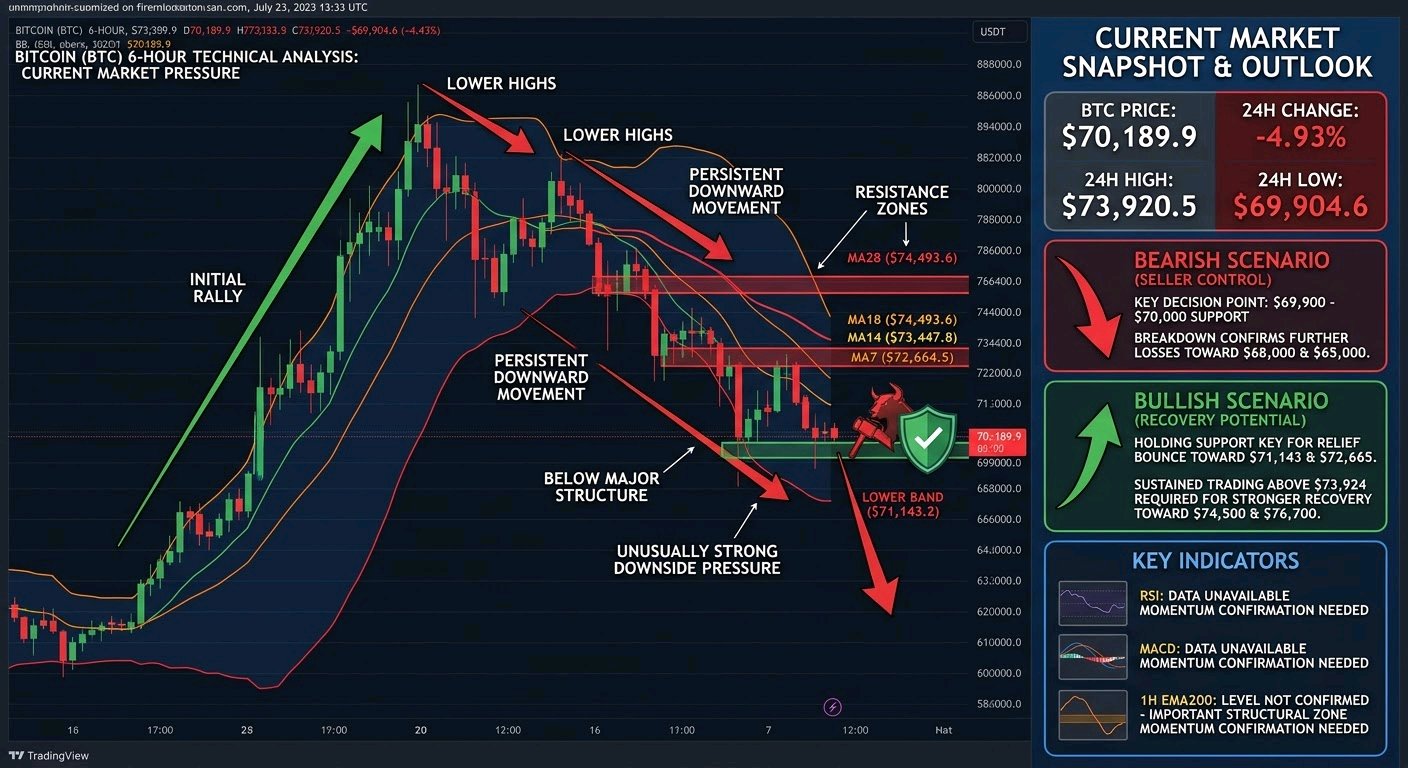
比特幣 ($BTCUSDT ) 正面臨強大的賣壓,目前價格在 70,189.9 美元附近徘徊,過去 24 小時下跌 4.93%。近期的跌勢已將 BTC 推離其先前的復甦區間,引發了買家是否能守住當前市場結構的疑慮。24 小時高點為 73,920.5 美元,低點則為 69,904.6 美元,顯示出顯著的波動性和日益增加的不確定性。 觀察 6 小時圖,比特幣先前曾從 6 萬美元低位區間強勁反彈,朝 87,000 美元至 88,000 美元區域邁進。然而,該復甦力道逐漸減弱,隨後出現低點下移與持續的下行趨勢。這顯示賣方目前正主導較廣的短期結構。最新的價格走勢也顯示 BTC 交易價格低於其主要移動平均線,表明看漲動能已大幅減弱。 移動平均線證實了此疲軟態勢。MA7 約在 72,664.5 美元,MA14 近 73,447.8 美元,MA28 則在 74,493.6 美元附近。這三條均線皆位於當前價格上方,形成了多個阻力區。布林通道(Bollinger Bands)的中軌在 73,924.1 美元附近,上軌約 76,705.1 美元,下軌則在 71,143.2 美元附近。BTC 跌破下軌顯示出異常強勁的下行壓力,儘管短期內仍有可能出現反彈。 截圖中未顯示 1 小時 EMA200 的數值,因此無法確認其確切水平。這仍是一個重要的結構性決策區:若能收復該點位將增強復甦潛力,反之若遭拒絕則可能加劇看跌動能。由於 RSI 和 MACD 數值也無法取得,動能確認仍需依賴額外的指標數據。 對買家而言,69,900 美元至 70,000 美元是當前的即時支撐區。若能守住此區,有望鼓勵價格反彈至 71,143 美元,隨後挑戰 72,665 美元。若要出現更強勁的復甦,則需要收復 73,448 美元至 73,924 美元區間。若能持續維持在此阻力集群上方交易,則可能開啟通往 74,500 美元甚至 76,700 美元的道路。 在看跌方面,若價格果斷跌破 69,900 美元,可能會使 BTC 進一步下探至 68,000 美元及 65,000 美元的心理關卡。賣方需要持續的下行壓力來確認下一波延續跌勢。 總體而言,在買家收復失守的移動平均線並確立更高的高點之前,比特幣的技術面依然疲軟。下一個主要走勢很可能取決於 70,000 美元是否能吸引足夠的買盤需求,或是賣方是否會強制引發另一次支撐位破位。在將任何反彈視為真正的趨勢逆轉之前,透過成交量和動能指標進行確認至關重要。 #IMPACTbyTrade
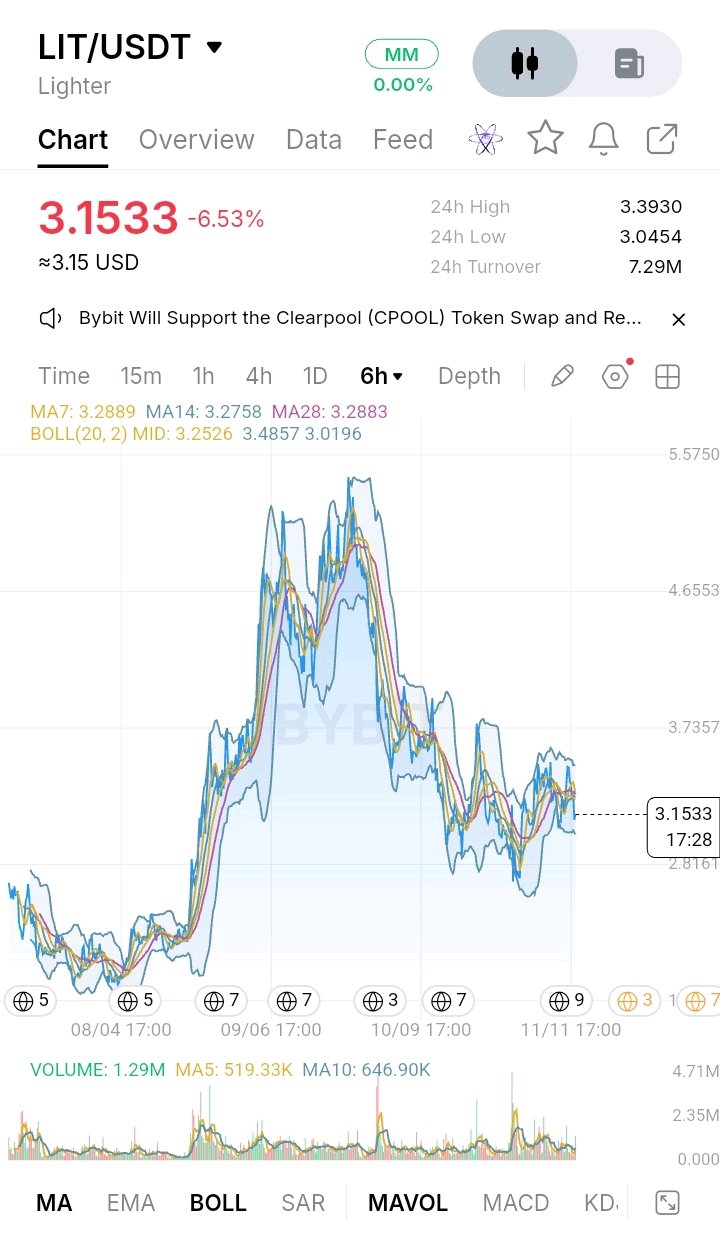
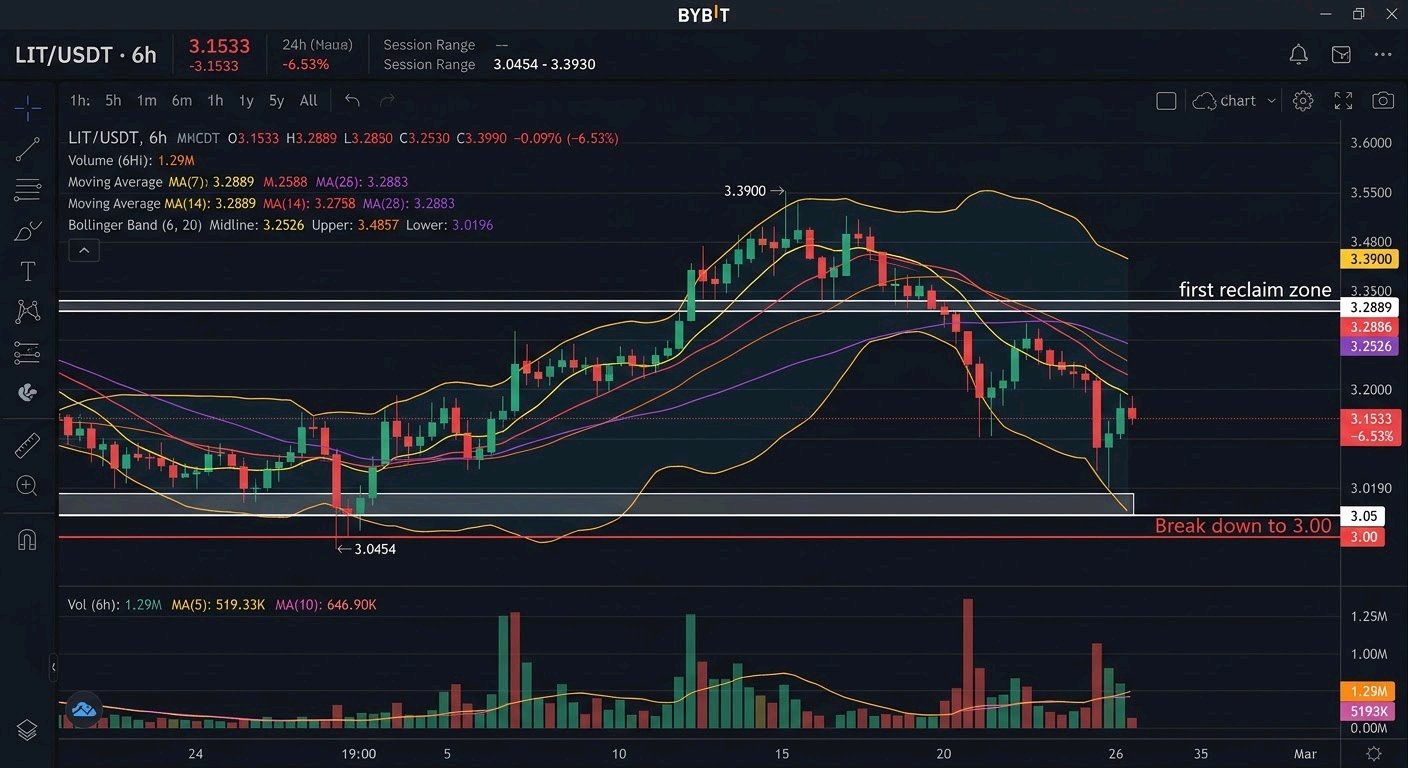
$LITUSDT is trading at 3.1533 USDT in the supplied Bybit snapshot, down 6.53% over 24 hours. The session range is 3.0454–3.3930, showing active trading and meaningful volatility. Price has pulled back from 3.39 and sits in the lower half of that range. On the six-hour chart, the broader structure remains corrective: LIT rallied sharply from its earlier base, peaked around 5.5 in September, and then formed lower highs and lower lows. Recent action looks like choppy stabilization after the decline, not a confirmed reversal. The six-hour moving averages reinforce this cautious reading. MA7 is 3.2889, MA14 is 3.2758 and MA28 is 3.2883, all above price and tightly clustered. This 3.28–3.29 area is the first reclaim zone: buyers need to recover it and hold it on a closing basis to show improving momentum. The Bollinger midline is 3.2526, also above price, while the upper and lower bands are 3.4857 and 3.0196. The lower band and 24-hour low place immediate support around 3.02–3.05. A decisive six-hour close below this area would expose the psychological 3.00 level and confirm continued seller control. The 1-hour EMA200 is not displayed, so its exact value cannot be verified and should not be guessed. It remains an important structural decision zone: reclaiming and holding above it would strengthen the recovery case, while rejection beneath it would leave rallies vulnerable. RSI and MACD readings are also absent, so there is no reliable basis to claim an oversold condition or bullish crossover. Visible evidence shows price below its short-term averages and Bollinger midpoint, consistent with near-term selling pressure. Six-hour volume is 1.29M, above MA5 at 519.33K and MA10 at 646.90K, indicating elevated participation, although volume alone does not reveal which side is dominant. For a bullish shift, LIT must defend 3.02–3.05, reclaim 3.25, and then close above 3.28–3.29 with stronger buying volume. That would open a test of 3.39, followed by the 3.48–3.49 upper-band region. A sustained break there would improve the structure and bring higher resistance into view; the September peak near 5.54 remains a major historical reference, not an immediate target. Conversely, rejection around 3.25–3.29 followed by a break below 3.0454 would favor another downward leg, with 3.00 the first psychological level to watch. Overall, LIT is at a decision point, not a confirmed bottom. Buyers must defend 3.02–3.05 and reclaim the moving-average cluster; sellers retain control while price stays below 3.28–3.29. A high-volume close outside this nearby range is the clearest trigger for the next directional move. #IMPACTbyTrade
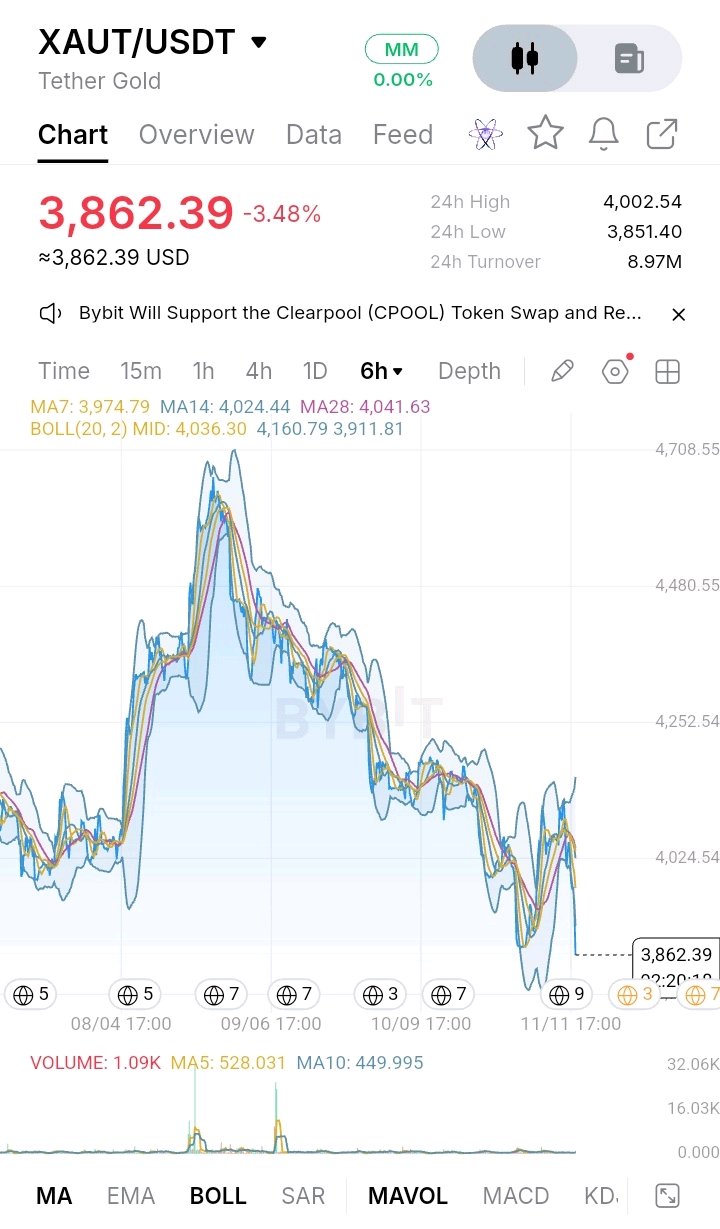
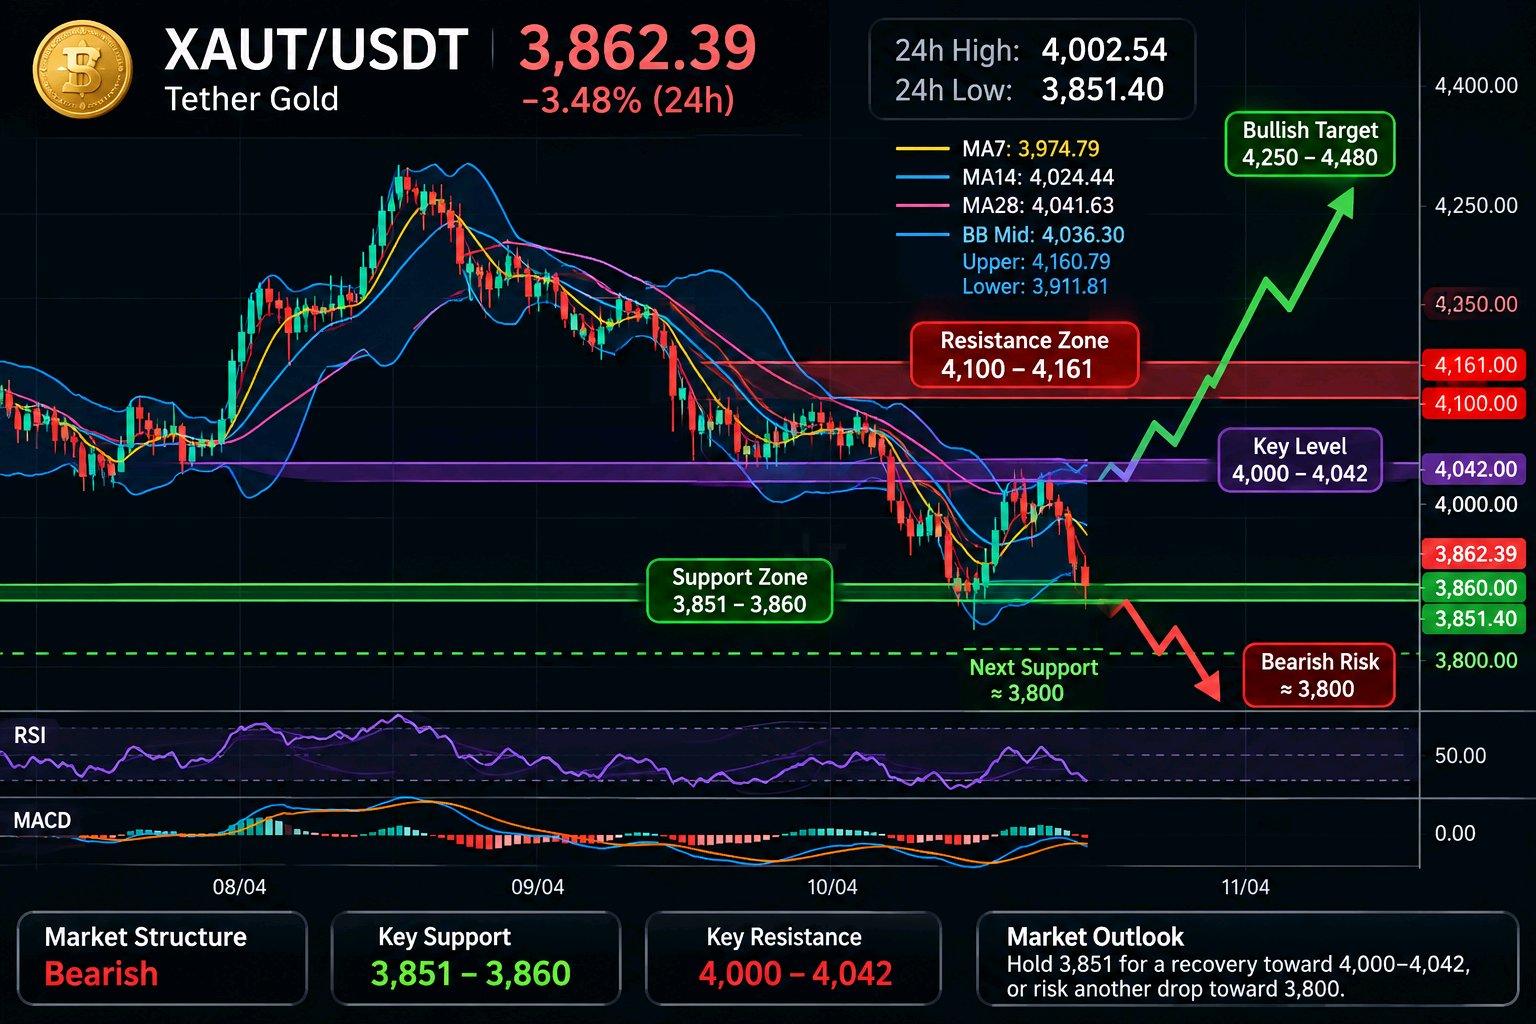
Tether Gold ($XAUTUSDT ) is trading at 3,862.39 USDT in the supplied Bybit snapshot, down 3.48% over 24 hours. The session range is 3,851.40–4,002.54, leaving price close to the daily low and showing that sellers have controlled the latest move. The 6-hour chart shows a broader decline from a visible swing peak near 4,700, followed by lower highs and lower lows. A sharp rebound from the recent trough failed to hold its recovery, and the latest drop back toward 3,860 signals that volatility remains elevated rather than a stable base having formed. The short-term structure is bearish. The displayed MA7 is 3,974.79, MA14 is 4,024.44 and MA28 is 4,041.63; price is below all three, while their clustering around 4,000–4,042 creates an immediate overhead supply zone. The Bollinger midline is 4,036.30, with the upper band at 4,160.79 and lower band at 3,911.81. Trading beneath the lower band suggests strong downside pressure and stretched conditions, but it does not by itself confirm a reversal. The chart does not show the 1-hour EMA200, RSI or MACD values, so their direction or readings cannot be verified. The 1H EMA200 should be treated as a major structural decision level once visible: reclaiming it would strengthen a recovery, while rejection beneath it would keep the broader bias defensive. Immediate support sits at 3,851–3,860, defined by the displayed 24-hour low and current price area. A decisive 6-hour close below this floor would expose the next psychological area around 3,800, with further weakness possible if selling accelerates. Buyers need to defend the low and produce a sustained higher low; a brief wick or intraday bounce is not enough. Above price, 3,912 is the first recovery test because it marks the lower Bollinger band. The 4,000–4,042 region is the key reclaim zone, combining the round-number level, short moving averages and Bollinger midline. A sustained close above it, followed by a successful retest, would be the first convincing sign that buyers are regaining control. If XAUT reclaims 4,042, resistance near 4,100 becomes the next upside test, followed by the upper Bollinger region around 4,161. A stronger continuation would need acceptance above these levels before the market can challenge prior swing supply around 4,250 and then the larger 4,480 area. Failure at 3,912 or rejection from 4,000–4,042 would favor another test of 3,851; losing that support would keep 3,800 in focus. For now, XAUT remains under clear selling pressure, with no confirmed momentum reversal visible in the supplied indicators. The next major move depends on whether buyers can defend 3,851 and reclaim 3,912, or sellers can force a 6-hour breakdown. Until price recovers the moving-average cluster, rallies are vulnerable to renewed selling. #IMPACTbyTrade