RISK AND RICHES
24526點贊18分享405粉絲264關注
Without risk a man is nothing
Without risk a man is nothing
當我打開 Bybit 看到 SPCXX 回升至 140 美元附近時,我的第一直覺是感到興奮。在看著這張圖表從 147.56 美元區域跌向 133.51 美元後,看到買家重新進場感覺就像是一個潛在的轉折點。 但經驗教會我要將興奮與證據區分開來。 以下是我注意到的重點:$SPCXXUSDT 目前交易價格為 139.35 美元,上漲 2.85%。在 1 小時圖上,價格已重回三條移動平均線之上:MA7 位於 139.31 美元,MA14 位於 138.98 美元,MA28 位於 137.74 美元。MACD 也呈正值,顯示短期動能正在改善。 然而,我還不敢稱這是一個確認的趨勢反轉。 140.53 美元的阻力位是即將面臨的考驗。若能伴隨更強的成交量果斷突破,可能會開啟通往更高水平的大門。若是遭遇拒絕,價格可能會跌回 138 美元甚至 137 美元。 我的策略是什麼?觀察確認訊號、管理風險,並避免追漲。 我經歷過足夠多的市場週期,深知復甦並不等於反轉。 #ByXIMPACT $DOGEUSDT


$QNTUSDT caught my attention after its sharp drop to $138.89. The rebound to $154.42 is significant, but I'm more interested in whether buyers can sustain the move. Here's what I'm watching: 1. TREND: Price has climbed above MA7 ($154.20), MA14 ($151.00), and MA28 ($149.14). Short-term momentum is improving. 2. RESISTANCE: The $156.88 area is the immediate obstacle. Breaking it convincingly could attract fresh buyers. 3. MOMENTUM: MACD is positive at 1.12, but volume has declined considerably. That's something I won't ignore. 4. RISK: Losing the $149–$151 support zone would make me question the recovery. My approach is simple: I won't chase QNT at $154.42. I'll wait for either a confirmed breakout above $156.88 or a controlled pullback that holds support. A recovery deserves attention, not blind trust. Trade the confirmation, not the excitement. #ByXIMPACT #WSOT2026 #WSOTShowYourAITradeToEarn10USDT
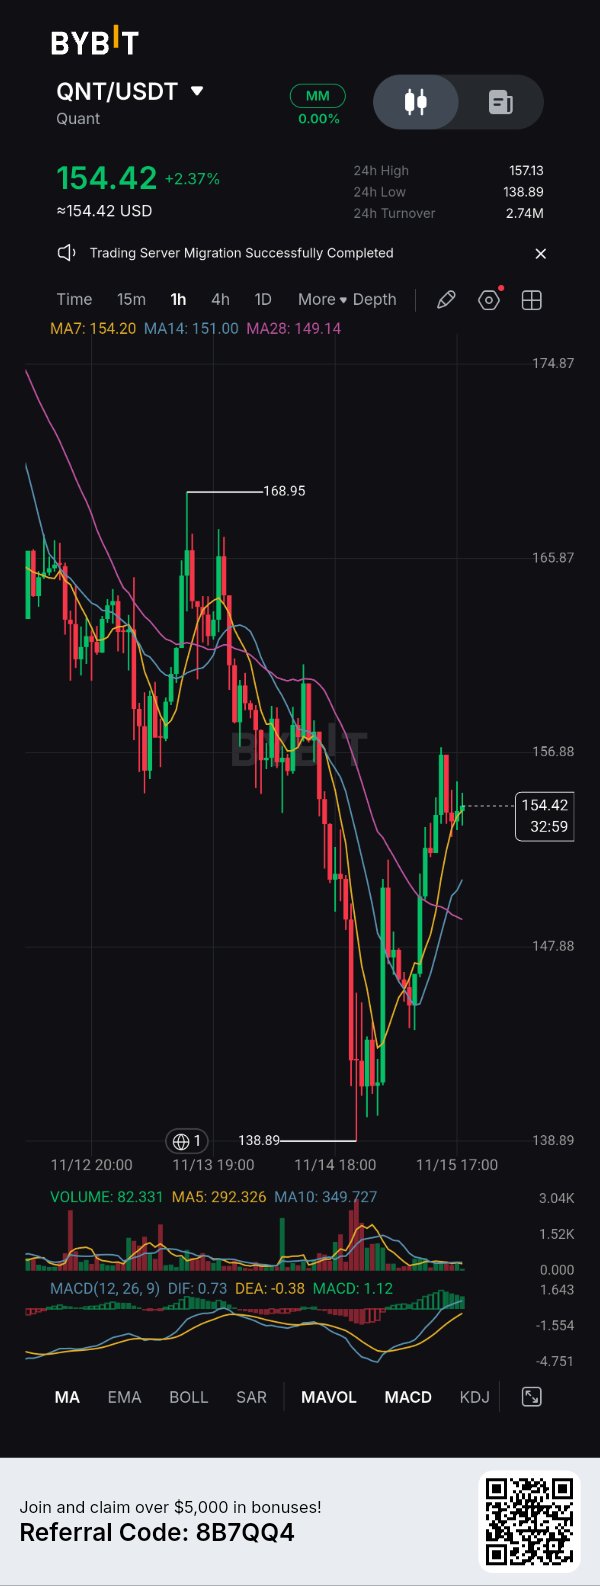
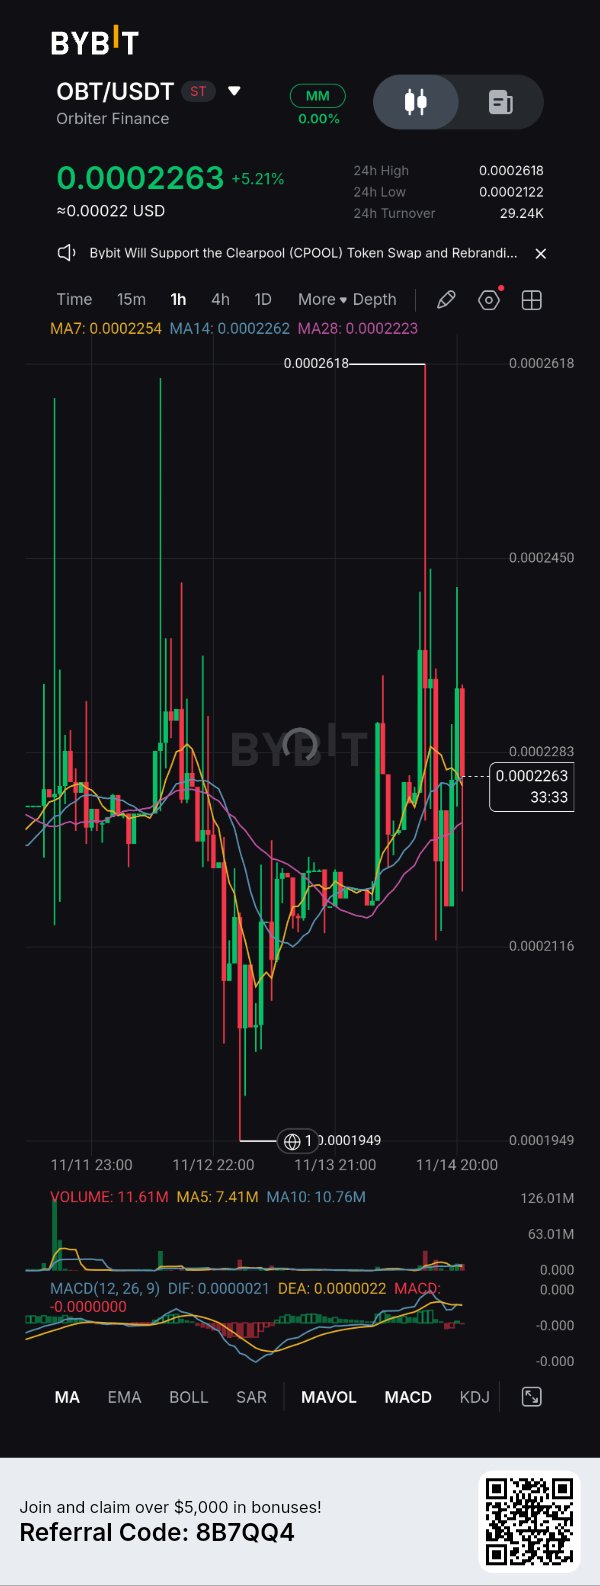
我在 2022 年的市場崩盤中學到了加密貨幣最昂貴的一課:如果風險管理做錯了,那麼看對代幣走勢也毫無意義。 看著利潤蒸發、倉位下跌,這教會了我永遠不會忘記的一件事:永遠不要讓信念成為忽視圖表的藉口。 這正是我今天對待 $OBTUSDT 的方式。 目前價格在 $0.0002263,OBT 顯示出復甦跡象,但我不會把 5.21% 的反彈誤認為是確定的突破。 以下是我在 1 小時圖上關注的重點: - 即時支撐位:$0.0002223–$0.0002254。 - 關鍵下行水平:$0.0002122。 - 主要阻力位:$0.0002283,隨後是 $0.0002450。 - 關鍵失效區(止損點):$0.0001949。 我的策略很簡單:等待確認信號、負責任地控制倉位大小,並在入場前就設定好出場點。 如果買方帶著令人信服的成交量收復阻力位,我會考慮看漲延續。如果支撐失敗,我不會與市場對抗。 我學到的是,保護資本也是一種交易勝利。 市場會讓你謙卑,但良好的風險管理能讓你留在場上。 #ByXIMPACT #WSOT2026
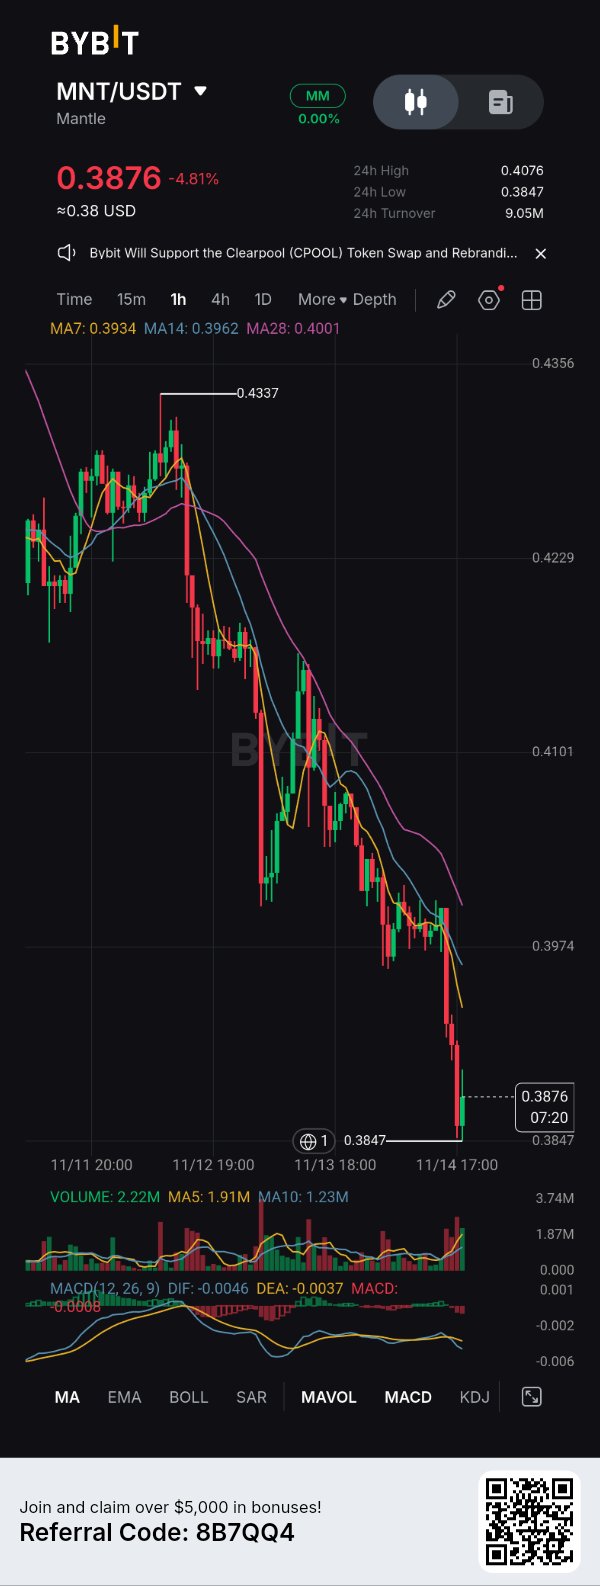
Everyone is either a maxi or a hater when it comes to $MNTUSDT . Both are wrong. I don't think Mantle deserves blind confidence, but I also don't think one ugly price movement tells the entire story. Here's where I stand. The bulls have a point: MNT is showing signs of buying interest around $0.3847, with volume reaching 2.22M. That suggests traders are still reacting to this support zone. But the bears aren't imagining things either. MNT currently trades at $0.3876, down 4.81%. More importantly, price sits below all three moving averages: MA7 ($0.3934), MA14 ($0.3962), and MA28 ($0.4001). MACD remains negative, confirming bearish momentum. My thesis? The short-term trend is bearish, but $0.3847 is the level I'm watching. A breakdown could invite further downside. A sustained recovery above $0.4001 would make me reconsider. I'm watching confirmation, not narratives. #ByXIMPACT$MNTUSDC
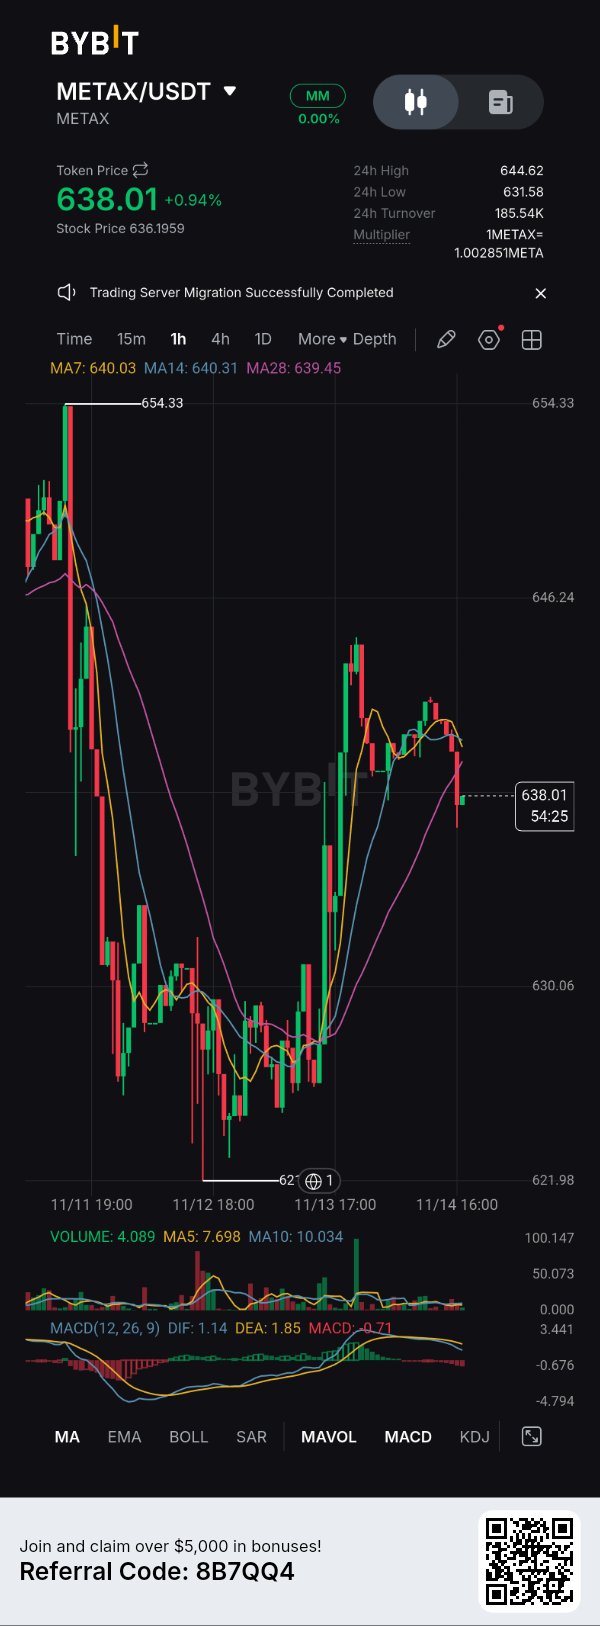
$METAXUSDT When I first looked at METAX, my thesis was that the recovery from its lower consolidation zone could develop into a stronger bullish move. That part played out. What I underestimated was how aggressively sellers would defend higher prices. The 1H chart now gives us an interesting picture. METAX recovered from approximately $621.98, rallied toward $654.33, and is currently trading around $638.01. That's a meaningful recovery, but the recent rejection shows buyers haven't fully secured control. I'm seeing another important detail: the 7, 14 and 28-period moving averages are clustered around $639–$640, while MACD has turned negative, suggesting short-term momentum is cooling. There's some satisfaction in seeing the recovery thesis materialize, but also humility in recognizing that timing and resistance matter just as much as direction. My current approach: I'm not adding at $638. I'm waiting for a convincing reclaim of $644.62 before considering additional exposure. A break below $631.58 would make me reassess the bullish setup. The market rewards updated thinking, not stubborn predictions. #ByXIMPACT #WSOT2026 $NVDAXUSDT
BR/USDT:我這一單完全看走眼了。
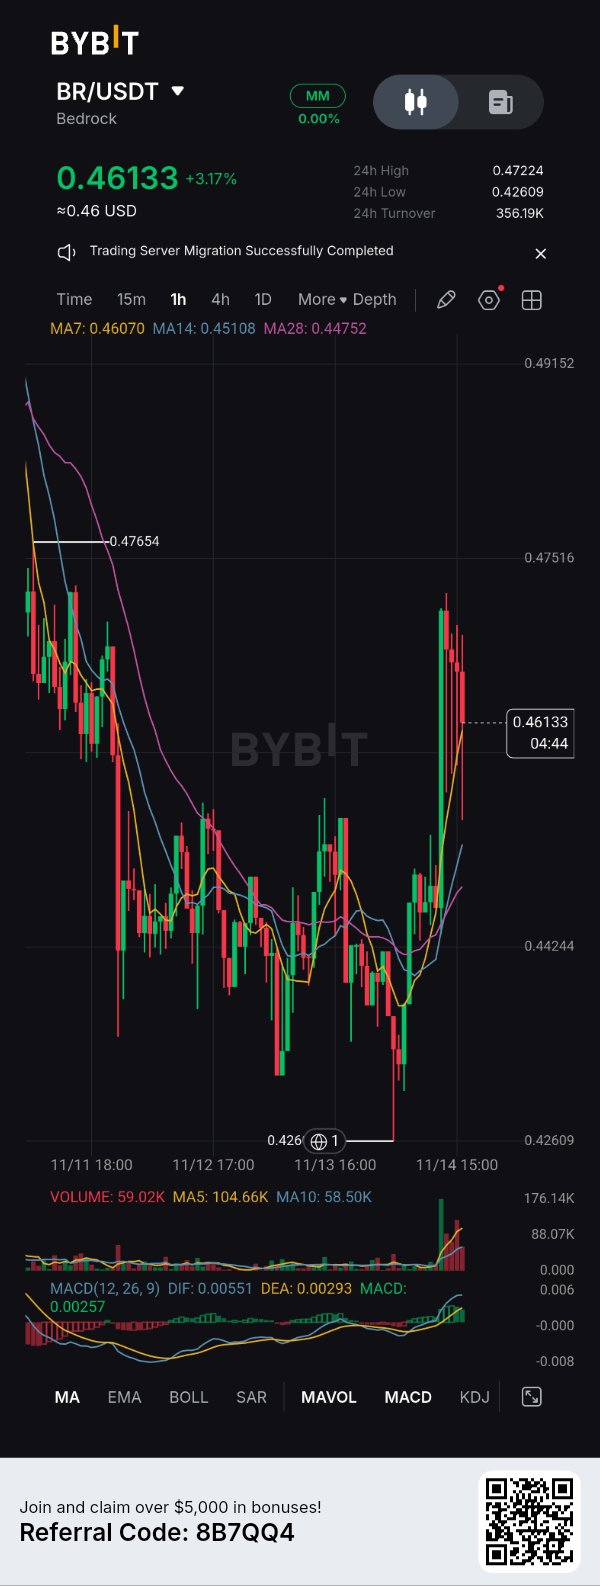
我以前一直認為 $BRUSDT 只是另一個炒作性質的代幣。每當我看到它受到關注,我的第一直覺就是找理由做空它。我以為這種熱度終究會消退。 但圖表迫使我重新思考。 在 1 小時的時間框架上,BR 從 $0.4424 附近的長期盤整中突破,並飆升至 $0.47224。引起我注意的不僅是價格走勢,還有隨突破而來的成交量激增。MACD 也轉為看漲,DIF 向上穿過了 DEA。 老實說,眼睜睜看著那波行情發生卻沒有持倉,真的令人沮喪。我花太多時間在堅持我最初的觀點,而不是去回應市場實際向我展示的東西。 我的偏見已經改變。現在,只要買方能守住突破結構,我就會關注其向 $0.4765 延續漲勢的可能性。如果 BR 在 1 小時收盤確認跌破 $0.4424,我的看漲論點就會失效。 我學到了重要的一課:市場不獎勵固執己見的人,它獎勵那些懂得何時修正觀點的交易者。 有時候,最大的交易錯誤並不是進場太晚,而是拒絕承認自己錯了。 #IMPACTbyTrade #WSOT2026 #WSOT曬出你的AI交易即可贏取10USDT $BERAUSDT

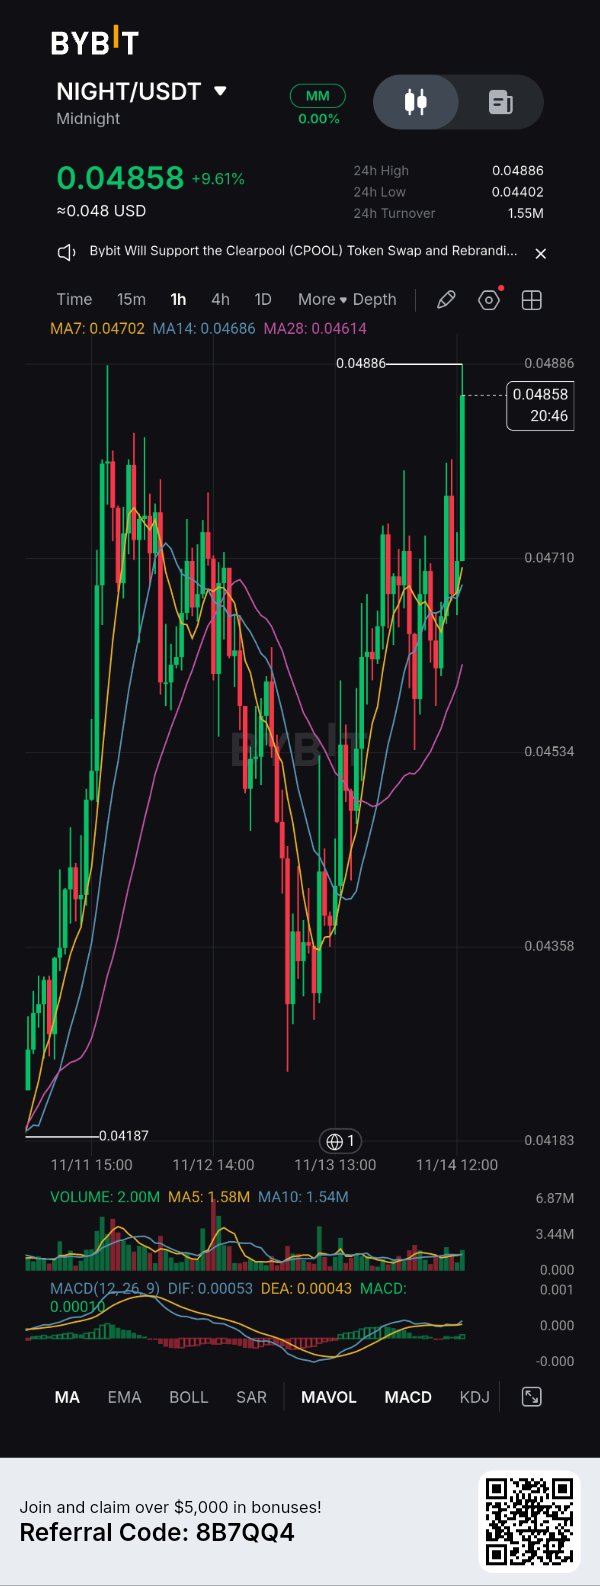
$NIGHTUSDT - I don’t shill often, but I’ve been quietly using Clearpool, and their rebrand to NIGHT on Bybit just hit my radar. If I could explain this token swap to my 2021 beginner self, I’d say it’s like your favorite restaurant changing its name but keeping the exact same chefs. Past me would have panic-sold the news and made the mistake of thinking a ticker change meant starting from zero. Honestly, I’m feeling a bit of frustration for missing the 0.04187 bottom, but pure excitement watching this breakout. My base case for the next few days is a test of new local highs. The 15m chart shows NIGHT up +9.61% at 0.04858, smashing through the 0.04886 resistance with volume confirming the move (2.00M vs the 1.58M MA5). My honest caveat? Token migrations can cause temporary liquidity confusion. My thesis is invalidated if we lose the MA7 support at 0.04702. Takeaway: Don't let past migration anxiety blind you to strong momentum. (NFA, always DYOR!) #ByXIMPACT
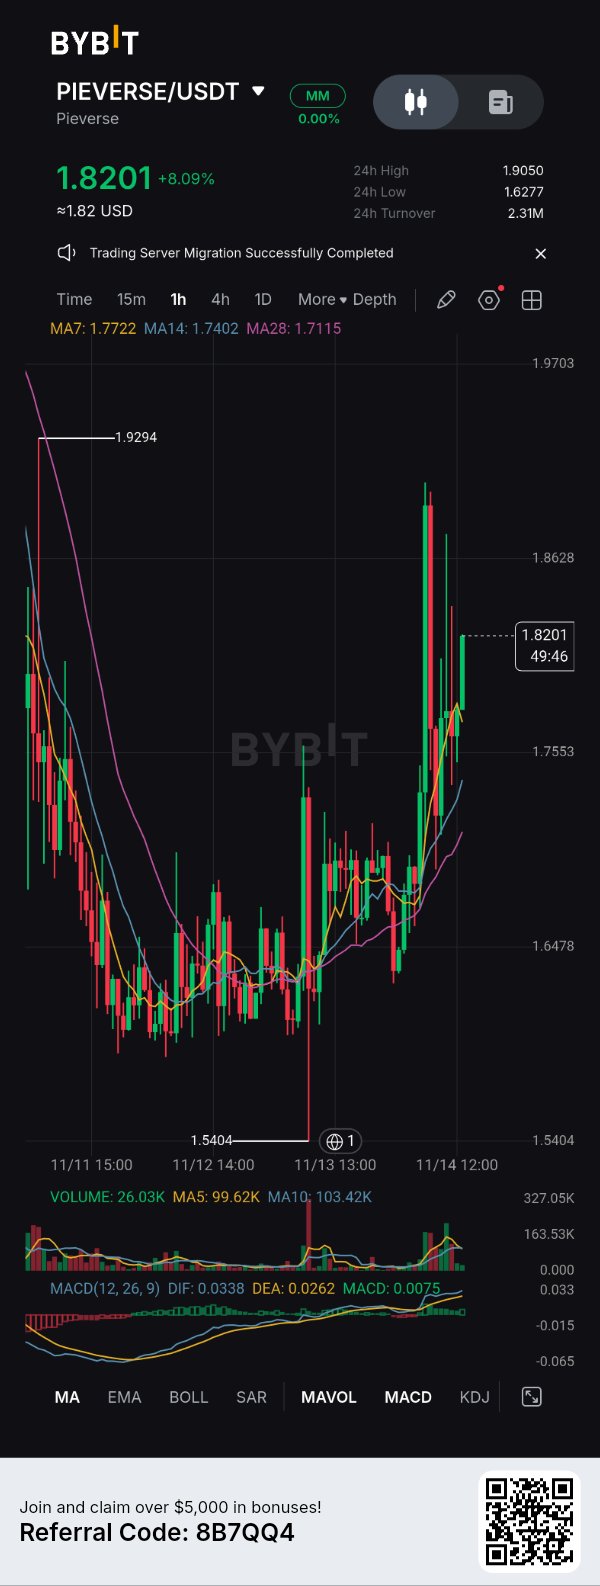
$PIEVERSEUSDT - 我進入加密貨幣領域不僅僅是為了追逐紅K線,或是每當代幣價格飆升就慶祝一番。 我在這裡是因為我相信金融機會,理解新興技術,並學習市場真正的運作方式。 但我有三個絕不妥協的價值觀: 1. 紀律勝過情緒。 我不會讓 FOMO(錯失恐懼症)驅使我進行交易。錯失機會總比盲目進場要好。 2. 知識勝過炒作。 我想了解我買的是什麼、市場為什麼波動、流動性在哪裡,以及什麼因素可能推翻我的投資論點。 3. 耐心勝過速成獲利。 並非每根K線都值得進場。有時,最明智的交易就是等待確認訊號。 我最大的底線是什麼? 我拒絕僅僅因為社群媒體上每個人都在喊某個代幣會「衝向月球」(to the moon)就拿錢去賭博。拒絕盲目進場。拒絕報復性交易。拒絕假裝每一次預測都會正確。 我為什麼在這裡? 因為我想透過知識、一致性和更完善的財務決策來建立一些有意義的東西。我知道這段旅程不可能總是一帆風順,但每一次經歷都應該讓我成為更好的市場參與者。 PIEVERSE 上漲 8% 很有趣,但一根紅K線並不能定義一個優秀的交易員。 我的目標不是抓住每一次飆升。 而是培養足夠的紀律,去識別優質機會,並在市場中存活夠久,直到能把握住這些機會。 我不為刺激而交易。我是有計畫地在交易。 市場不欠我獲利。我對自己的紀律負責。 #加密貨幣交易 #交易心理學 #Bybit #加密貨幣思維 #IMPACTbyTrade #WSOT2026 #WSOT曬出你的AI交易即可贏取10USDT
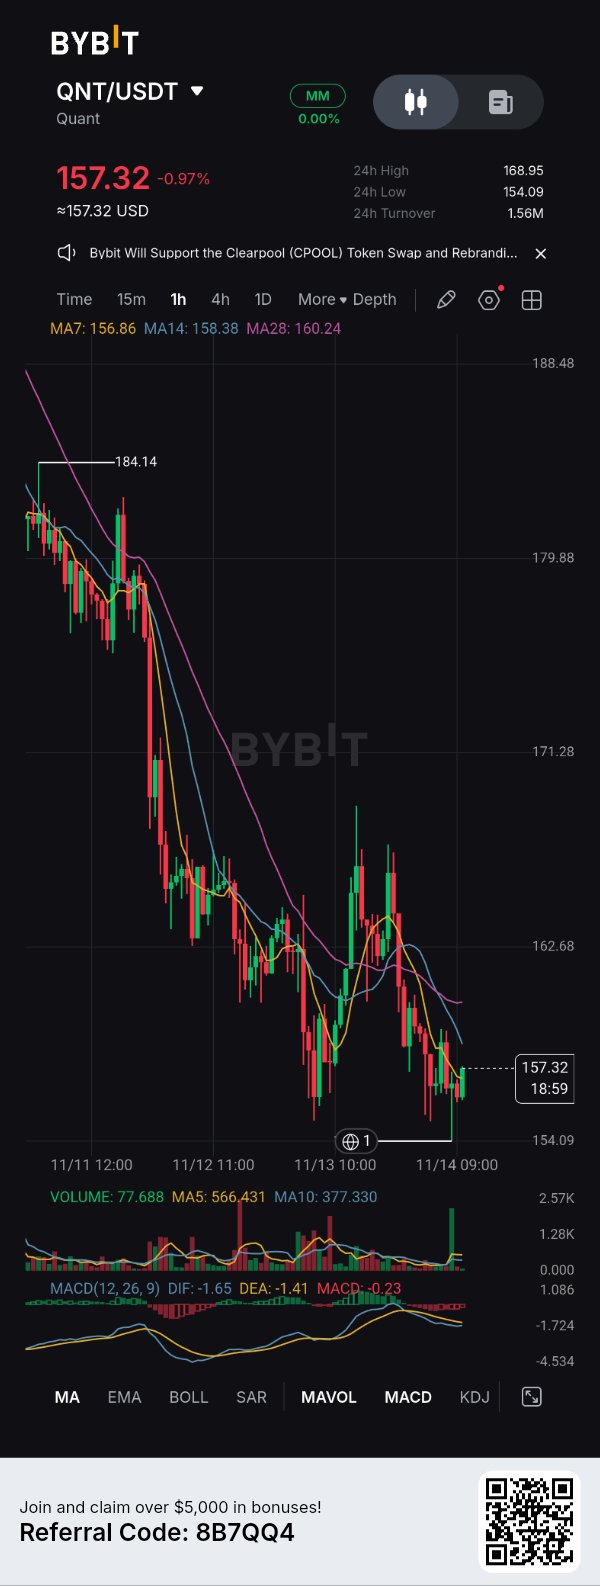
$QNTUSDT — A Conversation I Wish I Had With My Past Self. 🧠 Me in 2024: Why are you hesitating? QNT is already at $157.32. It has dropped significantly. This is obviously the perfect opportunity to buy the dip. The bounce is coming! Me now: That's exactly how I used to lose money. A falling price doesn't automatically mean a buying opportunity. Me in 2024: But look! It bounced from $154.09. Surely that's confirmation? Me now: Not yet. Look at the 1H chart. Price is still below MA14 ($158.38) and MA28 ($160.24). The broader structure remains bearish, and MACD is still negative. Me in 2024: So you're not buying? Me now: I'm watching. $154.09 is the immediate support I'm monitoring. If buyers defend it and price reclaims $158.38–$160.24 with convincing momentum, I'll reconsider a long position. If support breaks, I'll watch for further downside rather than trying to catch a falling knife. Me in 2024: You've become too cautious. Me now: No. I've become more disciplined. I no longer trade because I want the market to move in my direction. I trade when the market gives me evidence. THE ONE RULE I FOLLOW NOW: Never confuse a price drop with a trading opportunity. Let confirmation come before commitment. Sometimes the most profitable trade is the one you have the discipline not to take. #QNT #QNTUSDT #CryptoTrading #TradingPsychology #Bybit #ByXIMPACT

SUI —— 我放棄對抗趨勢的那一刻。📉
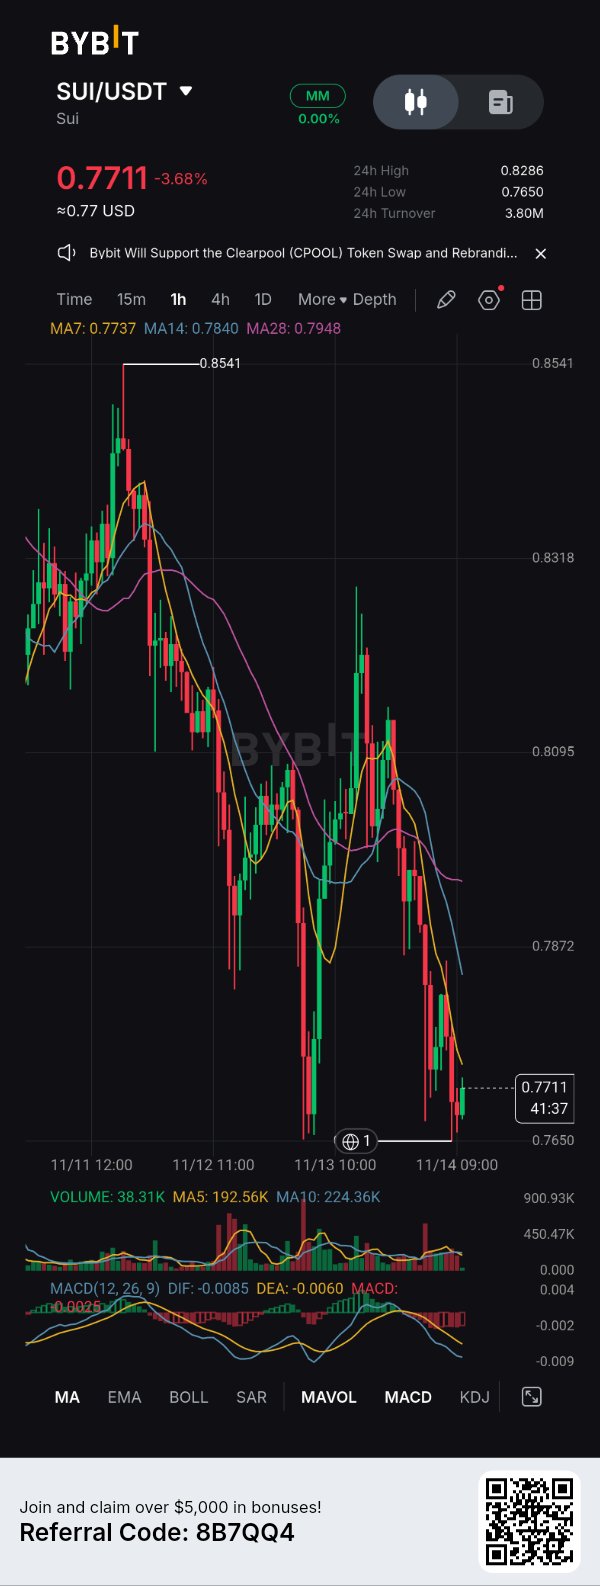
我曾經以為,每當某個幣種大幅下跌時,最好的時機就是在其他人還沒注意到反轉前「逢低買入」。 $SUIUSDT 最近提醒了我,為什麼這種想法可能會讓你付出慘痛代價。 觀察 1 小時線圖時,我注意到了一些重要的事。價格當時在 $0.7711 左右徘徊,從 $0.85 的區域跌下來後,跌幅為 3.68%。 但吸引我注意的不僅僅是下跌本身。 而是它的結構。 7、14 和 28 日移動平均線都位於價格上方,顯示賣方仍掌控局勢。MACD 指標也處於負值區域。 我的轉折點是什麼?看著 SUI 接近 $0.7650 的支撐區,卻沒有看到任何令人信服的看漲反轉跡象。 我確實很想預測反彈,但我提醒自己,便宜並不代表被低估。 這就是我目前看待 SUI 的方式: - 支撐位:$0.7650 - 即時阻力位:$0.7737–$0.7840 - 強勁阻力位:$0.7948 - 看漲確認:伴隨強勁買盤成交量收復阻力位。 - 看跌延續:明確跌破 $0.7650。 我在交易上改變了一件事:我不再僅僅因為價格看起來吸引人就入場。我會等待市場給我一個入場的理由。 我最大的教訓是:保護本金也是一種交易上的勝利。有時候,最聰明的交易就是你耐心等待的那一次。 你現在對 SUI 的操作策略是什麼——逢低買入還是等待確認? #ByXIMPACT #WSOT2026 #WSOT曬出你的AI交易即可贏取10USDT #黃仁勳離任考驗Nvidia的AI領導地位
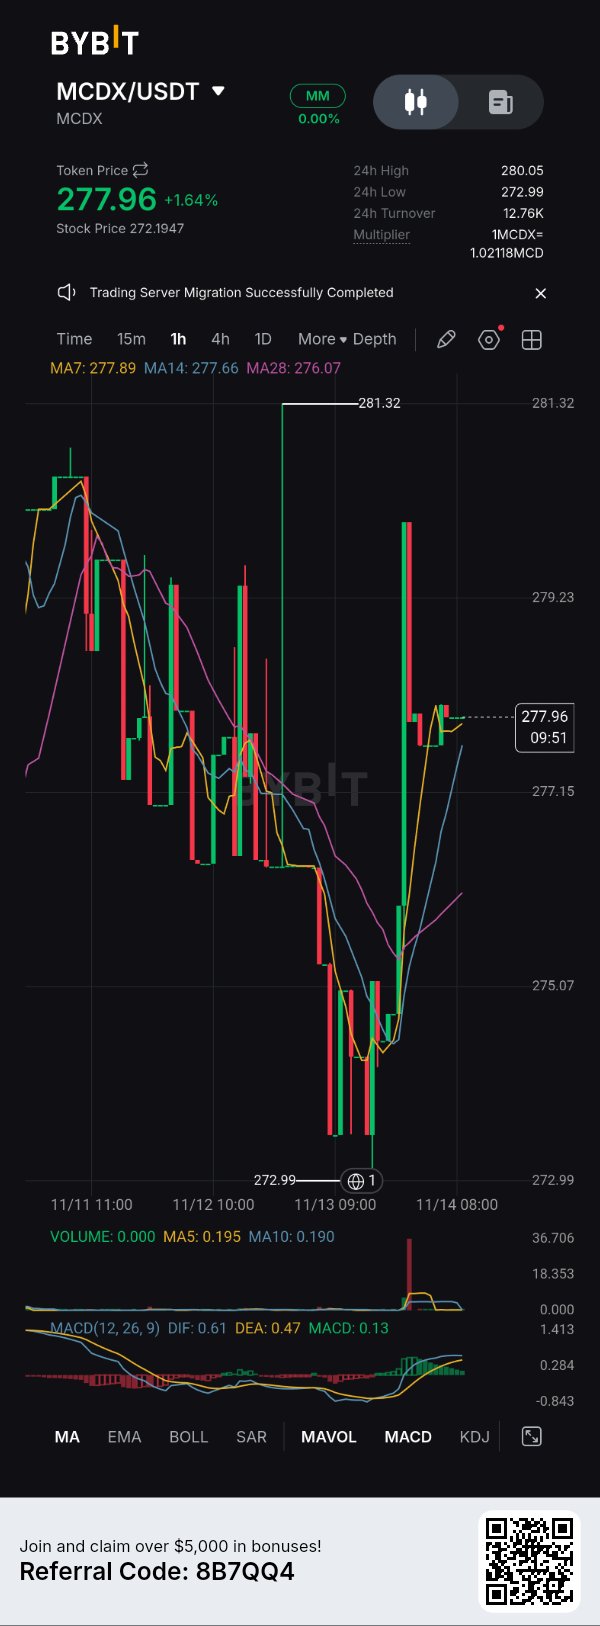
I used to believe that whenever a token printed a massive green candle after a heavy decline, it was confirmation that a bullish reversal had started. But watching $MCDXUSDT on the 1H chart reminded me why that assumption can be dangerous. Here's what I observed: 1. A sharp recovery isn't automatically a trend reversal. MCDX dropped towards $273 before recovering to $277.96. That's a strong bounce, but it doesn't automatically erase the previous selling pressure. 2. Volume needs context. A sudden volume spike can indicate aggressive buying, but traders still need to establish whether buyers can sustain that momentum. 3. Indicators need confirmation. The MACD has moved into positive territory, while the moving averages are beginning to recover. Encouraging signs, but not a guaranteed bullish continuation. The misconception: A big green candle tells you the market has reversed. The reality: It tells you that buying pressure has increased. Whether that pressure can sustain a new trend is a different question. My practical takeaway? I no longer chase a green candle simply because it looks impressive. I wait for confirmation, watch how price reacts around resistance, and pay attention to volume. Remember: A bounce is an opportunity to investigate, not an invitation to enter blindly. What's more dangerous in trading: missing a rally or entering a fake reversal? #ByXIMPACT $METAXUSDT #WSOT2026 #WSOTShowYourAITradeToEarn10USDT #JensenHuangExitTestsNvidiasAILeadership
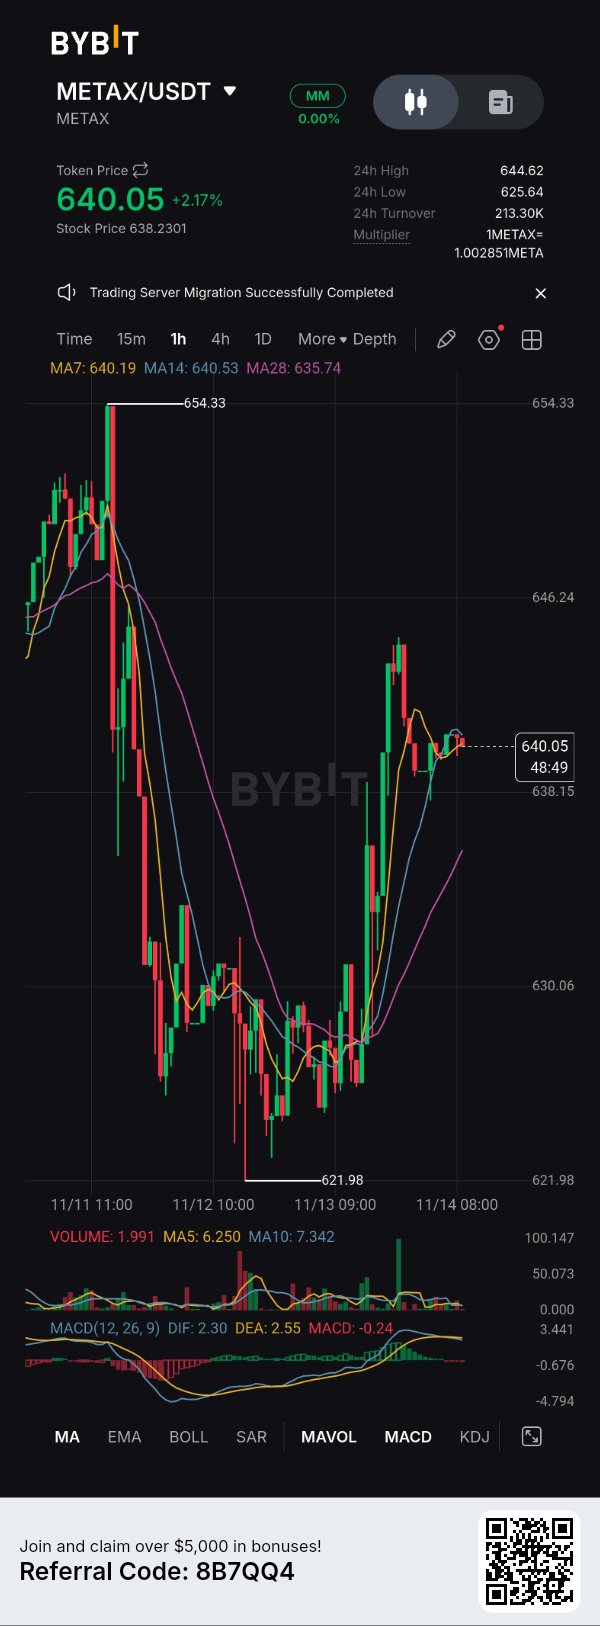
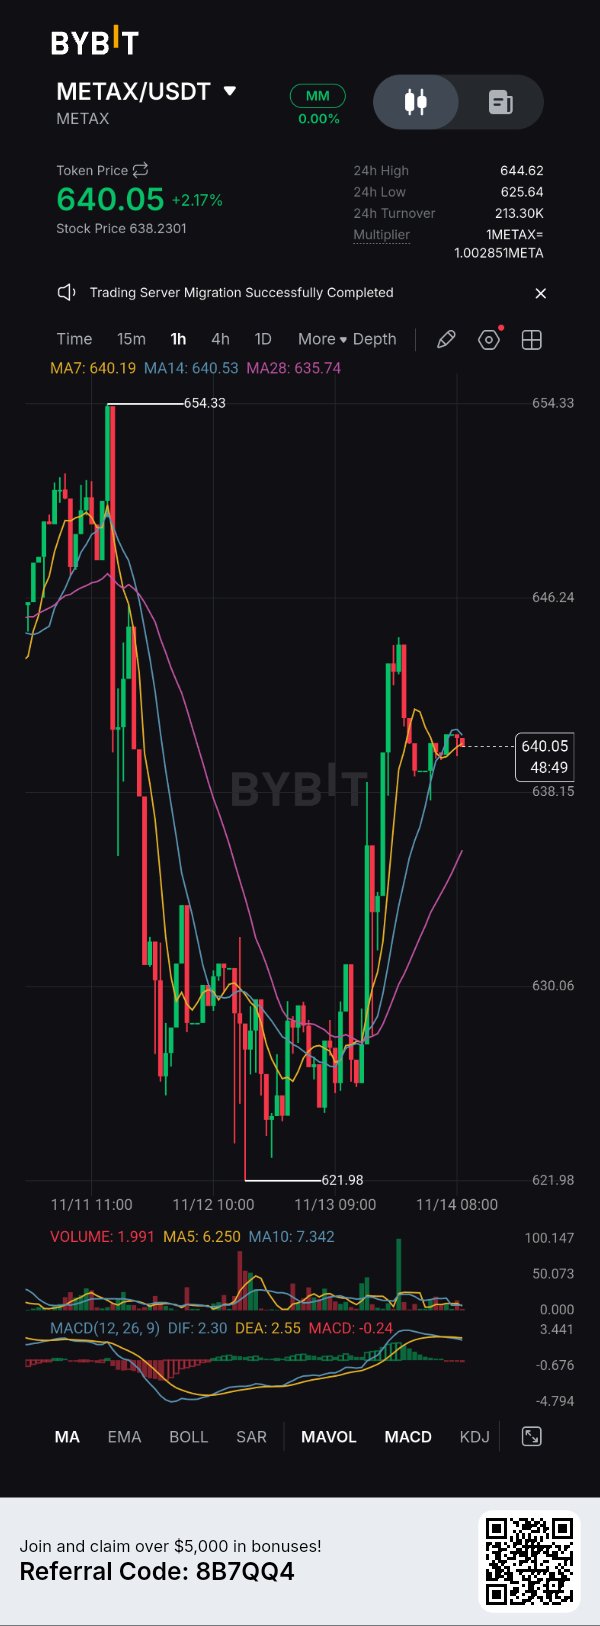
幣圈每個人都在盯著這個 $METAXUSDT 15 分鐘線圖,然後大喊著同一件事:「大家的共識是,從 621.98 強勢 V 型反彈回 640,證明多頭已經完全奪回控制權。這波下跌只是流動性掃蕩(liquidity sweep),我們正要重回 654!」 我在此要告訴各位,這種觀點只說對了一半。 沒錯,反彈確實很猛。但我的看法是,這是一個典型的「低高點」(lower-high)設置,目的是在下一波下跌前誘殺散戶多單。我們看到的是教科書級別的「多頭陷阱」,而不是趨勢反轉。 以下是我不看好這波漲勢的三個理由: 1. 移動平均線糾結(The MA Pinch):看看移動平均線。MA7 (640.19)、MA14 (640.53) 和 MA28 (635.74) 全都擠在一起,正好就在目前價格附近。這不是多頭動能,而是極度的猶豫不決和沈重的動態阻力。價格正掙扎著想要乾淨俐落地突破 MA14。 2. MACD 走勢疲軟:儘管價格大幅飆升,MACD (12, 26, 9) 卻完全平坦。DIF (2.30) 和 DEA (2.55) 呈現空頭排列,柱狀圖也維持在負值區。動能與價格走勢出現了負背離。 3. 市場結構:前一個區間高點是 654.33,近期低點是 621.98。目前反彈至 640,讓我們處於一個巨大的震盪區(chop zone)中間。這個「V 型」只是空頭在獲利了結;目前還沒有真正的結構性突破下降趨勢。 最強的反方論點: 為了站在反面觀點思考,從 621 上漲時的買入成交量其實並不弱。底部的成交量柱狀圖顯示出一些激進的綠色柱體,暗示有真實的現貨買盤在捍衛 620 水位。如果這種成交量持續累積,或許真能突破移動平均線的壓力。 什麼會讓我改變心意? 如果我們看到 15 分鐘線收盤確認站上 646.24 的阻力區,並伴隨 MACD 黃金交叉和成交量放大,我就會完全轉為看多並承認自己看錯。在此之前,我會持續在這些局部拉升中做空(scalping shorts)。 交易安全。別在震盪行情中被來回洗出場。 #IMPACTbyTrade

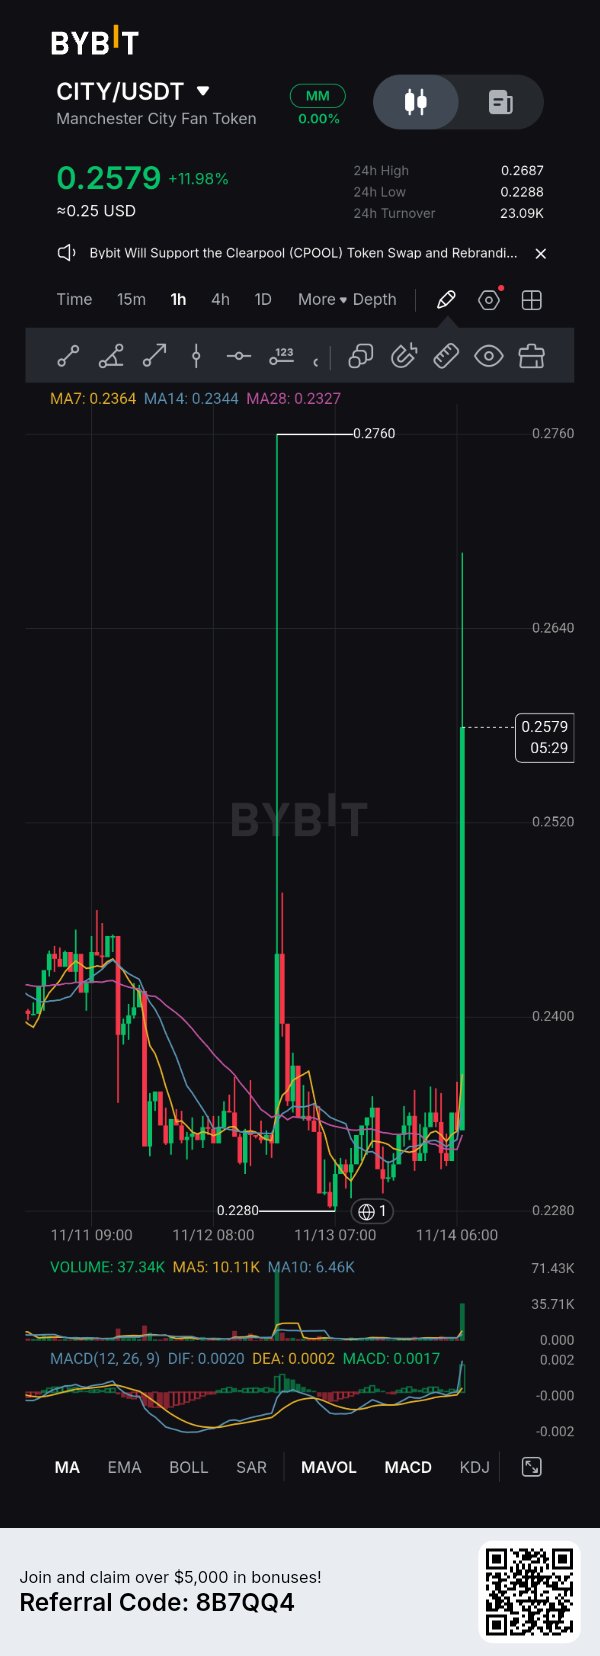
I've been paying closer attention to $CITYUSDT , and today's market activity gave me something interesting to work with. Here's what I'm seeing from the builder's perspective. 1. What I Shipped I completed another round of market observation around CITY/USDT, focusing on price behaviour, momentum, and trading activity. The numbers caught my attention: - Current price: $0.2579 - 24-hour gain: +11.98% - 24-hour high: $0.2687 - 24-hour low: $0.2288 That's a significant move after a period of relatively tight consolidation. 2. What Broke My biggest challenge was separating genuine momentum from short-lived excitement. CITY printed a massive bullish candle, but the upper wick approaching $0.2760 shows that buyers haven't had a completely smooth ride. A breakout is interesting. Sustaining it is the real challenge. 3. What I Learned One lesson stood out: volume matters. The displayed candle volume reached 37.34K, compared with a 5-period average of 10.11K. That's a substantial increase in activity. However, increased activity doesn't automatically guarantee continuation. I want to see whether buyers can defend the breakout rather than immediately surrendering the move. 4. What's Next? My next step is to monitor the $0.2520–$0.2400 region. If CITY holds above this area and builds acceptance, I'll be watching for another attempt towards $0.2687 and potentially $0.2760. If momentum fades, I'll reassess rather than force a bullish narrative. My biggest takeaway: Building conviction requires more than celebrating green candles. It means documenting what works, admitting what doesn't, and staying curious when the market challenges your assumptions. I'm still learning, still observing, and still building. The goal isn't to predict every move. It's to understand the market better with every move. What's your biggest concern with CITY right now: sustaining this breakout or overcoming the $0.2687 resistance? Market observations, not financial advice. #ByXIMPACT #WSOT2026 #WSOTShowYourAITradeToEarn10USDT #JensenHuangExitTestsNvidiasAILeadership #USPPITestsTheHigherForLongerTrade $GOOGLXUSDT
我不再對抗下跌趨勢了。原因如下。📉
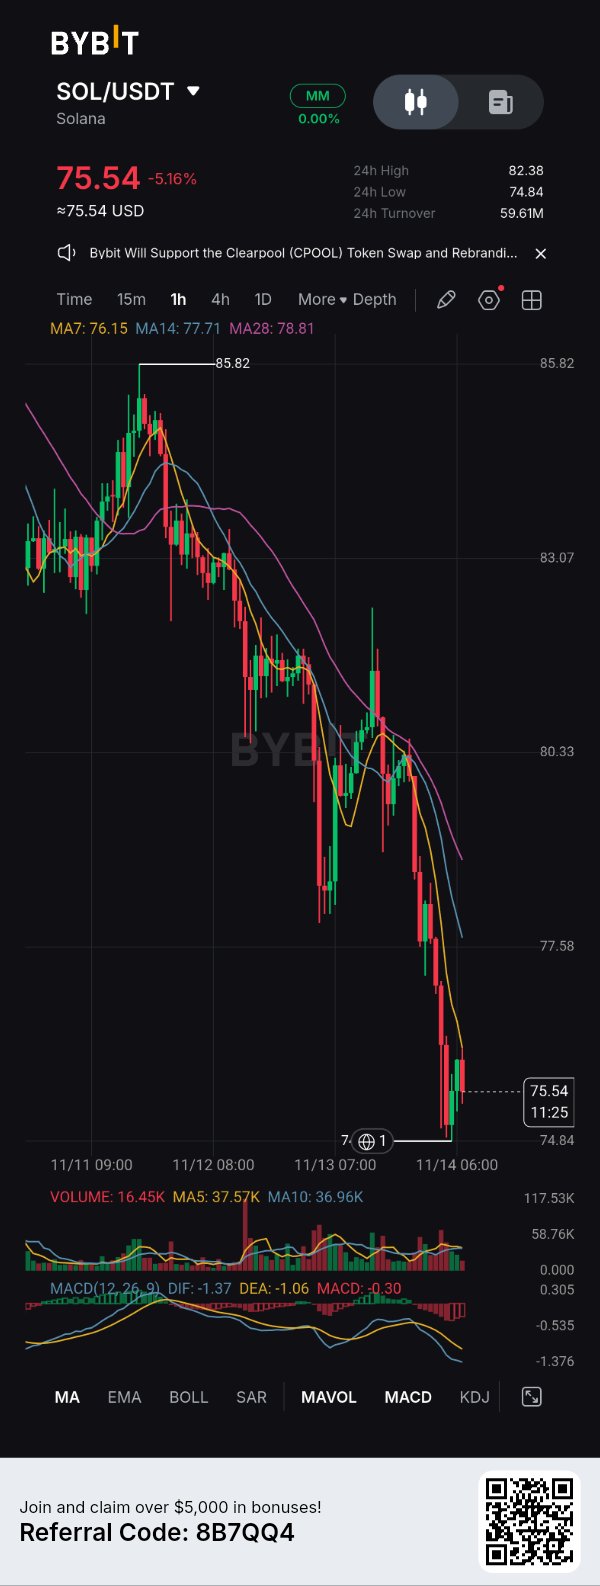
我一直在密切觀察 $SOLUSDT,有一點變得越來越難以忽視:賣方正在控制市場。 我的看跌論點並非基於單一根陰線,而是建立在更大的格局之上。 SOL 的交易價格為 75.54 美元,下跌了 5.16%,此前已從 85.82 美元的區域回落。1 小時線的結構持續出現更低的高點和更低的低點。 1. 我的市場論點 有三件事引起了我的注意: - 價格在 MA7 (76.15 美元)、MA14 (77.71 美元) 和 MA28 (78.81 美元) 之下運行。 - MACD 保持負值,確認了看跌動能。 - 77.58 美元區域在跌破後已成為一個重要的阻力區。 對我來說,目前還沒有足夠令人信服的理由去與賣方對抗。 2. 我的進出場邏輯 我傾向的方法是等待價格反彈至阻力位,再考慮建立空頭倉位。 - 潛在進場區間:76.15 美元 – 77.58 美元。 - 第一個下行目標:74.84 美元。 - 延伸目標:如果拋售壓力持續,則目標在 74.84 美元下方。 - 失效點:有效突破 78.81 美元上方。 這些是計劃好的點位,並非已確認成交的訂單。 3. 佈局時的心態 老實說,看著 SOL 如此激進地下跌,很容易讓人產生追空的衝動。 但我提醒自己,錯過進場機會總比在跌勢末端情緒化進場要好。 4. 我會重複的操作 我會繼續保持耐心,專注於市場結構,並堅持等待價格接近阻力位,而不是盲目追逐陰線。 5. 我低估的風險 突然的反彈行情。 在經歷如此激進的下跌後,空頭部位可能會變得過於擁擠。強勁的反彈可能會在看跌趨勢恢復前軋空那些進場較晚的賣方。 我的心得:市場不會獎勵急躁。有時最好的交易決策是等待價格來到你的預期點位,而不是追逐它已經走過的地方。 在交易突破行情時,你認為什麼更重要:動能確認還是回測阻力? 這是我的個人交易日記,不構成財務建議。 #ByXIMPACT $SOLUSDC

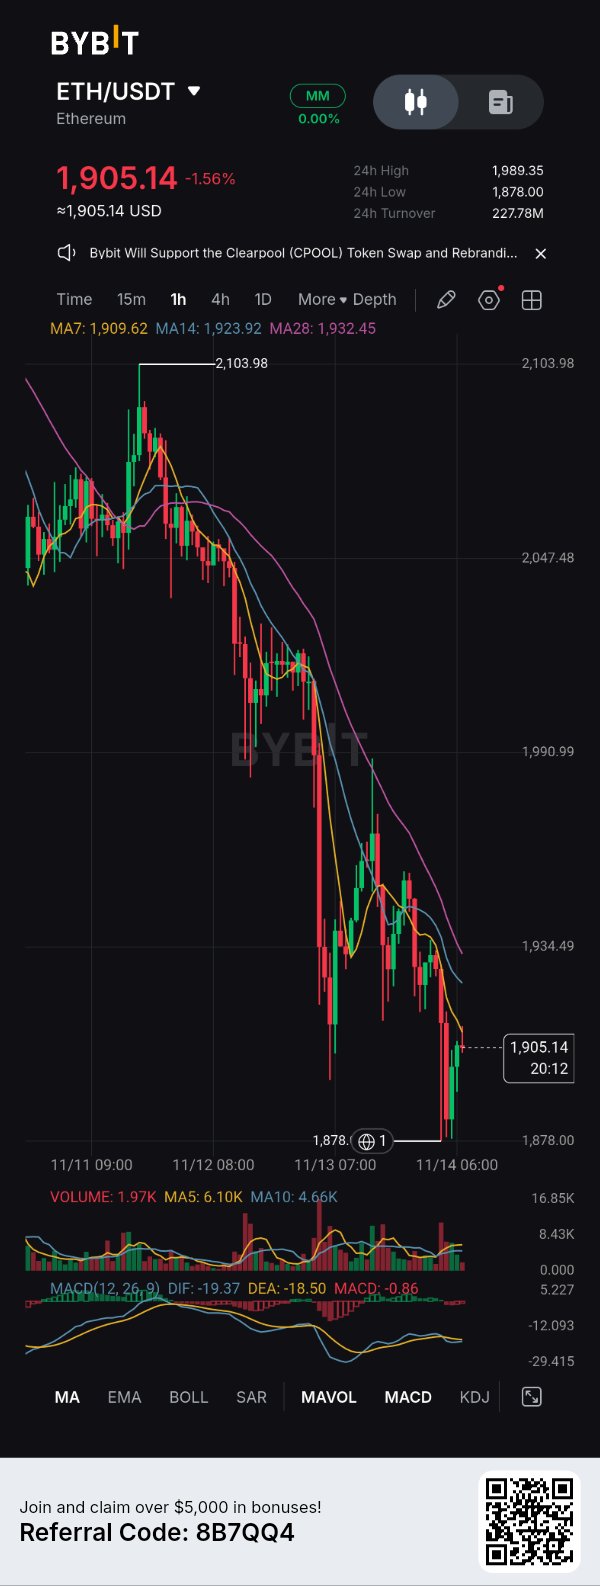
I initially thought $ETHUSDT had enough strength to defend the $1,930 region and attempt another recovery. I expected buyers to step in and turn the pullback into a continuation move. But the market had a different plan. Looking at the current ETH/USDT structure, a few things changed my mind: 1. The trend is still bearish: ETH is trading around $1,905, below MA7 ($1,909), MA14 ($1,923) and MA28 ($1,932). That's not the recovery structure I was expecting. 2. Sellers remain in control: The chart continues printing lower highs and lower lows. Previous recovery attempts have struggled to produce meaningful upside momentum. 3. $1,878 is the level I'm watching: This is the recent swing low. A decisive breakdown could expose ETH to another leg down. 4. MACD isn't convincing yet: Momentum remains negative, so I'm not rushing to call this a bullish reversal. I'll be watching two scenarios: - Bullish: ETH reclaims $1,923–$1,934 and establishes support above that zone. - Bearish: ETH loses $1,878, opening the possibility of further downside. Honestly, there's a certain frustration in watching a setup you believed in fail. But I'd rather admit I'm wrong than defend a bias the market has already invalidated. My biggest lesson: Never become emotionally attached to a direction. Let price action prove your analysis, and when the evidence changes, change your position. The market doesn't reward stubbornness. It rewards discipline. What's your current ETH bias: recovery or another breakdown? 👇 #ByXIMPACT
$BTCUSDT 跌破 67,000 美元,超過 13 億美元的多頭倉位遭清算,但短期持有者仍堅持「守住防線」 根據 Bybit 市場數據,BTC 目前價格為 67,241.5 USDT,24 小時內下跌 1.47%,盤中低點觸及 66,448.6。從 74,822.9 的高點計算,此波回調幅度已超過 11%。 📉 新聞推手:四重壓力疊加 此次下跌並非由單一因素驅動。在過去 24 小時內,約有 13 億美元的加密貨幣多頭倉位被強制清算,引發連鎖拋售。同時,機構資金正在撤退——貝萊德(BlackRock)的 IBIT 在截至週三的連續九個交易日內淨流出超過 20 億美元,僅在 11 月 13 日當天,IBIT 就流失了 1.435 億美元,而富達(Fidelity)的 FBTC 則流出了 4,190 萬美元。在宏觀層面上,高於預期的 CPI 數據強化了市場對聯準會可能再次升息的預期,加上輝達(Nvidia)在執行長辭職傳聞後股價大跌,削弱了科技股和加密貨幣領域的風險偏好。 📊 技術面:關鍵支撐位正受到考驗 在圖表上,BTC 已跌破數月來的 73,000–75,000 美元支撐區間,目前正在 67,000 美元附近掙扎。根據 21Shares 策略師 Matt Mena 的分析,持續跌破 69,000 美元將為測試 65,000 美元的支撐位打開大門。向上看,重回 70,000 美元將是復甦的第一步,但要實現持續反彈,必須站上 74,000 美元。動能指標顯示市場處於超賣狀態,但 MACD 死叉依然存在,賣壓尚未解除。 🔍 值得關注的細節 儘管出現了劇烈拋售,但 73,000–86,000 美元區間內由短期持有者持有的 148 萬枚 BTC 僅淨減少了 34,000 枚(約 2.3%),顯示多數人並未恐慌性拋售。買盤吸籌主要集中在 68,000 美元附近,約有 42,200 枚 BTC 被加倉。如果 65,000–66,000 美元的支撐位能夠守住,這些頑強持有的籌碼可能會成為後續反彈的基礎;反之,若明確跌破 65,000 美元,可能會迫使這些「鑽石手」投降,引發新一波連鎖清算潮。 ⚡ 關鍵關注點 接下來需觀察兩件事:ETF 資金流向能否轉正,以及 65,000 美元攻防戰的結果。在機構買盤明確回歸之前,請將任何反彈視為修復性反彈,而非趨勢逆轉。 ⚠️ 以上內容僅為個人市場觀察,不構成投資建議。槓桿是雙刃劍——倉位管理應永遠優先於方向判斷。 #ByXIMPACT $BTCUSDC

$LTCUSDT 正在復甦,但我還沒準備好要買入這次的反彈。原因如下。 我學到了一件關於交易的重要事情:並非每一根綠色蠟燭都值得我投入資金。 LTC 從 $47.71 的區域回升,目前交易價格約在 $48.80。這令人鼓舞,但當我觀察 1 小時線圖時,我看到的市場並未完全說服我買方已重新掌握控制權。 而且我不會假裝不是這樣。 🔍 我在圖表上看到的內容 LTC/USDT — 1H 當前價格:$48.80 24 小時漲跌幅:+1.08% 24 小時最高:$50.11 24 小時最低:$47.87 我的移動平均線讀數: - MA7:$49.03 - MA14:$49.27 - MA28:$49.12 我的擔憂如下: 價格低於這三條移動平均線。 這意味著復甦即將接近阻力區,賣方可能會再次活躍起來。 在考慮進行嚴肅的看漲佈局之前,我希望買方能先收復這個區域。 ⚠️ 為什麼我還沒被說服 我的 MACD 讀數為: - DIF:-0.15 - DEA:-0.08 - Histogram:-0.07 動能仍然是負面的。 成交量也相對平淡: - 當前成交量:1.26K - MA5:2.01K - MA10:1.99K 對我來說,這不足以支持我去追逐這次的反彈。 我想要的是更強勁的參與度,而不僅僅是另一次短暫的反彈。 🎯 我的交易規劃如下 我正在關注兩個可能的機會。 🔴 我的第一個計畫:做空拒絕點 如果 LTC 上漲至 $49.03–$49.27 區間並遭到拒絕,我會考慮做空。 $LTCUSDC 潛在進場點 (EP):$49.05–$49.25 止損 (SL):$49.75 止盈 1 (TP1):$48.30 止盈 2 (TP2):$47.87 我希望在進場前看到實際的看跌反應。 🟢 我的第二個計畫:買入確認後的復甦 我並沒有排除看漲的可能性。 如果 LTC 收復 $49.27 並在更大成交量的配合下成功回測該水平,我會重新評估我的看跌觀點。 潛在進場點 (EP):$49.30–$49.40 止損 (SL):$48.85 止盈 1 (TP1):$49.72 止盈 2 (TP2):$50.11 如果上述兩種設定都沒有得到確認,我就會保持觀望。 🧠 什麼會讓我改變主意? 如果 1 小時線收盤價強勢突破移動平均線密集區,隨後成功回測,我會更有興趣買入。 但如果賣方再次防守住該區域,我會尊重這種疲軟走勢。 我不需要預測每一次波動。我只需要在市場出現機會時認出它即可。 我的最終立場 在 LTC 證明自己之前,我持謹慎看跌態度。 $49.03–$49.27 區域是我的決策區。 我寧願等待確認,也不願成為另一個在短暫復甦高點接盤的交易者。 🔥 問大家一個問題: 如果你現在在交易 LTC,你會選擇在移動平均線阻力處做空,還是等到價格確認收復 $49.27 後再買入? #LTC #LTCUSDT #Litecoin #Bybit #CryptoTrading #TradingStrategy #ByXIMPACT #WSOT2026 #WSOT曬出你的AI交易即可贏取10USDT #黃仁勳離任考驗Nvidia的AI領導地位

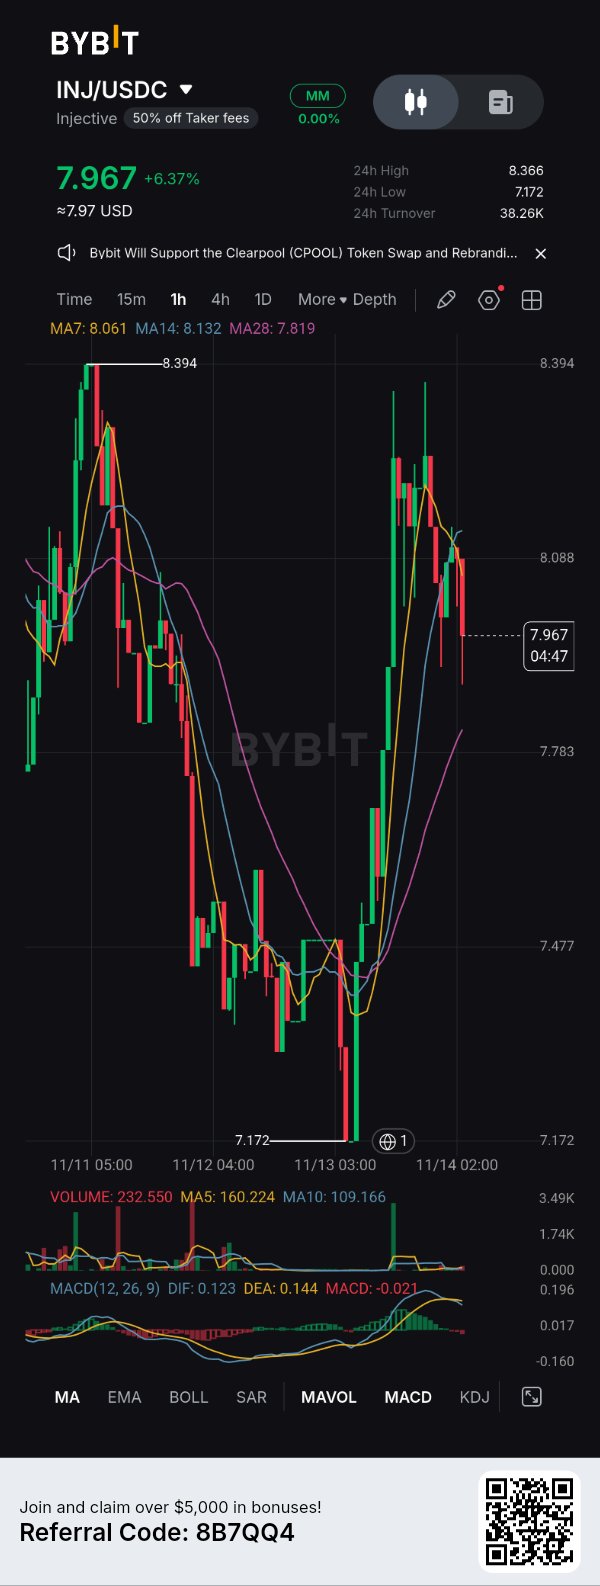
如果你在 7.172 的絕對底部買入 $INJUSDT,恭喜你。如果你現在盯著圖表,正考慮追高買入綠色蠟燭,那你就是流動性(韭菜)。 INJ 剛剛走出了一個激烈的 V 型反轉,直接從 7.172 衝到了 8.10。但仔細看看 1 小時圖:音樂剛停了。 以下是短期動能正在減弱的原因: 🔻 拒絕(Rejection):價格衝擊 8.10–8.13 區域(MA14)後立即遭到拒絕,相對於 8.394 的波段高點,形成了一個更低的高點。 🔻 MACD 翻轉:MACD 線已經向下交叉,柱狀圖也開始出現紅色條形。激進的買盤壓力正在枯竭。 🔻 MA 跌破:價格目前交易於 7 MA 和 14 MA 下方,正在緩慢下跌以測試更深層的支撐。 這並不一定意味著牛市結束了。但這意味著這一波多頭行情的輕鬆利潤已經被賺走了。現在,我們等待市場亮出底牌。 兩種情境(選邊站): 🟢 看漲回測(更高低點): 如果這真的是趨勢反轉,買家將會在 7.81–7.85 區域(MA28)介入。如果我們在那裡看到 1 小時級別的看漲拒絕蠟燭,這將提供一個絕佳的風險回報比,適合做多以再次衝擊 8.10。 🔴 看跌崩盤(死貓跳): 如果 7.75 的支撐崩塌,意味著 V 型反彈僅僅是為了誘捕遲到多頭的流動性陷阱。這裡的跌破將指向下方 7.47 的前一個盤整區。 總結: 不要 FOMO 一個動能已經在減弱的 1 小時圖表。讓價格回到結構支撐位。等待 MA28 回測或跌破信號來確認你的入場點。 你是打算逢低買入以博取更高低點,還是等跌破 7.75 後放空?👇 #ByXIMPACT
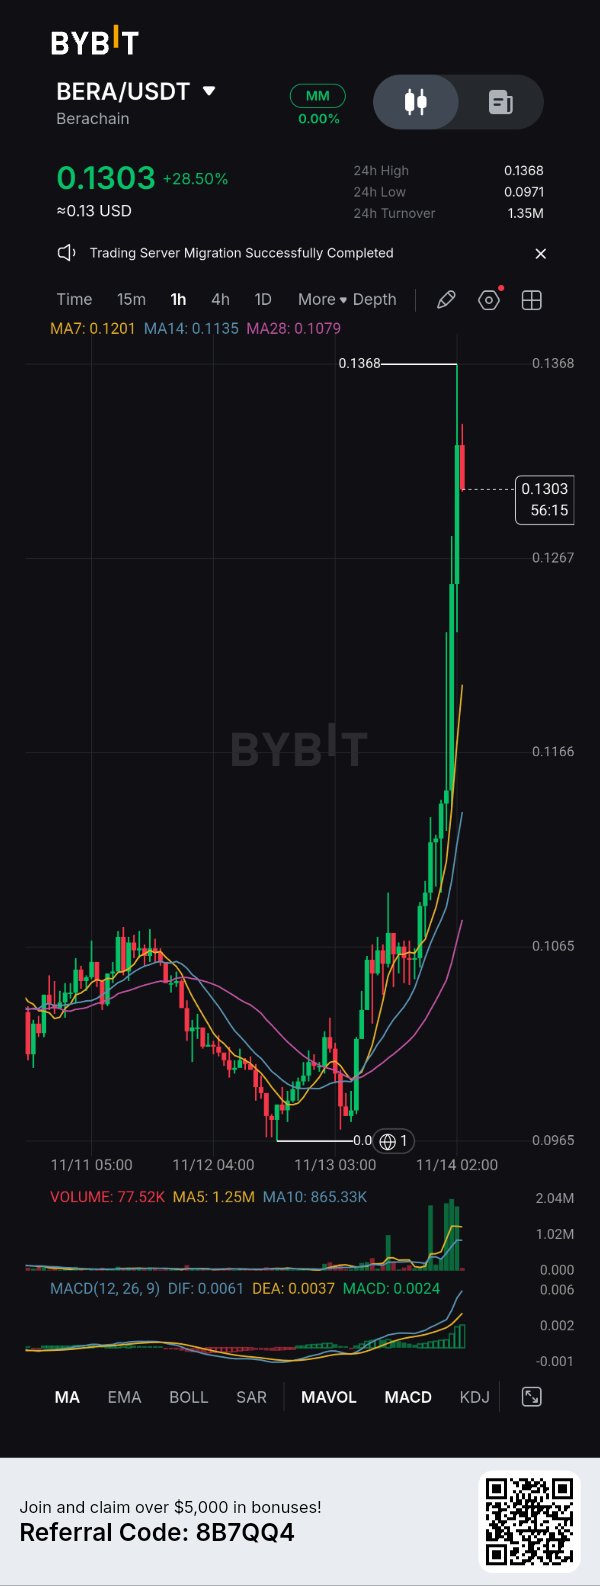
Some traders will see this$BERAUSDT chart and immediately look for a BUY button. I'm looking at the $0.1368 level. Why? Because BERA has made a powerful move from the $0.0971 region, but price is now approaching the high of the entire 24-hour session. This is where momentum traders need to distinguish between a genuine continuation and a late-entry trap. ⚡ WHAT THE CHART IS TELLING US BERA/USDT — 1H chart Current price: $0.1303 24H change: +28.50% 24H high: $0.1368 24H low: $0.0971 24H turnover: $1.35M Moving averages: - MA7: $0.1201 - MA14: $0.1135 - MA28: $0.1079 All three moving averages are positioned below price, with a bullish alignment. This confirms that the short-term structure has changed significantly. But there's a warning: price has moved considerably above its moving averages. A pullback would not necessarily mean the rally is over. 📊 THE MOMENTUM CHECK MACD: - DIF: 0.0061 - DEA: 0.0037 - Histogram: +0.0024 Momentum remains bullish, with DIF above DEA and a positive histogram. However, look at the volume readings: - Current volume: 77.52K - MA5 volume: 1.25M - MA10 volume: 865.33K The displayed current volume is considerably lower than both volume averages. This could reflect cooling participation after the explosive candles. I want to see fresh buying activity before trusting another immediate upward extension. 🎯 THE LEVELS THAT MATTER Resistance: - $0.1368 — 24H high - Above this level, watch for a confirmed breakout and new resistance formation. Support: - $0.1267 — First important chart area - $0.1201 — MA7 - $0.1166 — Additional chart support - $0.1135 — MA14 🔥 TWO SETUPS I'M WATCHING 🟢 SETUP 1: THE PULLBACK TRADE I would rather let BERA come to support than chase it at $0.1303. Potential EP: $0.1205–$0.1267, depending on the support reaction. SL: $0.1160 TP1: $0.1368 TP2: Only after a confirmed breakout, establish the next target from fresh price structure. Confirmation: A bullish reaction around the entry zone, preferably supported by renewed volume. 🔵 SETUP 2: THE BREAKOUT TRADE If buyers push through $0.1368 with strong volume and price successfully retests that level: EP: Above $0.1368 after confirmation. SL: Below the confirmed retest low. TP: Determine from the next resistance formed after the breakout. I won't invent a target where the chart provides none. INVALIDATION: A sustained breakdown below $0.1166 would significantly weaken this immediate bullish continuation thesis. ⚠️ THE MISTAKE I WANT TRADERS TO AVOID Don't confuse a strong token with a good entry. BERA has already delivered a substantial move. Buying simply because the candles are green can expose late entrants to a sharp correction. Sometimes waiting for a retest offers a better opportunity than chasing momentum. 🧠 MY VERDICT Bullish structure. Elevated entry risk. I'm interested in BERA, but I want buyers to prove that the $0.1368 resistance can be broken and defended. Until then, the pullback is the setup I'm watching. 🔥 BERA TRADERS, WHAT'S YOUR PLAN? Are you buying a controlled pullback toward $0.1267, or waiting for a confirmed breakout above $0.1368? #BERA #BERAUSDT #Berachain #Bybit #CryptoTrading #TechnicalAnalysis #ByXIMPACT #WSOT2026 #WSOTShowYourAITradeToEarn10USDT #JensenHuangExitTestsNvidiasAILeadership #USPPITestsTheHigherForLongerTrade
$HYPEUSDT — BUYERS MADE THEIR MOVE. NOW THE MARKET IS TESTING THEIR STRENGTH. 👀 I've been looking at HYPE, and one thing stands out: the rejection around $75.30. Price attempted a strong upward move, but sellers stepped in aggressively. Now HYPE is trading around $72.429, and I'm more interested in what happens next than in the initial rally. Here's how I'm reading the chart. 🔎 THREE THINGS I'M PAYING ATTENTION TO 1. The rejection wasn't insignificant. HYPE climbed toward $75.308 before experiencing a sharp pullback. That tells me the $75 region is an important resistance area. Buyers need to demonstrate that they can absorb selling pressure before I become confident in another breakout. 2. Momentum is cooling down. Look at the moving averages: - MA7: $73.264 - MA14: $72.712 - MA28: $72.220 Price has slipped below the MA7 and MA14 but remains above the MA28. For me, this is a short-term warning sign. The recovery structure hasn't completely disappeared, but buyers have lost some immediate momentum. 3. MACD is giving me another reason to be patient. DIF: 0.316 DEA: 0.324 MACD: -0.008 The slightly negative histogram suggests bullish momentum has weakened. I want to see whether this develops into a deeper correction or simply a temporary cooling-off period. 📍 THE LEVELS I'M WATCHING Rather than predicting one direction, I'm preparing for two possibilities. 🟢 BULLISH SCENARIO If HYPE reclaims $72.70–$73.30 and establishes support above that region, I'll start watching: - $73.86 - $74.50 - $75.30 A convincing break above $75.30 would be particularly interesting. 🔴 BEARISH SCENARIO If sellers push price below $72.20, I'll watch the $70.97 support area. A breakdown below that region could expose the previous swing low around $69.53. 🎯 MY TRADING APPROACH I'm not interested in buying simply because HYPE is showing a green 24-hour percentage. My preference is to wait for confirmation. - Potential long entry: $72.80–$73.30, after a confirmed reclaim and retest. - TP1: $73.86 - TP2: $74.50 - TP3: $75.30 - Invalidation: Sustained move below $72.20. These are conditional planning levels, not an active trade signal. The setup needs confirmation, and the first target offers limited upside relative to the proposed invalidation level, so I would reassess risk-to-reward before entering. 🧠 MY FINAL TAKE I'm cautiously neutral on HYPE in the immediate term. The rejection at $75.30 deserves attention, but I won't automatically interpret it as the beginning of a major decline. What I want to see is simple: can buyers reclaim the moving-average cluster, or will sellers force another test of lower support? The next reaction matters more than the previous rally. 👇 I WANT TO HEAR FROM OTHER TRADERS: If you were watching HYPE right now, which level would determine your next move: $73.30 or $70.97? And more importantly, what would make you change your bias? #HYPE #Hyperliquid #CryptoTrading #ByX #ByXIMPACT