Asmauhusnah
10619點贊4分享450粉絲806關注
Crypto Learner | Web3 Enthusiast Sharing market insights, ideas & opportunities Building. Learning. Growing. 🚀 Let’s grow together on ByX.
Crypto Learner | Web3 Enthusiast Sharing market insights, ideas & opportunities Building. Learning. Growing. 🚀 Let’s grow together on ByX.
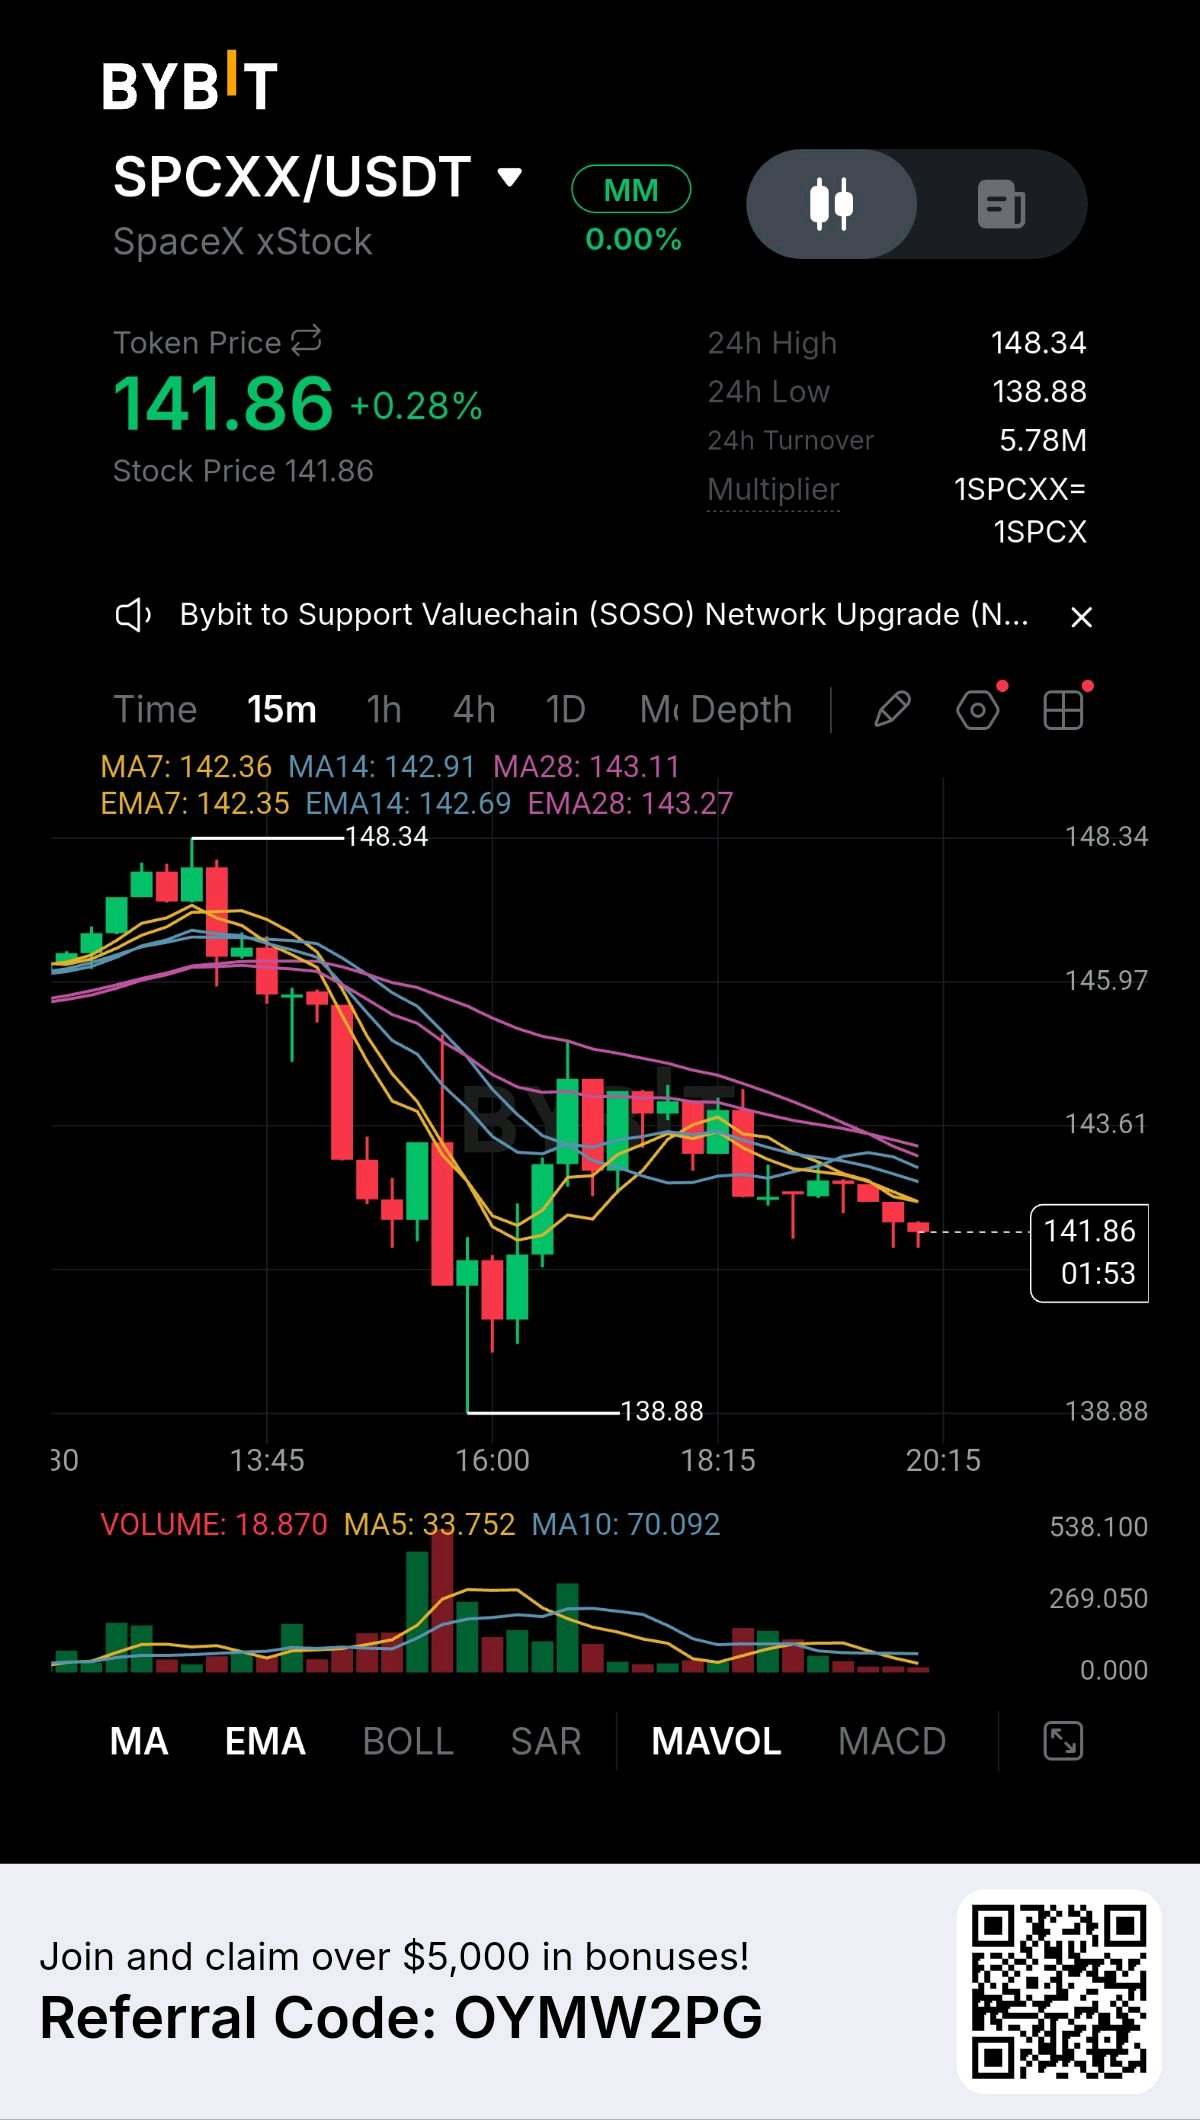
$SPCXXUSDT at a Crossroads: The 143.11 Ceiling vs 138.88 Floor Market Overview · Current Price: 141.86 · 24h Change: +0.28% · 24h Range: 138.88 to 148.34 · 24h Turnover: 5.78M The Situation The 15 minute chart shows SPCXX trapped in a bearish vice. After a sharp drop from 148.34, the price has established a pattern of lower highs, currently hovering at 141.86. The market is compressing, and a volatile move is highly probable in the near term. The Evidence · Moving Averages: The price is buried beneath a falling cluster of resistance. The MA7 sits at 142.36, MA14 at 142.91, and MA28 at 143.11. All are sloping down. · Volume: The volume profile is heavily skewed toward red spikes, confirming sellers are in control. · Candlesticks: Current price action is printing small, indecisive bodies, showing a lack of aggressive buyer interest at these levels. The Execution Plan Do not guess the direction in this chop. The setup demands a WAIT stance until the range resolves. · Long Trigger: A 15 minute candle closing decisively above 143.11. This breaks the bearish structure and targets 145.97. · Short Trigger: A 15 minute candle closing firmly below 141.00. This confirms the downtrend and targets the 138.88 session low. · Invalidation: Longs are dead below 141.00. Shorts are dead above 143.27. The Takeaway When a market compresses beneath a falling wall of moving averages, the path of least resistance is almost always down. The bears hold the tactical advantage until the price proves otherwise. The most profitable action right now is patience. Wait for the market to show its hand. Engagement Question Are you waiting for the price to break through the 143.11 resistance to confirm a reversal, or are you expecting a breakdown below 141.00 to continue the trend?#ByXIMPACT #WSOT2026 #BybitAIEvolving $ICPUSDT
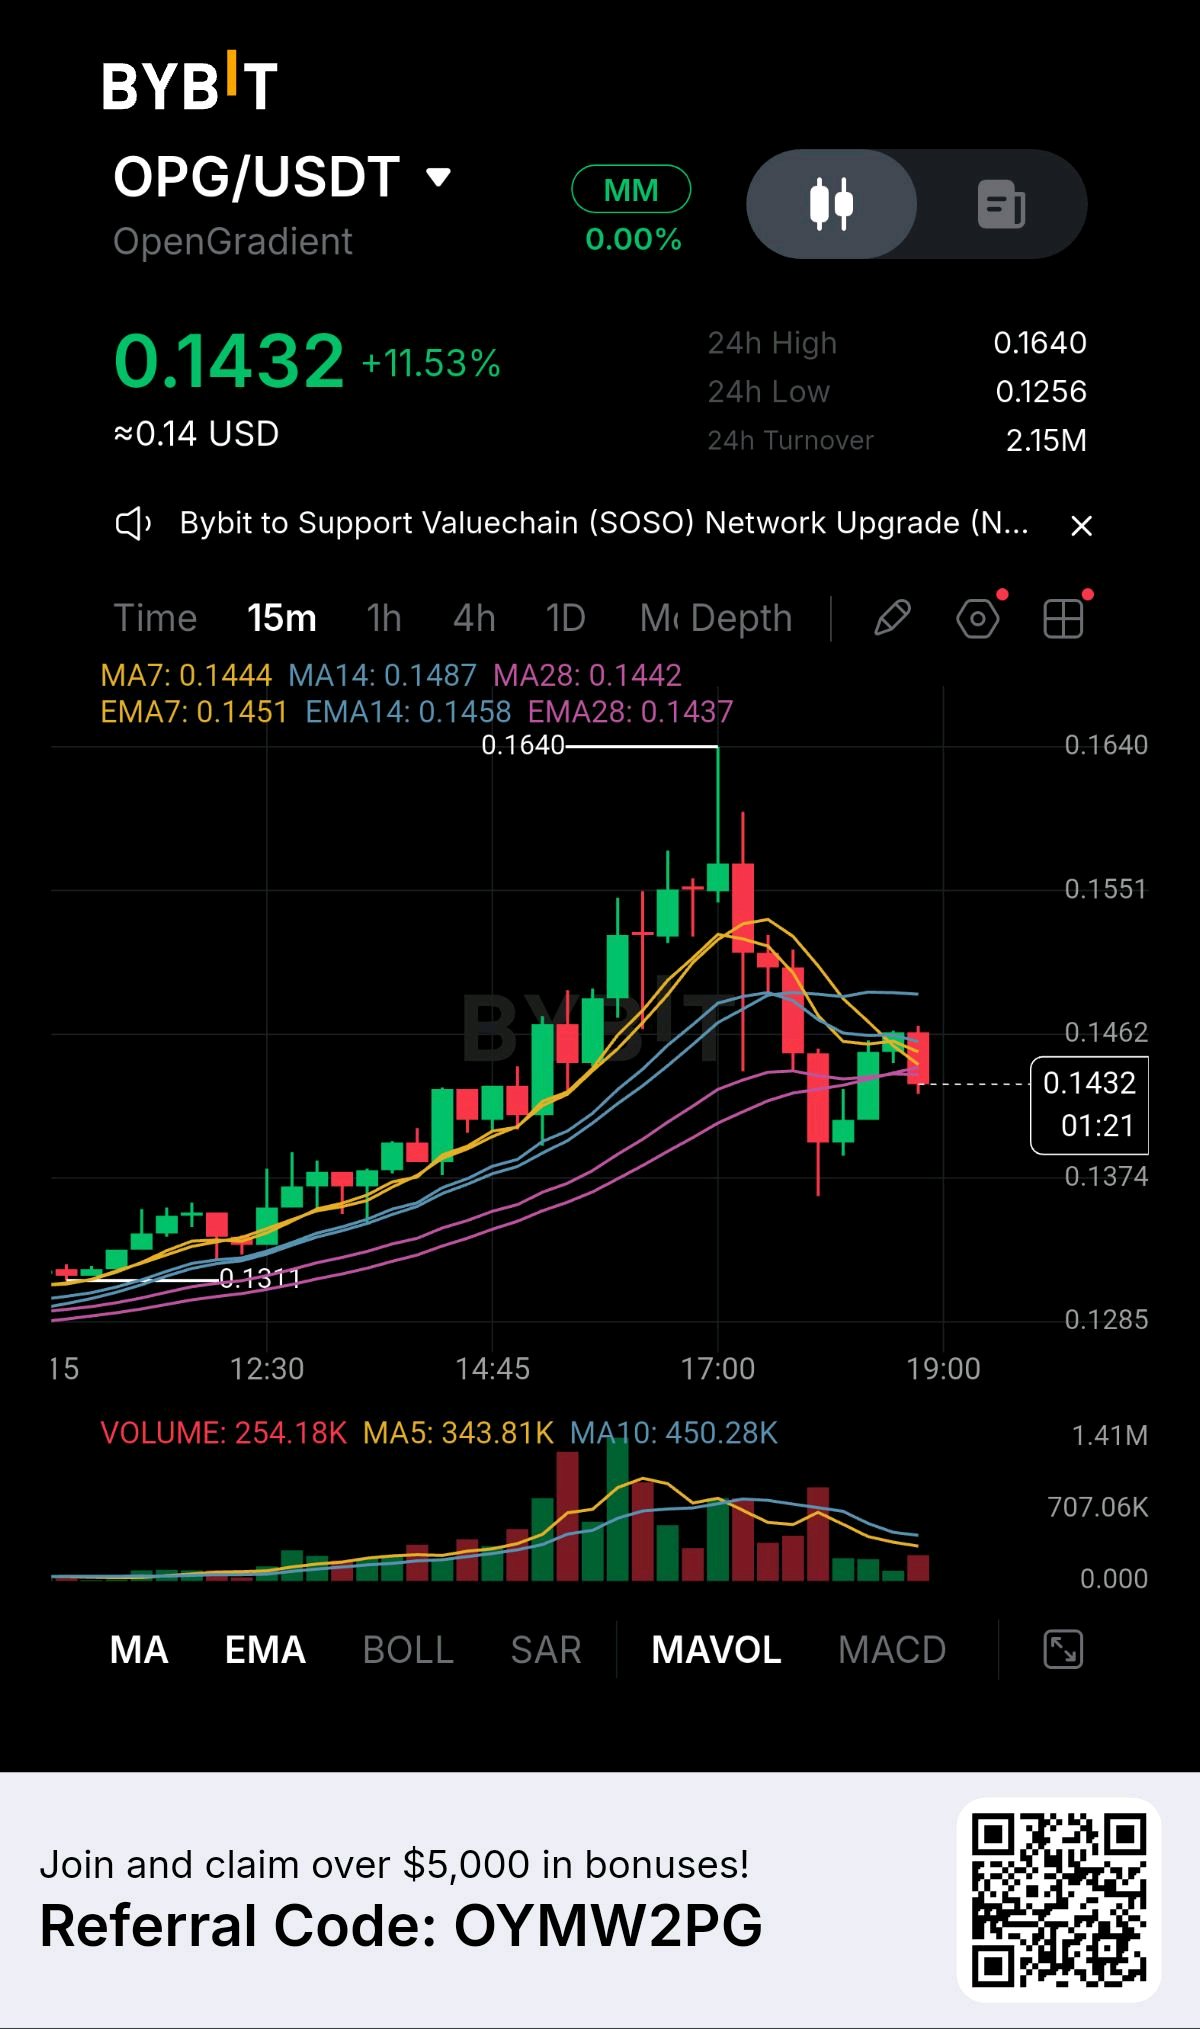
$OPGUSDT is currently in a sharp short term pullback after a massive rally. The market is sitting exactly on the MA28 support level at 0.1437. The immediate direction depends entirely on whether bulls can defend this line or if sellers force a breakdown. Market Context · Current Price: 0.1432 · 24h Change: +11.53% · 24h Range: 0.1256 to 0.1640 · 24h Turnover: 2.15M The Technical Reality The recent price action shows heavy profit taking. The price has broken below the short term MA7 at 0.1444 and MA14 at 0.1487, which signals immediate bearish momentum. However, the price has landed directly on the MA28 at 0.1442 and the EMA28 at 0.1437. These longer term averages are acting as the last line of defense for the uptrend. The red volume spikes confirm that sellers are aggressive. The current candle is attempting to stabilize, but there is no strong confirmation of a bounce yet. What to Watch · Bullish Trigger: A 15 minute candle closing back above the MA7 at 0.1444. This would signal that buyers are stepping in and a relief rally toward 0.1462 is possible. · Bearish Trigger: A 15 minute candle closing firmly below 0.1437. This invalidates the short term uptrend and opens the door for a deeper flush toward 0.1374. · Invalidation: The bullish idea is dead if price breaks 0.1437. The bearish idea is dead if price aggressively reclaims 0.1487. Actionable Strategy Do not force a trade here. The market is at a critical inflection point. Wait for the 15 minute candle to close. If it closes strong and green above 0.1444, look for longs. If it closes red below 0.1437, look for shorts. Final Thought An 11 percent daily run often leads to a sharp correction. The key is watching where the correction stops. The MA28 is the structural backbone of the rally. If buyers hold it, the trend is healthy. If they lose it, the rally was just a liquidity grab. Patience at this level will save your capital. Engagement Question Are you buying this dip at the MA28, or are you waiting for a confirmed breakdown below 0.1437 to look for short entries?#ByXIMPACT $TAIKOUSDT
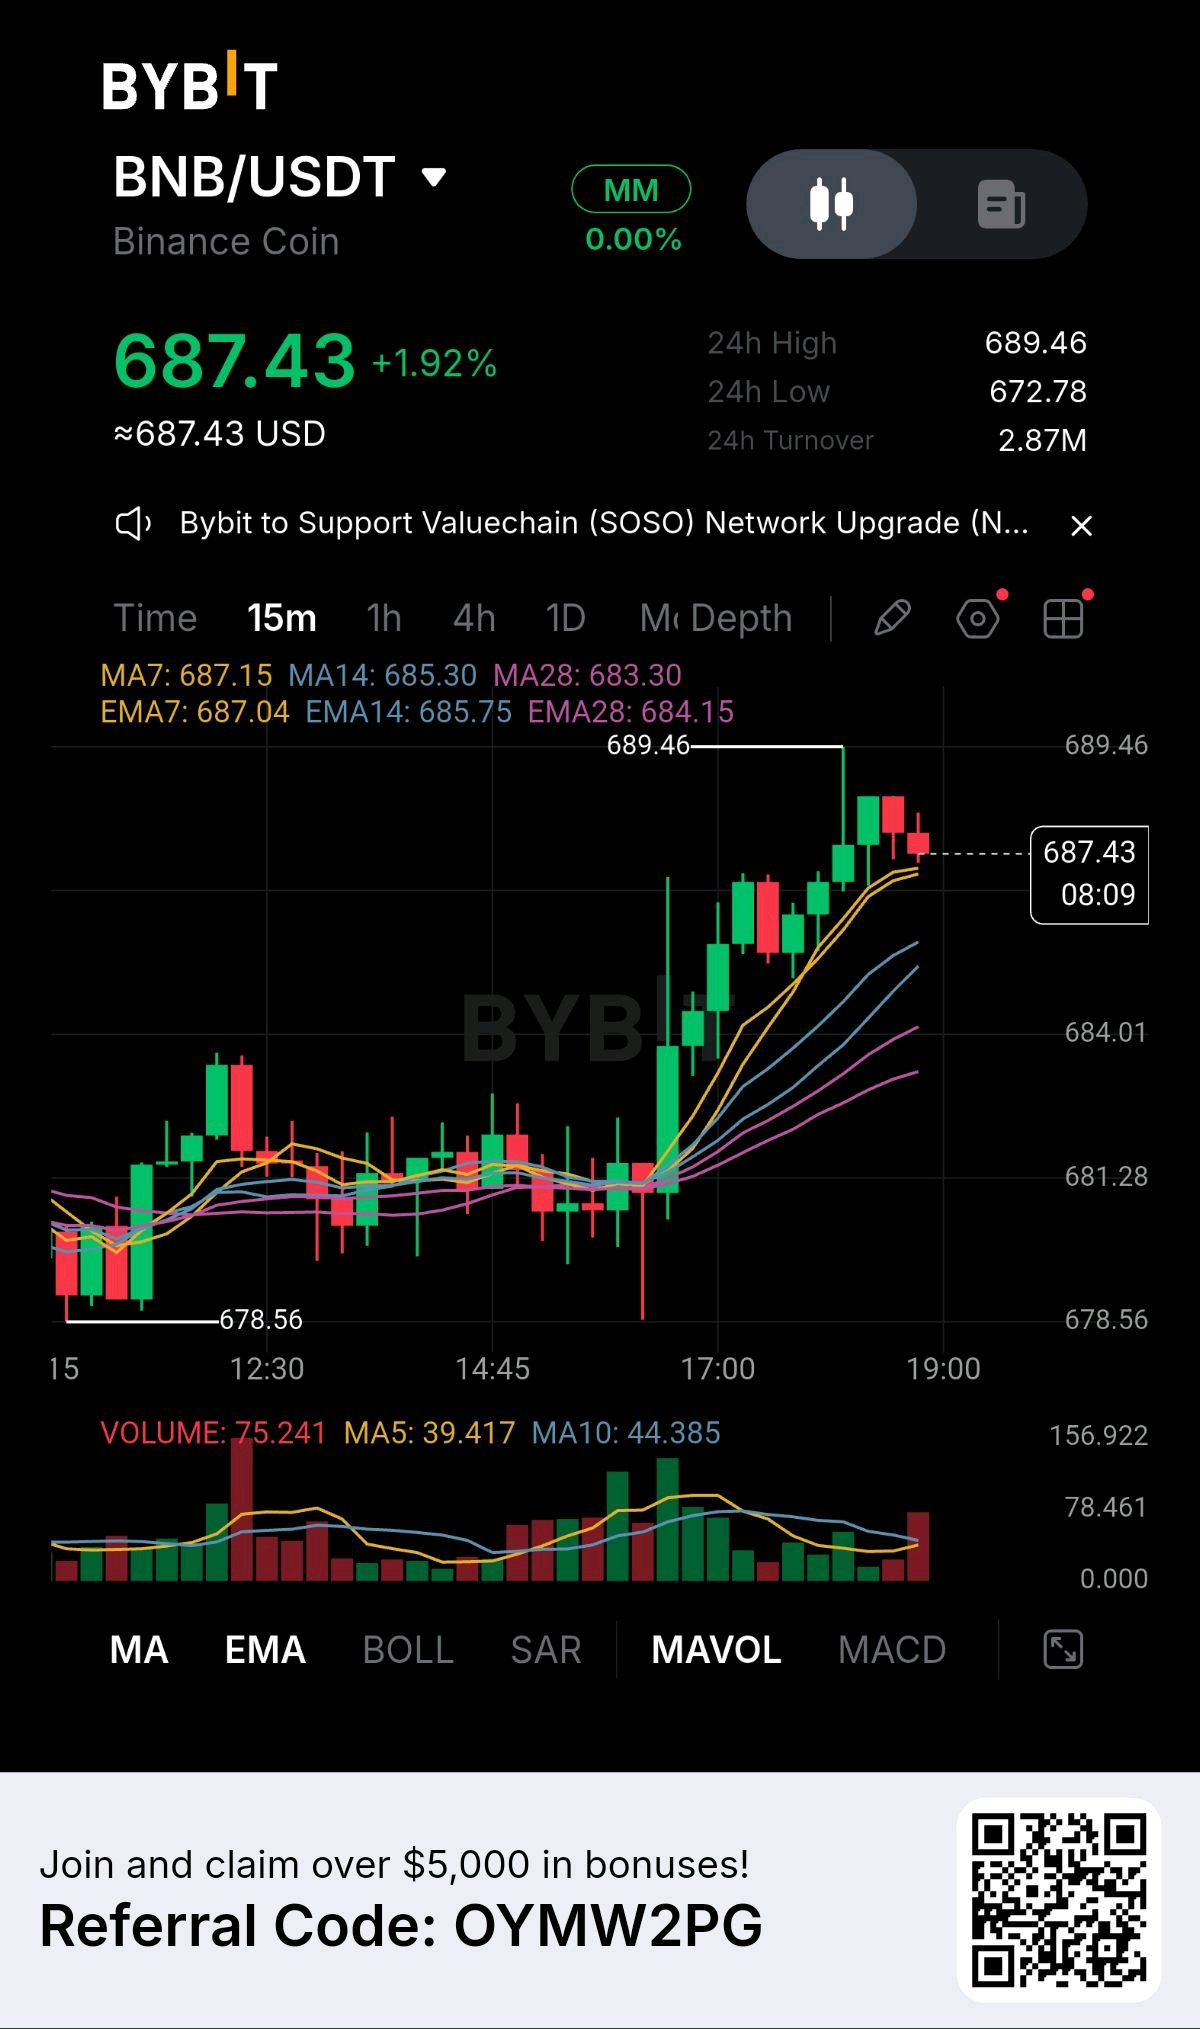
BNB Surges: Bulls Test 689.46 Resistance Ceiling
Market Snapshot · Current Price: 687.43 · 24h Change: +1.92% · 24h Range: 672.78 to 689.46 · 24h Turnover: 2.87M Market Structure The 15 minute chart shows a decisive shift to a bullish structure. After a prolonged period of flat, sideways consolidation near the session low of 678.56, buyers ignited an aggressive breakout. The price has carved a near vertical sequence of higher highs, pushing directly into a new local peak at 689.46. The market is currently pausing just below this high, attempting to establish a new support base. Technical Evidence The technical picture is strongly bullish. The moving averages are fanning out in a perfect bullish alignment. The MA7 at 687.15 and MA14 at 685.30 are well above the MA28 at 683.30, and all are sloping steeply upward. The price is trading comfortably above this cluster. The volume profile confirms the move with a massive green spike during the initial breakout. The current candles are small red bodies, indicating a healthy pause and minor profit taking at the highs rather than a reversal. Key Levels · Immediate Resistance: 689.46. The local high. A clean 15 minute close above this level confirms a continuation of the breakout. · Immediate Support: 685.30. The MA14 line and the first dynamic support level. · Structural Support: 683.30. The MA28 line and the ultimate floor for the current bullish trend. Bullish Scenario If BNB breaks and closes above 689.46, the momentum continues. Bulls will look to push toward the 690.00 psychological level, using the MA7 as a tight trailing stop. Bearish Scenario If the price rejects this high and forms a bearish reversal candle, the first sign of weakness would be a break below 687.15. A close below this level would signal a deeper retracement toward the MA14 at 685.30. Risk and Invalidation The setup is currently a WAIT for a new entry. The trend is strongly bullish, but buying directly at resistance after an extended move is risky. The bearish thesis is invalidated if price aggressively breaks above 689.46. The bullish thesis is invalidated if the price closes firmly below 683.30. Trader Insight When a market breaks out of a long consolidation phase with strong volume and stacked moving averages, it is a sign of genuine trend initiation. However, the safest entry is rarely at the very top of the impulse. Look for a controlled pullback to the MA7 or MA14 that shows immediate buying support, or wait for a confirmed 15 minute close above the local high. Do not chase the green candles. Engagement Question Given this strong bullish structure, are you chasing the breakout above 689.46, or are you waiting for a pullback to the MA14 at 685.30 to enter a long?#ByXIMPACT #WSOT2026 #USInflationRunsHotAndRateHikeBetsRise $BNBUSDT $BNBUSDC
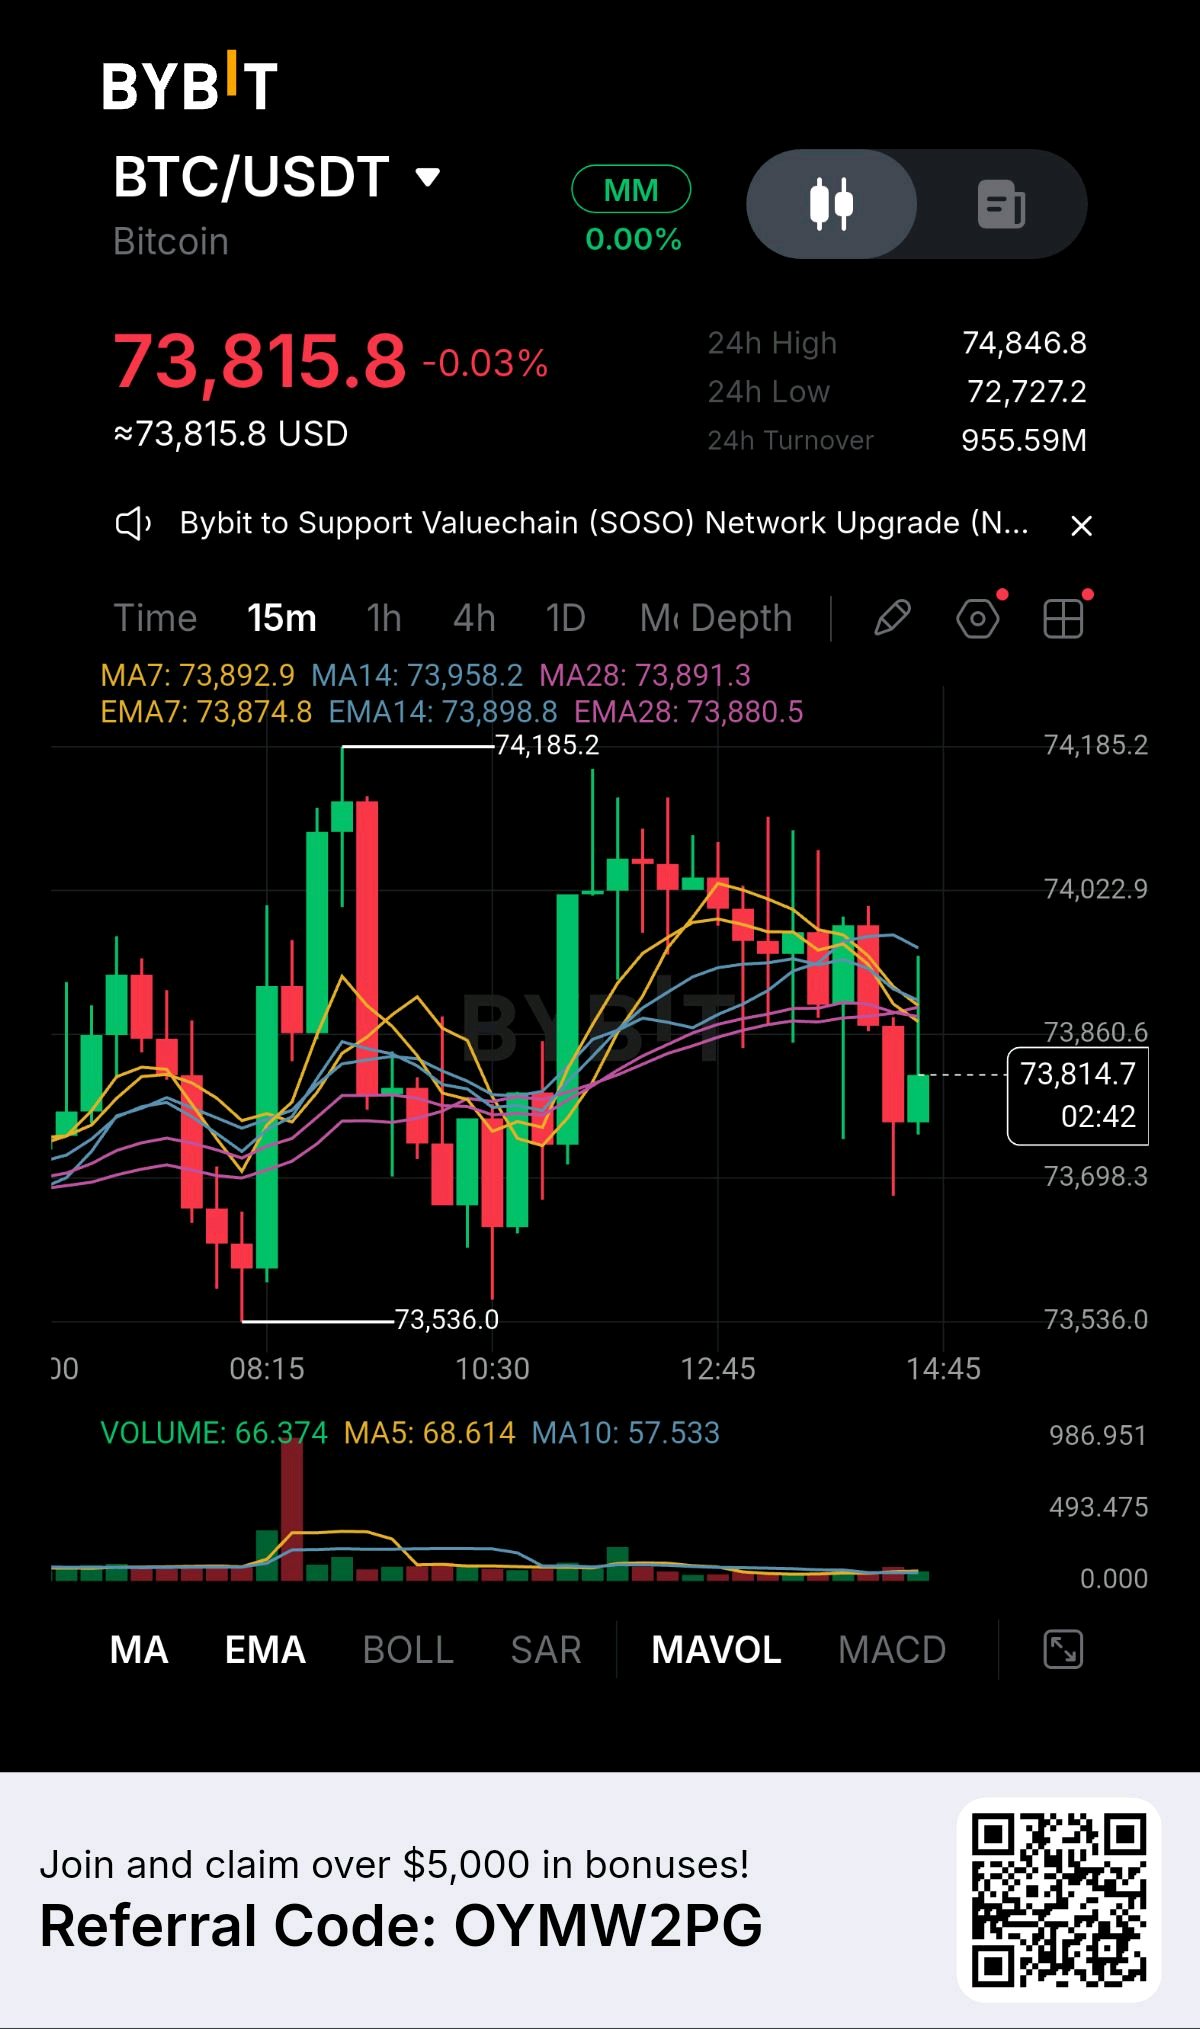
BTC Tests MA Support: Bulls Defend 73.8K Floor
Market Snapshot · Current Price: 73,815.8 · 24h Change: -0.03% · 24h Range: 72,727.2 to 74,846.8 · 24h Turnover: 955.59M Market Structure The 15 minute chart shows a choppy, volatile session with no clear sustained trend. After a sharp drop to 73,536.0, the market staged a strong recovery to a local high of 74,185.2. Since that peak, sellers have regained control, carving out a series of lower highs and pushing the price back down toward the 73,815.8 level. Technical Evidence The technical picture is at a critical inflection point. The price is trapped inside a dense cluster of moving averages. The MA7, MA14, and MA28 are all converging around the 73,892 level, with the EMA lines providing similar compression. The price is currently trading just below this cluster, which is a bearish signal. Volume has dried up significantly during the recent pullback, suggesting a lack of aggressive buying interest, while the current candles are red bodies pressing into support. Key Levels · Immediate Resistance: 73,898.8. The EMA14 line and the top of the moving average cluster. Bulls must reclaim this to halt the bleed. · Immediate Support: 73,698.3. The lower boundary of the recent consolidation zone. · Structural Support: 73,536.0. The session low and the critical line in the sand. Bullish Scenario For a relief rally, bulls must defend the 73,698.3 level and print a strong 15 minute candle closing back above the MA cluster at 73,898.8. This would signal that the selling pressure is exhausted and set up a retest of the 74,185.2 local high. Bearish Scenario If the current support fails and a 15 minute candle closes firmly below 73,536.0, the downtrend continues. The market would likely look for a deeper flush into lower price discovery. Risk and Invalidation The setup is currently a WAIT for a long entry. The market is in a short term downtrend and actively testing dynamic support. Catching a falling knife here is risky. The bearish thesis is invalidated if price aggressively reclaims 73,898.8. The bullish thesis is completely invalidated by a clean close below 73,536.0. Trader Insight When the price is trapped in a tight moving average cluster after a volatile swing, the market is in a state of equilibrium. The safest approach is to wait for a decisive close outside of this zone. A strong candle body closing above the cluster is your long signal. A clean break below the session low is your short signal. Do not force a trade in the middle of the chop. Engagement Question Given this tight moving average convergence, are you waiting for a confirmed reclaim of the MA cluster at 73,898 to go long, or is a breakdown below 73,536 your signal to look for shorts?#ByXIMPACT #WSOT2026 #BitcoinHitsTwoMonthLowAfterUSMidterms $BTCUSDT
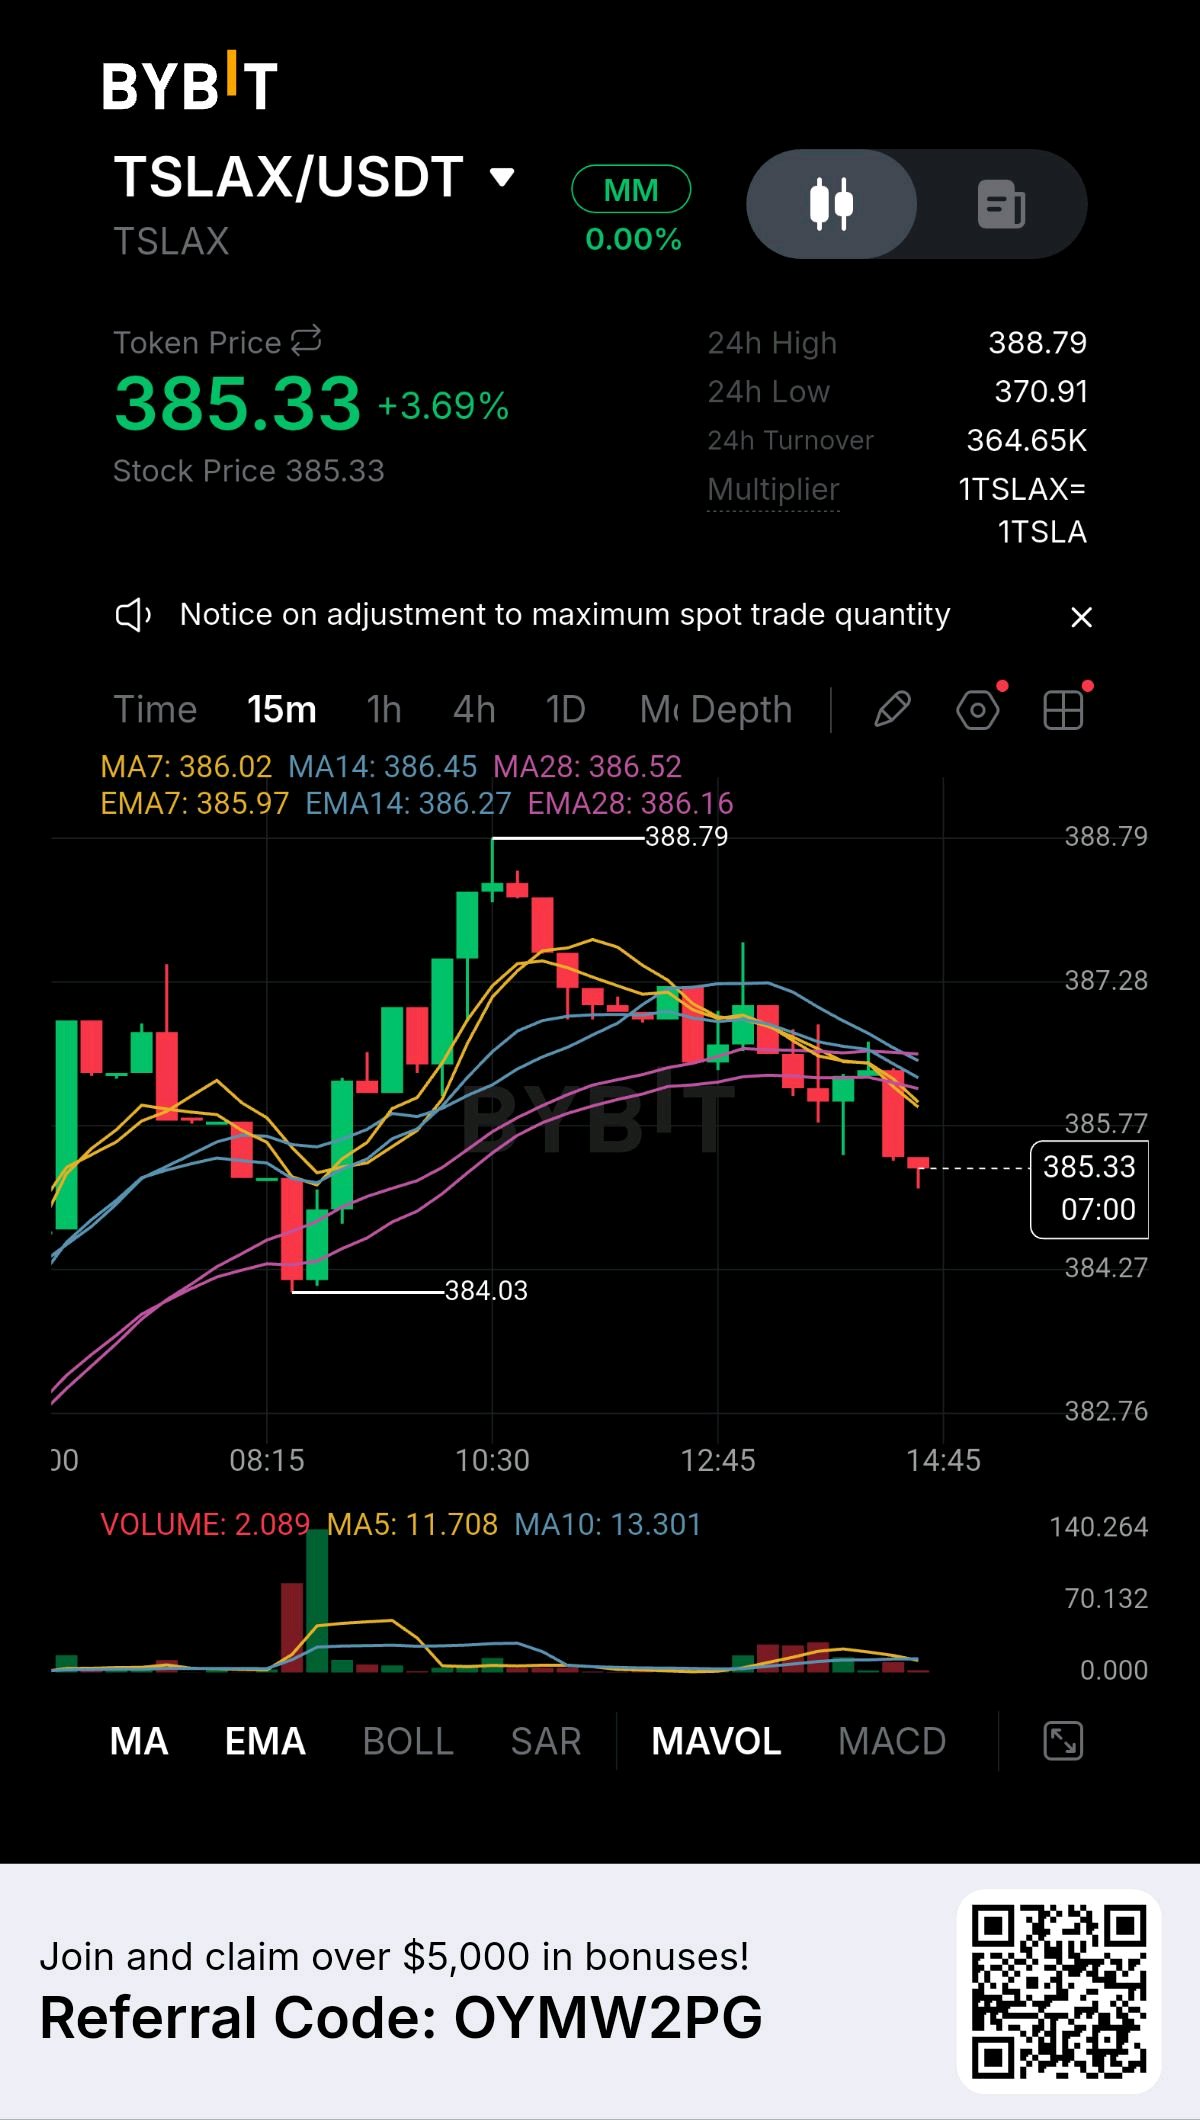
TSLAX Retreats: Bears Target 384.03 Support Floor
Market Snapshot · Current Price: 385.33 · 24h Change: +3.69% · 24h Range: 370.91 to 388.79 · 24h Turnover: 364.65K Market Structure The 15 minute chart reveals a sharp bullish impulse that has transitioned into a heavy retracement. After a strong rally from the session low of 384.03 to a local peak of 388.79, buyers lost momentum. The market has since carved a clear sequence of lower highs and lower lows, with sellers currently pressing the price down toward the 385.33 level. Technical Evidence The technical picture highlights a clear loss of bullish control. The price has broken below a dense cluster of moving averages. The MA7, MA14, and MA28 are all converging tightly around the 386.45 to 386.52 zone, with the EMA lines providing similar resistance overhead. The price is trading beneath all of them, which is a bearish signal. Volume has dried up significantly during the pullback, suggesting a lack of buyer interest at these levels, while the current candles are red bodies pushing toward the lows. Key Levels · Immediate Resistance: 386.02. The MA7 line and the bottom of the moving average cluster. Bulls must reclaim this to halt the bleed. · Immediate Support: 384.03. The session low and the critical line in the sand. · Macro Resistance: 386.52. The MA28 and the ultimate ceiling for the current bearish structure. Bullish Scenario For a relief rally, bulls must defend the 384.03 level and print a strong 15 minute candle closing back above the MA cluster at 386.52. This would signal that the selling pressure is exhausted and set up a retest of the 387.28 region. Bearish Scenario If the current support fails and a 15 minute candle closes firmly below 384.03, the downtrend continues. The market would likely look for a deeper flush into lower price discovery. Risk and Invalidation The setup is currently a WAIT for a long entry. The market is in a short term downtrend with moving averages stacked against it. Catching a falling knife here is risky. The bearish thesis is invalidated if price aggressively reclaims 386.52. The bullish thesis is completely invalidated by a clean close below 384.03. Trader Insight When a market rallies hard and then pulls back below a cluster of moving averages, it is a sign that the immediate buying pressure has been exhausted and sellers are stepping in. The key is to watch the support level. If the price can hold above 384.03 and form a base, a bounce is possible. If it slices through with a large red candle, the market is likely heading lower. Engagement Question Given this pullback, are you waiting for a confirmed reclaim of the MA cluster at 386.52 to look for longs, or is a breakdown below 384.03 your signal to short the next leg down?#ByXIMPACT #WSOT2026 #USInflationRunsHotAndRateHikeBetsRise $TSLAXUSDT
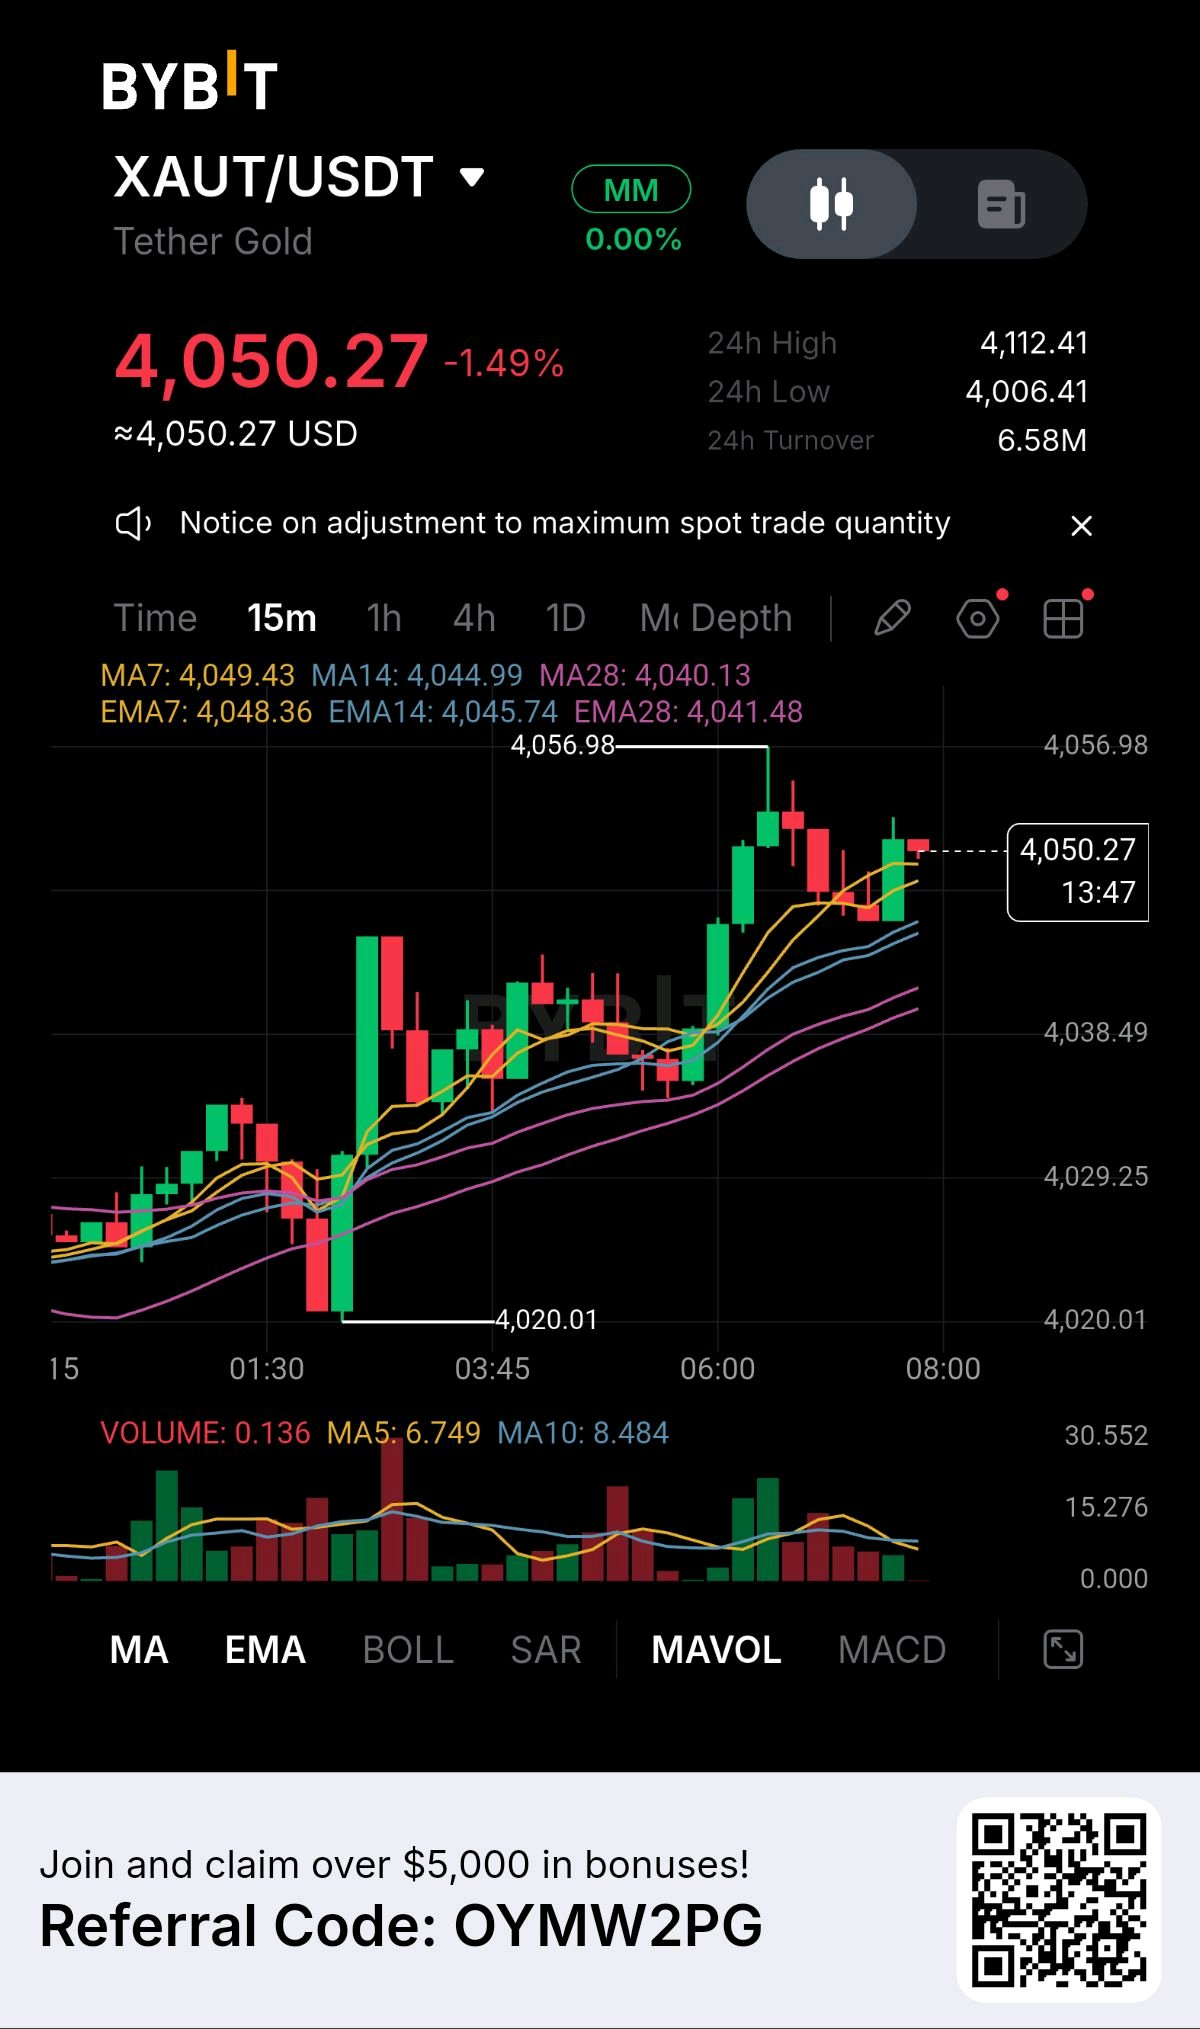
XAUT Holds Its Ground: Is Another Gold Move Loading? Gold is showing an interesting short term recovery structure despite remaining under pressure on the 24 hour chart. $XAUTUSDT is trading at $4,050.27, down 1.49% over the last 24 hours. However, the 15 minute chart reveals that buyers are still defending the recent recovery. What the chart is revealing • Price: $4,050.27 • 24H High: $4,112.41 • 24H Low: $4,006.41 • Turnover: $6.58M The technical picture The short term moving averages are aligned positively: • MA7: $4,049.43 • MA14: $4,044.99 • MA28: $4,040.13 The EMA structure tells a similar story, with price trading slightly above the major short term averages. This suggests that buyers still have some control over the immediate market structure, although momentum needs stronger confirmation. The levels that matter Resistance: $4,056.98 Support: $4,044 to $4,040 Further downside support: $4,038.49 and $4,029.25 Two possible developments A convincing breakout above $4,056.98 could strengthen bullish momentum and open the way for another upward test. However, losing the $4,040 support zone could weaken the recovery and expose lower support levels. My market perspective The important question is no longer just whether XAUT can recover. It is whether buyers can sustain the pressure long enough to turn this recovery into a stronger upward move. A breakout needs confirmation, not anticipation. What do you think comes next? Will gold break above $4,057 or return to test lower support?#ByXIMPACT #WSOT2026 #WSOTPicktoEarn10U

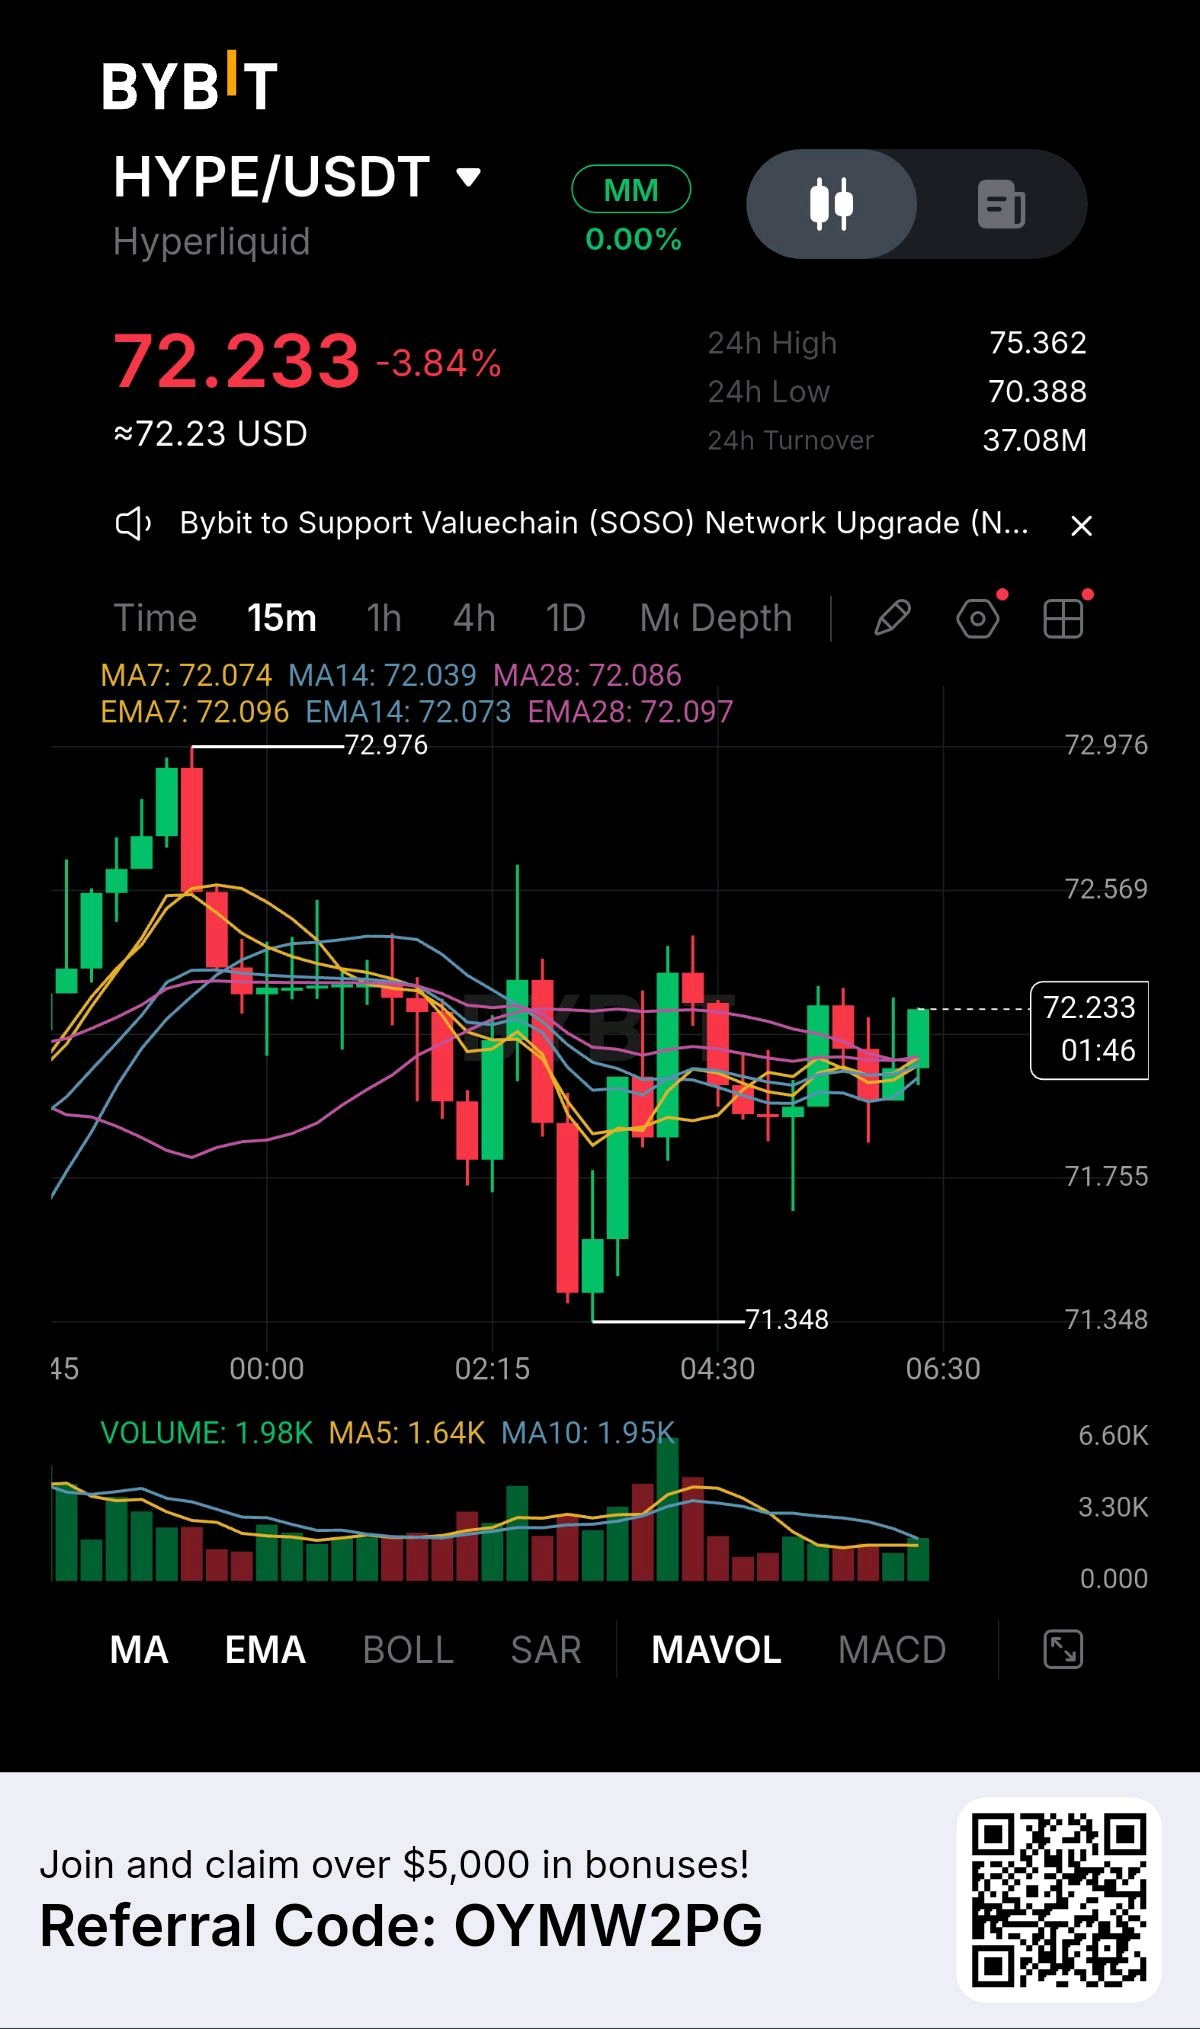
HYPE 在支撐位盤整:聚焦均線密集區
市場快訊 · 現價:72.233 · 24小時跌幅:-3.84% · 24小時區間:70.388 至 75.362 · 24小時成交額:3,708 萬 市場結構 15 分鐘線圖顯示,這段交易區間波動劇烈,經歷了急劇拋售後進入狹幅盤整。在觸及 72.976 的局部高點後,賣壓將價格打壓至 71.348 的盤中低點。自該低點以來,市場呈現出震盪橫盤的走勢。目前價格趨於平緩,買賣雙方均缺乏明顯的方向性動能。 技術面分析 技術面顯示市場極度猶豫不決。價格正被困在密集的移動平均線叢中。MA7、MA14 和 MA28 以及對應的 EMA 皆緊密收斂於 72.08 水平附近。這種壓縮表明短期動能已完全抵銷。成交量分佈在此震盪期間顯著萎縮,暗示市場正等待新的催化劑來決定下一步走勢。 關鍵點位 · 即時阻力位:72.569。需在 15 分鐘線圖上穩穩收於此位上方,方可確認看漲突破。 · 即時支撐位:71.755。當前震盪區間的下邊界。 · 結構性支撐位:71.348。盤中低點,也是至關重要的防守線。 看漲情境 若 HYPE 突破此 MA 密集區,且 15 分鐘 K 線強勢收於 72.569 之上,則盤整趨勢將向上突破。多方目標將鎖定在重新測試 72.976 的局部高點。 看跌情境 若價格受阻於 MA 密集區,且 15 分鐘 K 線有效跌破 71.755 收盤,則近期的反彈宣告失敗。市場極有可能重新下探 71.348 的結構性低點。 風險與無效化條件 目前的策略建議為「觀望」。市場正處於移動平均線附近的高壓縮、低成交量盤整階段。在震盪區間的中段進行交易勝率極低。若價格強勢收復 72.569,則看跌觀點失效。若價格有效收於 71.348 下方,則看漲觀點完全失效。 交易觀點 當移動平均線緊密收斂且成交量萎縮時,代表市場正在蓄勢,處於平衡狀態。第一個帶著實體長 K 線突破此密集區的收盤價,將主導短期趨勢。此時耐心至關重要,切勿搶先在突破前進場,等待市場揭示其方向。 互動提問 面對目前緊密的移動平均線收斂,您是在等待確認突破 72.569 後做多,還是將跌破 71.755 視為做空的訊號呢?#ByXIMPACT #WSOT2026 #WSOTPicktoEarn10U $HYPEUSDT

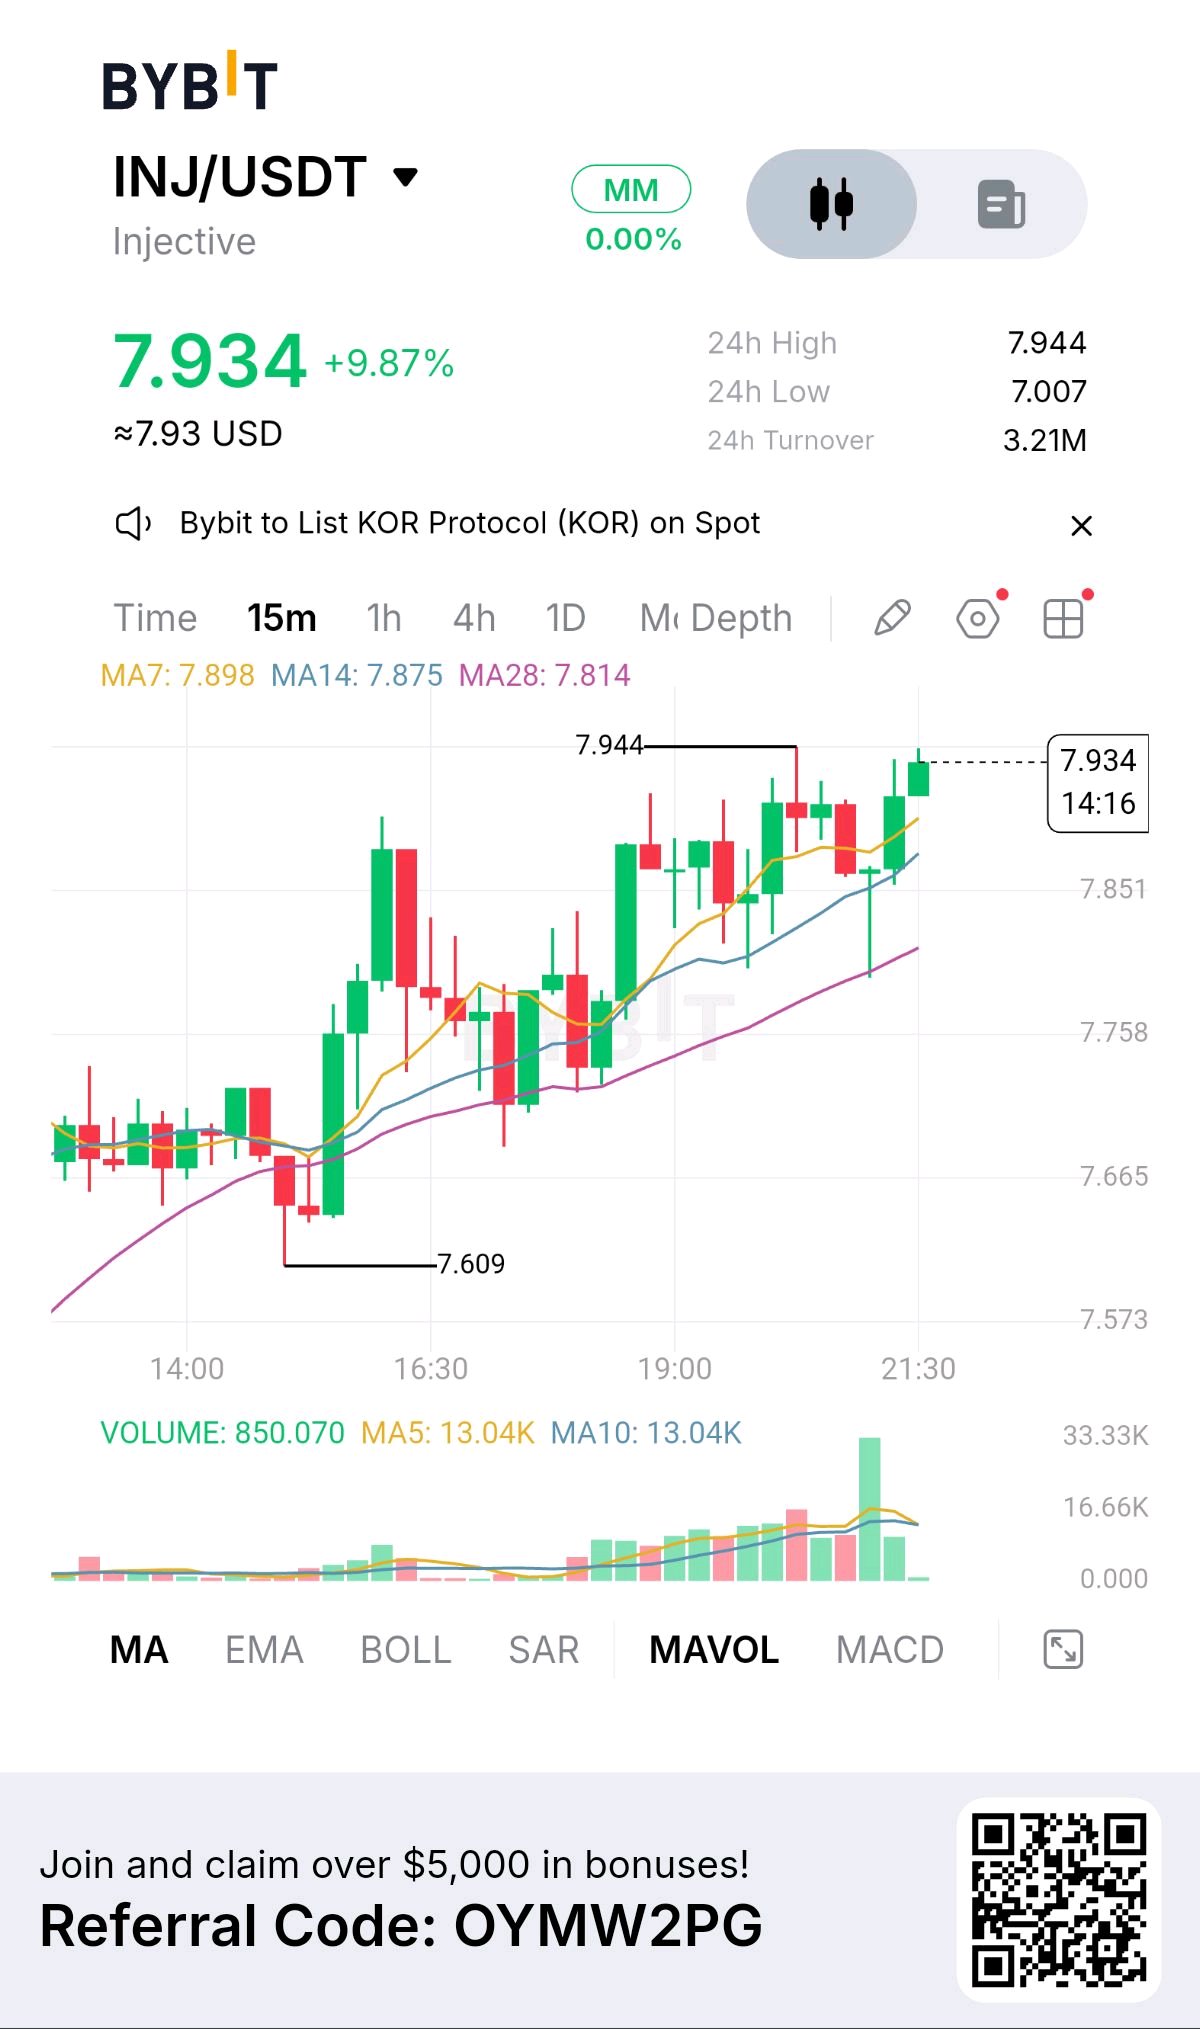
$INJUSDT 在 24 小時內上漲了 9.87%,目前價格為 7.934,略低於其 7.944 的近期高點。這次漲勢令人印象深刻,但下一步走勢可能比將價格推升至此的整個上漲過程更為重要。 15 分鐘線的結構依然建設性。更高的高點和更高的低點,加上向上移動的均線排列,顯示買方仍保持控制權。 MA7: 7.898 MA14: 7.875 MA28: 7.814 價格位於這三條均線之上,短期結構仍有利於買方。然而,7.944 是眼前的阻力位。若 15 分鐘線能確認收盤於該水平之上,將加強突破的力道,並使市場焦點轉向 8.00 的心理關卡。 同時也存在值得留意的風險。在經歷如此強勁的漲勢後,若在近期高點處受阻,可能會引發獲利了結。跌破 7.898 將是動能減弱的早期信號,而 7.814 則是更重要的支撐參考。 人們很容易想去追逐看起來勢不可擋的漲勢,但強勁的動能並不能免除確認的需求。市場仍需證明 7.944 能轉變為支撐位,而不是另一個反轉點。 INJ 接近 8.00,但買方是會衝破天花板,還是會先暫停以建立更強的基礎呢?#ByXIMPACT #比特幣跌破 8 萬美元
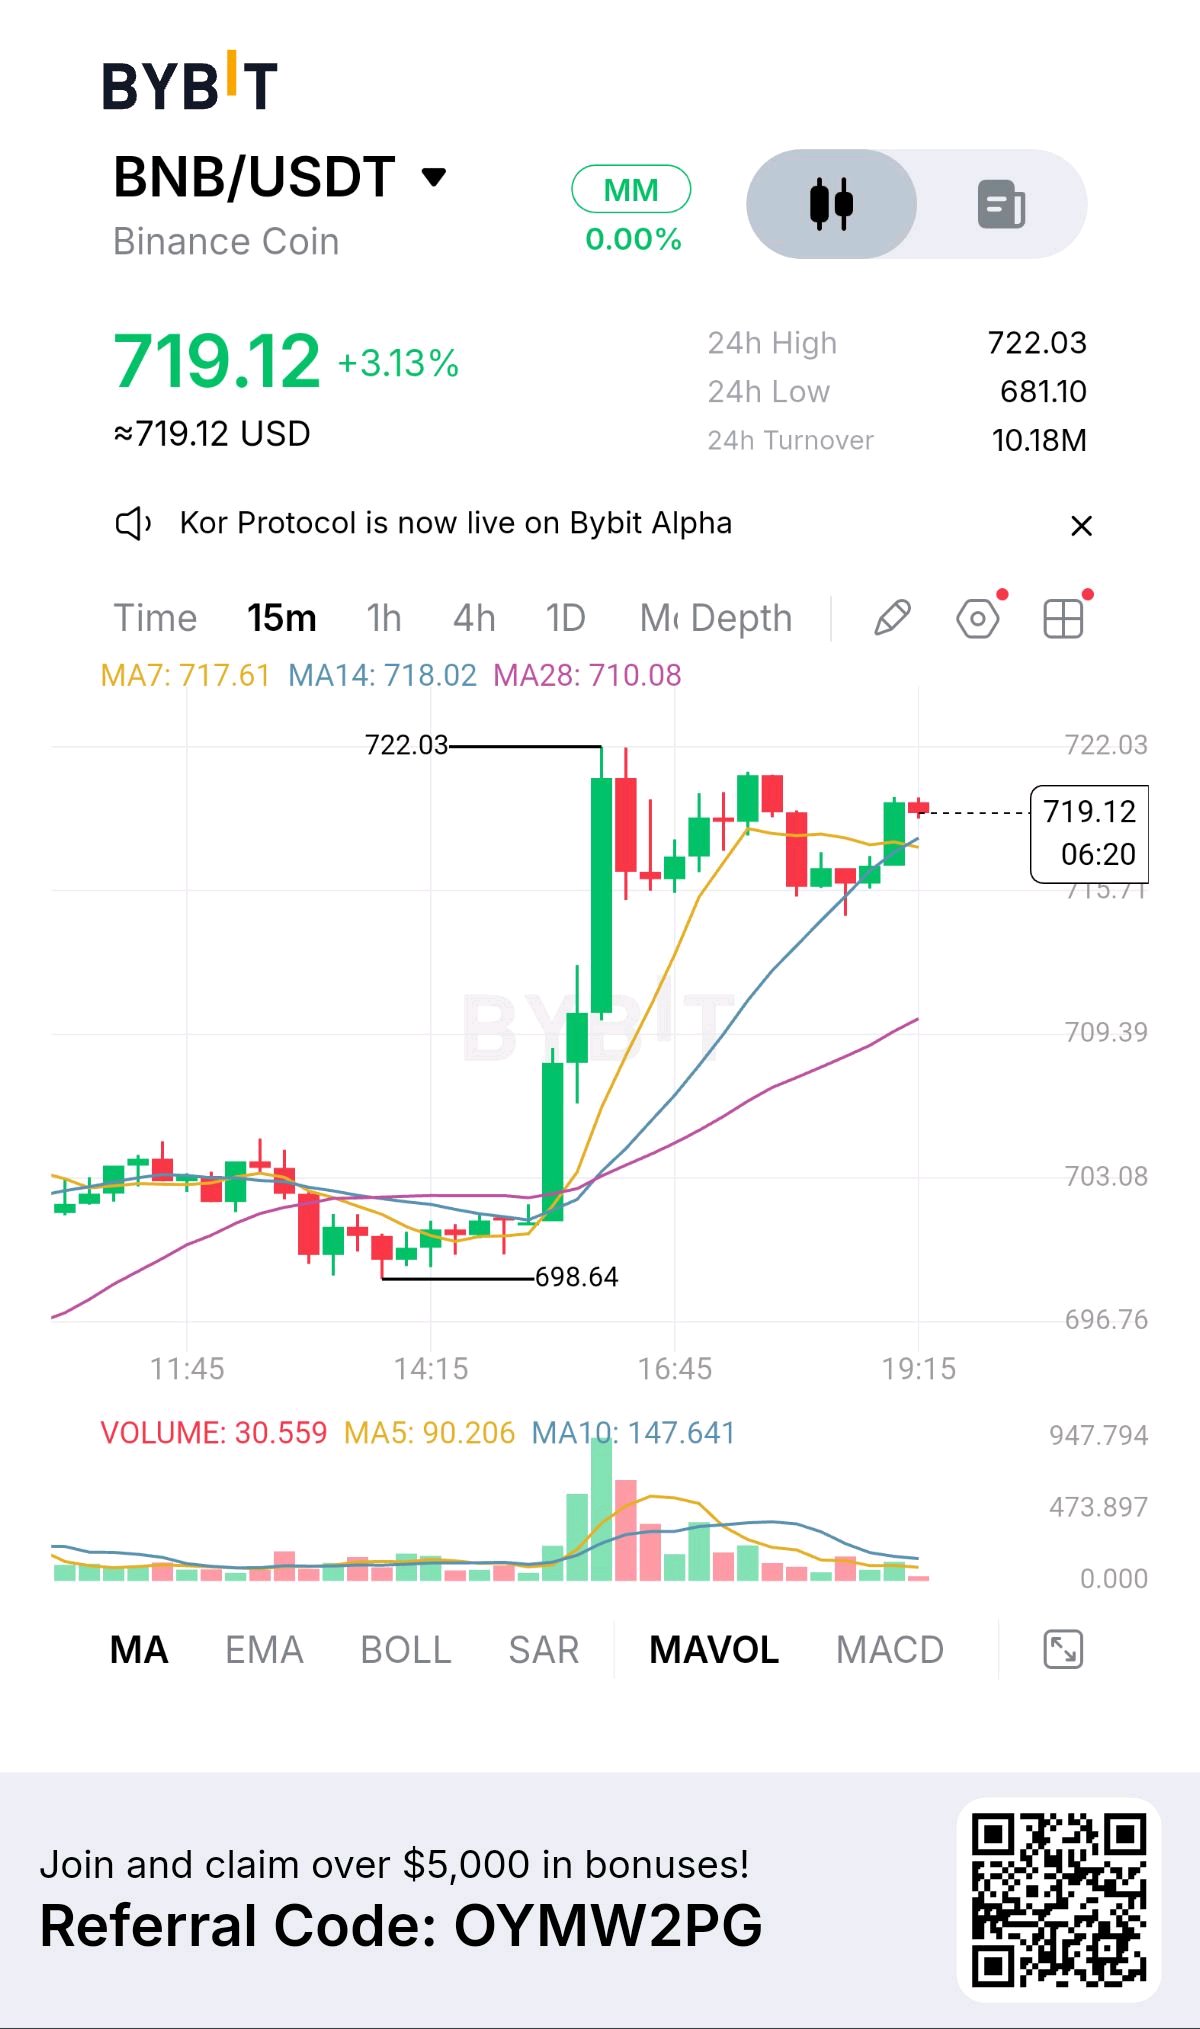
$BNBUSDT 在過去 24 小時內上漲了 3.13%,目前交易價格為 719.12,此前從 698.64 一路上升至 722.03 的短期高點。這波走勢之所以有趣,不僅是因為它出現了反彈,還在於價格在觸及高點後的表現。 BNB 並未回吐大部分漲幅,而是在 717–719 區域附近進行盤整。 移動平均線顯示出看漲格局:MA7 位於 717.61,MA14 為 718.02,MA28 為 710.08。價格仍保持在所有三條均線之上,且均線呈向上排列。這表明買方仍佔優勢,儘管短期的 MA7 和 MA14 線靠得很近,需密切留意。 市場目前面臨一個明確的考驗。 若 15 分鐘線能強勢收於 722.03 上方,將證明上漲動能已重新開啟。在此之前,阻力位尚未被突破。 如果價格跌破 717.61,盤整可能會轉為更深度的回調,屆時 710.08 將成為重要的支撐參考點。 盤整期間成交量下降,可能顯示交易活動在反彈後趨於冷卻。這本身並不能保證會出現另一次突破。 關鍵問題在於,BNB 是否正在積蓄足夠的實力再次挑戰 722.03,還是買方需要更深度的回調才會發動下一波行情。 你會選擇等待 722.03 確認突破,還是觀察回調並守住移動平均線支撐?#ByXIMPACT #比特幣跌破 8 萬美元
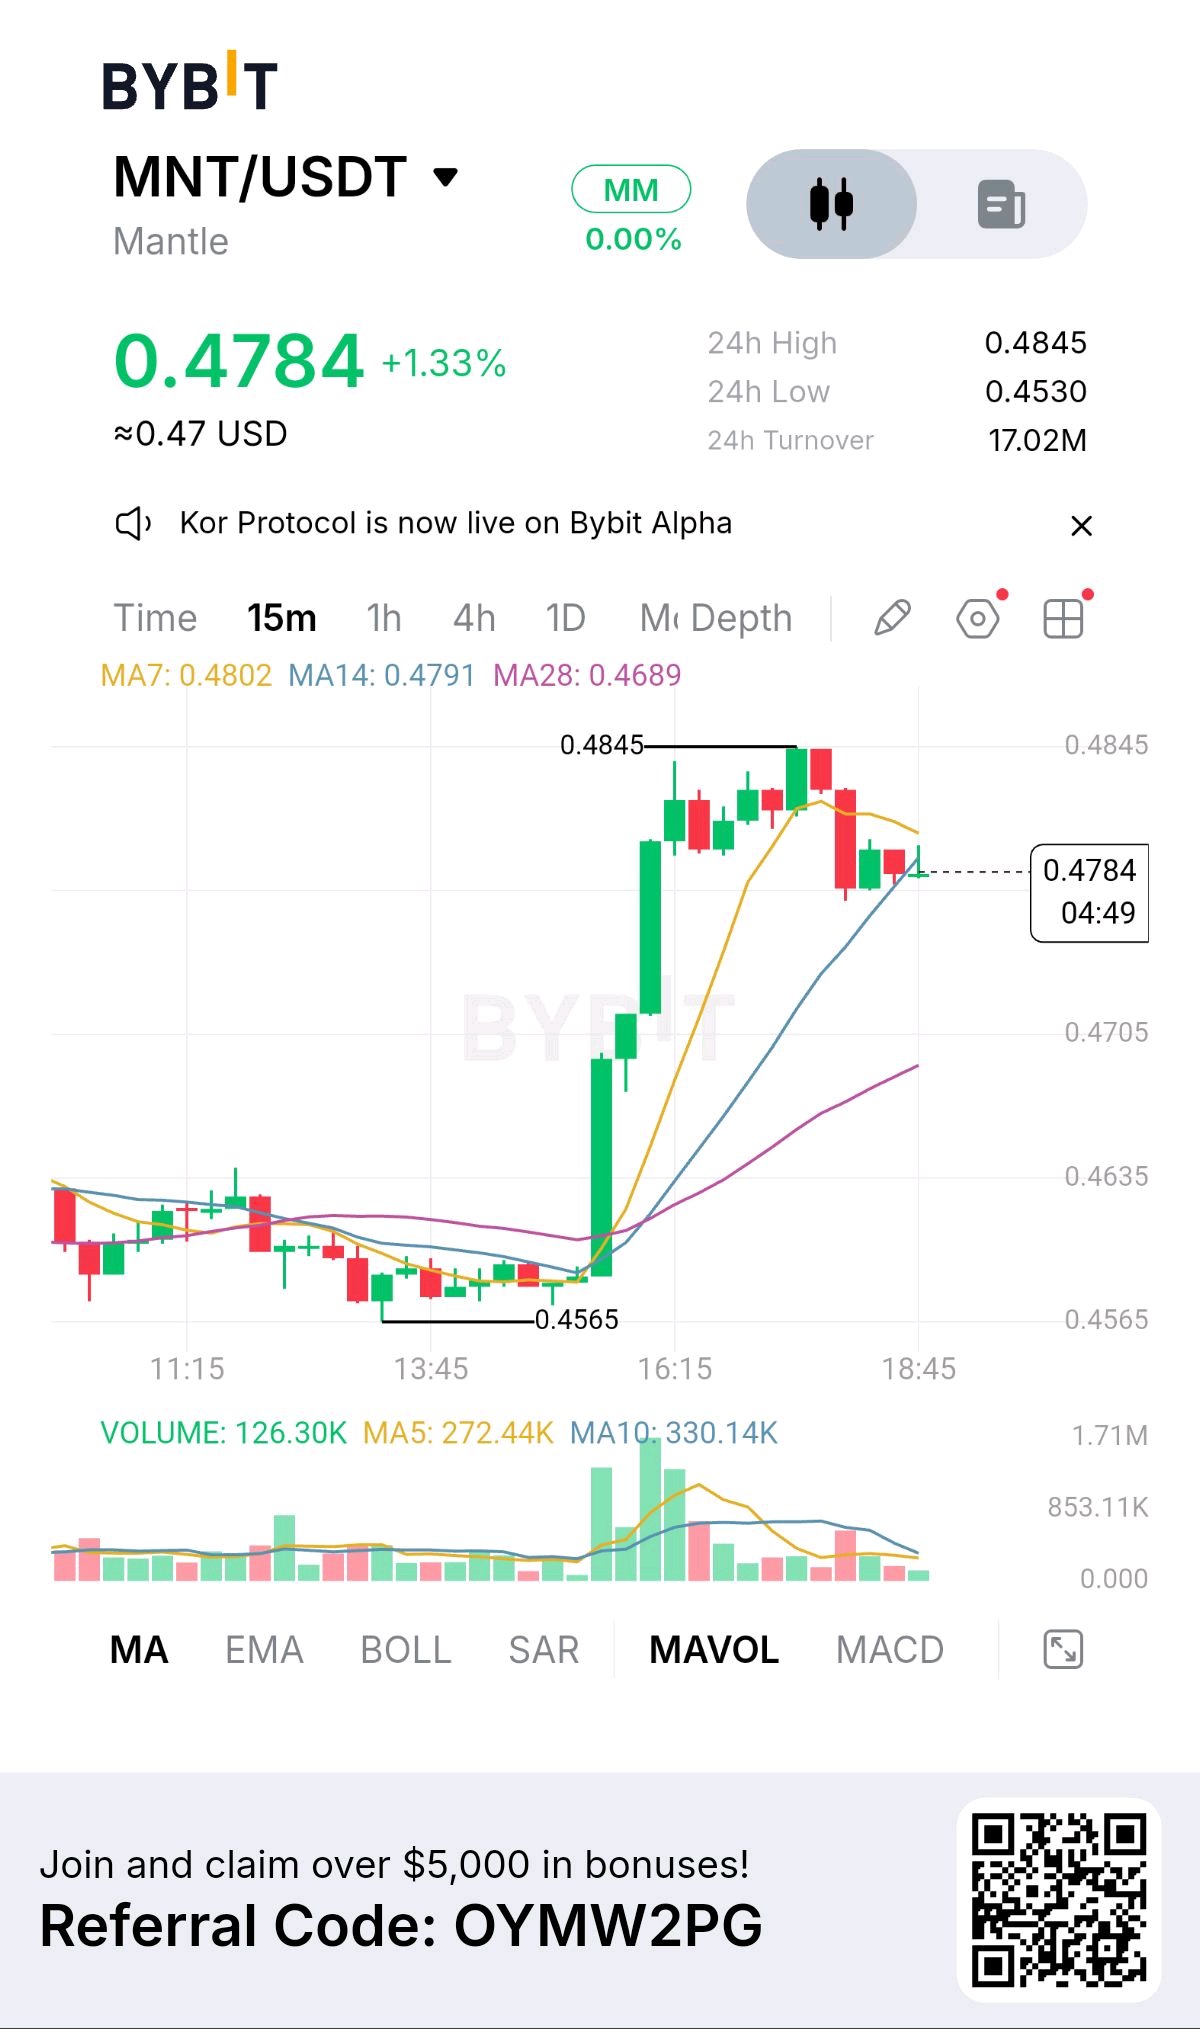
$MNTUSDT 正在維持其每日漲幅,但從 0.4565 到 0.4845 的漲勢目前正受到動能測試。 在強勁的上漲後,價格已回調至 0.4784。目前位於 0.4802 的 MA7 和 0.4791 的 MA14 之下,顯示短期買盤動能已減弱。不過,價格仍維持在 0.4689 的 MA28 之上,這使得更廣泛的復甦結構仍有一個關鍵支撐位在起作用。 下一步走勢將決定市場的方向。 若 15 分鐘線能強勢收在 0.4802 之上,將強化復甦態勢,並讓 0.4845 的高點重新成為焦點。另一方面,若決定性跌破 0.4689,可能會測試 0.4635 區域。 這次回調與真正的趨勢反轉之間的區別,將取決於價格在這些水平附近的反應。回調成交量低於上漲成交量這一點值得關注,但這並不能證明賣方已失去控制。 MNT 尚未顯示出確認的延續訊號。買方需要重新奪回短期動能,而 MA28 仍然是一個關鍵的下行參考。 買方會將這次回調轉變為再次推向 0.4845 的動力,還是復甦會在 0.4689 下方失去根基?#ByXIMPACT #比特幣跌破 8 萬美元 #WSOTPicktoEarn10U

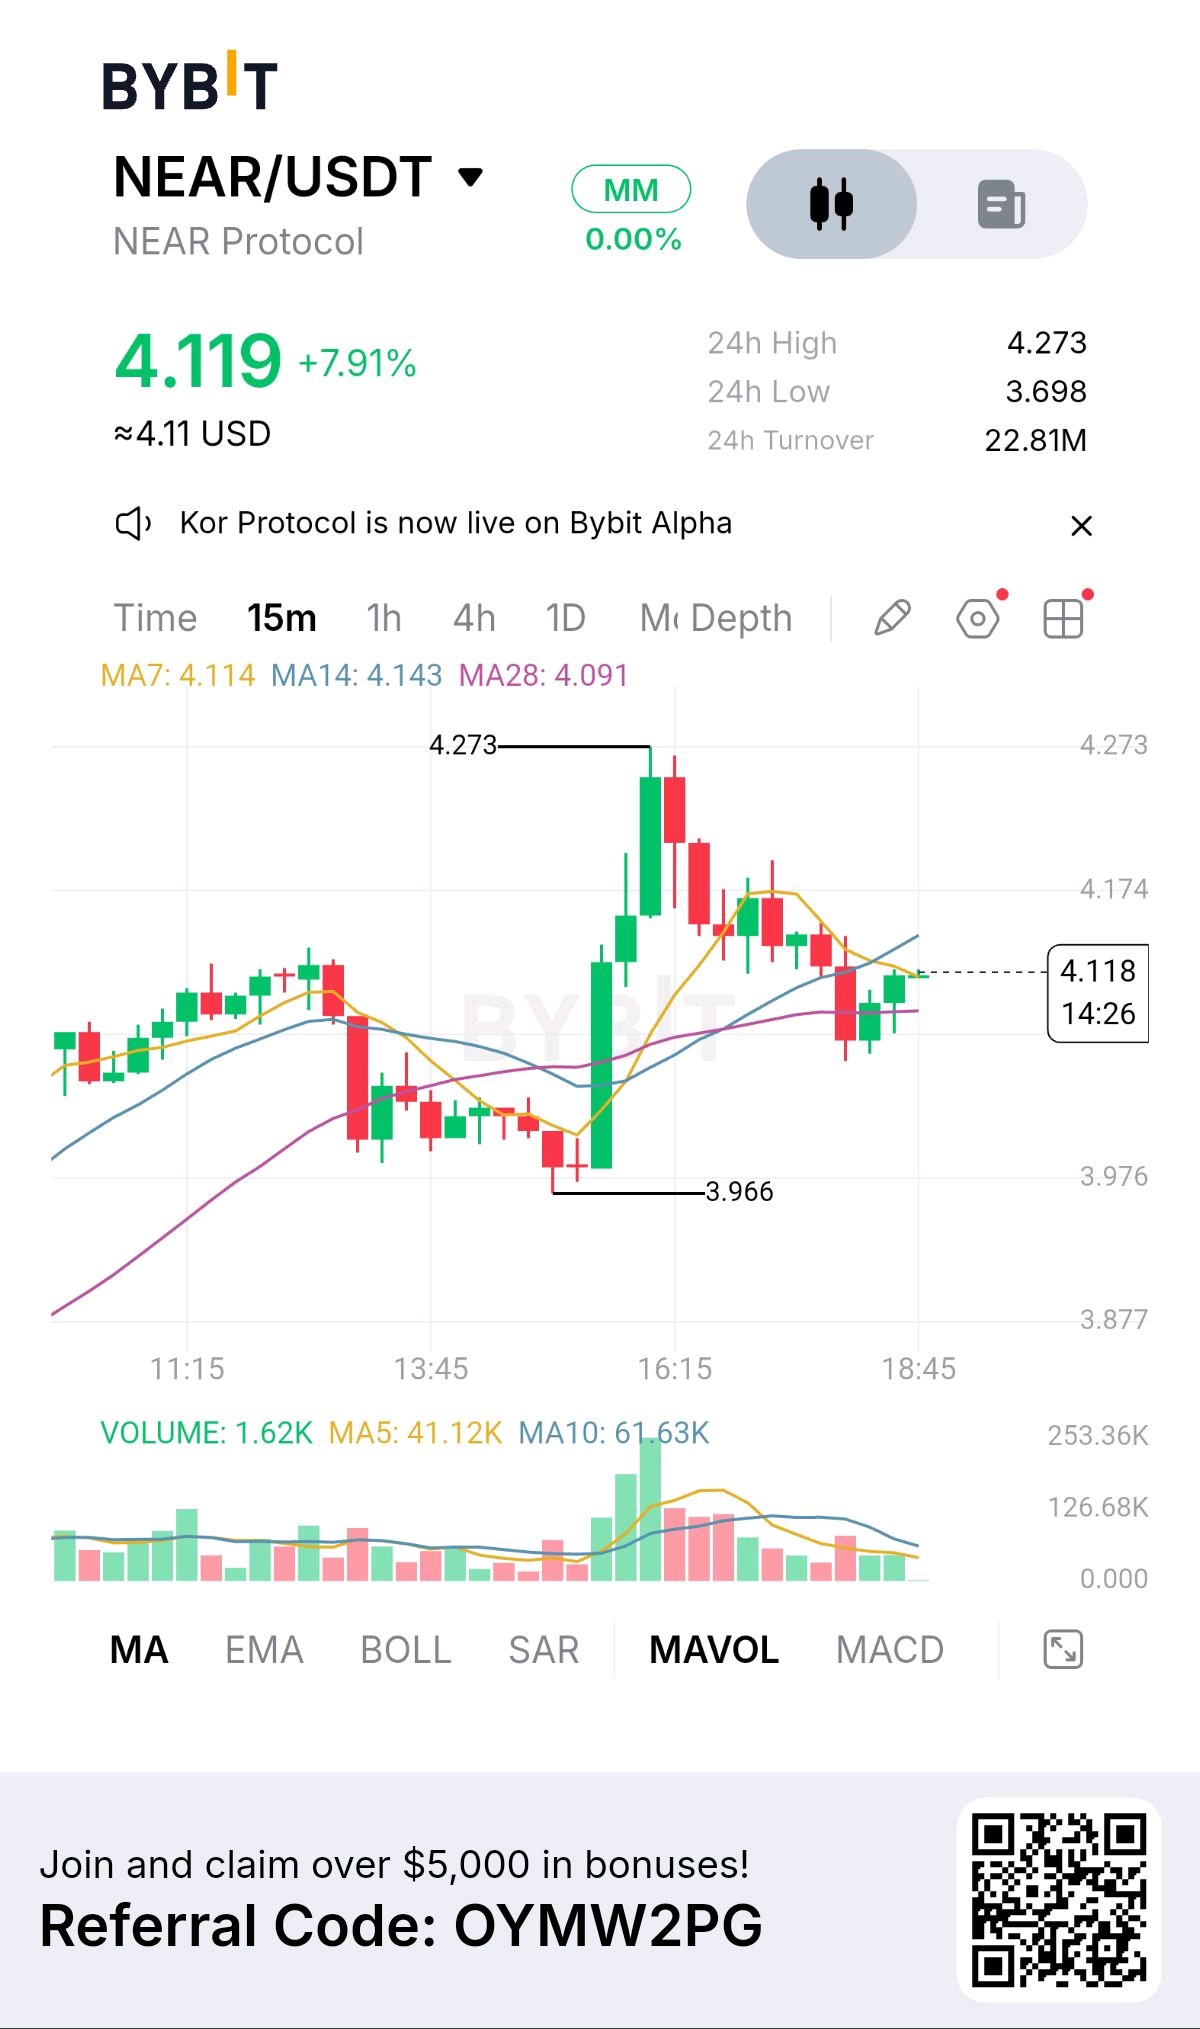
$NEARUSDT 在 24 小時內上漲了 7.91%,但漲勢目前面臨另一個挑戰:守住漲幅。 在強勁買盤推動下,價格從 3.966 上升至 4.273,隨後回調至 4.119。動能已冷卻,短期移動平均線開始區分出反彈行情與潛在更深層修正的分界點。 目前的交戰位置如下: MA7:4.114 MA14:4.143 MA28:4.091 價格略高於 MA7 和 MA28,但仍低於 MA14。這意味著 4.143 是買方需要立即奪回的關鍵水準,而 4.091 則是重要的支撐參考點。 如果買方能守住 MA28 並推動 NEAR 強勢收盤於 4.143 之上(15 分鐘線),反彈行情可能會重拾動能,向 4.273 邁進。 但若決定性地收盤於 4.091 以下,將會削弱看漲結構,並使 3.976 區域成為焦點。 值得注意的一個細節是:據報導回調時的成交量比推動漲勢時的成交量要輕。這可能暗示賣壓較弱,但並不能保證修正已經結束。 NEAR 已經展現了強勁的上漲動能。現在市場必須證明買方是否能守住這些漲幅。 這是一個在再次衝擊 4.273 前的健康停頓,還是更深層回撤的開始?#ByXIMPACT #Oracle20B 資金計劃測試 TheAITrade

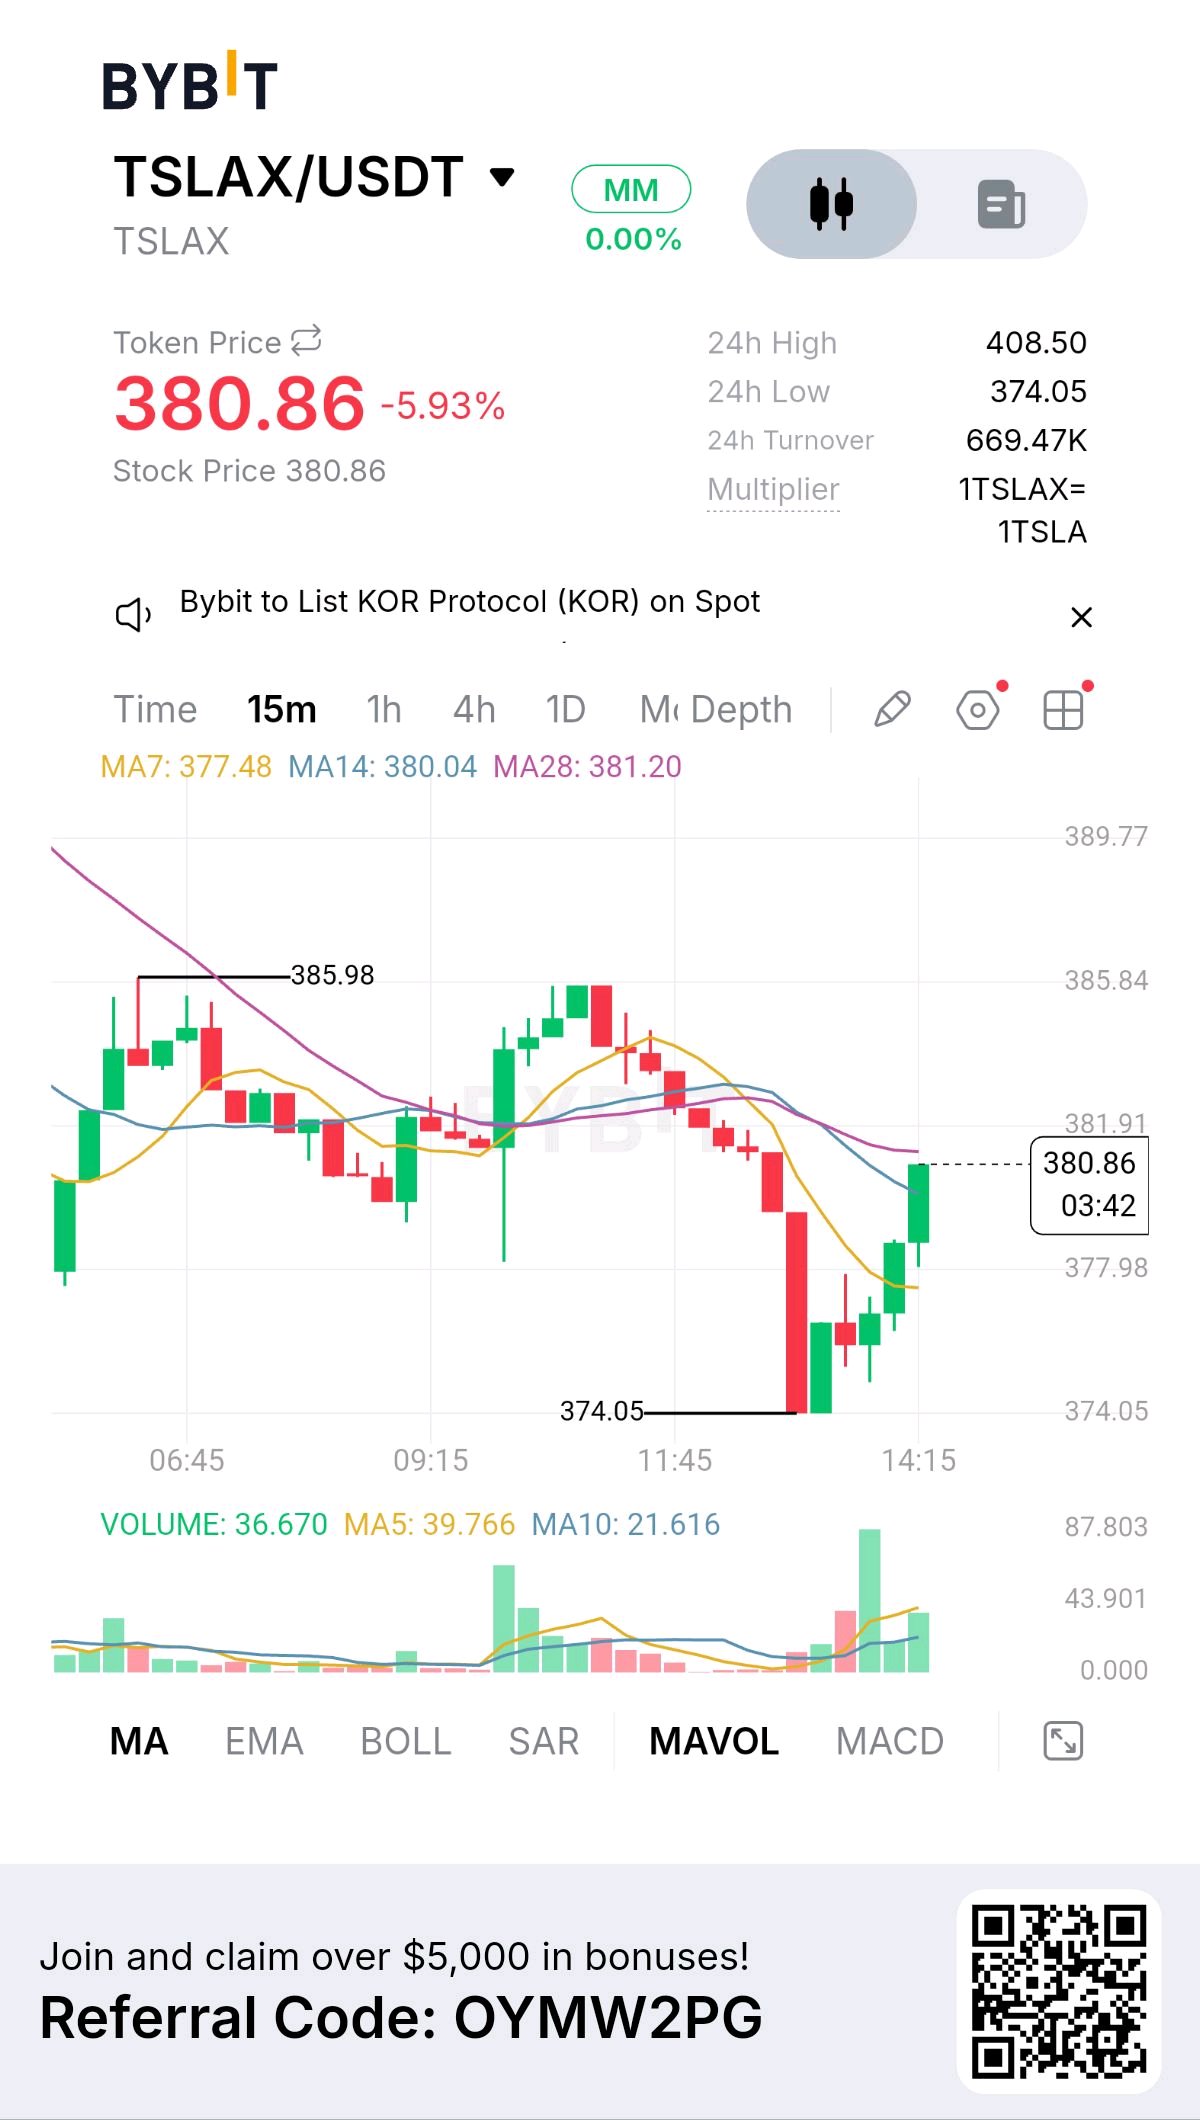
TSLAXUSDT 已從 374.05 反彈至 380.86,但更大的問題在於這波復甦是否有足夠的力道來扭轉短期的看跌結構。 儘管從盤中低點回升,TSLAX 在 24 小時內仍下跌了 5.93%。從 385.98 開始的下跌走勢相當猛烈,且 374.05 附近的沉重賣壓顯示出這波跌勢有多劇烈。 現在平衡正在改變。 價格已收復 377.48 的 MA7 和 380.04 的 MA14,正直接朝 381.20 的 MA28 邁進。這是復甦行情必須證明自己實力的地方。 若 15 分鐘線確認收盤於 381.20 上方,將增強看漲理由,並使 385.98 重新成為焦點。然而,若在此阻力位遭到拒絕,隨後跌破 380.04,可能會削弱反彈力道並下探 377.98,而 374.05 仍是主要的下行參考點。 重要的是要區分復甦並不等於反轉。買方雖然收復了失土,但在市場結構被視為走強之前,他們仍需克服阻力。 下一根 K 線的收盤價比反彈本身更重要。 TSLAX 是否會將此復甦轉化為 381.20 以上的真正反轉,還是賣方會利用這次反彈作為重新奪回控制權的機會?ByXIMPACT

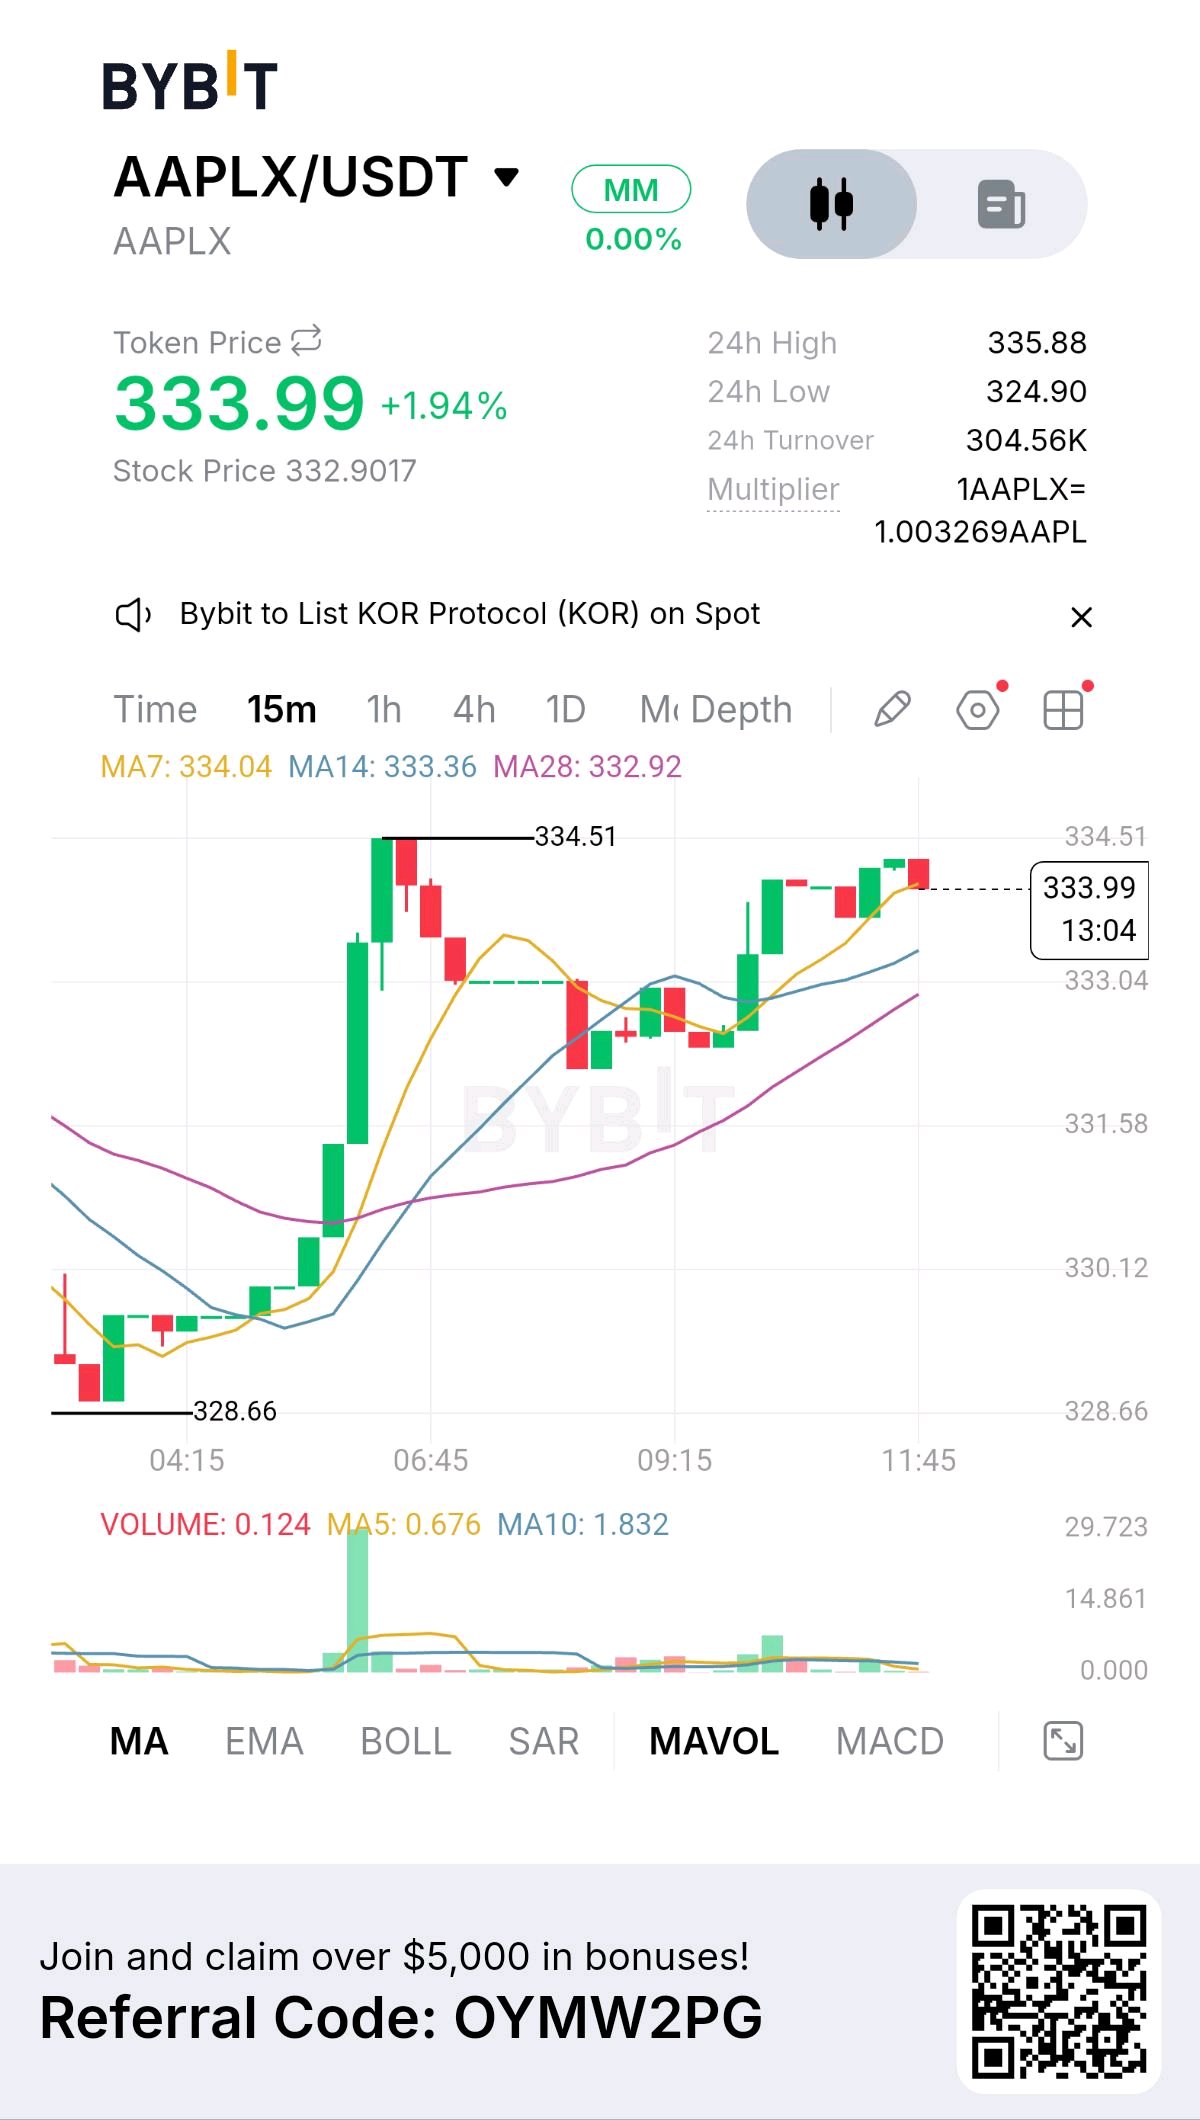
$AAPLXUSDT 正迎來決定性時刻。買方已從近期的跌勢中恢復,目前正在挑戰先前阻礙漲勢的同一阻力位。 目前交易價格為 333.99,該代幣 24 小時內上漲 1.94%。交易區間為 324.90–335.88,成交量為 304.56K,標的股票乘數為 1.003269。 為什麼這次測試很重要 15 分鐘線圖顯示,買方已從 328.66 點回升,並正向 334.51 點推升。經歷短暫回調後,價格已重返該水位並再次嘗試挑戰天花板。 這產生了一個重要的市場問題:第二次嘗試能否突破,還是賣方將再次守住該關卡? 目前的技術結構對買方有利: MA7: 334.04 MA14: 333.36 MA28: 332.92 均線呈多頭排列,且價格維持在 MA14 和 MA28 之上。不過,價格仍略低於 MA7,顯示短期動能正在接受考驗。 兩種結果,兩種不同訊號 若 15 分鐘線強勢收在 334.51 之上,且最好能有成交量配合,將能加強突破的力道,並將焦點轉向 335.88。 反之,若在 334.51 處遇阻回落,隨後跌破 333.36,則可能下探 332.92 的支撐區。 洞察 反覆的阻力測試很重要,因為它們揭示了買方是否能維持壓力。然而,多次逼近同一水位並不保證一定會突破。 對於 AAPLX 而言,下一次突破嘗試的質量遠比嘗試次數來得重要。 我想請問社群:買方最終能突破 334.51 嗎?還是我們即將看到同樣的天花板再次引發回調?#ByXIMPACT #比特幣跌破 8 萬美元
熱度高漲:牛市正在反擊
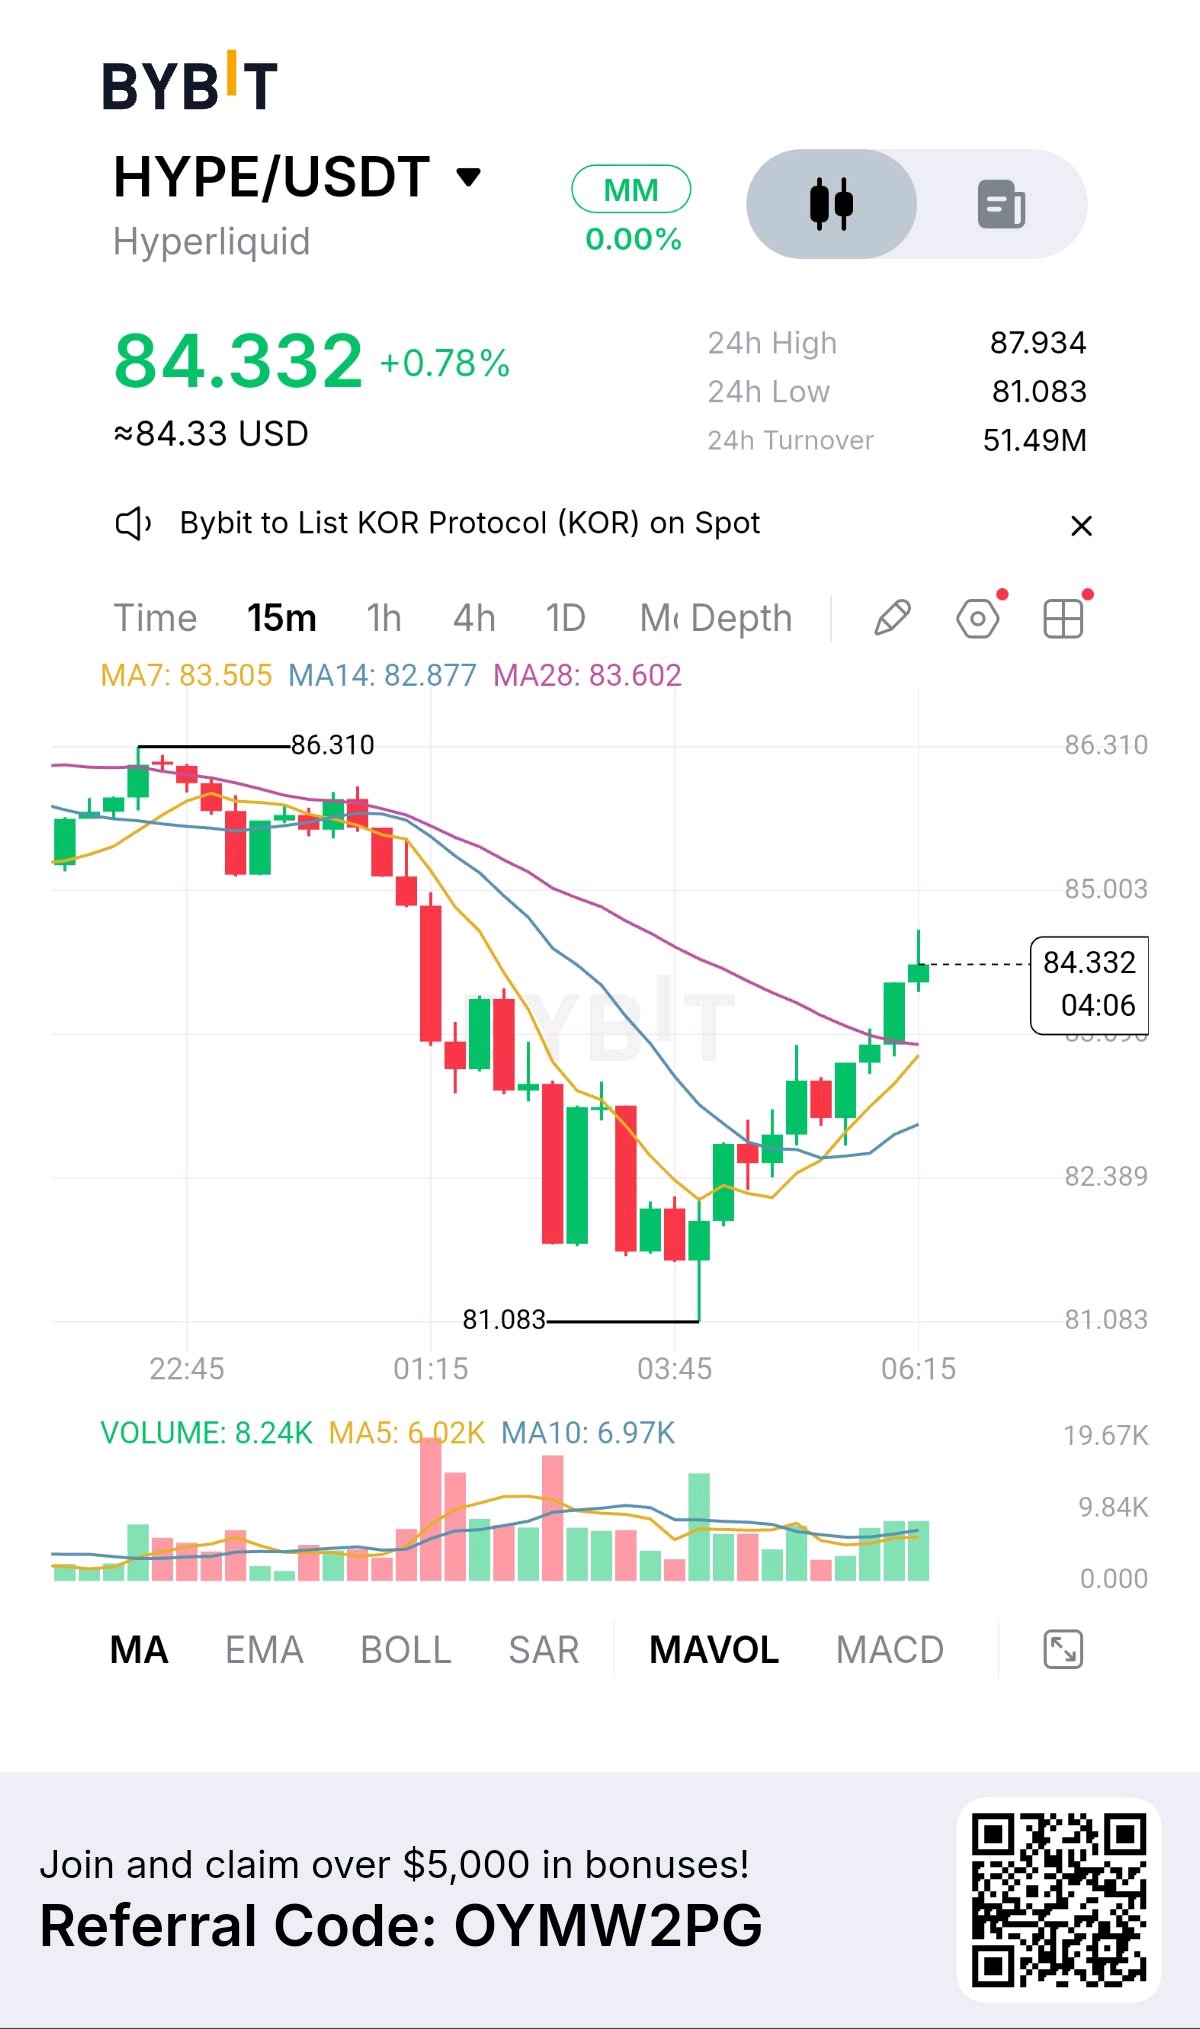
在跌至 81.083 的低點後,HYPE 面臨了沉重的拋售壓力。現在,買方正在反擊,復甦勢頭已難以忽視。 $HYPEUSDT 目前交易價格為 84.332,24 小時內上漲 0.78%。價格波動區間在 81.083 至 87.934 之間,成交量達到 5149 萬。 但接下來這點讓這次復甦變得很有趣。 市場結構正在改變 在從 86.310 跌至 81.083 後,HYPE 開始形成更高的低點與更高的高點。這顯示買方正在逐步重建短期動能。 移動平均線增添了另一個重要細節: MA7: 83.505 MA14: 82.877 MA28: 83.602 價格已回升至這三條均線之上。這是一個令人鼓舞的發展,但下一個阻力位將決定這是一次真正的趨勢復甦,還僅僅是短暫的反彈。 85.003 是真正的考驗 這就是戰況變得有趣的地方。 若 15 分鐘線能強勢收於 85.003 上方,可能會增強看漲論點,並讓 86.310 重新成為焦點。 然而,如果未能突破阻力,可能會引發新一波回調。若跌破 83.602,復甦走勢將會減弱,而 82.389 將成為一個重要的下行參考點。 我正在關注的一件事 最重要的问题不在於 HYPE 復甦了多少,而在於買方能否守住他們收復的陣地。 當阻力位轉變為支撐位時,復甦才更具意義。在此之前,確認訊號比情緒更重要。 來聽聽各位的市場觀點:HYPE 是否正準備再次衝向 86.310,還是您預期賣方會再次捍衛 85.003?ByXIMPACT

ONDO:多頭重掌局勢
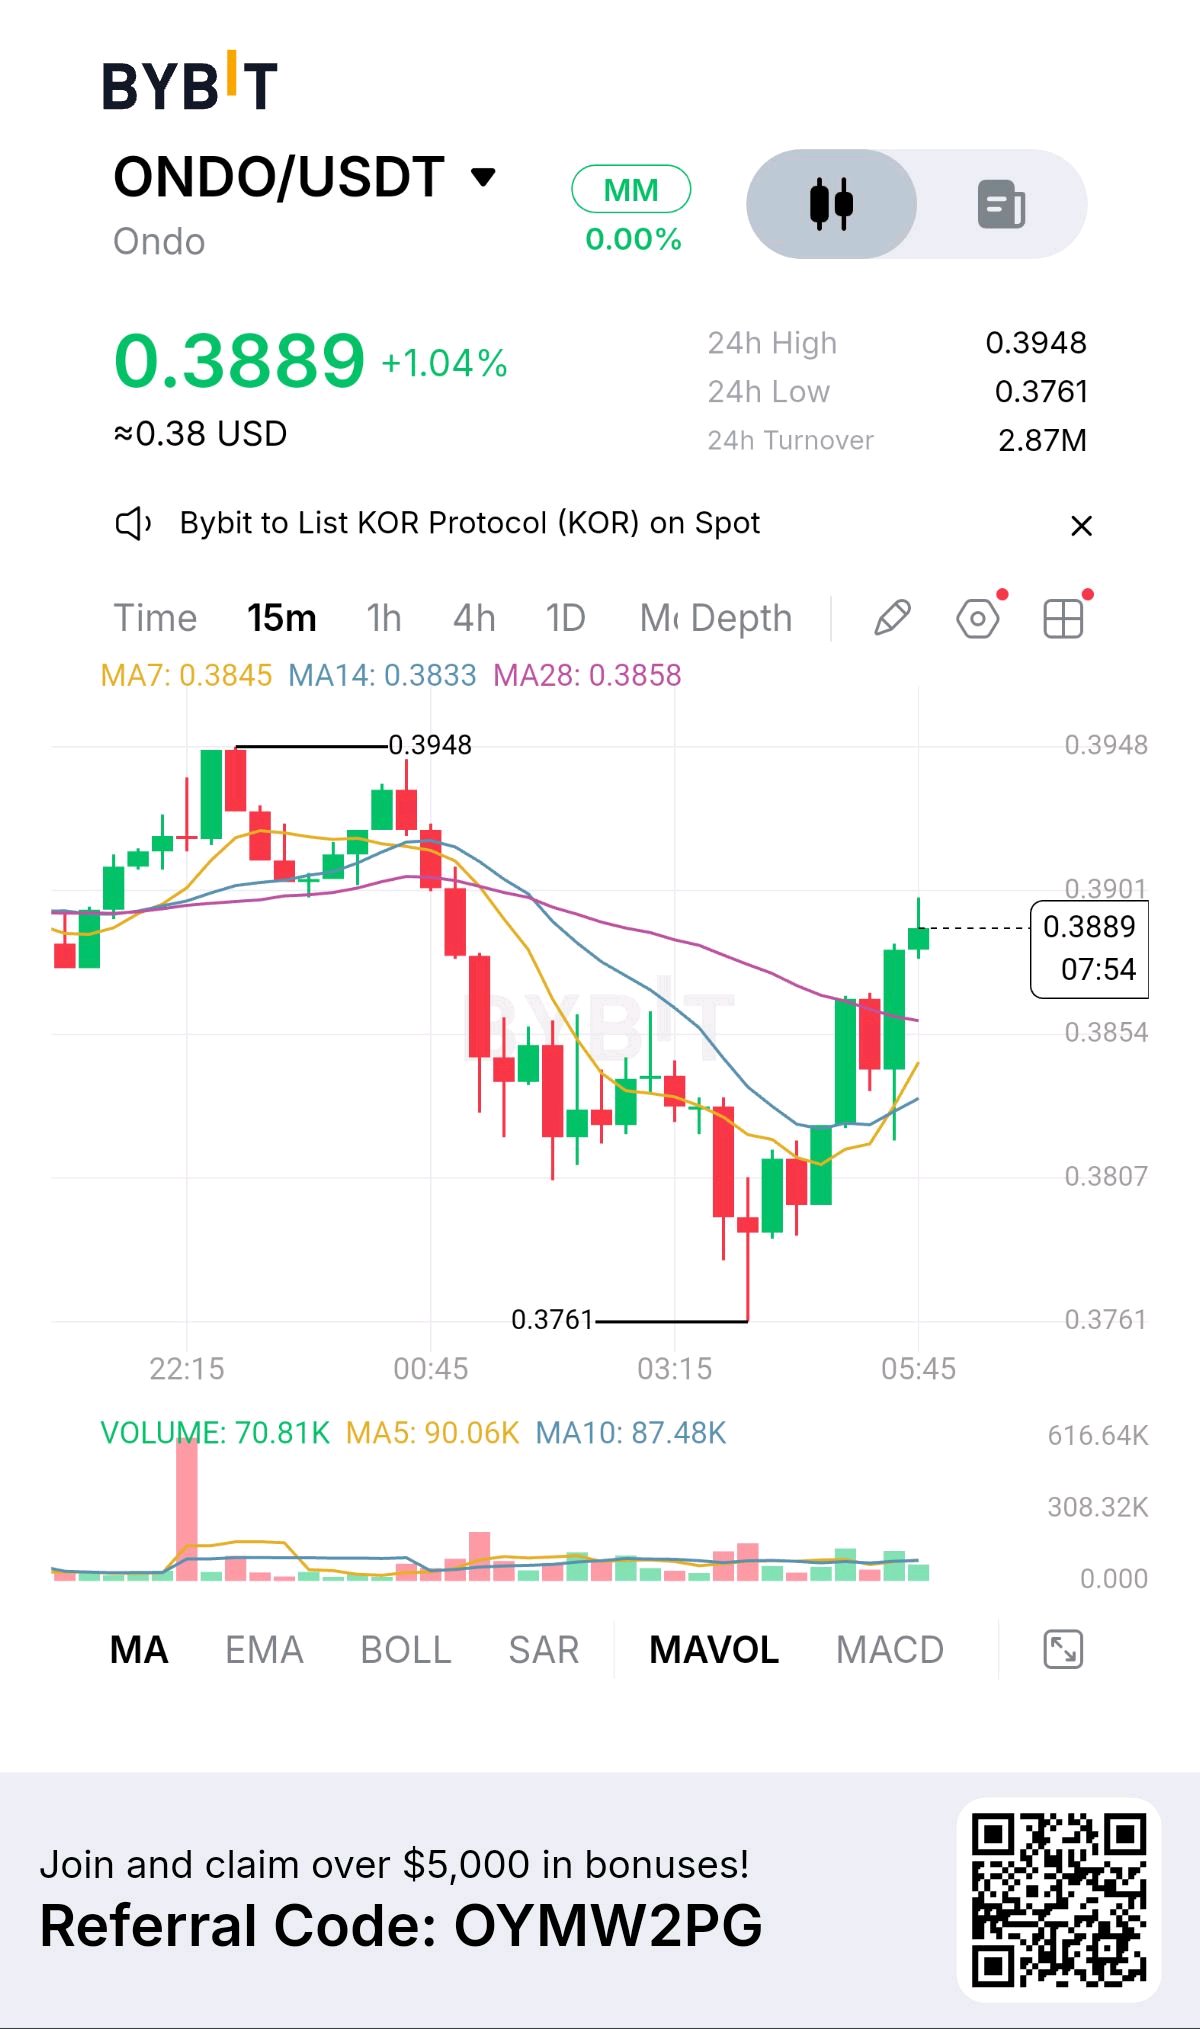
這次拋售非常劇烈。隨後的反彈同樣重要。但 ONDO 現在面臨一項測試,這可能會決定此次反彈是否會發展為更強勁的上漲走勢。 $ONDOUSDT 目前交易價格為 0.3889,24 小時內上漲 1.04%。盤中高點為 0.3948,低點為 0.3761,成交量已達 287 萬。 市場控制權的轉移 15 分鐘線圖揭示了價格走勢的劇烈變化。 在達到 0.3948 後,ONDO 出現了跌向 0.3761 的劇烈下挫。隨後買方進場,推動反彈,使價格回升至短期移動平均線上方。 這種反彈之所以重要,是因為市場已不再處於盤中低點。然而,收復失地只是第一步。買方仍需挑戰近期的反彈高點。 技術證據 當前移動平均線: MA7:0.3845 MA14:0.3833 MA28:0.3858 價格為 0.3889,高於這三條均線。這為短期結構提供了正面偏向,並表明買方已重新獲得部分控制權。 但動能現在必須在 0.3901 附近證明自己。 可能改變一切的關鍵點位 如果 15 分鐘線能穩健收於 0.3901 上方,將能增強反彈力道,並使盤中高點 0.3948 再次成為焦點。 若無法突破阻力,可能會引發另一次回調。第一個重要的支撐位參考是 0.3858,如果賣壓增加,則為 0.3807。 若持續跌破 0.3858,將會削弱當前的反彈結構。 我的觀點 ONDO 的走勢已不僅僅是從低點簡單反彈。它已收復其移動平均線集群,使買方處於比拋售期間更有利的技術位置。 儘管如此,我不會將動能改善與確認突破混為一談。 真正的測試在於買方能否將 0.3901 轉變為一個被市場接受的點位,而不是另一個拒絕點。 ONDO 是準備再次挑戰 0.3948,還是 0.3901 的阻力將會終止此次反彈?#ByXIMPACT #比特幣跌破 8 萬美元
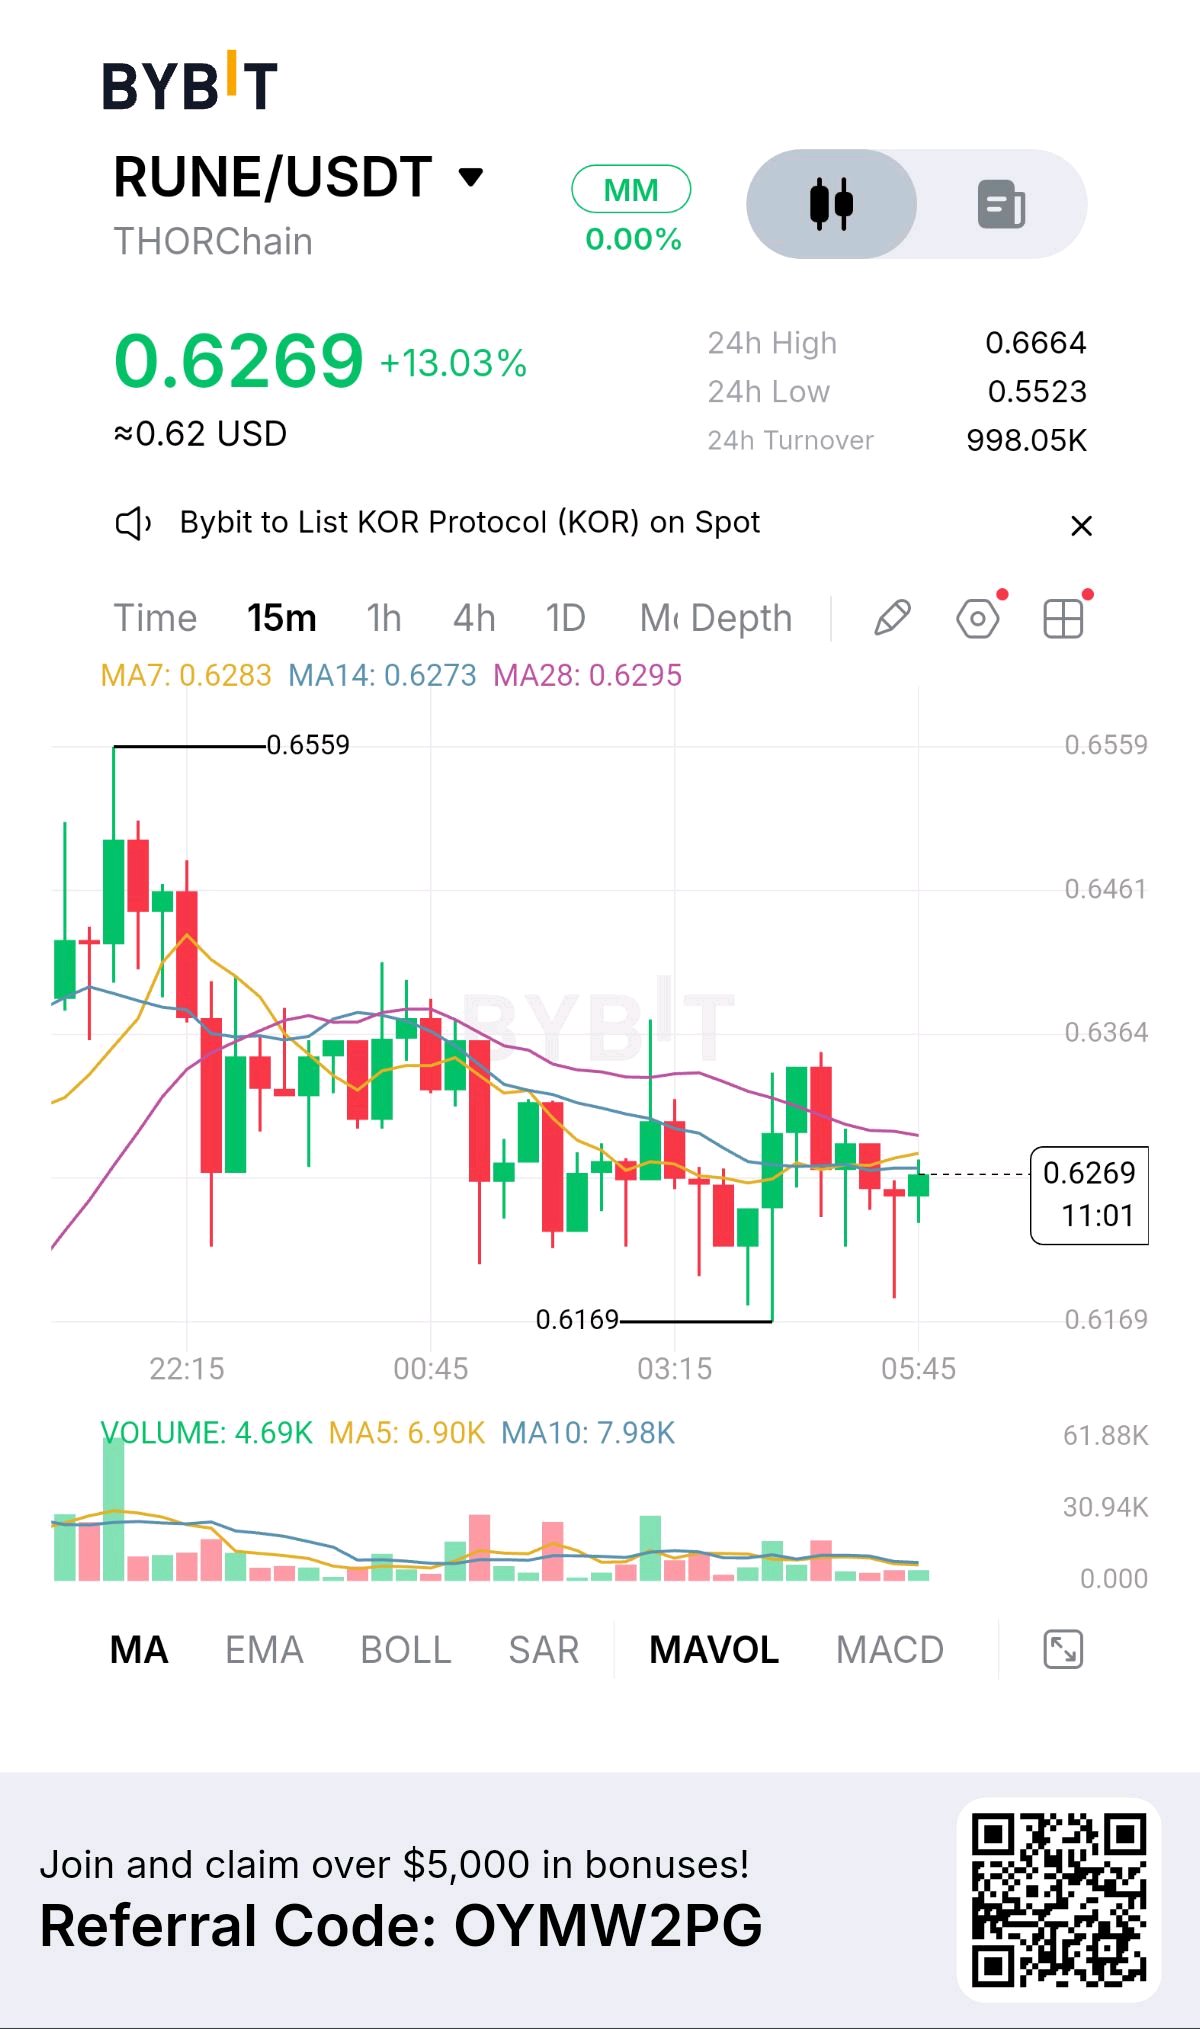
RUNE:上漲 13%,但多頭能奪回控制權嗎?
強勁的漲勢可以改變市場情緒,但守住這些獲利才是真正的戰場開始。 $RUNEUSDT 在 24 小時內上漲了 13.03%,目前交易價格為 0.6269。價格波動區間為 0.5523 至 0.6664,成交額達到 998.05K。 然而,15 分鐘線圖顯示了更複雜的情況。 在攀升至 0.6559 附近後,RUNE 經歷了劇烈反轉。賣方逐漸將價格壓低,直到買方在 0.6169 附近介入。從該區域的反彈令人鼓舞,但尚未重新奪回移動平均線簇。 動能測試 目前有三個關卡阻礙了更強勁的復甦: - 0.6273 — MA14 - 0.6283 — MA7 - 0.6295 — MA28 價格仍低於這三條均線。這意味著儘管有令人印象深刻的 24 小時表現,近期反彈仍面臨技術性阻力。 這裡有一個重要的區別:一個幣種在 24 小時內可能保持強勁正向,但其短期動能卻正在減弱。 戰局可能轉折之處 如果買方能以令人信服的 15 分鐘收盤價收復 0.6295,市場注意力可能會轉向 0.6364。這將是修復受損的短期結構的重要一步。 但如果再次遭到拒絕,RUNE 可能會變得脆弱。跌破 0.6269 將削弱當前的復甦勢頭,而 0.6169 仍然是需要關注的關鍵結構性低點。 反彈過程中相對平淡的成交量也意味著買方仍需展現更強的參與度。 更大的疑問 RUNE 已經實現了大幅上漲。現在的問題是買方能否守住這些績效,還是這波最新反彈將成為另一個更低的波段高點。 我會更關注 0.6295 附近的反應,而不是頭條新聞提到的 13% 漲幅。 RUNE 是在為另一波看漲擴張做準備,還是賣方正準備奪回控制權?#ByXIMPACT #區塊鏈安全 #Bybit 8 週年
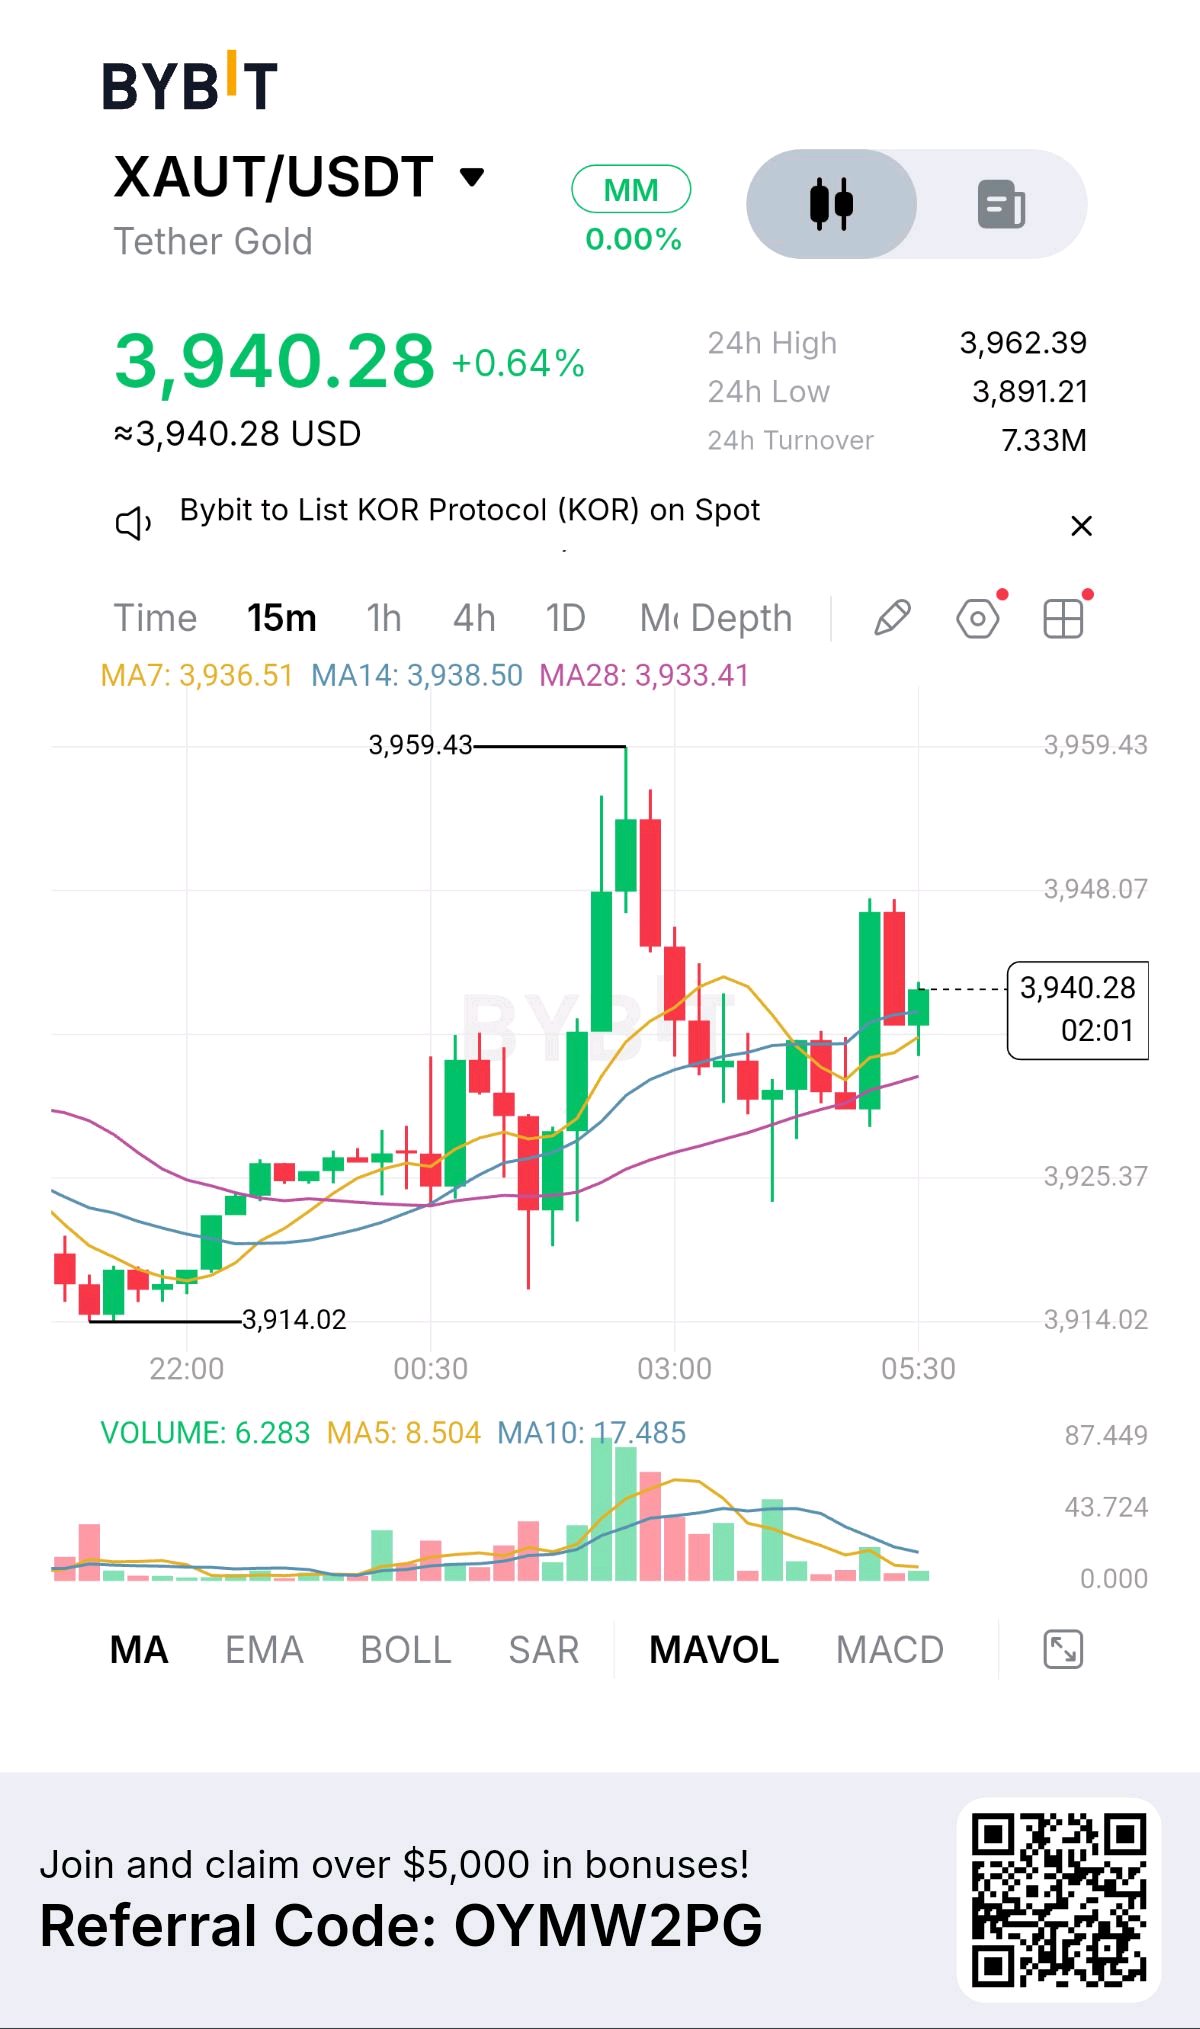
由黃金支持的 $XAUTUSDT 在從 3,914.02 回升後展現了韌性,但最新的價格走勢顯示買方仍面臨一場重要的攻防戰。 目前 XAUT 報價 3,940.28,24 小時內上漲 0.64%。其交易區間介於 3,891.21 至 3,962.39 之間,成交額為 733 萬。 圖表透露的真實訊息 向 3,959.43 挺進的漲勢顯示出強勁的買盤興趣。然而隨後的拒絕走勢,導致多頭未能守住高點的控制權。 現在的關鍵在於價格在移動平均線群附近的表現: MA7:3,936.51 MA14:3,938.50 MA28:3,933.41 XAUT 目前位於這三條均線之上。這對買方來說是令人鼓舞的跡象,但這些均線之間狹窄的距離暗示市場仍在尋找明確的方向。 關鍵的價格戰 3,948.07 區域是多頭需要克服的第一道障礙。在此之上,3,959.43 代表了前波高點,也是更為重大的突破測試。 另一方面,若失守 3,933–3,936 的支撐區,動能可能會轉向賣方。更深的回調將使 3,925.37 成為焦點。 我的市場解讀 這還不是確認的突破,也不是確認的逆轉。 重要的進展在於買方在回調後已收復移動平均線區間。如果他們能將 3,948.07 轉化為支撐,前波高點可能會再次面臨壓力。 但如果價格跌破均線群,目前的復甦走勢可能會迅速失去動能。 在這個市場中,下一根決定性的 K 線比近期的漲幅更重要。 買方是在為再次衝擊 3,959.43 做準備,還是這波回升已經後繼無力了?#ByXIMPACT #比特幣跌破 8 萬美元

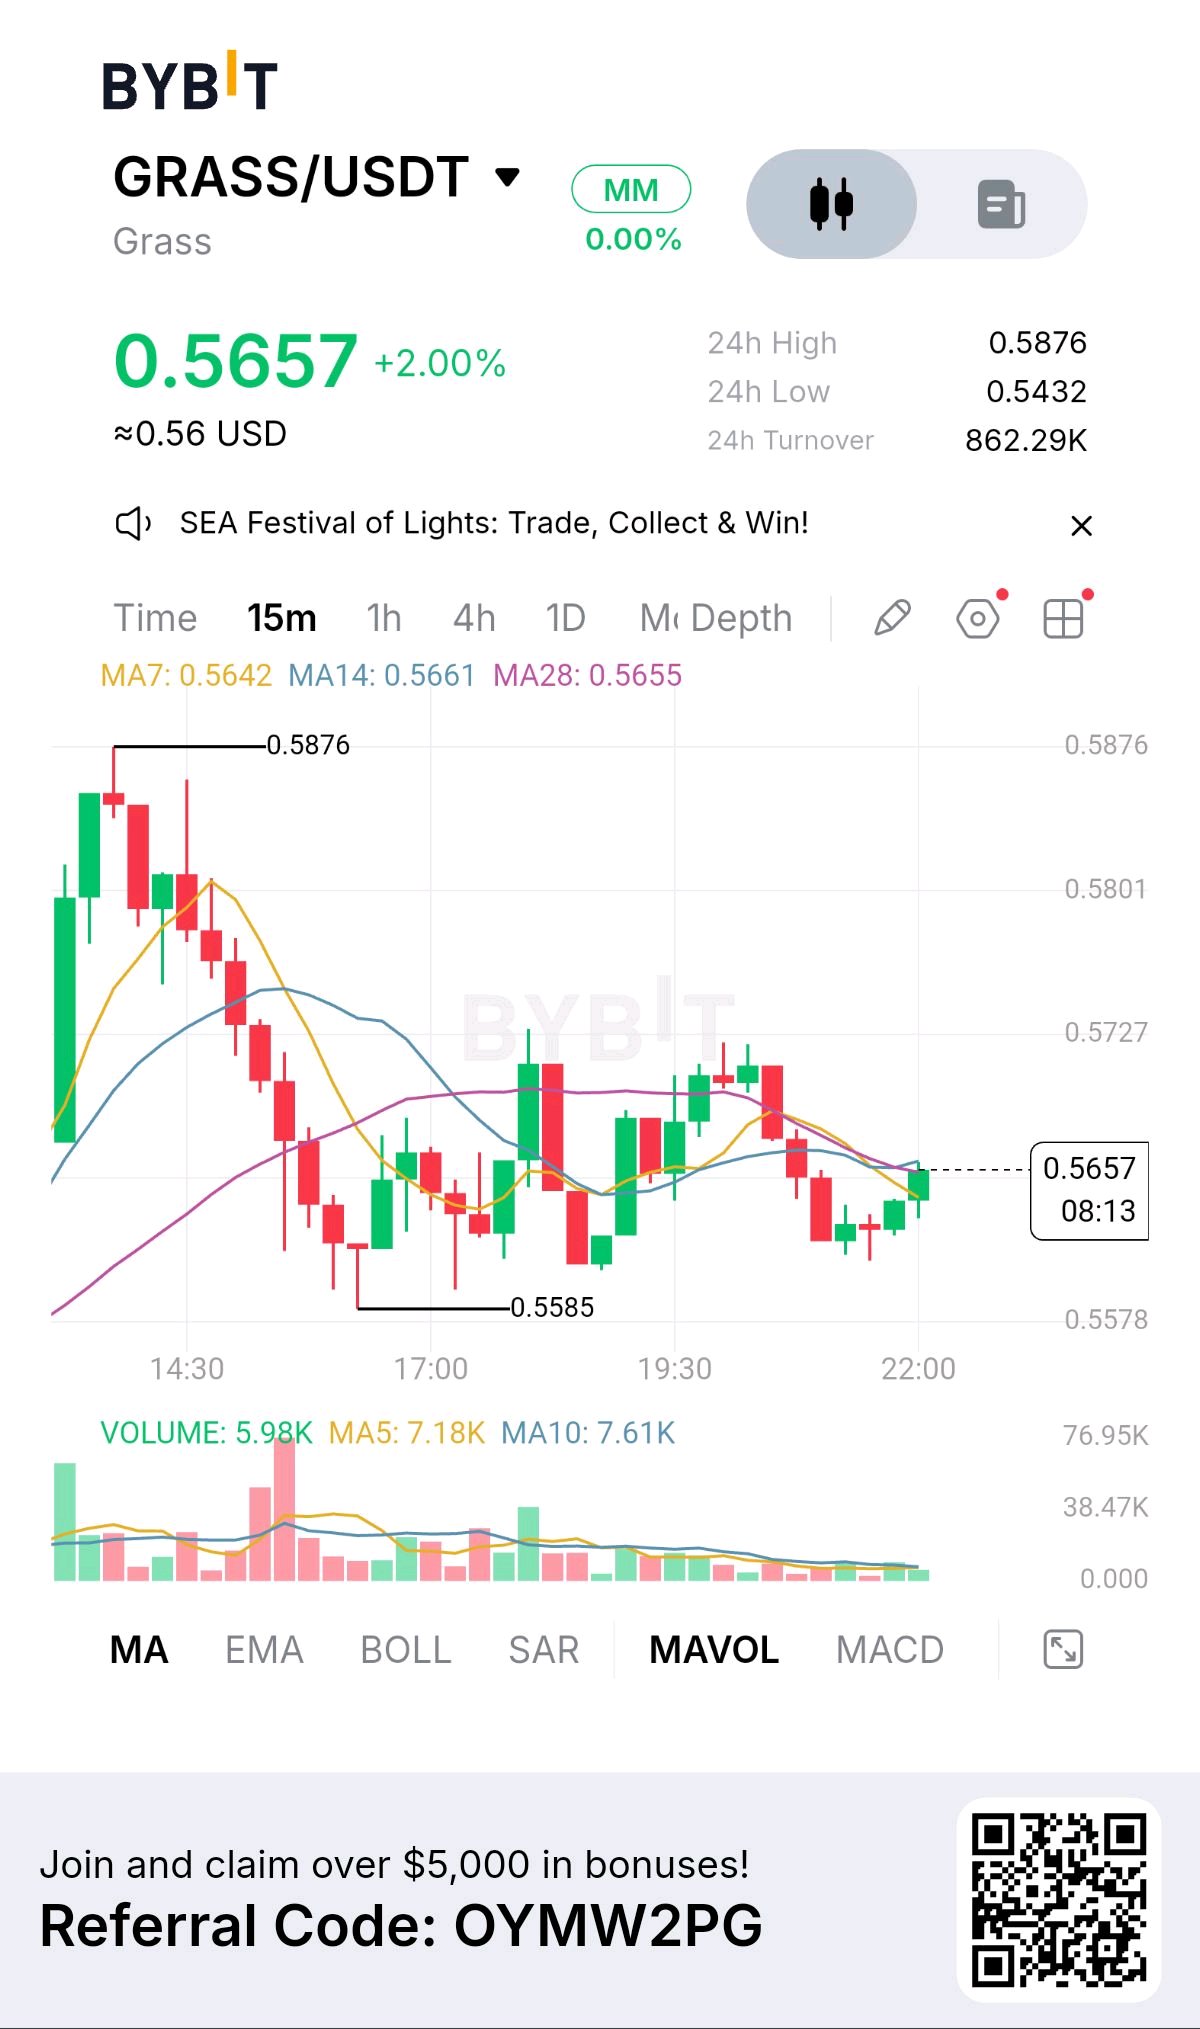
$GRASSUSDT 上漲了 2.00%,目前交易價格為 0.5657。24 小時波動區間為 0.5432 至 0.5876,成交量為 862.29K。 復甦來到決策點 15 分鐘線圖講述了在經歷大量拋售後的復甦故事。在達到 0.5876 的高點後,GRASS 跌至 0.5585 附近,隨後買方進場。 自該低點以來,價格透過更高低點逐漸回升。然而,反彈尚未發展成明確的上升趨勢。相反,市場正圍繞著一組密集的移動平均線橫向盤整。 三條均線,一個戰場 - MA7:0.5642 - MA14:0.5661 - MA28:0.5655 目前價格為 0.5657,GRASS 正處於此區間內交易。均線已趨於平緩,顯示先前的方向性動能已減弱。 成交量在盤整期間亦有所收縮,這顯示交易活動減少,而非買方或賣方佔據了確定性優勢。 下一步取決於確認訊號 若 15 分鐘線強勢收於 0.5661 之上,可能會給買方挑戰 0.5727 的機會。 若價格跌破 0.5642 且無法回升,市場焦點可能會回到近期的結構性低點 0.5585。 關鍵在於區分暫時性的區間波動與持續性的突破。成交量放大將會是更有用的確認訊號。 方向確立前的耐心 GRASS 目前正處於發展中的復甦與殘留的拋售壓力之間。雙方都尚未確立明確的控制權。 下一個遠離均線簇的決定性走勢,可能會提供市場下一個短期訊號。 哪個價位更值得關注:是用於看漲突破的 0.5661,還是可能看跌破位的 0.5642?#ByXIMPACT #比特幣跌破 8 萬美元
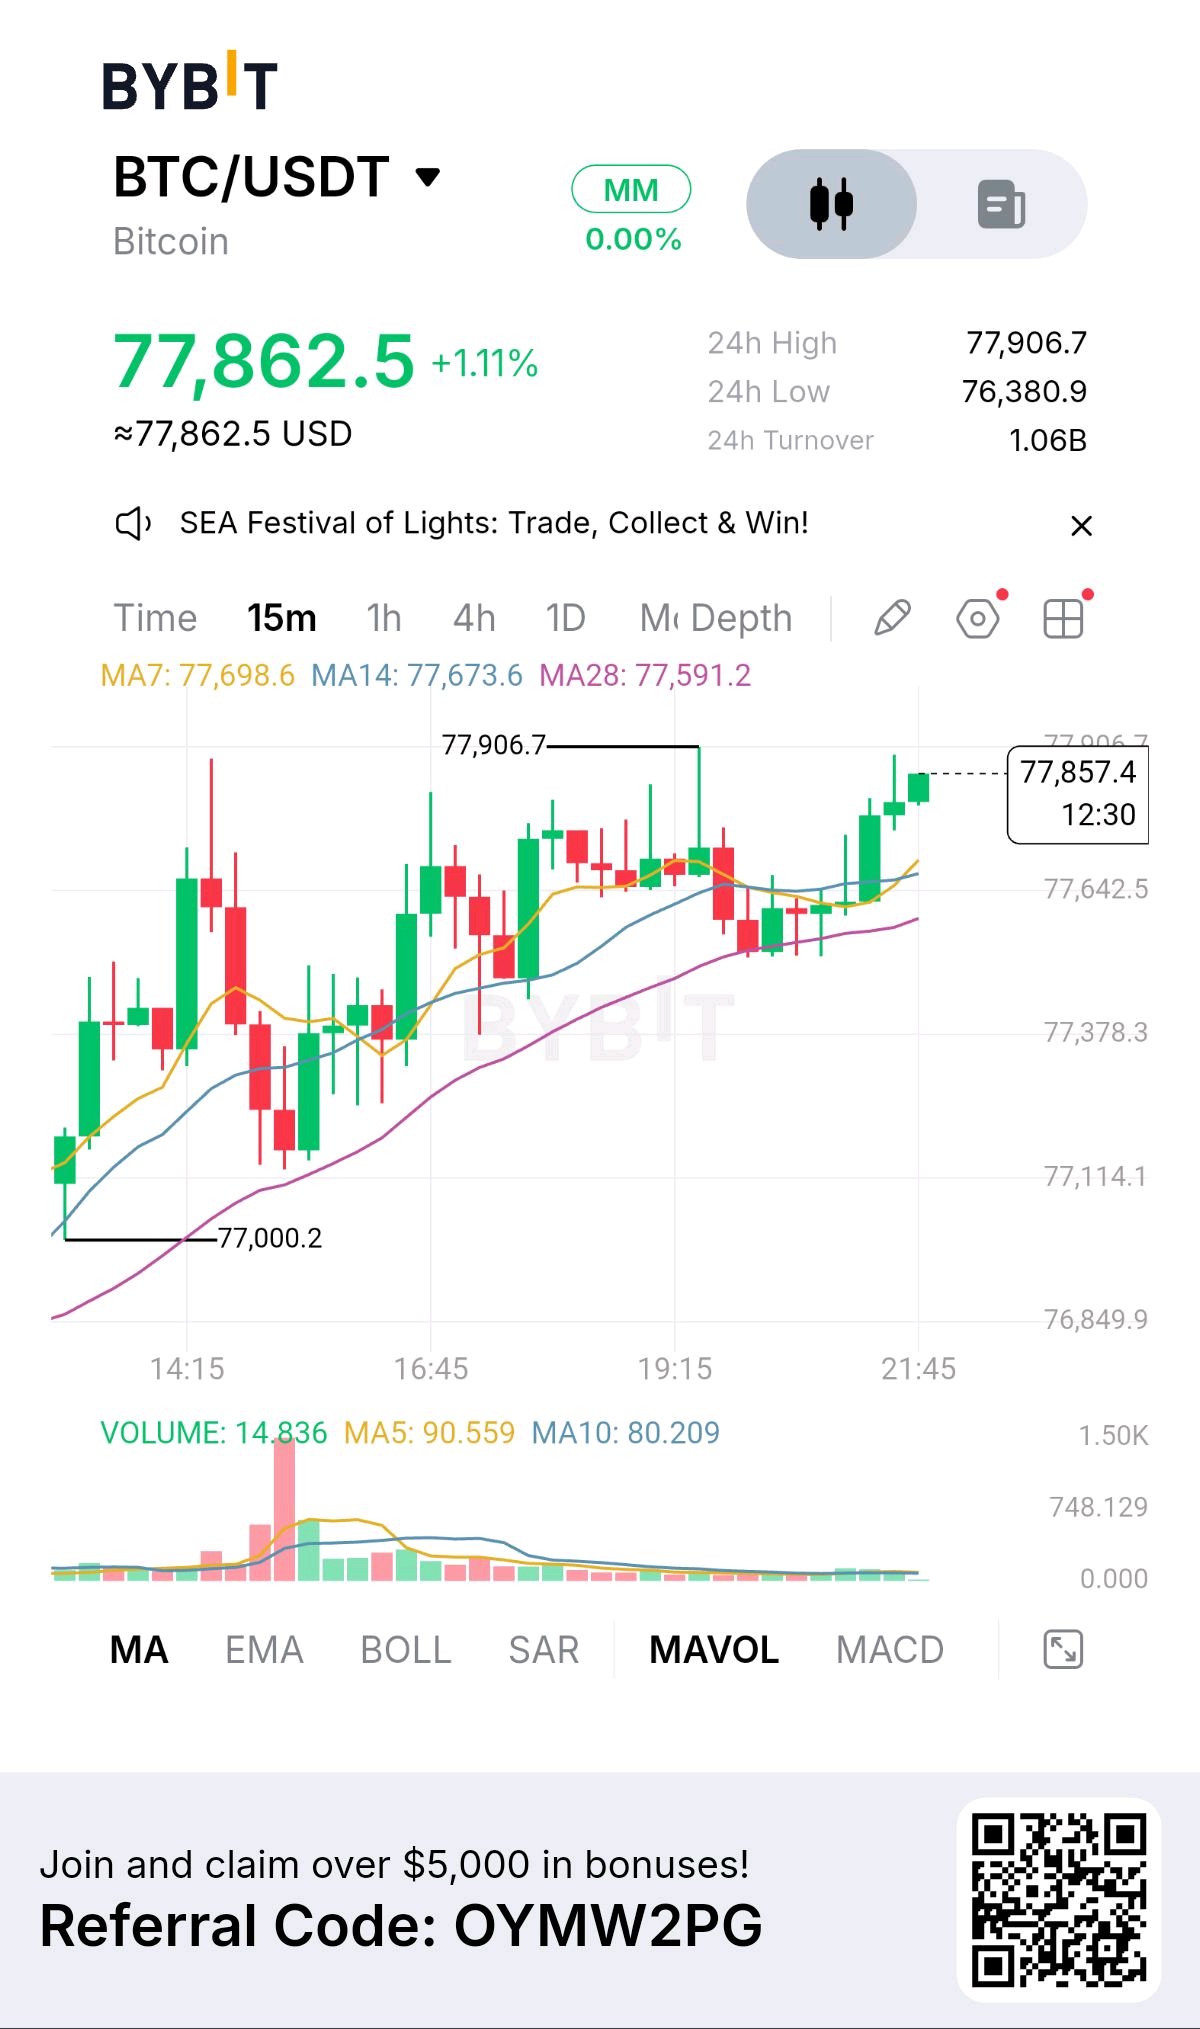
比特幣展現出新的強勢,交易價格為 77,862.5,24 小時漲幅為 1.11%。盤中交易區間落在 76,380.9 至 77,906.7 之間,成交額已達 10.6 億。 買方保持控制 在 15 分鐘線圖上,BTC 出現了一連串更高的高點和更高的低點,從 77,000.2 附近攀升至 77,906.7 的新一波區域高點。 移動平均線支持這種看漲結構: MA7:77,698.6 MA14:77,673.6 MA28:77,591.2 這三條均線均呈向上排列,且價格在均線上方運行。這使短期趨勢保持正向,儘管市場目前正在接近阻力位,買方必須證明他們有能力維持這種動能。 突破測試 當前的即時阻力位為 77,906.7。若 15 分鐘線能強勢收於該水位之上,可能會打開通往 78,000 心理關卡的路徑。 如果 BTC 無法向上突破,第一個支撐位參考為 MA7 的 77,698.6。若進一步走弱,焦點可能會轉向 MA28 的 77,591.2。 隨著價格接近高點,交易量有所放緩。這可能反映出市場活動暫歇,但若能有更強的參與度,將使任何突破顯得更具說服力。 動能強勁,但確認突破至關重要 BTC 目前佔據優勢,其移動平均線支撐著上漲結構。然而,阻力位尚未被突破,因此現階段保持耐心很重要。 確認突破可能會延續漲勢,而若跌破移動平均線支撐區間,則將訊號顯示動能正在減弱。 你會選擇等待確認突破 77,906.7,還是觀察回調至 77,698.6 附近後再判斷下一步?#ByXIMPACT #比特幣跌破 8 萬美元 $BTCUSDT

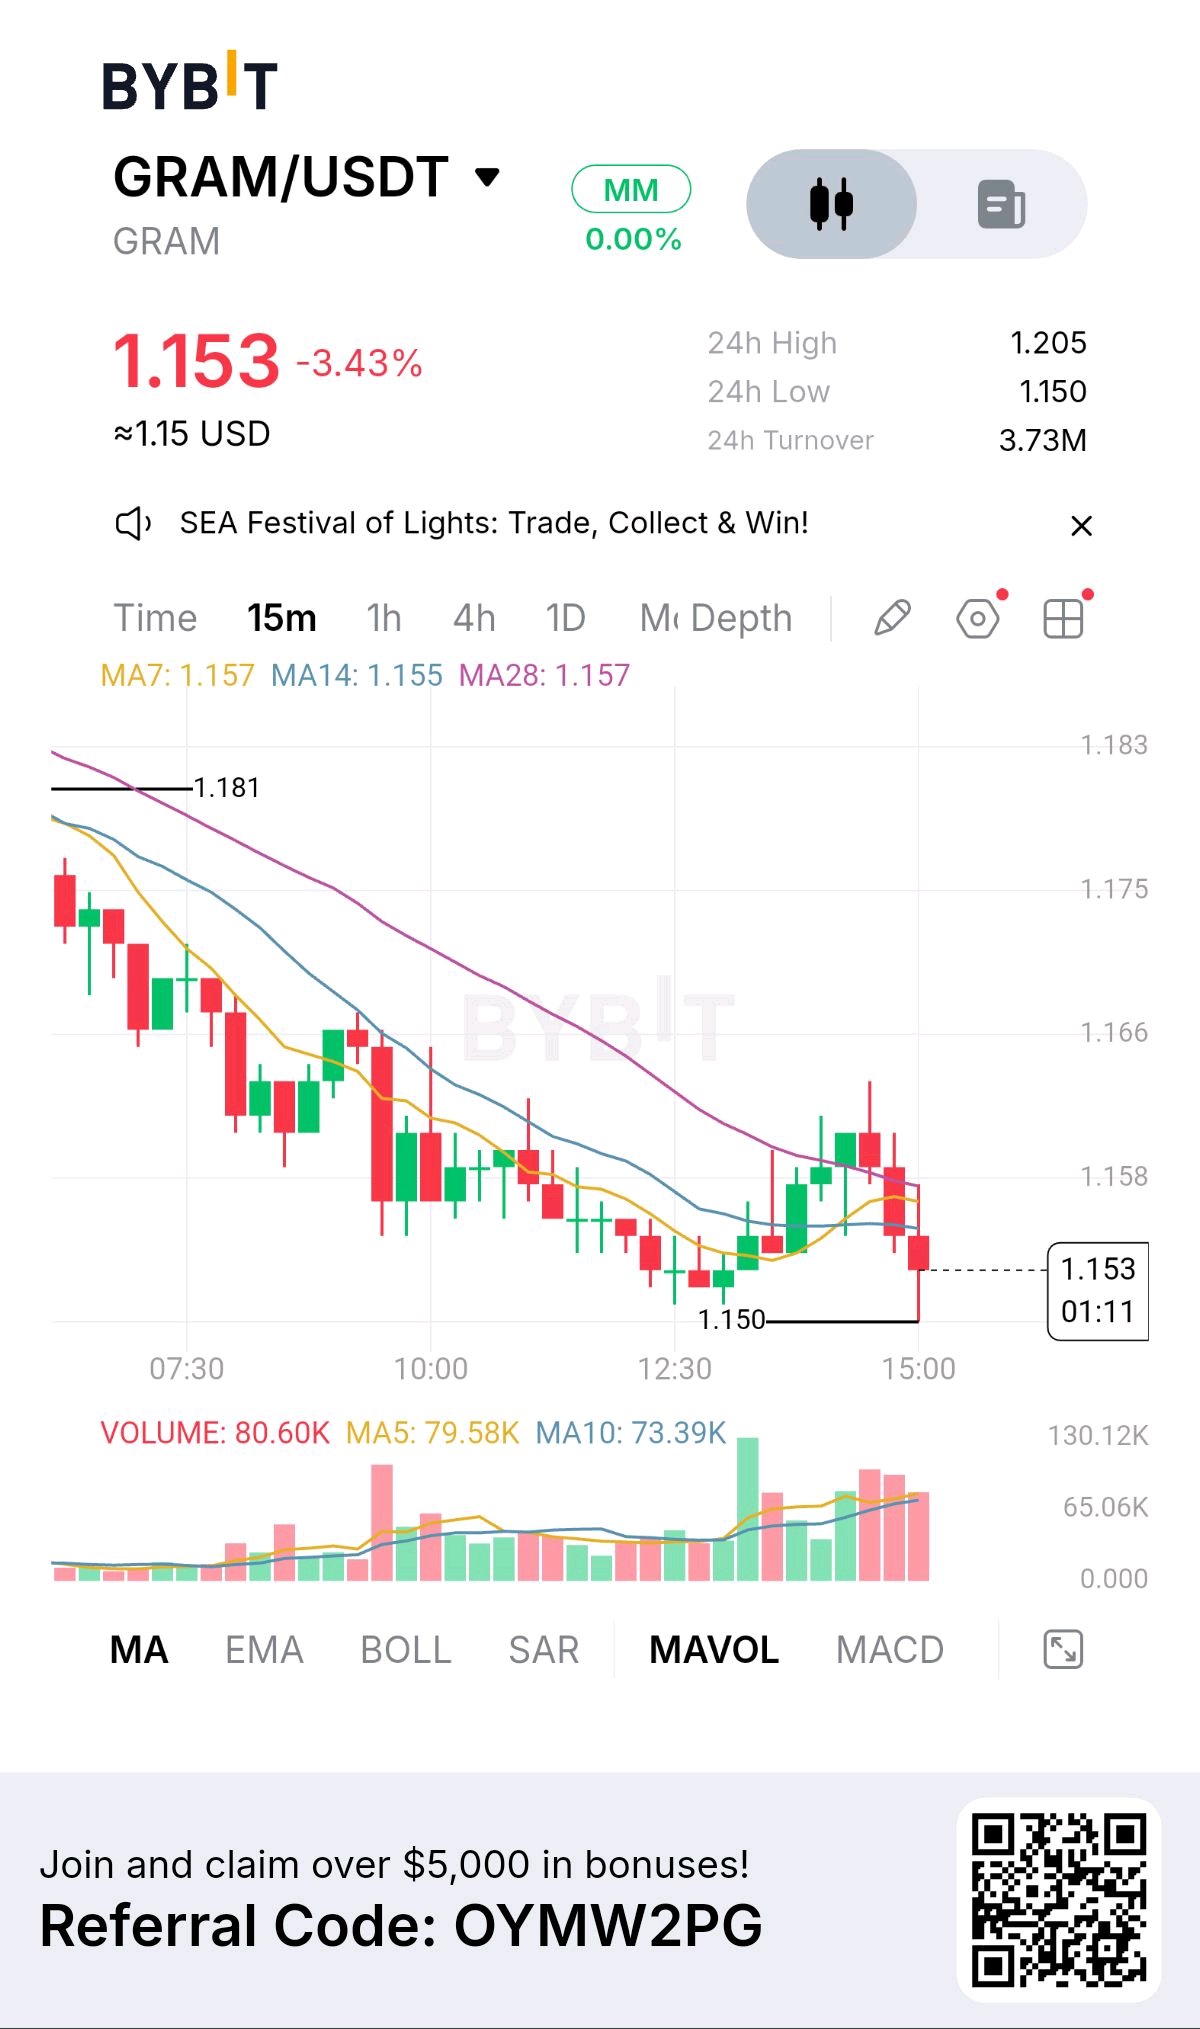
GRAM 價格來到 1.153:支撐位面臨壓力
$GRAMUSDT 在經歷一次失敗的復甦嘗試後,正努力重拾上漲動力。該代幣目前的交易價格為 1.153,24 小時內下跌了 3.43%,最高價為 1.205,最低價為 1.150,成交量為 373 萬。 賣方仍佔優勢 在 15 分鐘線圖上,GRAM 已從 1.181 的近期高點進入持續下跌趨勢。儘管買方曾試圖從 1.150 進行短暫反彈,但復甦未能維持,價格仍徘徊在盤中低點附近。 短期移動平均線進一步證實了這種疲軟態勢: - MA7: 1.157 - MA14: 1.155 - MA28: 1.157 由於價格低於上述所有三條平均線,短期趨勢仍承受看跌壓力。近期出現的紅色成交量激增顯示了拋售活動,而最新一根 K 線的長下影線則顯示在 1.150 附近存在一定的買盤興趣。 1.150 的攻防戰 該價位目前是市場面臨的直接考驗。 如果買方能守住 1.150 並將價格推升至 1.157 的移動平均線阻力區上方,那麼向 1.166 的回升可能成為焦點。 然而,若 15 分鐘線決定性地收盤跌破 1.150,將會削弱目前的支撐結構,並導致 GRAM 面臨進一步的下行風險。目前提供的圖表數據尚未確認特定的下方目標。 什麼因素可能改變局面? 若能持續站穩 1.157 上方,將挑戰目前的看跌格局。在此之前,移動平均線區塊仍是上方的主要阻力。 目前,GRAM 正陷入買方防守盤中低點與賣方控制短期結構之間的拉鋸戰。下一根已確認的 K 線收盤價可能會提供更明確的方向指引。 究竟買方能否守住 1.150,還是賣方會迫使價格跌破盤中低點?#ByXIMPACT #比特幣跌破 8 萬美元