AMBTC
3438點贊0分享187粉絲231關注
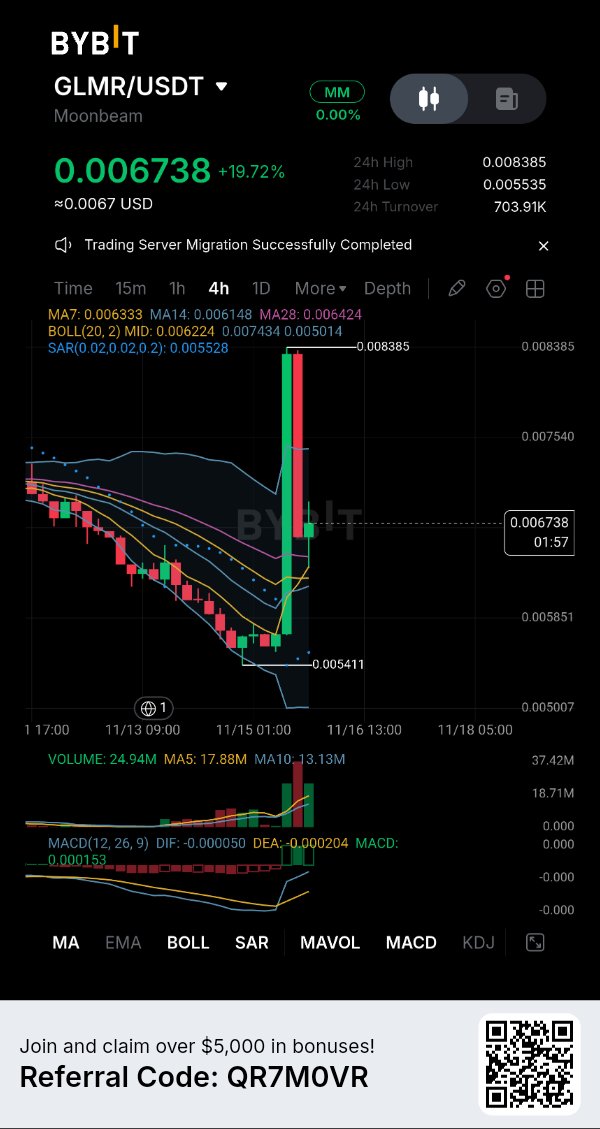
GLMR:回吐了 58% 的漲幅,目前為 0.006738
$GLMRUSDT — 價格比布林通道上軌(0.007434)低 9.4%,此前曾一度飆升至 0.008385。 看看 24 小時區間:0.005535 到 0.008385。價格回吐了約 58% 的漲幅,成交量仍是五日平均值的 1.4 倍。 目前尚無定論:這究竟是大趨勢中的回調,還是拉升後的盤整? 在大回調之後成交量依然很高。這是買方進場,還是賣方離場? 4H,Bybit 上的 GLMR/USDT,0.006738,24 小時漲幅 +19.72%。 宏觀備註 2026 年 11 月 14 日:美國現貨比特幣 ETF 連續兩週出現 23.5 億美元的淨流出(Cointelegraph)。僅供背景參考,並非此次行情的動因。 圖表顯示 價格連跌數日至 24 小時低點 0.005535。隨後拉升至 0.008385,較低點波動 51.5%,目前回調至 0.006738。飆升的高點比當前價格高出 24%。 成交量顯著。當前柱狀圖為 24.94M,是 17.88M 五日平均值的 1.4 倍,也是 13.13M 十日平均值的 1.9 倍。最高的一根柱狀圖(約 37M)出現在拉升期間。因此,回調是在成交量活躍的情況下發生的,而非悄無聲息的消退。 價格高於 MA7 (0.006333)、MA14 (0.006148) 和 MA28 (0.006424)。MACD 出現金叉:DIF -0.000050 高於 DEA -0.000204,兩者均在零軸下方。SAR 指示為 0.005528,位於價格下方。這些指標支持短期動能。它們並不證明趨勢發生了改變。它們是基於價格計算的,MA7 仍然低於 MA28,一次拉升會將所有均線拉高。 關鍵點位 支撐位:0.006333 (MA7),其次是 0.006224 (布林通道中軌)。24 小時低點為 0.005535。 阻力位:0.007434 (布林通道上軌),其次是 0.008385 (24 小時高點)。 什麼情況會增強看漲信號 價格比上軌低 9.4%,所以我現在還不要求突破。首先,我希望 4 小時收盤價能維持在 0.006333 和 0.006224 上方。然後是 4 小時收盤價突破 0.007434,且成交量高於 17.88M 的平均值。如果回調後能出現高於 0.006224 的更高低點,也會有所幫助。 擔憂 如果 4 小時收盤價低於 0.006224,價格將回到中軌下方,抹去此次反彈。飆升的高點 0.008385 已遭到拒絕,價格回吐了 58% 的漲幅。這些都是需要謹慎的原因。 什麼會改變我的看法 4 小時收盤價低於 0.006224。 教訓 拉升顯示了價格能走多遠。收盤價顯示了價格能站穩哪裡。 我的觀點 我的解讀:反彈目前仍在持續,只要 GLMR 的 4 小時收盤價保持在 0.006224 上方,我傾向於稍微看好。我可能會錯,如果 4 小時收盤價跌破 0.006224,那就證明我錯了。參考點位,不要參考我的傾向。這是一個情境分析,而非預測。這是發布時的解讀,而非保證。 對你來說,0.006224 的支撐還是突破 0.007434 的收盤價更重要? #ByXIMPACT
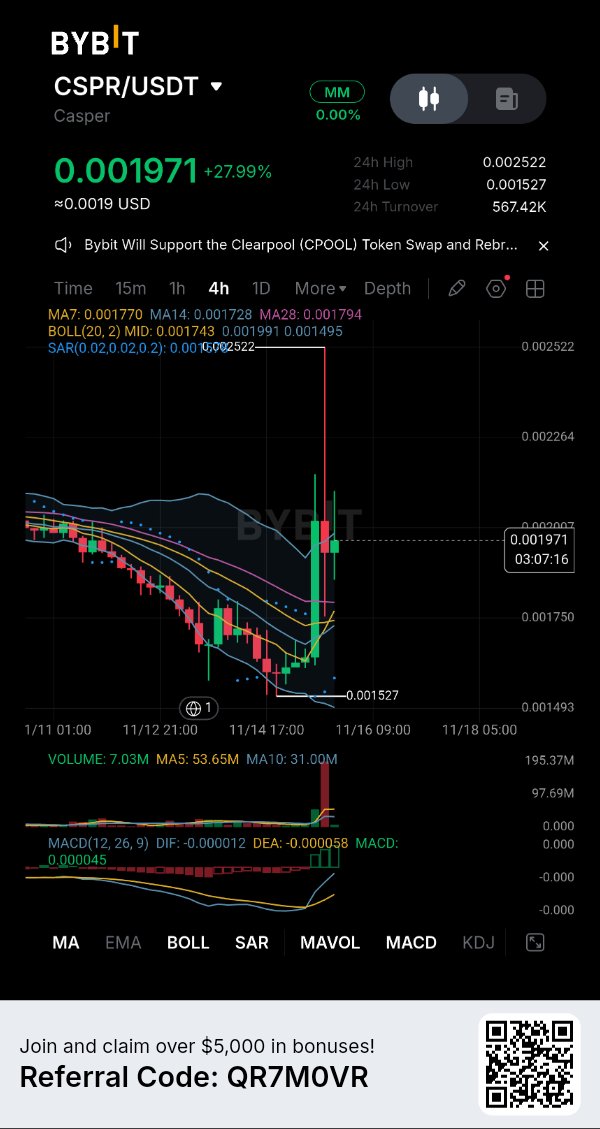
CSPR:飆升至 0.002522,現報 0.001971
$CSPRUSDT — 價格比布林通道上軌低 1%,目前為 0.001991,此前曾大幅衝高。查看 24 小時區間:0.001527 至 0.002522。價格已回吐約 55% 的漲幅。尚未解決的問題是:0.001991 這個點位能否從壓力轉為支撐?一根巨大的成交量柱加上單日 28% 的漲幅:什麼樣的訊號會讓你相信這種衝高——是回測、收盤價,還是更大的成交量? 4 小時圖,$CSPRUSDT 在 Bybit 上的價格為 0.001971,24 小時內上漲了 +27.99%。 宏觀備註 2026 年 11 月 15 日:比特幣跌至約 62,081,為 7 月以來的最低水準,隨後反彈至 65,000 以上(Cointelegraph)。僅供背景參考,並非此次波動的原因。 圖表顯示的內容 價格連續幾天下跌,觸及 24 小時低點 0.001527。隨後,一根 K 線衝高至 0.002522,比該低點高出約 65%,之後價格回調至 0.001971。24 小時波動區間為 0.000995。價格已回吐了約 55% 的漲幅。衝高的高點比當前價格高出 28%。成交量顯而易見。衝高那根 K 線的成交量目測約為 1.95 億,是 3,100 萬十日平均成交量的六倍多。當前 K 線成交量為 703 萬,對比五日平均成交量 5,365 萬,但這根 K 線僅完成了約 22%(還剩 3 小時 7 分鐘),所以現在比較還不公平。技術指標顯示反彈,但它們是滯後於價格的,因此不能作為獨立證明。價格高於 MA7 (0.001770)、MA14 (0.001728) 和 MA28 (0.001794)。MACD 已金叉:DIF -0.000012 高於 DEA -0.000058,但兩者皆仍低於零軸。這支持短線動能,但並不證明趨勢反轉。MA7 仍低於 MA28,單一衝高 K 線可能會拉高所有均線。 關鍵點位 支撐位:約 0.00186(目前這根 K 線的低點),接著是 0.001743(布林通道中軌)。24 小時低點為 0.001527。 阻力位:0.001991(布林通道上軌),接著是 0.002522(24 小時高點)。 什麼會加強看漲訊號 價格目前低於 0.001991,所以這只是測試,不是突破。僅僅觸及說明不了什麼。我希望看到 4 小時線收在 0.001991 之上,然後再進行回測並守住支撐。如果在 0.00186 之上出現更高的高點會有幫助。如果能在成交量遠高於 5,365 萬均線的情況下收在通道之上,才顯示有真正的買盤參與。 顧慮 4 小時線收在 0.001743 以下會讓價格跌破中軌,並抹去大部分反彈漲幅。價格在 0.002522 處遇阻,之後回吐了 55% 的漲幅。 什麼會改變我的想法 4 小時線收在 0.001991 之上。 教訓 一根大陽線並不代表趨勢。趨勢是一連串的收盤價,且每個收盤價都高於前一個。 我的觀點 我的解讀:這看起來像是一次急漲後的回調,還不是築底,所以我傾向保守,因為 CSPR 在 4 小時收盤價仍低於 0.001991。我可能是錯的,如果 4 小時收盤價高於 0.001991,那就能證明我是錯的。參考點位,不要盲從我的傾向。這只是一種情境分析,不是預測。這是發文時的解讀,並非保證。 在這裡,你更信任那根巨大的成交量柱,還是回調的力道? #ByXIMPACT #WSOT2026 #WSOT曬出你的AI交易即可贏取10USDT #黃仁勳離任考驗Nvidia的AI領導地位
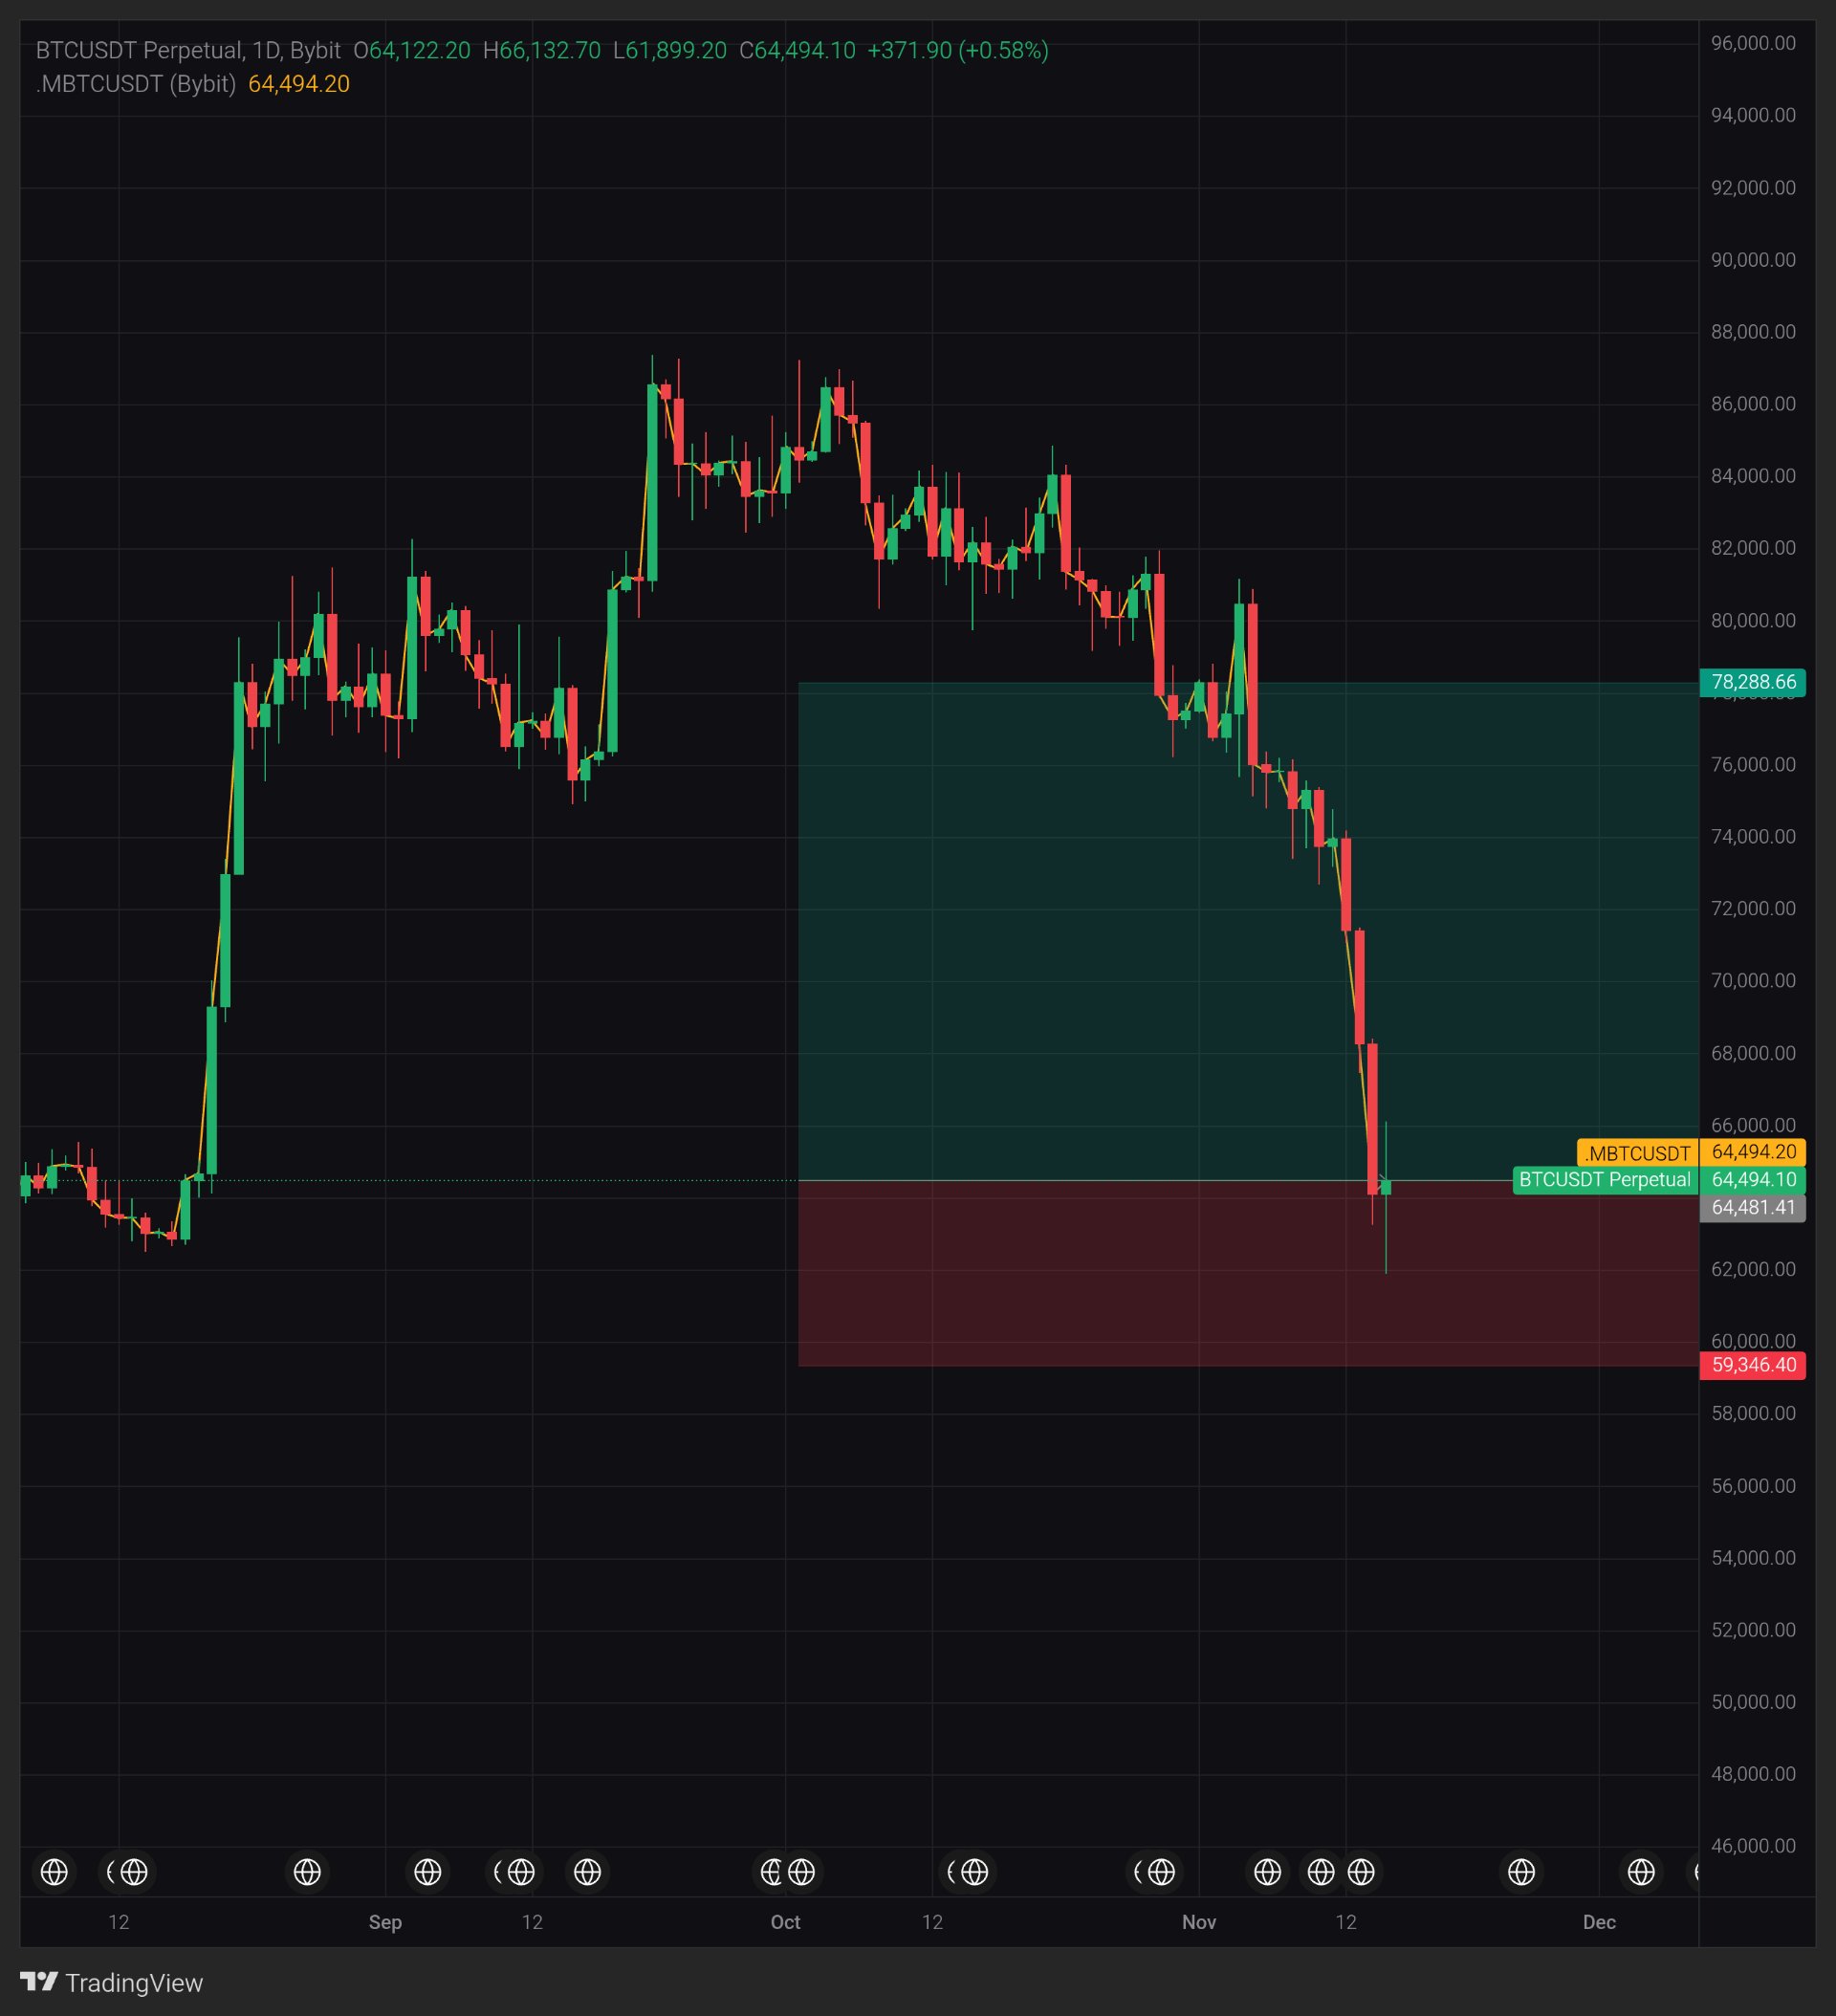
BTC 1日線:回到八月底部,64,481
$BTCUSDT — 價格回到八月份的基礎區間內,目前位於 64,481.41,這是我兩個箱體之間的分界線。 看看今天的日線,它在開盤價下方探了 2,223 點後回升,其實體部分不到昨天燭身的十分之一。 目前尚未定論的是:今天是否會收在 64,481.41 之上,還是這僅僅是暫時的停頓? 在連續三根紅K線之後,一根小小的綠K線能證明什麼呢? 1D,$BTCUSDT Bybit 永續合約,64,494.10,當前K線漲幅 +0.58%。 宏觀備註 2026 年 11 月 14 日:美國現貨比特幣 ETF 連續兩週出現 23.5 億美元的淨流出(Cointelegraph)。僅供背景參考,並非此次行情變動的原因。 圖表顯示內容 價格比 9 月份接近 87,300 的高點低了約 29%。連續三根日線紅K,且一根比一根大(分別約為 3.4%、4.4% 和 6.1%),將價格從約 73,940 拉低至 64,060,跌幅約 13%。 拉遠來看:在拉升之前,八月份的基礎區間位於 62,500 到 65,500 附近。價格現在又回到了這個區間。今日低點 61,899.20 稍微跌破該區間約 1%,隨後價格回升至 64,494.10。 今日K線:開盤 64,122.20,最高 66,132.70,最低 61,899.20,收盤 64,494.10。震幅為 4,233.50,約為開盤價的 6.6%。下影線長度為 2,223,約為 371.90 實體長度的 6 倍。價格從低點反彈了 4.2%。 黃線為 Bybit 指數(.MBTCUSDT),報價 64,494.20,與永續合約僅差 0.10。由於它是跟隨價格的,因此不能作為獨立證明。圖表未顯示成交量面板,所以我無法將今天的成交量與平均值進行比較。這是一次純粹的價格行為解讀。 關鍵點位 支撐位:61,899.20(今日K線低點),其次是 59,346.40(我紅色箱體的底部)。 阻力位:66,132.70(今日K線高點),其次是約 68,250(昨日大紅K線的起始點)。我綠色箱體的頂部為 78,288.66。 什麼情況會加強看漲信號 價格僅比 64,481.41 這條線高出 12.69,所以還沒定局。我首先希望看到日線收在 64,481.41 之上,然後是收在 66,132.70 之上。若回測時能出現高於 61,899.20 的低點,將能證明八月份的基礎區間依然有效。 隱憂 若日線收在 61,899.20 以下,則意味著八月份的基礎區間防守失敗,下一個參考點位將是 59,346.40。連續三天的紅K,且一根比一根大,說明賣方在今天之前一直掌握著主導權。 什麼會改變我的看法 日線收在 68,250 左右之上。 教訓 每一根日K線都是一張選票。今天的下影線是其本身實體的六倍。這是一個訊號,而非趨勢。 我的觀點 我的解讀是:這看起來像是急跌之後買方出現的第一個跡象,而非確定的底部,因此在 BTC 的日線收盤價維持在 68,250 左右下方時,我會保持謹慎。我可能會判斷錯誤,而日線收在 68,250 左右之上將會證明我錯了。請參考點位,而非我的傾向。這只是一個情境分析,而非預測。這是發文當下的解讀,而非保證。 在這裡對你來說,2,223 的下影線與 371.90 的實體,哪個更重要? #ByXIMPACT
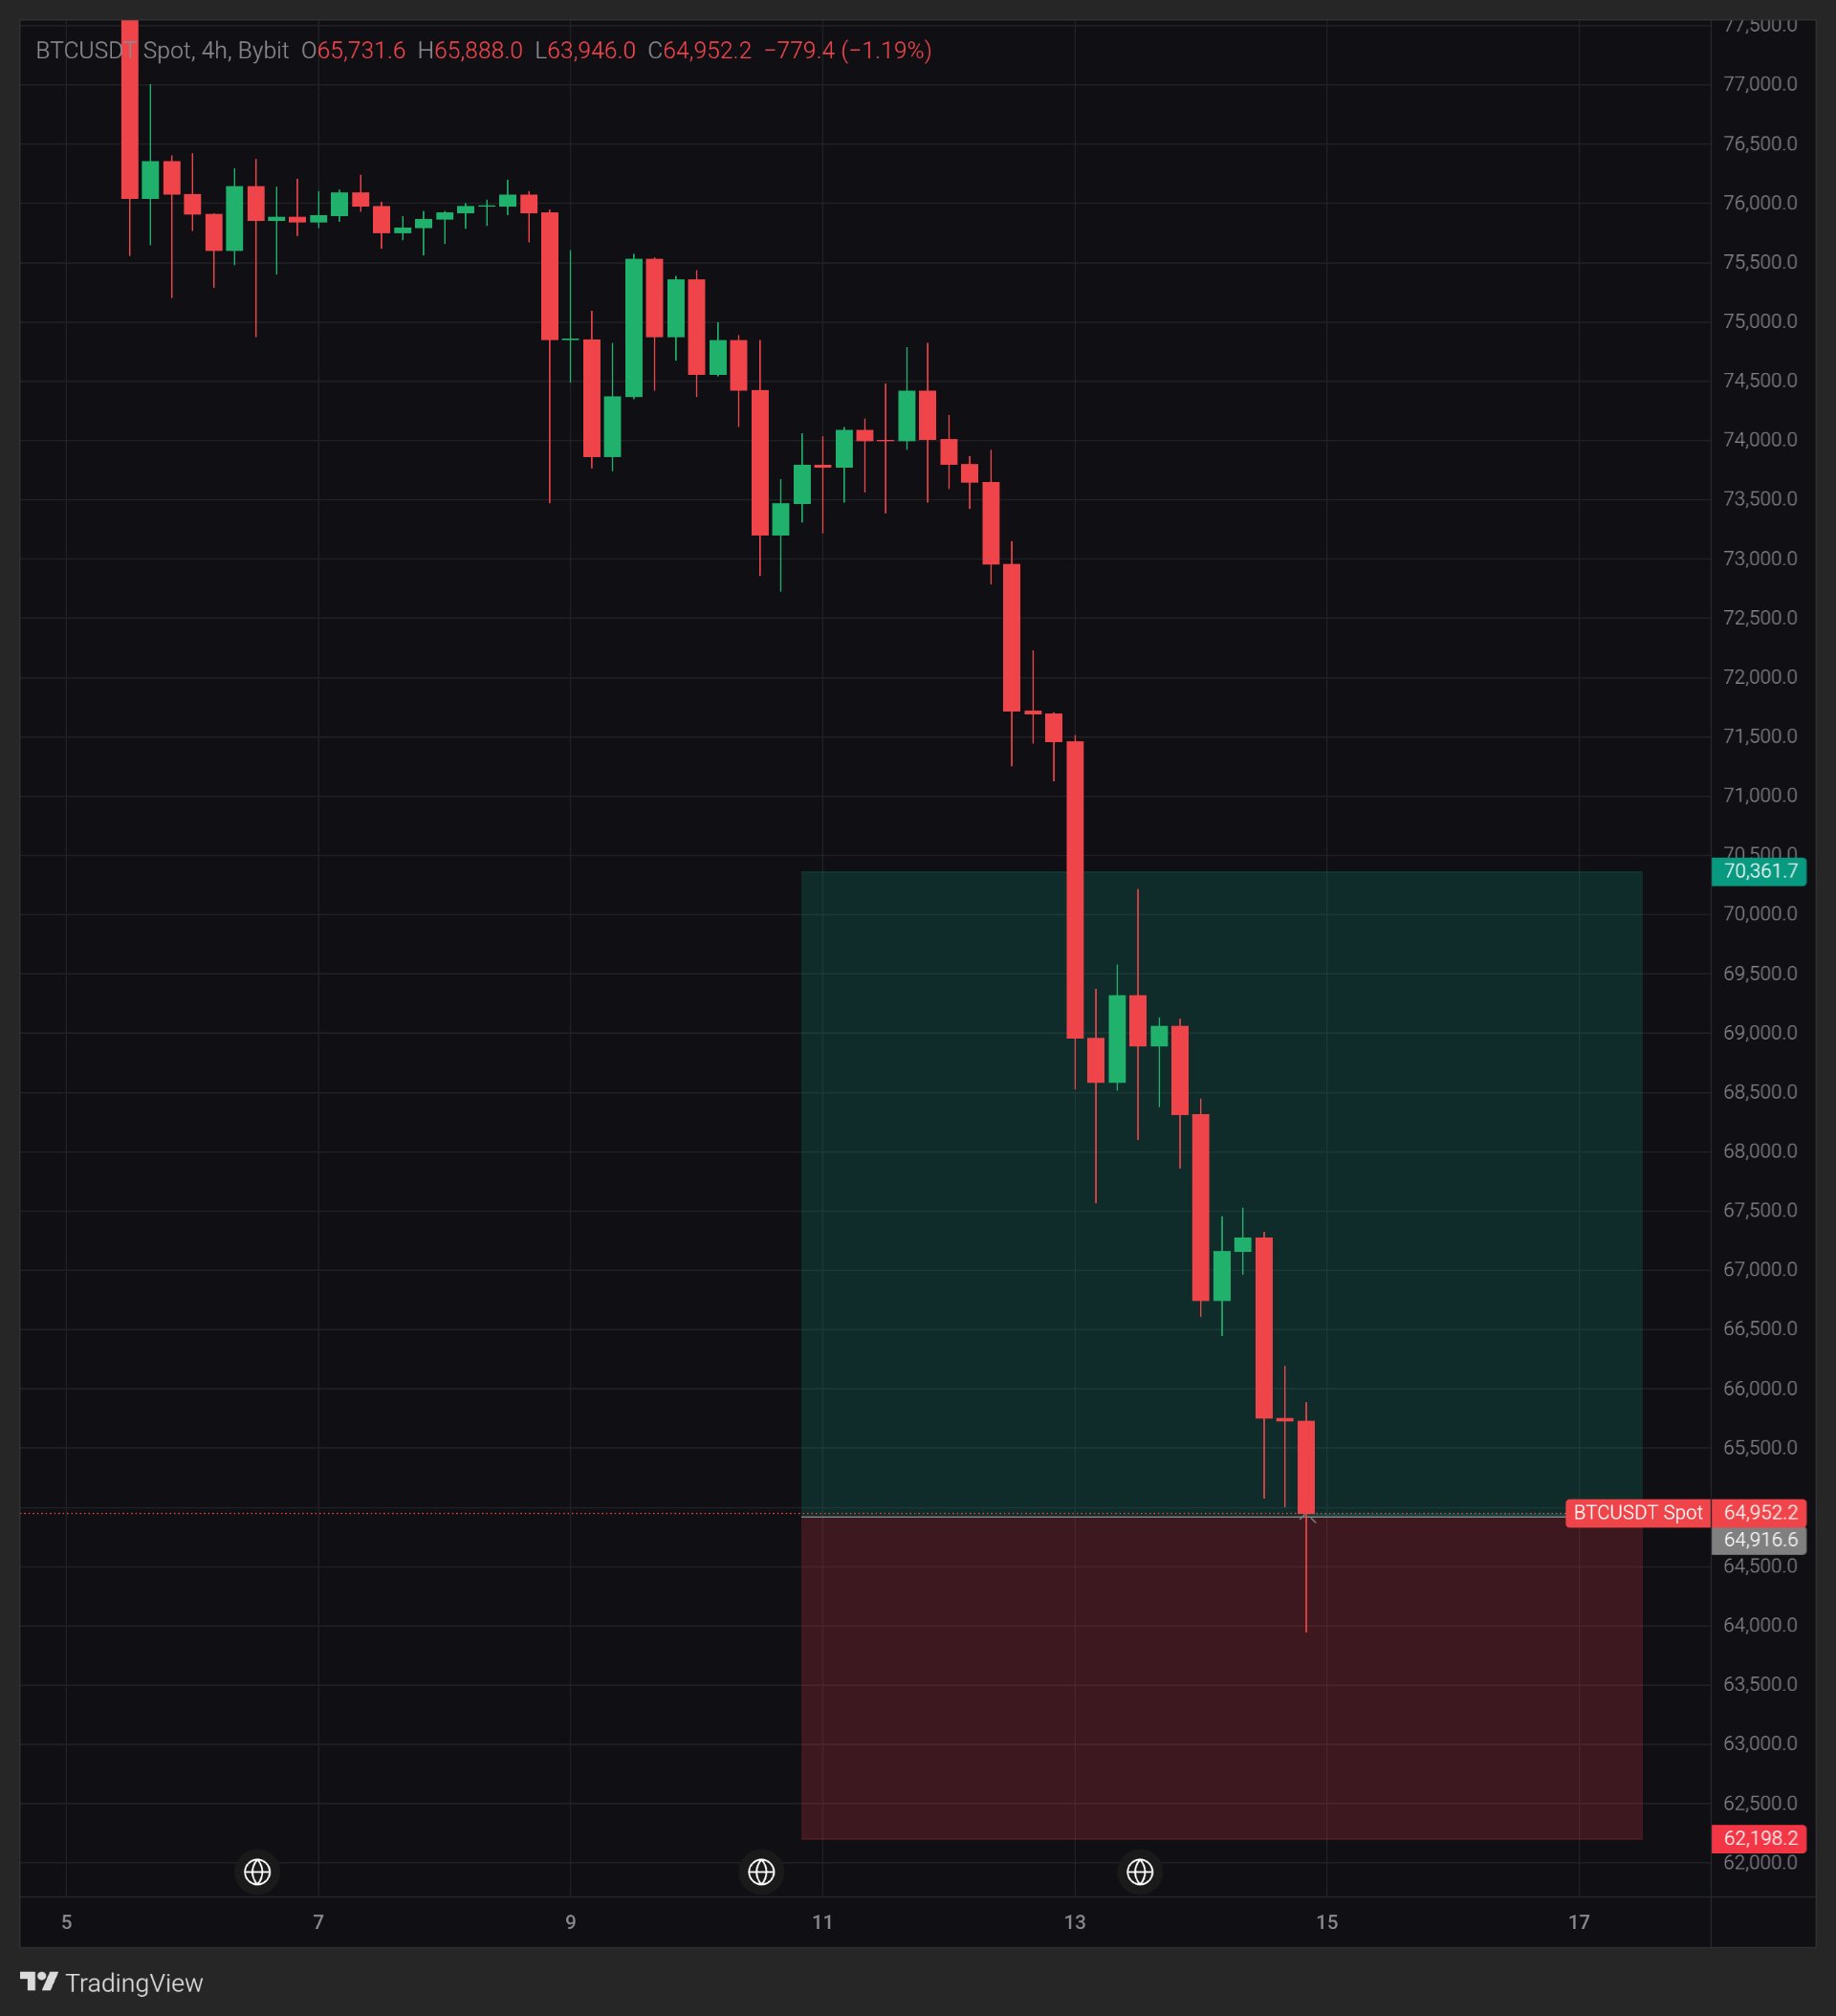
BTC 在觸及 63,946 的影線後,目前價格落在 64,917
$BTCUSDT — 關鍵位就在 64,916.6,價格正徘徊於此。 看看當前的K線。它曾跌破開盤價 1,786,隨後從低點反彈了 1,006。 尚未解決的問題是:這根下影線究竟是個支撐,還是下跌途中的又一次價格停頓? 這波下跌中的每一個低點在出現時看起來都像個底部。如果這次有什麼不同,會是什麼呢? 4小時圖,BTCUSDT Bybit 現貨,64,952.2,當前K線跌幅 -1.19%。 宏觀備註 2026年11月13日:國債收益率上升,且市場對美聯儲緊縮政策的押注持續(Kitco)。僅作為背景資訊,並非此次波動的原因。 圖表顯示 價格從11日接近 74,800 的高點跌至 64,952,三天內跌幅約 13.2%。波段低點不斷下移:大約在 67,566、66,445、65,029,現在則是 63,946。 類似今天這樣的下影線以前也出現過。在13日,一根K線曾跌至約 67,566,並收在低點上方約 1,000 的位置。幾根K線後,價格就跌破了那個低點。 當前K線:開盤 65,731.6,最高 65,888.0,最低 63,946.0,收盤 64,952.2。波動幅度為 1,942,約 3%。下影線長度為 1,006.2,約為實體 779.4 的 1.3 倍。收盤價位於波動區間的中間,比我箱體邊緣 64,916.6 高出 35.6。 此圖表未顯示成交量。沒有使用任何指標,這純粹是價格行為解讀。 關鍵點位 支撐位:63,946(本根K線低點),然後是 62,198.2(我紅色箱體的底部)。 阻力位:65,888(本根K線高點),然後是大約 67,270(上一根大陰線開始的位置)。我綠色箱體的頂部是 70,361.7。 什麼情況會增強看漲信號 價格正處於邊緣,所以目前這只是觸及,並未企穩。我首先希望看到4小時收盤價站上 64,916.6,然後是 65,888。如果回測時能出現高於 63,946 的更高低點,將表明這根下影線背後有買盤支撐。收盤價若能站上 67,270 左右,將是打破模式的第一個真正突破。 擔憂 如果4小時收盤價低於 63,946,意味著下影線低點失效,下一個參考點位將是 62,198.2。像這樣的下影線以前也曾被跌破過。 什麼會改變我的看法 4小時收盤價高於 67,270 左右。 教訓 下跌階梯就是不斷出現更低的高點和更低的低點。要形成底部,需要出現第一個更高的低點,並以收盤價來驗證。 我的觀點 我的解讀:這看起來像是一個下跌階梯,且這根下影線未經收盤價確認,所以我對 BTC 在4小時收盤價低於 67,270 左右的情況下持謹慎態度。我可能錯了,4小時收盤價站上 67,270 左右會證明我判斷錯誤。參考點位,不要參考我的傾向。這是一個情境分析,而非預測。這是發文當下的解讀,並非保證。 你對此有何看法,這是底部還是又一個下跌台階? #ByXIMPACT #比特幣在美國中期選舉後跌至兩個月低點 #AI科技股拋售使納斯達克100指數蒸發2.5兆美元
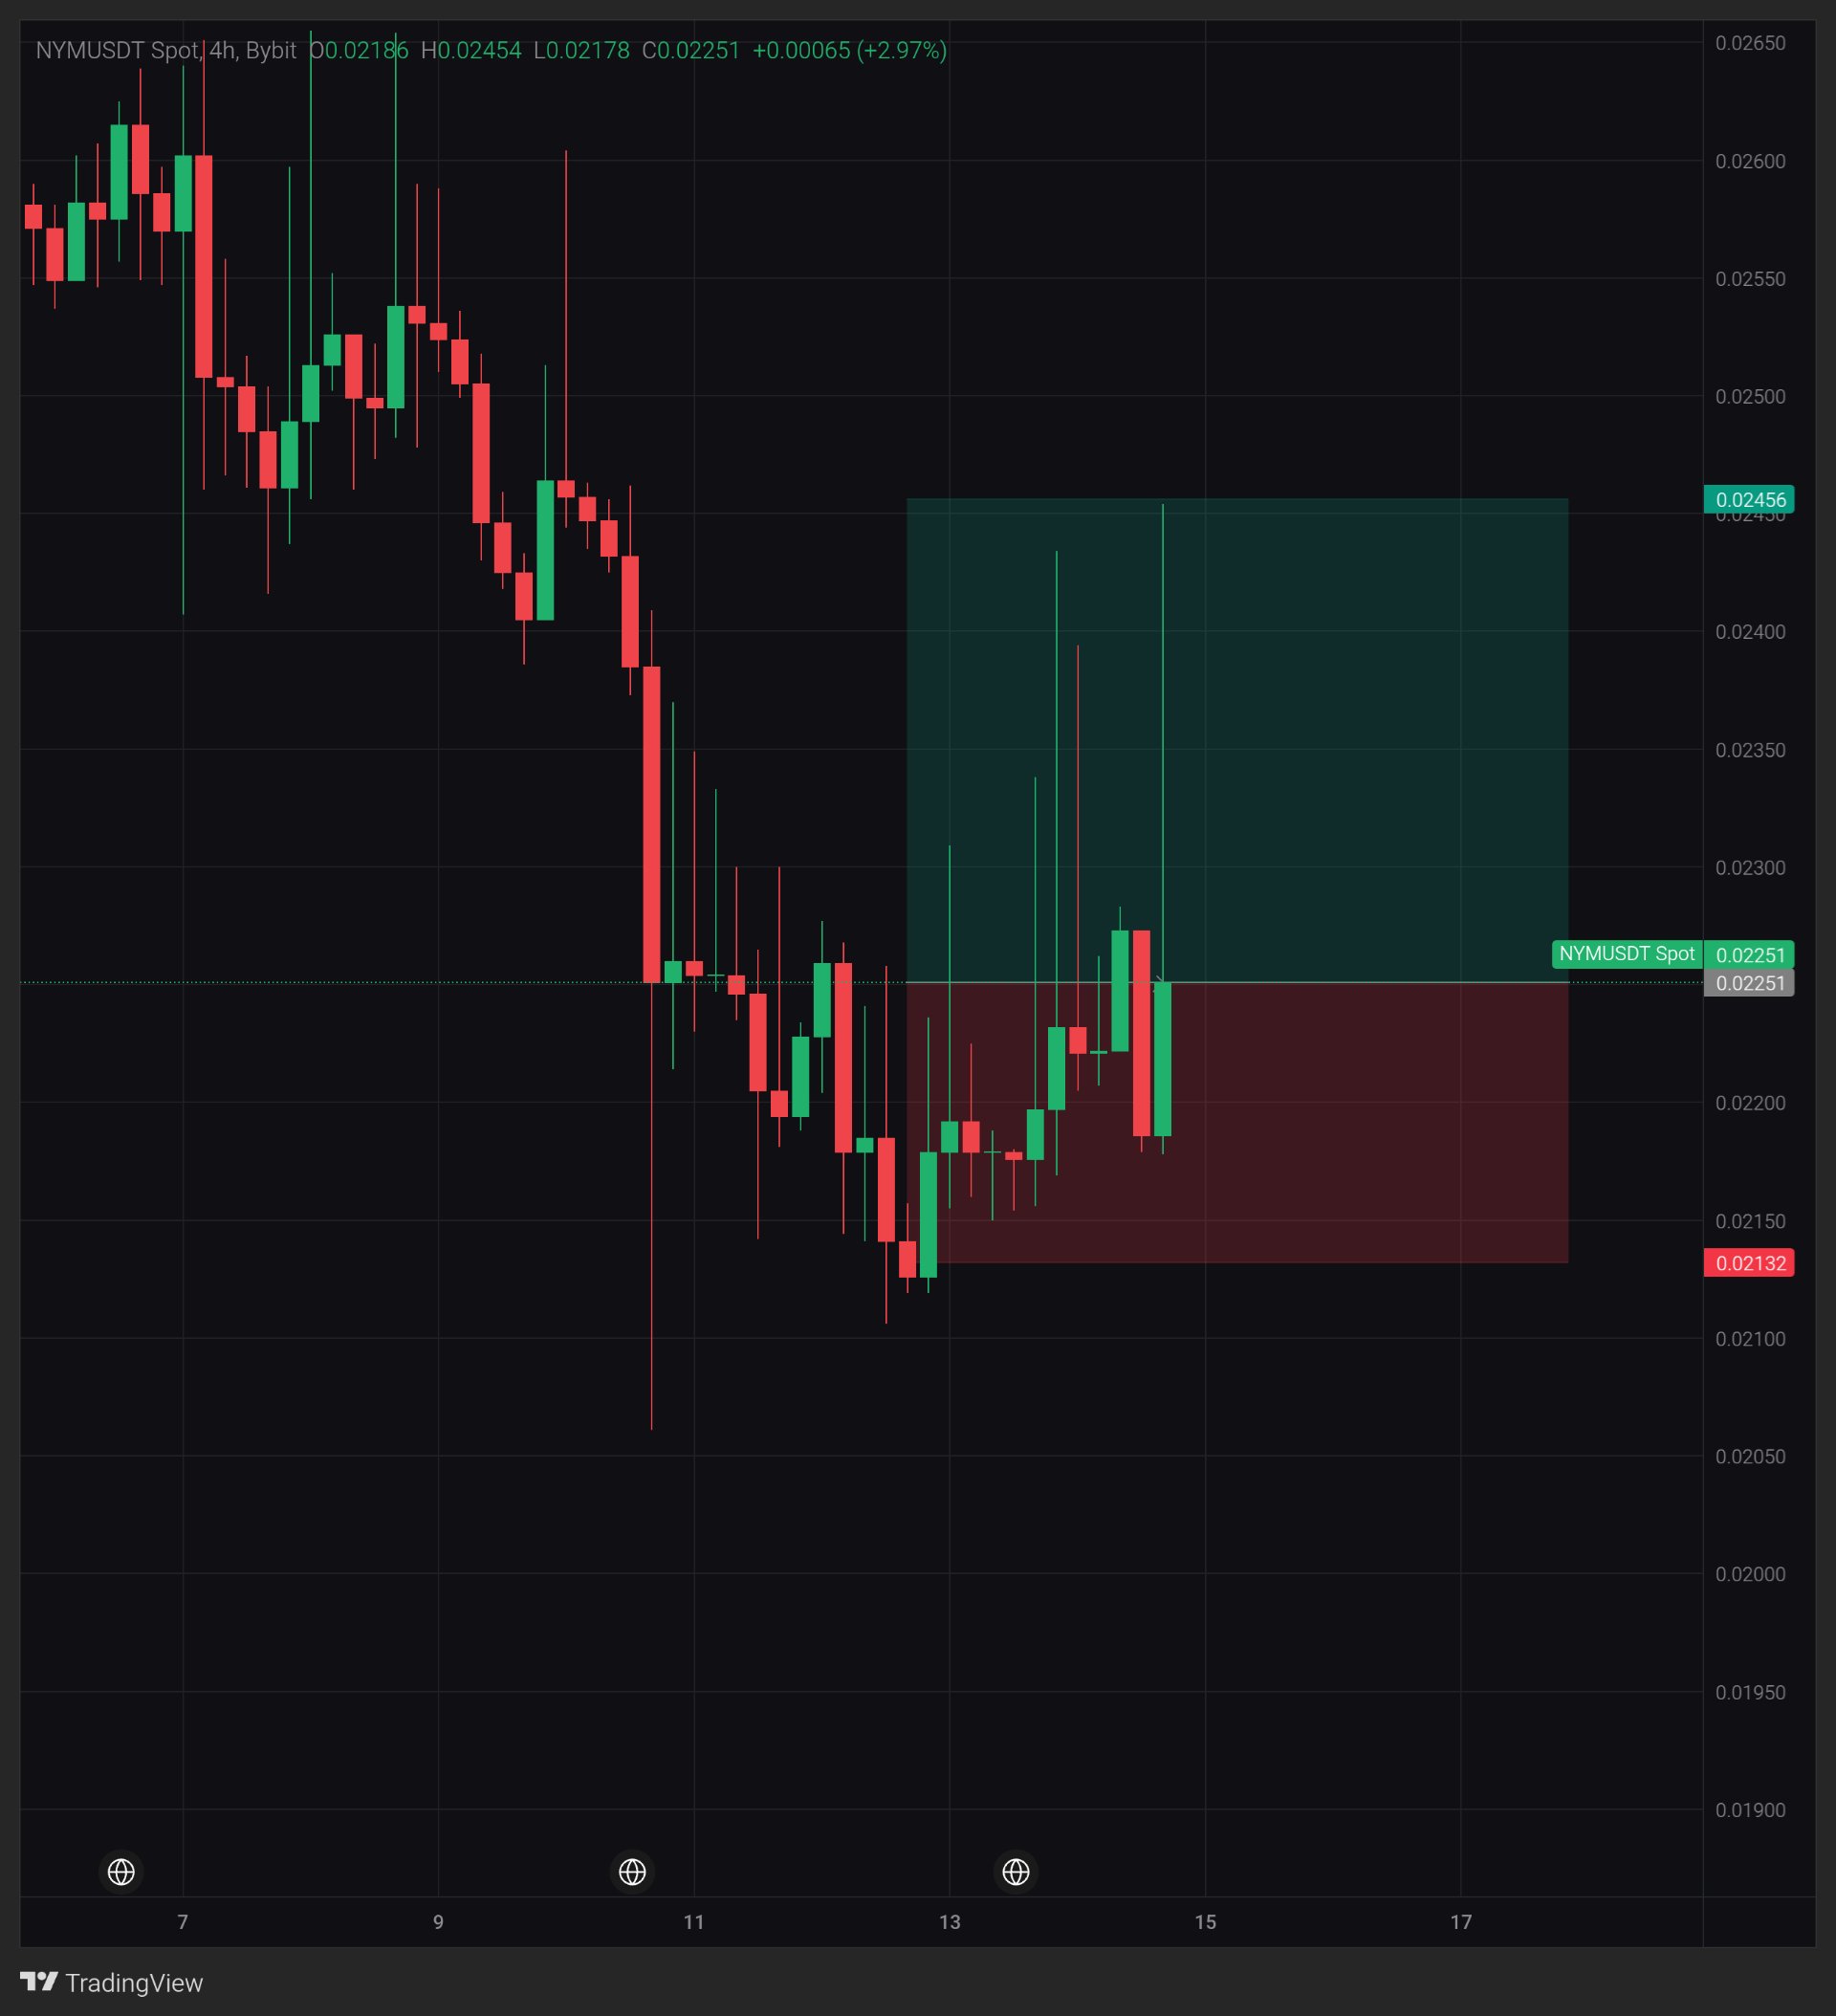
NYM: Wick to 0.02454, Now at 0.02251
$NYMUSDT — price is back at about 0.02251, where the big red candle closed on the way down. Look at the current candle. It pushed 12.3% above its open, then gave back about three quarters of that push. Still unresolved: is 0.02251 a base, or another stop under the same ceiling? Five wicks above 0.0230, zero closes there. What would it take to change that? 4H, $NYMUSDT Spot on Bybit, 0.02251, +2.97% on the current candle. Macro note Nov 13, 2026: US producer prices rose 0.3% in October, below the 0.4% expected, with the yearly rate at 6.5%, the highest since November 2022 (US Bureau of Labor Statistics, via Kitco). Background only, not the reason for this move. What the chart shows Price fell about 20%, from the 0.0265 area to a low near 0.02107, and has bounced since. The lows have lifted: roughly 0.0212, then 0.0215, now 0.0218. Look at the wicks. Five 4H candles since the 13th wicked above 0.0230, the longest to 0.02454. None of them closed above about 0.02274, the highest close of this bounce. The current candle: open 0.02186, high 0.02454, low 0.02178, close 0.02251. The range is 0.00276, about 12.6% of the open. The upper wick is 0.00203, about 3.1 times the 0.00065 body. The close sits in the lower quarter of the range. From the low near 0.02107, price is up about 6.8% at this level. Volume is not shown on this chart. There are no indicators, so this is a price-action reading. Key levels Support: 0.02186 (open of this candle), then 0.02132 (bottom of my red box). The swing low is near 0.02107. Resistance: about 0.02274 (highest close of this bounce), then 0.02456 (top of my green box, tagged by the wick at 0.02454). What would strengthen it Wicks above 0.0230 have not counted so far, because nothing has closed there. Until a 4H candle closes above about 0.02274, those wicks are just wicks. A close above 0.0230 would be the first real change. A higher low above 0.02186 on a retest would help too. Concern A 4H close below 0.02186 would erase this candle's whole gain. A close below 0.02132 would put price under the base of this bounce, with 0.02107 as the next reference. Price was sold back five times above 0.0230. What changes my mind A 4H close above 0.0230. The lesson A wick is a question. A close is the answer. Five wicks asked about 0.0230, and no close has answered yet. My view My read: price is stuck under a ceiling, and I lean cautious while closes stay below 0.0230. I could be wrong, and a 4H close above 0.0230 would prove me wrong. Take the levels, not my lean. This is a scenario, not a prediction. A reading at posting time, not a guarantee. Do you trust the higher lows or the failed wicks more here? #IMPACTbyTrade
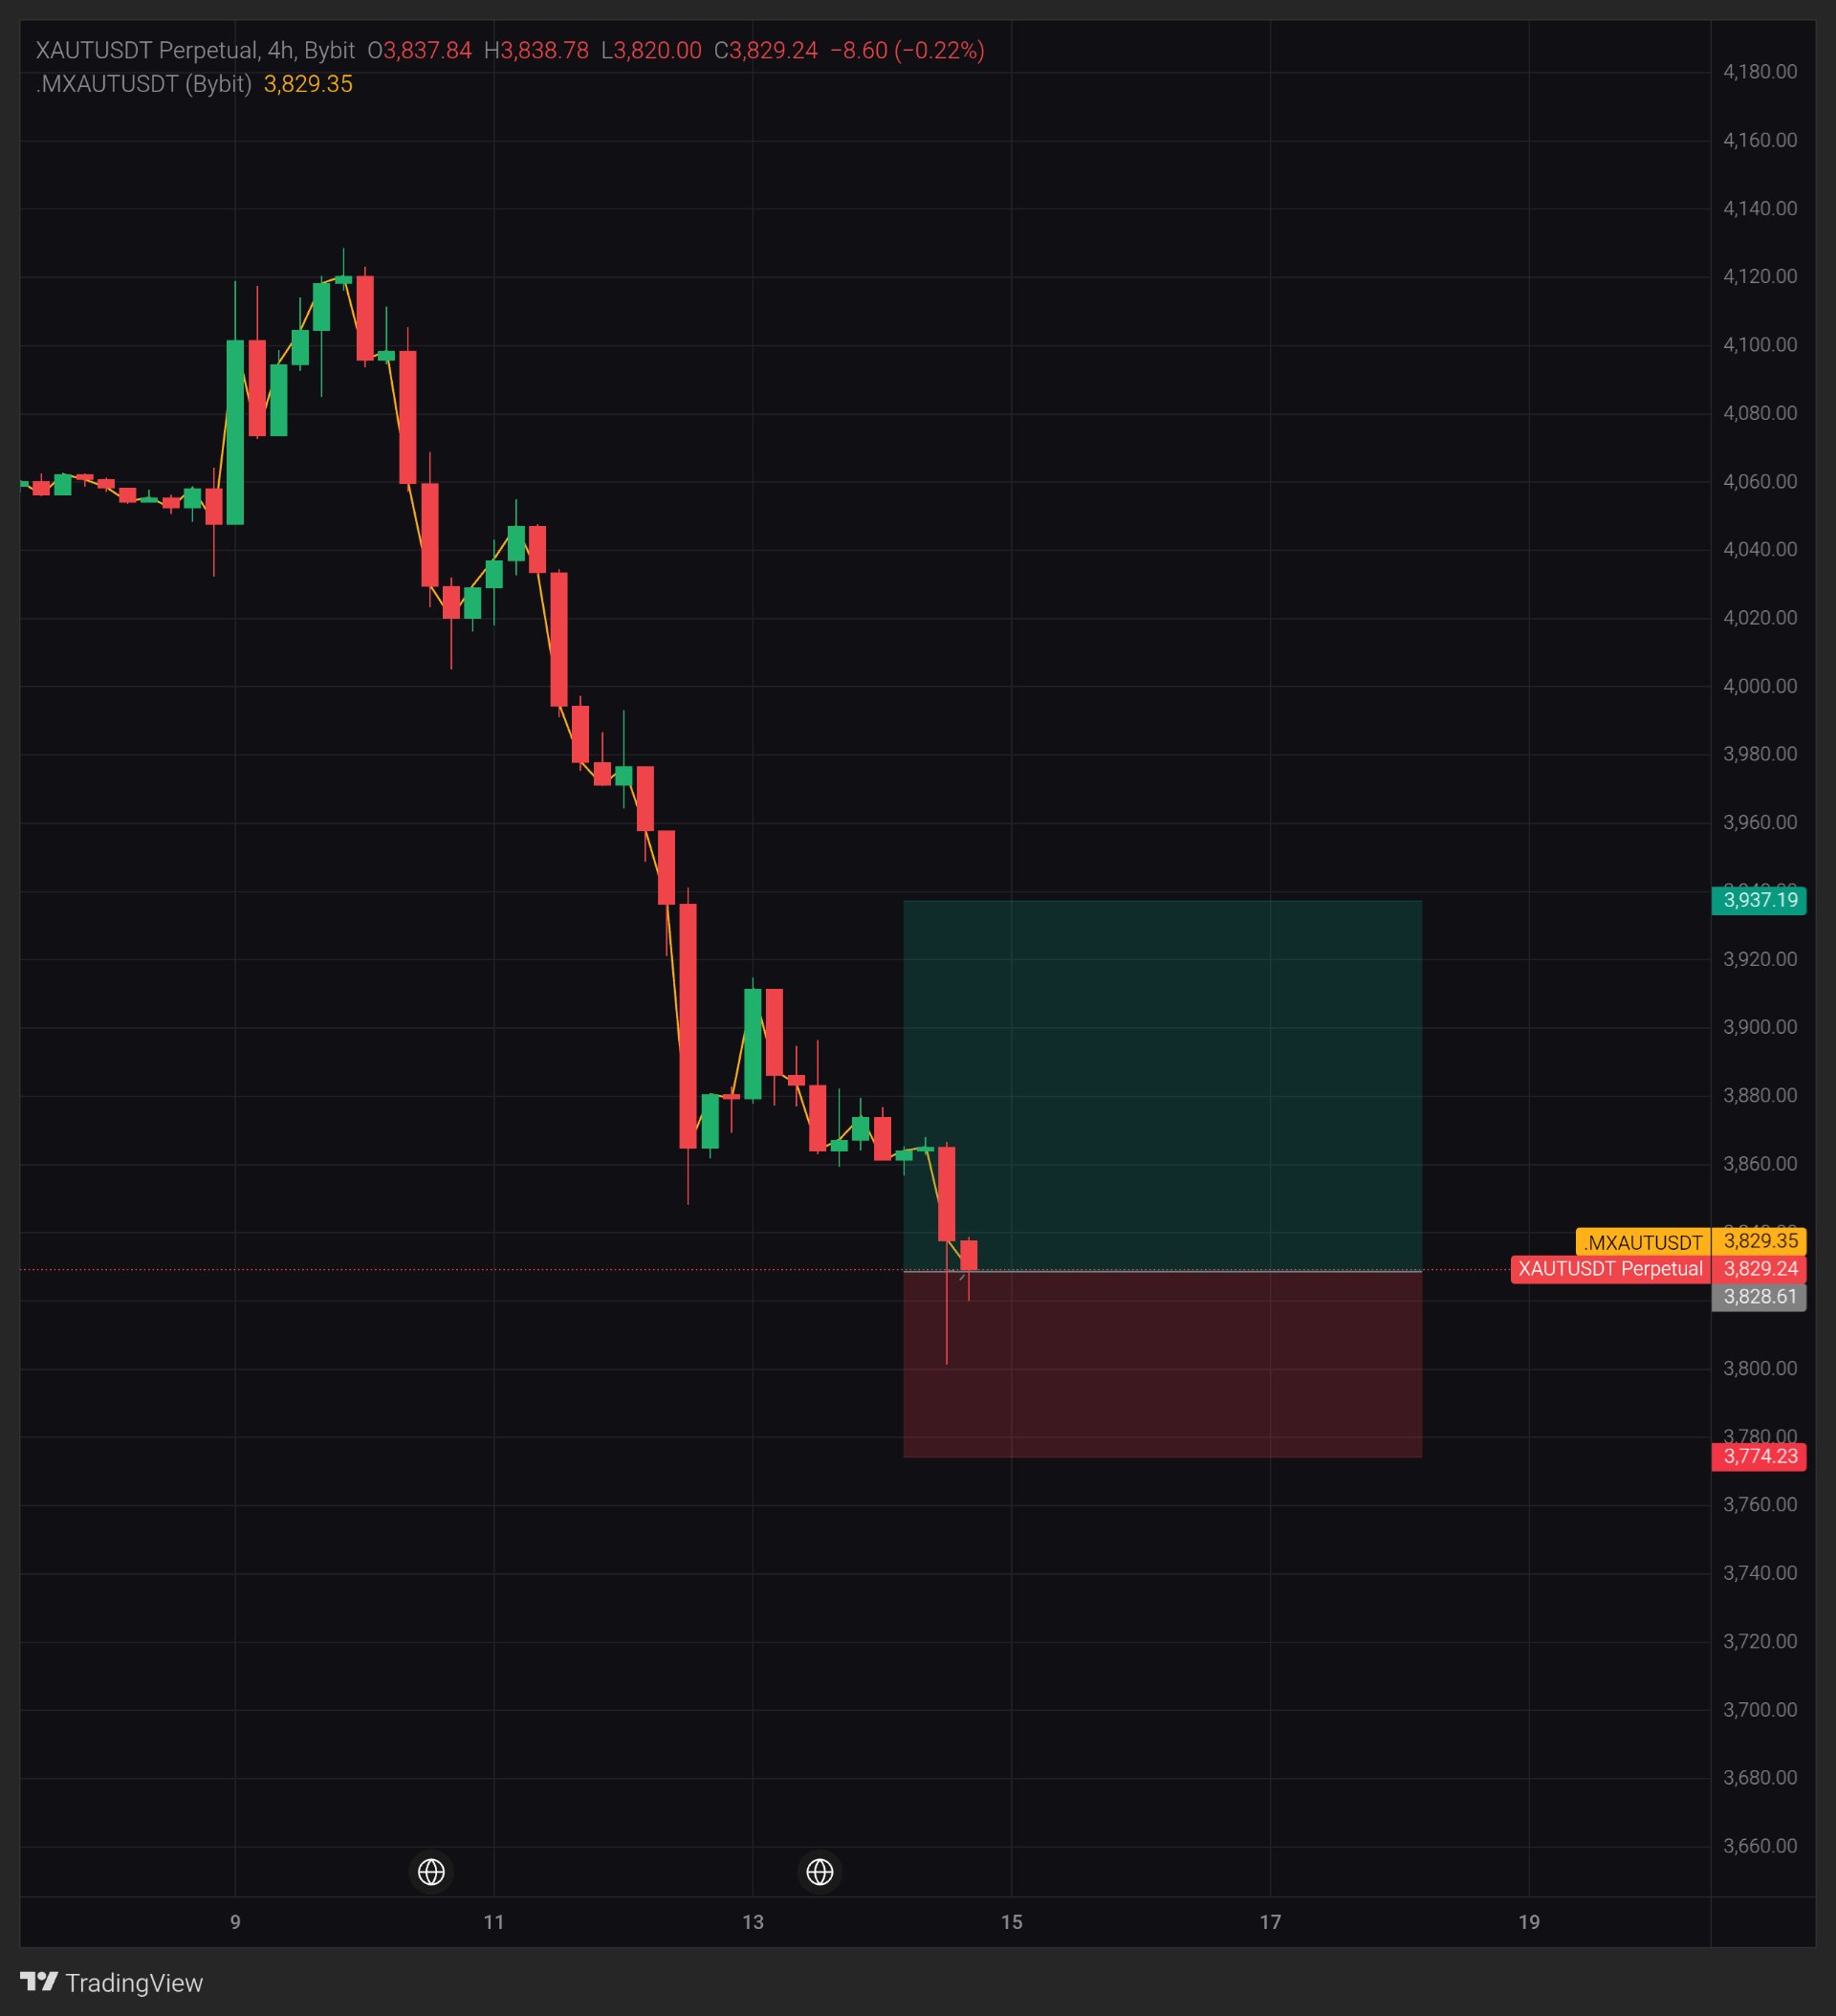
XAUT: Testing 3,828 After a 7% Drop
$XAUTUSDT — price is sitting right on 3,828.61, the line between my two boxes. Look at the current candle. It traded only 0.94 above its open, and 17.84 below it. Still unresolved: can the buyers who showed up on the last long wick hold a close? Who is more patient here, the ones who sold the bounces or the ones who bought the wick? 4H, XAUTUSDT Perpetual on Bybit, 3,829.24, -0.22% on the current candle. Macro note Nov 13, 2026: RoboForex's weekly gold outlook says markets are pricing a possible December Fed rate hike, with the FOMC minutes due Nov 18. Background only, not the reason for this move. What the chart shows Price fell from a high near 4,128 to 3,829, about 7.2%, in roughly five days. Since the old low near 3,848, the rebounds have made four lower highs in a row: about 3,915, 3,896, 3,879 and 3,867. The candle before this one closed at 3,837.84, under that old low. It also wicked down to about 3,801 before closing off its low. The current candle: open 3,837.84, high 3,838.78, low 3,820.00, close 3,829.24. The range is 18.78, about 0.5%. The upper wick is only 0.94 against an 8.60 body, so sellers held price under its open almost the whole time. The lower wick is 9.24, about the size of the body, so buyers did step in at 3,820. The index line ($XAUTUSDT) reads 3,829.35, just 0.11 from the perpetual. Volume is not shown here. The yellow line is the index price, which follows price, so it is not independent proof. This is a price-action reading. Key levels Support: 3,820.00 (low of this candle), then about 3,801 (the last wick low). The bottom of my red box is 3,774.23. Resistance: 3,838.78 (high of this candle), then about 3,848 (the old low, now overhead). The top of my green box is 3,937.19. What would strengthen it Price touched 3,820.00 and bounced, but a touch proves little. I want a 4H close above 3,838.78, then a 4H close above about 3,848 to show the old low is reclaimed. A higher low above 3,820.00 on a retest would help more. Concern A 4H close below 3,820.00 would mean the dip buyers failed. Four lower highs in a row show sellers have had the upper hand on every bounce. A close below about 3,801 would leave 3,774.23 as the next reference. What changes my mind A 4H close above about 3,867. The lesson A long wick shows buyers showed up. It does not show they stayed. Only closes do that. My view My read: this is a downtrend of lower highs, and the long wick below is not yet confirmed by a close, so I lean cautious while XAUT stays under about 3,867 on 4H closes. I could be wrong, and a 4H close above about 3,867 would prove me wrong. Take the levels, not my lean. This is a scenario, not a prediction. A reading at posting time, not a guarantee. Which level are you watching on this one, 3,820 or 3,848? #ByXIMPACT
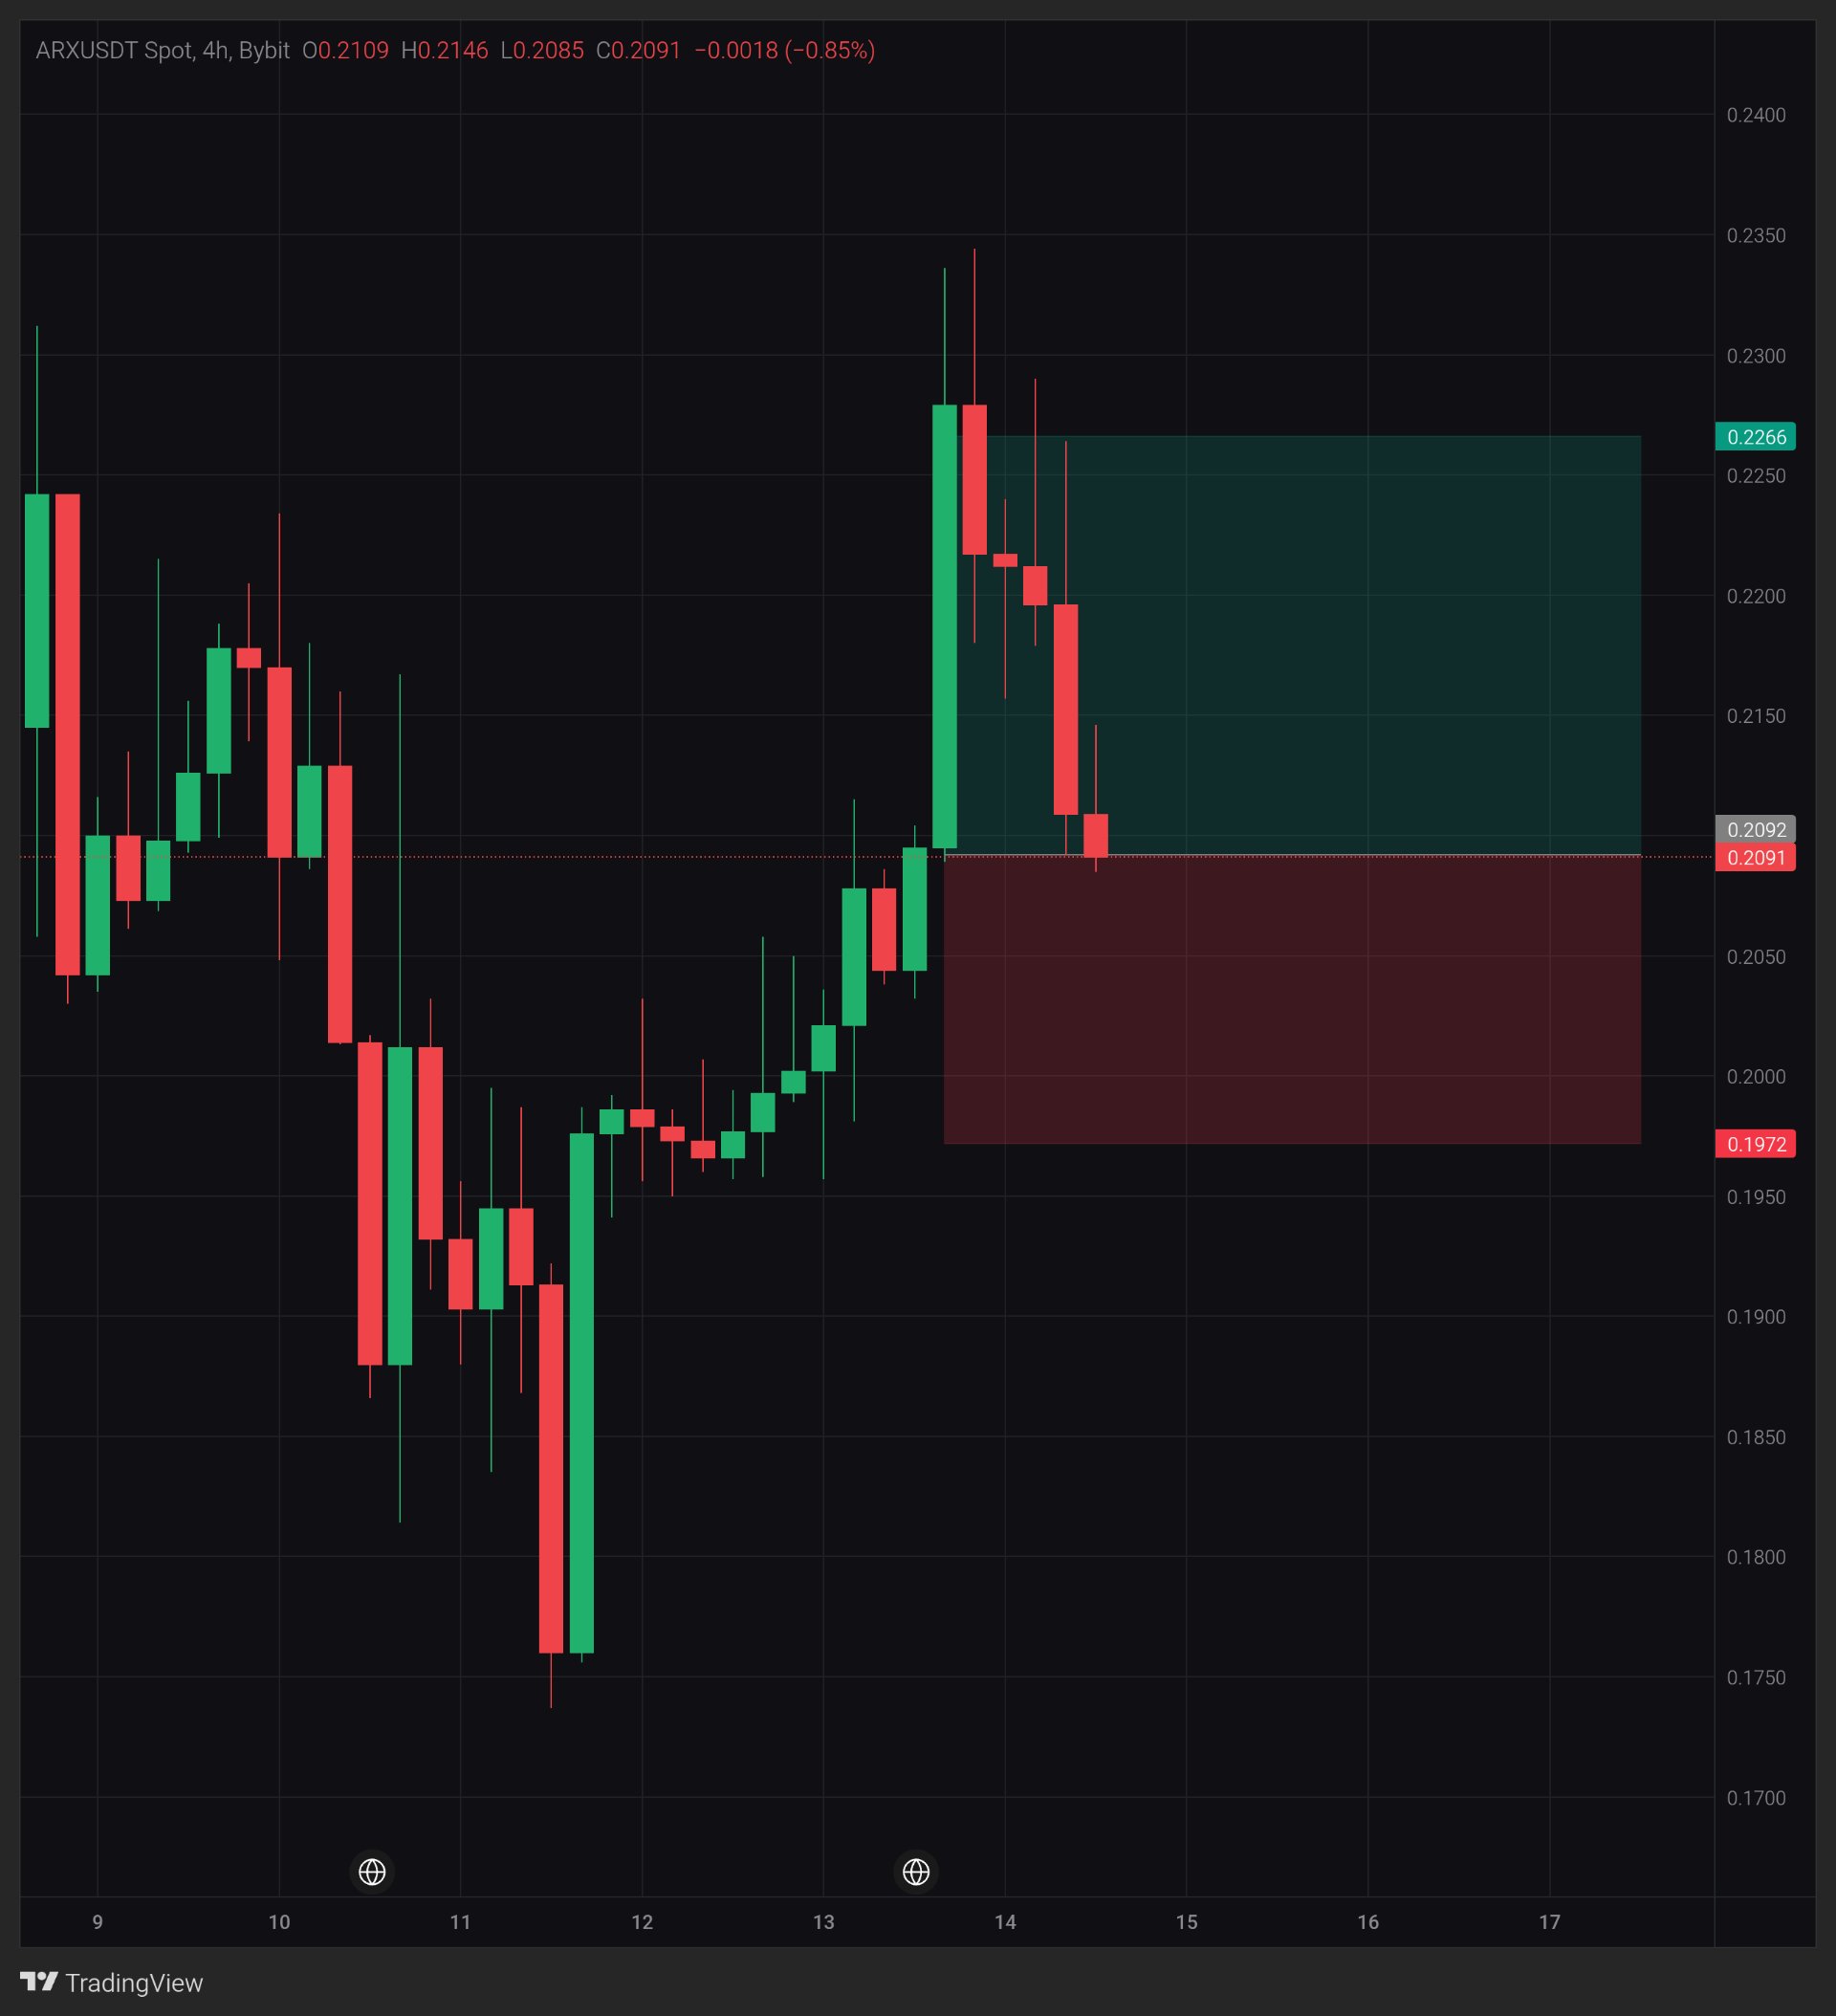
ARX:回到 0.2092,漲勢起點
$ARXUSDT — 價格回到了那根大綠 K 線的底部,0.2092。看看最後五次的收盤價。那根綠 K 線上漲了約 8.8%,而連續五次更低的收盤價已經將漲幅全部抹去了。 尚未解決的問題是:0.2092 在 4 小時線收盤時能否守住,還是這只是下跌途中的下一個停靠站?被拒絕的推升走勢告訴了你什麼綠 K 線無法表達的資訊? 4 小時線,Bybit 上的 ARXUSDT,0.2091,當前 K 線 -0.85%。 圖表顯示 一根大綠 K 線從約 0.2095 一路上漲至收盤接近 0.2279。下一根 K 線上影線觸及約 0.2345,隨後收低。自那之後的每一次收盤價都在走低:0.2217、0.2212、0.2196、0.2108,現在則是 0.2091。 看看目前的 K 線。開盤 0.2109,高點 0.2146,低點 0.2085。震幅約為 2.9%。上影線為 0.0037,大約是 0.0018 實體部分的兩倍。價格曾一度高於開盤價 1.75%,隨後遭到拋售。 拉遠來看:從約 0.1738 上漲至 0.2345 大約是 +35%。價格已經回吐了該漲幅區間約 42% 的空間。 這張圖表沒有顯示成交量,所以我無法判斷拋售背後的力道有多大。沒有任何指標,所以這純粹是基於價格行為的解讀。 關鍵點位 支撐位:0.2092(大綠 K 線底部,我兩個方框之間的邊緣),其次是 0.1972(我紅色方框的底部)。 阻力位:0.2146(當前 K 線高點),其次是 0.2266(我綠色方框的頂部)。 什麼會增強多頭走勢 價格已經觸及 0.2092 並下探至 0.2085,所以僅僅觸及並不能證明什麼。我希望看到 4 小時線收盤回到 0.2092 上方,然後是收在 0.2146 上方。如果在重新測試時能在 0.2092 上方形成更高的低點(higher low)會更有利。大綠 K 線實體的中點,約 0.2187 附近,是回調開始看起來被消化吸收的位置。 隱憂 若 4 小時線收在 0.2092 下方,意味著這波拉升的基礎失敗了。下一個參考點是 0.1972,即我紅色方框的邊緣。連續五次更低的收盤價顯示賣方目前掌握著控制權。 什麼會改變我的看法 4 小時線收在 0.2187 上方。 經驗法則 觸及某個點位只是「拜訪」。收盤才是一種「決策」。價格已經拜訪了 0.2092,但還沒做出決定。 我的觀點 我的解讀:這看起來是一次失敗的拉升,價格回到了起點,因此只要 ARX 在 4 小時收盤價上維持在 0.2187 以下,我就傾向保持謹慎。我可能會判斷錯誤,而 4 小時收盤價高於 0.2187 將證明我是錯的。參考這些點位,而不是我的傾向。這只是一種情境分析,而非預測。這是發文當下的解讀,並非保證。 你希望下一根 4 小時 K 線收在哪裡,0.2092 上方還是下方?為什麼? #ByXIMPACT #WSOT曬出你的AI交易即可贏取10USDT #黃仁勳離任考驗Nvidia的AI領導地位

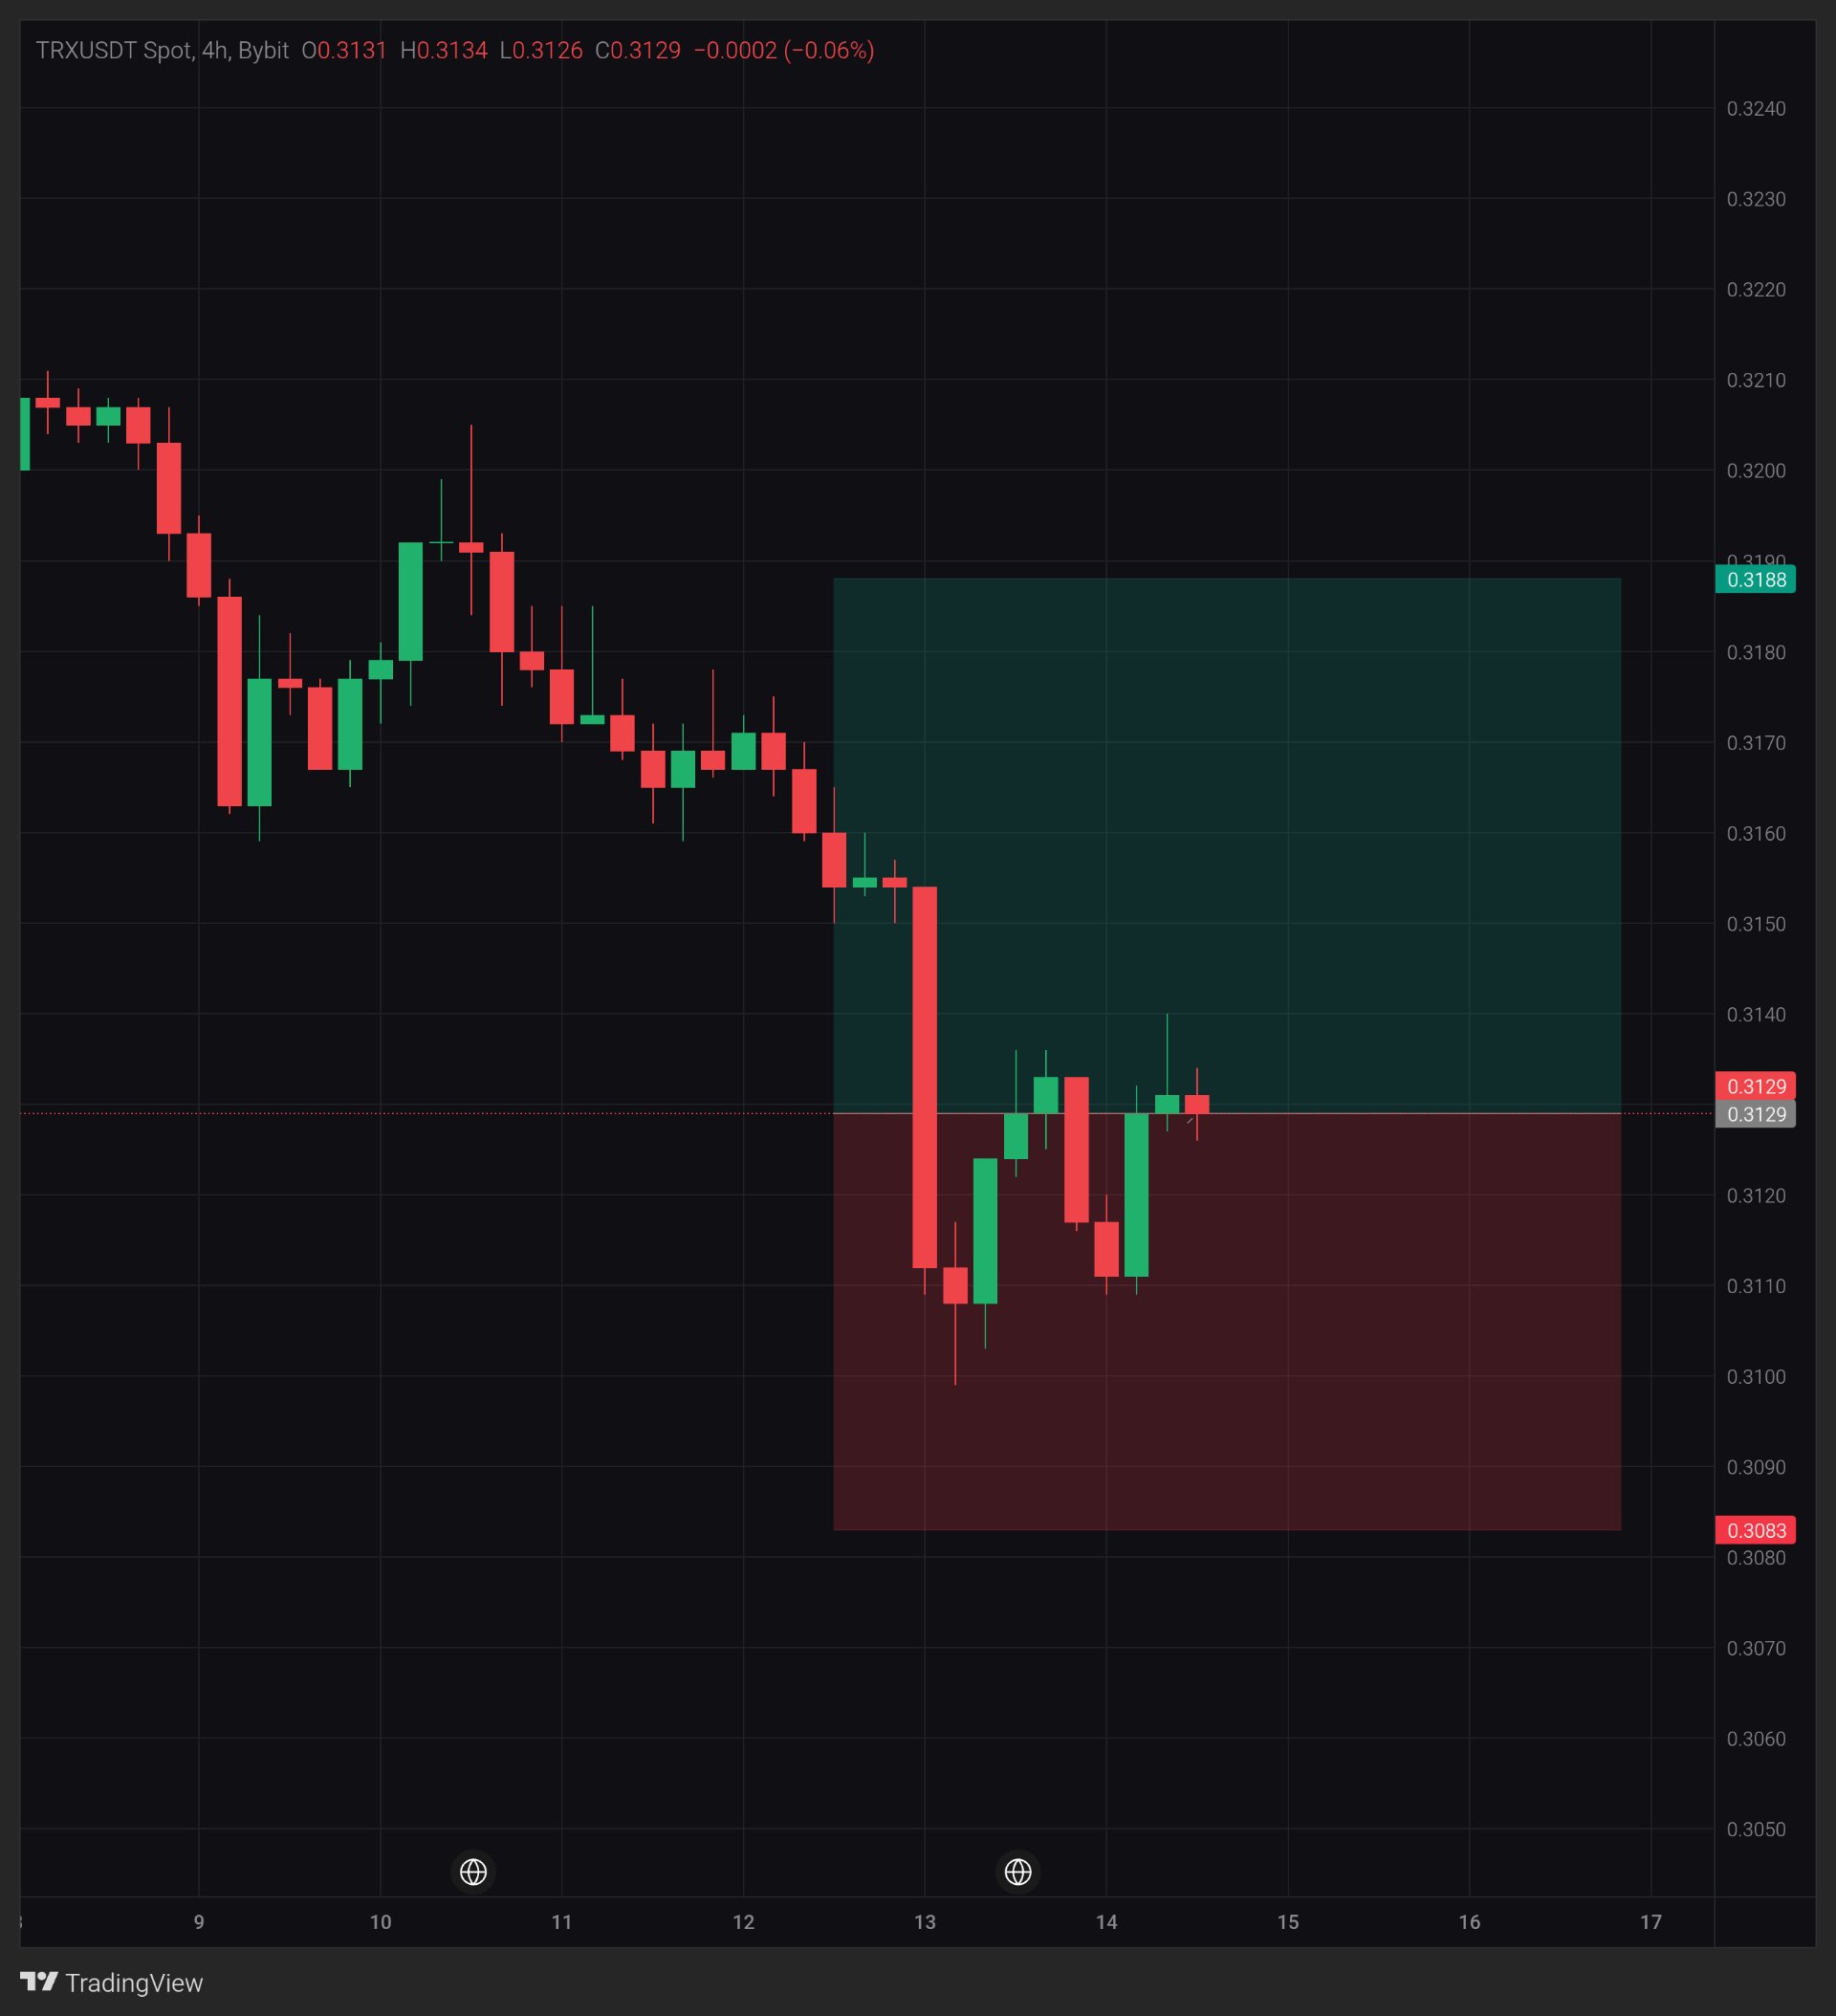
TRX:0.3133 形成了兩個實體頂部。它會突破嗎?
$TRXUSDT — 0.3133 已經阻擋了過去兩根 K 線的實體。 看看這個區間:自從下跌以來已經有九根 K 線,全都維持在約 1.3% 的範圍內。 那個上限同時也是那根大紅 K 線的中間點,價格已經在那裡兩度嘗試未果。 它會向上突破,還是 0.3110 的支撐位會先失守? 4 小時圖,$TRXUSDT Bybit 現貨,價格 0.3129(當前 K 線 -0.06%)。 宏觀註記 11 月 13 日:美國 10 月生產者物價指數年增 6.5%,為四年來最大年度漲幅(資料來源:《The Standard》)。這僅作為背景資訊,並非此次波動的原因。 圖表顯示 一根大紅 4 小時 K 線將價格從 0.3154 拉低至 0.3112,跌幅約 1.3%。此後價格反彈至 0.3140 的上影線高點,但 K 線實體始終停在 0.3133,這正好是那根大紅 K 線的中間點。低點則持續落在 0.3109 到 0.3111 之間。因此,價格正被擠壓在一個支撐位與壓力位之間,整個區間比那根大紅 K 線還要窄。此圖表未顯示成交量與指標,因此這僅為價格行為分析。 關鍵價位 支撐位:0.3126(當前 K 線低點),接著是 0.3109 到 0.3111(重複出現的低點),然後是 0.3098(下影線低點)以及 0.3083(我所畫框的底部)。 壓力位:0.3133(實體上限),接著是 0.3136 到 0.3140(上影線高點),然後是 0.3154(大紅 K 線的開盤價)以及 0.3188(我所畫框的頂部)。 何種情況會增強多頭力道 觸及 0.3140 並不能證明什麼,因為之前已經觸及過了。若能在 4 小時收盤價高於該價位,將是第一個真正的進展,因為目前為止,高於 0.3133 的上影線都未能站穩。 疑慮 4 小時收盤價若低於 0.3109,將會跌破支撐住前幾次下跌的底部,下一個目標位將是 0.3098。若在 0.3133 再次遭到拒絕,會讓這個壓力位變得更難以忽視。 什麼情況會讓我改變看法 4 小時收盤價高於 0.3154,這將會完全抹去那根大紅 K 線的影響。 心得 下跌後的窄幅震盪即為中繼整理。收盤時哪一方勝出,就決定了這是什麼性質的整理。 我的觀點 我的解讀是:這看起來像是下跌後的暫停,還不是反轉。在 0.3140 以上收盤之前,我傾向保持謹慎。我可能會判斷錯誤,若 4 小時收盤高於 0.3154 就證明我錯了。請參考價位,不要盡信我的傾向。這只是一個情境分析,而非預測。這是在發文當下的解讀,並非保證。 觀察上限與下限。你認為哪一邊會先失守? #ByXIMPACT #AnthropicIPOValuationTest #比特幣在美國中期選舉後跌至兩個月低點
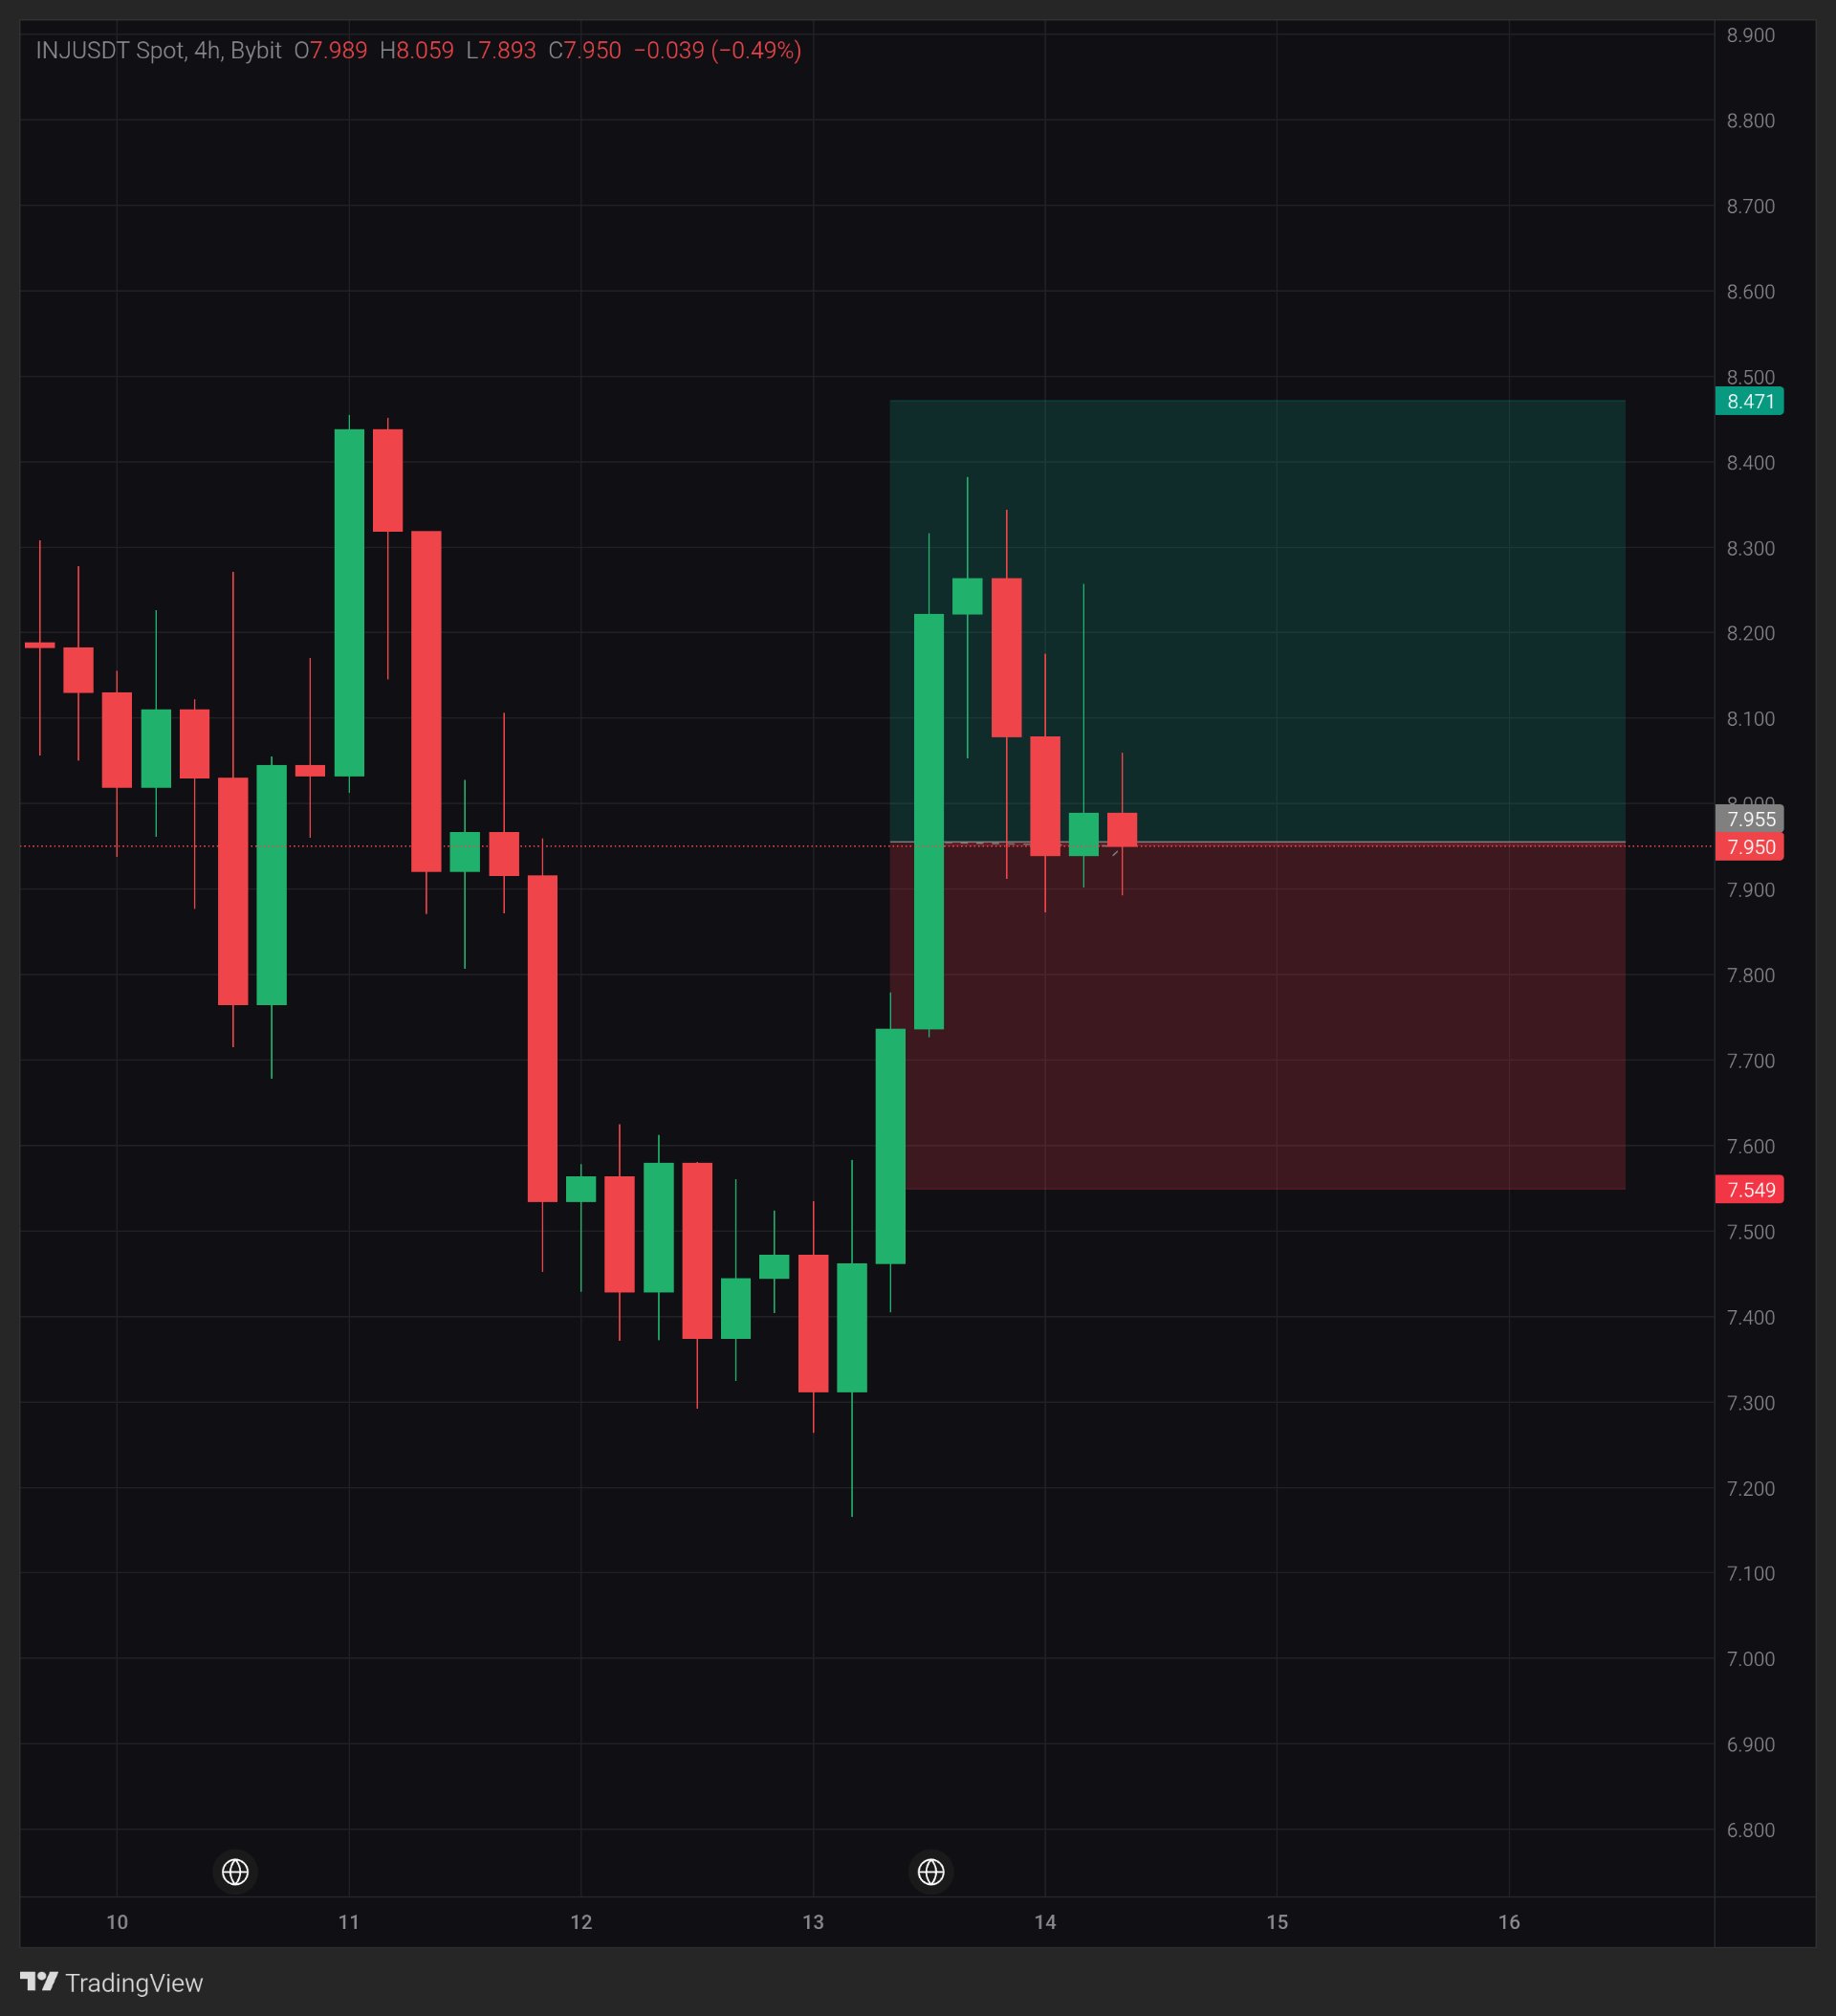
INJ: 7.87 floor, lower highs. Which breaks?
$INJUSDT — 7.87 to 7.90 keeps catching every dip. The highs have faded from 8.385 to 8.059 over five candles. Price is also sitting at the midpoint of a 6% surge candle. Does the floor hold, or does the squeeze break down first? 4H chart, $INJUSDT Spot on Bybit, price 7.950 (-0.49% on the current candle). Macro note Nov 13: US October producer prices rose 6.5% year-on-year, the largest annual gain in four years, adding to expectations of more Fed rate hikes (The Standard). Background only, not the reason for this move. What the chart shows INJ bounced from the 7.17 wick low to the 8.385 high, about 17%, led by one big green candle (7.735 to 8.225, about 6%). Since then price has faded back to 7.95, right at that candle's midpoint, about 7.98. The recent candles keep repeating lows at 7.87 to 7.90 while the highs fade, so price is squeezing between a flat floor and lower highs. A small green candle also left a wick up to about 8.265, where sellers showed up. Volume and indicators are not shown on this chart, so this is price action only. Key levels Support: 7.87 to 7.90 (repeated lows), then 7.735 (base of the surge candle), then 7.549 (bottom of my box). Resistance: 8.06 (current candle high), then 8.18 to 8.27 (wick highs), then 8.385 and 8.471 (top of my box). What would strengthen it Touching 8.06 proves nothing. A 4H close above it would end the lower-high pattern, and a close above 8.27 would clear the last wick high. Holding 7.87 on another dip would also help. Concern A 4H close below 7.87 would break the floor that caught the last dips, with 7.735 next. A bounce that fades back to the midpoint of its own biggest candle is losing strength. What changes my mind A 4H close below 7.735, which would erase the whole surge candle. The lesson A bounce that gives back half of its biggest candle is asking a question. The floor under it decides the answer. My view I'm watching the 7.87 floor and the 8.06 cap. A squeeze like this resolves one way or the other, and a close shows which side won. This is a scenario, not a prediction. A reading at posting time, not a guarantee. Which gives first, the 7.87 floor or the 8.06 cap? #ByXIMPACT

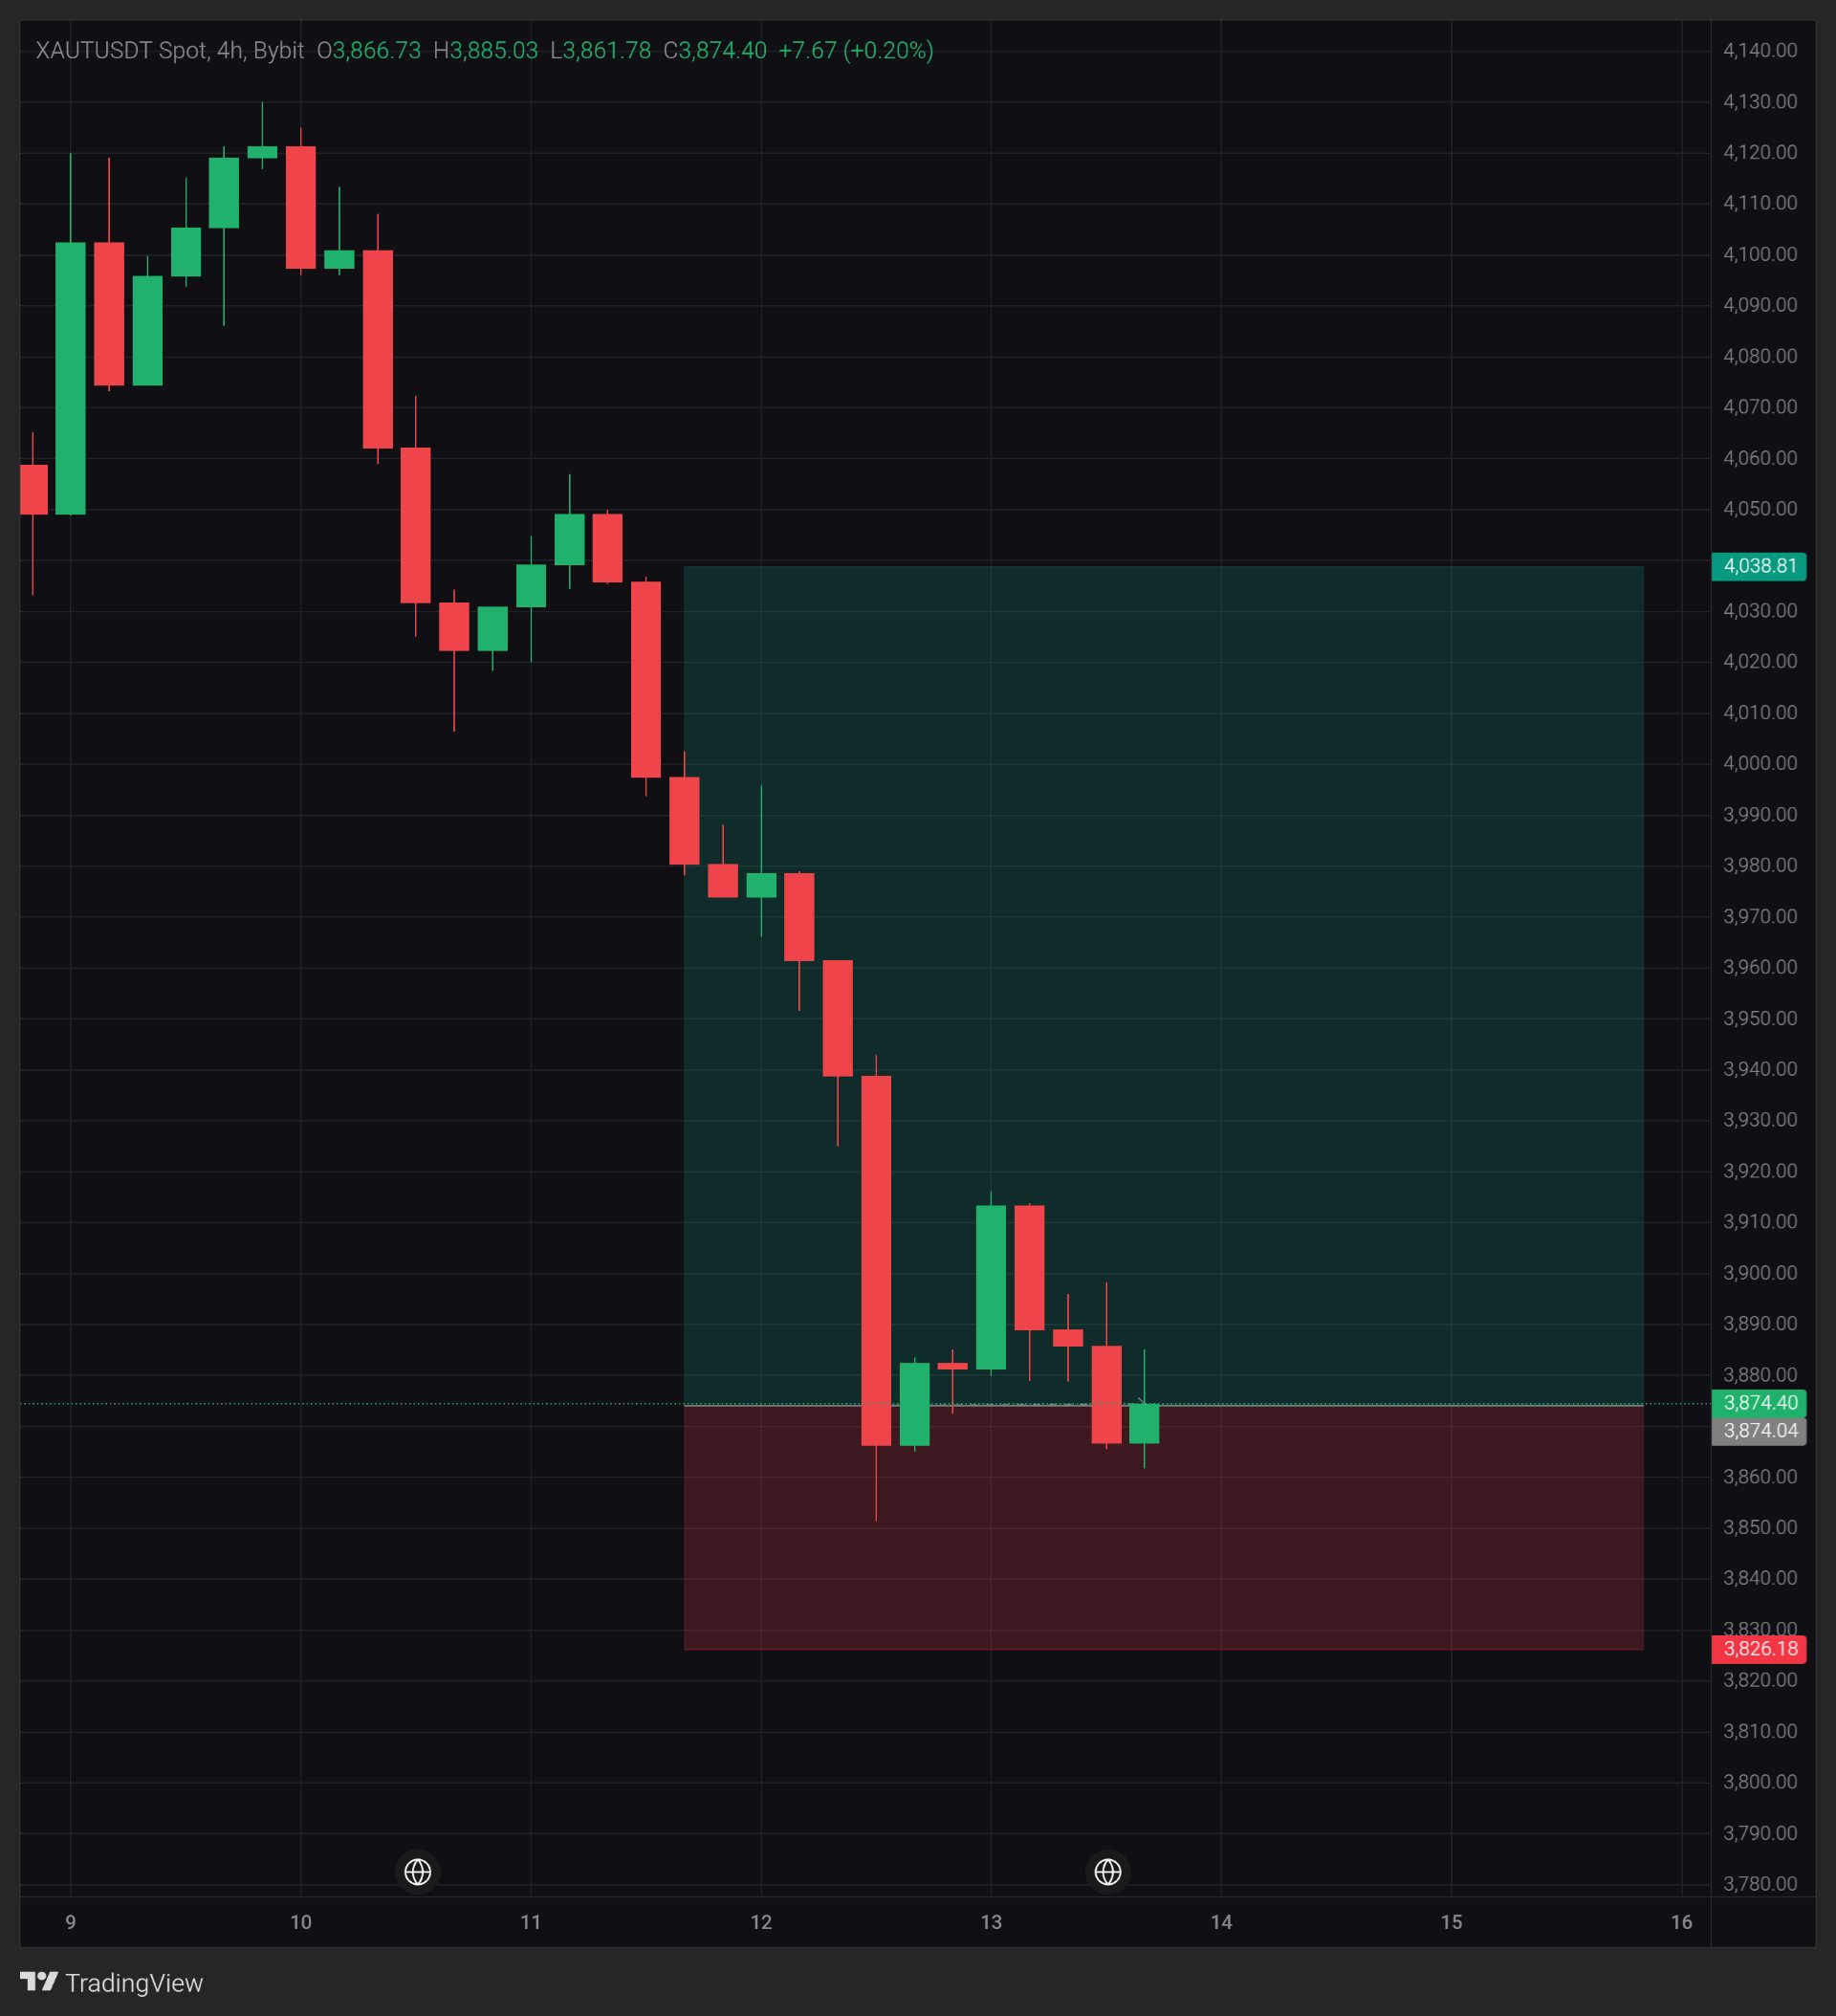
XAUT:黃金準備好復甦了嗎?
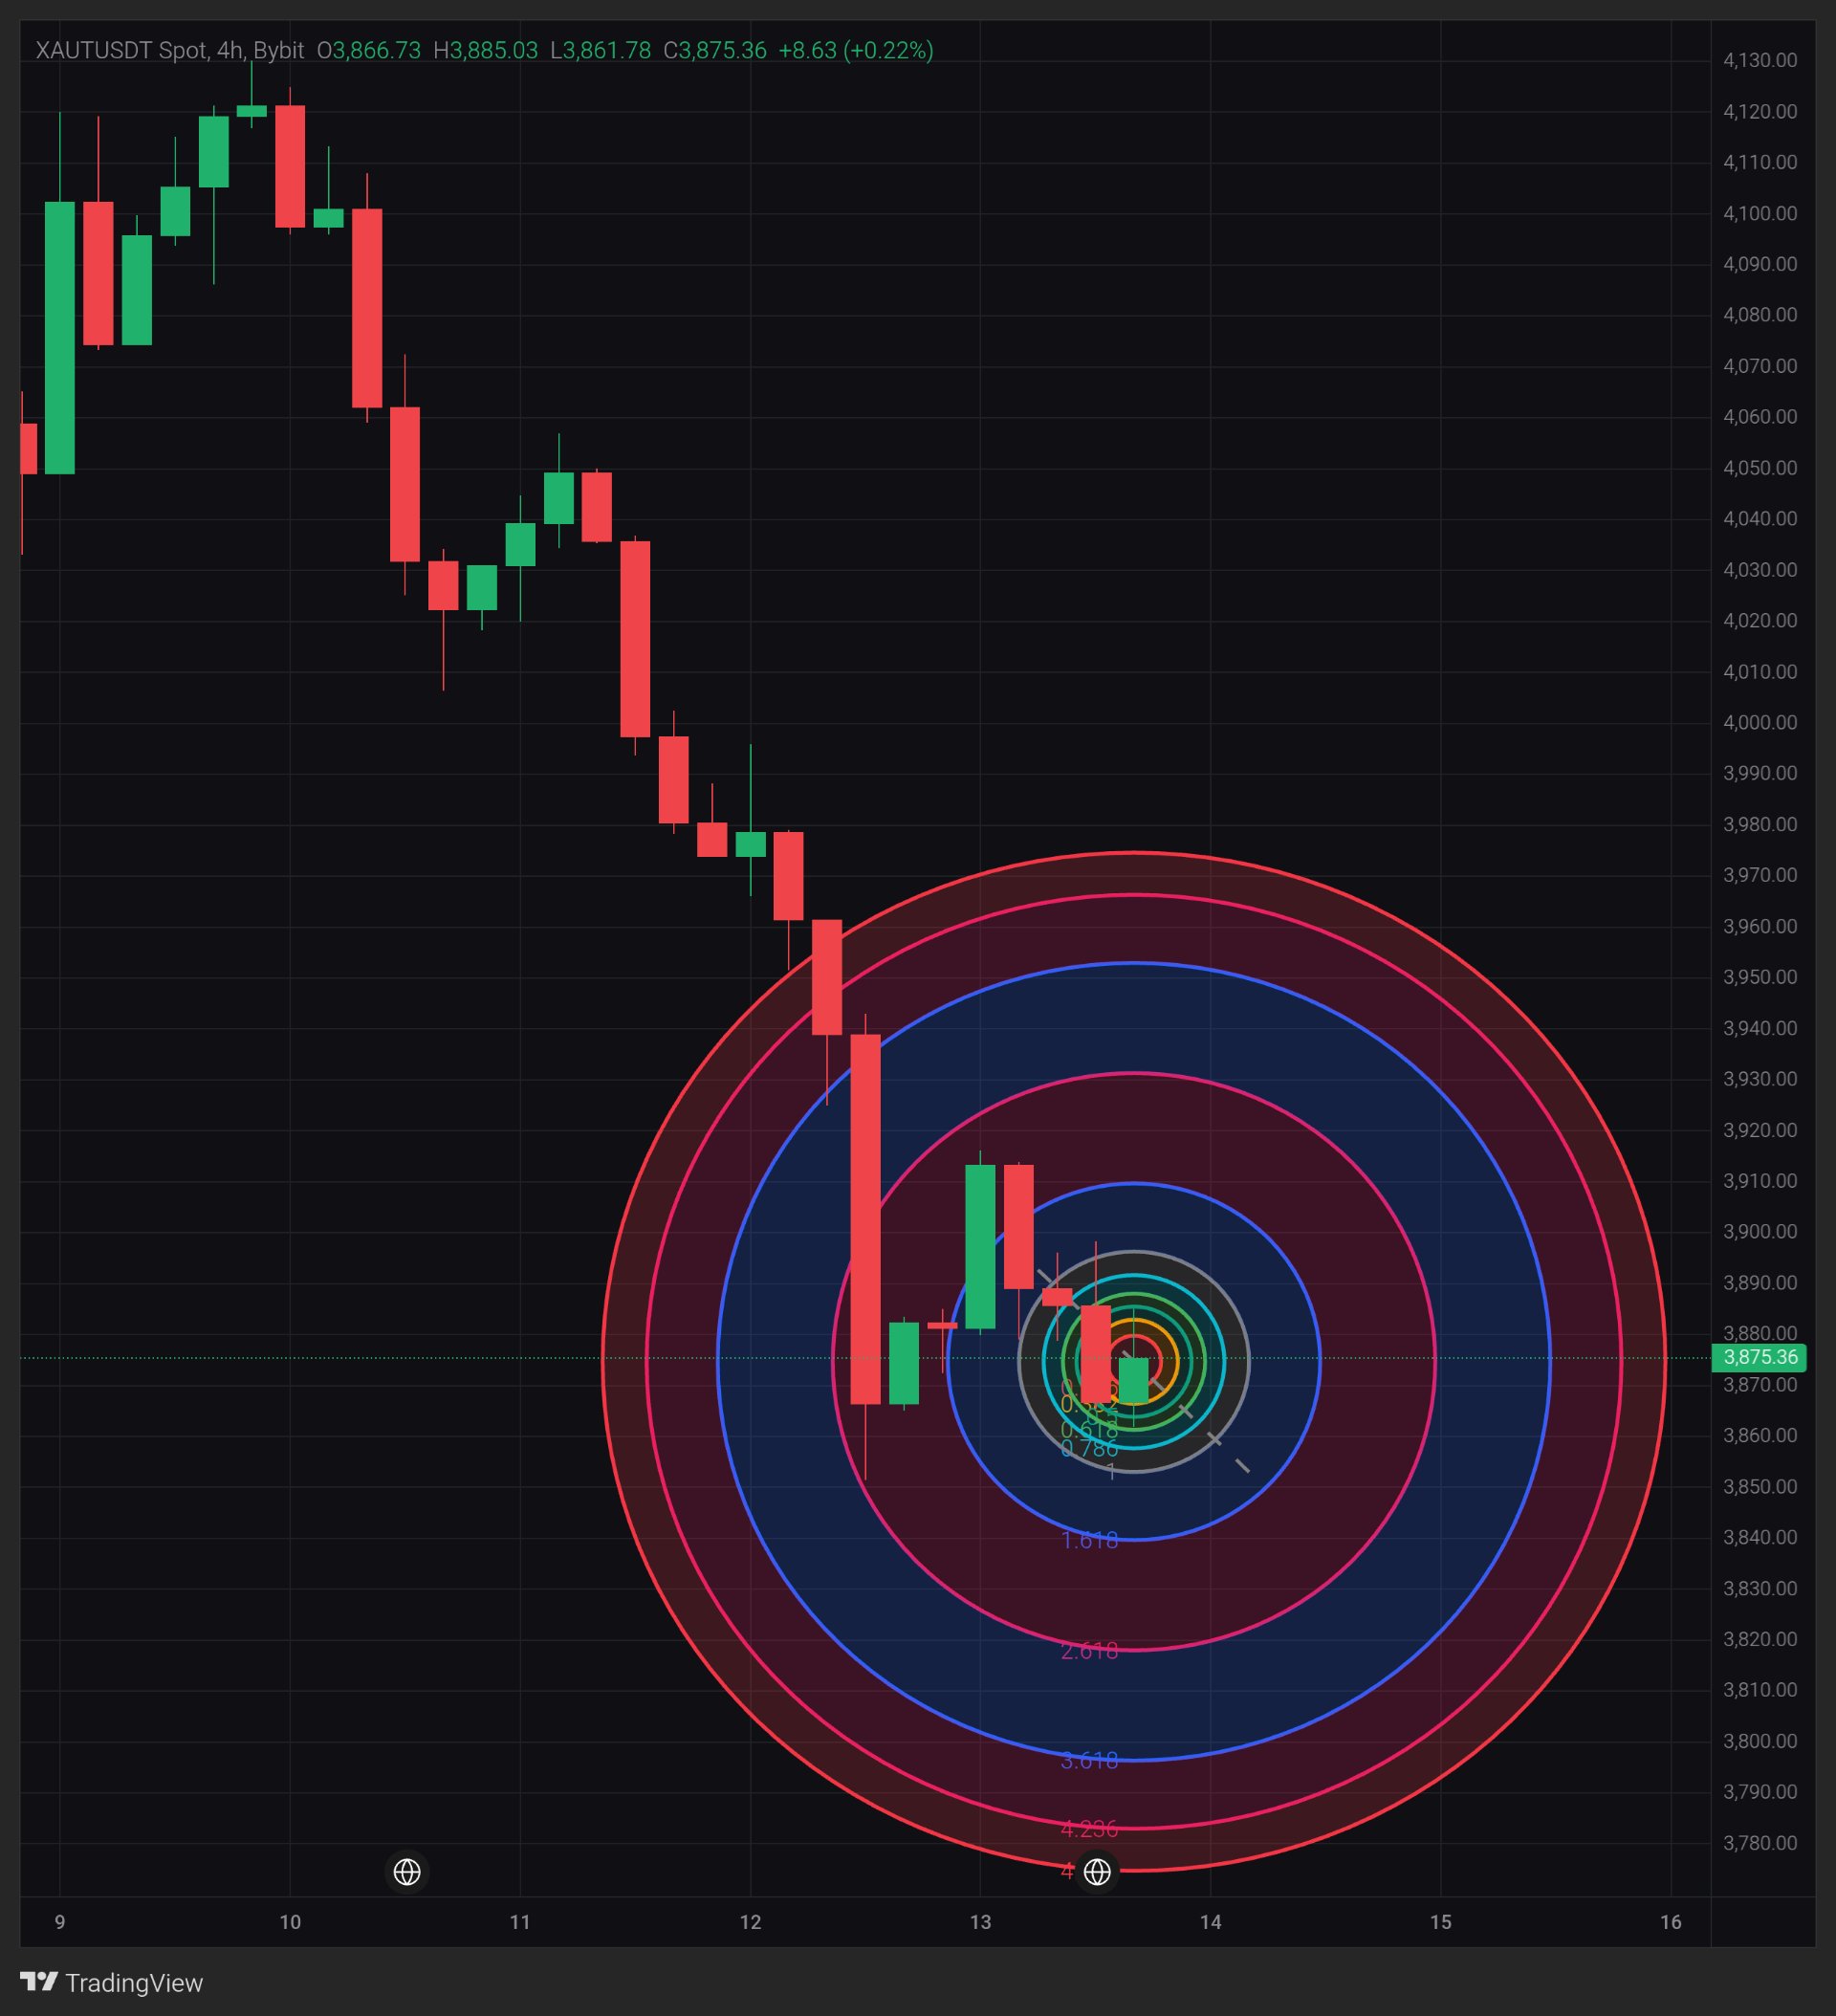
黃金經歷了一波劇烈拋售,但 XAUT 目前正在測試 $3,860–$3,875 附近的關鍵支撐區。 有趣的是,儘管黃金正面臨宏觀經濟壓力,但 Tether Gold 在透明度方面剛剛取得了重要進展。隨著買家試圖守住當前水位,這是否會創造出不同的市場敘事? 我的 Bybit 4 小時線圖顯示 $XAUTUSDT 位於 $3,874.40,當前 K 線上漲 0.20%。開盤價為 $3,866.73,最高觸及 $3,885.03,並測試了 $3,861.78。 是什麼在驅動黃金? 由於通膨擔憂加劇、美元走強以及國債殖利率上升,黃金一直承受著壓力。這些因素增加了對聯準會採取更緊縮政策的預期,這通常會對黃金等無息資產造成壓力。 然而,週五的生產者物價指數(PPI)數據提供了一些緩解。美國 10 月 PPI 上漲 0.3%,低於 0.4% 的預期,幫助黃金收復了部分近期失地。 XAUT 基本面 Tether Gold 還有一個具體的重要進展。 11 月 12 日,Tether 宣布畢馬威(KPMG)美國分公司已完成對 TG Commodities 2025 年財務報表的獨立審計。此次審計包括對支撐 XAUT 的金條進行實地檢查和識別驗證。 對於旨在提供基於區塊鏈的實體黃金曝險的代幣而言,這是一個意義重大的透明度里程碑。 儘管如此,儲備透明度提高並不自動意味著市場價格上漲。XAUT 仍然與基礎黃金市場緊密掛鉤。 技術結構 4 小時線圖持續顯示短期看跌結構,高點不斷降低,且 $4,130 區域面臨強大的拋售壓力。 價格目前正試圖在 $3,860–$3,875 附近企穩。 我關注的關鍵點位: 即時支撐:$3,860 次要支撐:$3,850 主要支撐:$3,826 第一阻力位:$3,885–$3,900 下一個阻力位:$3,940 更高阻力位:$3,980 主要回升目標:$4,038 看漲情境 如果買家繼續捍衛 $3,860 並收復 $3,900,我將觀察價格是否會向 $3,940 邁進。 若能強勢回升至 $3,980 以上,可能會開啟通往 $4,038 的道路。 我的圖表設置標記了一個潛在的入場點位,接近 $3,874,目標價為 $4,038.81,止損設在 $3,826.18。 不過,我更傾向於等待 4 小時線確認回升,而不是僅僅因為價格接近支撐位就進場。 看跌情境 如果 XAUT 在 4 小時線確認收盤跌破 $3,860,那麼這次回升嘗試可能會失敗。 屆時,我會將 $3,850 和 $3,826 作為下一個下行觀察區域。 若持續跌破 $3,826,將使我圖表上的看漲設置失效。 我的交易計畫 我正在密切關注 $3,860–$3,900 的區間。 成功收復阻力位將改善回升前景,而再次遭到拒絕則可能產生進一步的下行風險。 我寧願等待確認,也不願試圖接住下墜的市場。 我的解讀 XAUT 目前有趣的地方在於,其不斷改善的透明度故事與基礎黃金市場的疲軟之間存在反差。 KPMG 的審計是一個正面的基本面發展,但美元、國債殖利率和聯準會的預期仍然是重要的驅動因素。 對我來說,接下來 4 小時線在 $3,860–$3,900 附近的反應,是了解這究竟是復甦的開始,還是僅僅在廣泛下跌趨勢中的停頓之關鍵所在。 $XAUTUSDT #ByXIMPACT
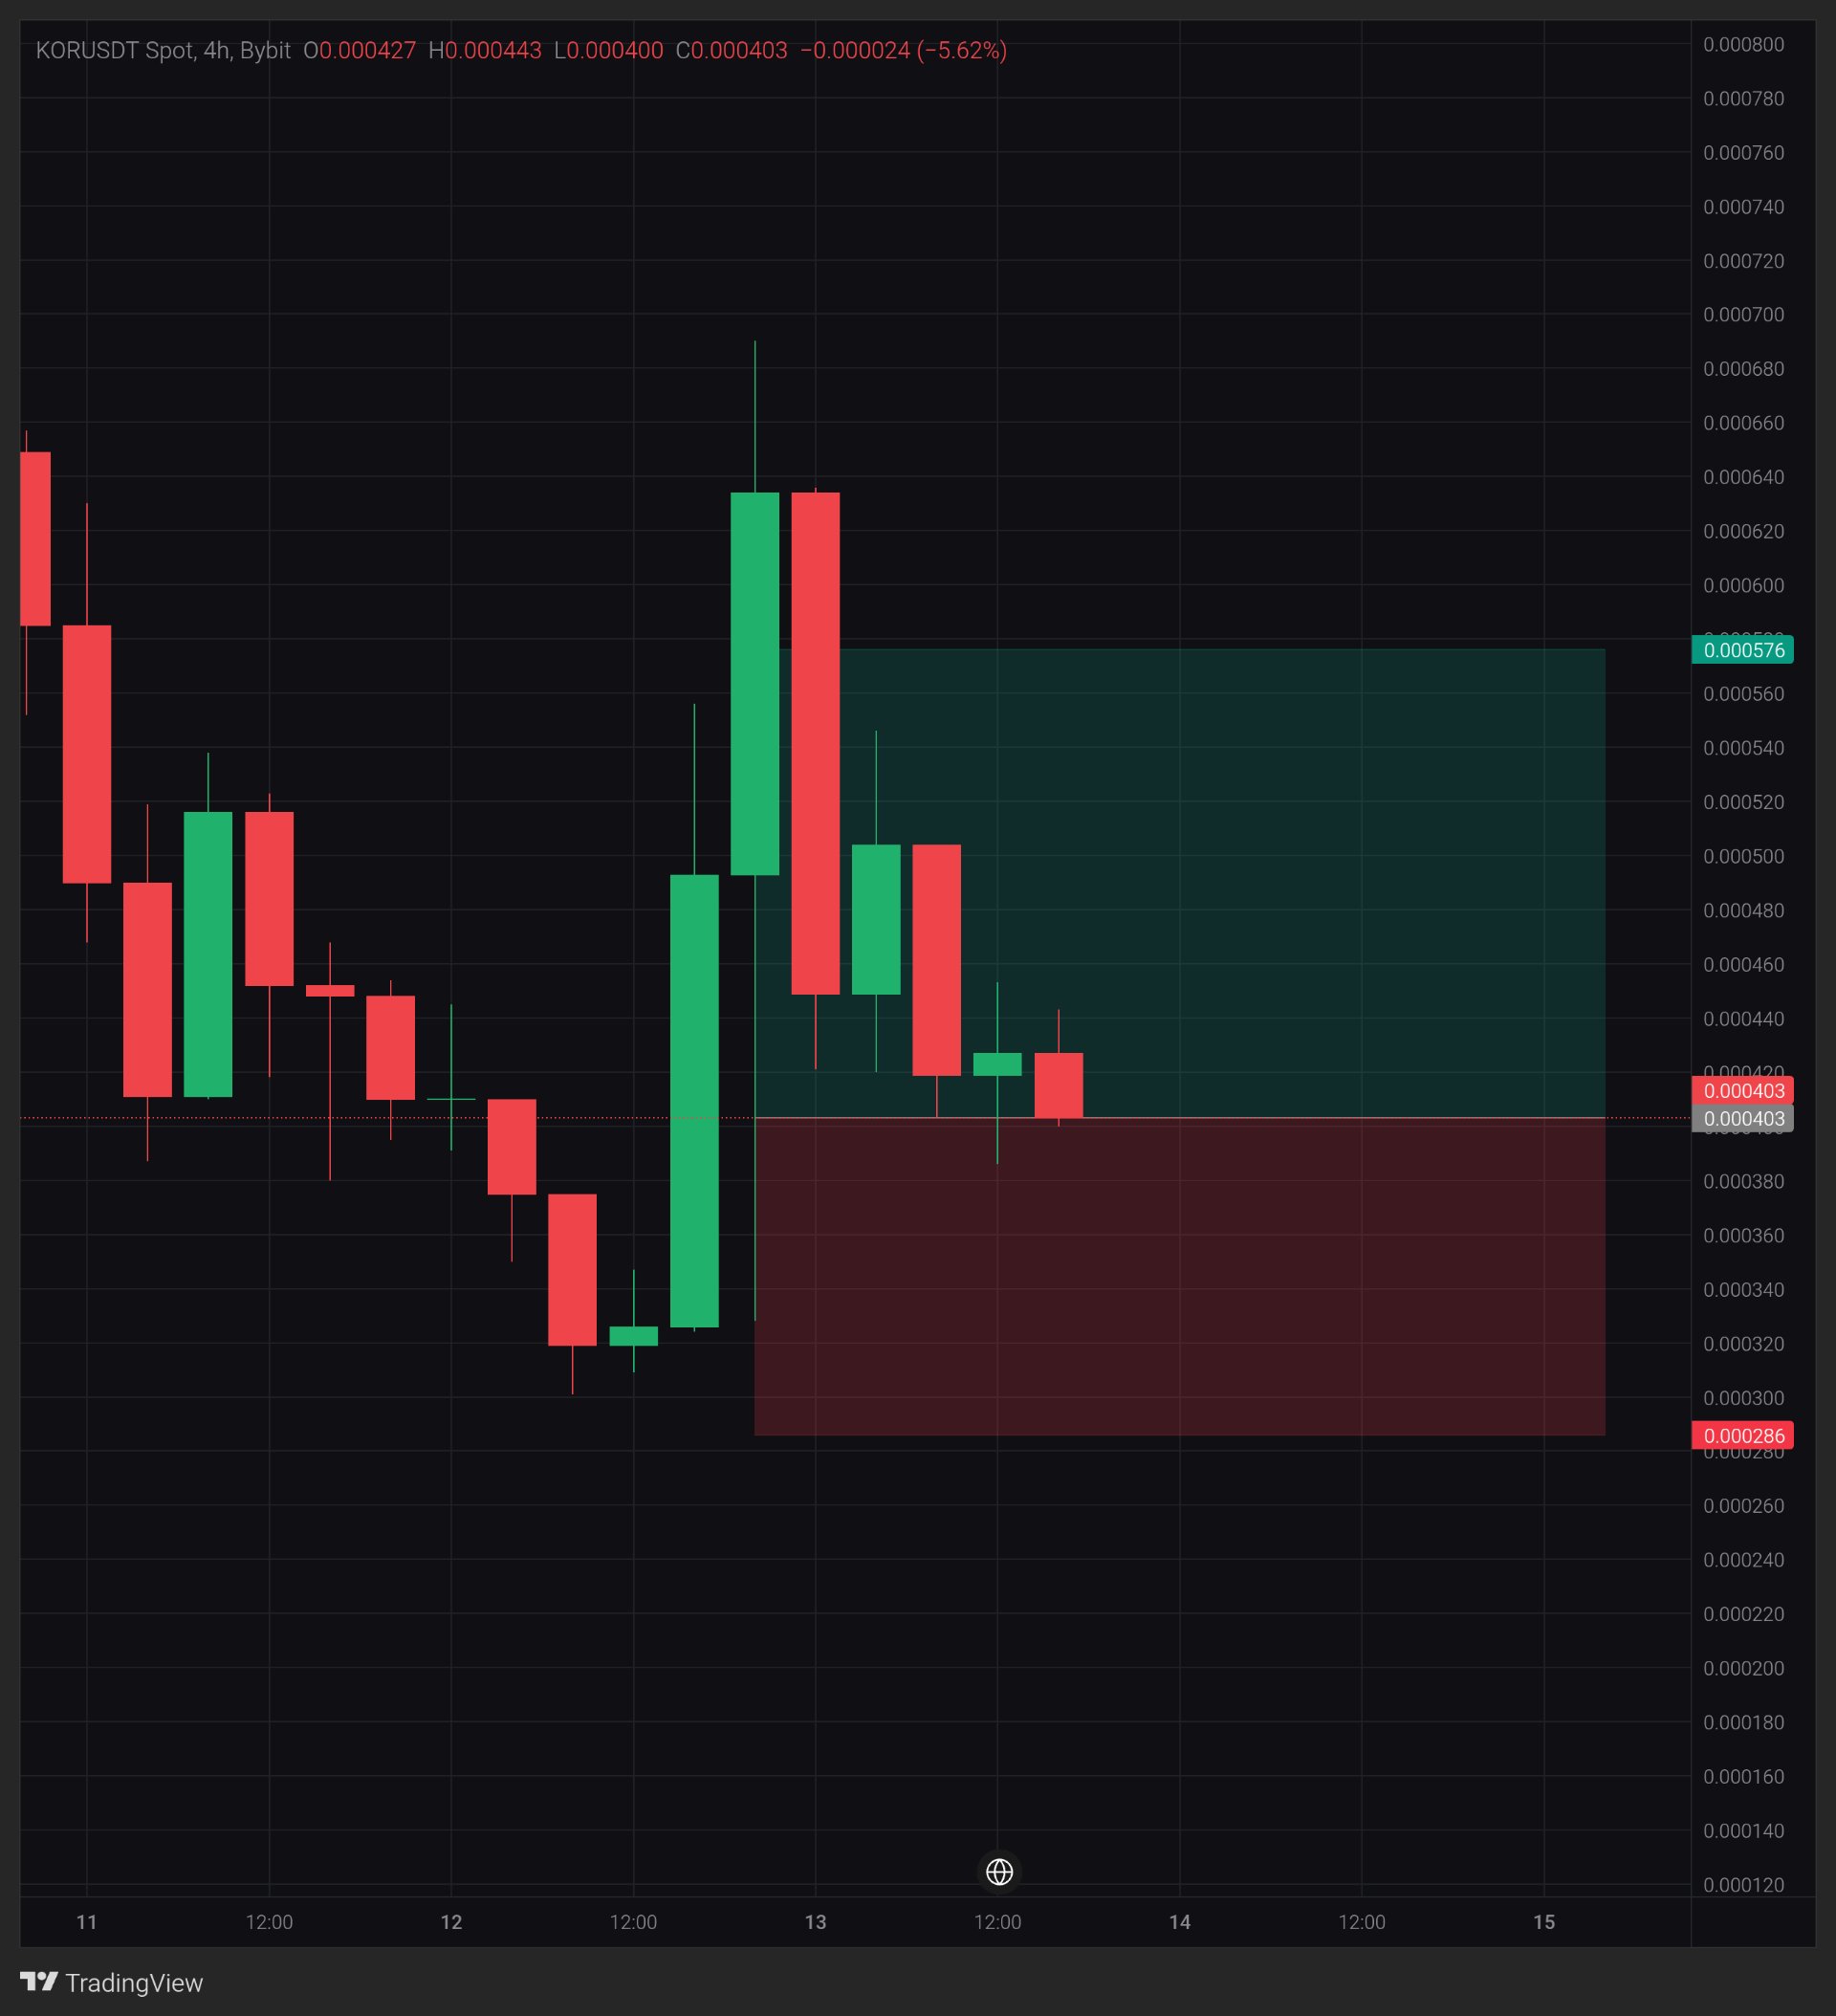
KOR: Can Buyers Defend $0.00040?
$KORUSDT is approaching a critical level, and the next 4H candles could reveal whether buyers are preparing another recovery or whether sellers still control the market. After a sharp rebound from around $0.00032 toward $0.00063, KOR has lost momentum and returned to the $0.00040 area. This is where I want to see whether buyers can step back in. My Bybit 4H chart shows KORUSDT at $0.000403, down 5.62% on the current candle. The candle opened at $0.000427, reached $0.000443 and tested a low of $0.000400. PROJECT FUNDAMENTALS KOR Protocol is built on Base and focuses on managing creative rights, licensing and payment settlements on-chain. Its goal is to give artists, producers, publishers and intellectual property owners a more transparent way to manage and monetize creative assets. The project recently entered a new exchange-listing phase, with KuCoin and Gate announcing KOR spot trading on November 4. Gate also introduced a Launchpool campaign. This brings additional market exposure, but exchange listings alone do not guarantee sustainable demand or price appreciation. MARKET STRUCTURE The previous rally showed strong buying interest, but the rejection near $0.00063 changed the short-term picture. The $0.00040 area is now the immediate level to watch. Key levels: Support: $0.000400 Secondary support: $0.000380 Major support: $0.000320 Resistance: $0.000443 Higher resistance: $0.000500 Major upside target: $0.000576 BULLISH SCENARIO If buyers defend $0.00040 and KOR reclaims $0.000443 with a convincing 4H close, I would watch for a move toward $0.00050. A stronger continuation could bring $0.000576 into focus. I would prefer confirmation and a successful retest rather than entering simply because the price has fallen. BEARISH SCENARIO If KOR loses $0.00040 on a confirmed 4H close, the next areas I would monitor are $0.000380 and $0.000320. A break below $0.000320 would significantly weaken the recovery structure. The $0.000286 area is an additional downside invalidation reference from my chart setup. MY TRADING PLAN I am watching the reaction around $0.00040 rather than chasing the market. A confirmed reclaim of $0.000443 would improve the bullish case. A breakdown below support would make me reconsider the setup. Because KOR is a newly listed and highly volatile token, position sizing and risk control are especially important. MY INTERPRETATION What interests me here is not simply the percentage decline. It is the fact that price has returned to an area where buyers previously showed interest. The next 4H reaction should tell us more than any prediction. I want confirmation from price action before taking a position. #ByXIMPACT #JensenHuangExitTestsNvidiasAILeadership
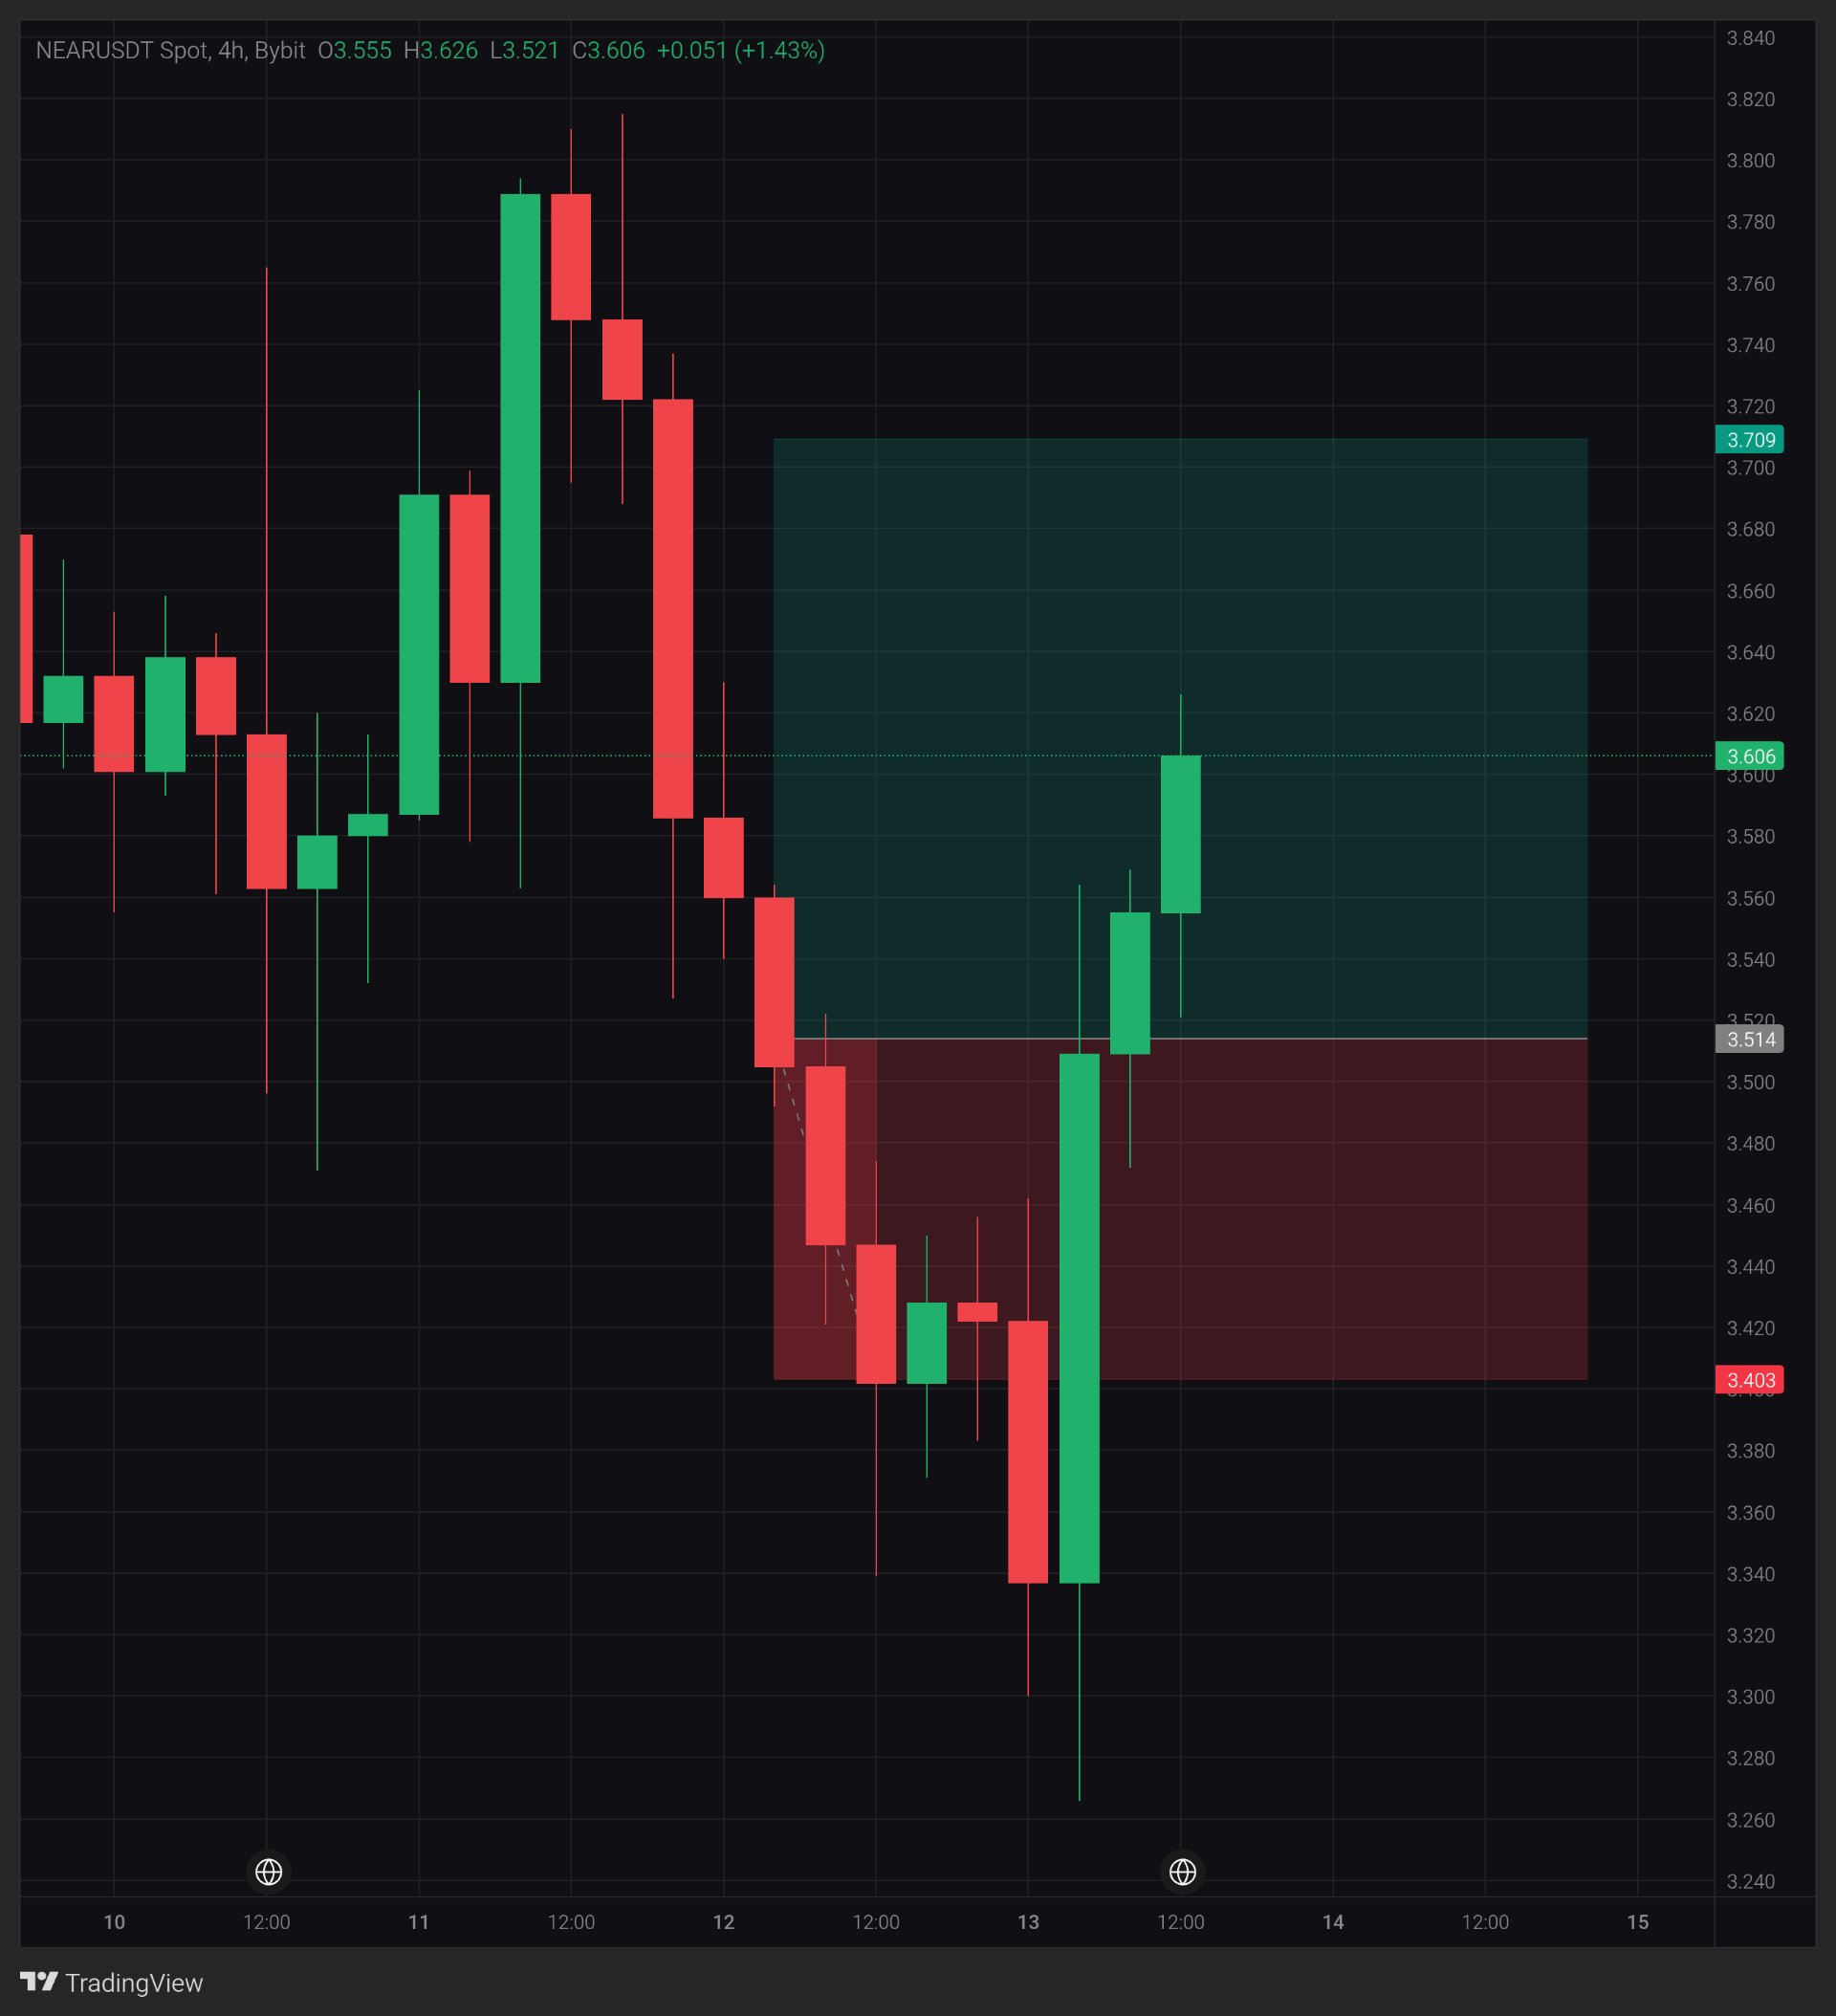
Our expectation was spot on The $NEARUSDT coin has broken through the resistance level, opening up a new path and higher price levels... #WSOT2026 #WSOTShowYourAITradeToEarn10USDT
NEAR: Price is back at the 3.514 breakdown
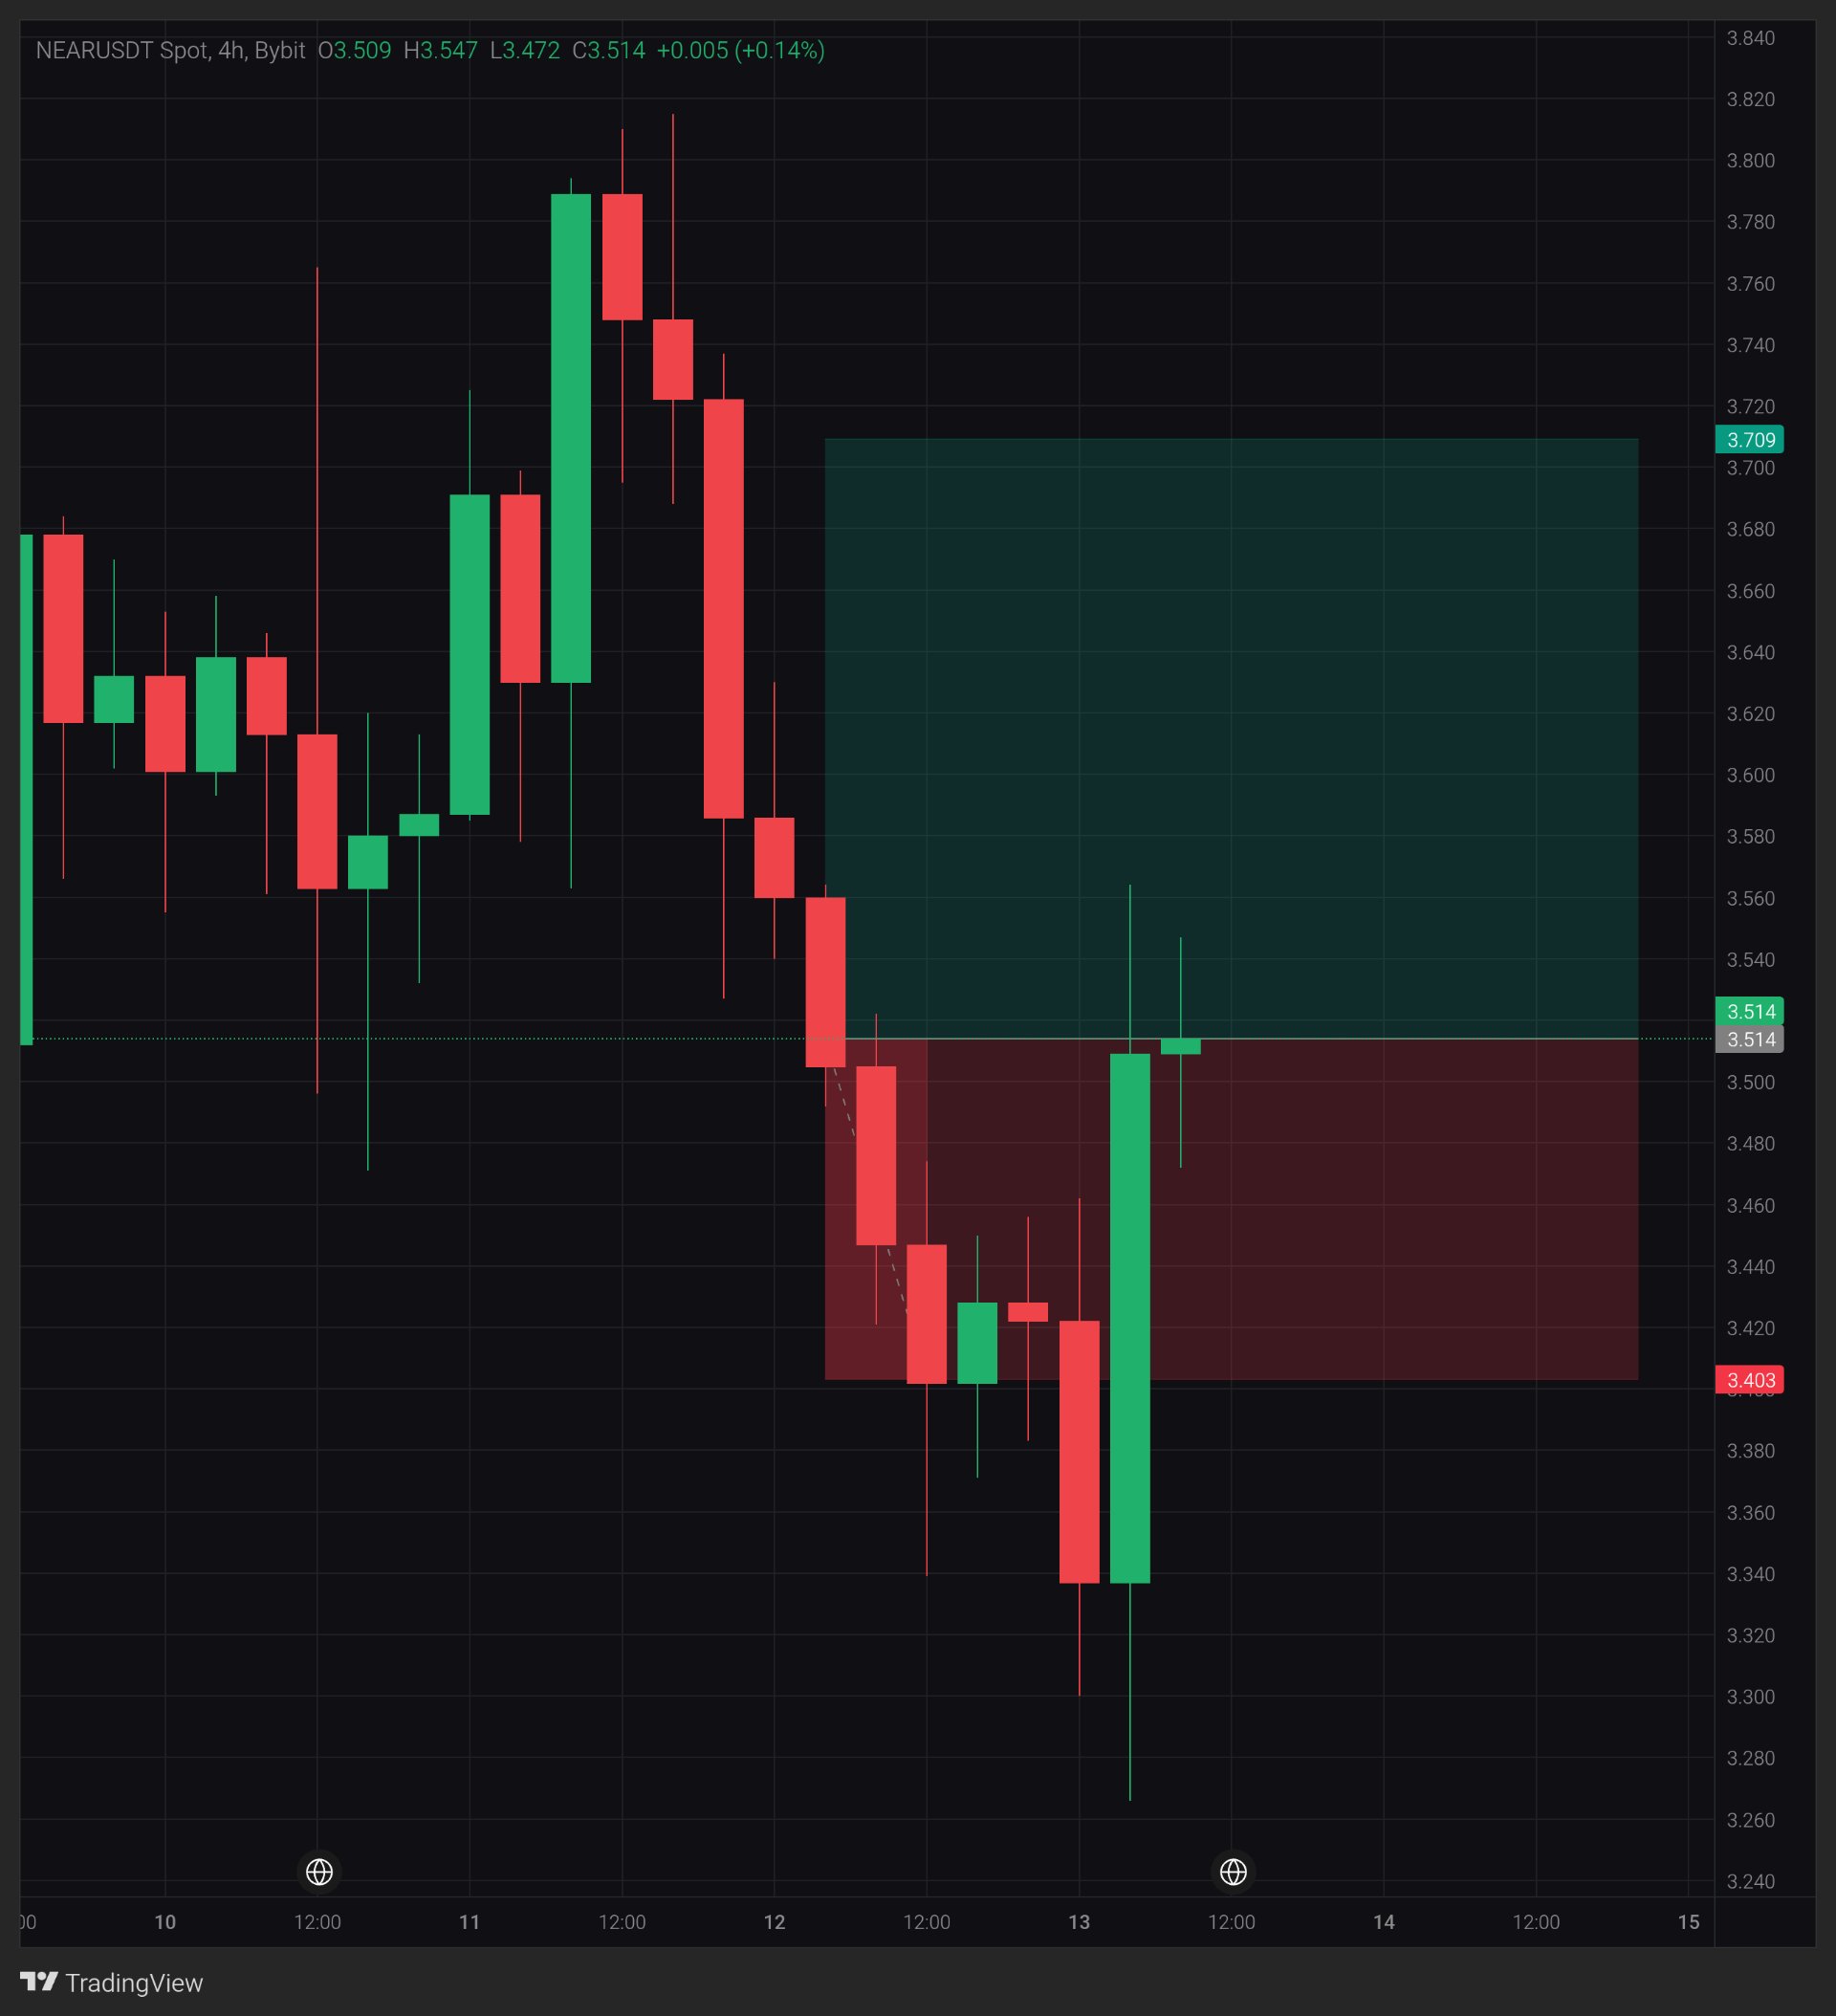
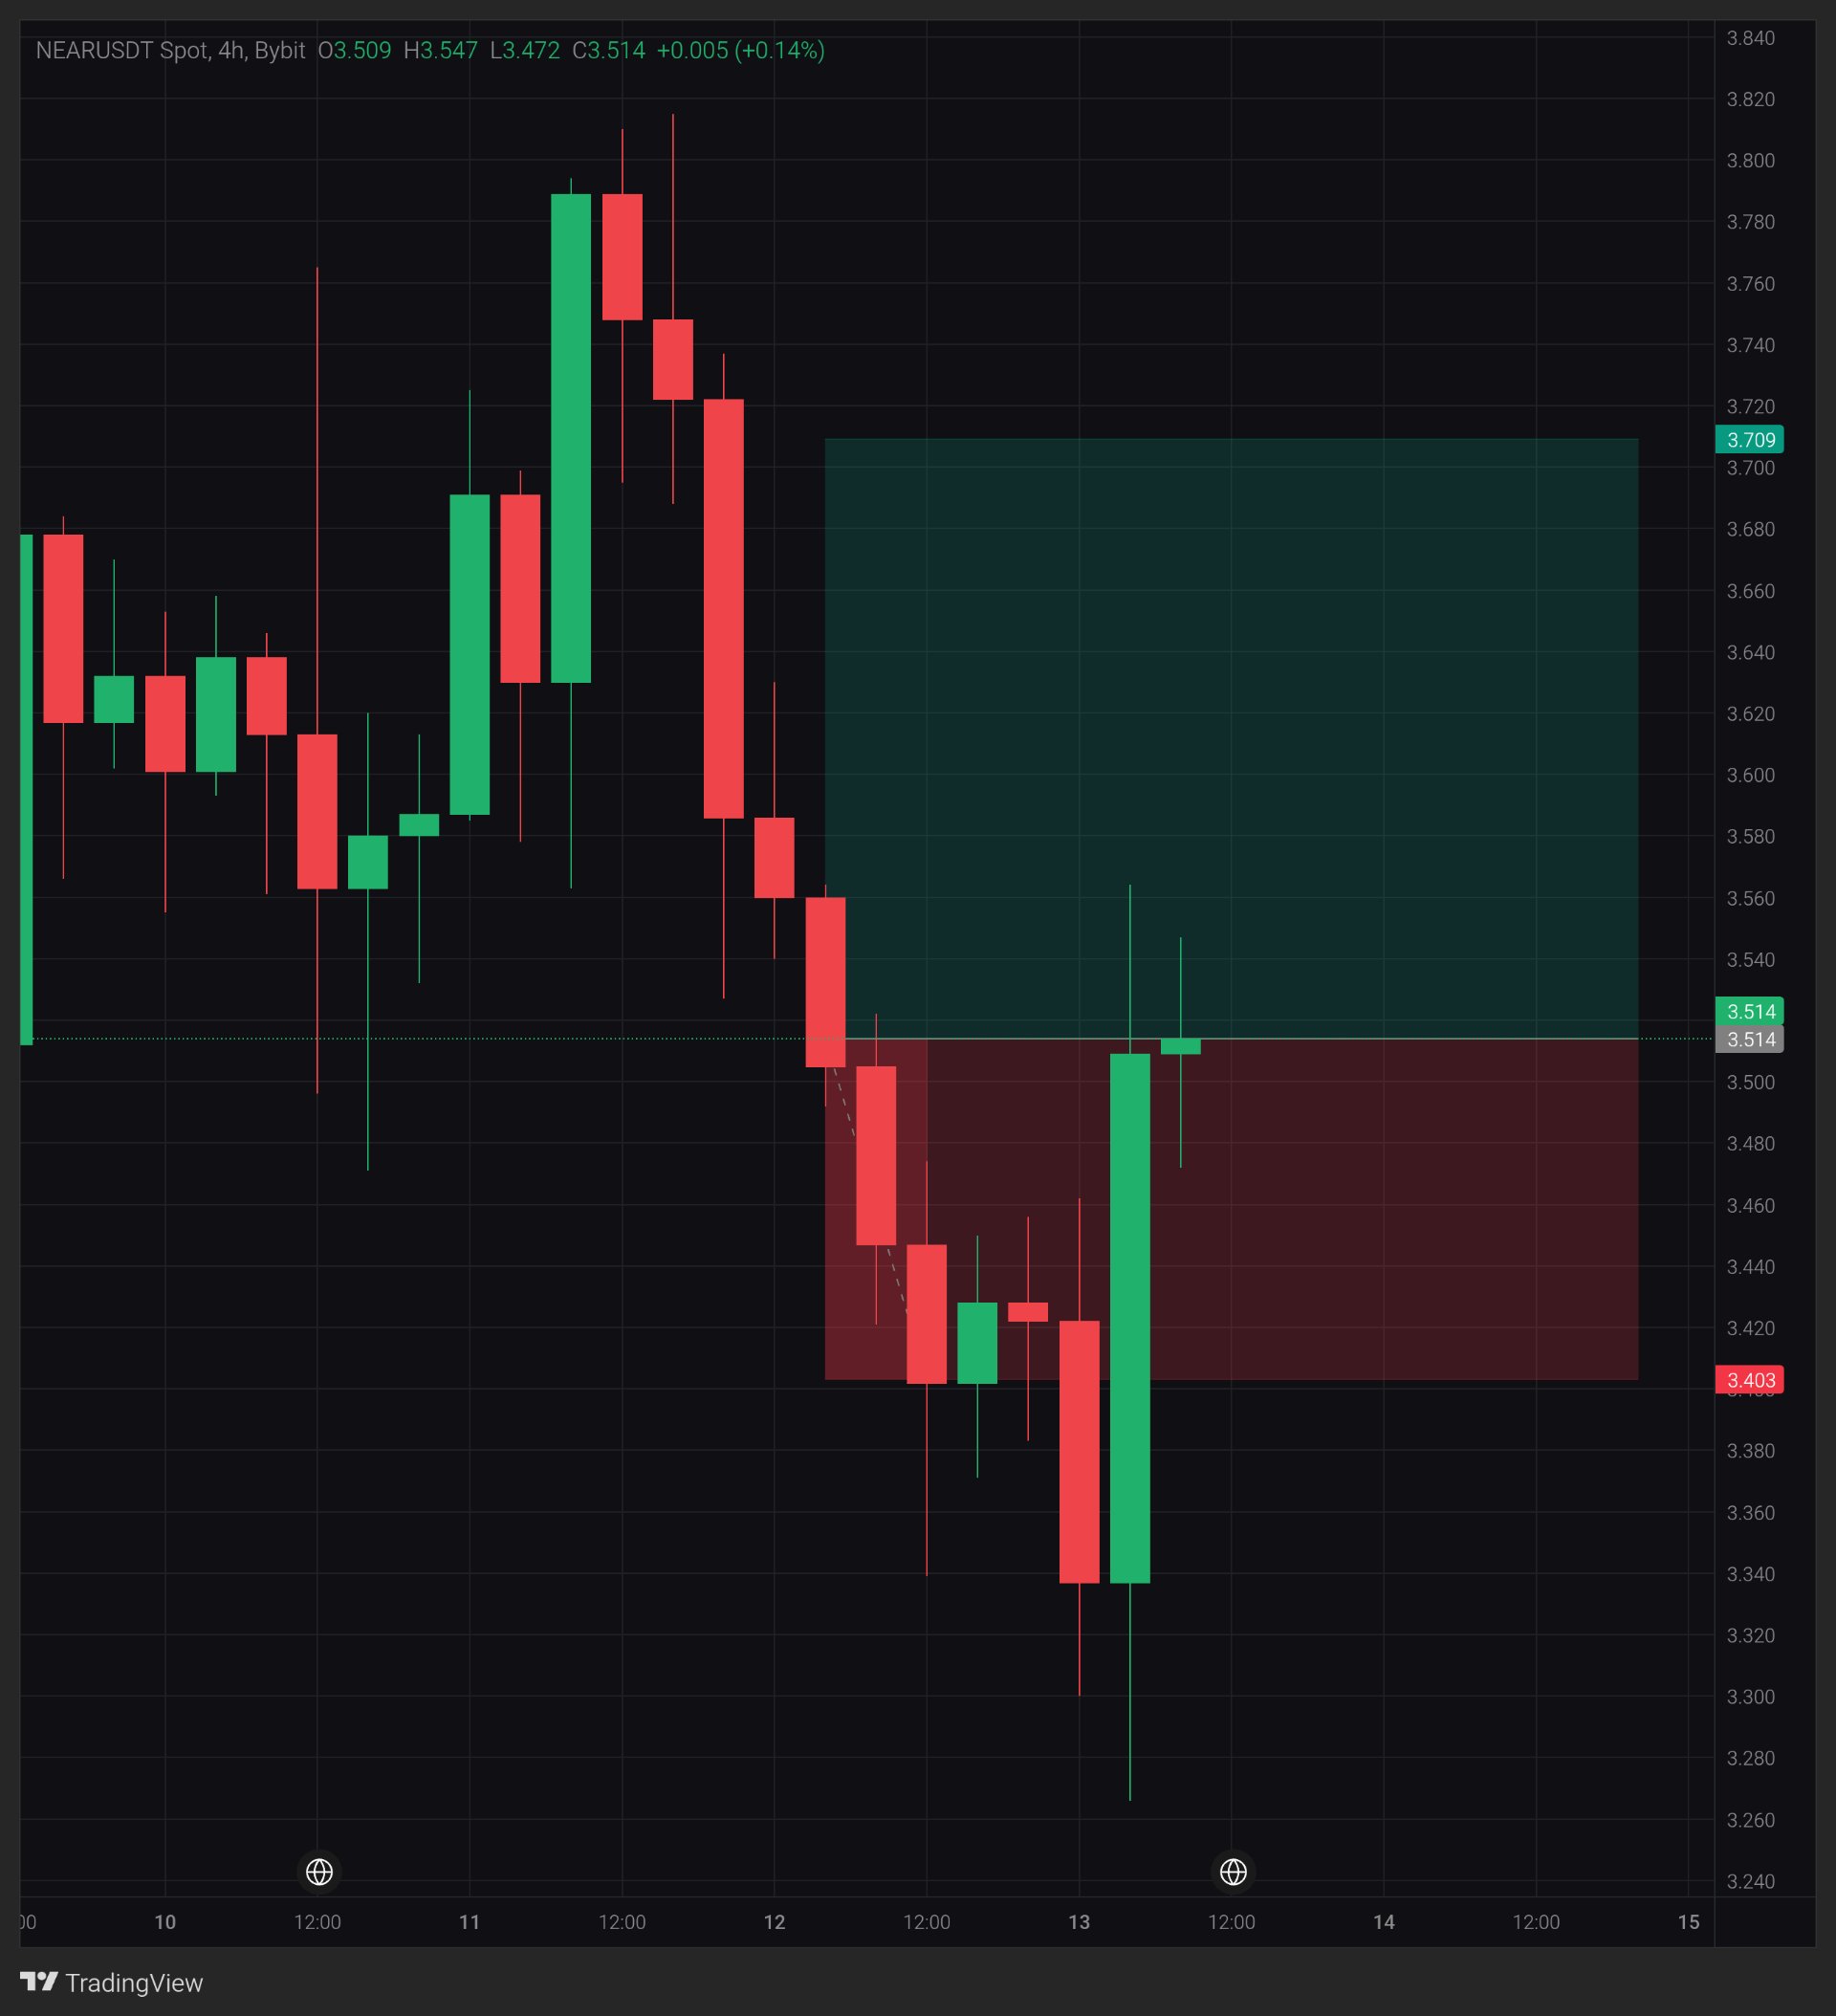
$NEARUSDT — 3.514 is the level price fell through on the way down. One green 4H candle just engulfed the last red one, at about twice its size. Price is back at that line, with a wick down to 3.265 behind it. Is this a real recovery, or just a visit to resistance? 4H chart, $NEARUSDT Spot on Bybit, price 3.514 (+0.14% on the current candle). Macro note Nov 11: after a hot US CPI print, markets leaned further toward a December Fed hike, and 2-year Treasury yields had their biggest jump since April 2025 (Bloomberg). Background only, not the reason for this move. What the chart shows NEAR fell from the 3.82 area to the 3.265 wick low, roughly 15%, then bounced about 9% to the 3.547 high. The big green candle left a long lower wick, so buyers reacted hard at the low. But the current candle is small: its body is 0.005 inside a 0.075 range, under 7% of the range, with wicks on both sides. That is indecision right at the old breakdown area. Volume is not shown on this chart, so this is price action only. Key levels Support: 3.472 (low of the current candle), then 3.403 (bottom of my box), then 3.340 and the 3.265 wick low. Resistance: 3.547 to 3.560 (wick highs), then about 3.585, then 3.709 (top of my box) and the 3.82 area. What would strengthen it Touching 3.560 again proves nothing. A 4H close above it would be the first real step. Holding 3.472 on a pullback would also help. Concern A 4H close below 3.472 would say the bounce is stalling at resistance, with 3.403 next. A bounce that only reaches the breakdown area is still a bounce, not a trend change. What changes my mind A 4H close below 3.403. The lesson A long lower wick shows buyers reacted. It does not show they can hold the next test. My view I'm watching how price behaves around 3.56 before treating this as more than a bounce into resistance. Closes matter more than wicks here. This is a scenario, not a prediction. A reading at posting time, not a guarantee. Which matters more to you here, a close above 3.560 or a hold above 3.472? Not financial advice. Always manage your risk. 📊 #ByXIMPACT
NEAR: Price is back at the 3.514 breakdown
$NEARUSDT — 3.514 is the level price fell through on the way down. One green 4H candle just engulfed the last red one, at about twice its size. Price is back at that line, with a wick down to 3.265 behind it. Is this a real recovery, or just a visit to resistance? 4H chart, $NEARUSDT Spot on Bybit, price 3.514 (+0.14% on the current candle). Macro note Nov 11: after a hot US CPI print, markets leaned further toward a December Fed hike, and 2-year Treasury yields had their biggest jump since April 2025 (Bloomberg). Background only, not the reason for this move. What the chart shows NEAR fell from the 3.82 area to the 3.265 wick low, roughly 15%, then bounced about 9% to the 3.547 high. The big green candle left a long lower wick, so buyers reacted hard at the low. But the current candle is small: its body is 0.005 inside a 0.075 range, under 7% of the range, with wicks on both sides. That is indecision right at the old breakdown area. Volume is not shown on this chart, so this is price action only. Key levels Support: 3.472 (low of the current candle), then 3.403 (bottom of my box), then 3.340 and the 3.265 wick low. Resistance: 3.547 to 3.560 (wick highs), then about 3.585, then 3.709 (top of my box) and the 3.82 area. What would strengthen it Touching 3.560 again proves nothing. A 4H close above it would be the first real step. Holding 3.472 on a pullback would also help. Concern A 4H close below 3.472 would say the bounce is stalling at resistance, with 3.403 next. A bounce that only reaches the breakdown area is still a bounce, not a trend change. What changes my mind A 4H close below 3.403. The lesson A long lower wick shows buyers reacted. It does not show they can hold the next test. My view I'm watching how price behaves around 3.56 before treating this as more than a bounce into resistance. Closes matter more than wicks here. This is a scenario, not a prediction. A reading at posting time, not a guarantee. Which matters more to you here, a close above 3.560 or a hold above 3.472? Not financial advice. Always manage your risk. 📊 #ByXIMPACT
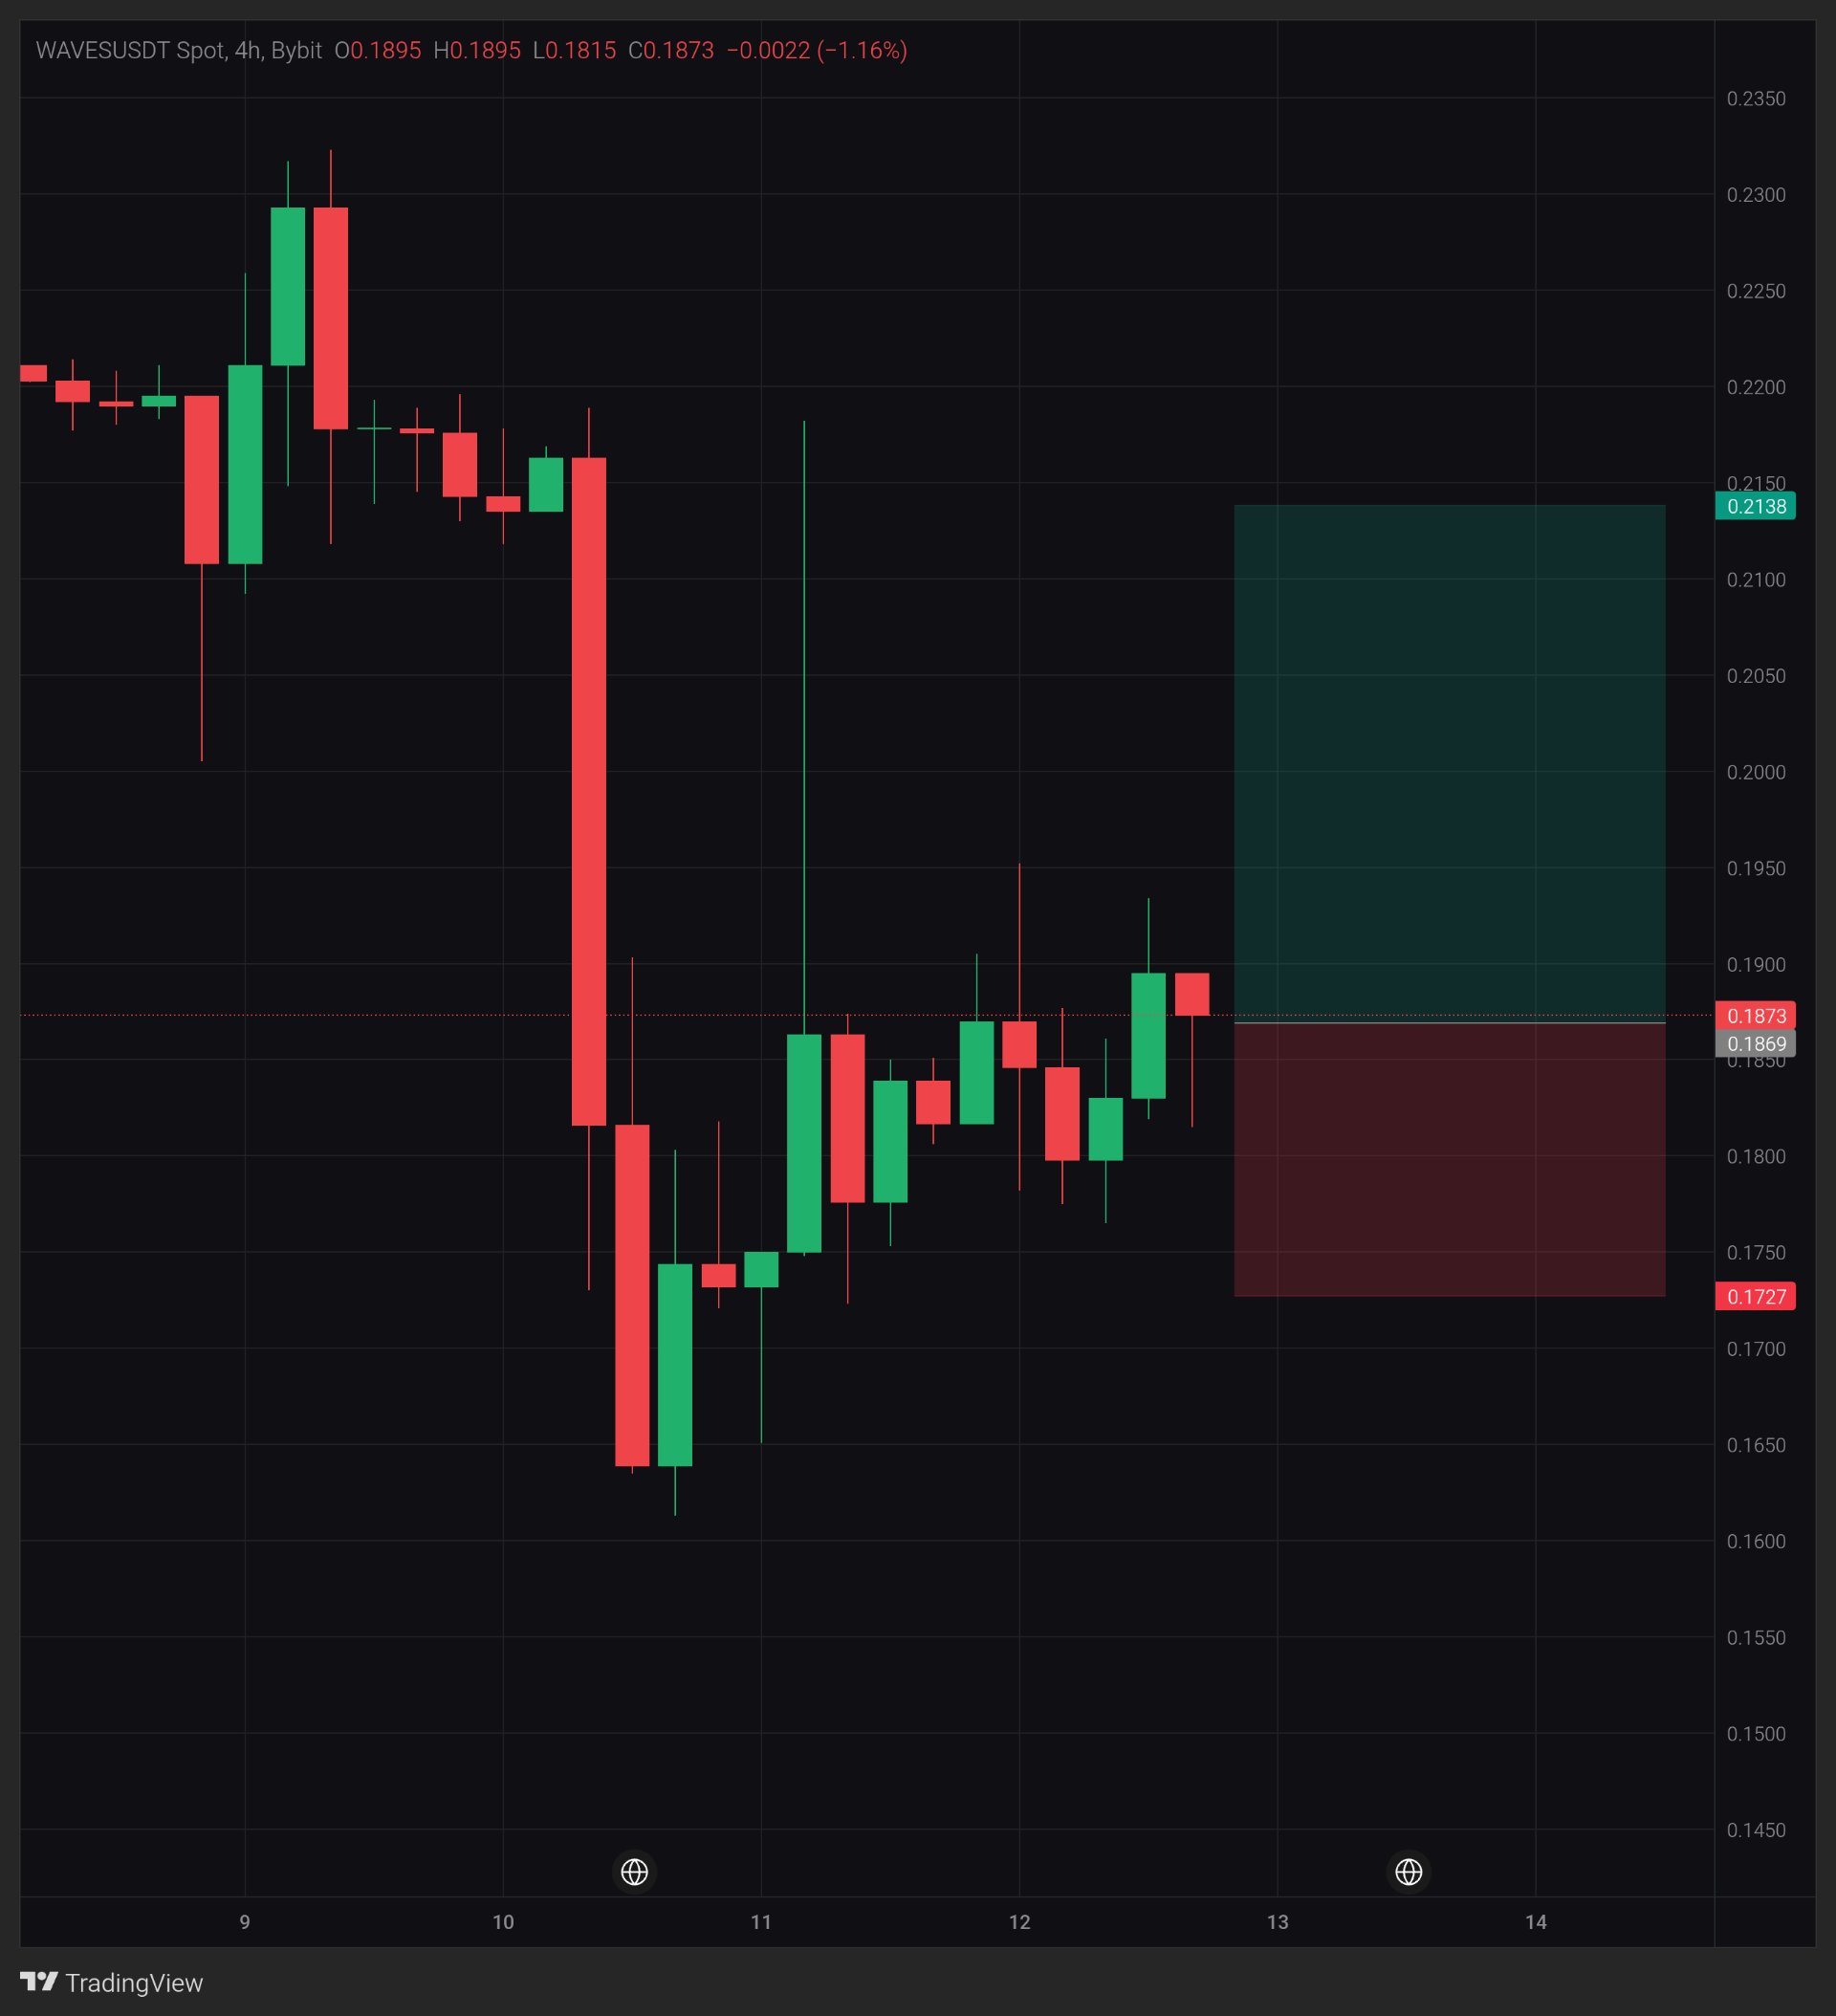
WAVES:4小時線能收在 0.1895 之上嗎?
$WAVESUSDT — 0.1895 擋住了過去兩根K線的實體。影線雖然拉得更高,但收盤價並沒有跟上。這是一次從低點反彈 20% 的走勢,目前卡在這一線下方。這是在築底,還是下跌前的中場休息? 4小時圖,$WAVESUSDT Bybit 現貨,價格 0.1873(當前K線 -1.16%)。 宏觀備註 11月10日:美國10月CPI月增 0.4%,高於預期,CME聯準會觀察工具顯示12月升息25個基點的機率約為89%(美國勞工統計局;透過法新社的 CME 聯準會觀察)。僅供背景參考,並非此次波動的原因。 圖表顯示什麼 一根巨大的 4小時紅色K線跌幅約 16%,下探至 0.1815 區域。自那之後,價格反彈約 20% 至 0.1935 後回落。我在意的一個細節是那根高達 0.2180 的長影線,比該K線收盤價高出約 16%,隨後完全遭到拒絕。這告訴我賣方就在上方等著。此視圖中沒有指標或成交量,所以這純粹是價格行為分析。 關鍵點位 支撐位:0.1815(當前K線低點),其次是 0.1775 左右,再來是 0.1727(我的箱體底部)。 阻力位:0.1895,其次是 0.1935 至 0.1950(影線高點),再來是 0.2138(我的箱體頂部)。 什麼會增強看漲動能 再次觸及 0.1895 證明不了什麼。4小時收盤價站上該點位才是真正的第一步,而若能收在 0.1950 上方,則會清除近期的影線高點。 擔憂 如果 4小時收盤價低於 0.1815,則代表反彈力道正在減弱,接下來將測試 0.1775 和 0.1727。0.2180 的影線已經顯示出價格走高時賣方的反應。 什麼會改變我的看法 4小時收盤價低於 0.1727。 教訓 影線顯示價格曾到過哪裡。收盤價顯示價格在哪裡被接受。那根 0.2180 的影線並未被市場接受。 我的觀點 在看到收盤價站上 0.1895 之前,我不會把它視為僅僅是壓力位下的反彈。這是一個劇本,而非預測。這是發文當下的解讀,絕非保證。 在這裡,你比較相信 0.1935 上方的影線,還是 0.1895 上方的收盤價? 非財務建議。請務必管理好你的風險。📊 #ByXIMPACT #WSOT2026

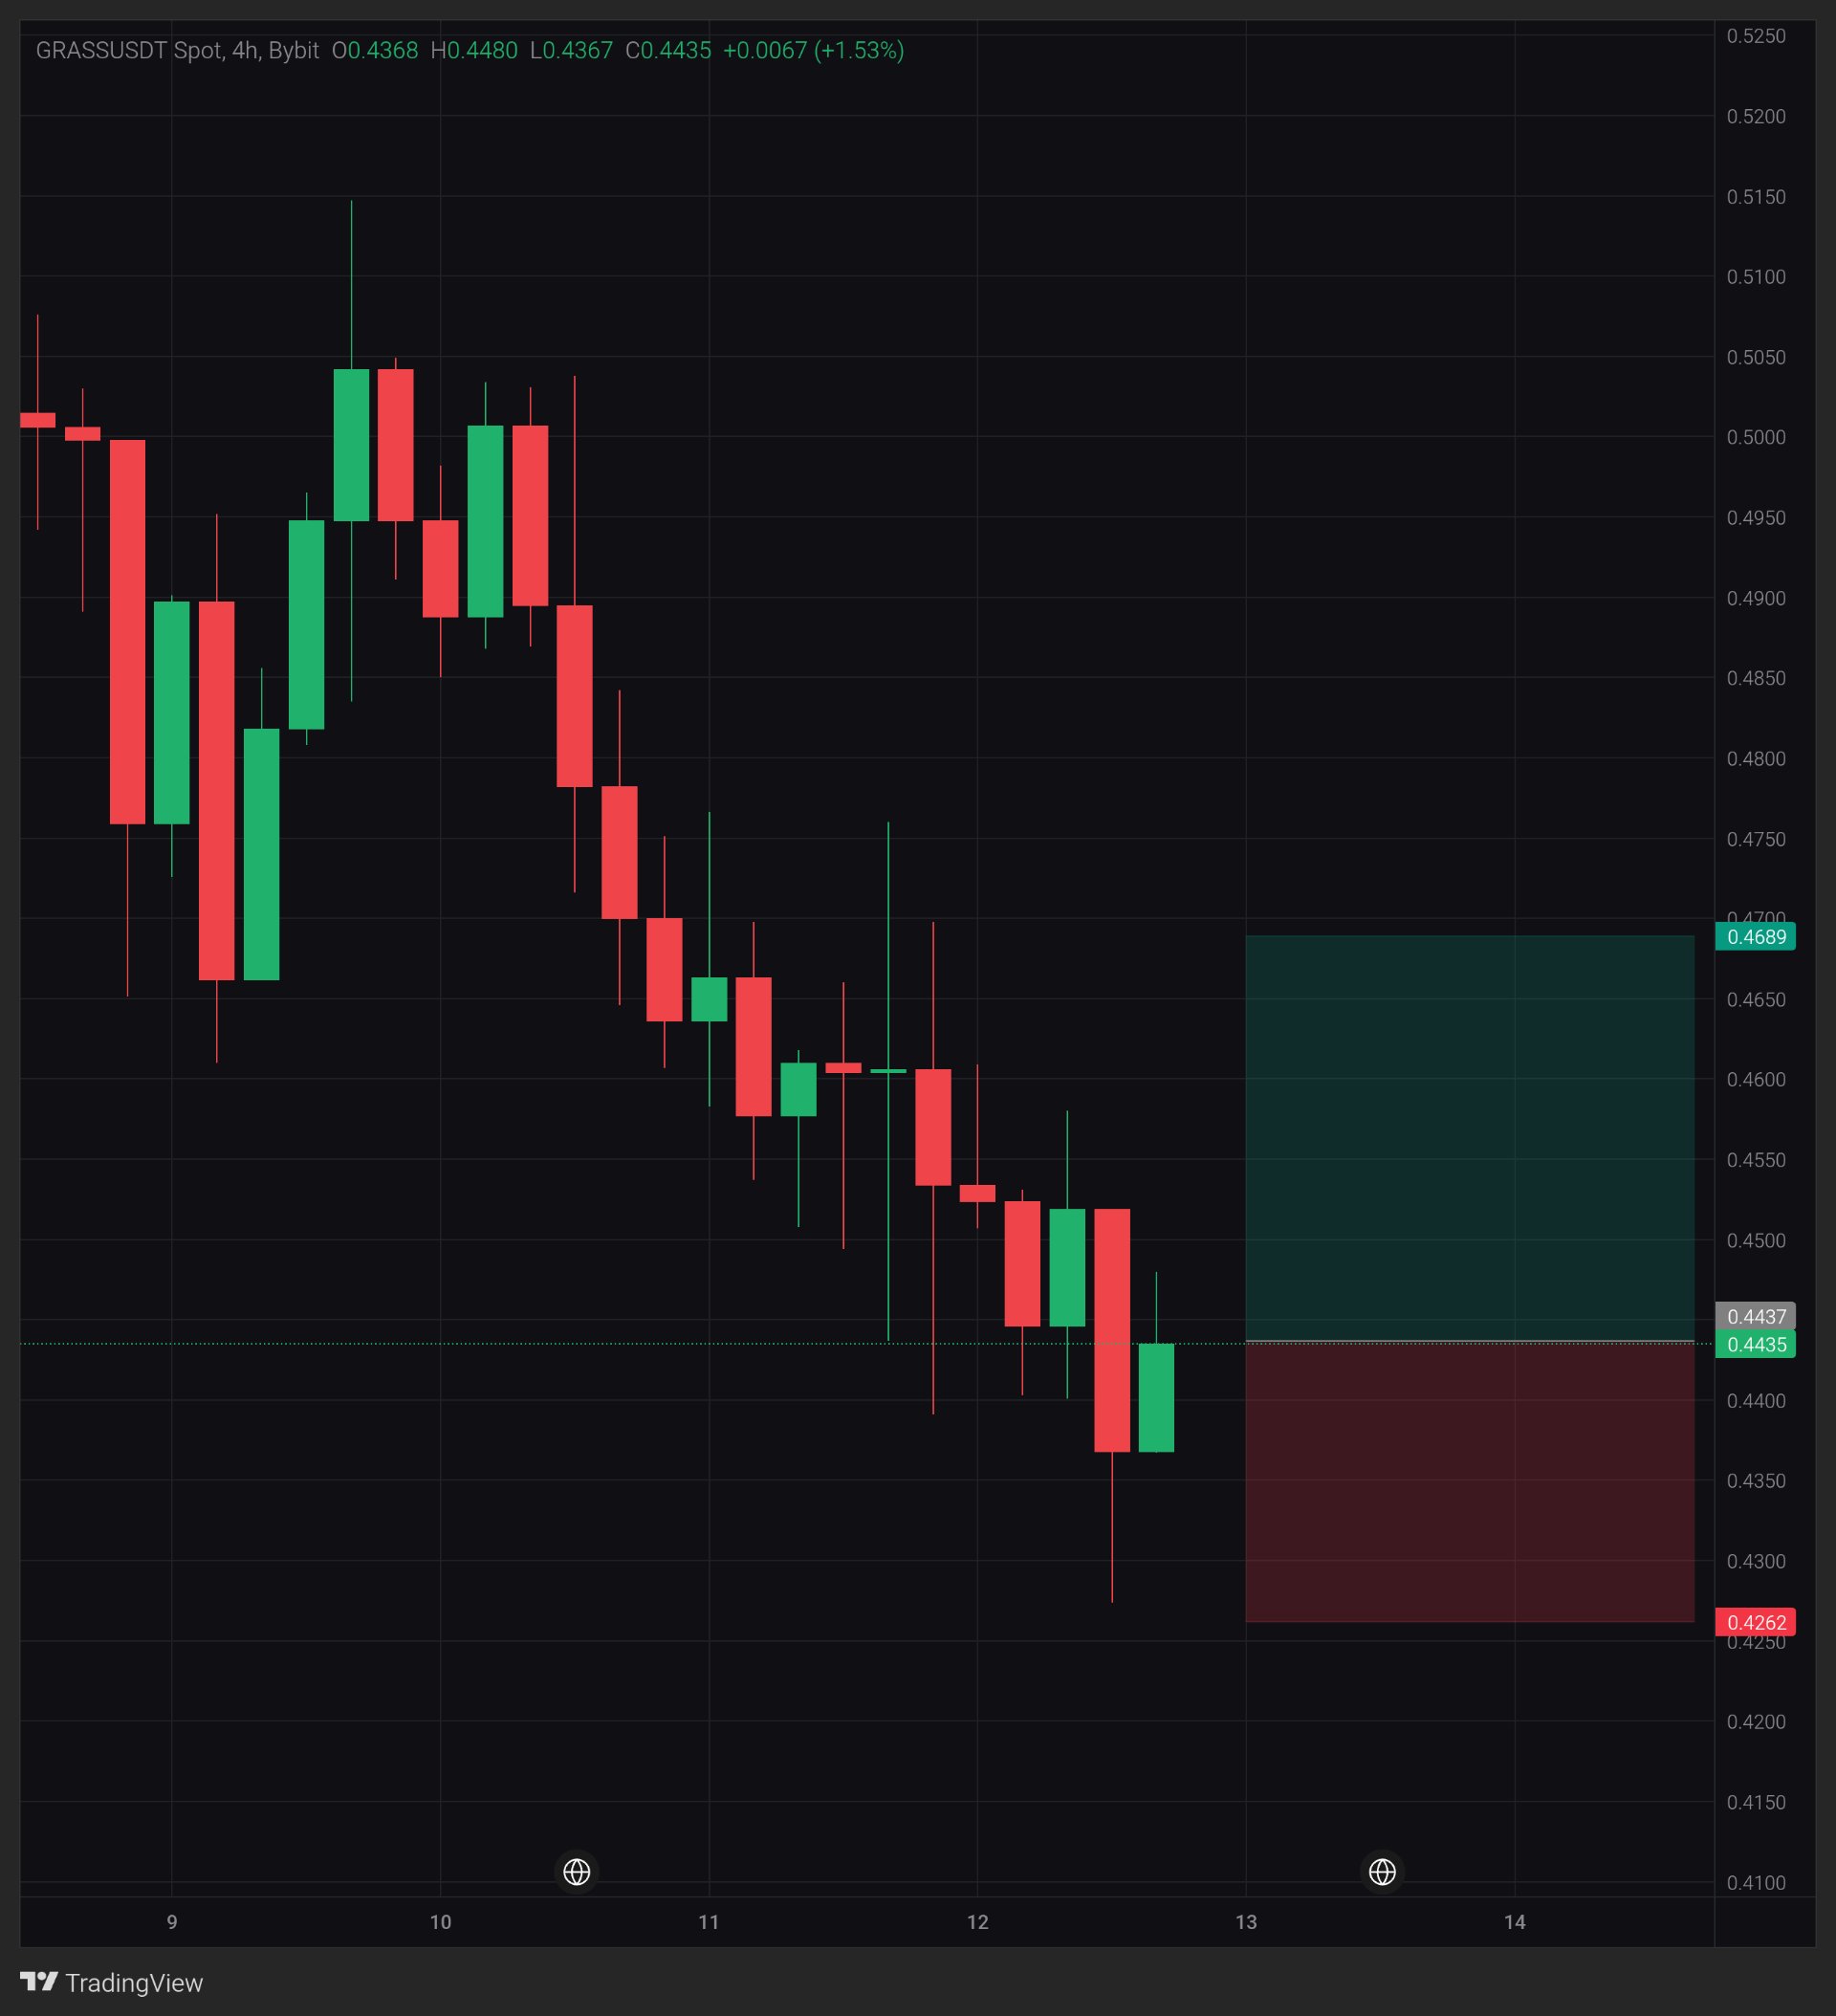
GRASS: Can buyers reverse the 4H downtrend?
$GRASSUSDT — GRASS is showing a small recovery around 0.4435 after another period of selling pressure. What's interesting is that price has fallen from the 0.5000 region, but the latest candle is attempting to recover after testing the 0.4367 area. The short-term structure remains bearish, and one green candle is not enough to confirm a reversal. Is this the first sign of a recovery, or just a temporary bounce? Timeframe: 4H | Pair: $GRASSUSDT Spot, Bybit | Price: 0.4435 | Latest candle: O 0.4368 / H 0.4480 / L 0.4367 / C 0.4435 (+1.53%). Candle close status not confirmed. Macro note November 12, 2026 — Reuters reported that Cleveland Fed President Beth Hammack supports gradual, smaller interest-rate increases to bring inflation back toward the Fed's 2% target. This is broader market background, not the reason for GRASS's price movement. What the chart shows GRASS has been moving through a clear short-term decline, falling from around 0.5050 toward the 0.4300 region. The latest candle has recovered 0.0067 from its open, but its high at 0.4480 shows that price is still facing nearby resistance. The important detail is whether buyers can turn this bounce into a sequence of higher lows. Key levels Support: 0.4367, then approximately 0.4270. Resistance: 0.4480, then 0.4550–0.4600. What would strengthen it A clean break above 0.4480 followed by a confirmed 4H close above that level would be the first positive signal. A successful retest and a higher low would provide additional confirmation. Concern The broader 4H structure still shows lower highs and lower lows. If 0.4367 fails and price closes below it, the current recovery attempt becomes much weaker. What changes my mind A 4H close below 0.4367 would make me more cautious about GRASS's short-term direction. The lesson In a downtrend, a green candle can be only a temporary bounce. A confirmed higher low and a break of the previous lower high provide stronger evidence of a reversal. My view I'm watching the 0.4367–0.4480 range closely. GRASS is showing its first signs of short-term recovery, but the bigger structure still needs confirmation. This is a scenario, not a prediction. A reading at posting time, not a guarantee. Can GRASS reclaim 0.4480 and challenge the current downtrend? Not financial advice. Always manage your risk. 📊 #WSOT2026 #AnthropicIPOTestsTheAIBoom #USInflationRunsHotAndRateHikeBetsRise #BitcoinHitsTwoMonthLowAfterUSMidterms
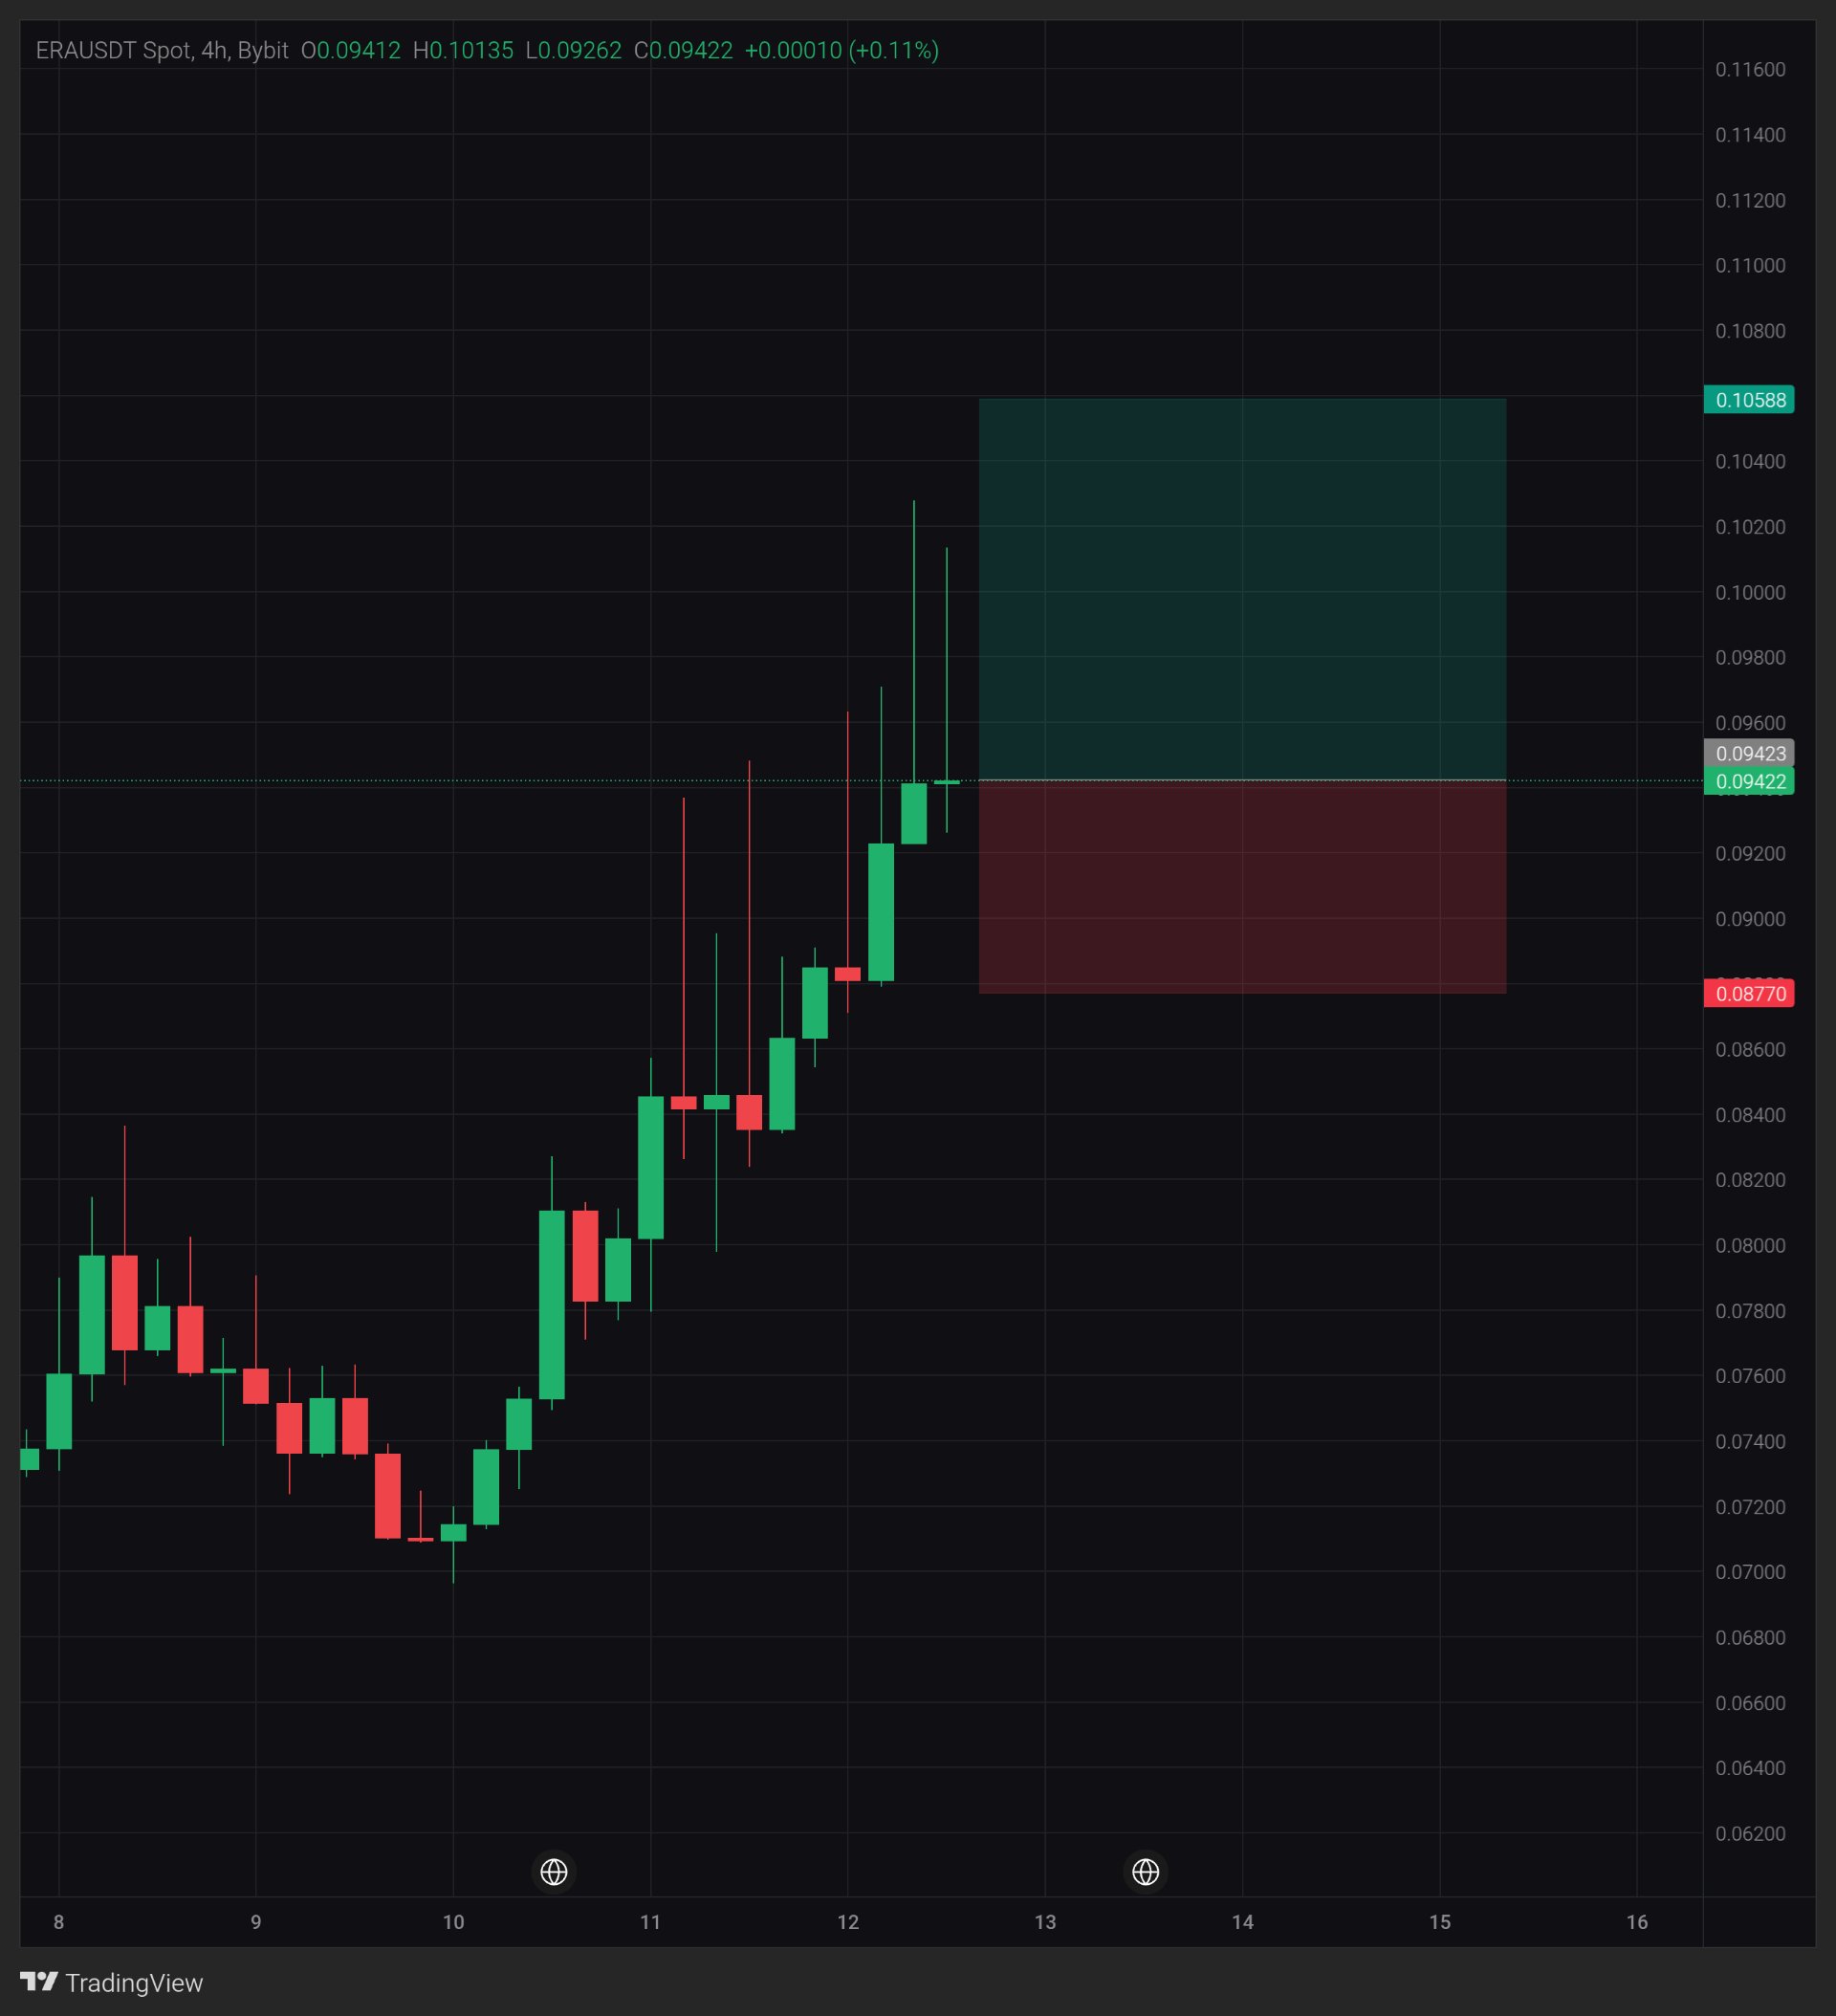
ERA:影線觸及 0.10 附近,4 小時線會收在上面嗎?
$ERAUSDT — 目前價格 0.0942,0.10 處兩次出現長上影線遭到拒絕。 該幣種自 11 月 10 日低點以來已上漲約 35%,但最新一根 K 線的上影線幾乎佔據了其波動範圍的 80%。 目前尚未解決的問題是,買方能否收在該影線區域之上,還是賣方將持續在該區間拋售。 這是在下一波拉升前的停頓,還是買方力竭了? 週期:4H 交易對:$ERAUSDT 現貨,Bybit 價格:0.09422 K 線:開盤 0.09412 / 最高 0.10135 / 最低 0.09262 / 收盤 0.09422 (+0.11%) K 線收盤尚未確認。 宏觀說明 2026 年 11 月 12 日:美國 10 年期國債收益率徘徊在 5% 附近,因為在 10 月份通脹數據火熱後,各大銀行紛紛上調了對美聯儲加息的預期(資料來源:TipRanks)。僅供背景參考,並非波動原因。 圖表顯示 ERA 從 11 月 10 日的約 0.0700 上漲至 0.0942,漲幅約 35%。 我注意到一個細節:自 11 月 11 日以來,幾乎每根 4H K 線都有遠高於其實體的上影線,分別觸及約 0.0948、0.0963、0.0971,隨後是 0.1028 和 0.1014。 實體部分持續走高,但每一次衝高都被賣出。這些影線表明賣方在這些價格點非常活躍。它們並不直接證明頂部已經形成,且在沒有成交量配合的情況下,我也無法判斷其規模。 關鍵點位 支撐位:0.0900,其次是 0.0840。 阻力位:0.0970,其次是 0.1020。 點位為目測結果,僅供參考。 什麼情況會增強走勢 再次觸及 0.10 意義不大,因為影線已經兩次觸及該位置。 4H 收盤價站穩 0.1020 之上,隨後回踩確認為支撐,會是更好的訊號。 下一根 K 線上影線縮短也會有所幫助。 擔憂 在短時間內上漲約 35%,且頂部出現長上影線,行情可能會迅速回調。 若 4H 收盤價跌破 0.0900,將意味著近期拉升的基礎已喪失。 什麼會改變我的觀點 4H 收盤價高於 0.1020。 教訓 影線顯示價格在哪裡被拒絕,而收盤價顯示誰贏得了這根 K 線。 我的看法 我正在密切關注 0.10 區域。在 4H K 線收盤站穩該價位之前,我將影線視為一種警告,而非趨勢反轉。這只是一種情境假設,而非預測。這僅是發文時的解讀,不構成保證。 在這裡,你更看重 K 線實體還是影線? 非財務建議。務必做好風險管理。📊 #比特幣在美國中期選舉後跌至兩個月低點

TRX:0.3155 再次測試,4H 線能守住嗎?
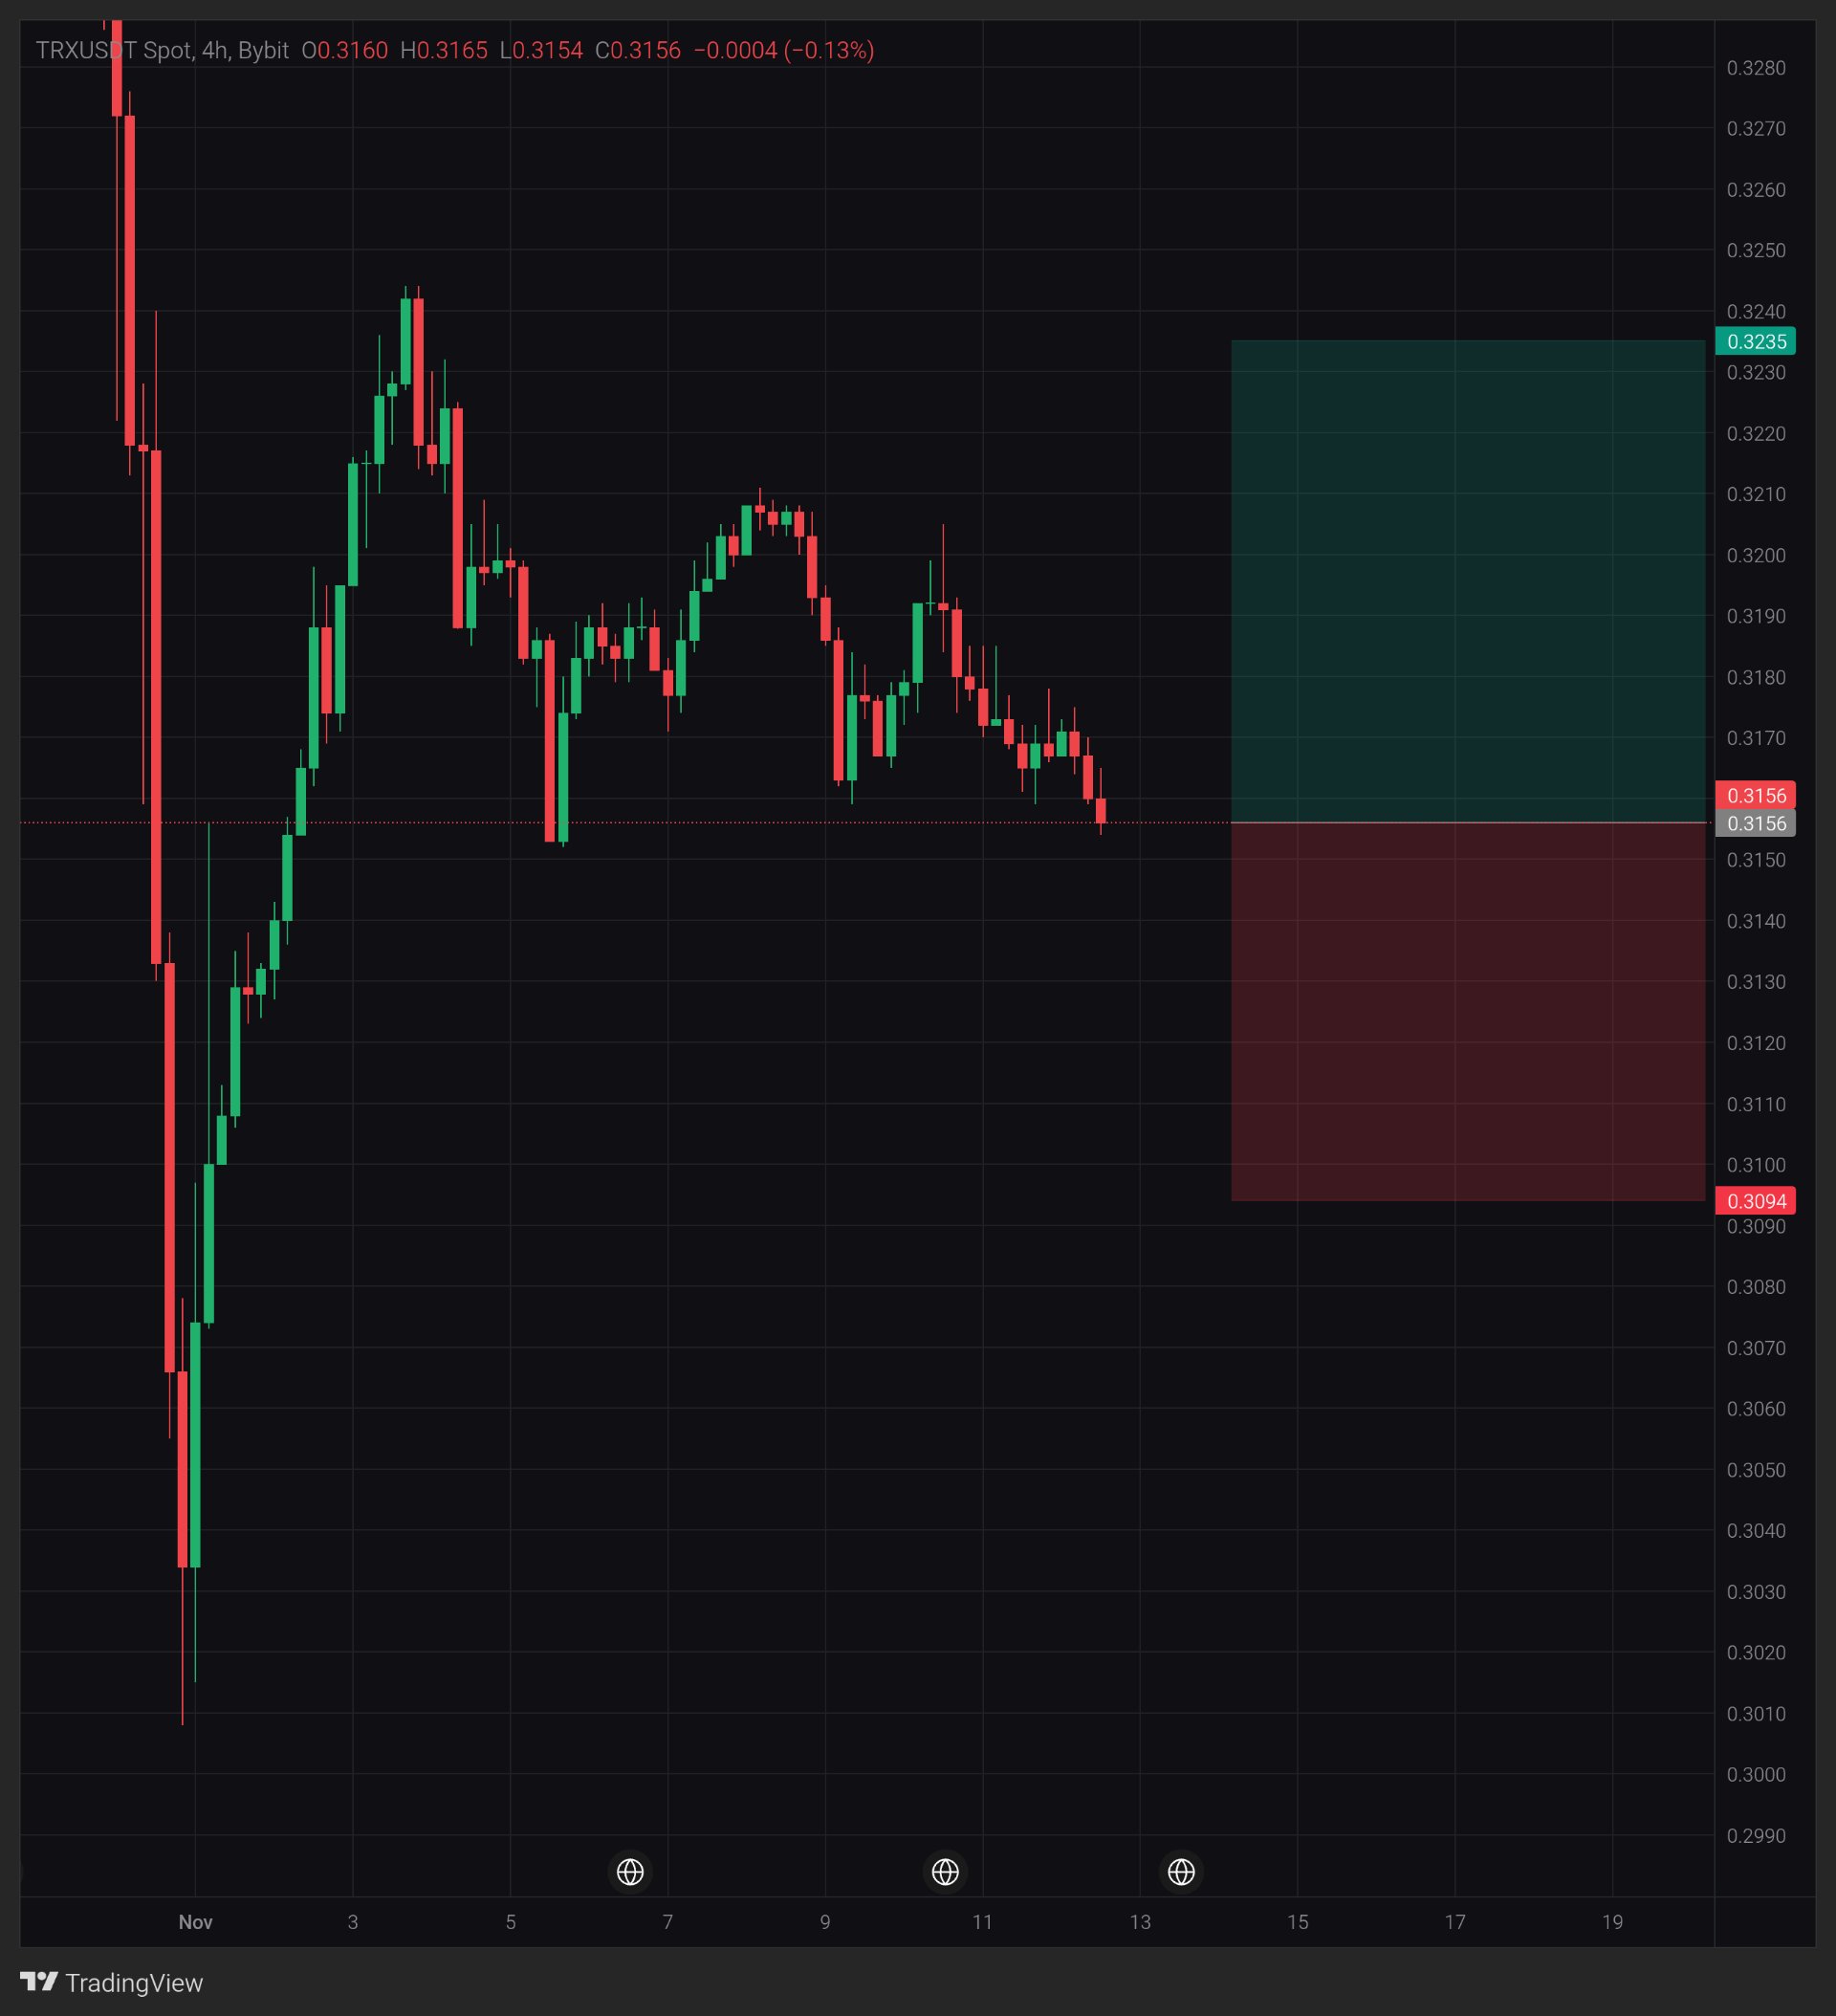
$TRXUSDT — 價格目前位於 0.3156,正好處於 11 月 5 日以來一直守住的底部支撐位。 高點不斷下移(0.3243,接著 0.3210,然後大約 0.3205),但低點幾乎沒有變動。 目前尚未解決的問題是,買家是否會繼續捍衛這個底部,還是會有 4 小時線收盤跌破它。 當區間變得如此狹窄時,哪一邊會先發動呢? 週期:4H 交易對:$TRXUSDT 現貨,Bybit 價格:0.3156 K線:開 0.3160 / 高 0.3165 / 低 0.3154 / 收 0.3156 (-0.13%) K線收盤尚未確認。 宏觀筆記 2026 年 11 月 10 日:美國 10 月 CPI 上漲 0.4%,高於預期,數據發布後國債收益率飆升(CNBC)。僅作為背景參考,並非波動原因。 圖表顯示 TRX 在 11 月初從 0.3010 附近的急跌中反彈,在 0.3243 附近見頂,隨後以小 K 線緩步走低。 我注意到一個細節:大約一週以來,價格一直維持在 0.3155 到 0.3210 大致區間內,波幅僅約 1.7%。 高點下移對上水平底部形成收斂。這顯示區間正在縮小,但並未顯示會往哪個方向突破。 關鍵點位 支撐:0.3150,接著是 0.3100。 阻力:0.3175,接著是 0.3210。 點位為目測,僅供參考。 什麼情況會增強看漲信號 觸及 0.3175 說明不了什麼,突破它僅僅是第一步。 若能收在 0.3175 之上,接著收在 0.3210 之上,會是更好的訊號。 回踩確認支撐有效,或是出現高於 0.3154 的更高低點,會增加走勢的份量。 隱憂 高點不斷下移,且最新一根 K 線正逼近底部。 若 4 小時線收在 0.3150 下方,意味著底部支撐已告破。 什麼會改變我的看法 4 小時線收在 0.3150 下方。 經驗法則 水平底部配上高點下移,說明區間正在收縮,但不代表哪邊會贏。 我的觀點 我將 0.3150 視為分水嶺。只要它守住,我將此視為收斂,而非跌破。這是一個劇本,而非預測。這是發文當下的解讀,不構成保證。 在這裡你比較相信哪一個:水平底部還是持續下移的高點? 非財務建議。務必管理好你的風險。 📊 #IMPACTbyTrade
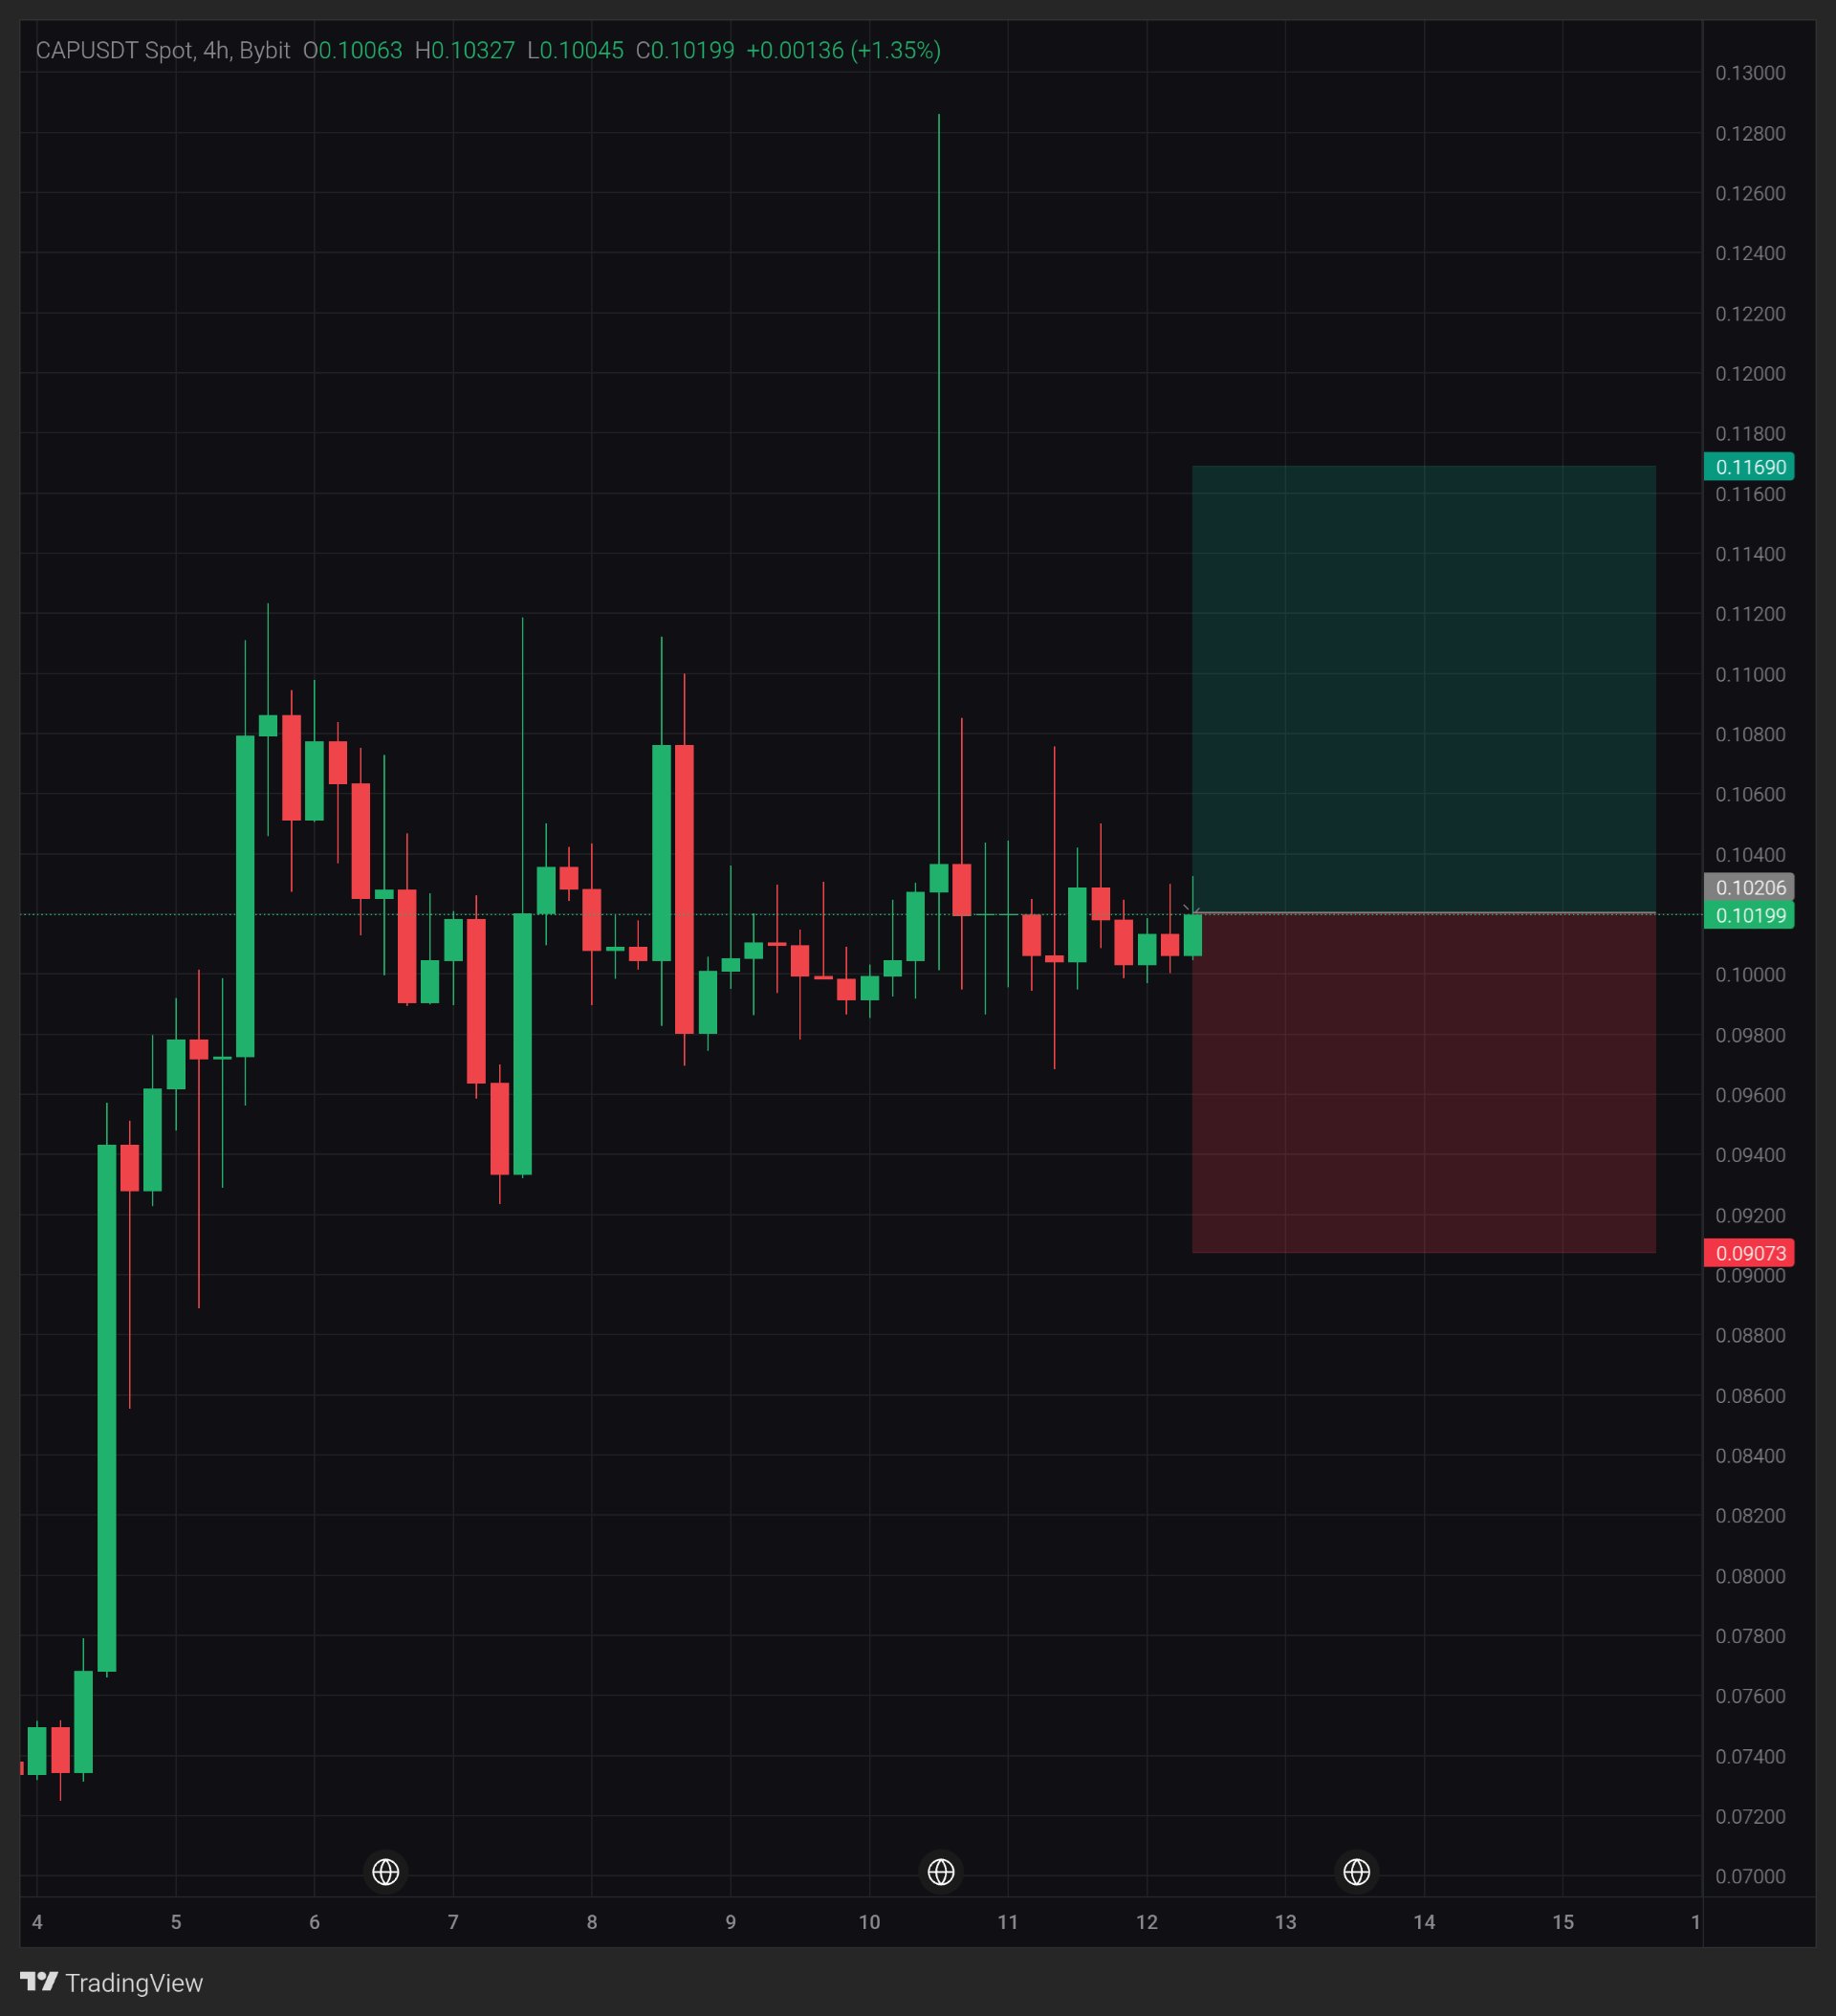
CAP: Can 0.1000 become a solid support?
$CAPUSDT — CAP is holding near 0.1020 after several 4H candles failed to establish a clear direction. What's interesting is the contrast between the earlier explosive rally and the current tight consolidation around 0.1000–0.1040. Buyers have managed to keep price above the recent lower range, but resistance is still limiting the recovery. Is this consolidation building strength for another move, or is momentum starting to fade? Timeframe: 4H | Pair: $CAPUSDT Spot, Bybit | Price: 0.10199 | Latest candle: O 0.10063 / H 0.10327 / L 0.10045 / C 0.10199 (+1.35%). Candle close status not confirmed. Macro note November 11, 2026 — Reuters reported that US October core CPI increased 0.3%, above the 0.2% forecast, while Federal Reserve officials discussed the possibility of larger interest-rate increases. This is broader market background, not the reason for CAP's price movement. What the chart shows CAP previously surged from around 0.0740 toward 0.1080, with an extreme upper wick reaching approximately 0.1285. Since that move, price has settled into a sideways range. The interesting detail is that despite the volatility, recent candles have repeatedly returned to the 0.1000 area rather than establishing a new direction. Key levels Support: 0.1004, then 0.0980–0.0960. Resistance: 0.1033, then 0.1075–0.1085. What would strengthen it Buyers need to push above 0.1033 first. A confirmed 4H close above this level, followed by a successful retest, would strengthen the recovery scenario. A break above 0.1085 would provide further confirmation. Concern The current consolidation has not produced a convincing higher-high structure. Losing 0.1000 and closing below the recent support area would weaken the bullish scenario. What changes my mind A 4H close below 0.0980 would make me more cautious about CAP's short-term direction. The lesson After a sharp rally, consolidation can represent either accumulation or distribution. The eventual breakout and candle close help distinguish between the two. My view I'm watching CAP around 0.1000–0.1033. The price is holding an important area, but I want to see a confirmed breakout before calling this a stronger recovery. This is a scenario, not a prediction. A reading at posting time, not a guarantee. Will CAP break out of this range, or continue moving sideways? Not financial advice. Always manage your risk. 📊 #ByXIMPACT
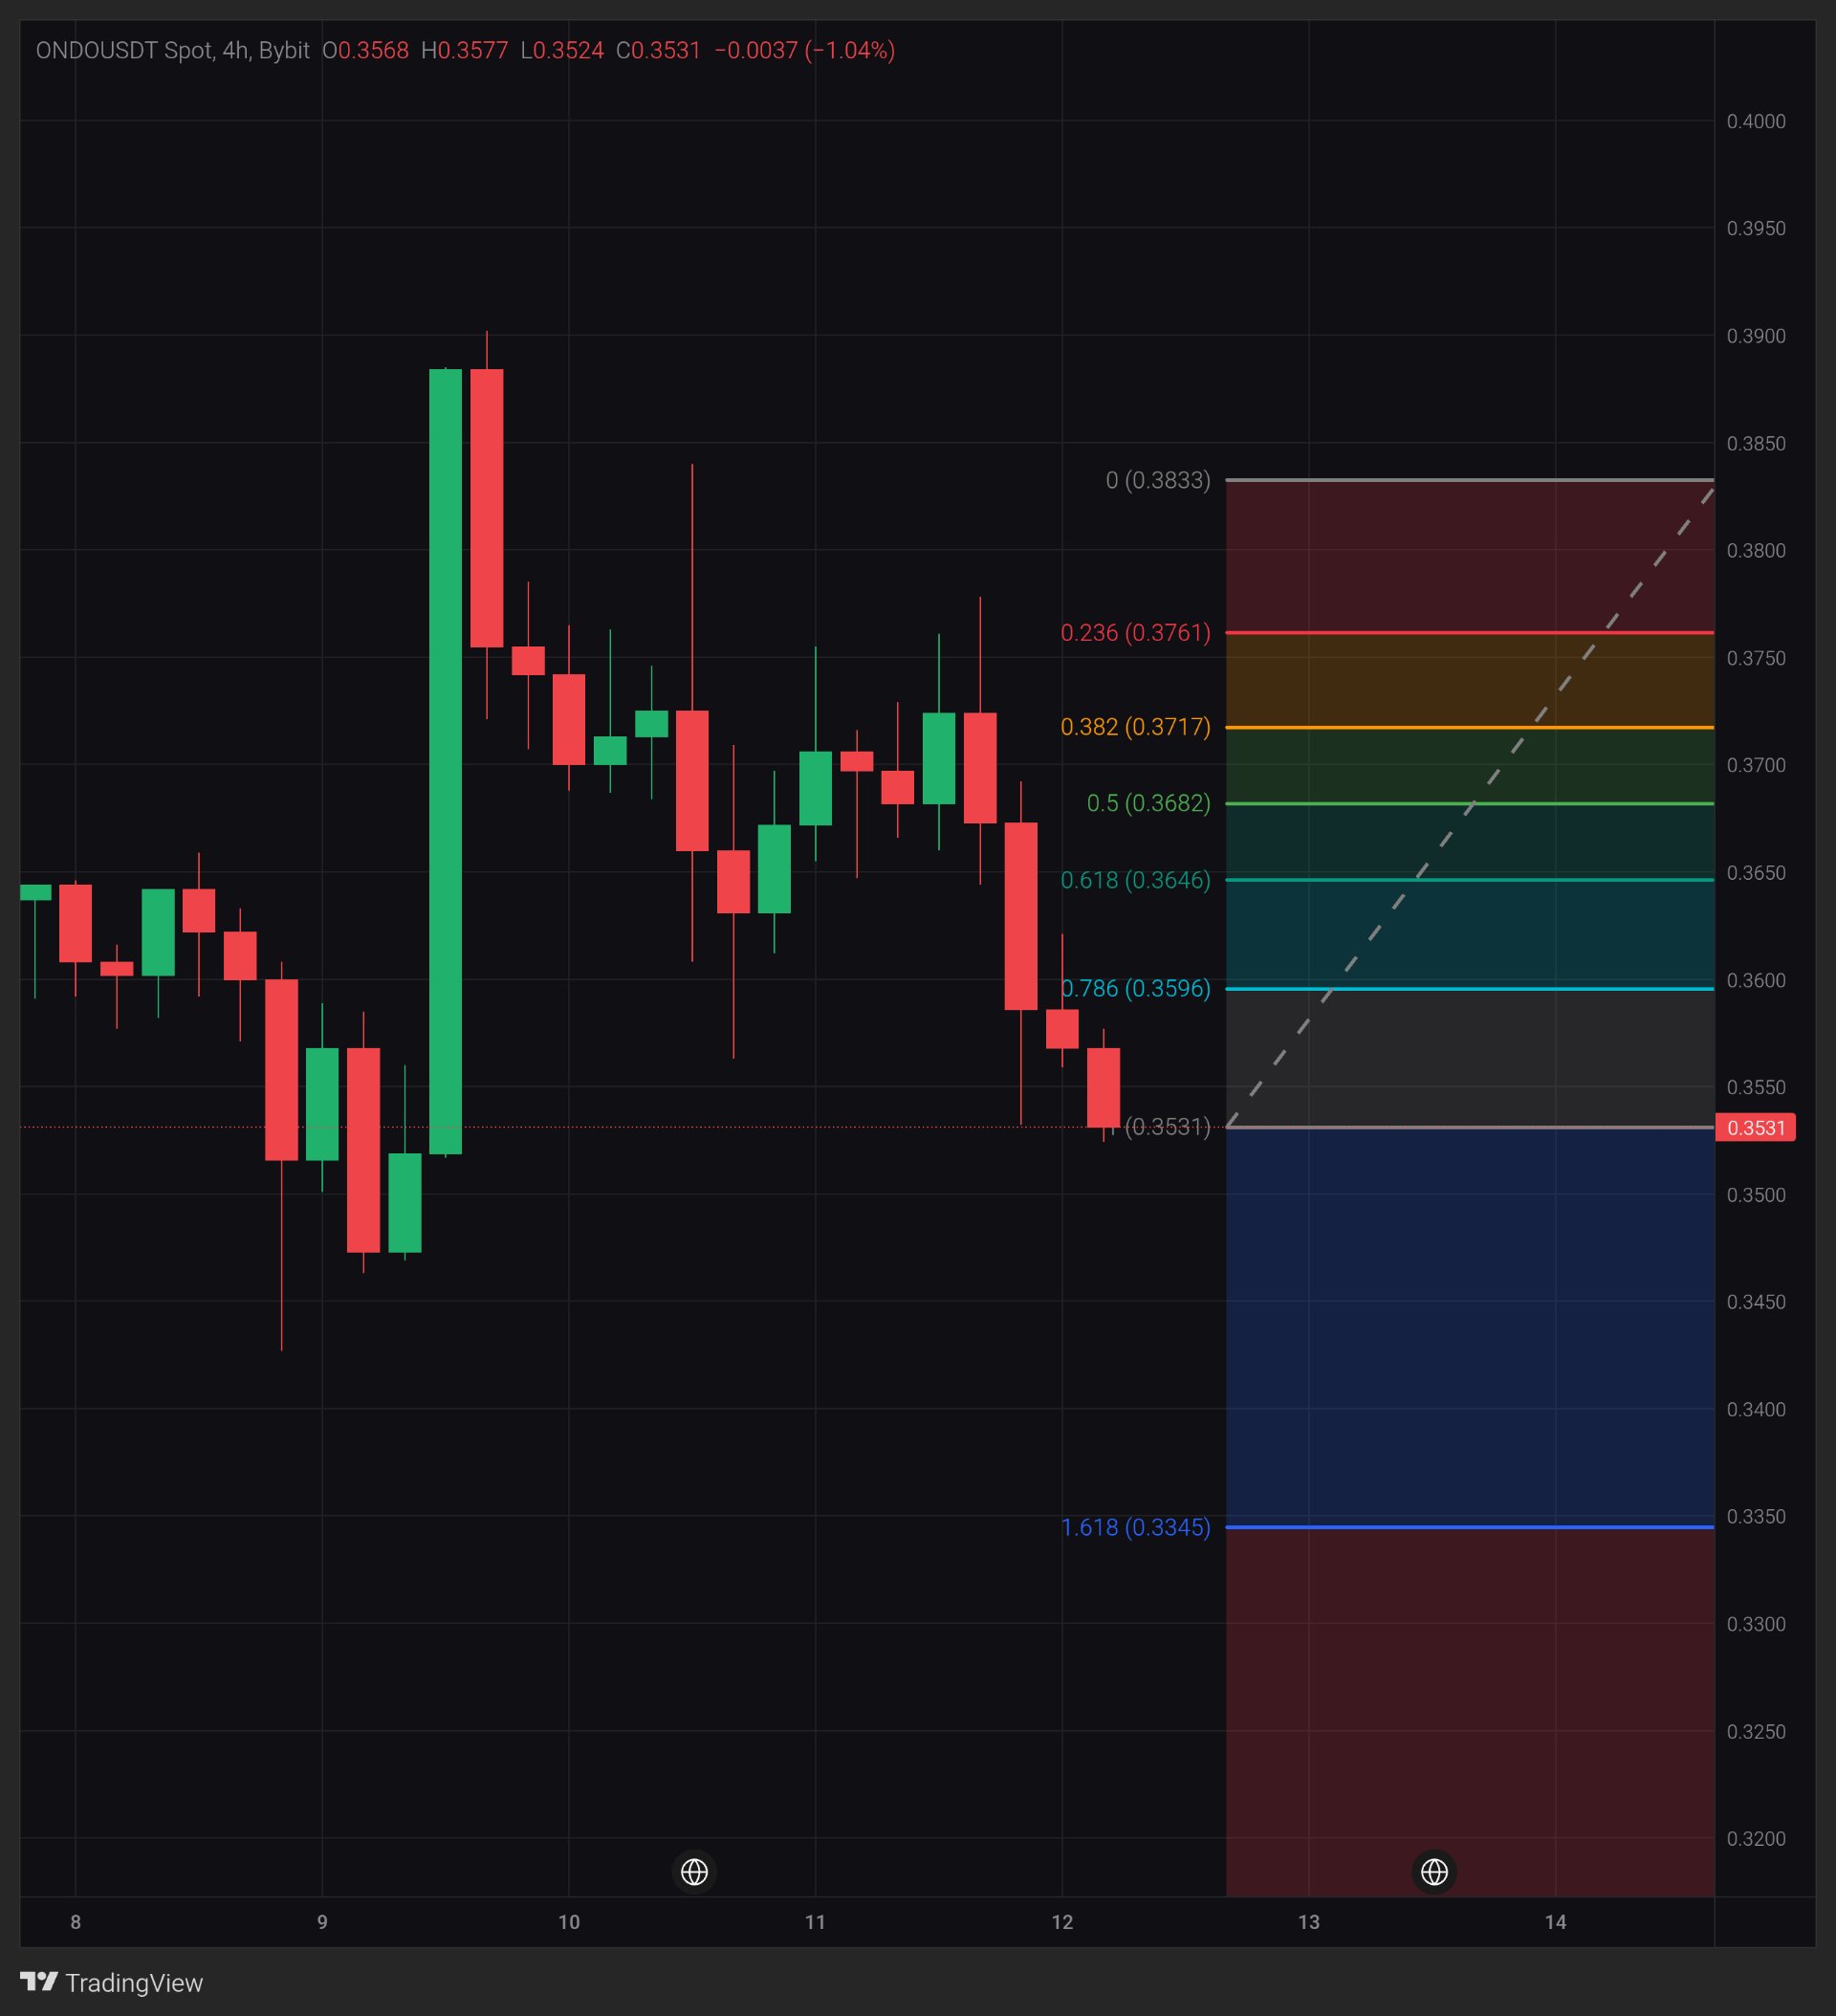
ONDO: Can 0.3530 support stop the decline?
$ONDOUSDT — ONDO is testing the 0.3530 area after several consecutive 4H candles showed increasing selling pressure. What stands out is the failed recovery toward 0.3900, followed by a sequence of lower highs and a gradual loss of momentum. Price is now sitting near an important Fibonacci reference level, while the next support area is becoming increasingly relevant. Will buyers defend this zone, or is ONDO preparing for another leg down? Timeframe: 4H | Pair: ONDOUSDT Spot, Bybit | Price: 0.3531 | Latest candle: O 0.3568 / H 0.3577 / L 0.3524 / C 0.3531 (-1.04%). Candle close status not confirmed. Macro note November 12, 2026 — Reuters reported that the US dollar strengthened to its highest level in months as hotter inflation revived expectations of further Federal Reserve rate increases. This is broader market background, not the reason for ONDO's price movement. What the chart shows ONDO experienced a strong upward move toward 0.3900 before facing a sharp rejection. Since then, the 4H structure has shifted toward lower highs. An important detail is that price has now fallen below the 0.3596 Fibonacci level (0.786), leaving the 0.3531 area as the next important reference. Key levels Support: 0.3524, then 0.3450–0.3425. Resistance: 0.3596, then 0.3646–0.3682. What would strengthen it Buyers need to defend 0.3524 first. A break above 0.3596 followed by a confirmed 4H close above it would be an initial sign of recovery. Holding that level on a retest would strengthen the bullish scenario. Concern The recent sequence of red candles and lower highs suggests that sellers still have control of the short-term structure. A confirmed 4H close below 0.3524 would increase concern about another downward move. What changes my mind A 4H close below 0.3524 would make me more cautious about ONDO's short-term outlook. The lesson Fibonacci levels can help identify important reaction zones, but losing a level on a candle close is different from simply testing it with a wick. My view I'm watching the 0.3524–0.3596 range closely. ONDO needs to show that buyers are willing to defend the current area before a stronger recovery becomes convincing. This is a scenario, not a prediction. A reading at posting time, not a guarantee. Will ONDO reclaim 0.3596, or will sellers push it toward the next support? Not financial advice. Always manage your risk. 📊 #BitcoinHitsTwoMonthLowAfterUSMidterms #USInflationRunsHotAndRateHikeBetsRise
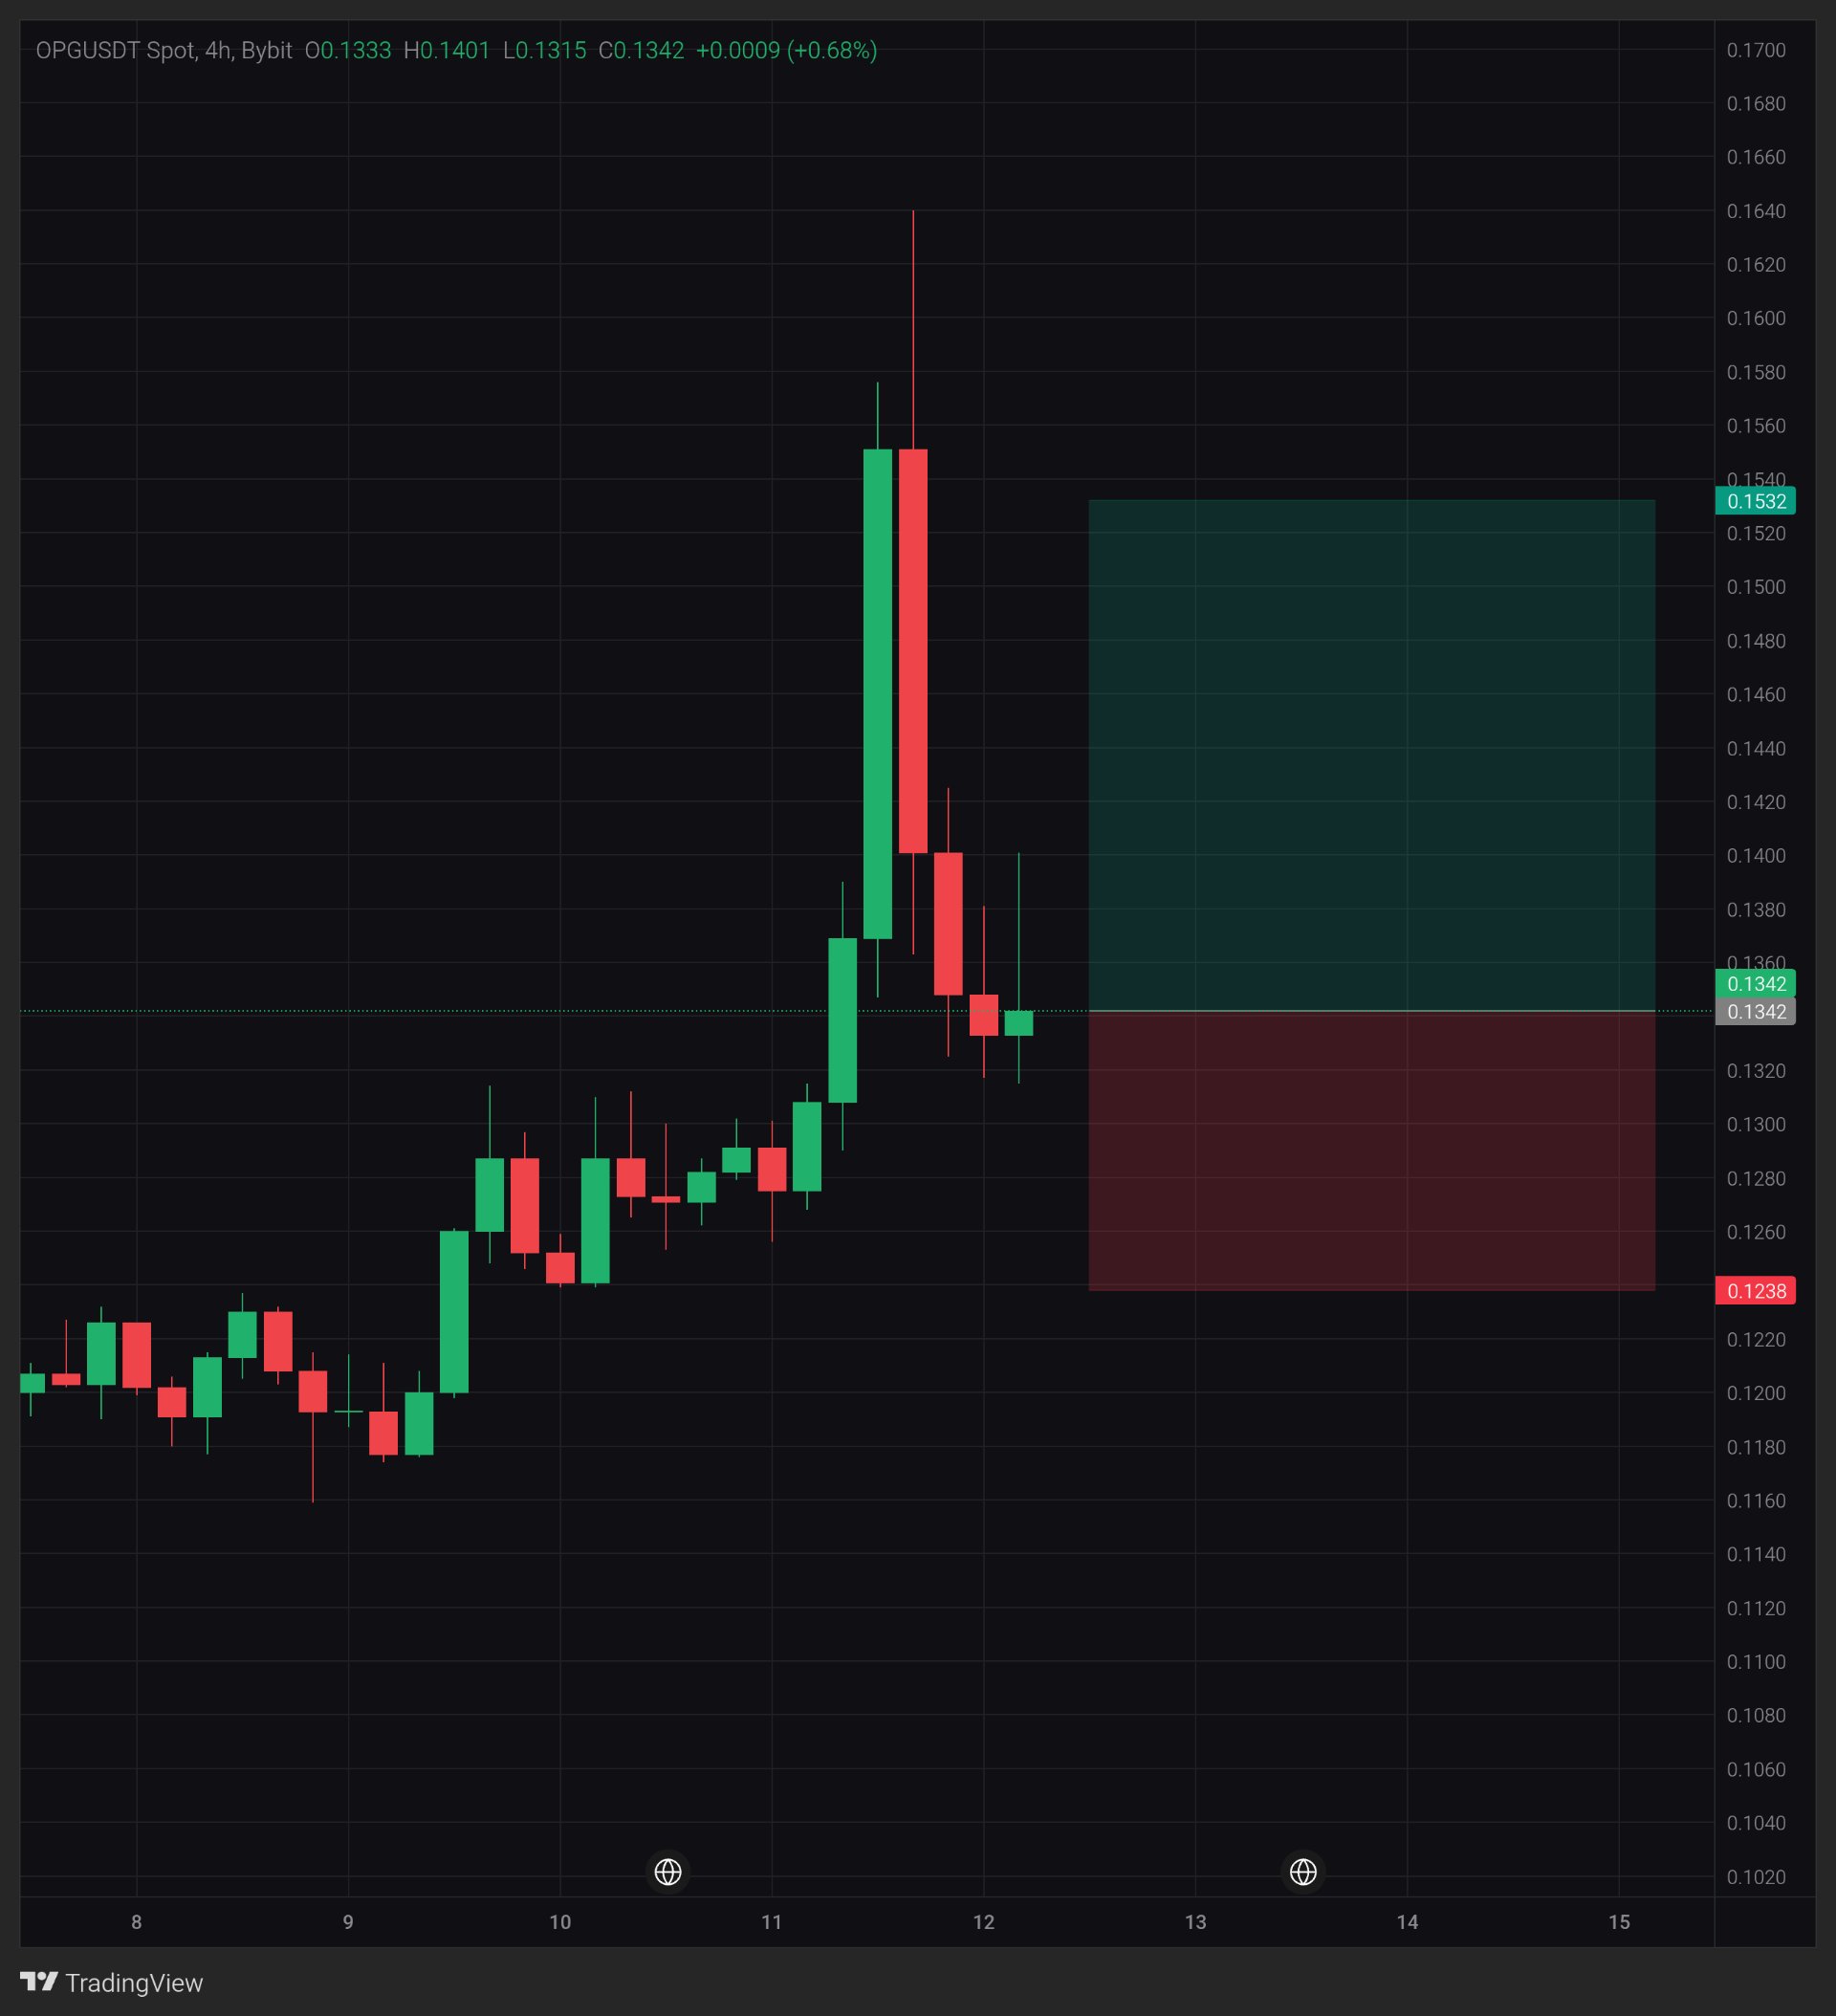
OPG: Can 0.1340 hold after the sharp pullback?
$OPGUSDT — OPG is trying to stabilize around 0.1340 after a powerful rally was followed by an aggressive rejection. What caught my attention is the long upper wick near 0.1640, showing how quickly sellers stepped in after the breakout attempt. Price has now pulled back toward the area where the previous consolidation took place. Is this a healthy correction after the rally, or is the recovery already losing momentum? Timeframe: 4H | Pair: $OPGUSDT Spot, Bybit | Price: 0.1342 | Latest candle: O 0.1333 / H 0.1401 / L 0.1315 / C 0.1342 (+0.68%). Candle close status not confirmed. Macro note November 12, 2026 — Reuters reported that the US dollar reached a 19-month high as stronger-than-expected inflation and hawkish Federal Reserve comments increased expectations of further interest rate hikes. This is broader market background, not the reason for OPG's price movement. What the chart shows OPG climbed from approximately 0.1180 to 0.1550 before a sharp rejection, with an upper wick reaching around 0.1640. The interesting detail is that the pullback has brought price back toward 0.1315–0.1340, an area where buyers may attempt to regain control. Key levels Support: 0.1315, then 0.1280–0.1260. Resistance: 0.1401, then 0.1550–0.1640. What would strengthen it First, buyers need to defend 0.1315. A break above 0.1401 followed by a confirmed 4H close above that level would provide an initial recovery signal. Holding it on a retest would strengthen the case. Concern The rejection from 0.1550 was aggressive, and the long upper wick near 0.1640 highlights significant selling pressure. Losing 0.1315 on a confirmed 4H close would weaken the recovery scenario. What changes my mind A 4H close below 0.1315 would make me more cautious about further downside. The lesson A strong rally does not automatically mean a trend will continue. The reaction after a sharp rejection often tells us more than the rally itself. My view I'm watching the 0.1315–0.1401 range closely. OPG has shown strong upward momentum, but the latest rejection means buyers still need to prove that they can defend the recovery. This is a scenario, not a prediction. A reading at posting time, not a guarantee. Will OPG recover above 0.1401, or will sellers push it lower? Not financial advice. Always manage your risk. 📊 #BitcoinHitsTwoMonthLowAfterUSMidterms