Bao 宝
6406點贊0分享171粉絲253關注
$GRAMUSDT 剛剛出現了一個罕見的情況:所有平均線都對價格達成了一致。 在從 1.113 滑落至 1.016(跌幅約 8.7%)後,GRAM 目前報價 1.049,其 7、14 和 28 週期的移動平均線(MA)重疊在 1.051、1.049 和 1.049。在 1 小時圖上,這顯示市場已經停止了自我分歧。 在這一波走勢的大部分時間裡,28 日均線一直是向下的壓制,每一次反彈都在其下方夭折。現在它已經走平,而價格正處於它之上,而不是下方。這還不是反轉,這是單邊壓力的終結。 讓我困擾的是成交量。最近一根 K 線的成交量為 156K,而 5 根 K 線的平均成交量為 384K。之前的拋售是在巨大的成交量下發生的,而從 1.016 的回升成交量卻較輕且在萎縮。買方確實進場了,但他們還沒有為這波漲勢付出代價。 訂單簿顯示 91% 是買單,但我不會太依賴這個數據。買單可以在幾秒鐘內撤銷,在成交量萎縮的情況下出現一面倒的訂單簿,通常意味著人們只是在掛單,而不是在主動吃單。 我正在關注的點位: - 高於 1.073:24 小時高點,也是下跌以來的第一個更高的高點。這才是真正的信號。 - 低於 1.016:低點被跌破,之前的回升僅僅是暫停。 - 1.016–1.073:一個約 5.6% 寬度的區間,目前價格正處於中間位置。 大多數人會跳過的部分: 假設 GRAM 突破 1.073 而你追漲,將止損設在 1.016 下方,風險約為 5.3%。第一個合理的目標價 1.113 距離僅約 3.7%。這大約是 0.7R(風險回報比),即使你判斷對了方向,這也是一筆糟糕的交易。 更好的做法是等待價格重新站穩 1.073,經過測試確認支撐有效,並使用更緊湊的止損。在此之前,這還稱不上是一個交易設置。這是一個壓縮盤整,而這種成交量萎縮的盤整最終會透過一根大 K 線來決定方向,而不是靠猜測。 我不做多空預測。我需要看到收盤價高於 1.073 且成交量遠高於 384K 的平均水平,或者價格跌破 1.016 且無法反彈。 #IMPACTbyTrade
$MNT 從低點反彈了 4%,隨即直接撞上阻力位。 Mantle 已從 0.3631 回升至 0.3773,1 小時線圖剛好觸及 0.3786 附近的 28 期移動平均線 (MA)。最新的 K 線收紅並帶有上影線,代表買方雖然嘗試進攻但未能守住陣地。 這一點比反彈本身更重要。價格是在跌幅已經擴大後,才攀升回 7 期和 14 期 MA(分別為 0.3750 和 0.3731)之上。28 期 MA 仍是這三條均線中最高的一條,且依然向下傾斜,所以整體結構尚未扭轉。在證明反轉前,這僅是下跌趨勢中的回調。 成交量也說明了同樣的情況。之前的賣壓留下了巨大的成交量柱,其中幾根遠高於 974K 的 10 期平均成交量。反彈顯得較為冷清,最新的成交量柱約為 795K,低於這兩個平均值。真正的反轉通常伴隨著市場參與度。這看起來更像是市場在喘口氣。 別對訂單簿上 98% 的買單抱有太多期待。掛單很容易,撤單也很容易。重要的是價格能否收在阻力位之上。 反彈現況: - 這波回升涵蓋了從 0.4036 到 0.3631 跌幅的約 35%。 - 50% 回撤位在 0.3834 附近,24 小時高點在 0.3940。兩者目前都未被觸及。 - 若能守穩 0.3786 之上,才會是真正的態勢轉變。 我需要觀察的信號: - 1 小時線收盤站上 28 期 MA,隨後進行回測並將其轉為支撐。 - 價格推升時成交量必須放大,而不是逐漸萎縮。 假想設定(非即時信號):在確認守穩後於 0.379 附近進場,止損設在 0.3725 下方,首要目標價位在 0.3940,盈虧比約為 2.3:1。如果價格先跌破 0.3731,則此設定作廢,並重新考驗 0.3631。若跌破該低點,則代表這次反彈僅是中繼整理。 我不會在阻力位追價。目前市場顯示的僅是反彈,而非反轉。0.3786 的收盤價是兩者分界。 非投資建議。 $MNTUSDT #IMPACTbyTrade

$HYPEUSDT HYPE 跌至 60 美元後迅速反彈,漲幅達 13.7%。從成交量來看,最容易的部分已經結束了。 HYPE 的下影線觸及 60.063 美元,伴隨著整波行情中最大的成交量。買方在幾小時內就做出了回應,目前價格回到 68.27 美元,位於 7、14 和 28 小時移動平均線之上。 這是一個實質性的收復。這也改變了問題的核心。 恐慌拋售的蠟燭圖在圖表上留下了最大的成交量柱。最新的一根成交量柱約為 9K,而 5 期平均成交量在 31K 以上。拋售過程展現了決心,而反彈則顯得平靜。買方並沒有離場,但也沒有急於推高價格。 69 美元是上方壓力位。24 小時高點為 69.008 美元,最後幾次上攻都因上方賣壓而回落。價格目前距離該點位約 1.1%,尚未突破。 移動平均線也尚未轉為看漲。MA7 位於 66.90 美元,但 MA14 (65.92 美元) 仍低於 MA28 (66.14 美元),且整波跌勢的斜率才剛開始平緩。此外,價格仍比啟動這波跌勢的高點 72.86 美元低 6.7%。在收復該水平之前,我不會稱之為趨勢反轉。 盈虧比 (R:R) 發生變化的關鍵點 這些是假設性的設置,而非交易信號。 追漲突破 69 美元:若止損設在 66.90 美元附近,風險約為 2.10 美元,而上漲至 72.86 美元的目標利潤約為 3.86 美元,盈虧比大約為 1.8:1。 等待回測 66.1–66.9 美元區間:盈虧比會更好,但若將止損設在 65.9 美元下方,則會陷入正常的每小時波動雜訊中。若放寬止損範圍,優勢將大打折扣。 比起追突破,我寧願看到回測在賣壓較輕的情況下站穩。如果 66 美元失守,那麼之前的低點掃貨只是這波行情的前半部分而已。 買方的反應很快。但他們是否還願意追高,這一點目前還沒有得到驗證。 #IMPACTbyTrade
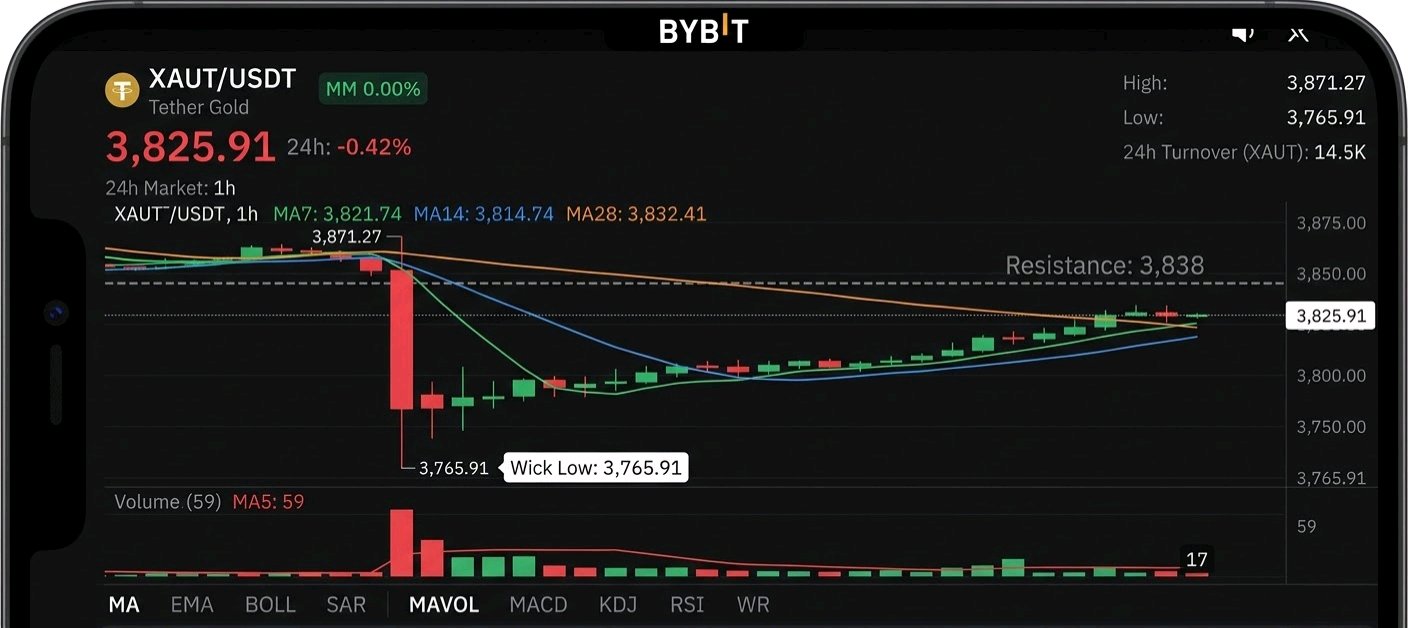
$XAUTUSDT XAUT swept the lows at 3,765.91, but the recovery is running on fading volume The drop was violent. XAUT fell through the 1h moving averages in one heavy-volume leg and wicked down to 3,765.91. The buyers who stepped in there did real work, and price is back at 3,825.91, about 57% of the 24h range. But the volume has gone quiet. The flush came on the biggest bars of the session. The bounce has been built on shrinking participation, and the latest bar shows about 17 against a 5-bar average near 59. A reversal needs buyers to show up with conviction, and so far they haven't. The moving averages show the same split: - MA7 (3,821.74) and MA14 (3,814.74) have been reclaimed. That's the good news. - MA28 (3,832.41) is still above price, sloping down, and only about 6.5 points away. It's the line that separates "bounce" from "trend repair." - The recovery's first rejection came around 3,838, so that's the nearby ceiling to clear. The order book also leans sell at 79%. That's a snapshot and can flip quickly, so I wouldn't build a thesis on it. But the pressure above price matches what the volume is saying. What I need to see A 1h close above MA28 and the ~3,838 rejection high, ideally with volume expanding rather than shrinking. That would turn the sweep into a real higher-low structure and put the 24h high (3,871.27) back in play. What weakens it Losing the MA7/MA14 cluster (3,815–3,822) would turn this into a lower-high retest of the lows. Gold-backed tokens can also whip hard around the sweep zone, so I'm not interested in chasing the bounce under the MA28. I'm not offering an entry or stop here. The chart doesn't confirm one, and I'd rather wait for the reclaim. The sweep is done. What's still unproven is whether anyone wants to buy the recovery. #IMPACTbyTrade
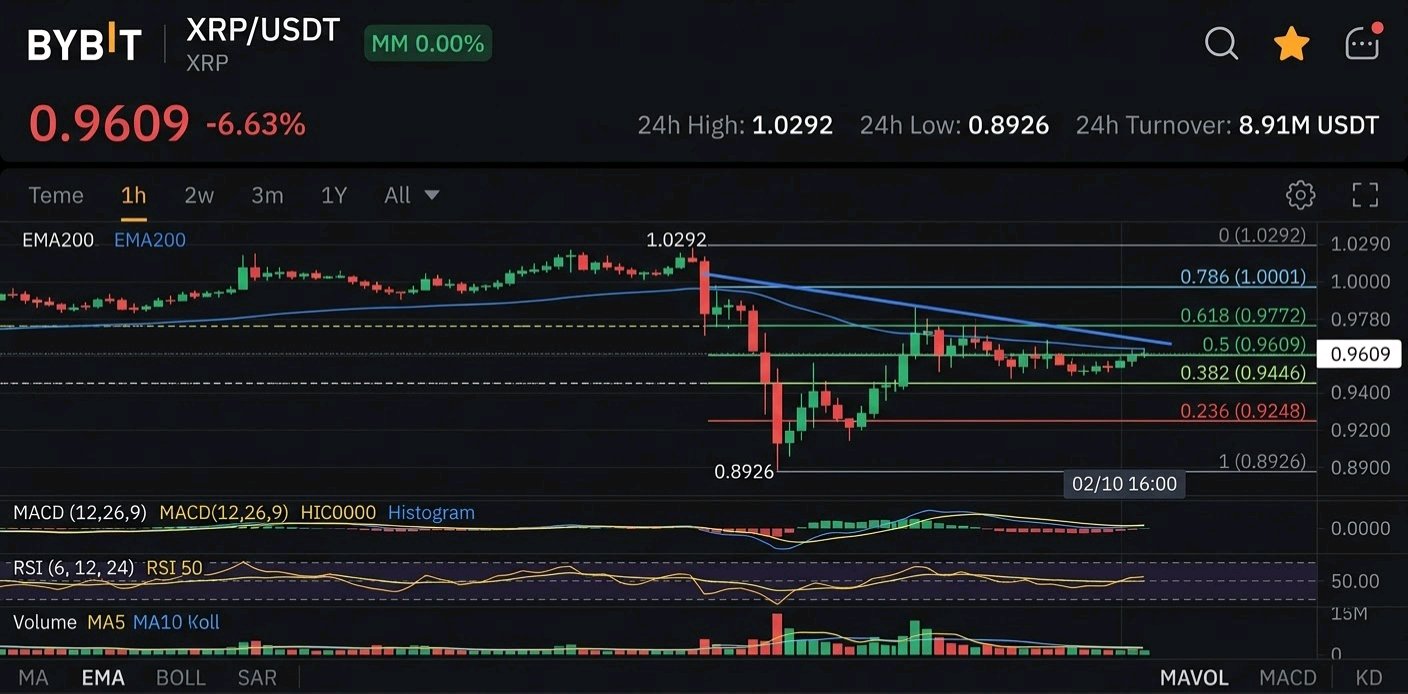
XRP 剛剛拋售了 13%,反彈了 8%,目前正處於其區間的正中點。 XRP 從 1.0292 暴跌至 0.8926,經歷了一次 13.3% 的洗盤,隨後回升至 0.9635。這對整個跌幅進行了 52% 的回撤。該區間的 50% 水位在 0.9609,因此價格正停在平衡點上。 其他指標也都指向這裡。MA7 (0.9607) 和 MA28 (0.9590) 已經收斂到同一個位置,而 24 小時高點 0.9977 就在上方不遠處。當趨勢、均值和中點都指向同一個價格時,市場正在等待有人來打破僵局。 復甦本身看起來比實際情況要強。反彈在 0.978 左右見頂,低於早先的 0.99+ 區域,因此這是一個低點高點(lower high)。反彈期間的成交量也在減弱,5 期均線目前低於 10 期均線。巨大的成交量出現在暴跌和第一次綠色復甦蠟燭上。買家在低點出現了,但他們並沒有跟進。 一個警示:目前的蠟燭線才剛開始幾分鐘,所以 38.59K 的成交量意義不大。我判斷的是成交量平均線的趨勢,而不是那根柱狀圖。 我需要看到的: - 1 小時收盤價高於約 0.978 將會突破復甦高點,0.995 到 1.00 的區域將成為下一個測試點。 - 如果在這裡受阻,隨後收盤價低於 MA14 (0.9397),則表明這次反彈只是緩解性反彈,0.8926 將再次成為目標。 訂單簿顯示有 59% 的買單,但單一快照很容易造假,所以我不會依賴它。 我目前還沒看到明確的進場點。追逐一個反彈到其中點的行情並沒有什麼優勢。決策點在 0.978 或 0.94,我寧願讓市場先選擇方向。 $XRPUSDT #IMPACTbyTrade
PEPE 從低點反彈了 7%,但從數據來看還不到進場時機 PEPE 掃掉了 0.000003697 的低點,在 1 小時線圖上收復了 7 期和 14 期移動平均線,目前價格來到 0.000003956。這看起來像是復甦,但我還沒被說服。 之前的拋售伴隨著巨大的成交量,而這次反彈的成交量明顯較小。賣方是用堅定的決心把價格壓下去,而買方只是在慢慢把它推回來。 目前的 K 線尚未收盤,距離收盤還有約半小時。我首先想看到的是收盤價高於 MA14(0.000003903)。如果只是留下一根上影線然後被拒絕,那不算數。 更關鍵的水平是位於 0.000004096 的 MA28,它比當前價格高出約 3.5% 且呈向下傾斜趨勢。PEPE 昨天已經嘗試過一次反彈,但在該區域附近遭到拒絕。現在是同樣的測試,而這次反彈還沒通過考驗。 為什麼我不追漲 假設以當前價格進場,並將停損設在 0.000003697 低點下方(例如 0.00000369): - 風險約為 0.000000266。 - 若目標設在 MA28,盈虧比約為 0.53R。 - 若目標設在 24 小時高點 0.000004320,盈虧比約為 1.37R,而且前提是價格必須先突破 MA28。 在目前位置買入,意味著要冒著跌破低點的風險,卻只能換取不到 1:1 的盈虧比,直到遇到第一個真正的阻力位。這只是假設性的計算,並非交易訊號。 什麼情況會改變我的看法 - 如果在安靜的回調中,MA14 或 MA7 的回測能守住作為支撐,那將提供更好的進場點和更小的風險。 - 若能小時線收盤突破 0.000004096,隨後回測守住,結構才會發生改變。 - 若重新跌破 0.000003697,則反彈無效,重新開啟下跌空間。 掃掉低點這件事是真的,但單憑掃低點並不代表反轉。市場必須透過成交量能匹配賣壓的方式收復 MA28,才能證明其反轉意圖。 $PEPEUSDT #IMPACTbyTrade

DOT's 15% flush is down to one question: where are the buyers? is down 15.4% to 0.6877 on DOT/USDC, and the big red candle is no longer the part I'm watching. The damage came in one hourly candle that sliced through MA7 on the heaviest volume of the whole move. That was real selling. Since then, price wicked to 0.6811, bounced once, and slipped back to about 1% above that low. Volume has faded sharply from the flush, though the current candle is still open, so I'd judge it at the close. The order book shows 87% bids, yet price won't lift off the low. Bids are sitting there, but nobody is paying up. A resting bid is a stated intention, and it can be pulled in seconds. Context I found no DOT-specific catalyst. The wider market is risk-off: fear & greed was 26 as of Nov 11, and total market cap was down about 5.8% on the week. It's also Sunday, and this pair's 24h turnover is only 17.34K. I'd cross-check the move against DOT/USDT before reading too much into the 15%. What I need to see Price is below all three MAs, and they're stacked bearishly: MA7 at 0.7066, MA14 at 0.7346, MA28 at 0.7655. The first real sign of life is a reclaim of MA7 on rising volume. A touch of 0.6811 isn't a reversal, and neither is a bounce. Hypothetical setup, not a signal: a reclaim of 0.7066 with a stop under 0.6811 risks about 0.0255. - MA14 at 0.7346 pays only about 1.1R. - MA28 at 0.7655 pays about 2.3R. - Falling MAs mean those targets shrink every hour. A reclaim of MA7 alone doesn't give an attractive trade. It needs follow-through to MA28 to justify the risk. Invalidation: a clean break below 0.6811 on volume. At that point the 87% bids stop mattering. The sellers have shown their hand. The buyers haven't yet. $DOTUSDT #IMPACTbyTrade

SOL 正處於低位,買單掛單佔 81%,卻無買家進場。 訂單簿顯示有買單,但圖表顯示沒人在買。 SOL/USDC 目前價格為 75.49,日內下跌 7.37%,僅比 24 小時最低點 74.78 高出 0.71。可見訂單簿中約 81% 的掛單都在買方(bid side),這看起來是看漲訊號。但請看看價格對此的反應:在觸及 74.78 後,SOL 反彈進入一個狹窄且重疊的區間。K 線很小,上下影線也很短,沒有延續性。大量的掛單支撐卻拉不動價格,這通常意味著被動需求正在吸收賣壓,而真正的買家則在場邊觀望。這只是買單牆,而非趨勢反轉。 趨勢依然向下 - MA28 位於 77.84,且向下傾斜。 - MA14 位於 75.84,仍在價格上方。 - MA7 位於 75.56,走平並貼近價格。 價格圍繞著短期均線震盪,而較長期的均線持續從上方壓制。自 82.32 高點以來的每一次反彈,高點都比前一次低。 成交量說明了一切 當前小時成交量為 1.45K,對比 MA5 的 1.70K 和 MA10 的 1.81K。導致下跌的賣壓已經枯竭,這是一個真實的變化,因為市場不再被推低。但反彈也沒有成交量支撐。沒有成交量的築底只是暫停,而非反轉。 我需要看到的訊號 - 收復:小時線收盤站回 75.84(MA14)上方。僅僅是影線穿過不算數。 - **真實確認**:持穩在 77.84(MA28)上方。在此之前,任何上漲都只是下跌趨勢中的反彈。 - 失效點:小時線收盤跌破 74.78。該水位已經測試過一次,第二次測試若成交量較弱,通常守不住。 這是一個假設性的設置,並非現有的交易建議。如果 SOL 收復 75.84 並持穩,止損設在 74.78 下方,第一目標位在 77.84,風險約為 1.06,回報約為 2.00。盈虧比大約是 1.9:1。這個比率可以接受,但不算優秀,而且只有在收復該位置後才成立。現在買入意味著在均線下方進場,且止損設在剛測試過的支撐位上。 我不會去追買單牆。SOL 已經停止下跌,但停止下跌並不等於趨勢反轉。下一個小時線收盤能否站上 75.84,將告訴我們這些買單究竟是真實需求,還是等待被掃掉的底板。 這是圖表觀察,非財務建議。我僅根據截圖進行分析,未核查新聞、資金費率或衍生品數據,請在操作前自行查核。 $SOLUSDT #IMPACTbyTrade

HYPE 的反彈力道已顯疲態 HYPE 從 71 點初頭一路殺至 67.113,單根小時線就完成了一次清算,隨後 3-4 小時的反彈已經停滯。雖然有買盤進場承接低點,但反彈後續無力。 24 小時區間為 75.308 至 67.113,價格目前落在 68.85,下跌 5.87%。75.3 的尖峰只是一根迅速遭到拒絕的長上影線,因此這次拋售源於突破失敗,而非單純的弱勢。 反彈才是問題所在 那根殺跌 K 線成交量為全圖最大,接近 6 萬。隨後的反彈 K 線成交量明顯不足,當前小時成交量僅 7.76K,遠低於 10 週期平均的 20.72K。如此巨大的成交量伴隨強勢殺盤,看起來像是被迫拋售;而僅憑零星成交量回升,看起來只是暫時停頓。 移動平均線也印證了這一點。價格目前位於 7、14 和 28 日均線下方(分別為 69.37、69.93、71.48),且三條均線皆向下傾斜。反彈一度觸及 MA7 區域後失敗,隨後留下了較低的高點。現在當前 K 線又翻紅了。 我的觀察重點 - 67.113:這次拋售的低點。若回測能守住且成交量縮小,將是健康的訊號。若跌破,則意味著先前的殺盤只是第一波跌勢。 - 69.4-69.9:MA7/MA14 匯聚區。若能收復並站穩,我的看法將會改變。 - 71.5:MA28 均線及下跌的起點。若無法收復這裡,我會將此視為下跌趨勢中的反彈。 委託單簿顯示 70% 的賣壓符合目前的走勢,但這只是瞬間快照,隨時會變,所以我不會太依賴它。 我不會在均線下彎時去追反彈。做多需要價格在真實成交量支持下收復 69.9 左右,做空則需要回測失敗或是跌破 67.1。在發生其中一種情況之前,現在沒有交易機會,市場還在盤整。 殺盤是最喧囂的部分。回測 67.1 時的表現,將決定這裡是底部,還是下跌的開端。 以上僅基於 1 小時線圖分析。我尚未查核這波行情背後的任何新聞、資金費率或資金流向數據。 $HYPEUSDT #IMPACTbyTrade

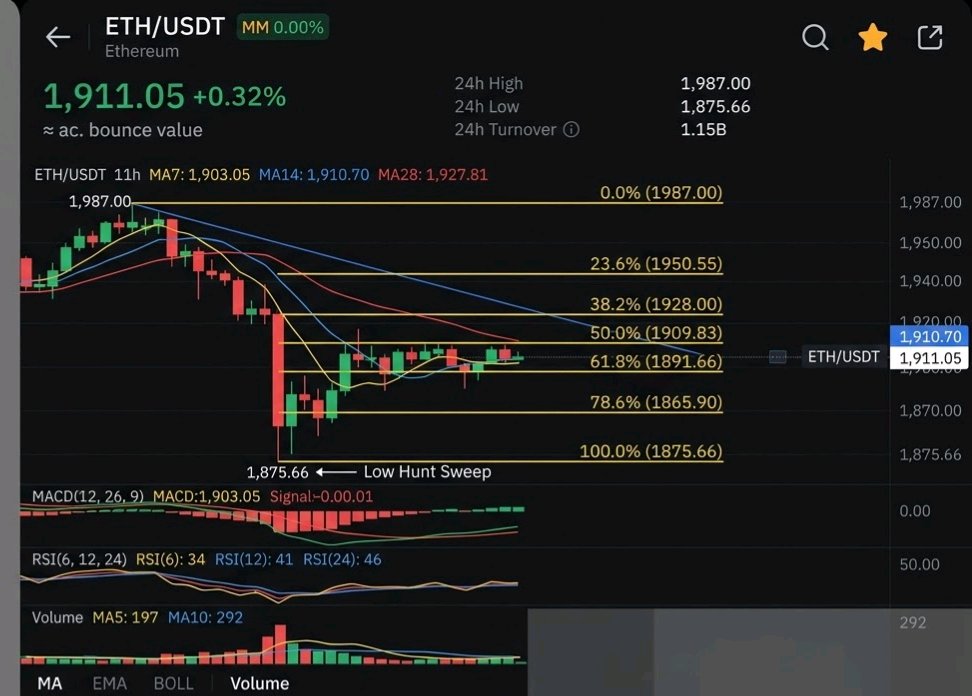
ETH 觸及了它一直在尋找的低點。但後續並沒有出現反彈。 拋售已經掃掉了下行空間。ETH 在本時段最大成交量的推動下,瞬間下探至 1,875.66 並隨即拉回。這通常是我開始尋找反轉訊號的地方。 但看看下影線之後的情況。反彈將價格從 1,875 推至 1,910,正好觸及 1,910.70 的 14 週期移動平均線(MA),且成交量不斷萎縮。5 週期成交量平均值約為 197,而 10 週期則是 292。在成交量遞減的情況下出現的反彈只是停頓,而非定局。 結構才是更大的問題。小時級別的高點持續下移,從 24 小時高點 1,987 降至約 1,950,現在又降至 1,917 左右。移動平均線呈現看跌排列,MA28 (1,927.81) 在上,接著是 MA14,最後是 MA7 (1,903.05),且全部向下傾斜。價格處於 24 小時波動區間的下三分之一,僅較低點上漲約 31%。 我需要看到的訊號: - 小時線收盤價高於 1,927.81。單憑這一點並不能扭轉什麼,但這是反彈具有延續性的初步跡象。 - 突破 1,950 左右的區域。這是最後一個低點中的高點,若能突破此處,即打破了低點持續下移的序列。 否定該觀點的情況: 如果 ETH 再次失守 1,875.66,那麼這次掃蕩就不再是「洗盤」,而變成了支撐位跌破。所有在下影線處介入的買家都將被套牢。 在 MA28 下方我不會追漲。這裡沒有確認的進場點,只是一個等待收復的假設性佈局。訂單簿顯示賣單佔 65%,但這只是一個快照,而非交易訊號。 ETH 並沒有在 1,875 處失敗,它只是因為守住該點位而未獲得相應的回報。 $ETHUSDT #IMPACTbyTrade
LINK's 10.214 breakout never had a chance to hold LINK pushed to 10.214 on the 1H chart, then gave up the entire move. One long-wicked candle was followed by a full-bodied red one that erased it. That's the signature of a failed breakout: buyers got price there, but nobody wanted to pay it. Since then the structure has only gotten weaker. Every bounce has made a lower high, and the stack is now fully bearish: MA7 (9.615) under MA14 (9.735) under MA28 (9.838). Each rally has died at or near the fastest average, which tells me sellers are still using strength to exit rather than buyers using weakness to accumulate. Volume agrees. The heaviest bars on the chart are the red ones, while the green recovery candles trade on noticeably lighter volume. That's a bounce nobody is committing to. Price is now 9.577, down 3.25%, only about 0.7% above the 24h low at 9.510. The latest candle did wick down to 9.510 and bounce, so there's a hint of buying there. But a wick is not a reclaim. Until LINK closes back above 9.615, it's just a pause inside a downtrend. Why a bounce isn't automatically a trade Suppose a long only triggers after a hourly close above MA14 at 9.735, with a stop below 9.510: - Risk: 0.225 - Reward to MA28 (9.838): 0.103, which is about 0.46R - Reward to 10.038: 0.303, which is about 1.35R So even a successful recovery offers poor reward-to-risk until price is well above the moving averages. That's hypothetical, not a signal, since the chart doesn't establish an entry. But it explains why I'd rather wait than catch this. What I'm watching - Bullish: A close above 9.615, then 9.735, ideally on rising volume. That would turn the averages from a ceiling into support. - Bearish: A close below 9.510 would take out the day's low. There's no visible support beneath it on this chart, so that break would open fresh downside and shouldn't be treated as a dip to buy. The 9.510 low is holding for now, but the market has to prove buyers will defend it with volume, not just a wick. Note: This is based only on the screenshot, so I didn't verify news, derivatives data or broader market context. Add anything you know of, such as BTC direction or a LINK catalyst, and I can sharpen the angle. $LINKUSDT #IMPACTbyTrade

STX Gave Back Its Entire Bounce, and the Volume Warned Us The 24h change reads +2.42%, but the 1H chart tells a different story. STX swept the 0.2730 low on Nov 13, then snapped back with one large green candle. The move ran straight to 0.2996, just under the 0.30 round number, and stalled there. It never got a clean look at 0.30. What bothers me is the volume. The climb to 0.2996 happened on almost nothing. The rejection candle and the selloff behind it carried the biggest volume bars on the chart. Buyers pushed price up quietly, and sellers came in loud once it got there. Now price sits at 0.2796, almost exactly on the MA7 (0.2797) and still below the MA14 (0.2869) and MA28 (0.2862). Those two averages have converged around 0.286, so that zone is the first real test. The sweep of 0.2730 held, which is something, but I don't call a bounce a reversal until price gets back above that cluster. The math, as a hypothetical setup only (no confirmed entry here): - Long from 0.2796 with invalidation under 0.2730 risks about 2.4%. - Target 0.2865 gains about 2.5%, roughly 1:1. That isn't worth taking. - Target 0.2996 gains about 7.2%, roughly 3:1. That works, but only if price gets through the MA cluster first. Waiting for a reclaim above 0.287 makes it worse. With the same stop, the risk is about 0.0140 against 0.0126 of upside to 0.2996, so the trade is under 1:1. The best entry was near the low, and the late chase isn't attractive. I'm watching two things: a 1H close back above 0.2870, and whether volume shows up on the way. If 0.2730 breaks, the sweep-and-reclaim idea is dead and the range is gone. One caution: turnover on this pair is thin (3.46K), so moves here can look cleaner or uglier than they would on deeper liquidity. I didn't check news or other catalysts for STX. This is a read of the chart alone. If you want, I can research Stacks developments and fold them in. $STXUSDT #IMPACTbyTrade

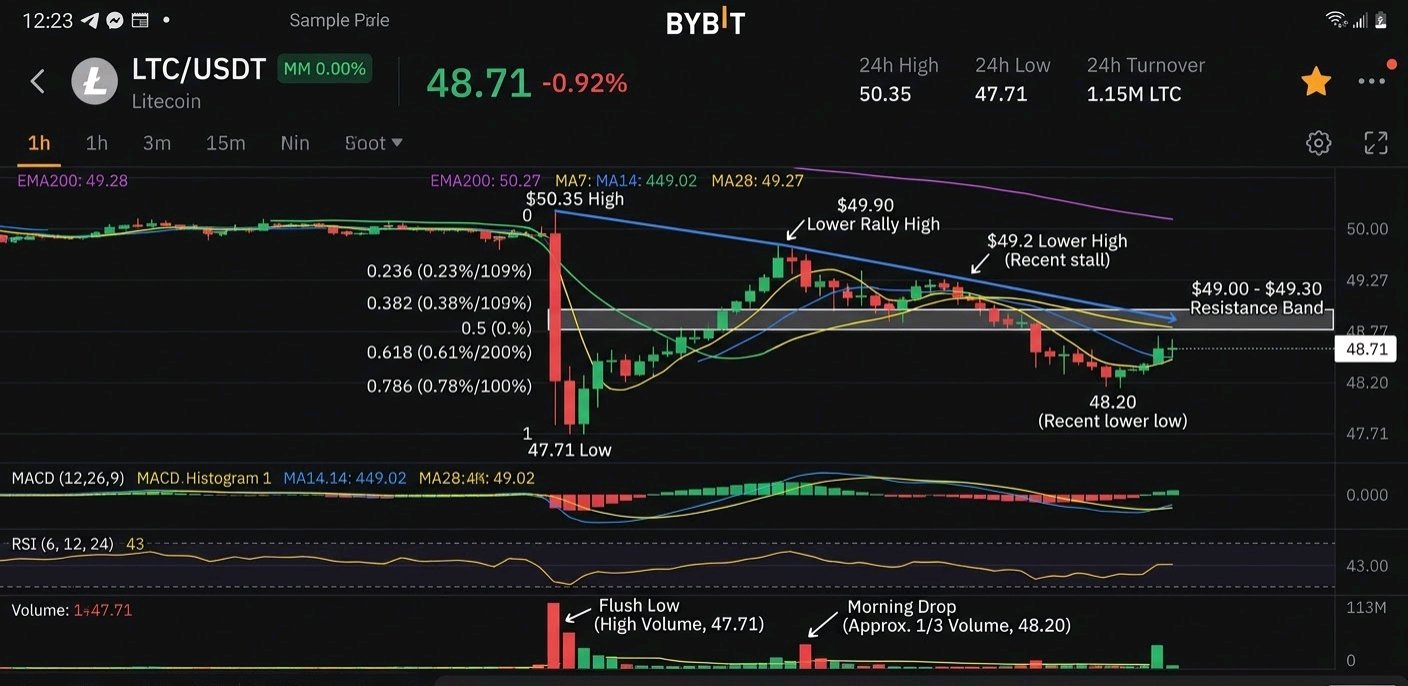
Litecoin's $47.71 low is still standing, but the bounces keep failing below it LTC swept $47.71 in a heavy flush yesterday, then rallied. Every rally since has made a lower high, and the latest sell-off stopped around $48.20, well above that low. Price is now coiling between a floor it hasn't revisited and a ceiling that keeps getting lower. On the 1H chart the high is $50.35, followed by a lower rally high near $49.90. The most recent push stalled around $49.2. Price is at $48.71 and sits under the MA7 ($49.02), MA14 ($49.27) and MA28 ($49.11). Those three are bunched within about 25 cents, so $49.00-$49.30 is one resistance band, not three separate levels. The volume is the interesting part. The first drop to $47.71 was by far the biggest volume bar on the chart, which looks like a real flush. The second drop this morning printed roughly a third of that volume. Sellers pushed price lower again with much less force, and that is why the $47.71 low hasn't been tested again. The bounce isn't convincing either. The current green candle's volume (about 79) is below its 5-bar average (about 91), and the order book shows 66% asks to 34% bids. That's a snapshot and can change in seconds, but it does mean buyers aren't being aggressive here. What would change my mind I'm not interested in buying anything under $49.00. A 1H close above $49.30 that holds on a retest would tell me the lower-high sequence is broken. Until then, this looks like a pause in a weak structure, not a reversal. Risk management Even a confirmed reclaim has a problem. Say a long triggers on a $49.30 retest, with invalidation just under the $47.71 low (about $47.65) and a first target at $50.35. That's about $1.65 of risk for $1.05 of reward, roughly 0.6:1. This is a hypothetical setup, not a signal. The confirmation costs you the reward-to-risk. You'd need either a tighter structural stop, such as under $48.20, or a target beyond $50.35 to make it worth taking. If $47.71 breaks on rising volume, the flush low becomes a failed support and the downside story takes over. Right now neither side has proven anything. The level that matters is $47.71 below and $49.30 above. LTC has to leave that range before there's a trade, and I'd rather wait for it than guess which way it goes. Based only on the 1H chart provided; I didn't research news or derivatives data. Not financial advice. $LTCUSDT #IMPACTbyTrade
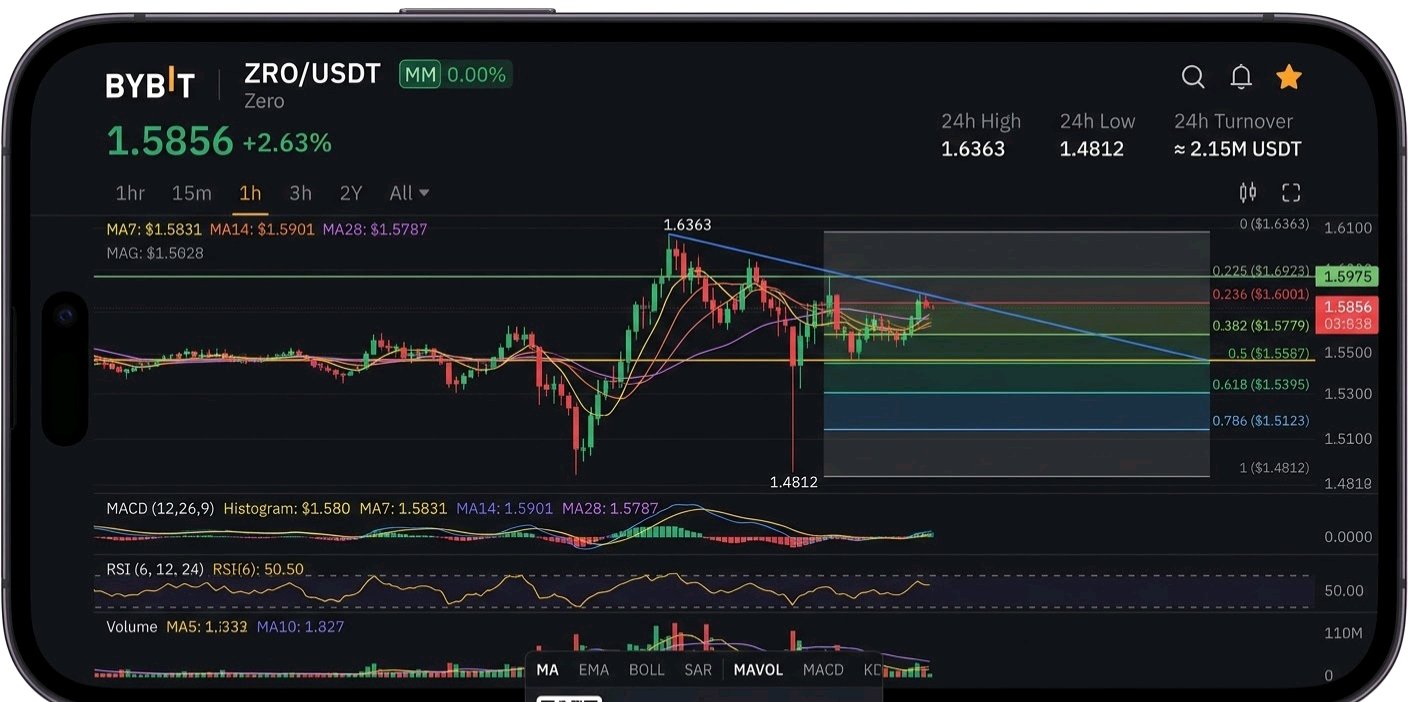
ZRO 逢低買盤湧入後便陷入沉寂。這種沉默至關重要。 ZRO 目前價格為 $1.5856 (+2.63%),經歷了從 $1.4812 低點開始的 V 型反轉。小時線圖顯示價格目前被壓縮在低於 $1.6363 高點的狹窄區間內。 復甦看起來很強勁,但自 $1.6363 遭拒絕以來的價格走勢呈現出一系列的高點下移(lower highs)。最近的一次下跌也掃過了 $1.55 區域。賣方將價格推低至約 $1.52,留下一根長下影線,買方隨後吸收了賣壓,價格迅速反彈。這是一次未能延續的流動性獲取(liquidity grab),算是稍微正面的訊號。 但我沒有看到後續動能。目前蠟燭圖的成交量約為 19K,遠低於 5 期平均值 (34K) 和 10 期平均值 (28K)。近期唯一的大成交量飆升出現在一根紅色蠟燭上,而之後的反彈力道薄弱。 移動平均線也顯示出同樣的猶豫不決。MA7 ($1.5831)、MA14 ($1.5901) 和 MA28 ($1.5787) 糾結在一起,價差不到一分錢,價格正處於這幾條均線之上。這是壓縮,而非趨勢。訂單簿(order book)則提供了一個小小的警訊:買單佔 45%,賣單佔 55%。這只是快照,單獨來看不應過度解讀,但它與日漸萎縮的成交量並不矛盾。 我需要觀察的重點: - 看漲確認:小時線收盤價高於 $1.5975,且成交量高於 5 期平均值。這將扭轉高點下移的趨勢,接下來的測試目標為 $1.6363。收盤站上該價位將確認這次復甦不只是單純的反彈。 - 警訊:收盤跌破 $1.5587 的支撐平台。這會讓之前的掃盤下影線看起來像個陷阱,屆時需密切關注 $1.52 的低點。若失守該位,將再次測試 $1.4812 的低點。 目前沒有明確的交易訊號。價格處於區間中段,因此在突破阻力或回測支撐之前,做多(long)的風險報酬比並不理想。比起猜測方向,我寧願等待區間突破。 逢低買盤確實出現了。現在重要的是,是否有人願意追價以突破 $1.5975。 以上非財務建議。僅基於 1 小時圖表分析;我尚未核實任何新聞或催化劑。 $ZROUSDT #IMPACTbyTrade
SUI 剛剛回吐了 38% 的漲幅,並精準停在它需要守住的位置。 SUI 在幾小時內從 0.7646 上漲至 0.8280,漲幅約為 8.3%。隨後回調至 0.8036,這幾乎正是該段漲幅 38.2% 的回撤位(約 0.8038)。市場目前停在第一個關鍵位,這將揭示該次上漲是否具備真實的需求支撐。 最有趣的 K 線並不是那根急漲的陽線,而是隨後出現的那根大陰線。那波拋售將價格打壓至 0.7985 附近,正好觸及 MA14(0.7979)和 MA28(0.7984)組成的匯聚區。隨後價格收復了該陰線的大部分失地,留下了一根長下影線。賣方雖然成功進行了拋售,但買方依然守住了均線匯聚區。 目前來看,這像是回調,而非反轉。但這一點尚未得到確認。 我仍未確信的幾點: - 價格位於 MA7(0.8087)下方,且最近幾根 K 線均為陰線。短期動能已經冷卻。 - 訂單簿大致平衡,買盤佔 48%,賣盤佔 52%。在此價格水平上,沒有哪一方明確佔據主導地位。 - 0.8087 是第一個關鍵位。除非 SUI 能收復該水平,否則這僅僅是一次反彈嘗試,而非趨勢。 風險/回報問題 假設我等待價格明確站穩在 0.8087 之上,並以 MA 匯聚區下方的 0.7975 作為止損。這只是一個假設性的設置,因為目前還沒有入場機會。 - 目標價 0.8158:盈虧比約 0.59R。不值得進場。 - 目標價 0.8280:盈虧比約 1.65R。這是唯一值得冒險的目標。 因此,追逐向 0.8158 的初步反彈回報率很差。只有當你預期價格會全面重測 0.8280 的高點,並且該高點仍需被突破時,這筆交易才具有意義。 什麼情況會導致觀點失效 小時線收盤價低於 0.7979 意味著 MA 支撐失敗,0.7646 的低點將再次成為焦點。那樣的話,之前的下影線將變成一個陷阱,而不是防禦。 我的觀點:逢低買入者在該出現的地方出現了,但他們還沒有經過再次測試。下一個測試點是 0.8087。 注意:以上分析僅基於您截圖中的圖表(1小時圖,11月13日,21:23)。我沒有查看任何新聞、解鎖資訊或衍生品數據,因此在發佈前,請加入您所了解的任何催化劑。這不是財務建議。 $SUIUSDT #IMPACTbyTrade

INJ's rally was one candle, not a trend INJ is up 11% to 8.183, but almost all of that move came from a single hourly candle. Volume shows the same thing: one spike to about 3.29K, while nearly every other bar on the chart is flat. That is how a burst of aggressive buying looks, and it is not yet a sustained trend. Before that, INJ bled lower under all three moving averages until it swept the 7.172 low with a long wick and snapped back. Buyers defended that level immediately. The 1h MA7 (7.943) has now curved up through MA14 (7.659) and MA28 (7.548), and price sits above all of them. That is a real change in short-term structure. I'm not trusting it yet, for three reasons: - Price is already roughly 8% above MA28 after a near-vertical run. The averages haven't caught up, so a pullback toward MA7 would be normal and healthy. - The 8.352 high was rejected, and the candle right after it printed red with a wick. That is a pause at resistance, not a breakout. - The 24h turnover is only 29.66K. On a pair this thin, one large order can create a move like this, and it can disappear just as fast. What I'd need to see - Bullish: a hourly close above 8.352 that holds on a retest. Until then, this is only a touch of resistance. - Weakening: a drop back into the body of the spike candle, roughly the 7.9 area by my read of the chart. That would suggest the move was a one-off squeeze with no follow-through. I wouldn't chase this. No entry or stop has been established, so any trade here is hypothetical until price confirms. The best entries usually come after the first pullback is defended, not at the top of a vertical candle. The question now is whether the volume returns on the next push or stays on that single bar. $INJUSDT #IMPACTbyTrade

SOL 拿下了 77.85 的流動性並隨即反彈,但這波回升還沒贏得我的信任。 跌至 77.85 的拋售非常劇烈,而反轉速度也幾乎一樣快。Solana 現在已經回升到 1 小時線圖上的 7、14 和 28 週期均線上方。這是自這波跌勢開始以來,它首次收在 28 日均線(約 80.86)之上。 讓我擔憂的是,自從 84.82 高點以來,MA28 一直壓制著每一次反彈,所以能重新站上確實很重要。但看看成交量,洗盤蠟燭圖留下了圖表上最沈重的成交量柱,而目前這波上漲只有 3.51K,對比 5 週期平均成交量 2.51K。漲幅超過平均值固然不錯,但那些在 77.85 處拋售的賣方力道,遠比現在推升價格的買方還要強勁。 價格也正處在一個非常關鍵的位置。84.82 → 77.85 這個區間大約是 6.97 點,而 61.8% 的回撤點位落在 82.16 附近。上一根 K 線收在 82.04,正好停在這個位置下方。V 型反轉若停在黃金分割點,我會希望看到的是扎實的收盤價站上,而不是留下一根上影線。 我正在關注的: 看漲確認:1 小時線收盤價站穩 ~82.2 並在回測時守住,同時成交量放大。下一個阻力位是 83.07,接著是 84.82 的高點。 健康回調:回測 MA28 區域(~80.9)並守住。若在那裡設定一個假設性的交易策略,止損設在 ~79.6 下方,到 83.07 大約有 1.5R,到 84.82 大約有 2.7R。這只是一個劇本,並非交易訊號,我還沒建立倉位。 失敗:跌破均線集群和 79.6 區域,這將會被視為一次掃單後的「死貓反彈」。 掃單已經結束。復甦是真是假,取決於當價格觸及 82.2 時,買方是否會進場。 $SOLUSDT #IMPACTbyTrade

BNB bounced 17 points off the low, but the bounce hasn't proven anything yet BNB dumped from 688.15 to 622.55, a drop of about 9.5%. The sell-off candle carried the heaviest volume on the chart. The bounce since then has been quiet: volume fades with each green candle. Price is at 640.12 (-3.32% on the day), sitting right on the 14-period MA at 639.76. It has reclaimed the 7-period MA (635.90), but the 28-period MA at 649.03 is still above and still sloping down. All three averages remain stacked bearishly. Buyers have retaken the fast average, but they haven't touched the one that matters. The bounce retraces only about 27% of the entire drop. The 38.2% level lands near 647.6, almost exactly on the 28 MA. The 50% level is 655.35. So the first real test sits around 648-649, where trend resistance and the first Fibonacci retracement overlap. What concerns me is the volume. The heavy volume came on the way down, and the recovery has been thin. The last candle's volume is around 202 against a 5-period average of 537. That's a relief bounce, not conviction. The order book is slightly bid-heavy at 53/47. That's a mild positive, but order books change fast and I wouldn't build a thesis on it. What I need to see - A 1h close above 649, ideally with volume rising instead of fading. - Then 655.35, followed by the 24h high at 662.39. - If price loses the 635.9 MA7 and rolls over from here, the 622.55 low gets retested. - A close below 622.55 would invalidate any recovery idea. I'm not chasing a candle that's pressed against a falling MA with fading volume. There's no confirmed entry here, only a level to watch. Until BNB closes above 649, this is a bounce inside a downtrend. Chart-based only. I haven't checked news, listings or derivatives data, so add those if you want a fundamental angle. $BNBUSDT #IMPACTbyTrade

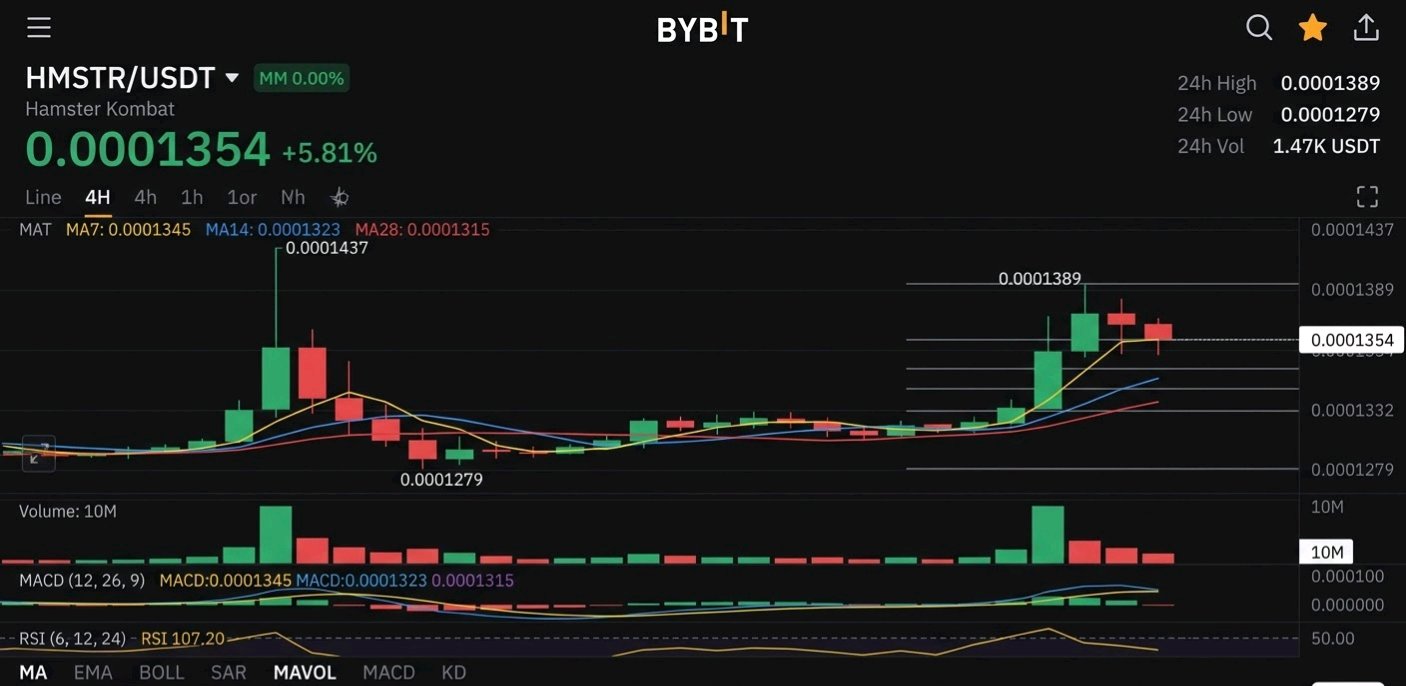
HMSTR 剛剛完成了它在 11 月 8 日飆升時未能做到的事:它帶著成交量強勢回歸了。 4 小時線圖上首次衝擊 0.0001437 的走勢是曇花一現。買方衝刺後,賣方隨即在長影線處拋售,不到兩天價格就吐回了全部漲幅,觸及 0.0001279。那次飆升完全沒有後續動能。 這次不同了。經過大約兩天在 0.000128 到 0.000132 之間平靜的築底後,突破蠟燭圖帶出了圖表上最大的成交量柱,約 1000 萬。早先那波飆升完全無法與之相比。價格目前在 0.0001354,位於 MA7 (0.0001345)、MA14 (0.0001323) 和 MA28 (0.0001315) 之上,且短週期均線疊加在長週期均線之上。這是該圖表上首次出現明確的多頭排列。 但這尚未確認。突破走勢在 0.0001389 處受阻,留下一根長上影線,隨後的 4 小時蠟燭圖收黑。買方試圖推進,賣方隨即反擊,價格目前處於兩者之間。 我需要看到的訊號: - 4 小時收盤價高於 0.0001389,將該影線轉為失土收復區。 - 回調時守住 0.0001318-0.0001323 區間,即 MA14 與 MA28 的匯聚處。跌破 0.0001301(24 小時低點)將使此次突破失效。 作為一個純假設性的建倉設定,以 0.0001354 入場,止損設在 0.0001300 下方,第一目標位 0.0001437,盈虧比大約為 1.5R。這還可以,但不算令人興奮。若能回調至 0.000132 附近,盈虧比會比現在追漲好得多。 警示: 掛單簿顯示買單佔 94%,賣單佔 6%,看起來偏向多頭。但 24 小時成交額僅約 1.47K,因此掛單簿很薄,容易被操控或出現假掛單。在下一波衝刺中實際成交量能維持住之前,我不會將其視為強烈信心訊號。 這個設定比上週好,但 0.0001389 仍然必須被收復。 非投資建議。 $HMSTRUSDT #IMPACTbyTrade

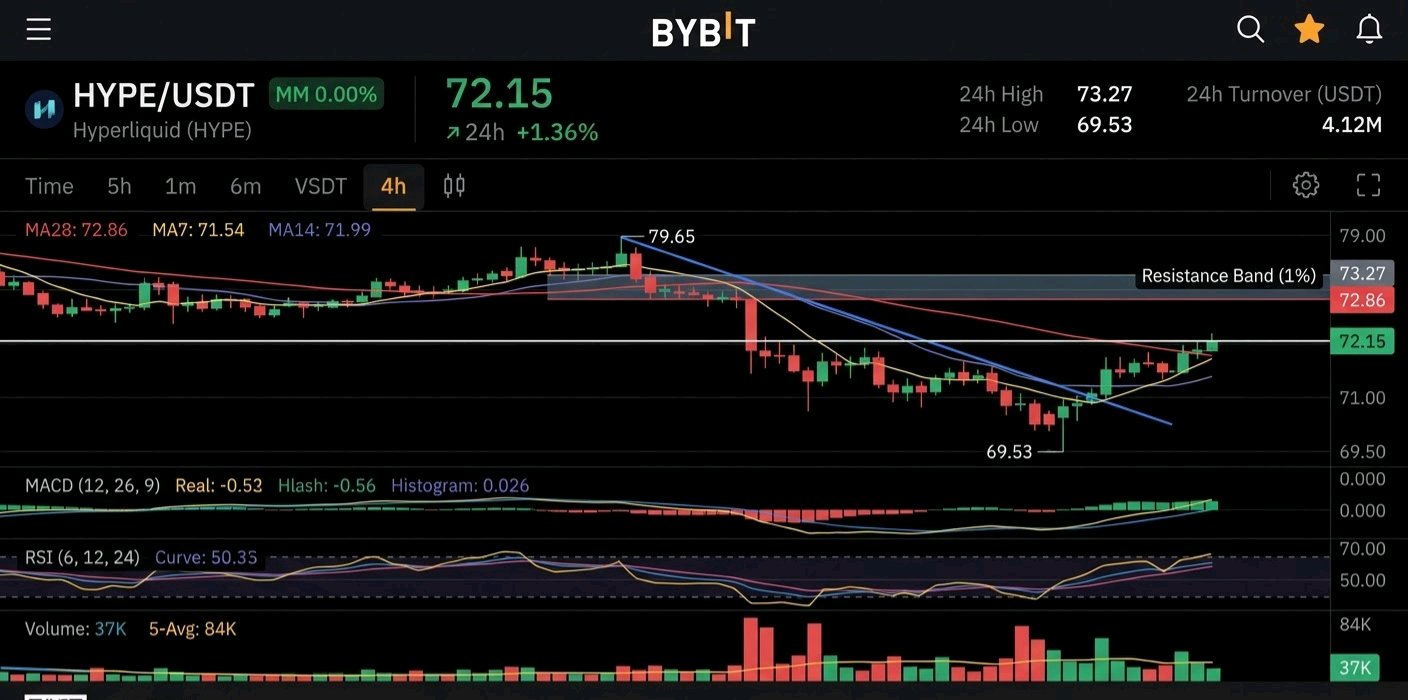
HYPE 剛出現反彈。真正的考驗在於幾小時前曾遭遇拒絕的價格關卡。 HYPE 已從 79.65 的波段高點下跌至 69.53 的低點,跌幅約 12.7%。目前回升至 72.15,日內上漲 1.36%。 反彈本身不是重點,價格水準才是。 4 小時線的 MA28 位於 72.86,上次反彈就是在該區域受阻。24 小時高點 73.27 就在上方一點點。這意味著在當前價格上方約 1% 的位置有一個阻力帶,買方再次面臨的空間非常有限。 有兩件事引起了我的注意: 買方兩次守住了低點。69.5 到 70 的區間出現了兩根尖銳的下影線,且第二根的低點稍微高一點。這是下跌趨勢後出現吸籌跡象的第一個訊號。 反彈目前還沒有成交量支撐。高成交量柱狀圖都集中在之前的拋售期間。當前的 4 小時 K 線成交量為 37K,而 5 期均線為 84K。雖然它還在形成中,我不打算過度解讀,但復甦需要市場參與才有意義。 MA7 (71.54) 和 MA14 (71.99) 現在走平且位於價格下方,但 MA28 仍在下行。價格只是收復了短期均線,而非趨勢。 關於盈虧比的問題。假設你等待 4 小時線確認收在 73.27 上方。這只是一個假設性的進場點,而非訊號。若將失效點設在 69.53,風險約為 3.7。第一個目標位在 75.98 附近,報酬約為 2.7,風險報酬比大約是 0.7R。即使完全回撤至 79.65,也只有約 1.7R。等待確認訊號會吃掉大部分漲幅,這也是為什麼追價進入阻力區並不吸引人的原因。 我需要看到的訊號: 4 小時線收盤價高於 73.27,且成交量最好高於 10 期平均成交量。 對該區域進行回測,並確認能形成支撐。 如果 69.53 失守,雙底的想法就會破滅,79.65 的高點也將不再具備參考價值。 在此之前,這看起來只是下跌均線下的反彈行情。它尚未確認反轉。 $HYPEUSDT #IMPACTbyTrade