Wave1
529點贊0分享169粉絲1081關注
Content Creator || Signal Provider|| BNB holder || Trader .
Content Creator || Signal Provider|| BNB holder || Trader .
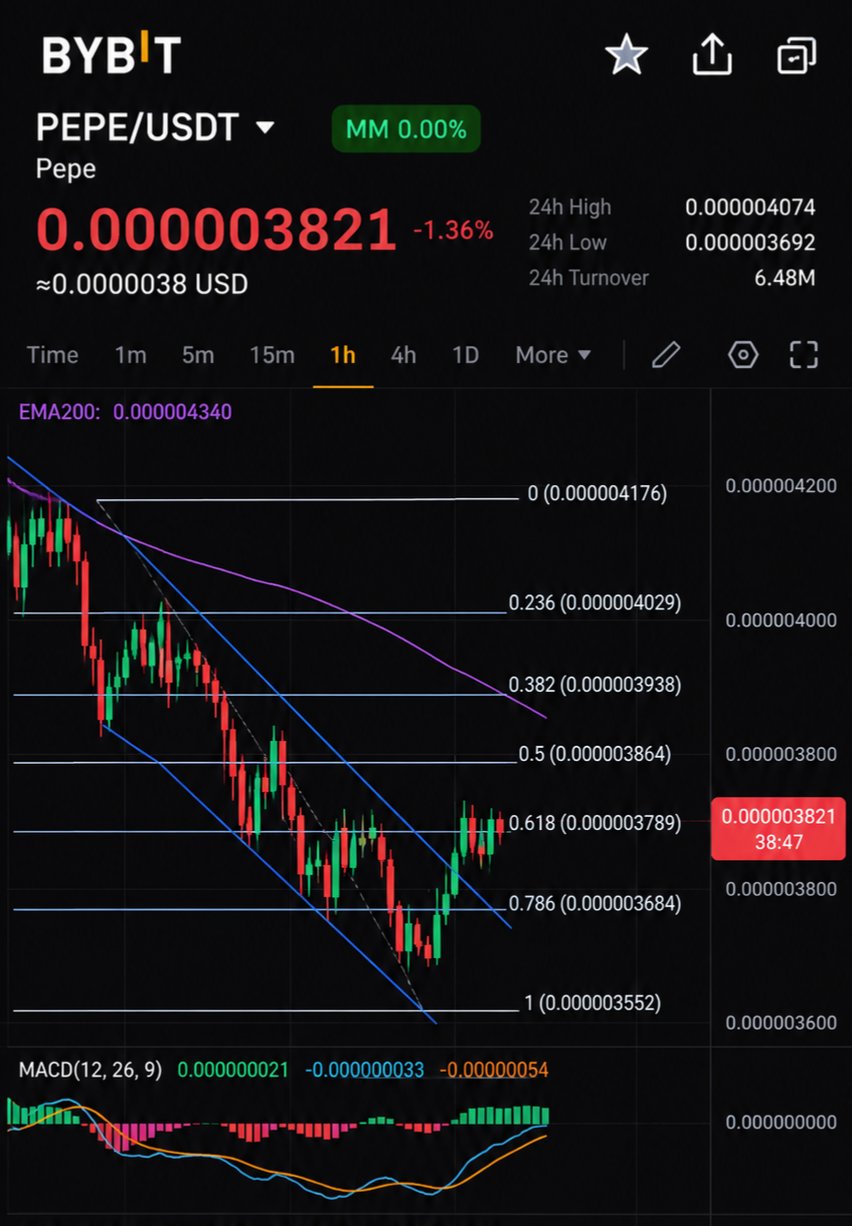
PEPE is showing a small recovery, but the 1H chart suggests buyers still have work to do. $PEPE is trading around $0.000003821, up 0.45% over 24 hours. However, price remains below all three key moving averages: MA7: $0.000003858 MA14: $0.000003902 MA28: $0.000003909 This is the level I’m watching closely. The recent bounce from $0.000003692 has not yet changed the short-term structure. PEPE needs to reclaim the $0.00000390 to $0.00000392 zone with stronger volume to show that buyers are gaining control. On the downside, $0.000003764 is the first important support, followed by the recent swing low at $0.000003692. My observation: PEPE is trying to stabilize after a sharp decline, but a green 24H reading alone does not confirm a trend reversal. The real signal will be whether buyers can reclaim resistance and sustain it with volume. $PEPEUSDT #ByXIMPACT
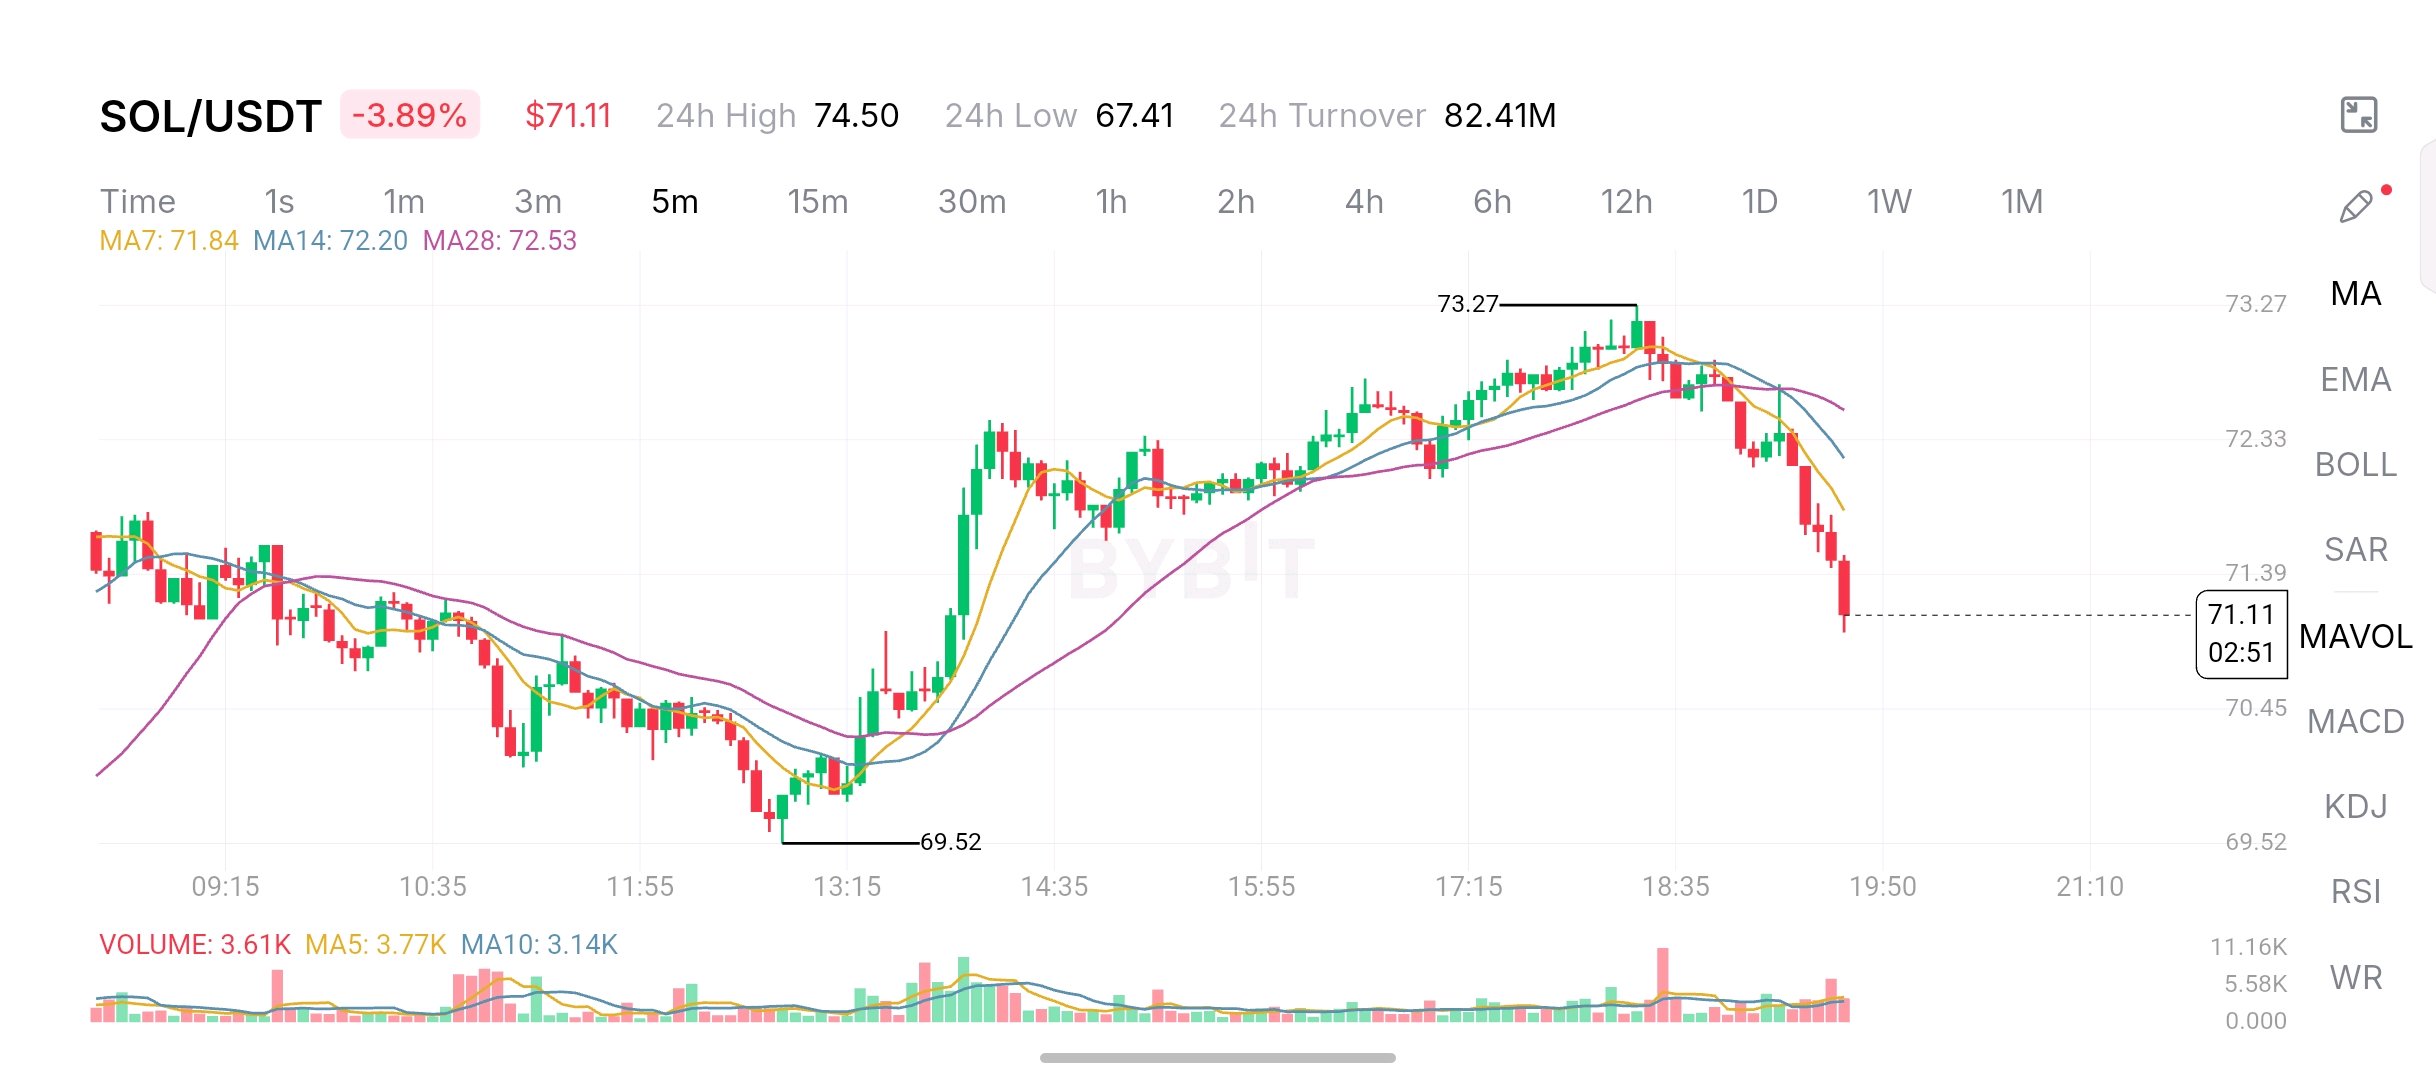
SOLANA 動能正在減弱。賣方正在掌控短期圖表。 我一直在觀察 5 分鐘線圖上的 SOL/USDT,最新的價格走勢顯示動能出現了明顯的轉變。 SOL 目前交易價格約在 71.11 美元,跌幅達 3.89%,此前未能維持向 73 美元區間的反彈。 引起我注意的不僅僅是下跌本身,而是賣方在最近的局部高點後奪取控制權的速度之快。 圖表告訴我什麼 SOL 從盤中可見低點 69.52 美元攀升至約 73.27 美元,隨後動能減弱。 價格沒有繼續創出更高的波段高點,而是開始形成下跌走勢。最新的 K 線顯示賣壓更強,SOL 回落至 71 美元附近。 還有另一個重要細節。 目前價格低於所有三條移動平均線: - MA7:約 71.84 美元 - MA14:72.20 美元 - MA28:72.53 美元 這種排列顯示短期動能已轉為看跌。在考慮反彈是否具有說服力之前,買方需要先收復這些均線。 關鍵市場數據 - SOL 價格:71.11 美元 - 24 小時漲跌幅:-3.89% - 24 小時最高價:74.50 美元 - 24 小時最低價:67.41 美元 - 24 小時成交額:8,241 萬美元 - 圖表可見高點:73.27 美元 - 圖表可見低點:69.52 美元 我關注的價位 71 美元區間是目前需要關注的關鍵價位。 如果 SOL 失守該區域且賣盤成交量增加,下一個可見的參考位在 70.45 美元左右,隨後是 69.52 美元的盤中低點。 在反彈方面,SOL 首先需要收復 71.84 美元。若能進一步突破 72.20 美元和 72.53 美元,將能提供買方回歸的更有力證據。 看漲情境 如果 SOL 能維持在 71 美元上方,築出更高的波段低點,並在成交量放大的配合下收復均線群,我會對反彈更感興趣。 看跌情境 如果賣方在成交量擴大的情況下繼續將價格推低至 71 美元下方,目前的疲軟走勢可能會延續至更低的盤中水平。 我的最終觀察 我並未將此圖表視為趨勢反轉的確認,但短期結構顯然已經轉弱。 有一點很突出:SOL 曾成功反彈至 73 美元附近,但買方無法守住該漲幅。 目前,我正在觀察 71 美元能否成為支撐,或者賣方是否會成功將價格推低。圍繞這一價位的下一次反應,將比目前的紅色 K 線更能說明問題。 $SOLUSDT #ByXIMPACT
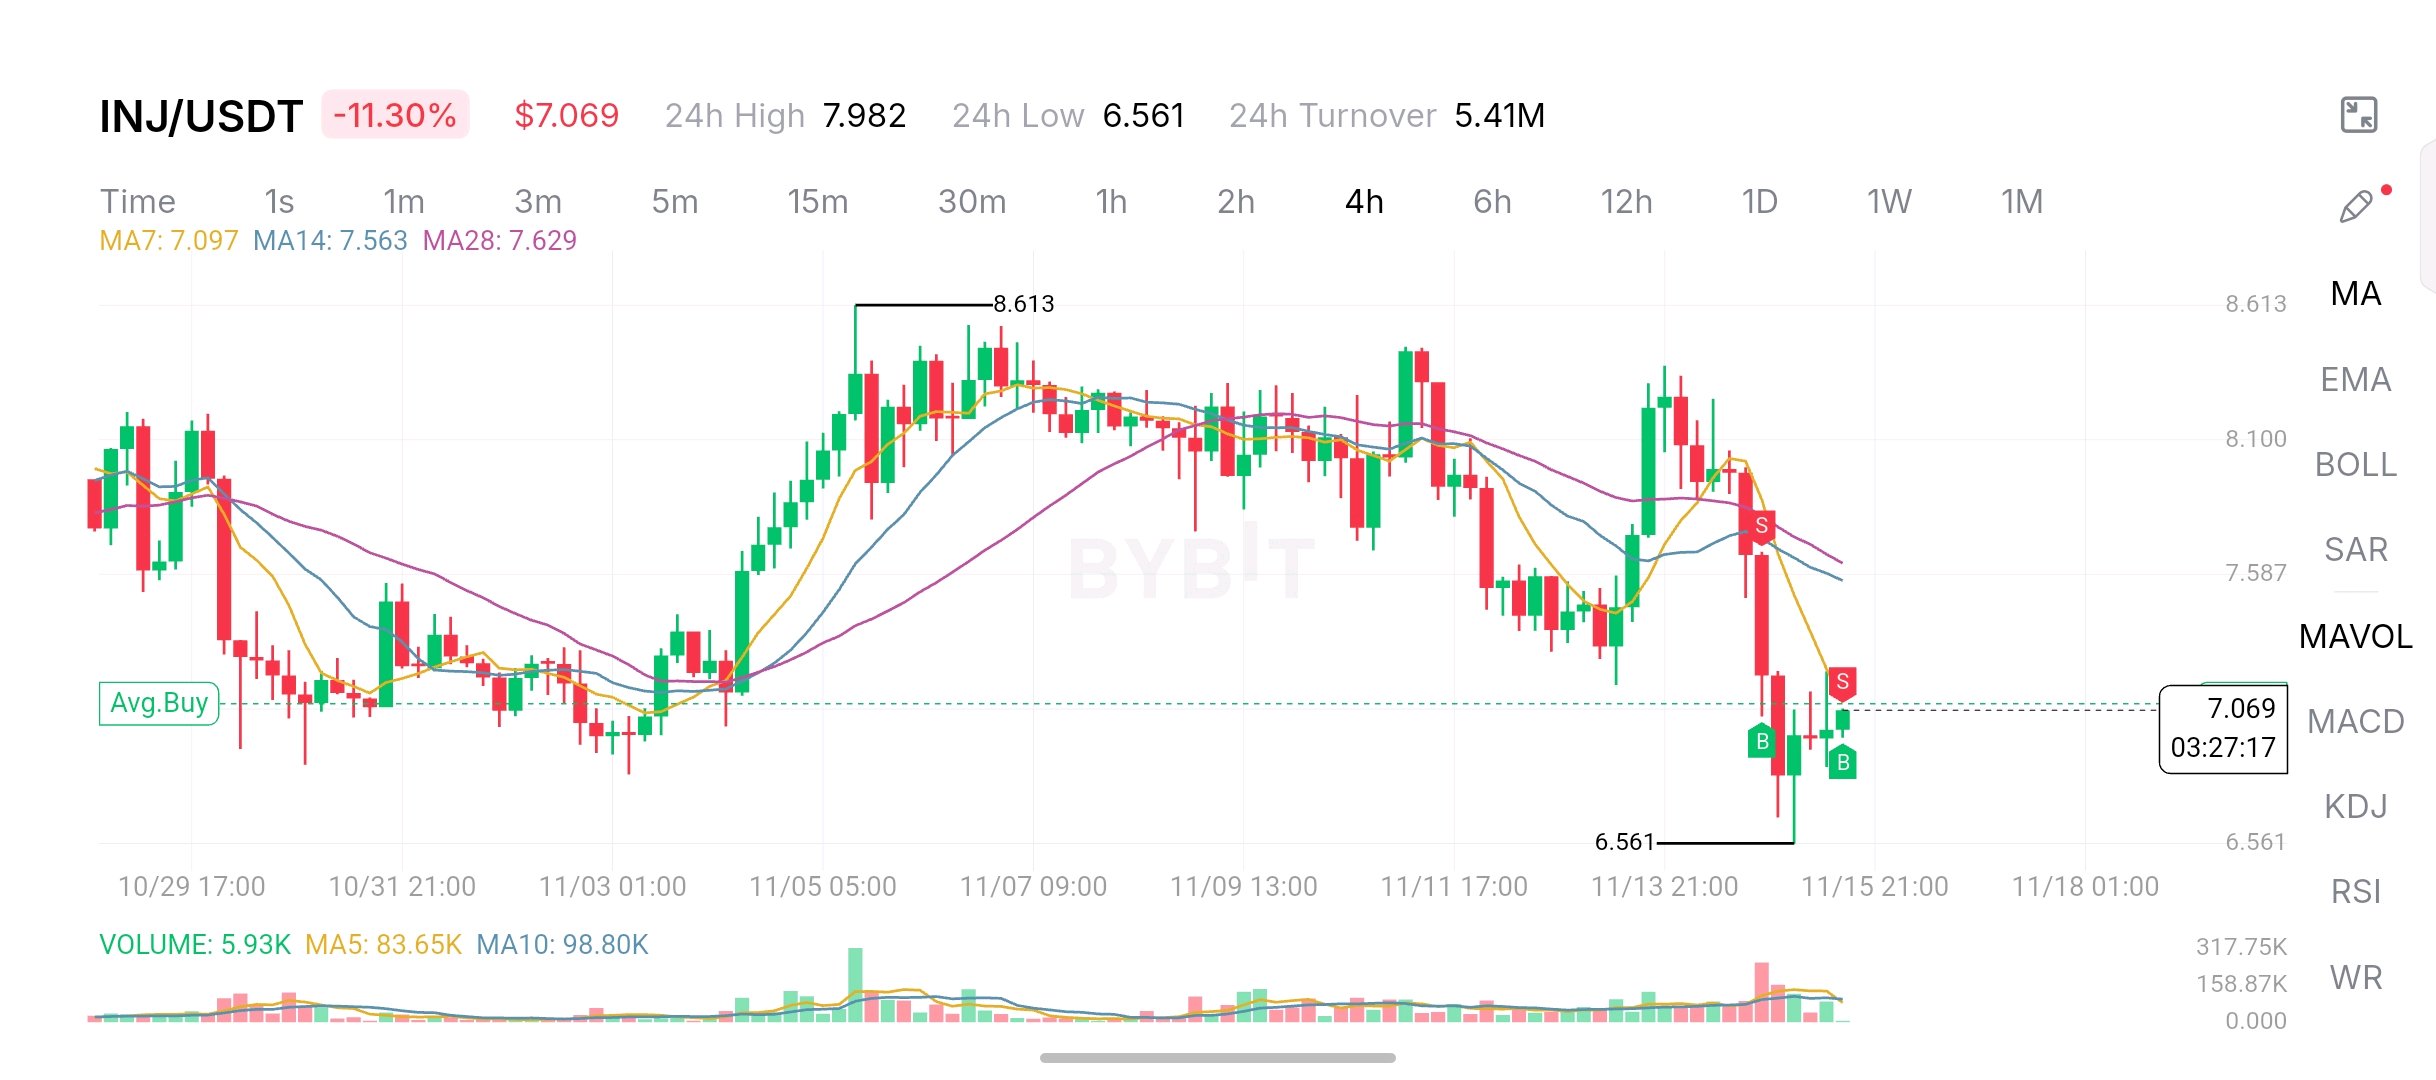
$INJ DROPS 11.30% AS SELLING PRESSURE RETURNS. THE $6.56 SUPPORT ZONE IS NOW CRITICAL! Injective is facing another difficult session, and the latest 4-hour chart shows that sellers are maintaining control despite a small recovery attempt. $INJ is currently trading around $7.069, down approximately 11.30% in 24 hours. The price has dropped from the recent swing high of $8.613 and recently touched $6.561 before bouncing back toward the $7.00 area. What caught my attention is the strength of the latest selling move. The recovery attempts have struggled to reclaim previous levels, while the moving averages continue pointing toward a weak short-term structure. Here are the important technical levels: • MA7: $7.097 • MA14: $7.563 • MA28: $7.629 Price is currently below all three moving averages. Even the short-term MA7 is slightly above the current price, showing that buyers still need to build momentum. Key levels I'm watching: - Immediate support: $6.561 - Psychological level: $7.00 - First resistance: $7.097 - Next resistance: $7.563 - Major resistance: $7.629 If buyers defend $6.561 and push price above $7.097, INJ could attempt a recovery toward the $7.56 area. However, losing the recent low would be a concerning development and could expose the chart to further downside pressure. Volume also deserves attention. The displayed volume is 5.93K, compared with MA5 at 83.65K and MA10 at 98.80K. This suggests the latest bounce has not yet demonstrated strong volume participation. My current observation: I'm not treating this bounce as a confirmed reversal. The broader 4-hour structure remains weak, and buyers need to reclaim important moving averages before the chart starts looking healthier. For now, the $6.561 support and $7.10 resistance are the two levels I'm watching most closely. The real question is whether buyers can turn this recovery attempt into sustained momentum or sellers will push INJ toward another low. $INJUSDT #IMPACTbyTrade
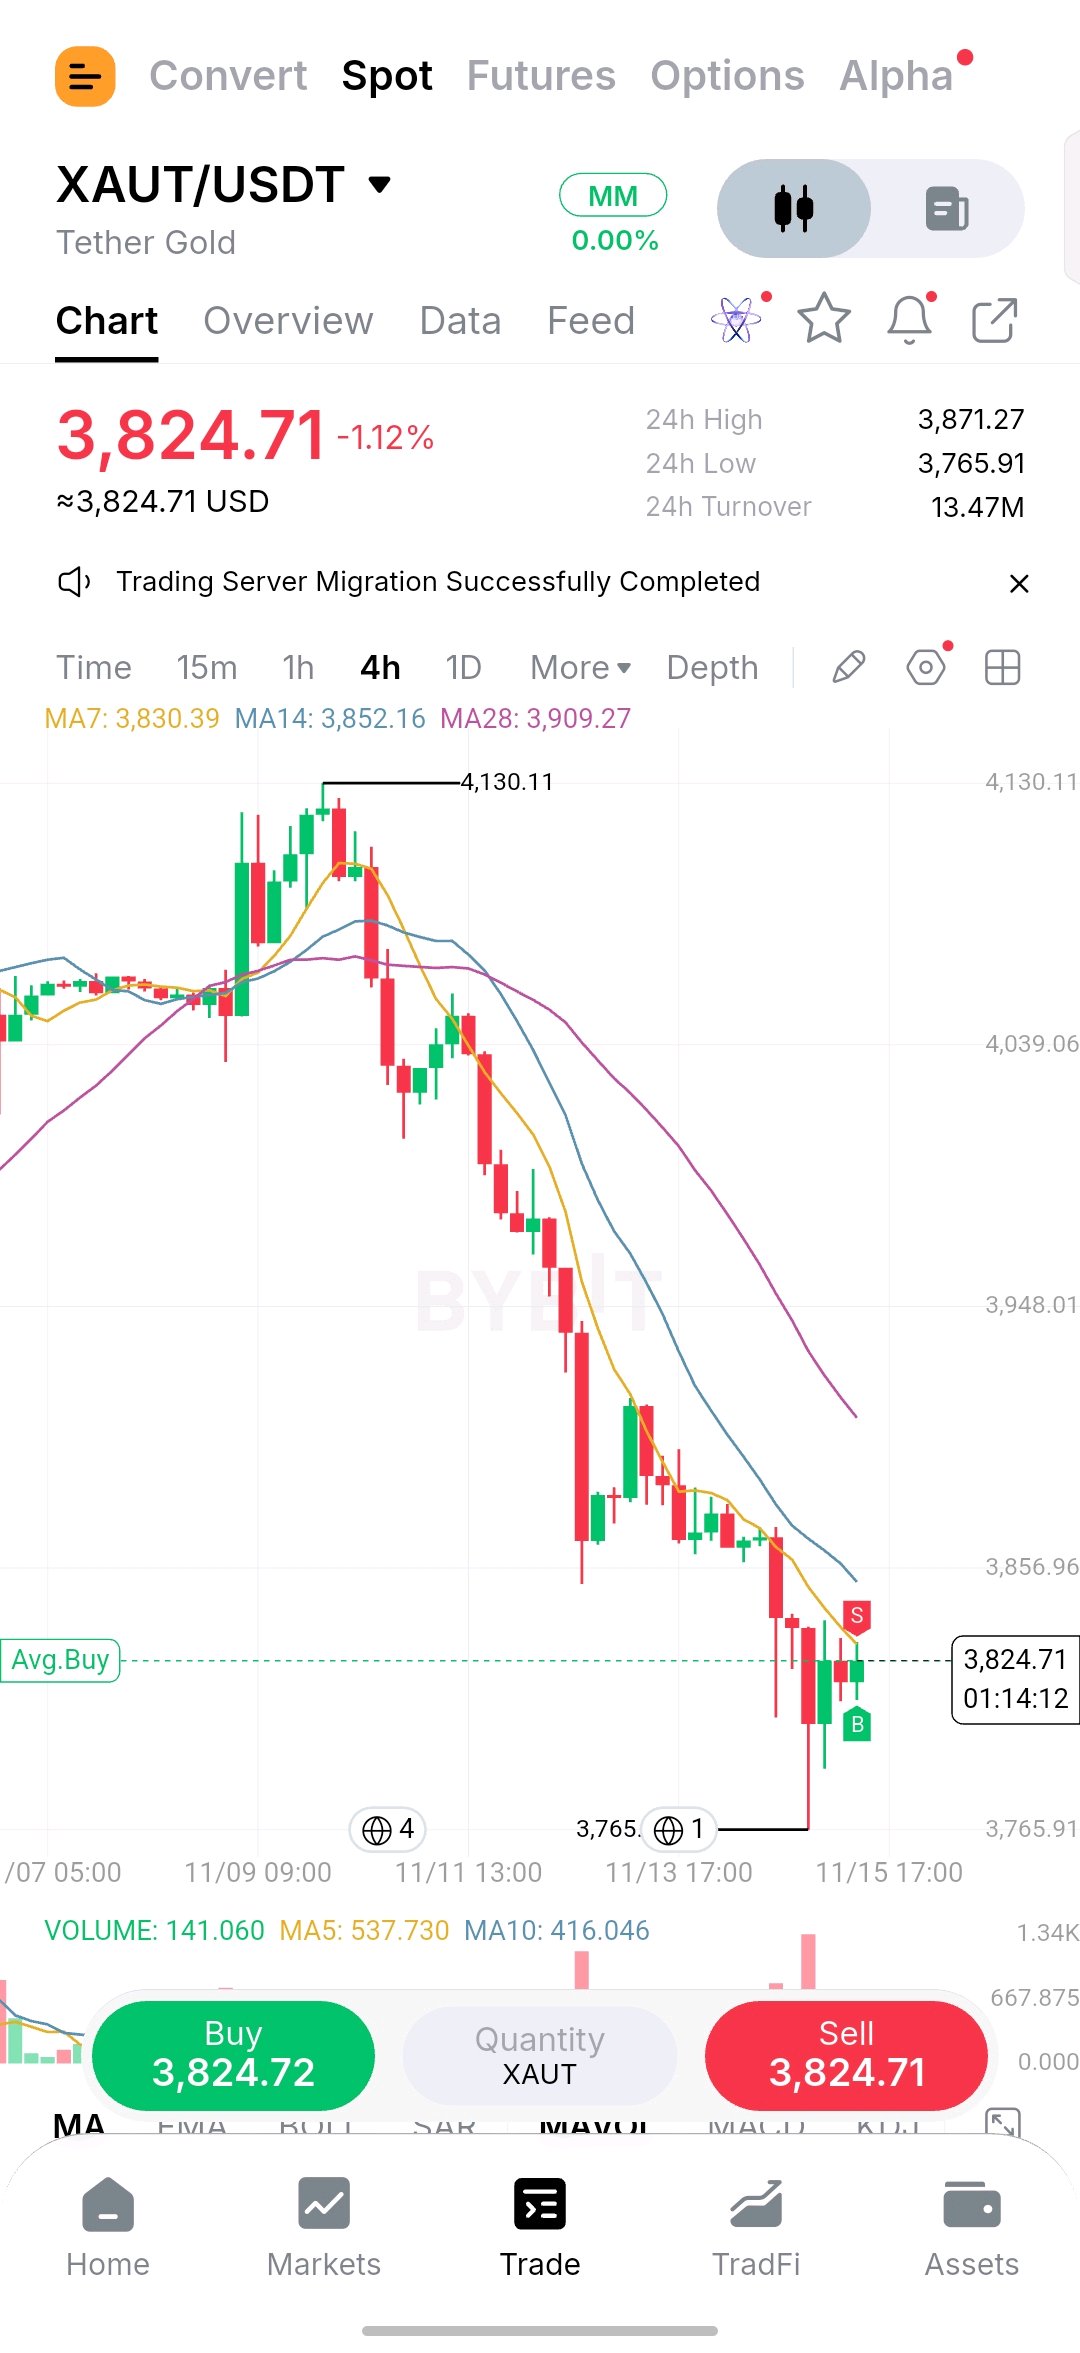
黃金代幣 $XAUT 在從 4,130 美元急劇下跌後面臨賣壓。買家能否守住 3,765 美元的支撐位? Tether Gold 的動能出現明顯轉變,最新的 4 小時圖表顯示賣方仍主導著短期方向。 $XAUT 目前交易價格約為 3,824.71 美元,24 小時內下跌約 1.12%。價格已從近期波動高點 4,130.11 美元大幅回落,隨後觸及 3,765.91 美元的日內低點。 引起我注意的是 3,765 美元區域附近的近期反應。在經歷了一波激烈的拋售後,買家進場並將價格推回至 3,824 美元附近。然而,此次反彈仍面臨多項技術挑戰。 移動平均線顯示持續疲軟: • MA7: 3,830.39 美元 • MA14: 3,852.16 美元 • MA28: 3,909.27 美元 價格仍低於這三條移動平均線。這表明儘管有最近的反彈嘗試,更廣泛的 4 小時結構仍處於看跌狀態。 我關注的關鍵點位: - 即時支撐位:3,765.91 美元 - 第一阻力位:3,830.39 美元 - 下一個阻力位:3,852.16 美元 - 主要阻力位:3,909.27 美元 - 前波動高點:4,130.11 美元 如果買家成功守住 3,765.91 美元,XAUT 可能會嘗試再次向 3,850 美元區域反彈。 然而,如果價格持續跌破近期低點,則表明賣壓依然強勁,市場可能會進一步走弱。 交易量是另一個重要因素。當前顯示交易量為 141.060,而 MA5 為 537.730,MA10 為 416.046。這顯示最近的反彈尚未吸引強勁的成交量參與。 我目前的市場觀察: 我正在觀察這次反彈能否發展成更強勁的走勢,還是僅僅是下跌趨勢中的又一次暫時反彈。 對我而言,重新站上 3,852 美元並最終突破 3,909 美元,將是動能改善的重要訊號。 在市場環境不確定的情況下,黃金支持的加密資產值得關注,但圖表仍需進一步確認。 3,765 美元的支撐區是下一個重要戰役的開端。 $XAUTUSDT #ByXIMPACT
$PEPE 在經歷了 6.27% 的大幅下跌後正努力反彈。但買方仍面臨巨大挑戰。 PEPE 在 4 小時圖上顯示出持續的疲軟,最新的價格走勢顯示賣方仍掌控著更廣泛的短期趨勢。 目前 PEPE 的交易價格約為 $0.000004016,24 小時內下跌了約 6.27%。價格已從近期的高點 $0.000005617 回落,並在近期觸及 $0.000003692 後試圖進行小幅反彈。 引起我注意的是市場結構發生了多麼劇烈的變化。 在達到近期高點後,PEPE 開始形成低點下移 (lower lows) 和高點下移 (lower highs)。每一次復甦嘗試都難以維持動能,這使得賣方得以將價格進一步推低。 移動平均線揭示了一個重要的訊號: • MA7: $0.000004002 • MA14: $0.000004211 • MA28: $0.000004488 價格目前位於 MA7 上方,但仍低於 MA14 和 MA28。這意味著最近的反彈顯示出一些短期強勢,但更廣泛的復甦尚未確認。 以下是我關注的關鍵點位: - 即時支撐位: $0.000003692 - 第一阻力位: $0.000004173 - 下一阻力位: $0.000004211 - 強阻力位: $0.000004488 如果買方能夠守住近期低點並收復阻力區,PEPE 可能會嘗試更強勁的反彈。 然而,若失守 $0.000003692,將會進一步削弱結構,並帶來額外的下行壓力。 另一個有趣的細節是成交量。目前顯示的成交量為 107.98B,而 MA5 為 284.26B,MA10 為 330.24B。這表明最近的價格反彈尚未伴隨著強勁的成交量參與。 我的當前觀察: 我正在觀察這種小幅反彈能否發展成更強勁的走勢。幾根綠色 K 線不足以確認趨勢逆轉。 PEPE 需要持續的買盤成交量以及成功收復關鍵移動平均線。 目前,$0.000003692 的支撐位是我觀察名單上的關鍵區域。 接下來的走勢取決於買方能否最終將這種反彈嘗試轉化為真正的動能。 $PEPEUSDT #ByXIMPACT
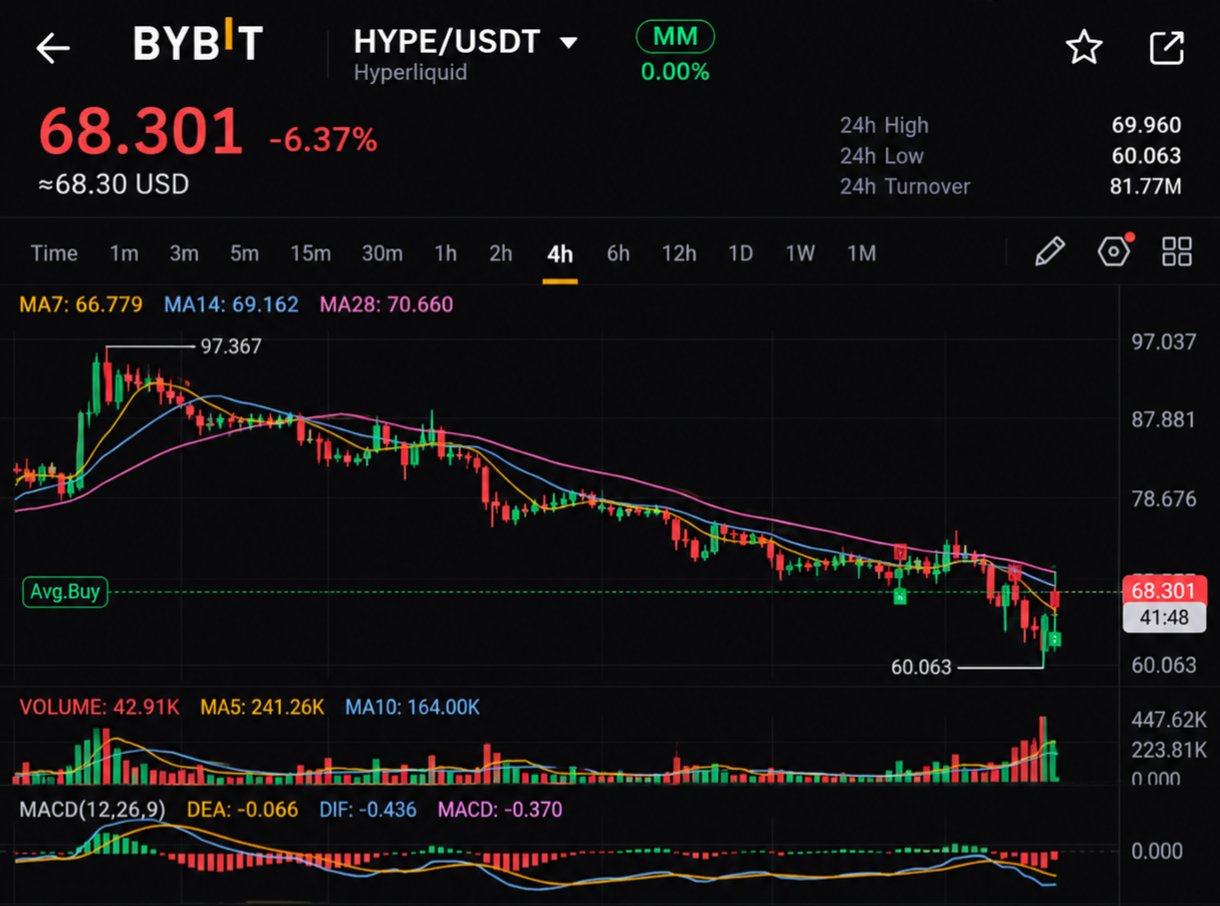
HYPE 下跌了 6.37%,但買方正在守住 60 美元的支撐區! Hyperliquid ($HYPE) 在 4 小時圖上持續疲軟,但其最新的價格走勢值得關注。 HYPE 目前交易價格約為 65.32 美元,24 小時高點為 69.96 美元,低點為 60.06 美元。近期拋售期間,交易量也有所回升。 引起我注意的是: 價格已從 97 美元區域顯著下跌,形成了明顯的低點不斷降低與高點不斷降低的趨勢。MA7(66.779 美元)、MA14(69.182 美元)和 MA28(70.660 美元)均位於當前價格上方。 這顯示賣方仍掌控著大盤結構。 我關注的關鍵點位: - 60.06 美元:主要支撐位及近期波動低點。 - 66.78 美元:第一個移動平均線阻力位。 - 69.18 美元:MA14 阻力位。 - 70.66 美元:MA28 阻力位。 MACD 保持負值,而 RSI 讀數則漲跌互見,顯示儘管近期出現反彈,但動能尚未完全恢復。 我現在的關注點很簡單: HYPE 能否重回 67 美元並建立足夠的強勢來挑戰 69-70 美元的阻力區? 還是會再次受阻,導致 60 美元的支撐區再次面臨考驗? 接下來在這些價位的反應可能揭示這究竟是復甦的開始,還是下行趨勢中的暫時停頓。 我正在密切關注價格走勢和成交量。強勁的反彈需要確認,而不僅僅是紅綠K線。 $HYPEUSDT #IMPACTbyTrade

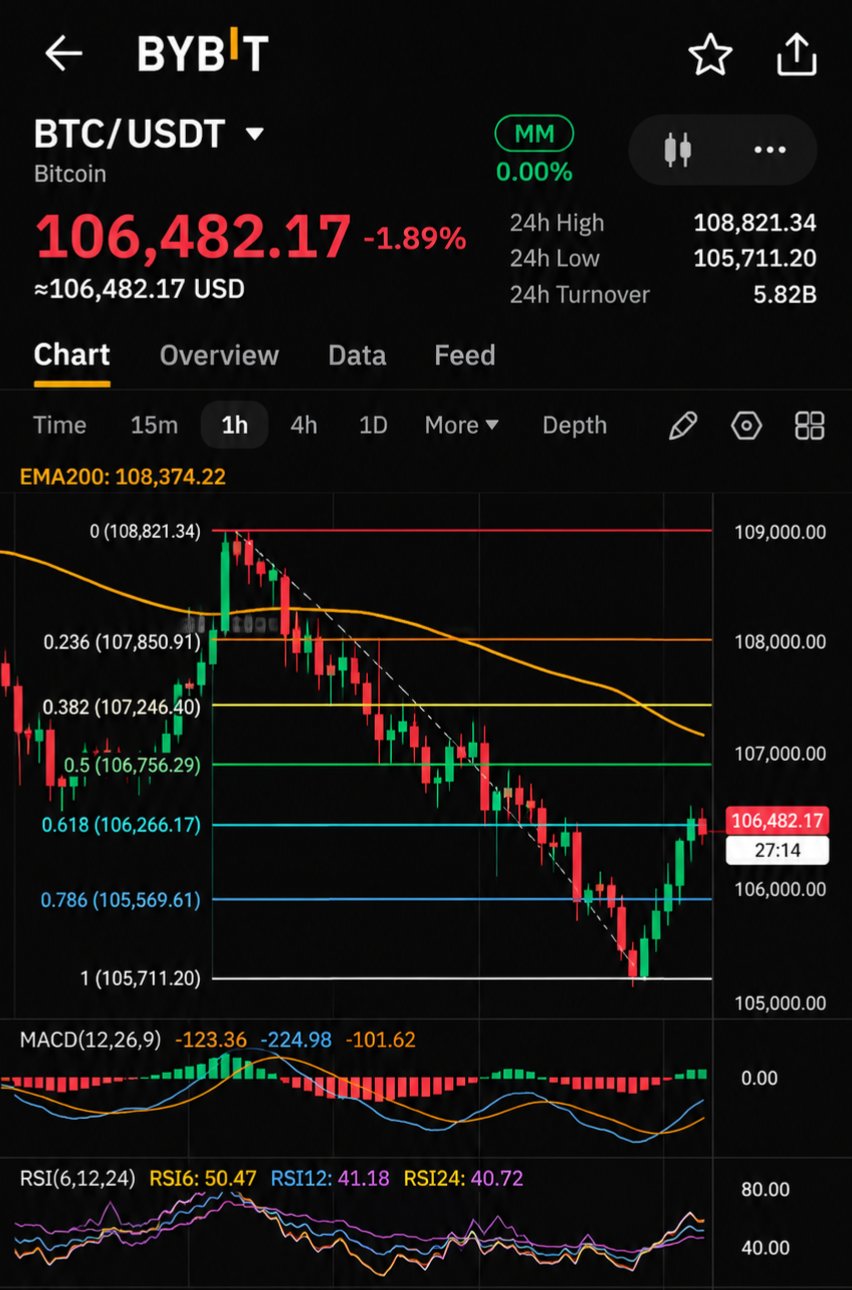
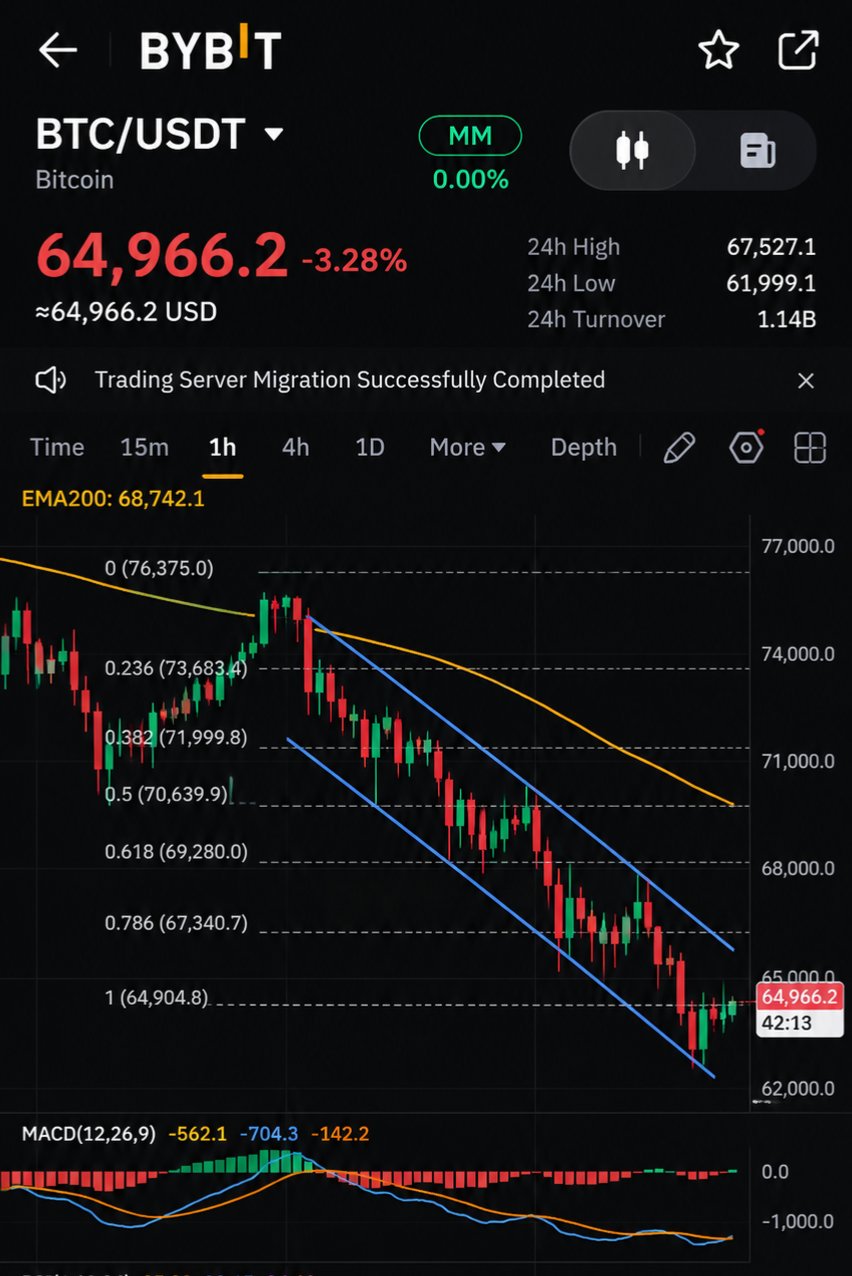
BITCOIN IS STRUGGLING TO RECLAIM $65K AS SELLING PRESSURE CONTINUES! Bitcoin is showing signs of a possible short-term recovery, but the 4-hour chart still tells a bearish story. BTC is currently trading around $64,966, down approximately 3.28% in 24 hours. The market has experienced a sharp decline from the $76,375 region, putting significant pressure on buyers. However, one important development caught my attention: Bitcoin recently tested the $62,000 support zone and managed to bounce back toward $65,000. This suggests that buyers are still defending lower levels, but the question is whether they have enough strength to reverse the current trend. Here are the key technical levels I'm watching: - $62,000: Major support area and recent session low. - $64,966: Current trading area where buyers are attempting to stabilize price. - $65,695: MA7 resistance. - $67,125: MA14 resistance. - $70,236: MA28 resistance and an important recovery level. All three moving averages are positioned above the current price and are trending downward. This indicates that sellers still have control over the broader 4H structure. What could happen next? If BTC reclaims $65,700 with convincing volume, it could open the door toward $67,100. A stronger recovery above that level would improve the short-term technical picture. On the other hand, another rejection could bring $62,000 back into focus. Losing that support would put additional pressure on the market. My observation: Bitcoin has bounced from support, but a bounce alone does not confirm a trend reversal. I'm watching volume, resistance levels and buyer strength before calling this a recovery. The next move around $62K to $67K could provide a much clearer picture of Bitcoin's direction. $BTCUSDT #IMPACTbyTrade

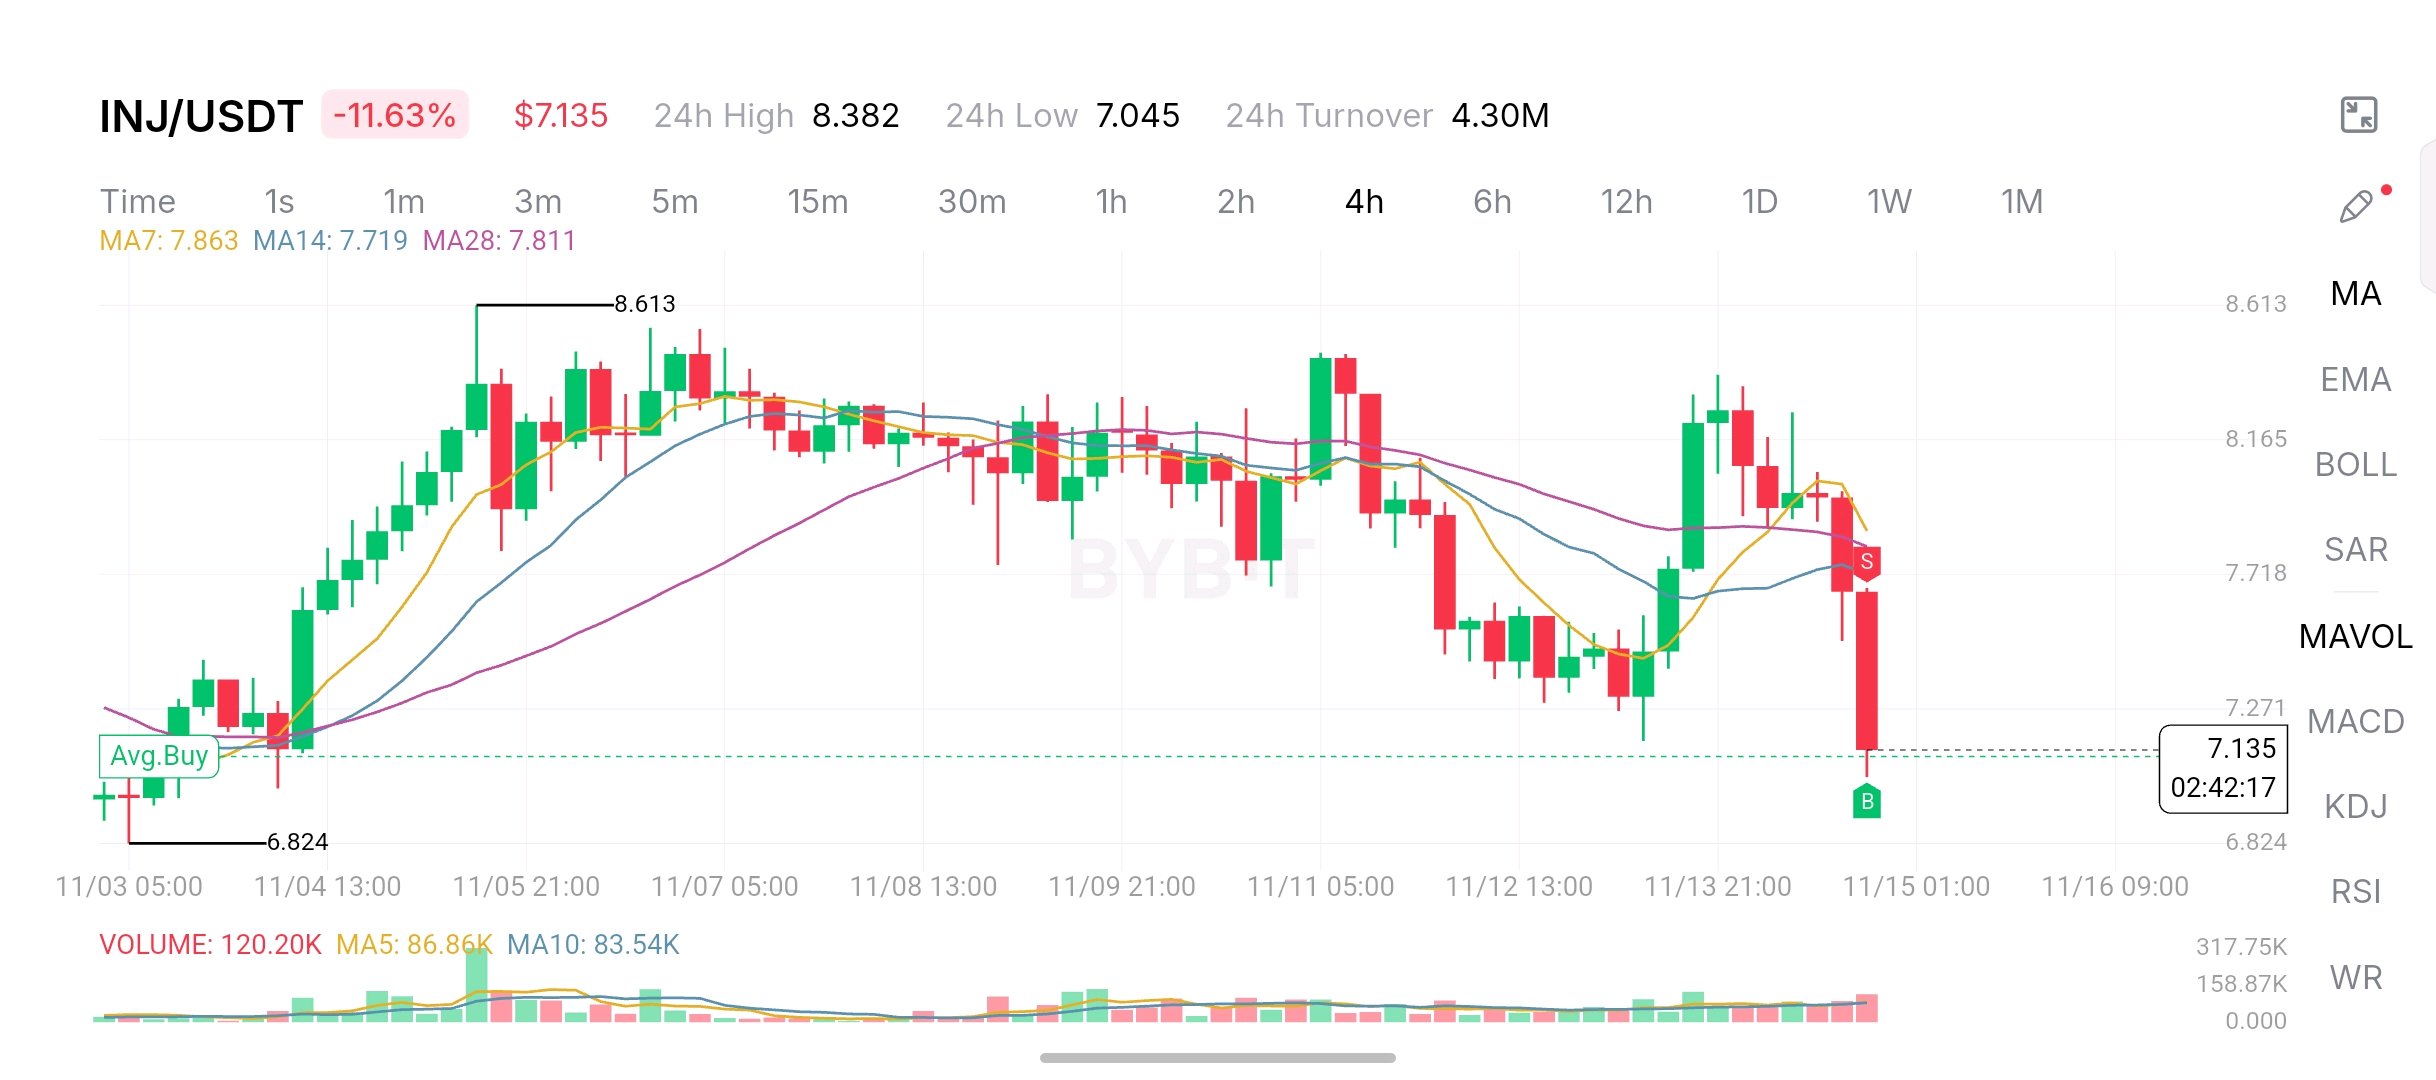
$INJ DROPS 11.63% AS SELLING PRESSURE HITS THE MARKET. THE $7 SUPPORT ZONE IS NOW IN FOCUS. Injective is showing a significant shift in short-term momentum, and the latest 4-hour chart deserves attention. is currently trading around $7.135, down approximately 11.63% in 24 hours. What makes this move interesting is the sharp rejection from the recent recovery area near $8.30, followed by a strong bearish candle pushing price toward its daily low of $7.045. Looking at the chart, buyers attempted to regain control during the November 13 recovery, but the latest move erased much of that progress. The moving averages are also showing weakness: • MA7: $7.863 • MA14: $7.719 • MA28: $7.811 Price is now trading below all three averages. This suggests that sellers currently have the advantage on the 4-hour timeframe. Here are the key levels I'm watching: - Immediate support: $7.045 - Next important support: $6.824 - First recovery resistance: $7.718 - Stronger resistance zone: $7.811 to $7.863 The $7.045 level is particularly important because it represents the recent 24-hour low. If buyers defend this area, INJ could attempt a recovery toward the moving average cluster. However, if selling continues and price loses this support, the previous swing low around $6.824 becomes an important downside reference. Another detail worth watching is volume. The chart shows approximately 120.20K volume, compared with MA5 at 86.86K and MA10 at 83.54K. This suggests increased activity around the latest move. My current observation: I'm not treating this sharp decline as an automatic buying opportunity. The market needs to show that buyers can defend support and reclaim important resistance levels. For now, needs a stronger response from buyers. The next 4-hour candles could be important in determining whether this is a temporary correction or the beginning of another bearish leg. Support defense, volume and a reclaim of the moving averages are what I'm watching next. $INJUSDT #IMPACTbyTrade
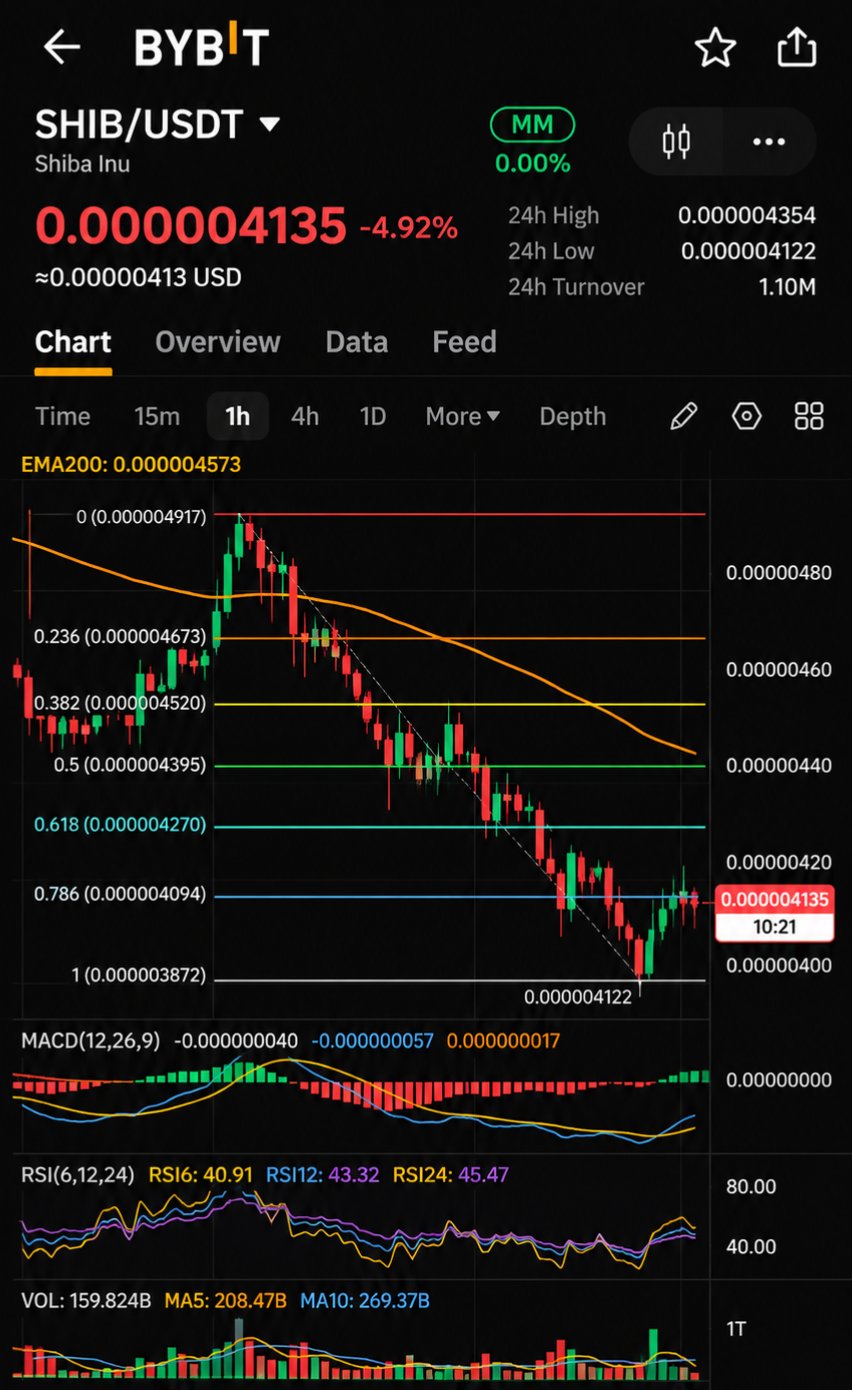
$SHIB 面臨拋壓,賣方正將價格推向關鍵支撐位! Shiba Inu 表現持續疲軟,最新的 4 小時圖表顯示,在出現任何實質性反彈之前,買方仍需付出更多努力。 $SHIB 目前交易價格約為 $0.000004135,過去 24 小時下跌約 4.92%。價格最近測試了 $0.000004122,使該點位成為我關注的焦點。 這個設置有趣之處在於更宏觀的圖表結構。 SHIB 一直在形成更低的高點和更低的低點,這表明賣方在近期的價格走勢中保持著主導權。 移動平均線也發出了謹慎的信號: • MA7:$0.000004208 • MA14:$0.000004251 • MA28:$0.000004336 這三條均線目前皆位於市場價格上方。這意味著 SHIB 需要更強的買盤力道來收復這些價位,以改善其短期結構。 以下是我正在觀察的重要點位: 支撐位:$0.000004122 第一阻力位:$0.000004208 下一個阻力位:$0.000004251 主要移動平均線阻力:$0.000004336 如果買方成功守住 $0.000004122,我們可能會看到嘗試向移動平均線集群反彈的情況。 然而,若明確跌破該支撐位,將會增加賣壓,並可能導致 SHIB 面臨進一步下行的風險。 另一個值得觀察的細節是交易量。根據顯示的市場數據,目前的 24 小時成交額約為 110 萬美元。我想觀察的是在反彈過程中,買盤參與度是否會增加,而不是僅依賴幾根綠色蠟燭。 我的市場觀察: 我還不會稱這為反轉。整體 4 小時結構仍然看跌,收復移動平均線將是重要的第一步。 SHIB 需要買方在支撐位展現實力。 $0.000004122 附近的下一次反應可能會告訴我們短期動能的去向。 $SHIBUSDT #IMPACTbyTrade

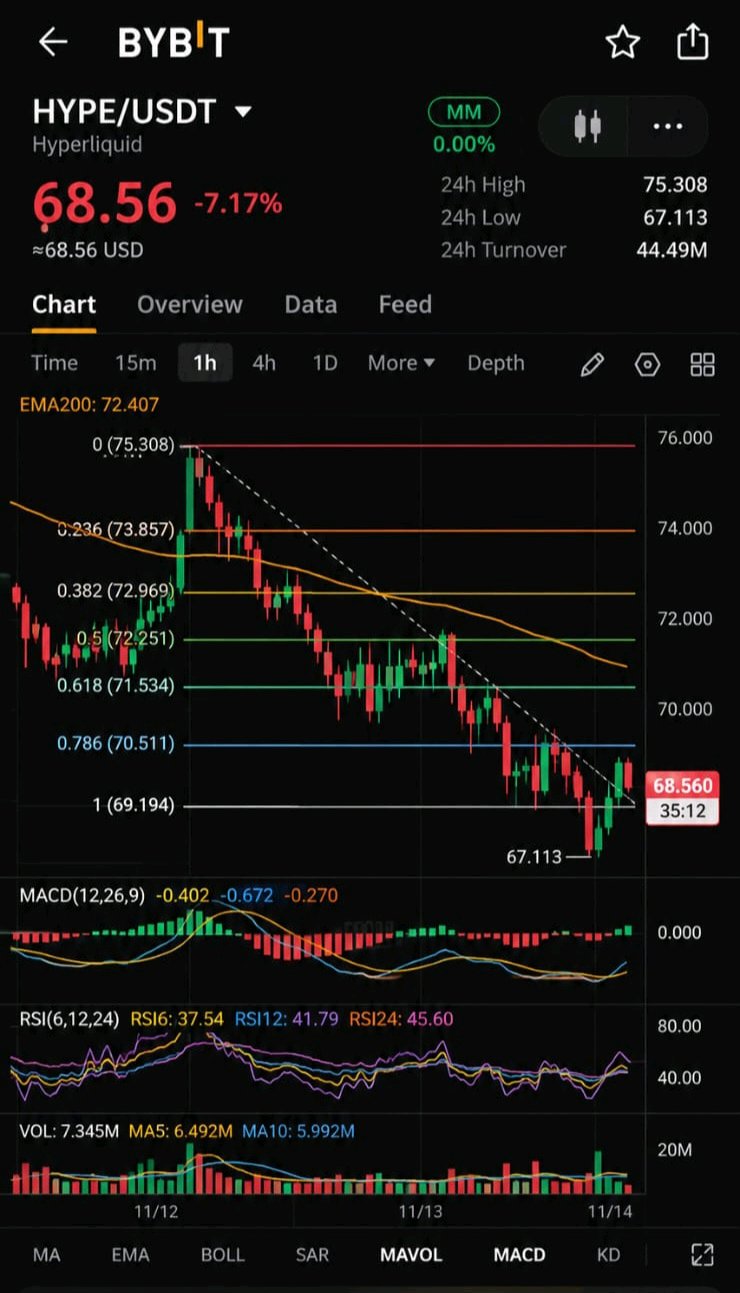
$HYPE 面臨賣壓,價格測試 67 美元支撐區。 我一直在觀察 Hyperliquid 的圖表,最新的 4 小時結構顯示買方仍難以重奪主導權。 $HYPE 目前交易價格約在 68.56 美元,過去 24 小時下跌約 7.17%。價格近期曾下探至 67.113 美元,隨後嘗試小幅反彈。然而,這波反彈仍需確認。 令我印象深刻的是移動平均線的位置。 目前的 4 小時移動平均線水平為: • MA7: 70.330 美元 • MA14: 71.053 美元 • MA28: 71.862 美元 價格目前運行在三條均線下方。這意味著短期動能依然疲軟,賣方仍佔據優勢。 67.11 美元是我關注的關鍵區域。 該點位近期成為本波走勢的最低點。如果買方能夠守住該價位並建立更強的動能,HYPE 可能嘗試反彈至 69.84 美元,隨後是 70.33 美元的阻力區。 然而,若價格持續跌破 67.11 美元,將會對圖表造成進一步壓力,並可能開啟下行的另一波空間。 還有一個重要細節:移動平均線仍位於當前價格上方,構成了買方需要克服的多重阻力區。 交易量也值得關注。近期的拋售伴隨著明顯的成交量,因此我想觀察在任何反彈嘗試中,買入量是否開始增加。 我目前的策略很簡單: 我不會將一根小陽線視為確認反轉。我希望看到 HYPE 收復重要的移動平均線,持穩於支撐位之上,並展現更強的買盤參與度。 Hyperliquid 仍然是一個值得關注的有趣生態系統,但其圖表目前需要更多的強度。 下一個重要的訊號將來自 HYPE 在 67.11 美元附近的反應,以及買方能否收復 70 美元區域。 目前而言,支撐位的防守與成交量的確認比短線反彈更為重要。 $HYPEUSDT #IMPACTbyTrade

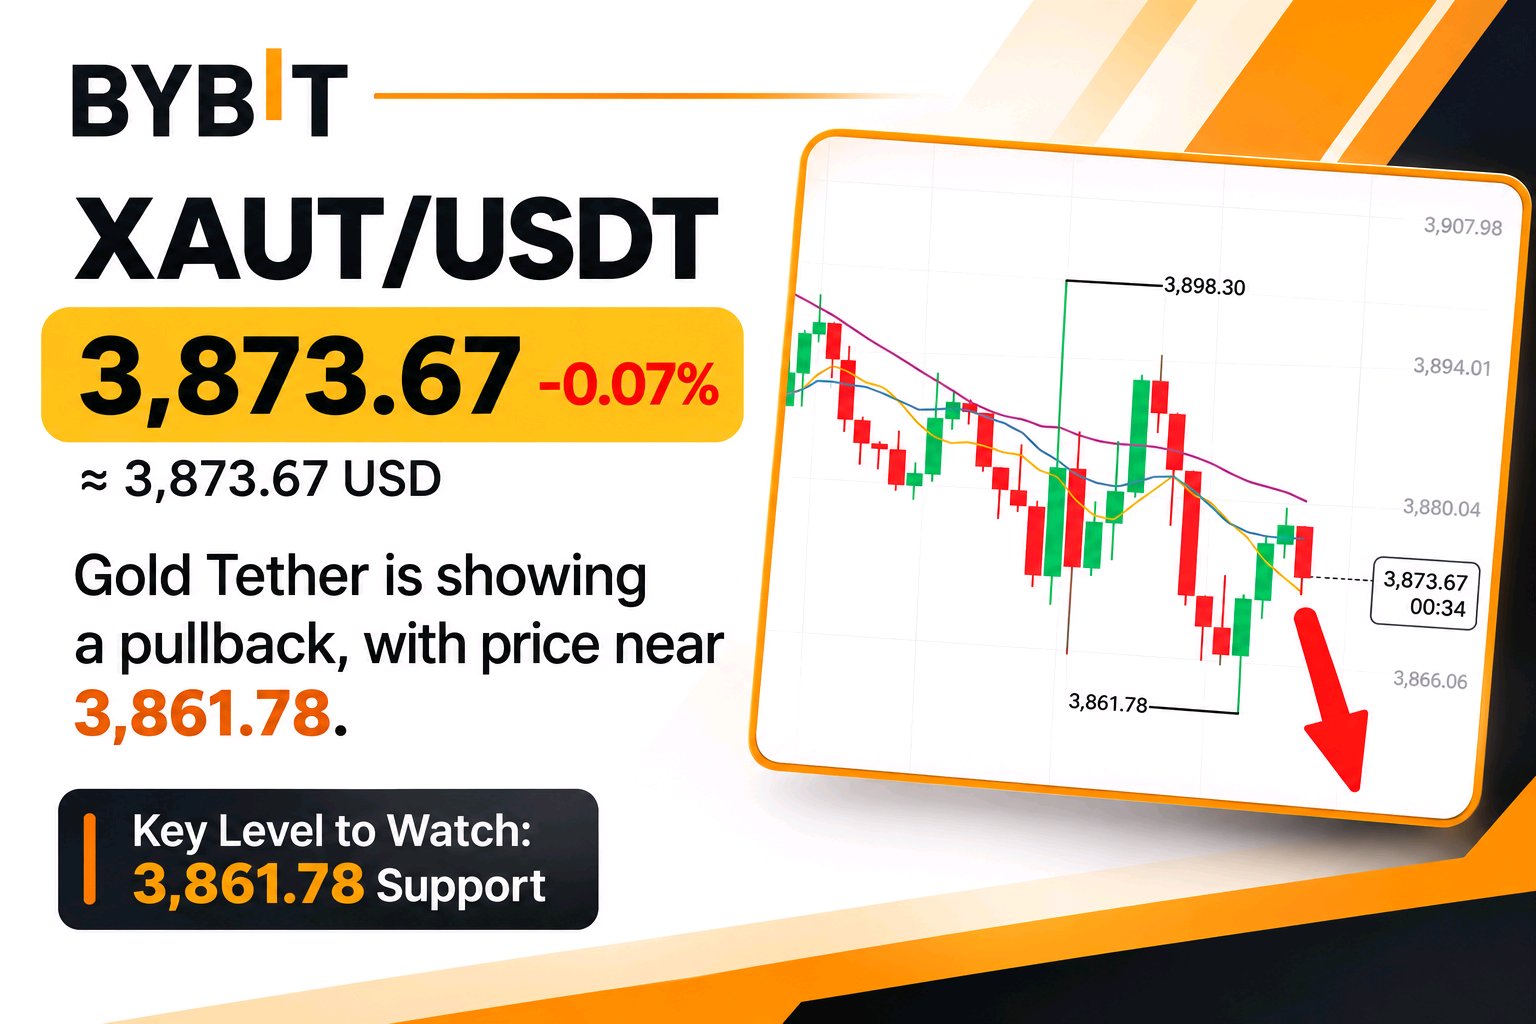
XAUT/USDT: Gold Faces Selling Pressure I'm watching XAUT closely. Gold is trading around $3,873.67, down 0.07%. The 15-minute chart shows sellers putting pressure on price after a recent bounce. Key level I'm watching is $3,861.78 support. A break below it could bring further downside pressure, while a recovery above the moving averages may improve momentum. For now, confirmation matters more than guessing the next move. $XAUTUSDT #WSOTShowYourAITradeToEarn10USDT #WSOT2026 #ShowMyRWATrades
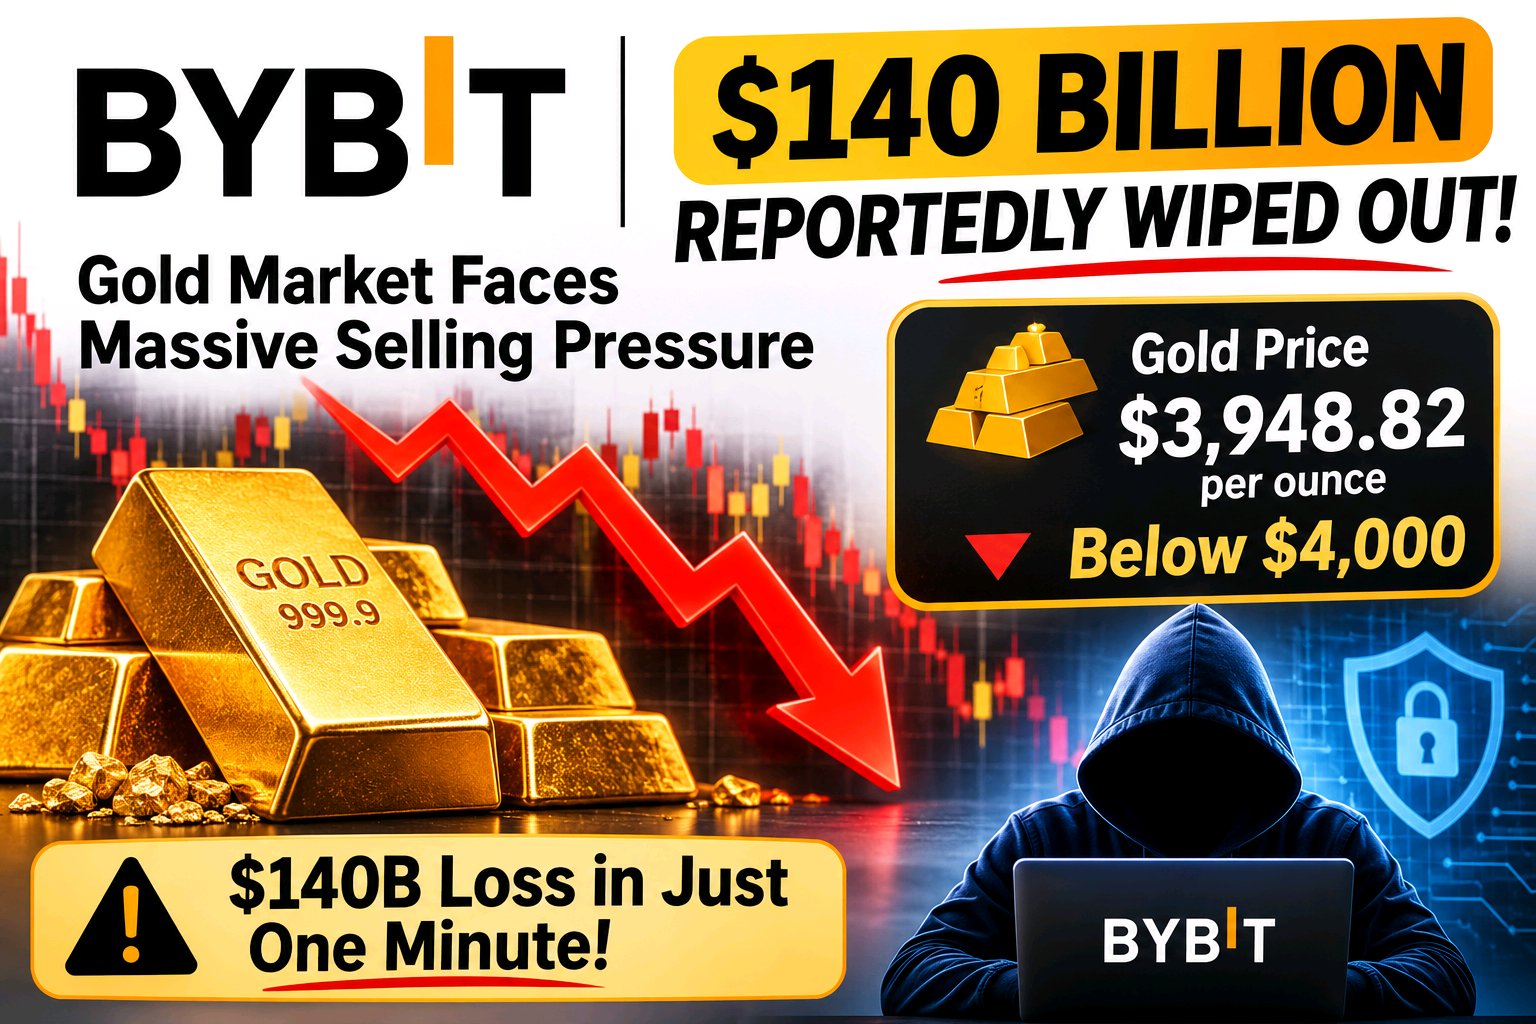
🚨 $140 BILLION REPORTEDLY WIPED OUT FROM GOLD MARKET VALUE IN JUST ONE MINUTE! Gold is facing intense selling pressure as prices fall below the important $4,000 per ounce level. According to Reuters, gold was trading around $3,948.82 on November 12, as a stronger US dollar and rising expectations of Federal Reserve rate hikes weighed on the precious metal. ⚠️ IMPORTANT: The reported $140 billion one-minute loss has not been independently verified. A decline in market value does not necessarily mean that the same amount of cash left the market. WHAT'S NEXT FOR GOLD? I'm watching whether buyers can defend current levels or if selling pressure continues. Will gold recover, or is more downside ahead? $XAUTUSDT #WSOT2026 #USInflationRunsHotAndRateHikeBetsRise #BitcoinHitsTwoMonthLowAfterUSMidterms
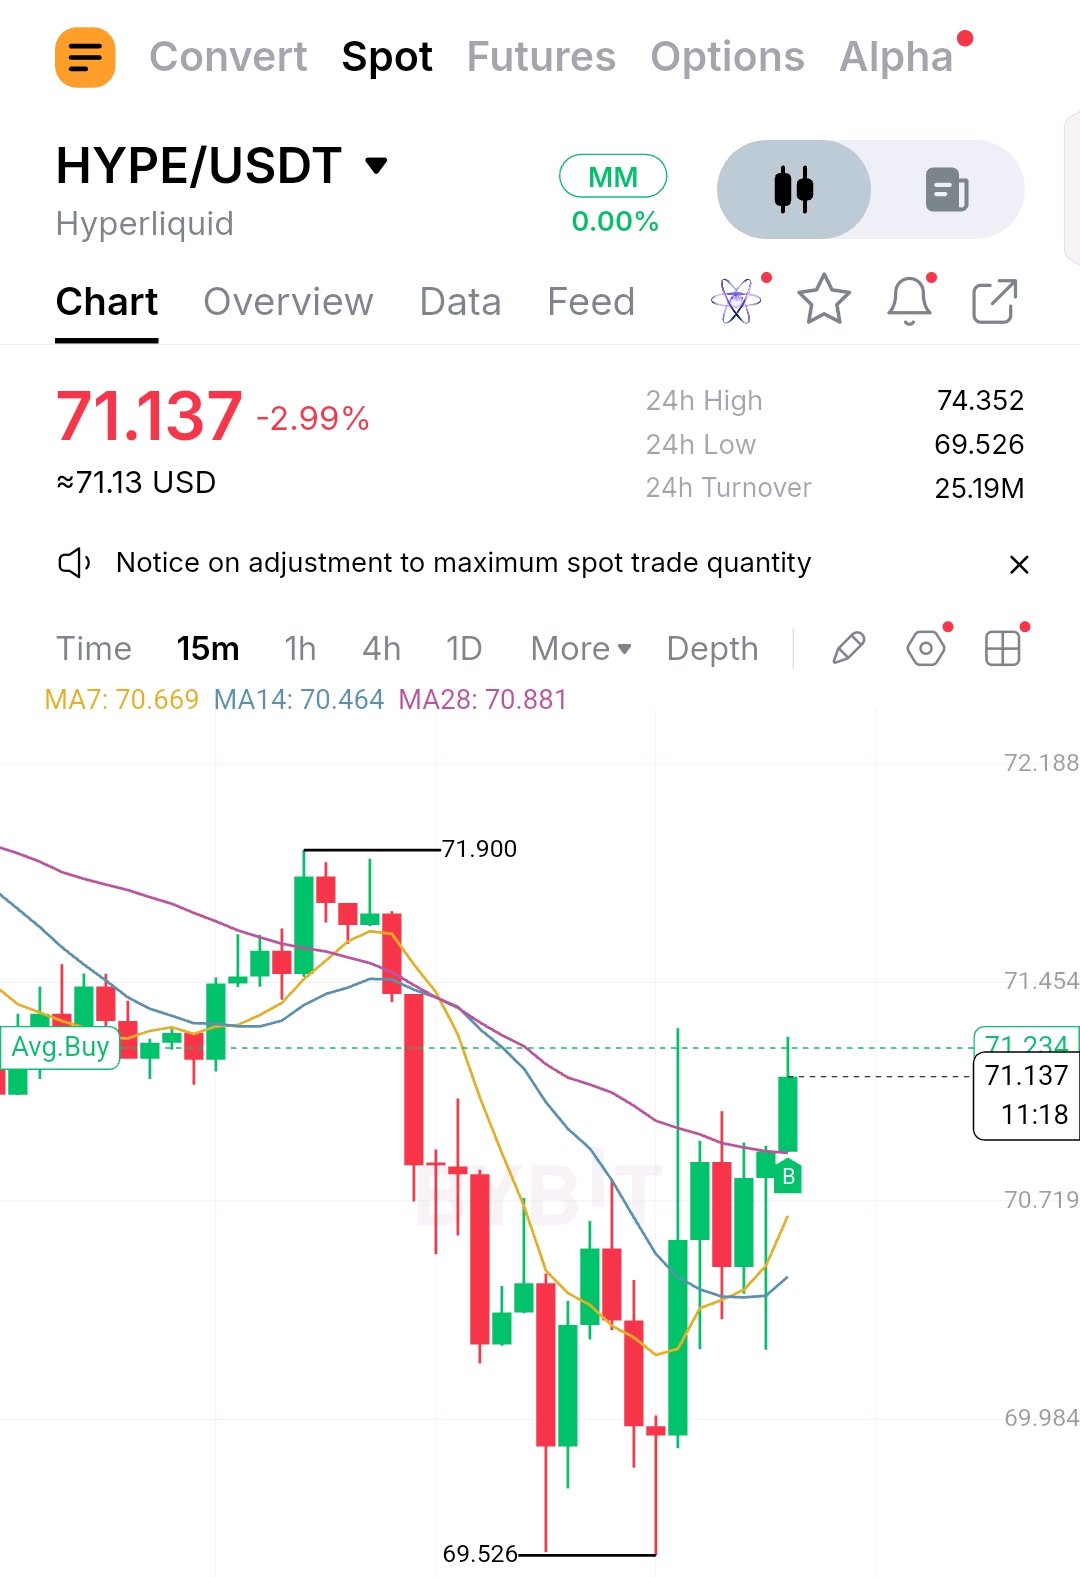
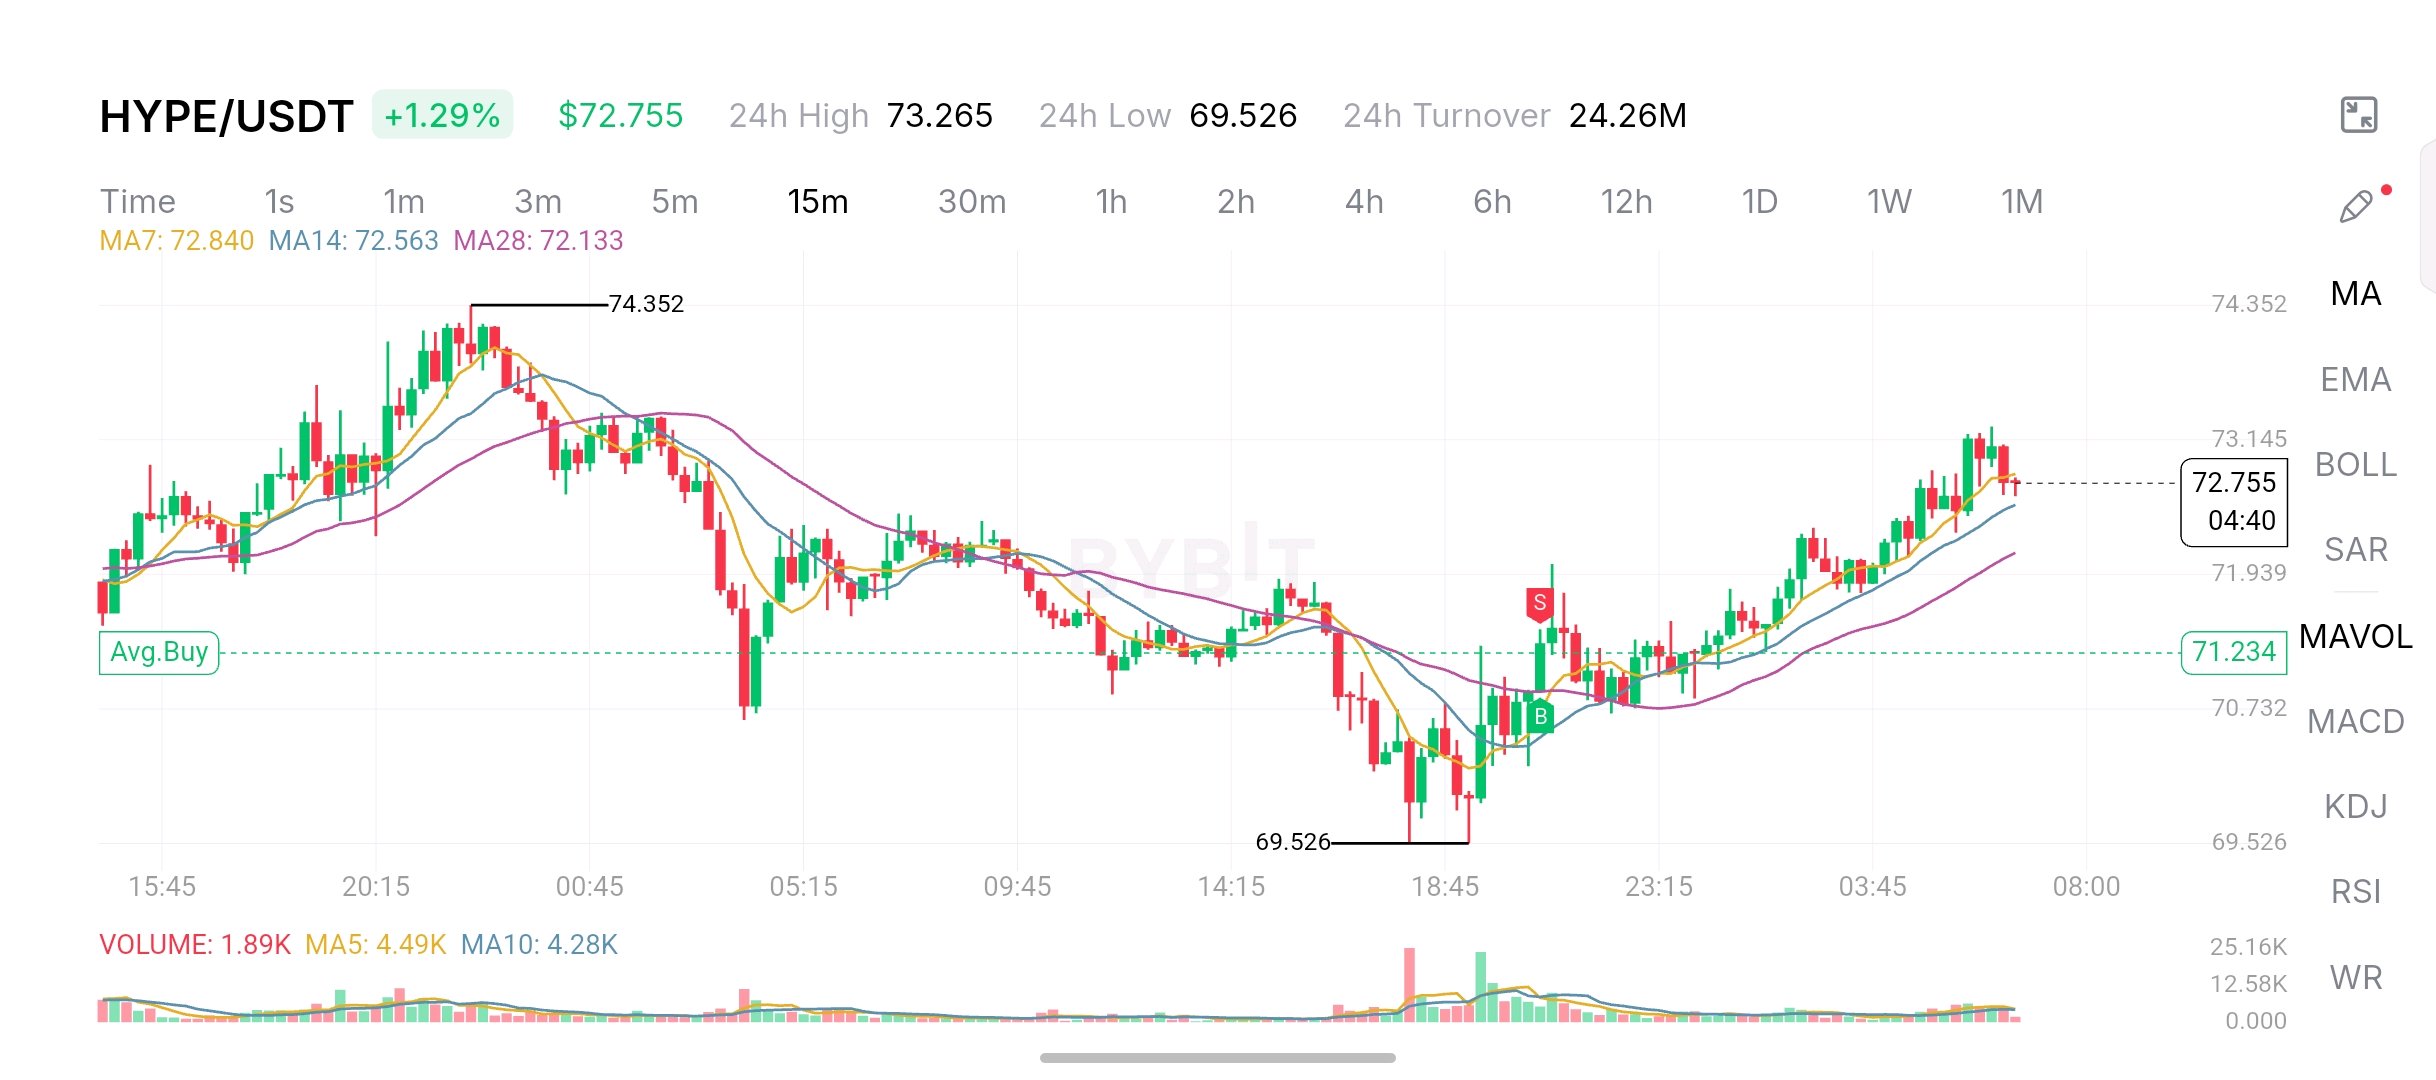
$HYPEUSDT 展現出強勁的復甦動能! HYPE/USDT 目前交易價格約為 $72.755,上漲 1.29%,在從 $69.526 的低點回升後持續走強。 在 15 分鐘線圖上,買方已將價格推回 MA14 ($72.563) 和 MA28 ($72.133) 之上。不過,價格在 $73.145 至 $73.265 附近面臨短期阻力。 以下是我關注的價位: • 阻力位:$73.265 • 下一個上行區域:$74.352 • 支撐位:$72.563 • 下方支撐位:$72.133 值得留意的一個細節是成交量。近期的反彈需要更強的買盤參與,才能確認進一步的上行空間。 我的看法:HYPE 已經恢復了短期強勢,但能否站穩移動平均線並突破阻力,將是維持動能的關鍵。 我會等待確認信號,而不會盲目追高。 #美國通膨升溫,升息押注升高 #WSOT2026 #比特幣在美國中期選舉後跌至兩個月低點 #ShowMyRWA
$BTC
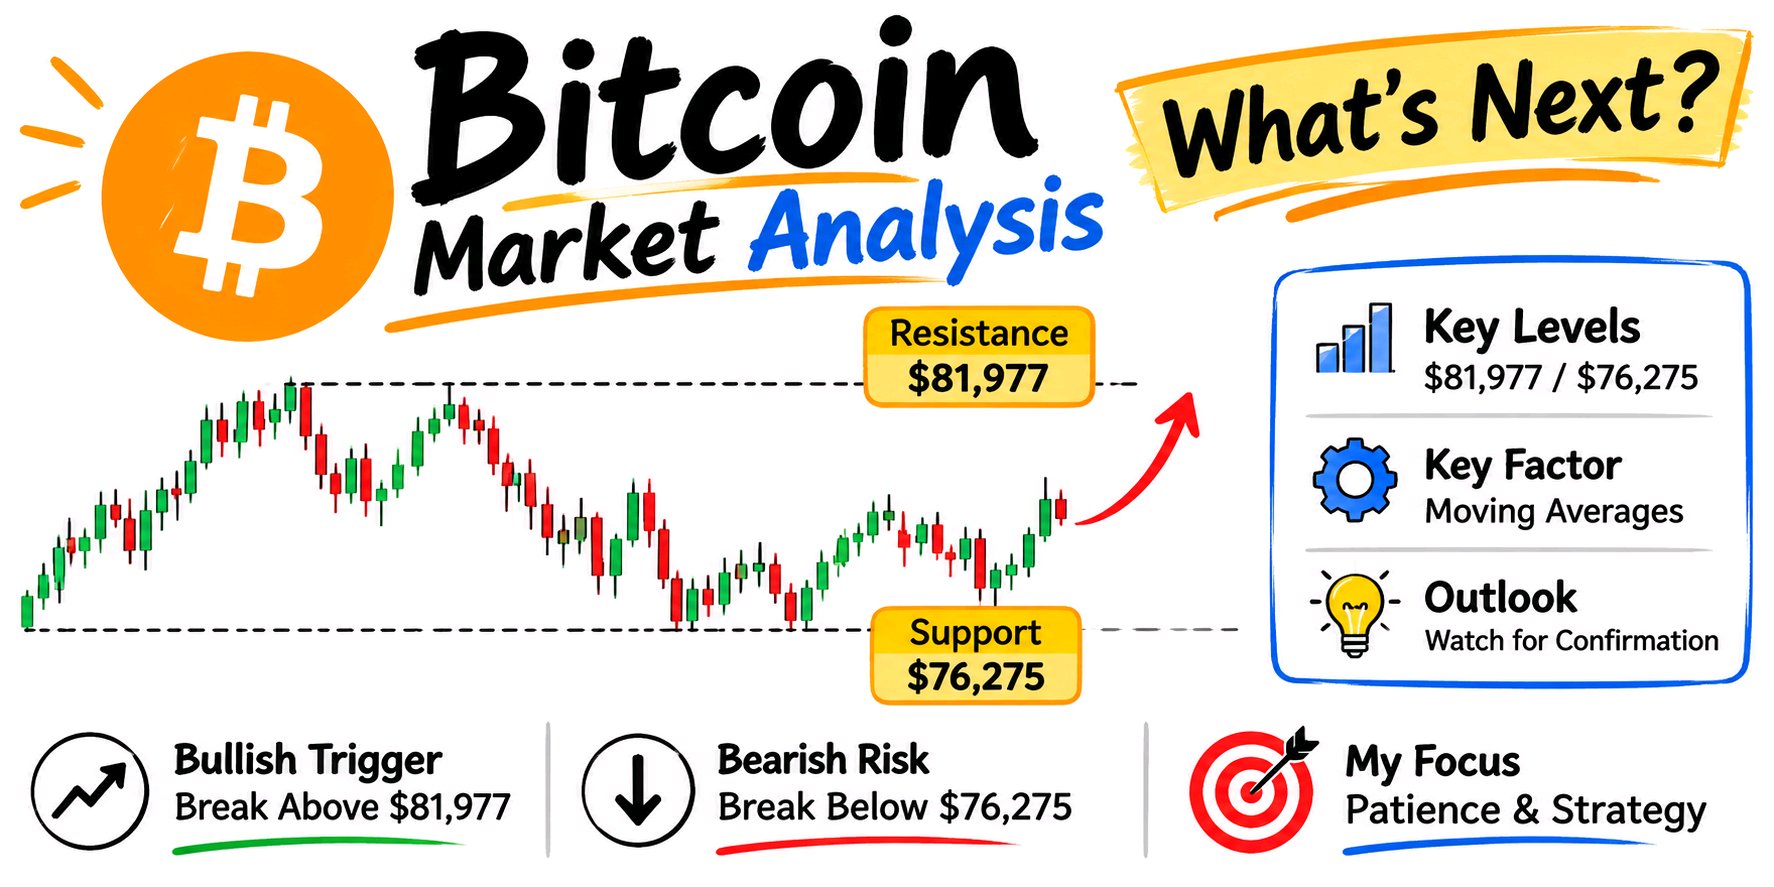
Bitcoin is more than just a price movement. It's a market worth understanding. I'm watching how trading volume, buyer activity and market sentiment shape BTC's next move. One thing I always focus on is confirmation rather than reacting to every price change. For me, successful trading starts with research, patience and understanding market structure. What's your focus right now: BTC accumulation or short-term trading? $BTCUSDC #WSOT2026 #USInflationRunsHotAndRateHikeBetsRise #AnthropicIPOTestsTheAIBoom
HYPE GOING ON TOP 📈
HYPE is showing signs of recovery after touching $69.526. Price is now around $71.137. I'm watching whether buyers can push through $71.45 and challenge $71.90. The recovery looks interesting, but confirmation matters more than a quick bounce. Watching volume closely. #HYPE #Bybit #WSOT2026 #USInflationRunsHotAndRateHikeBetsRise #BitcoinHitsTwoMonthLowAfterUSMidterms $HYPEUSDT
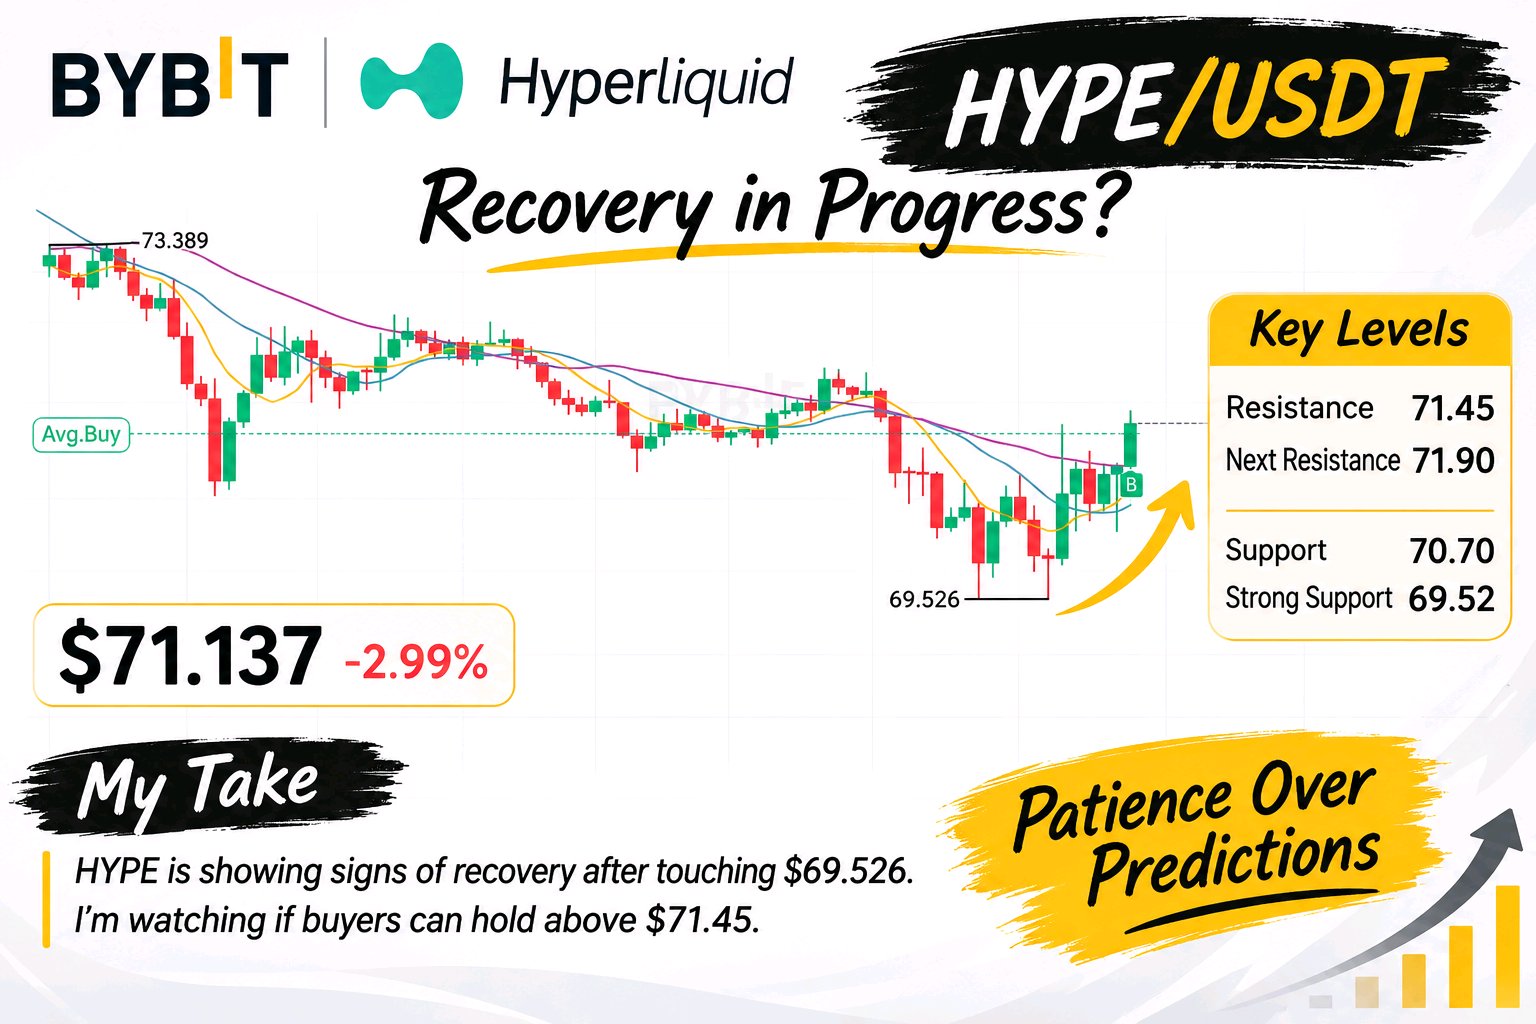
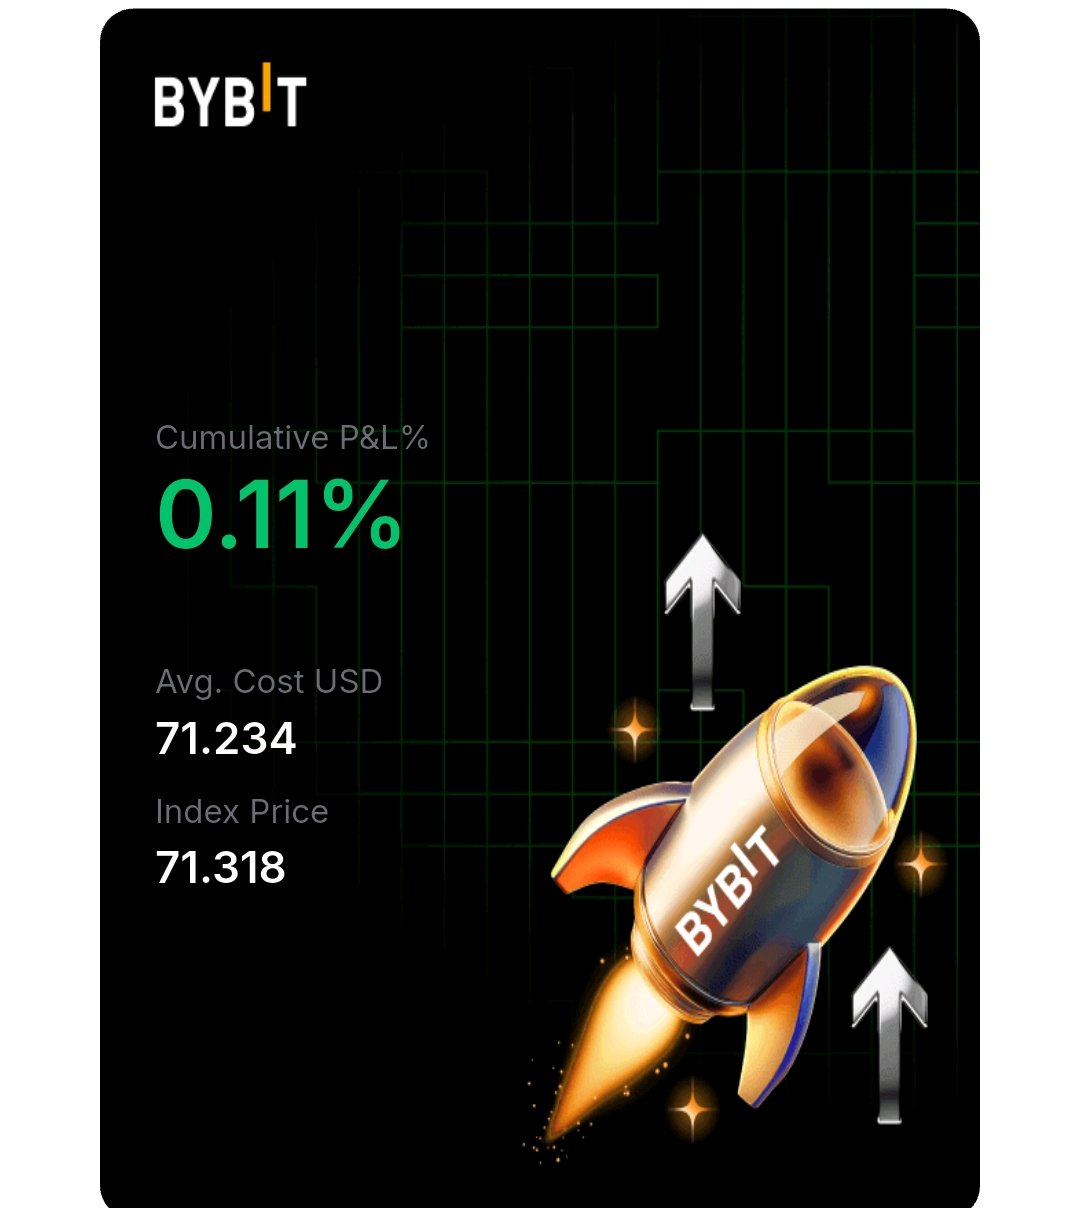
$HYPEUSDT 在觸及 $69.526 後出現復甦跡象。 目前價格在 $71.137 左右。我正在觀察買方能否突破 $71.45 並挑戰 $71.90。 這次復甦看起來很有趣,但確認行情比快速反彈更重要。 密切關注成交量。 $HYPERUSDT #WSOT2026 #ShowMyRWA