Asmodeus
13787Like9Shares751Fans424Follow
Ця сторінка, це просто сховище моїх думок. Якщо вам вони цікаві то підписуйтесь. З радістю підпишуся в відповідь. 😎
Ця сторінка, це просто сховище моїх думок. Якщо вам вони цікаві то підписуйтесь. З радістю підпишуся в відповідь. 😎
$HYPEUSDT bounced off $60. But have the sellers truly lost control? After a sharp drop, HYPE showed a strong buyer reaction. The price rose from $60.03 to the $67 area, but I'm not rushing to call this a reversal yet. The reason for my caution is the market structure. 98% OF LIQUIDATIONS WERE LONG In the last available daily snapshot, about $84.3 million in positions were liquidated on HYPE. Of that amount, approximately $82.7 million were LONGs. This is a massive purge of leveraged buyers who were trying to hold onto the previous upward move. At the same time, open interest on Hyperliquid decreased by 8.9% — down to about $1.3 billion. For me, this is an important signal: part of the speculative capital has already left the market. FUNDING SHOWS AN INTERESTING DIVERGENCE On Hyperliquid, the funding rate turned negative, while on Binance and Bybit it remained positive. Such a difference shows that trader positioning on different exchanges differs significantly. Negative funding can create conditions for SHORT covering, but it does not guarantee growth on its own. WHERE IS THE LIQUIDITY CONCENTRATED NOW? I highlight the following areas: - $68.75–69.10 — the immediate hurdle for buyers. - $71.75–72.40 — an important zone of resistance and potential SHORT covering. - $74.75 — the next recovery target. - $64.25–64.65 — a significant cluster of LONG liquidations. - $60.00–60.10 — the local bottom of the latest sell-off. The liquidity asymmetry is particularly interesting: according to the available liquidation map, there is significantly more potential LONG liquidation below the current price than there is SHORT liquidity immediately above. This means the risk of a re-drop remains. MY POSITION I see the first signs of stabilization, but I don't see a confirmed reversal yet. A return above $69 with the formation of a higher low will be the first argument in favor of the buyers. The next test is $72.40. If HYPE can consolidate above this area, the picture will become significantly more interesting. If the price loses $64.60, attention will shift back to the $60 low. The most interesting thing right now is not the HYPE bounce itself, but whether buyers can maintain it after the market has already liquidated most of the leveraged LONGs. #IMPACTbyTrade $BTCUSDT

$XRPUSDT after the $1.00 breakdown: Retest of $0.89–$0.95, 95% of longs wiped out, and a bounce from a two-year low 🎯⚡ Ripple ($XRP) has experienced a brutal sell-off wave, breaking through the $1.00 psychological barrier and dropping to a local low of $0.893 – $0.899 (the lowest level since November 2024). The coin is currently recovering in the $0.950 – $0.963 range (+3.96% for the current session after falling -15%…-18% over the week), while spot XRP ETFs are showing zero activity. The derivatives market is dominating the spot market (perp volumes are 4.4x higher), so price action is being driven exclusively by liquidation mechanics. Derivatives and Market Structure Analysis: Mass long squeeze: Over the last 24 hours, $12.58M in positions were forcibly closed in the $XRP futures market, with 95%–96% ($11.95M–$12.05M) coming from buyers. The leveraged crowd, which was buying the dip above $1.00, became the fuel for the dump. Open Interest (OI) and flows: Aggregate OI dropped by 4.32% to $2.25B (pulling back from the September peak of $4.1B), confirming forced deleveraging. At the same time, a synchronous daily capital outflow from both spot (-$15.3M…-$54.1M) and futures (-$142.9M) was recorded, and the Taker Buy/Sell Ratio dropped to 0.86 – 0.89 (market sells are prevailing). Psychology and funding: The Funding Rate has cooled down to a low +0.0044% – +0.0087% (~4.85% APR against the base 0.01%), completely removing the overheating. However, retail accounts are still holding a dangerous long bias — the Long/Short ratio by accounts is reaching 2.61 (and up to 4.04 on some platforms). Liquidity Map and Technical Zones: 📈 Resistance (short pools): After a sharp dump below the dollar, a dense trail of short-stops has formed above the price. The first technical resistance zone and area for local liquidity sweeping lies at the psychological $0.992 – $1.018 level (where the 50-day MA also sits). Securing above $1.02 will open the way for a cascading test of $1.061 – $1.081. 📉 Support (long pools): The nearest demand and liquidity zone below remains right under the local bottom at $0.893 – $0.910 (Fibonacci pivot level at $0.9097). If sellers push through $0.893, the next deep magnet lies all the way in the $0.80 – $0.82 area. Trading Context and Position: Current working zone: $0.895 – $1.018. My view: The $XRP market has gone through a painful capitulation of buyers (96% long liquidations over the day and cooling of funding to 0.0044%), but the excessive number of retail long accounts (a ratio of 2.61) is hindering a quick V-shaped reversal. As long as the price holds a base above the two-year low of $0.893 – $0.910, a technical bounce to test the broken dollar level ($1.00 – $1.02) from below looks prioritized; that is where the future trend will be decided. How are you playing $XRP below a dollar — are you picking it up from $0.90 support for a bounce to $1.02, or are you waiting for a return above $1.00 to enter? 💭 $IMPACTbyTrade $BTCUSDT

$ETHUSDT after the dump to $1,715: Long squeeze, whale skew at 4.72:1, and liquidity pools below $2,000 🎯⚡ Ethereum ($ETH) underwent a brutal overnight sell-off, piercing the $1,715 level (a low not seen since July) and recovering to consolidate in the $1,800 – $1,820 range. Over the week, the coin has lost 18.6%, and 25.4% over the month, finding itself under double pressure: outflows from spot ETFs (totaling $696M) and the sale of 7,500 ETH by the Ethereum Foundation. Derivatives and positioning analysis: Hard long squeeze: Following the break of the psychological $2,000 mark and the retest of $1,800, a wave of forced liquidations swept the market. Within the last 24-hour window, out of $151.5M in liquidations on $ETH, nearly 90% ($136.3M) came from buyers (the leaders in terms of liquidated volume are Binance with $51.98M and Hyperliquid with $25.33M). Divergence between whales and the crowd: While the overall order flow in the market remains in a fragile balance (49.49% longs vs. 50.51% shorts), big capital on top exchanges is aggressively buying the panic — the Whale Position Ratio on OKX hit 4.72:1 in favor of longs (compared to 1.18 by account count, which indicates a large average purchase ticket). Fundamental pressure: The queue to exit staking has grown to 269,951 ETH, which creates additional local spot supply during rebounds. Liquidation Heatmap: 📈 Resistance (short pools): After the steep drop below $1,900, a dense trail of short-stops has formed above. The first zone of resistance and local liquidity removal lies at $1,875 – $1,920, while the main psychological and liquidation magnet is located at the breached $2,000 – $2,031 level. 📉 Support (long pools): The nearest liquidity zone below remains beneath the overnight low in the $1,715 – $1,750 range. If this shelf is lost, the next global support and stop pool lies all the way down at the June bottom of $1,566 – $1,600. Trading context and position: Current operating zone: $1,750 – $1,920. My view: The $ETH market is oversold across all short- and medium-term timeframes, and 90% of yesterday’s leveraged longs have already been shaved off the market. Since big capital (Whale Position 4.72) has already started accumulating positions on the dump, and a liquidity vacuum has accumulated above $1,900–$2,000, as long as the base is held above $1,750 – $1,800, a technical rebound and short-covering towards $1,920 – $2,000 looks like the priority. How are you playing this $ETH dump — picking it up from $1,800 support for a bounce, or waiting for the spot ETF reaction at the week's open? 💭 #IMPACTbyTrade $BTCUSDT

$BTCUSDT has been falling for several weeks. What really broke the market? Bitcoin has lost the $70,000 mark, and the price has dropped to lows the market hasn't seen since August. But the most interesting part here is the reason for the decline. I don't see a single factor that could explain such a move. Several negative processes are compounding, and each one amplifies the next. 1. THE FED CHANGED MARKET SENTIMENT US inflation in October turned out to be higher than expected. This reinforced fears that the Federal Reserve might keep rates high for longer or even return to hiking them. For Bitcoin, this is important because of the cost of capital. When US bond yields rise and the dollar strengthens, investors become more cautious about risk assets. Cryptocurrencies have come under pressure alongside tech stocks. 2. INSTITUTIONAL MONEY HAS STOPPED SUPPORTING BTC US spot Bitcoin ETFs recorded an outflow of about $1.28 billion in one week — the worst weekly performance since June. Following this movement, the funds have even shifted to a negative net balance for 2026. For me, this is one of the most important signals: previously, ETFs were a stable source of demand, but now this channel has turned into an additional source of pressure. 3. SALES IN THE TECH SECTOR AMPLIFIED THE DECLINE Bitcoin is reacting more and more strongly to overall risk appetite. The drop in tech stocks, concerns about AI spending, and uncertainty surrounding Nvidia have heightened investor caution. An additional factor was the news about the future exclusion of Strategy from global MSCI indices. The company is one of the largest corporate holders of BTC, so this decision created another reason for risk reassessment. 4. DERIVATIVES TURNED THE CORRECTION INTO A CASCADE When BTC began to lose important price levels, a forced position closure mechanism was triggered. According to available estimates, over the course of the day, total crypto market liquidations exceeded $1.3 billion, with the bulk of it being LONG positions. A chain reaction occurred here: - The price drops. - LONG positions lose margin. - Exchanges forcibly close positions. - Sales put additional pressure on the price. - Subsequent support levels are also put at risk. That is exactly why the decline accelerated. The market began selling not just because of a shift in sentiment, but also due to forced deleveraging. 5. MARKET LIQUIDITY IS ALSO SHRINKING According to Glassnode analytics, the spot buyer flow has turned negative even amid elevated trading volumes. Simultaneously, ETFs recorded significant outflows, and short-term holders neared break-even. This means that during the decline, the market did not receive enough counter-demand to absorb the selling. When there are fewer buyers, even a relatively ordinary volume of sales can cause a disproportionately strong move. MY OBSERVATION I wouldn't call the current decline the result of a single panic-inducing news item. Macroeconomics changed expectations regarding the cost of money. ETFs stopped providing their previous level of demand. The tech sector added negativity, and derivatives accelerated the movement through mass liquidations. Now the main question is whether the spot buyer will return. Deep oversold conditions might create the conditions for a bounce, but without a recovery in demand, any growth risks remaining just a short-term reaction after a massive sell-off. For me, the most important signal for a future BTC recovery is not one strong green candle, but the return of capital to the spot market and the stabilization of ETF flows. $IMPACTbyTrade

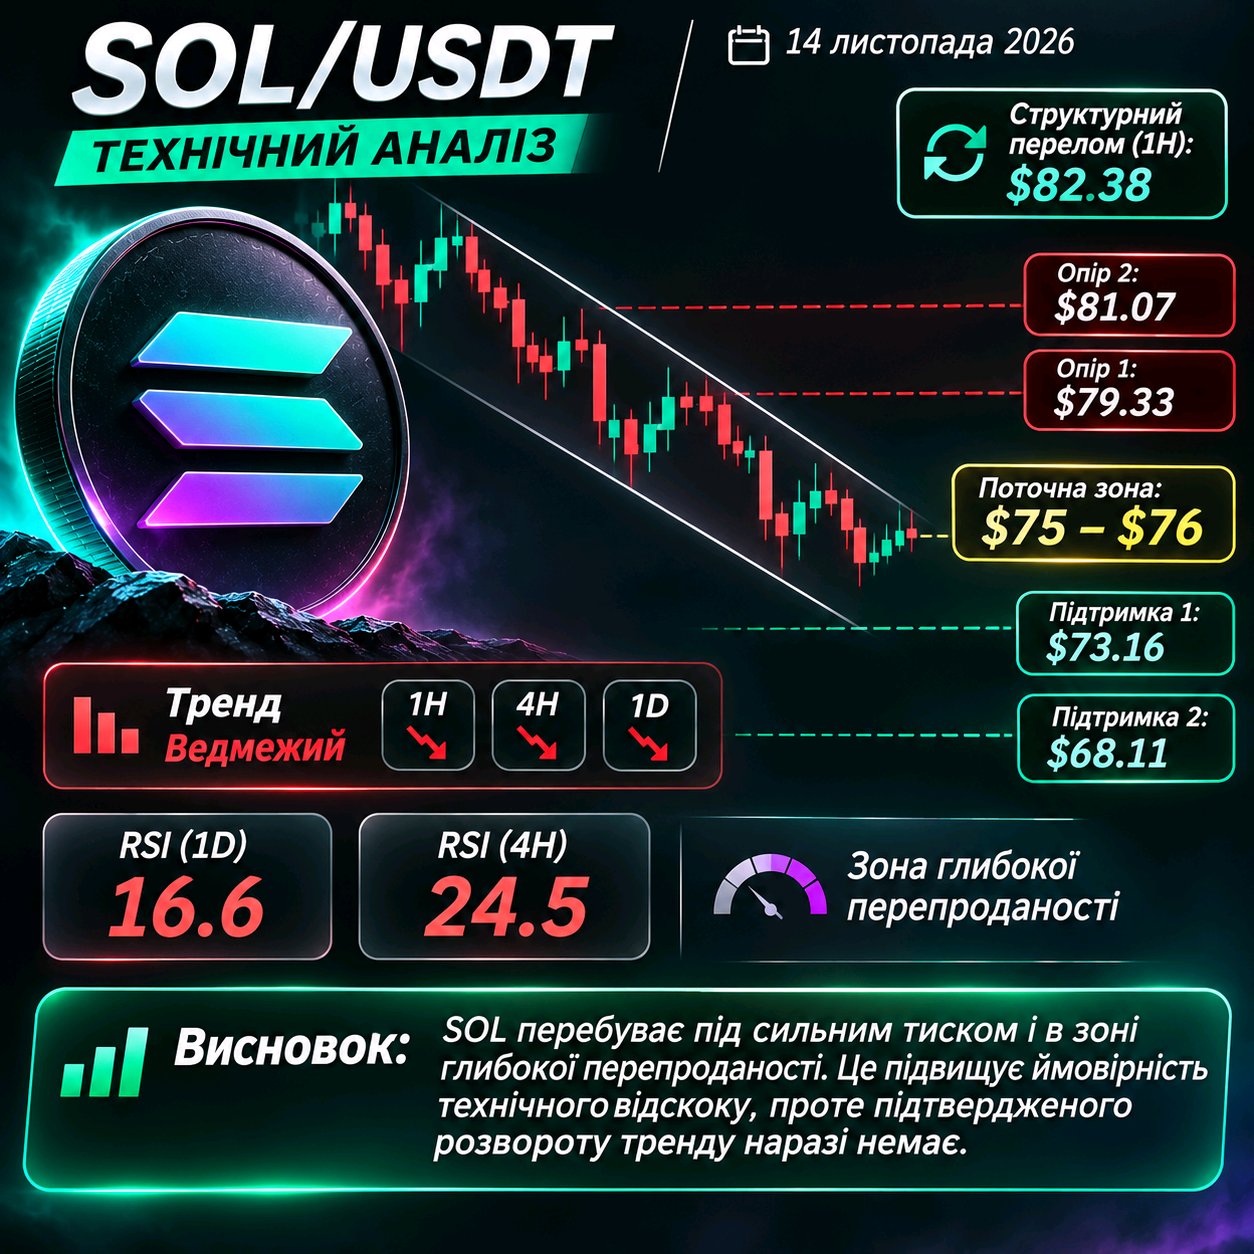
$SOLUSDT: The RSI has dropped to 16.6. Do the sellers have any steam left? There comes a moment when a decline starts to look exhausted, but that doesn't mean it's over yet. That is exactly the situation with Solana right now. On the latest available data, the RSI on the daily timeframe has dropped to 16.6, and on the 4H, it is down to 24.5. Both values are in deep oversold territory. But I am more interested in another detail: the SOL price remains below the main moving averages, and the downtrend structure has not yet been broken. WHERE IS THE DIRECTION BEING DECIDED RIGHT NOW? I am highlighting a few price areas: - $73.16–74.77 — the nearest zone where buyers need to demonstrate strength. - $79.33 — the first important hurdle for recovery. - $81.07–82.38 — the next resistance zone and a potential structural pivot point. - $68.11 — the lower support area if sellers increase the pressure again. WHAT ARE THE INDICATORS SHOWING? RSI signals significant market exhaustion. Such an oversold state can create conditions for a technical rebound. At the same time, the MACD remains in the negative zone, and the price is trading below the main averages. It is important to distinguish between two processes here: the weakening of sellers and the actual return of buyers. The former is already visible in the indicators, while the latter still requires confirmation from the price. TWO POSSIBLE DEVELOPMENTS If SOL holds the $73–75 area and forms a higher low, the next test will be a return to $79.33. If the support fails to hold, attention will shift to $70.94–68.11. In any case, BTC's reaction will remain an important factor for Solana. MY OBSERVATION I see an asset that is already heavily oversold but has not yet demonstrated a trend change. I am not convinced by the RSI below 20 alone. It is far more important to see if buyers can hold the next correction, form a higher low, and bring the price back above the nearest resistance levels. SOL has approached an area where a rebound could begin. But confirmation of a reversal must appear on the chart, not just in the indicators. #IMPACTbyTrade $BTCUSDT
Crypto Market Overview: Extreme Fear (19), a $1.4B–$1.6B liquidation cascade, and a 20x liquidity imbalance 🎯⚡ The cryptocurrency market is experiencing one of the largest deleveraging phases this quarter: total capitalization has dipped to $2.35T (-2.58% daily), and the Fear & Greed Index has plunged into the "Extreme Fear" zone — 19 points. The main macro trigger is the acceleration of US producer inflation (PPI rose to 6.5% year-on-year) and the increased probability of a 25 bps Fed rate hike in December to 89%, which triggered a sell-off in risk assets and outflows from spot ETFs. Snapshot of key assets ($BTC, $ETH, $SOL): $BTCUSDT: Broke through the $70,000 psychological barrier, falling to a 3-month low in the $67,100 – $68,900 range (a pullback from the recent $76K+). Bitcoin dominance holds near 60% — capital is fleeing from altcoins into the base asset or stablecoins. $ETHUSDT: Dipped to test the $2,000 – $2,002 round number (-3.4% daily and -32.6% year-to-date), absorbing about $120M in liquidations during the local dump. $SOLUSDT: Trading near $81.35 – $81.45 (-10% for the week) amid net outflows from spot Solana ETFs (-$1.92M in the last session). Analysis of derivatives and market mechanics: Massive leverage wipeout: At the peak of the dump, the total volume of forced closures in the market reached $1.40B – $1.62B daily (specifically, $622M was burned in just 4 hours during the breach of $70K for $BTC). About 90%–94% of all liquidations were on the buying side — the leveraged crowd trying to catch the bottom became fuel for the decline. Open Interest (OI) and positioning: Total market OI decreased by 3.83% (to $93.98B), while the daily derivatives trading volume jumped to $196.4B. The overall Long/Short ratio has leveled out in favor of sellers (48.6% longs vs. 51.4% shorts), which has relieved funding overheating. Liquidity Map (Heatmap): After the drop below $70K, an unprecedented imbalance formed — about $14B in short-liquidity has accumulated above the current price, against only $660M in longs below (a skew of over 20 times). The main magnets for a short-squeeze are the $72,000 (first rehabilitation barrier) and $76,500 – $77,000 levels. Below, there is only one unclosed cluster of long-stops under $67,000 (~$276M in intensity). Trading context and conclusions: The market has passed through a harsh retail capitulation: extreme fear (19), 90%+ wiped-out longs, and a 20x short-liquidity skew above create a classic foundation for a counter-trend bounce. The main condition for bulls across the market is holding above the $67,000 cluster. Returning above $72,000 will trigger a cascading close of shorts, which will pull (higher than $2,100) and oversold altcoins with it. How are you acting in conditions of extreme market fear — are you building spot positions on the dip, or waiting for a reaction from US stock indices? 💭 $IMPACTbyTrade

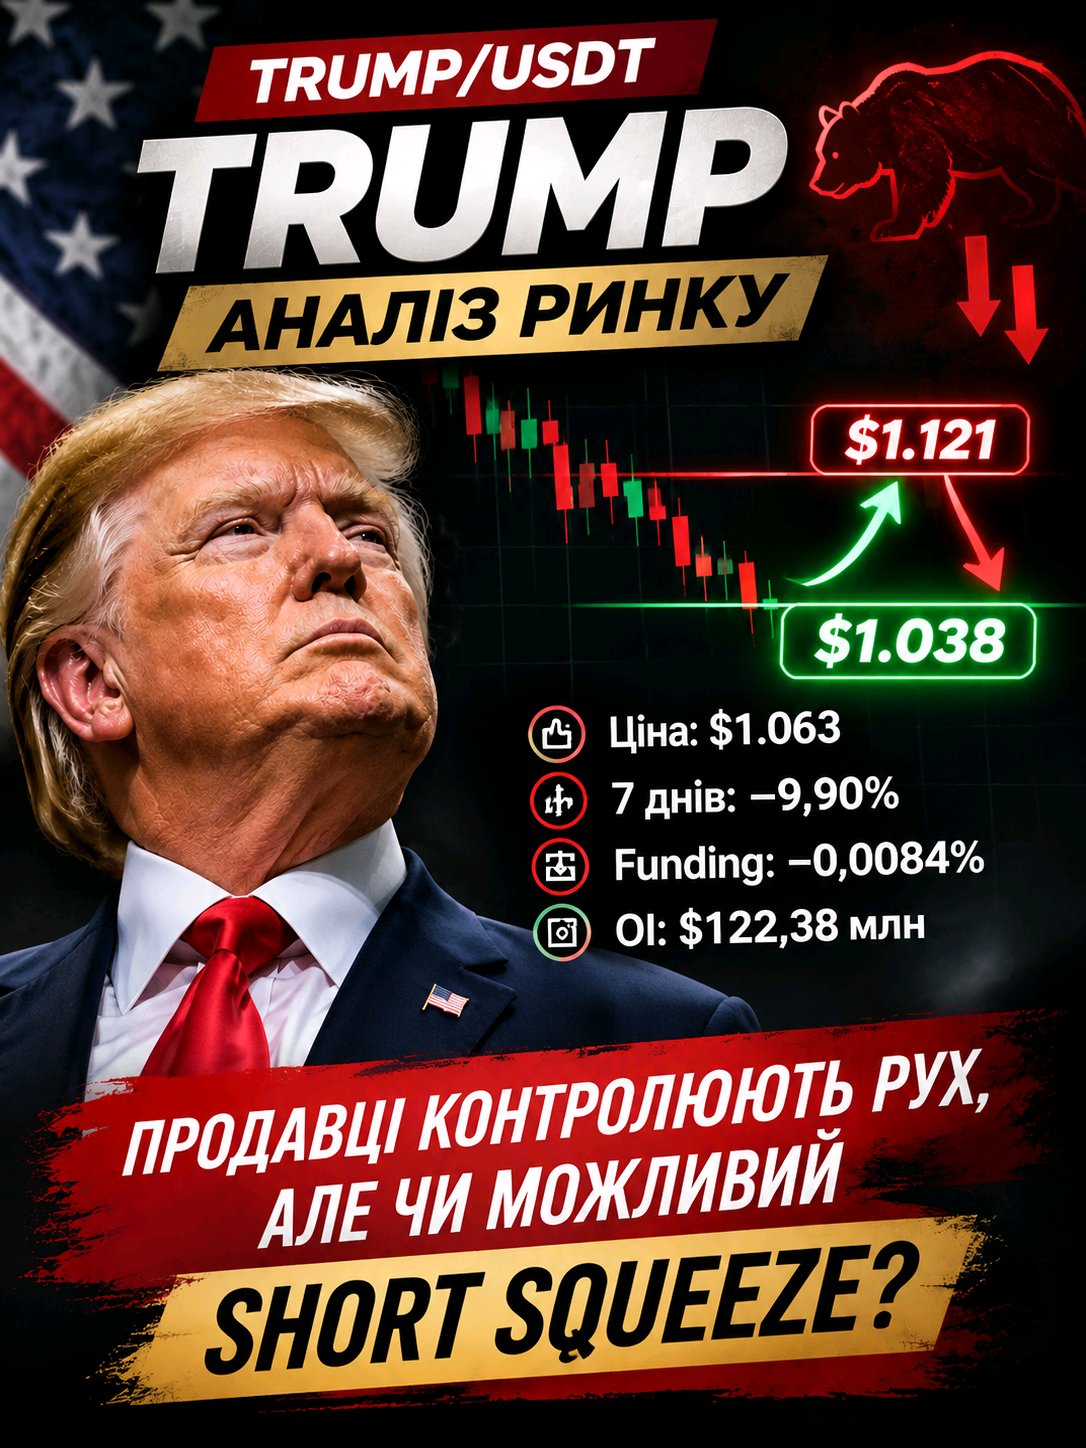
$TRUMPUSDT: sellers are in control of the movement, but the market might be setting up for a Short Squeeze TRUMP/USDT is looking weak right now. Over the last 7 days, the token has lost about 9.9%, and the daily decline is 1.12%. But I'm more interested in the behavior of futures market participants. What I see: - Price: $1.063 - Open Interest: $122.38M - Funding Rate: -0.0084% - 24h Low: $1.038 - 24h High: $1.121 Negative funding shows that shorts are paying longs. This indicates bearish positioning, but at the same time, it creates conditions for a potential Short Squeeze if buyers regain control. There's another factor — the upcoming token unlock. Additional supply could increase selling pressure, although some of this risk may have already been priced in. My trading logic: I'm highlighting two zones. 🔴 $1.038 — if support doesn't hold and a retest from below confirms buyer weakness, an argument for a Short will emerge. 🟢 $1.121 — returning above this level with volume confirmation could change the short-term picture and pave the way for a Short Squeeze. Right now, I see no point in rushing to enter. Negative funding in itself is not a signal to go long, just as a price drop doesn't guarantee a continuation of the short. The main question: will sellers be able to push through $1.038 while the market remains overloaded with short expectations? I will wait for reactions at these levels instead of trying to guess the next move. Market data is a snapshot as of November 14, 2026. The levels are points of interest to watch, not confirmed entry signals. #IMPACTbyTrade $BTCUSDT
$HYPEUSDT at the psychological $70.00 mark: 98% long wipeout, funding cooldown, and shorts clustering at $78.55 🎯⚡ Hyperliquid ($HYPE) is trading around $70.90 – $71.73 after testing a local low of $69.52 – $69.95 (a pullback of ~26–27% from the September high of $97.98). The price is under pressure from general macro negativity and net outflows from spot HYPE ETFs (-$1.70M in the last session), however, futures volume exceeds spot by 7.8x, and the derivatives order book has already gone through a rigorous leverage cleanse. Derivatives and Market Structure Analysis: Absolute Long Wipeout: Over the last 24 hours, $6.92M – $7.77M in positions have been forcibly closed on the $HYPE futures market, 98% of which were buyers. The crowd that tried to buy the dip above $73–$75 has been almost entirely wiped out of the market. Open Interest (OI) and Funding: Cumulative OI is holding at a high level of $3.20B – $3.27B (approx. 17.8%–18.0% of the $18.24B market cap), indicating that large capital remains in positions. At the same time, the Funding Rate has dropped to a baseline of +0.0064% – +0.0096% (and even went negative at -0.0070% on Bybit), completely removing overheating. Fundamental Buffer: The protocol continues to generate ~$75.4M in monthly fees, 99% of which are directed through the Assistance Fund for the direct buyback of $HYPE from the market, creating constant spot demand on dips. Liquidation Heatmap: 📈 Resistance (short pools): After the spill to $70, a massive imbalance formed above the price — the total pool of short liquidations above ($51.1M) significantly outweighs the lower clusters. The first rehabilitation barrier lies at $73.56, and the main clusters for a cascading short squeeze are burning at $77.47 (~$4.8M) and $78.55 – $79.37 (over $21.6M in liquidity for a +5% move). 📉 Support (long pools): The nearest cluster of long stops lies right under the round level at $69.81 – $70.55 (~$2.3M and ~$2.2M respectively). If sellers push through $69.50, the next liquidity zone will be activated on a further 5% decline (about $7.3M in stops). Trading Context and Position: Current working zone: $69.50 – $73.60. My view: The $HYPE market has gone through a painful capitulation of leveraged buyers (98% of longs wiped out in a day, negative funding on Bybit, and oversold on lower timeframes). While the price holds the base around the psychological $69.50 – $70.00 (above the 200-day moving average), the priority looks to be a return above $73.56 with a subsequent hunt for the large short liquidity pool in the $77.50 – $78.55 zone. How are you handling $HYPE near $70 — picking it up from current support for a bounce, or waiting for a breakout above $73.60 to enter? 💭 #IMPACTbyTrade $BTCUSDT

$BTCUSDT testing the 200-week moving average ($67,400–$68,300): $1.31B liquidation cascade and 20x liquidity skew to the upside 🎯⚡ Bitcoin ($BTC) is going through a rough deleveraging phase, having broken psychological support at $70,000 and trading in the $67,440 – $68,365 range (after a local wick down to $66,915). Price tested the strategic 200-week moving average (200W MA) against the backdrop of capital outflows from spot ETFs (-$284.1M on November 12 and -$41.9M on November 13), while the Fear & Greed Index has plummeted to 12 (Extreme Fear). Derivatives and Market Structure Analysis: Massive long wipeout: Over the last 24 hours, about $1.31B – $1.40B in positions were forcibly closed on the crypto market, with about 90% ($625.8M for BTC alone) coming from buyers. The leveraged crowd that was buying the dip above $70K has been completely shaken out. Open Interest (OI) and Funding: Total OI has dropped to $50.71B (Binance — $10.59B, CME — $7.16B), confirming a massive dumping of positions. The Funding Rate has crashed to almost zero — +0.0015% (~1.6% annualized), which indicates total cooling of the order book. Crowd Psychology: The overall Long/Short ratio by volume and positions has shifted toward sellers (48.2% longs vs 51.8% shorts), although retail accounts on some platforms are still trying to catch the bottom. Liquidation Heatmap: 📈 Resistance (short pools): After the spill below $70K, a massive imbalance formed above: the total volume of short liquidation above the price exceeds the lower pools by more than 20 times ($546M in the near range vs $282M below). The first magnet and rehabilitation zone for bulls is located at $72,000 – $74,000, and higher up is a large cascade at $76,000 – $77,000. 📉 Support (long pools): An unfilled tail of long stops remains below in the $67,000 zone (~$276M in liquidation intensity upon breakdown). Losing this shelf opens the path to a deep liquidity magnet at $64,530 (~$89.3M). Trading Context and Stance: Current operating zone: $67,000 – $72,000. My view: The market has gone through the capitulation of leveraged buyers — extreme fear (12), zero funding, and 90% of longs wiped out create classic conditions for a technical bounce. As long as the price holds the base above $67,000 and the 200-week MA, the priority scenario looks like a move for the massive short-liquidation pool in the $72,000 – $74,000 zone. A breakdown of $67,000 on high volume will invalidate this scenario and send the price to test $64.5K. How are you handling this $BTC dump — picking it up from the $67K–$68K zone for a bounce to $72K, or are you waiting for a reaction from the stock market and ETFs? 💭 #IMPACTbyTrade

The crypto market is losing liquidity. Liquidations have already exceeded $1.3 billion — but have we seen the bottom? Today's crypto market drop has several causes, and each one reinforces the others. BTC has dropped below $70,000, ETH has lost the $2,000 mark, and the majority of altcoins have come under pressure from sellers. But I am most interested in the situation in the derivatives market. WHAT IS HAPPENING WITH LIQUIDITY? According to available data for November 13, the total volume of liquidations has exceeded $1.3 billion. The main blow fell on LONG positions. In BTC, buyer liquidations accounted for approximately $753 million out of a total volume of $779 million. This shows how many traders were positioned for continued growth before the sharp downward move. At the same time, funding has turned negative. Some of the excessive optimism has already vanished, but this does not yet mean that sellers have lost control. WHY DID THE FALL GO BEYOND DERIVATIVES? I identify three additional factors: - BTC ETF: an outflow of about $1.44 billion over five trading sessions weakened institutional demand. - ETH ETF: an outflow of about $695.9 million during the first eight sessions of November. - Stablecoins: a supply reduction of approximately $14.2 billion over 30 days indicates a decrease in available liquidity in the crypto ecosystem. As a result, the market faced both a reduction in demand and the forced closing of leveraged positions simultaneously. WHERE DO I SEE INTERESTING SIGNALS? Against the backdrop of the general decline, individual assets are behaving differently. HYPE showed relative resilience, while BNB, SOL, and ZEC remained under pressure. XRP, in the available snapshot, also looked more resilient than BTC and ETH. For me, this is an important observation: during a general sell-off, a difference begins to emerge between assets that are simply falling with the market and those where relative demand is being maintained. MY POSITION: I would not yet call the current drop the final capitulation. Yes, a significant portion of LONG positions has already been liquidated. Yes, funding has cooled down. But ETF outflows and liquidity contraction remain serious obstacles to recovery. My main criterion for a sentiment shift is the return of spot demand. I want to see that growth is supported by real buying, not just by closing SHORT positions. The market has already punished those who believed too early in continued growth. Now it will be interesting to see if buyers appear who are ready to support the price without excessive leverage. #IMPACTbyTrade $BTCUSDT $ETHUSDT

$BNBUSDT at the wedge squeeze near $672–$680: 95% of longs wiped out and a divergence between retail and "whales" 🎯⚡ BNB ($BNB) is consolidating in the $672 – $680 range (holding 4th place by market cap at ~$88.8B–$90.2B), trading within a descending wedge after pulling back from the $704–$717 resistance zone. Despite the coin holding up better than most altcoins, the derivatives market is currently fully controlling short-term movements — futures volume is 5.2x higher than spot. Technical picture and indicators: Chart structure: A series of lower highs ($759 → $723 → $698) is forming on the daily timeframe. The price has consolidated below the 20-day and 50-day SMAs ($708–$720) and broken below the lower Bollinger Band ($682.7), but it is still holding above the strategic 200-day SMA ($657). Momentum (RSI and MACD): The daily Relative Strength Index (14-day RSI) has dropped to 37–39 — a zone of weakness, but not yet critical oversold territory (below 30), which leaves room for a final dip before a reversal. The MACD remains in the bearish zone below the signal line. Derivatives analysis and positioning: Longs clearing: Over the last 24 hours, over 95% of the total liquidation volume in the $BNB derivatives market came from buyers. Leveraged buyers trying to catch the bounce from $685–$690 served as fuel for the decline. Open Interest (OI) and Funding: Total OI has dropped to $955M – $1.09B (-15.5% monthly), confirming that weak hands are exiting (deleveraging) rather than aggressive new short positioning. The Funding Rate has cooled to a baseline of +0.0026% – +0.0089%, completely removing the overheating. Crowd divergence: The overall Long/Short ratio by account has shifted to short (0.79 – 0.84), but on Binance itself, retail traders are stubbornly holding a huge long bias — 72.9% of accounts are in long positions (a 2.69 ratio). Historically, readings above 65% on Binance often serve as a contrarian signal for local downward pressure. Liquidation Heatmap: 📈 Resistance (short pools): Due to low leverage on $BNB, clusters are forming close to the price. The nearest concentration of short stops is burning at $696.90 – $698.56 (~$1.25M+ total). A breakout of the psychological $700 level will activate a cascade to $702 – $712 (~$4M–$6M in liquidations), and with a +5% impulse to $722.60, $7.7M of shorts will be taken out. 📉 Support (long pools): The nearest local magnet for sellers lies at $671.20 – $675.10 (~$1.1M+ long stops). In case of a breach of the key shelf at $668–$671, the cascade will pull the price down to the structural support at $653.80 – $657.80 (where ~$7.5M of long liquidity is concentrated, along with the 200-day SMA). Trading context and position: Current working zone: $668 – $698. My outlook: $BNB is in a decision-making zone near the lower boundary of the corridor. The overload of retail longs on Binance (72.9%) increases the risk of a final stop-run into the $668 – $671 zone (or a retest of the 200-day SMA near $657). However, since funding has cooled and 95% of yesterday's longs have already been wiped out, a 4H candle return and consolidation above $695 – $698 will be a clear trigger for a short squeeze to $712–$722. How are you working with $BNB in this wedge — waiting for a final stab below $670 to enter, or only entering after a $698 breakout? 💭 $IMPACTbyTrade $BTCUSDT

$HYPEUSDT: The fundamentals support the token, but the chart doesn't support optimism yet! I'm interested in a contradiction in HYPE right now: the token buyback and burn mechanism continues to reduce supply, but there is no convincing return of buyers visible on the chart yet. According to the latest technical snapshot, the RSI on the daily timeframe was around 34, and on the 4H it was around 39. The MACD remained in the negative zone. This shows that sellers still retain the advantage. At the same time, the RSI has already approached the area where the market might try to stabilize. WHERE IS THE MAIN BATTLE RIGHT NOW? I am paying attention to two areas: - $69.85–70.30 — the zone where it is important to evaluate the buyers' reaction. - $72.08–72.45 — the area where returning above it could be the first argument in favor of a recovery. Above that, there is still one more barrier: the $72.88–73.74 region. But simply touching these values confirms nothing. What will matter is the price reaction, volumes, and the formation of new local lows. FUNDAMENTAL FACTOR: HYPE has a token buyback and burn mechanism. The cumulative volume of burned tokens, according to reports from November 12, has exceeded 50.7 million HYPE. This is a factor worth considering when evaluating tokenomics. However, supply reduction does not mean an automatic price increase: demand, liquidity, and the general state of the market remain decisive. MY POSITION: I don't see sufficient grounds to call the current movement a reversal yet. To change my assessment, I want to see HYPE return above the nearest resistance zone, an increase in volumes, and the formation of a higher low on the 4H timeframe. If this doesn't happen, the fundamental story of the buyback and burn will remain a separate positive factor against a weak price structure. HYPE has an argument in favor of long-term tokenomics right now. But the short-term direction still needs to be confirmed by the market itself. #IMPACTbyTrade $BTCUSDT

$ETHUSDT has entered a deeply oversold zone. Is this enough for a recovery? In the current situation, Ethereum is drawing attention with its RSI metrics. In the latest available snapshot, the daily value was 25.3, and on the 4H, it was around 28. Such indicators point to strong selling pressure and an elevated oversold state for the asset. But there is another side to the picture. The price remains below major moving averages, and the MACD continues to reflect negative momentum. In other words, technical indicators do not yet provide sufficient grounds to talk about a change in market trend. WHAT DOES THE CURRENT SITUATION SHOW? I am focusing on three points: - RSI is at low values — selling pressure has been significant. - MACD remains in the negative zone — downward momentum is still present. - Price is below major moving averages — the market structure is still weak. MY OBSERVATION Overselling can precede a technical rebound, but it does not in itself confirm that the decline is over. To change my assessment of the situation, I want to see how the price behaves after the next attempt at recovery. It is especially important whether ETH can form a higher low and return to an upward structure. So far, the indicators show market exhaustion, but there is no confirmation of a trend reversal. I wonder what will appear first: the first signs of structural recovery or a new wave of selling pressure? #IMPACTbyTrade $BTCUSDT

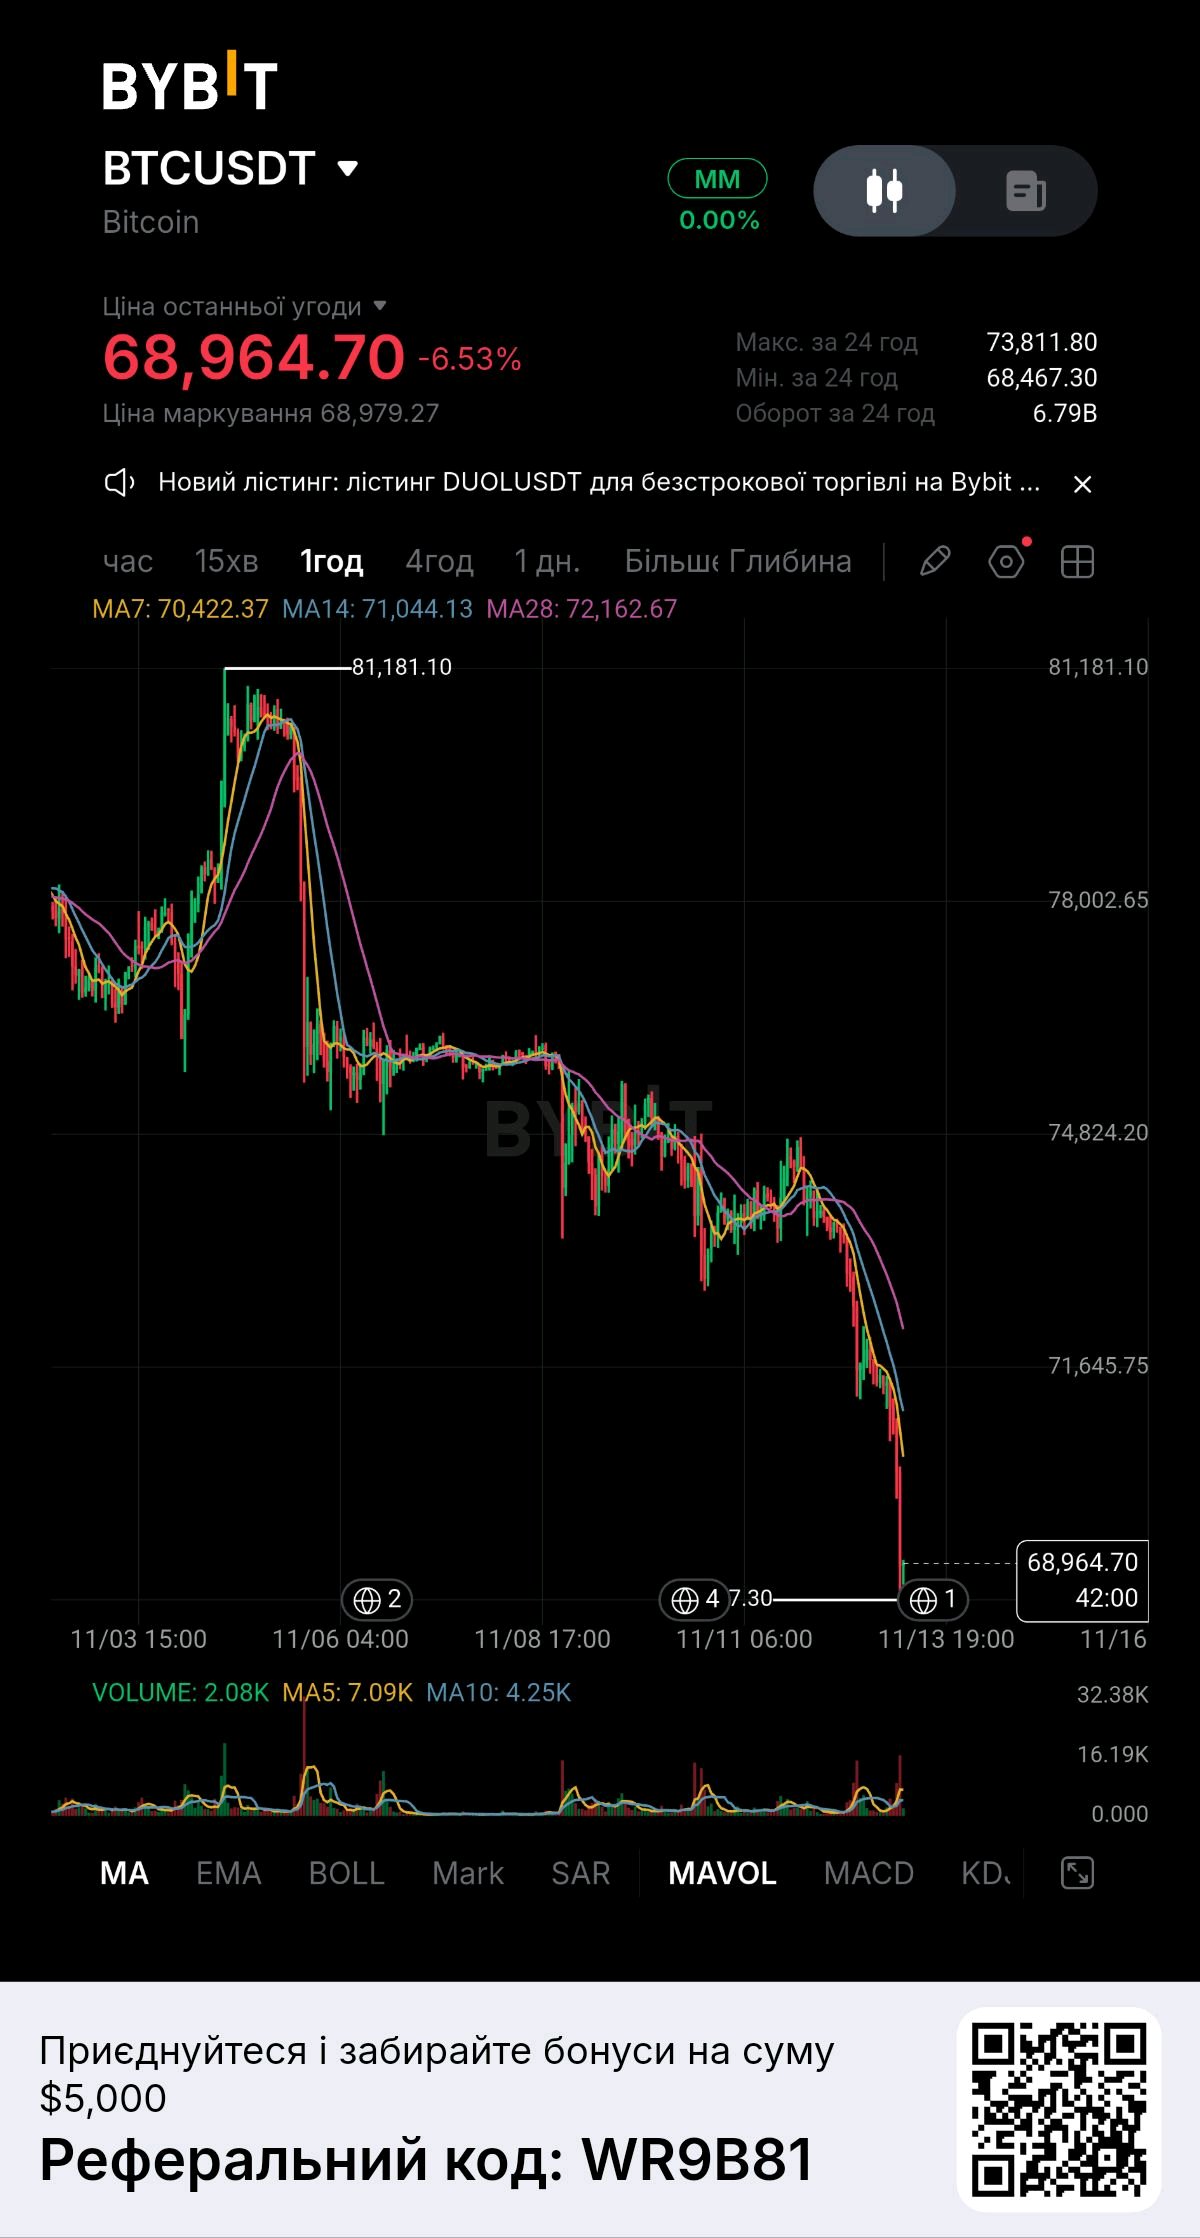
$BTCUSDT below $70,000: what does the structure of the drop reveal? Bitcoin has fallen to $68,964, losing 6.53% over the past 24 hours. On the hourly chart, it is clearly visible how sellers gradually increased pressure, and the final impulse accelerated the decline to $68,467. The most interesting thing right now is the positioning of the moving averages: - MA7 — $70,422 - MA14 — $71,044 - MA28 — $72,163 The price is below all three indicators. This sequence reflects the sellers' dominance on the short-term timeframe. Where is the market's attention focused? $68,467 — the local low of the last 24 hours. The $68,000 psychological level is located nearby. If the decline continues, the next area of technical interest could be $66,500–$67,000. On the other hand, a return above $70,422 would be the first noticeable improvement in the short-term structure. The next targets are $71,044 and $72,163. What interests me the most? The last impulse was accompanied by an increase in trading volume. This indicates an intensification of sellers, but it does not, by itself, prove that the market has reached a local bottom. After such a rapid decline, it is important to distinguish between two phenomena: a technical bounce and a genuine trend reversal. For the latter, a sustained return above the nearest moving averages and the formation of a new structure of highs and lows are required. My conclusion: BTC is currently showing distinct short-term weakness. But the next reaction near $68,467 may provide more information about the state of the buyers than the drop itself. #IMPACTbyTrade

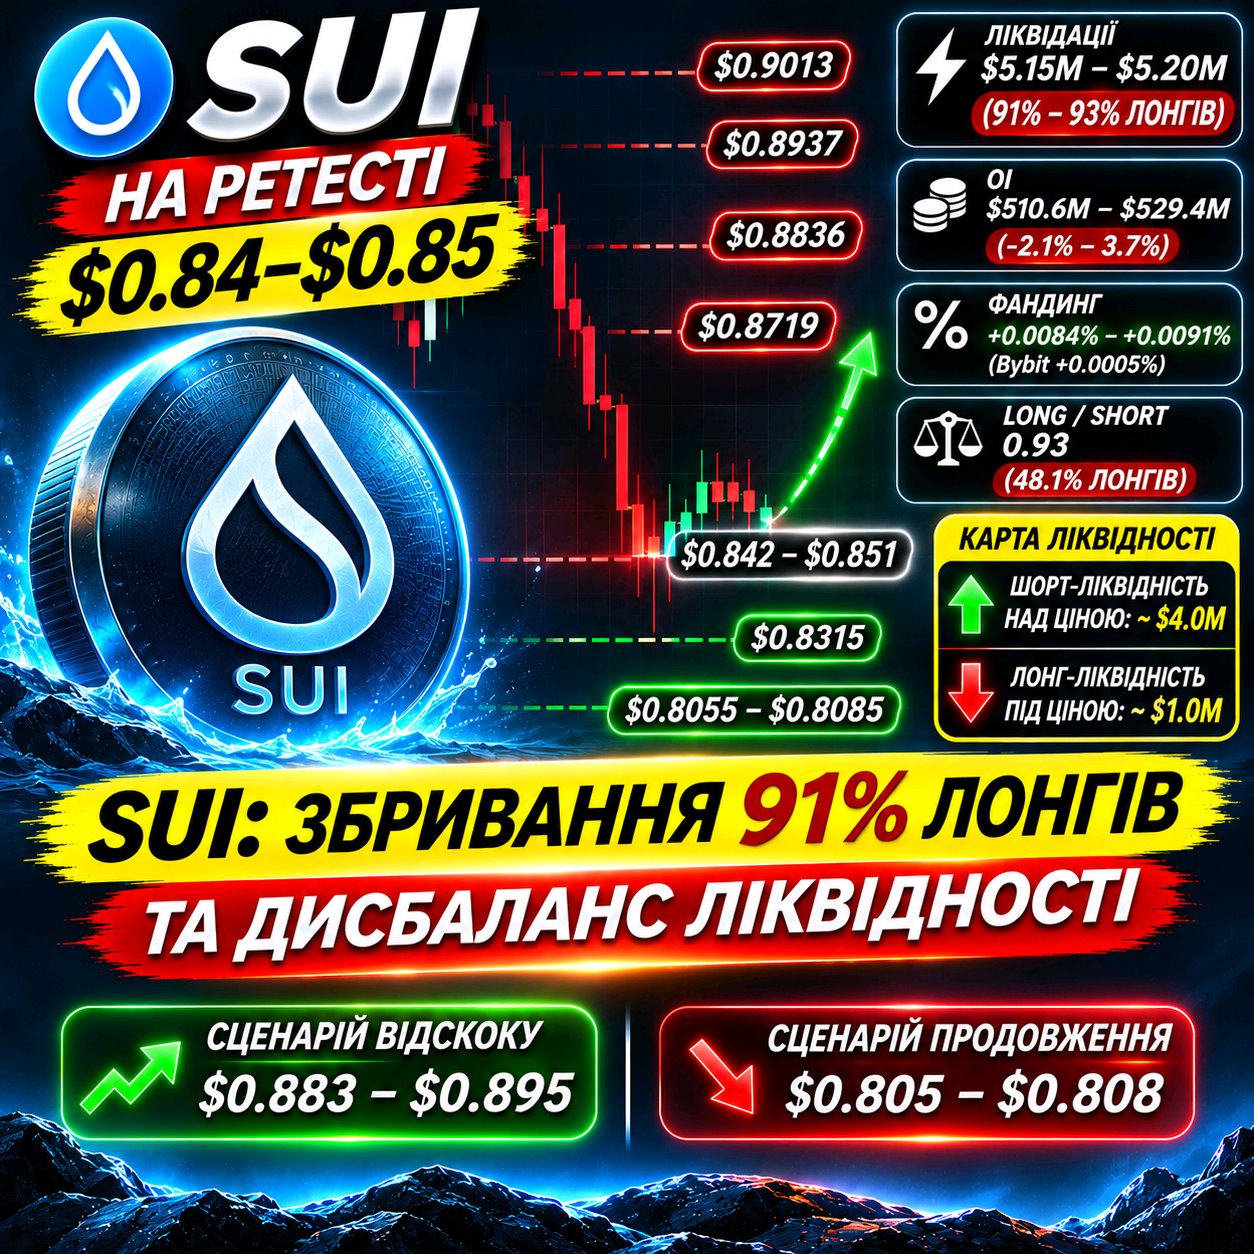
$SUIUSDT retesting $0.84–$0.85: 91%–93% of longs liquidated and a liquidity imbalance at $0.883 🎯⚡ Sui ($SUI) is trading in the $0.842 – $0.851 range after a prolonged 30-day correction (-21%…-26%) and a recent wick down to $0.808. The futures market is completely dominating spot (perp volumes exceed spot by ~5.6x), so any movement right now is determined solely by liquidity hunting in thin order books. Derivatives and market structure analysis: Hard long wipeout: Over the last 24 hours, ~$5.15M – $5.20M in positions have been forcibly closed in the derivatives market, with 91%–93% of that coming from buyers. The crowd, trying to catch knives during the pullback, served as the main fuel for the dump. Open Interest (OI) and Funding: Total OI dropped by 2.1% – 3.7% to the $510.6M – $529.4M level (which is ~14.9% of market cap). The baseline Funding Rate settled down to a calm +0.0084% – +0.0091% (on Bybit it's even +0.0005%), completely eliminating the overheat. Crowd positioning: The overall Long/Short ratio by accounts has shifted towards sellers (0.93 — only 48.1% of accounts are long), although on Binance, retail is still holding a local long bias (~67.5%). Liquidity Heatmap: 📈 Resistance (short pools): A noticeable bias has formed above the current price — within +10% to the upside, there is about $4.0M of short liquidity against $1.0M of longs below. The nearest clusters of short positions are gathered at $0.8719 (~$164K) and $0.8836 (~$305K). A breakout above $0.8836 opens the way to a cascade of pool liquidations in the $0.8937 – $0.9013 area (~$1.7M–$2.0M). 📉 Support (long pools): The nearest cluster of long stops is located at $0.8315 (~$210K), and the main magnet for sellers lies at $0.8055 – $0.8085 (where the largest single cluster of $355K is concentrated, with a total of ~$2.4M in liquidations upon a 5% dip). Trading context and positioning: Current working zone: $0.805 – $0.885. My view: After the market wiped out over 90% of leveraged longs in a day, selling pressure has slowed, and careful short covering has already begun on the 1H–4H timeframes. Since a significantly denser liquidity pool has accumulated above up to $0.89–$0.90, and funding has cooled down, as long as the $0.830 support holds, a technical rebound and short squeeze into the $0.883 – $0.895 zone looks like the priority. How are you handling $SUI right now — picking it up from the $0.83 support for a squeeze, or waiting for a breakout above $0.885? 💭 #IMPACTbyTrade $BTCUSDT
$DOGEUSDT at 3-year bottom ($0.067): 96% long washout and 76% 'whale' skew towards buys 🎯⚡ Dogecoin ($DOGE) has come under heavy selling pressure, dropping to three-year lows in the $0.0666 – $0.0670 range (losing ~7.3% over the week and ~18% over the month). Even the nearing DogeOS mainnet launch hasn't stopped the correction yet, but the derivatives market is already showing signs of retail buyer capitulation. Derivatives and market structure analysis: Harsh long washout: Over the last 24 hours, $6.38M in positions have been liquidated in the $DOGE futures market (over 1,090 accounts), with 96.2% ($6.14M) being long positions. The crowd that was catching knives above $0.070 has been almost completely wiped out of the market. Open Interest (OI) and Funding: Cumulative OI dipped by 3.32% to $905.83M (~13.54B DOGE), confirming the shedding of excessive leverage. The Funding Rate is holding at a moderate level of +0.0064% – +0.0074% (around 8–9% annualized) with no critical overheating. Whale and retail divergence: While the general Taker order flow remains weak (0.96 in favor of sellers), big capital and top traders are accumulating positions on the dip — the 'whale' volume ratio (Smart Money Skew) stands at 76.4% long vs. 23.6% short. Liquidity Map (Heatmap): 📈 Resistance (short pools): After the dump to $0.067, an attractive cascade of short stops has formed above. The first barrier and liquidity sweep zone is located in the $0.0705 – $0.0715 range (previous daily high), with the next major cluster near $0.0735 – $0.0750. 📉 Support (long pools): The nearest liquidity zone to the downside lies just below the current low in the $0.0650 – $0.0665 range. A break of this mark will open the way to testing the psychological $0.0600 level. Trading context and position: Current working range: $0.0655 – $0.0715. My view: The $DOGE market has undergone a local washout — 96% of liquidations were on the buying side, and the price has hit long-term support. Given that large players hold 76% of volume in longs, and a fresh pool of short liquidity has accumulated above $0.0705, a technical rebound and short squeeze into the $0.0710 – $0.0735 zone looks like the priority if the $0.0660 level is maintained. Are you already picking up $DOGE at this 3-year low or waiting for a consolidation above $0.0710 before entering? 💭 #IMPACTbyTrade $BTCUSDT

$XAUTUSDT (Gold) under macro-pressure: Pullback below $4,000, long skew on Bybit, and key liquidity levels 🎯⚡ Gold ($XAU) is under serious selling pressure: after a failed assault on resistance in the $4,145 – $4,157 zone, the price broke the psychological threshold of $4,000 and dipped to $3,946 – $3,952. The main trigger for the drop is the release of "hot" US inflation (CPI at 3.7%) and a sharp strengthening of the US Dollar Index (DXY) amid the Fed's hawkish rhetoric. Derivatives and market structure analysis: Capital flows and OI: On crypto-derivative platforms, the cumulative Open Interest (OI) for gold futures ($XAU/USDT) grew by +1.93% – 2.87% and is holding at $1.57B – $1.58B, despite the drop in trading volumes after the sharp dump. Traders are actively entering new positions on the pullback. Crowd psychology and funding: The global market is looking short — the overall Long/Short ratio is at 0.917 (on Binance, it's 0.859). However, retail on Bybit is stubbornly buying the dip: the local Long/Short ratio there is skyrocketing at 1.170. Meanwhile, the base Funding Rate has dropped to zero levels (0.0000% – +0.0009%), completely removing the overheating. Leverage cleansing: Over the last 24 hours, of the total liquidation volume on gold crypto-futures, over 82% came from long positions — leveraged buyers once again became fuel for the move downward. Liquidity map and technical zones: 📈 Resistance (rebound targets): The nearest resistance zone and cluster of short-stops has formed in the $4,025 – $4,040 range (previous support, now acting as a flip level). Above that lies a powerful barrier at $4,074 – $4,082. 📉 Support (risk zone): Right below the current price is a critical historical demand layer at $3,900 – $3,910 (where the November impulse began). If sellers push through $3,900, the next stop to clear liquidity is the October bottom in the $3,870 – $3,875 range. Trading context and position: Current working zone: $3,900 – $4,030. My view: Gold is oversold on lower timeframes (1H RSI dropped below 28), and zero funding provides room for a technical bounce. However, due to the strong dollar and the retail long skew on Bybit, there is a high probability of a prior wick into the $3,900 – $3,910 liquidity zone before an attempt to return above $4,000. How are you playing gold this week — are you buying from $3,900 or waiting for a return above $4,030 to confirm a reversal? 💭 #IMPACTbyTrade $BTCUSDT

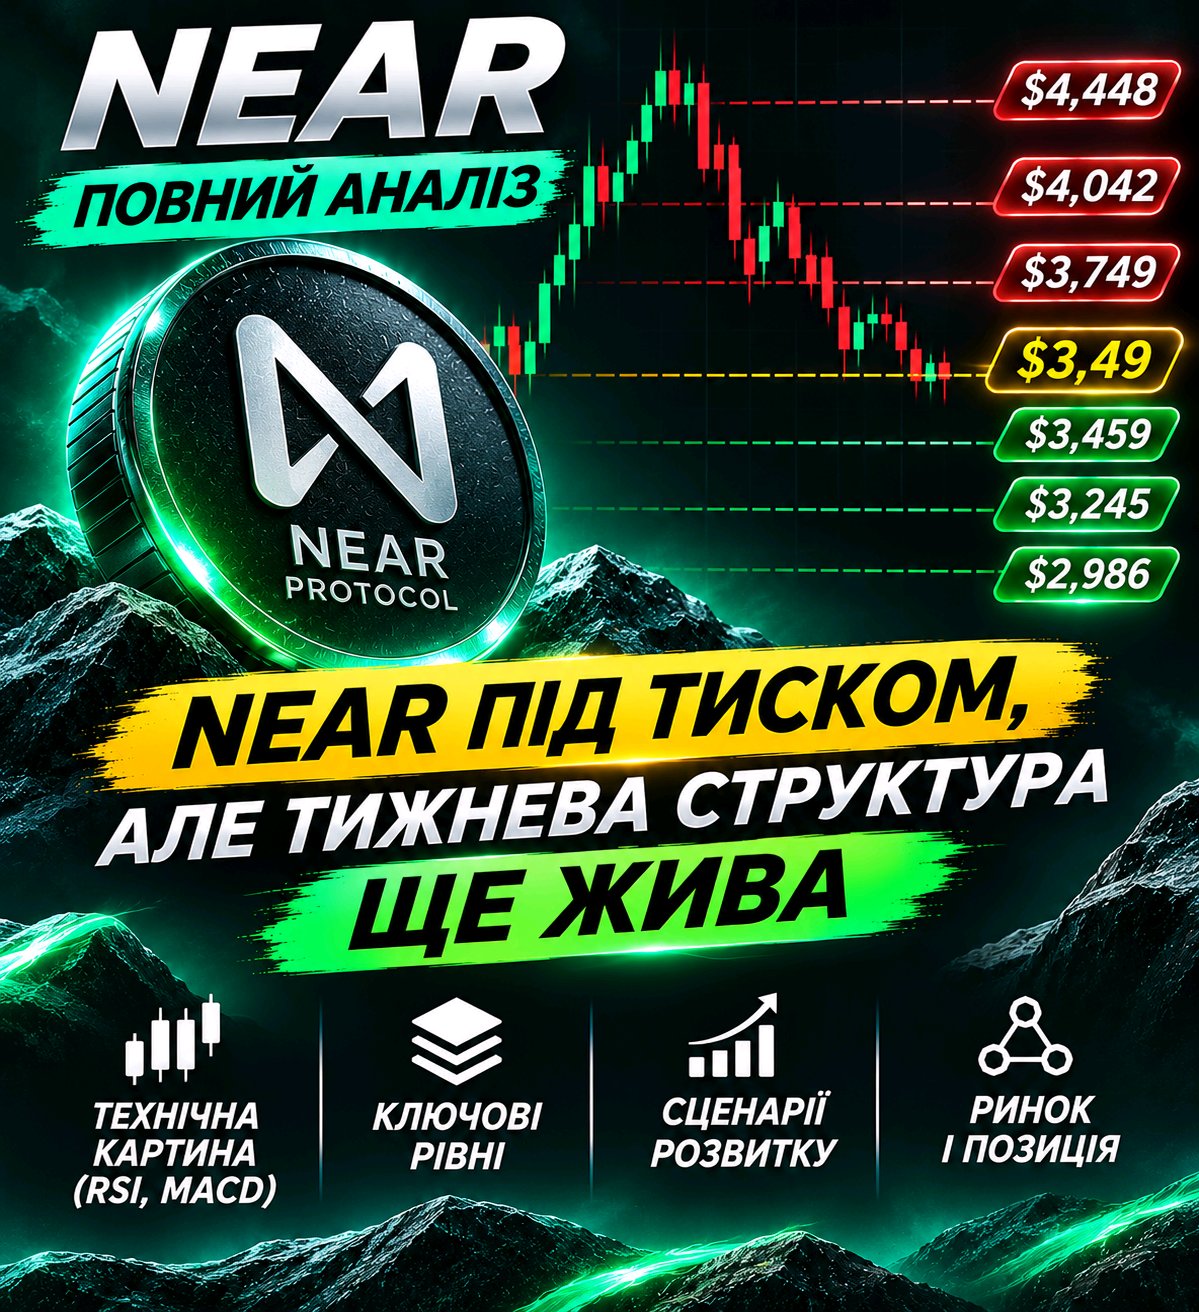
$NEARUSDT squeezed near $3.61: 91% of longs wiped out and a liquidity trap at $3.73 🎯⚡ Near Protocol ($NEAR) is trading around $3.60 – $3.62, stabilizing after a local pullback from the $3.72–$3.84 mark. Over the last 7 days, the asset has dipped ~6.3%, having gone through a harsh deleveraging of excessive leverage — the market is preparing for an exit from a tight corridor. Derivatives and market structure analysis: Deleveraging and liquidations: Over the past 24 hours, $6.51M – $7.39M in positions have been liquidated in the $NEAR futures market, of which 91%–94% were longs. The crowd that was buying the dip above $3.70 became fuel for the dump, but the main "meat" has already been sheared. Open Interest (OI) and flows: Total OI dropped by ~2–3.9% and is holding at the $831M – $835M level (with a market capitalization of ~$4.68B, giving a high OI/MCap ratio of ~17.6%). At the same time, a net capital outflow from spot (-$10.0M) and futures (-$49.5M) has been recorded over the day. Psychology and funding: The overall Long/Short ratio by accounts has leveled out into a neutral zone of 0.93 – 1.06, but on Bybit, there is a strong retail skew toward longs (2.36:1, 70.2% of accounts are buying) with negative funding of -0.0254%. The base market rate is calm — 0.0033% – 0.0095%. Liquidity map (Heatmap): 📈 Resistance (short pools): The nearest significant cluster of short-seller liquidations has formed at $3.70 – $3.734 (~$520K–$690K). Breaking this zone and the sell wall at $3.748 ($1.8M) opens the path to a cascading sweep of $1.8M+ in shorts in the $3.803 – $3.866 range. 📉 Support (long pools): Below, the nearest pool of long stops lies at $3.420 – $3.439 (~$557K–$750K), where there is also a large limit buy order on Hyperliquid ($1.6M at $3.469). Trading context and position: Current working zone: $3.44 – $3.74. My view: After the market wiped out over 90% of leveraged longs in a day, sellers are exhausted — on the 12-hour timeframe, a cautious accumulation of new positions is already visible (+$31.1M OI). Since there is significantly more liquidity accumulated above up to $3.80 for a short squeeze ($1.8M vs $277K below at a 5% step), if support at $3.45–$3.50 holds, an impulse short squeeze above $3.73 looks like the priority. How are you trading $NEAR right now — picking it up from the $3.45–$3.55 support for a squeeze or waiting for a breakout of $3.75? 💭 #IMPACTbyTrade $BTCUSDT
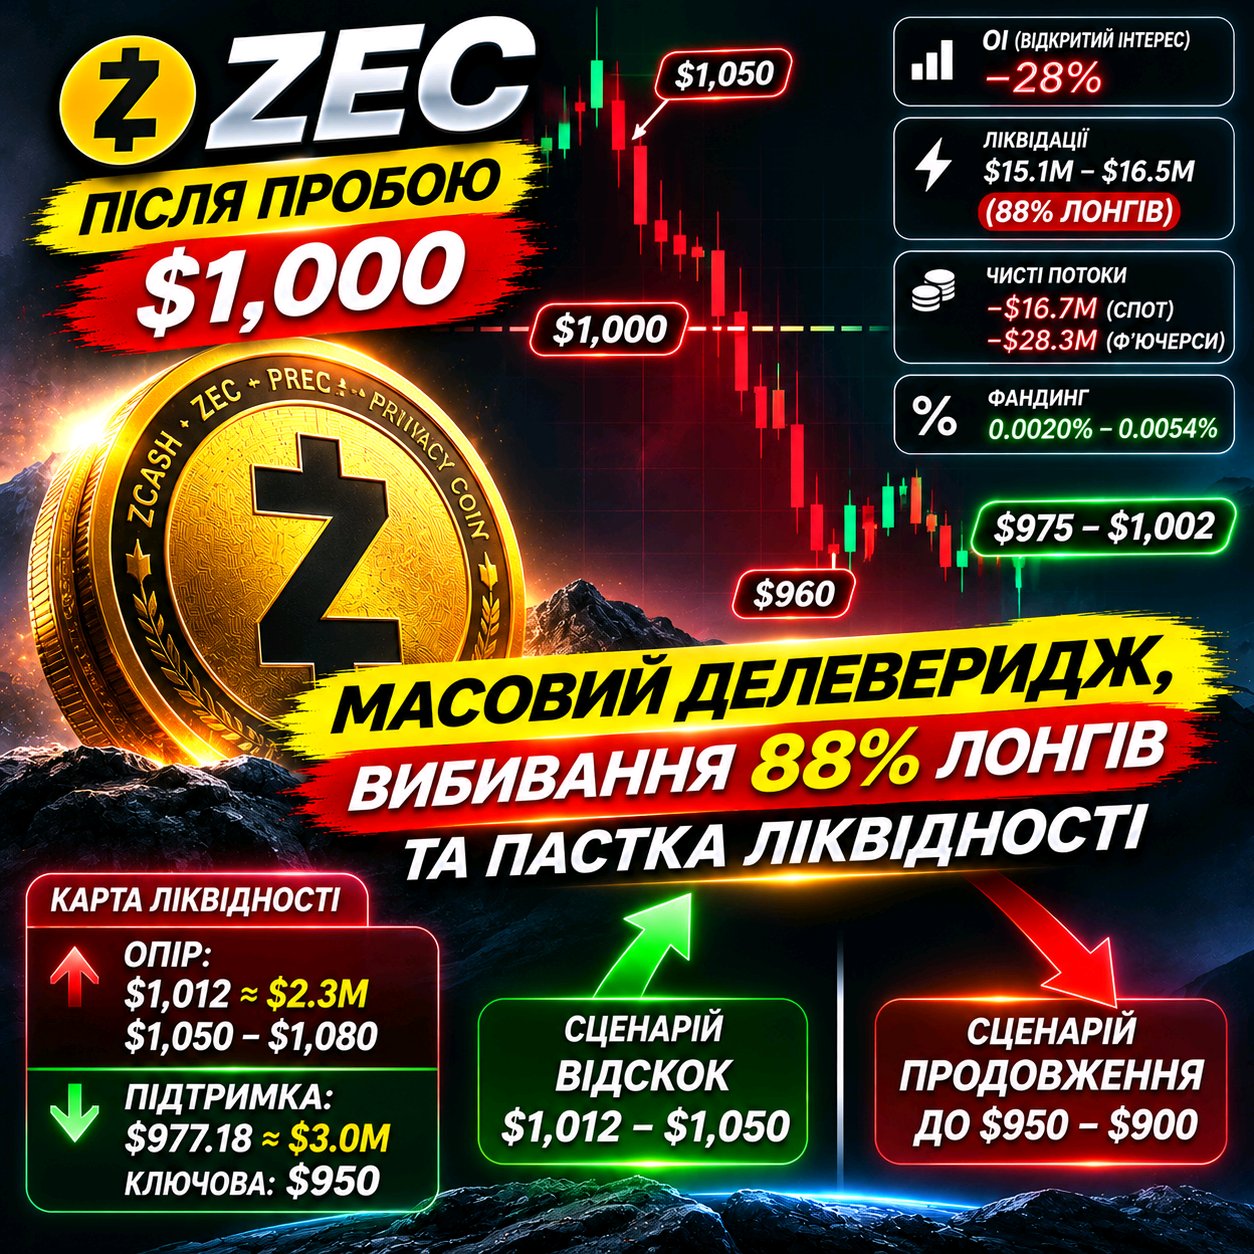
$ZEC after breaking $1,000: Massive deleveraging, 88% of longs wiped out, and a liquidity trap 🎯⚡ Zcash ($ZEC) is experiencing one of the roughest weeks of the season — after losing the key $1,000 mark, the coin dipped to a local low of $960–$963 and is currently trading in the $975 – $1,002 range (down nearly 23% in 7 days). Even the recent launch of the NU7 upgrade (which reduced block time from 75 to 25 seconds) and a $1M investment from Grayscale could not keep spot price from a wave of sell-offs. Derivatives and market structure analysis: Massive deleveraging (OI): Total Open Interest for $ZEC has collapsed by 28% (to the ~$1.59B mark), and spot/futures flows for the day recorded net outflows (-$16.7M and -$28.3M respectively). This indicates forced position closures and shedding of excessive leverage. Wiping out longs: Over the last 24 hours, more than $15.1M – $16.5M in positions have been liquidated on the market, with 88% of these being buyers. The crowd, as usual, tried to buy the dip near $1,050–$1,000 and became fuel for the dump. Psychology and funding: The Long/Short ratio by accounts has leveled out to a balance (49.3% / 50.7%), and the Funding Rate has dropped to a calm 0.0020% – 0.0054%, completely removing the overheat. Liquidity map (Heatmap): 📈 Resistance (short pools): A significant concentration of short liquidity has accumulated above the current price. The nearest cluster of short-sellers is burning at the $1,012 level (~$2.3M), and a return above $1,050 opens the path to a retest of $1,080. 📉 Support (long pools): The nearest cluster of long stops lies at $977.18 (~$3.0M), and the key survival threshold is the $950 level. Losing this zone opens the way for a deeper dump into the $900 region. Trading context and position: Current operating zone: $950 – $1,015. My view: The $ZEC market has gone through a painful but necessary leverage purge (28% drop in OI and cooling of funding). Since a clear imbalance toward short-stops has formed at the top of the liquidity map, holding the $950–$960 support makes a technical rebound and liquidity sweep above $1,012 logical to expect. Are you buying $ZEC below the psychological $1,000, or are you waiting for a consolidation above $1,015 before entering? 💭 #IMPACTbyTrade $BTCUSDT
$XRPUSDT is almost near $1. But oversold doesn't mean the drop is over! XRP has dipped to $1.058, and the daily RSI is nearing 24.6. Such values attract the attention of buyers looking for an opportunity to get in after a strong decline. But I see one problem: sellers are still in control of the market structure. WHAT DOES THE CHART SHOW? On the daily timeframe, XRP remains below the key moving averages. The MACD also maintains negative momentum. On the 4H, the RSI is near 32.6, and on the weekly, it's around 38.3. In other words, weakness is manifesting not just on the short timeframe. This significantly reduces the conviction in the idea of a quick reversal. WHERE IS THE MAIN BATTLE HAPPENING? I’m highlighting a few important areas: - $1.044–1.052 — the nearest support zone. - $1.022 — the next target on the downside. - $0.984 — an important lower level. - $1.075 — the first signal of improvement. - $1.096 — the next resistance. - $1.137 — stronger confirmation of a recovery. I’m watching the reaction near $1.044 especially closely. If buyers don’t hold this area, the risk of continued downside increases. WHAT COULD CHANGE THE PICTURE? I’m not interested in a short bounce on a 15-minute chart. I want to see support defense, an increase in buying volume, and the formation of a higher low on the 4H. Returning above $1.075 would be the first positive signal. Consolidation above $1.096 would strengthen the arguments in favor of a recovery. MY TRADING HYPOTHESIS: For now, the advantage remains with the sellers. Losing $1.044 without a successful reclamation of the level would open the path to $1.022 and potentially $0.984. However, if buyers defend the support and reclaim $1.075, I will start more closely evaluating the possibility of a short-term structure shift. MY POSITION: RSI at 24.6 makes XRP interesting to watch, but it doesn't give me grounds to call the current price the bottom. I want to see how buyers defend $1.044 before placing a bet on a recovery. Perhaps the first part of the bounce will happen without me. That's an acceptable price to pay for waiting for confirmation. #IMPACTbyTrade $BTCUSDT