
VICTORIA 777
4277Like0Shares506Fans1759Follow
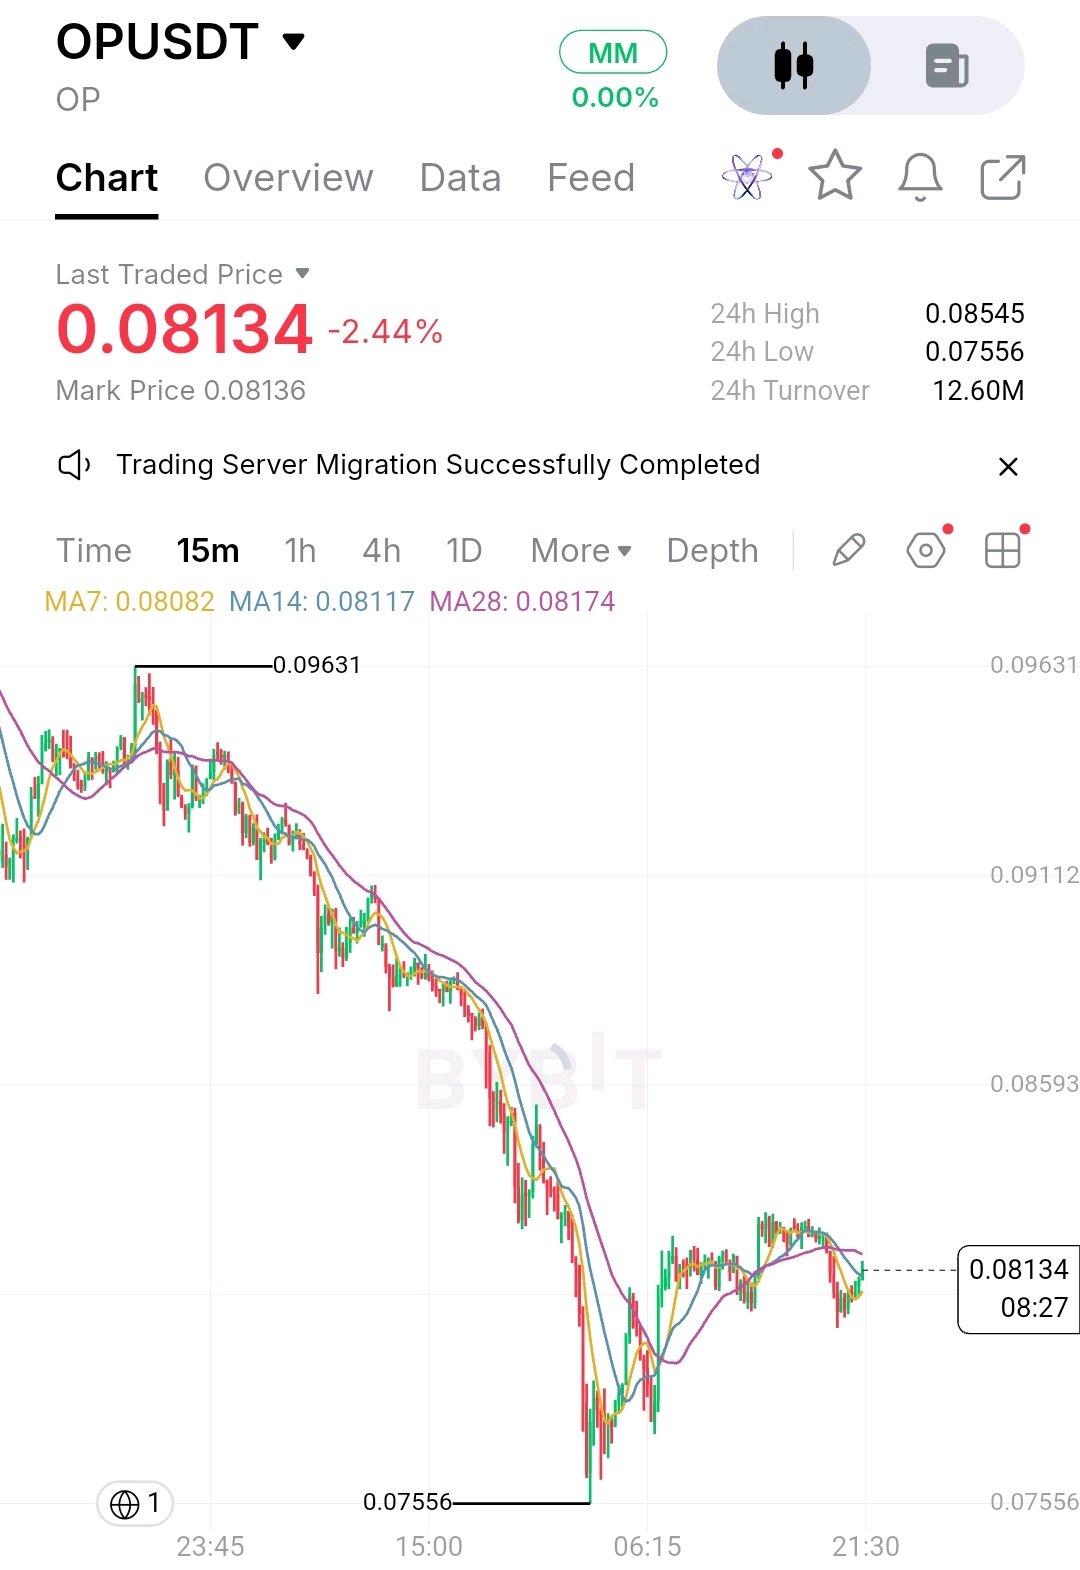
OPUSDT: The Sell-Off May Be Losing Momentum, But Is This Really a Reversal? Optimism has an interesting setup right now. OP is trading around $0.0823, down approximately 5.9% over 24 hours. However, today's recovery from the $0.0755 area deserves attention. Here is what caught my eye: 🔍 The overlooked signal Derivatives data shows: - Open interest: $50.99M, down 1.36%. - Funding rate: -0.0212%. - 24h liquidations: $1.78M, with approximately $1.73M from longs. This combination suggests significant long-side deleveraging. The rebound is interesting, but it is not yet proof of fresh accumulation. Key technical levels: 🟢 Support: $0.0755–$0.0741 🔴 Resistance: $0.0864 Bullish scenario: OP holds its recovery structure and breaks above $0.0864 with convincing volume. That would improve the short-term outlook. Bearish scenario: Another rejection followed by a breakdown below $0.0800 could expose the previous low again. My approach? I would rather wait for confirmation than chase this bounce. The important question isn't how quickly OP recovered. It's whether buyers can defend the recovery when selling pressure returns. What do you think? Is OP building a genuine bottom, or are we simply watching a temporary relief rally? $OPUSDT #IMPACTbyTrade

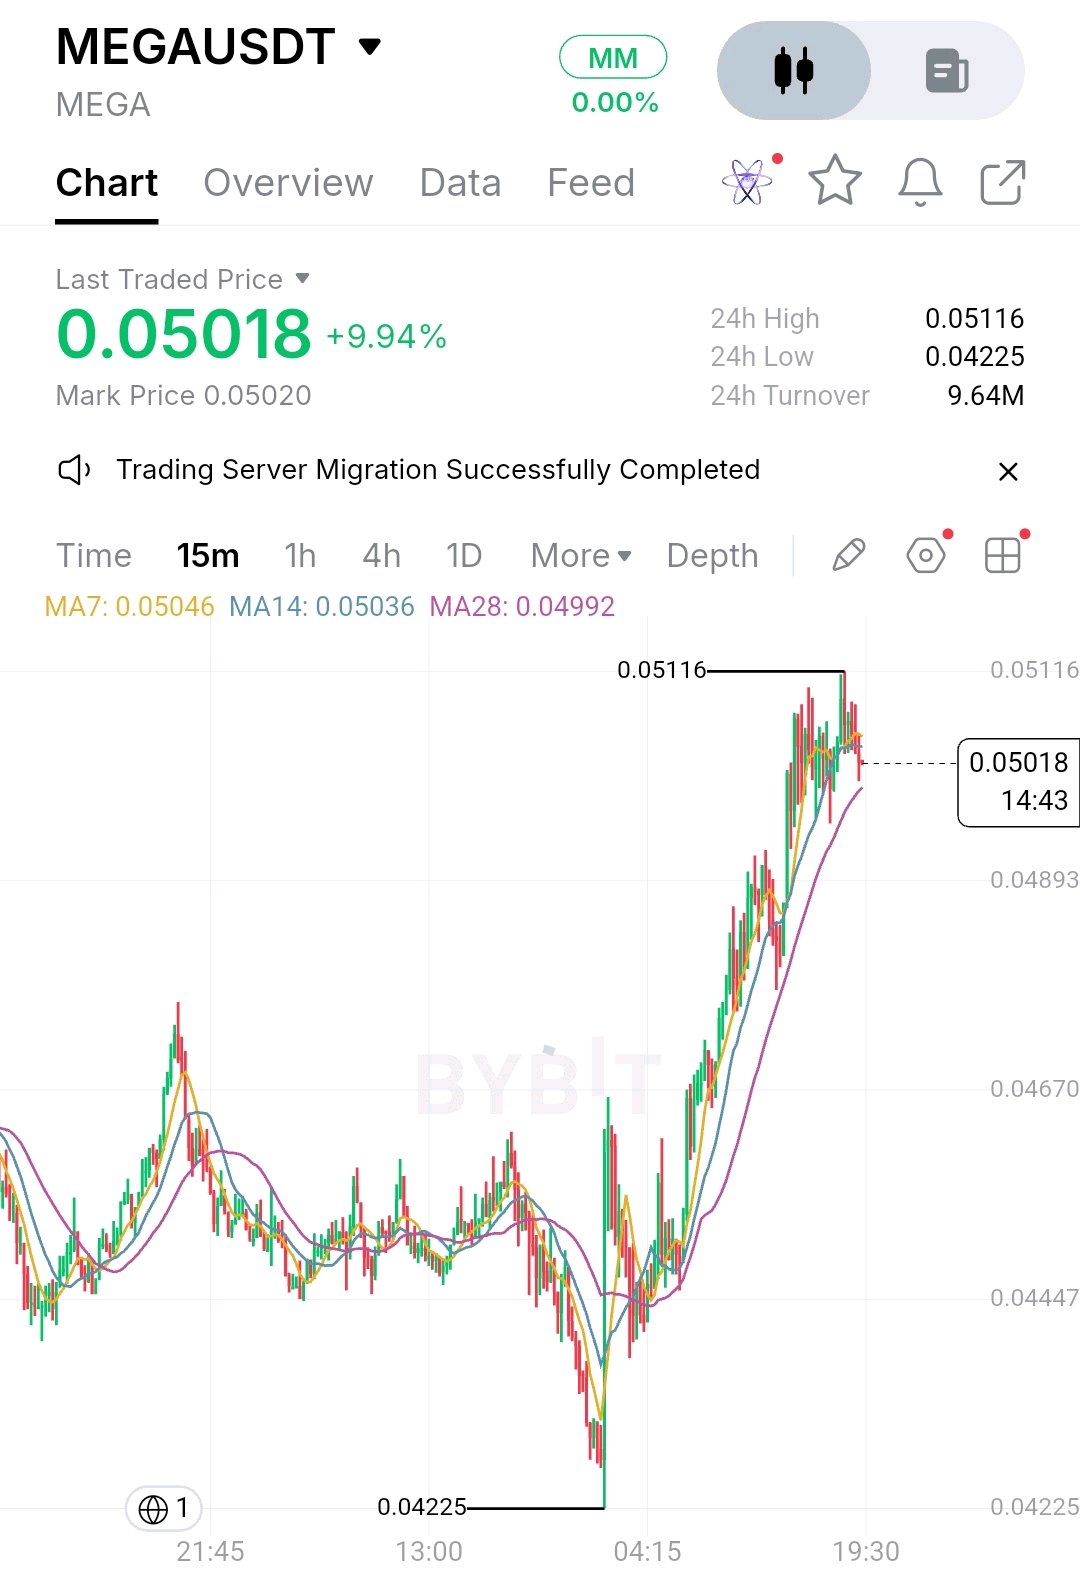
MEGA: A 10% rally is interesting. What happens at resistance is more important. MegaETH (MEGA) is showing impressive short-term strength, but I am watching one critical area before calling this a confirmed breakout. On the supplied Bybit chart, MEGA is trading at $0.05018, up 9.94%, after recovering from $0.04225. Here is what caught my attention: * MA7: $0.05046 * MA14: $0.05036 * MA28: $0.04992 * 24H resistance: $0.05116 The overlooked signal: Despite the strong rally, price is currently sitting below MA7 and MA14. This suggests short-term momentum is cooling near resistance, even though the broader 15-minute structure remains elevated. There is also a fresh fundamental development. On November 10, MEGA announced a $30 million commitment to new products, beginning with an AI inference marketplace planned for December. However, its November 13 announcement of a 20% workforce reduction adds an important execution risk. The Block +1 My trading outlook: * Bullish: A convincing 15-minute close above $0.05116 could open the door toward further upside. * Bearish: Rejection could bring $0.04992 and $0.04893 back into focus. * Confirmation: I want to see a breakout supported by expanding volume, not just another price spike. I would rather wait for confirmation than chase a rally directly into resistance. One question for the community: Is MEGA preparing for another breakout, or are early buyers approaching their profit-taking zone? $MEGAUSDT #IMPACTbyTrade

🚀 INIT is showing serious relative strength — but the next move matters more than the rally! INIT is trading around $0.1268, up approximately 20% over 24 hours, while the broader crypto market faces significant selling pressure. What caught my attention is the structure behind this move. On the supplied 15M Bybit chart: 📊 Price surged from $0.09279 toward $0.13386. 📈 MA7 ($0.12686) > MA14 ($0.12270) > MA28 ($0.11369). 🔥 The moving averages show strong short-term bullish momentum. The overlooked detail: A powerful rally doesn't automatically mean a confirmed breakout. The ability to hold above the rising MA7 and defend the $0.1227 area could be more important than another immediate green candle. 🎯 Bullish scenario: A sustained reclaim of $0.13386 could open the door to further upside. ⚠️ Bearish scenario: Losing $0.1227 would weaken the short-term structure and increase pullback risk. My approach? I would rather see consolidation and confirmation than chase an extended candle. What's your view on INIT: another breakout incoming, or is the market preparing for a cooldown? 👀 $INITUSDT #IMPACTbyTrade

BTCUSDT: The bounce is recovering momentum, but has Bitcoin actually escaped the selling pressure? November 15, 2026 | Market Structure Analysis Bitcoin is trading around $64,900 after a sharp selloff toward $61,899. The rebound looks encouraging on the 15-minute chart, but I am watching one important detail before turning bullish. What the chart reveals: * BTC has recovered above MA7 ($64,872), MA14 ($64,810) and MA28 ($64,113). * Short-term moving averages are showing improving momentum. * The $61,899 low marks an important liquidity area. * The broader price structure remains bearish despite the recovery. The overlooked signal: Bitcoin's futures open interest recently declined 5.3% to $18.05B, while US spot Bitcoin ETFs recorded approximately $1.07B in cumulative outflows over five sessions. This suggests substantial deleveraging alongside persistent investment outflows. kryptoliczby.com +1 My trading outlook: 🟢 Bullish: A sustained recovery toward $67,496 would strengthen the reversal argument. 🔴 Bearish: Losing $61,899 would expose Bitcoin to another downside expansion. My conclusion: I would rather wait for confirmation than chase this rebound. Recovering moving averages is encouraging, but reclaiming resistance is a different challenge. One question for the Bybit community: Is this the beginning of a genuine BTC reversal, or simply a relief bounce after aggressive long liquidations? I want to hear your market structure perspective. $BTCUSDT #IMPACTbyTrade

#IMPACTbyTrade MERL is still up, but there's an important weakness developing on the 15M chart. 👀 After climbing from the $0.02862 area to a 24H high of $0.03258, MERL is now struggling to maintain its short-term momentum. Here's what I'm watching: Price is trading around $0.03160, below all three moving averages: • MA7: $0.03183 • MA14: $0.03186 • MA28: $0.03189 That tight MA cluster is now the immediate reclaim zone. **My read:** 🟢 Bullish: Reclaim $0.03183–$0.03189 and hold it. That could open another attempt toward $0.03258. 🔴 Bearish: Continued rejection from the MA cluster could expose lower support around $0.03059. The interesting part? MERL hasn't erased its entire intraday advance, but buyers need to prove they still have control. I'm watching the reclaim, not chasing the previous pump. **Would you consider this a healthy consolidation or an early warning of a deeper pullback?** $MERLUSDT

STRK just bounced from $0.03309, but I’m not calling this a reversal yet. 👀 After dropping 8.37% to $0.03415, STRK is showing its first interesting sign of short-term recovery. Here’s what caught my attention: Price has rebounded approximately 3.2% from the $0.03309 low and moved back above the MA7 ($0.03361) and MA14 ($0.03408). But there’s one important problem: MA28 at $0.03485 is still overhead. That makes the next move particularly important. My levels to watch: * $0.03309: Critical support. Losing this level could expose STRK to further downside. * $0.03408: Short-term momentum reference. * $0.03485: First major recovery hurdle. * $0.03771–$0.03796: Previous high resistance zone. I want to see buyers reclaim $0.03485 and defend it before considering a stronger bullish setup. Until then, this could simply be a relief bounce inside a broader bearish move. Are buyers finally stepping in, or is STRK preparing for another leg down? $STRKUSDT #IMPACTbyTrade

DOGE is bouncing, but the chart is still telling a bearish story. Don't confuse the two. $DOGE is trading around **$0.06101, down 5.29%**, after dropping to a fresh intraday low of $0.06029. What concerns me most isn't just the sell-off. It's the structure behind it. On the 15-minute chart, DOGE continues making lower highs and lower lows. More importantly, price remains below all three moving averages: - MA7: $0.06125 - MA14: $0.06195 - MA28: $0.06242 That alignment shows sellers still have short-term control. The bounce from $0.06029 is worth watching, but it is not a confirmed reversal. **My levels to watch:** 🔹 $0.06029 — Critical immediate support. 🔹 $0.06125 — First recovery hurdle. 🔹 $0.06195–$0.06242 — Resistance and potential trend-recovery zone. If buyers reclaim these levels and hold them, momentum could start shifting. If $0.06029 breaks, further downside pressure becomes a concern. I'm watching for confirmation, not chasing the first green candle. **Would you buy this dip, or wait for DOGE to reclaim resistance first?** $DOGEUSDT #IMPACTbyTrade

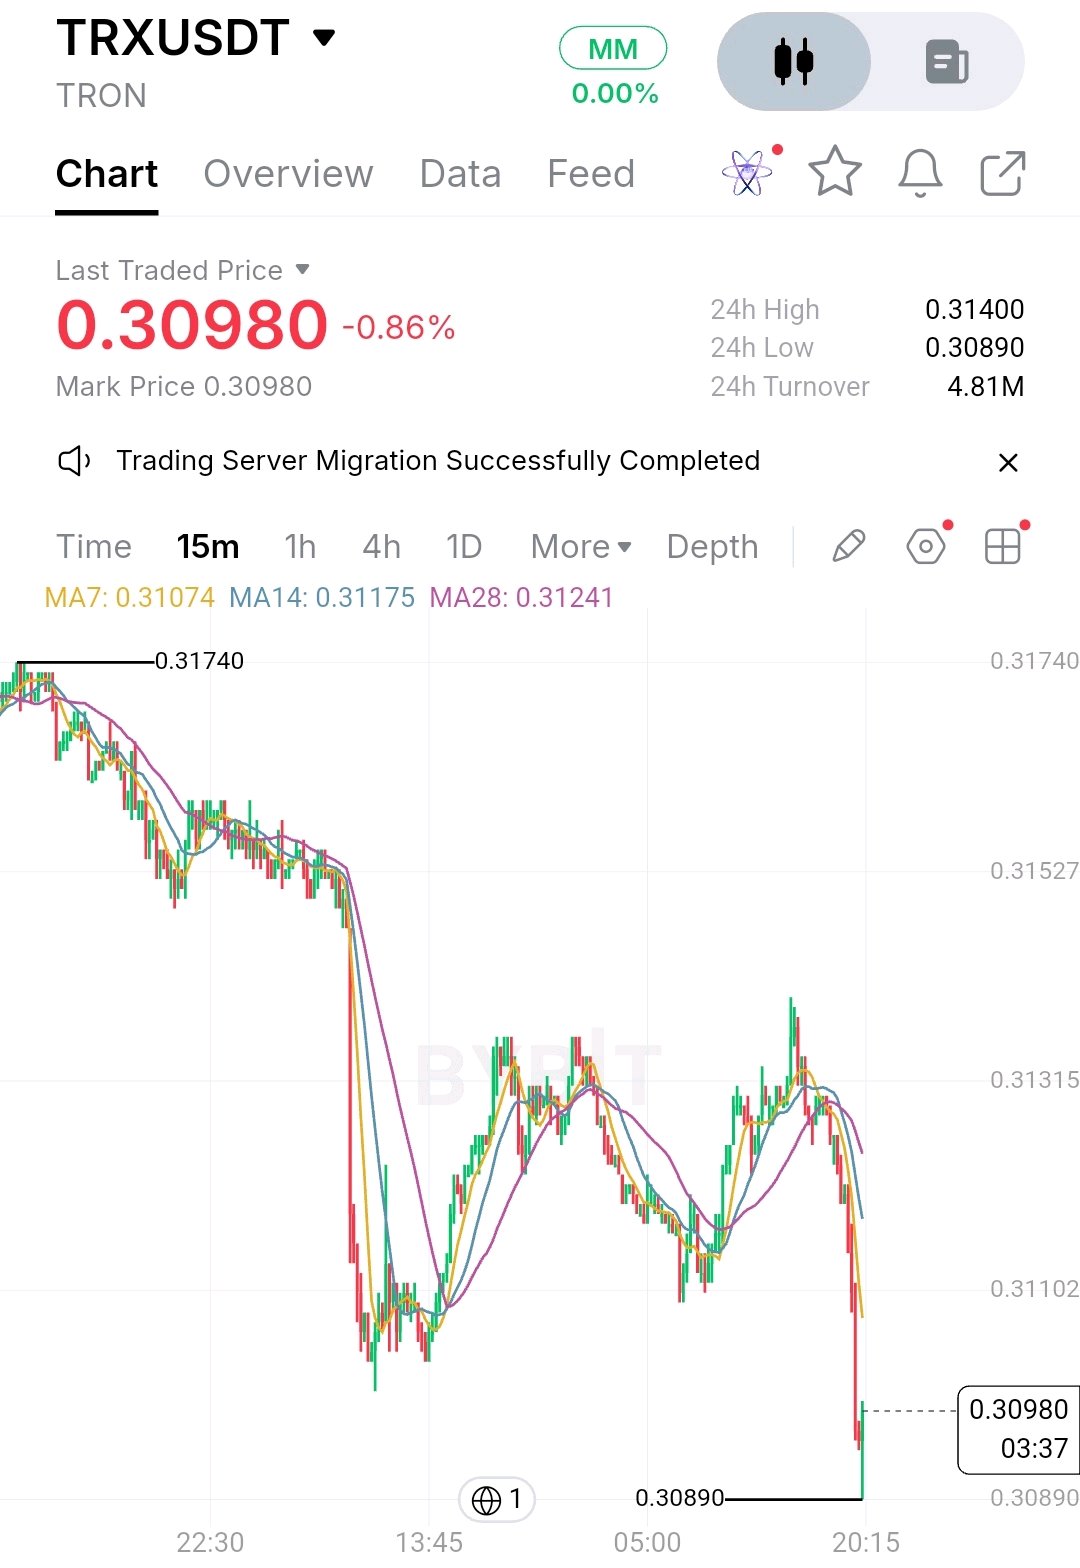
TRON ($TRX) just hit a critical support level, but the bounce isn't convincing yet. On the 15-minute chart, TRX is trading at $0.30980, down 0.86%, after a sharp selloff that pushed price to $0.30890. Here's the detail I'm watching: all three moving averages are sitting above the current price: - MA7: $0.31074 - MA14: $0.31175 - MA28: $0.31241 This shows short-term momentum remains under pressure. The latest green candle suggests a reaction from the $0.30890 low, but one bounce is not enough to call a reversal. My key levels: - Support: $0.30890 - First recovery test: $0.31074 - Stronger confirmation zone: $0.31175–$0.31241 If buyers reclaim the moving averages, a recovery becomes more convincing. If $0.30890 breaks, downside pressure could accelerate. I'm watching the reaction at support, not chasing the first green candle. Will TRX defend $0.30890, or are sellers preparing another move lower? $TRXUSDT #IMPACTbyTrade

BNB is approaching its 24H low, but the real concern is what happens if buyers fail to defend it. BNBUSDT is trading at $604.84, down 5.62%, with price sitting below all three short-term moving averages: • MA7: $609.30 • MA14: $613.00 • MA28: $614.69 Here's the detail I'm watching: the latest selloff pushed price toward $602.33, and the small recovery so far hasn't reclaimed even the 7-period MA. That means a bounce alone isn't enough to call a reversal. Two levels matter now: • Bullish: Buyers defend $602.33 and reclaim $609.30, followed by $613–$614.69. That would be the first sign of improving momentum. • Bearish: A sustained break below $602.33 would expose the possibility of further downside. My view: The trend remains bearish on this 15M chart. I'd rather wait for buyers to prove themselves than chase an unconfirmed bounce. Will $602.33 hold, or is BNB preparing for another leg down? $BNBUSDT #IMPACTbyTrade

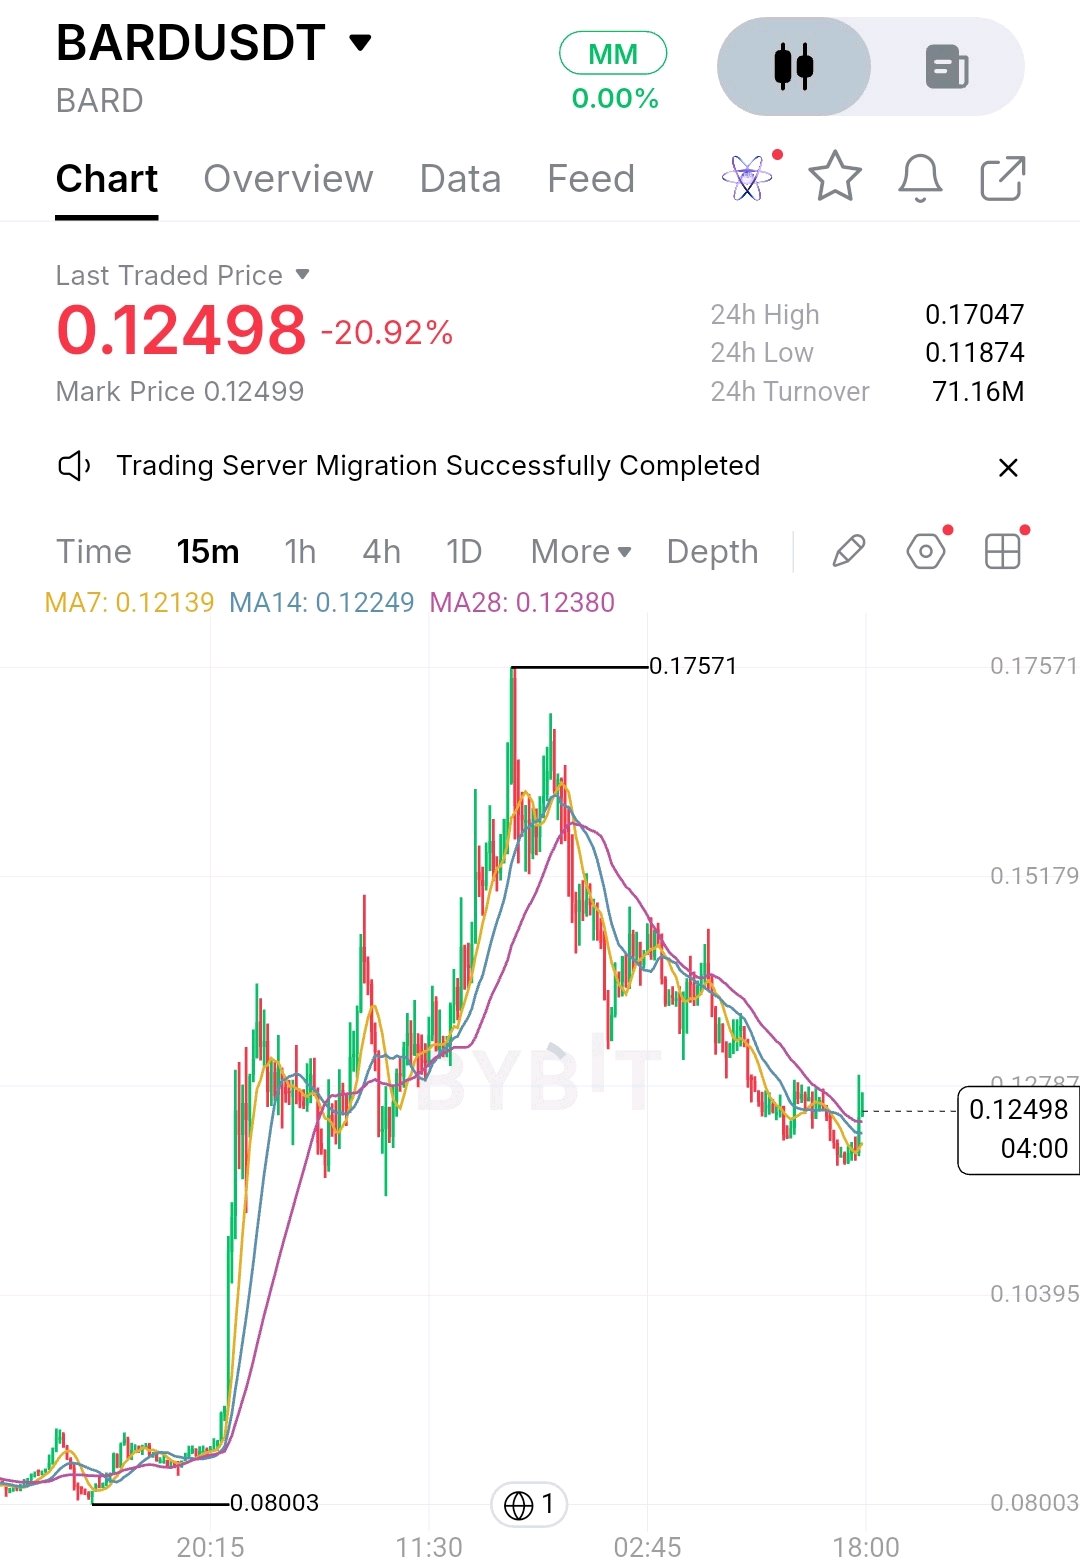
BARD is bouncing, but the bigger trend hasn't given buyers a reason to celebrate yet. Here's what caught my attention on the 15M chart. After climbing from $0.0800 to nearly $0.1757, BARD entered a clear sequence of lower highs and lower lows. Now price has bounced from the $0.11874 low and reclaimed all three moving averages: • MA7: $0.12139 • MA14: $0.12249 • MA28: $0.12380 But there's an important detail: the moving averages are still bearishly aligned. That means short-term buying pressure is returning, but a confirmed trend reversal is still missing. **My key levels:** • $0.12380: Area buyers need to defend. • $0.11874: Critical downside level. If BARD holds above the moving averages and breaks its recent lower-high structure, recovery could gain credibility. If price loses that support, another bearish leg remains possible. I'm watching confirmation, not chasing the first green candle. **Do you think BARD can finally reverse its trend, or is this just another relief bounce?** $BARDUSDT #IMPACTbyTrade

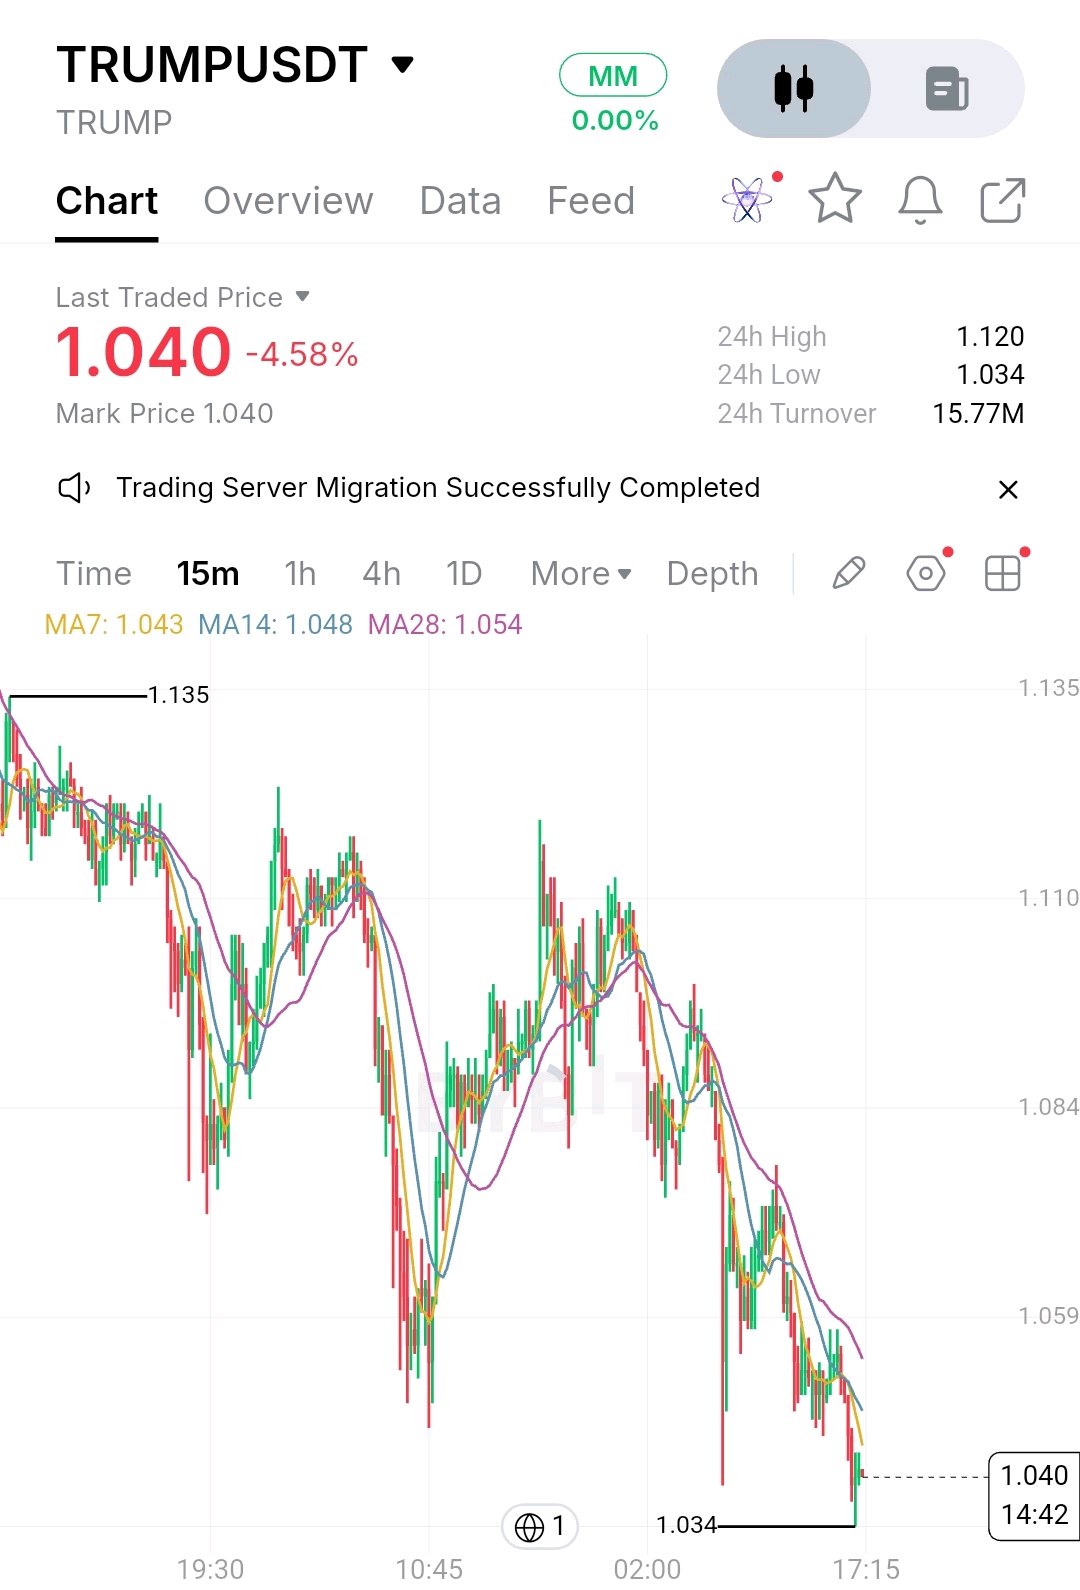
TRUMP is approaching a critical level, but the chart isn't showing a reversal yet. $TRUMP is trading at **1.040**, down 4.58%, and sitting just above its 24H low at **1.034**. Here's what concerns me: All three moving averages are above price: - MA7: 1.043 - MA14: 1.048 - MA28: 1.054 This bearish alignment shows that sellers still have short-term control. **My key levels:** 🔴 Below 1.034: Bearish continuation risk increases. 🟢 Above 1.054: A meaningful recovery attempt becomes more interesting. I don't want to mistake a small bounce for a trend reversal. The interesting part is that TRUMP is testing its 24H low while all three moving averages remain overhead. **Will buyers defend 1.034, or are we about to see another leg down?** $TRUMPUSDT #IMPACTbyTrade
HYPE just bounced hard from its 24H low, but I'm not convinced the recovery is strong enough yet. Here's what I'm watching. 👇 HYPEUSDT is trading around $69.28, down 4.22%, after sweeping the $67.052 low. The rebound is encouraging, but there's an important detail: On the 15M chart: - MA7: $69.302 - MA14: $69.455 - MA28: $69.152 Price is hovering around these moving averages, while the MA14 remains overhead. This suggests the bounce is still fighting short-term bearish pressure rather than confirming a trend reversal. My two scenarios: 🟢 Bullish: Reclaim $69.45 and hold above it. That would make a stronger recovery more convincing. 🔴 Bearish: Lose $69.15 and the rebound starts looking vulnerable to another downside move. I'm watching the reaction around $69.45 closely. The key distinction: A strong bounce after a liquidity sweep doesn't automatically mean buyers have regained control. Would you trust this recovery, or wait for confirmation? $HYPEUSDT #IMPACTbyTrade

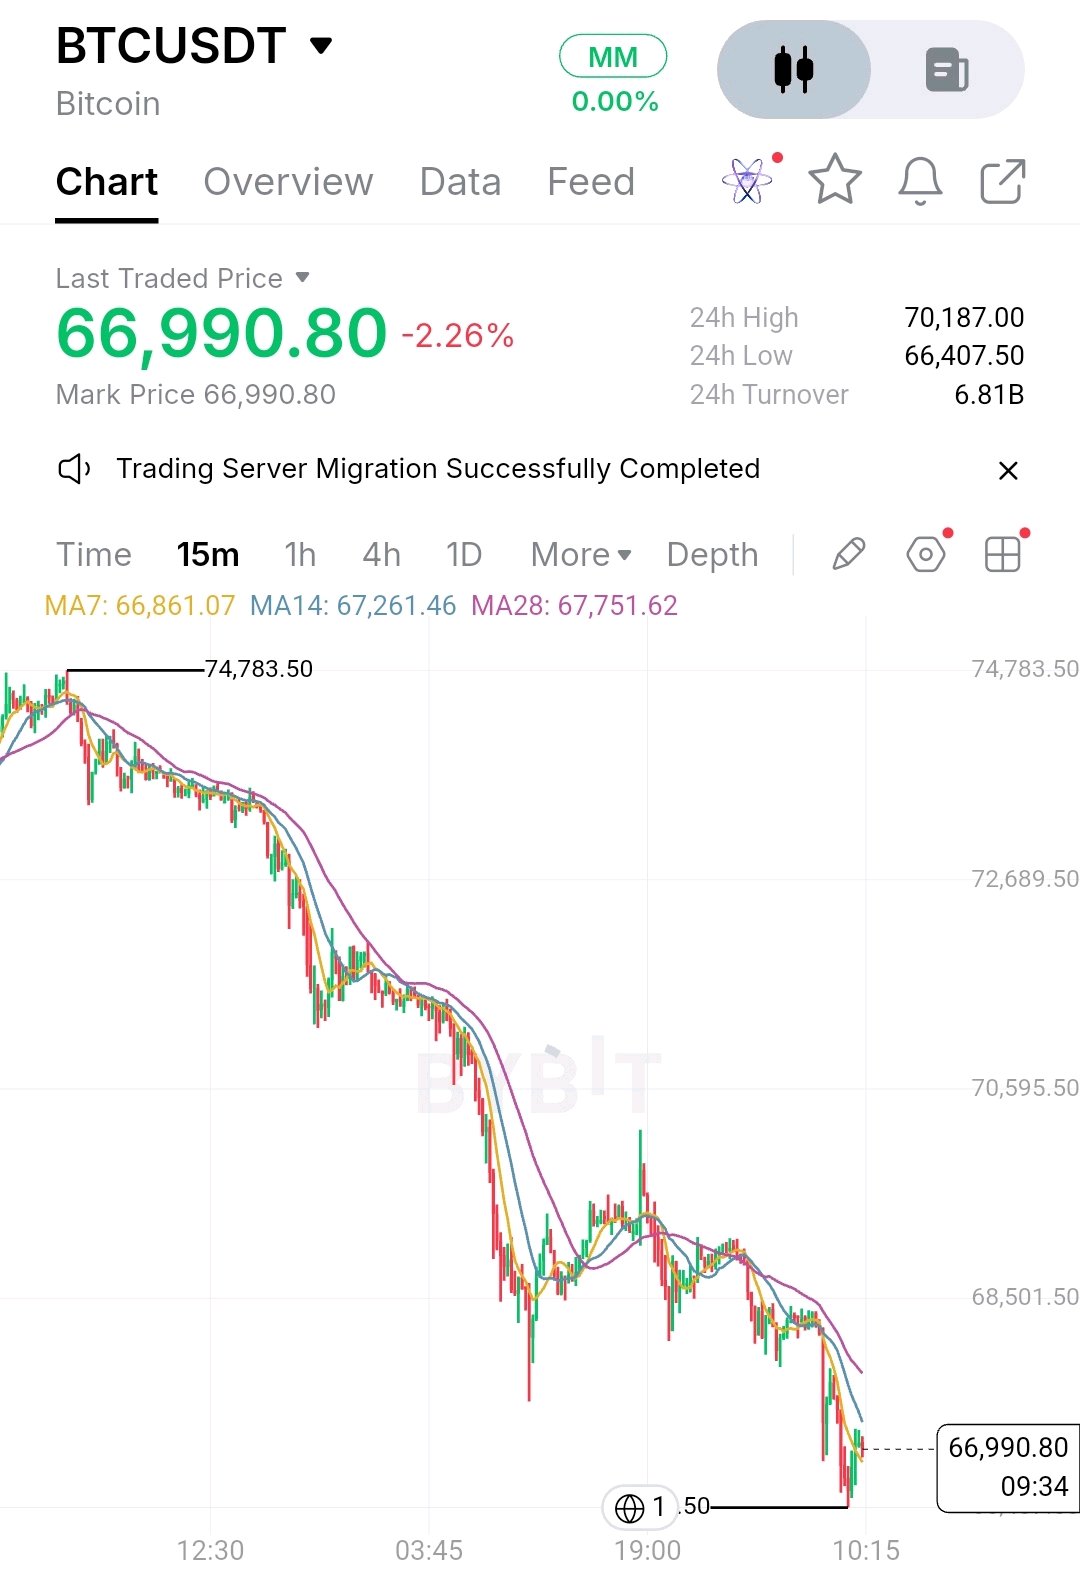
Bitcoin is bouncing, but the trend hasn't given bulls a reason to celebrate yet. BTC is trading around $66,990 after testing the $66,407 area. Here's the detail I'm watching: Price has recovered above the 15M MA7 ($66,861), but remains below the MA14 ($67,261) and MA28 ($67,751). That tells me something important: short-term buying pressure has appeared, but the broader intraday momentum remains bearish. Key levels to watch: - $66,407: Critical support and recent 24H low. - $67,261: First resistance to reclaim. - $67,751: Next major confirmation level. If buyers reclaim both moving averages and hold above them, the recovery becomes more convincing. But losing $66,407 would put bearish continuation back in focus. I'm not calling this a reversal yet. The important distinction: A bounce after a sharp selloff is not the same as a trend reversal. Would you trust this recovery, or wait for $67,750 to be reclaimed first? $BTCUSDT #IMPACTbyTrade
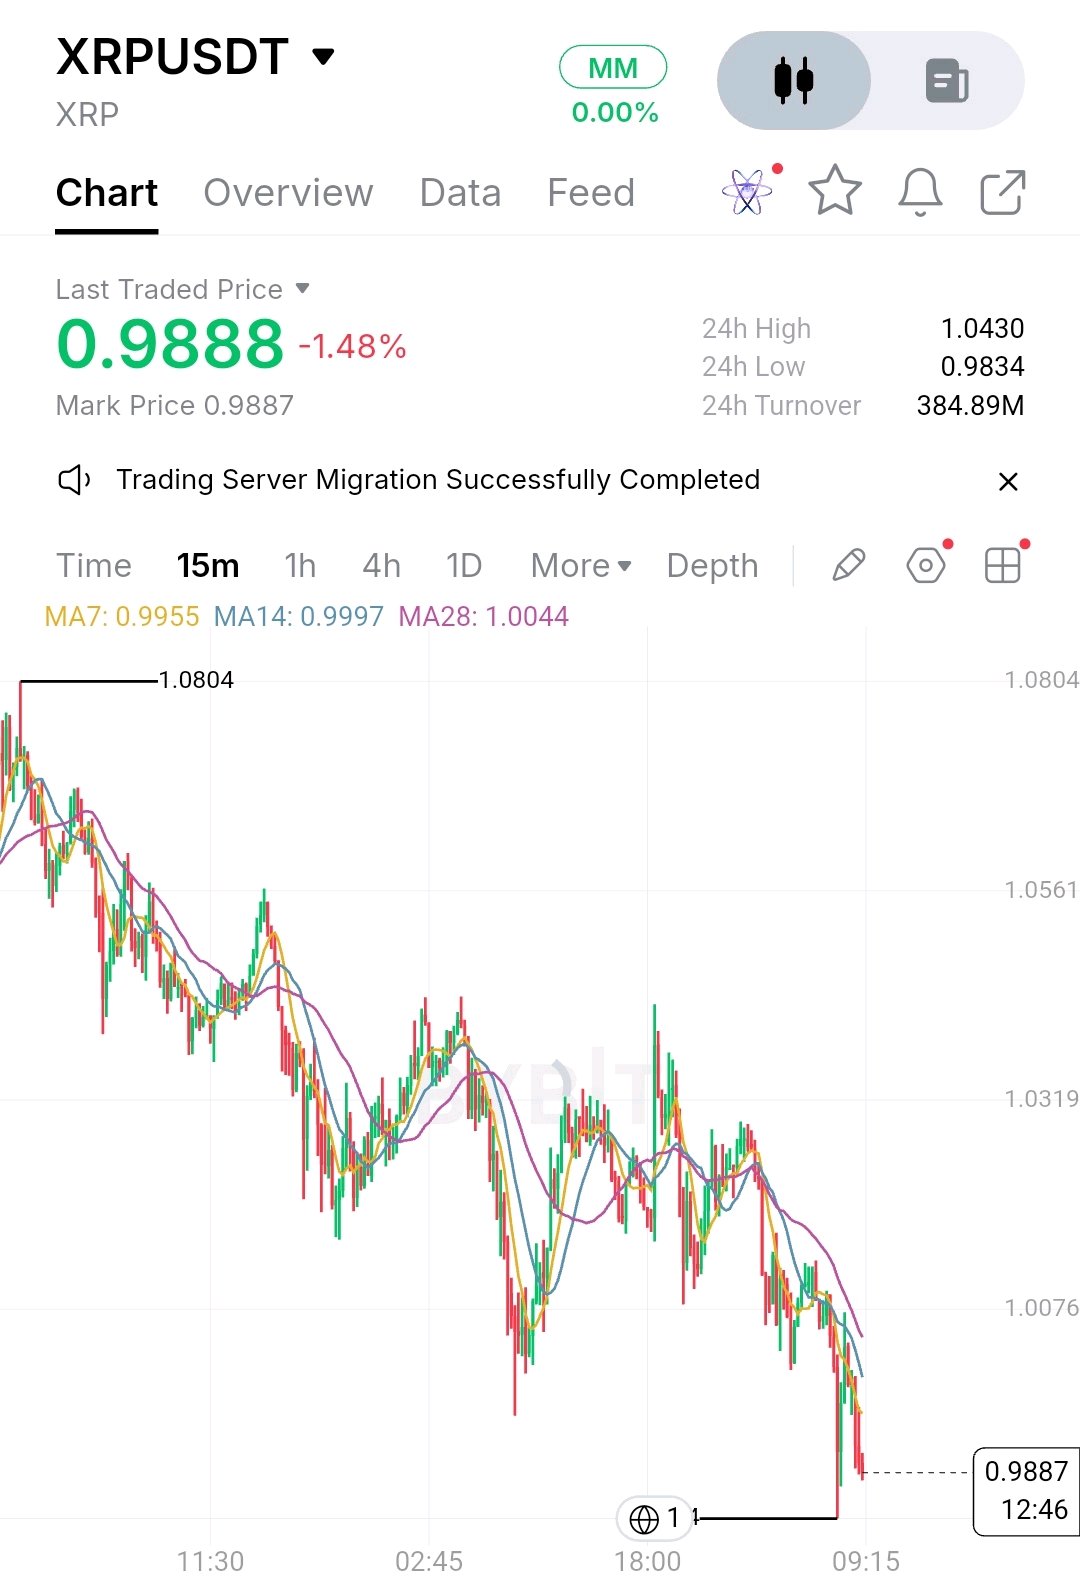
XRP is approaching its 24H low, but the bigger concern is what the moving averages are telling us. XRP is trading around $0.9888, down 1.48%, with the 24H low sitting at $0.9834. Look closely at the 15M chart: - MA7: $0.9955 - MA14: $0.9997 - MA28: $1.0044 All three moving averages are above price and bearishly aligned. Here's the detail many traders may overlook: XRP isn't just testing support. It's doing so while short-term momentum remains weak and price is trading below every displayed moving average. What I'm watching next: 🔻 A break below $0.9834 could open the door to further downside. 🔺 Reclaiming $0.9955, followed by $1.0000, would be the first sign of improving short-term structure. For now, I want to see buyers prove themselves before calling this a reversal. Will XRP defend $0.9834, or are we about to see another leg down? $XRPUSDT #IMPACTbyTrade
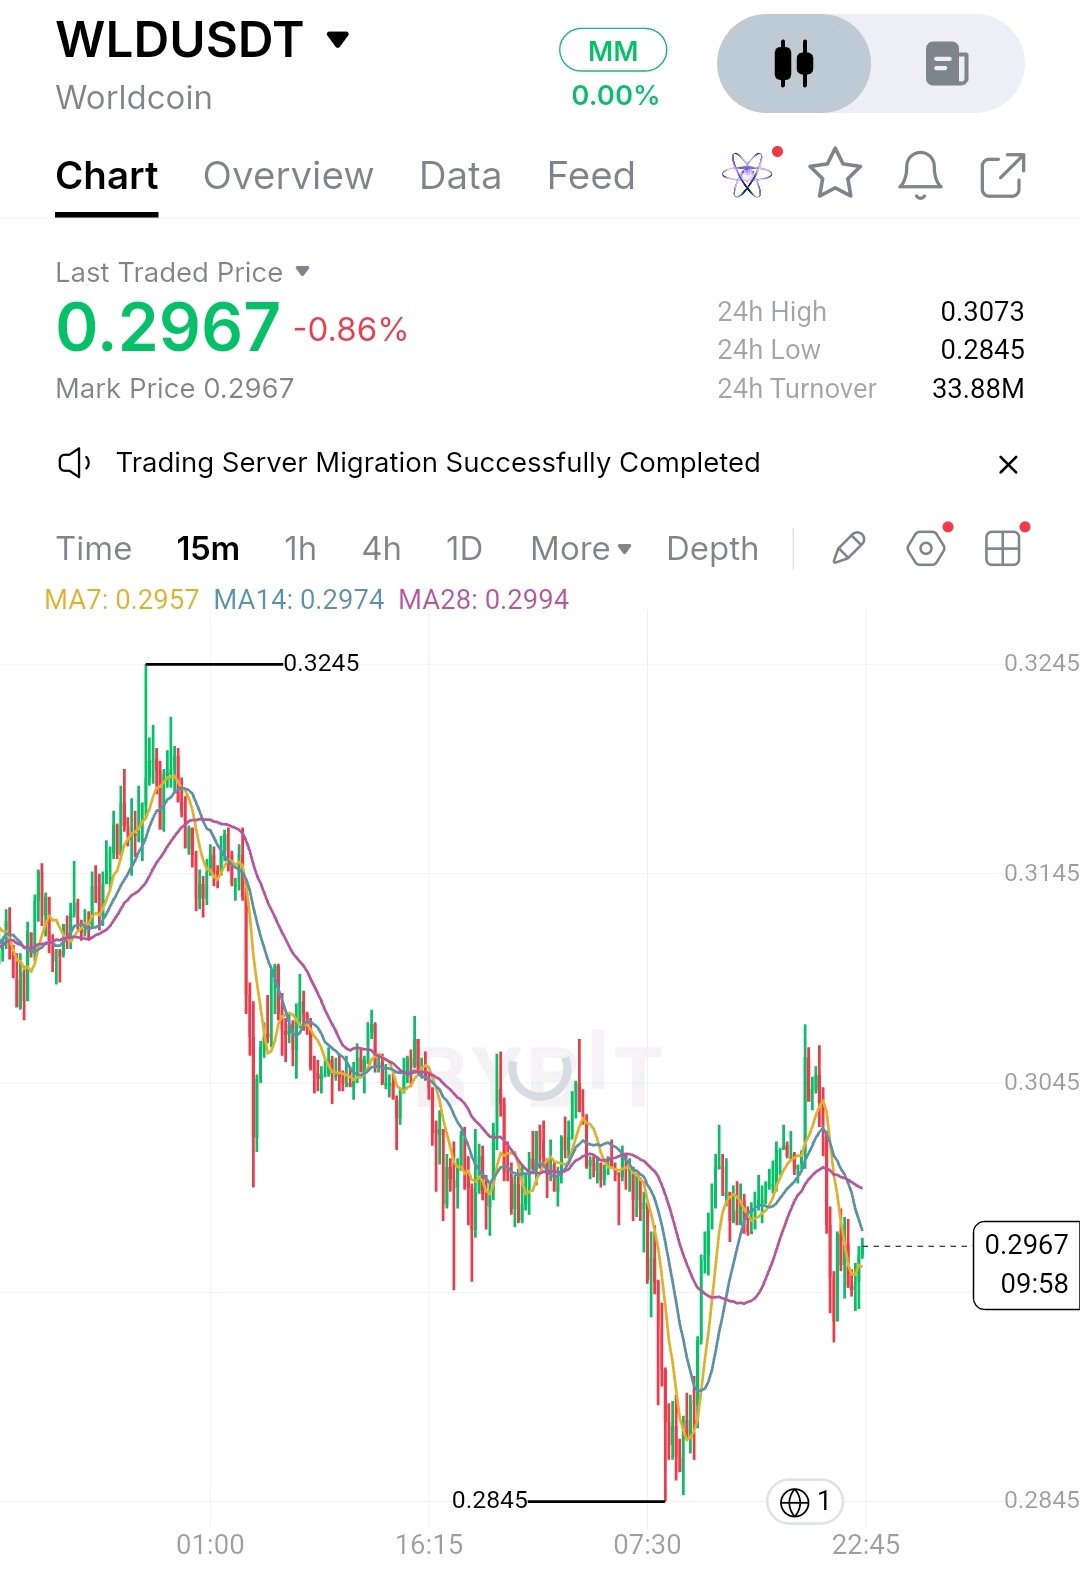
WLD is bouncing, but buyers still haven't taken control. 👀 And there's one level I'm watching closely. On the 15M chart, WLD recovered sharply from **$0.2845**, pushing towards $0.3073 before facing a strong rejection. Now price is sitting around **$0.2967**, below MA14 ($0.2974) and MA28 ($0.2994). Here's what matters: The bounce looks encouraging, but the broader short-term structure remains weak. The rejection near $0.3073 suggests sellers are still defending higher prices. **My key levels:** 🔹 Resistance: $0.2994–$0.3073 🔹 Support: $0.2845 A sustained reclaim of $0.2994, followed by a break above $0.3073, would strengthen the bullish case. But losing the current recovery and revisiting $0.2845 would put buyers under serious pressure. I'm not chasing this bounce. I want confirmation that buyers can actually reclaim resistance. **Is this the beginning of a recovery, or just another lower high before the next leg down?** $WLDUSDT #IMPACTbyTrade

SOL bounced from $77.82, but the recovery is already showing signs of weakness. Here’s what caught my attention on the 15M chart. Price rallied toward the $81 area after the sharp sell-off, but buyers failed to sustain that recovery. Now SOL is trading around $79.64, below both the MA14 ($80.045) and MA28 ($80.399). The important detail: the short-term bounce hasn't changed the broader bearish structure. **Levels I'm watching:** 🔹 $80.00–$80.40: Key resistance zone. Reclaiming this area and holding above it would improve the bullish case. 🔹 $77.82: Critical local support. A breakdown could expose SOL to further downside. I don't want to mistake a relief bounce for a reversal. Until buyers reclaim resistance, patience is more valuable than chasing momentum. Will SOL reclaim $80.40, or revisit $77.82 first? $SOLUSDT #IMPACTbyTrade

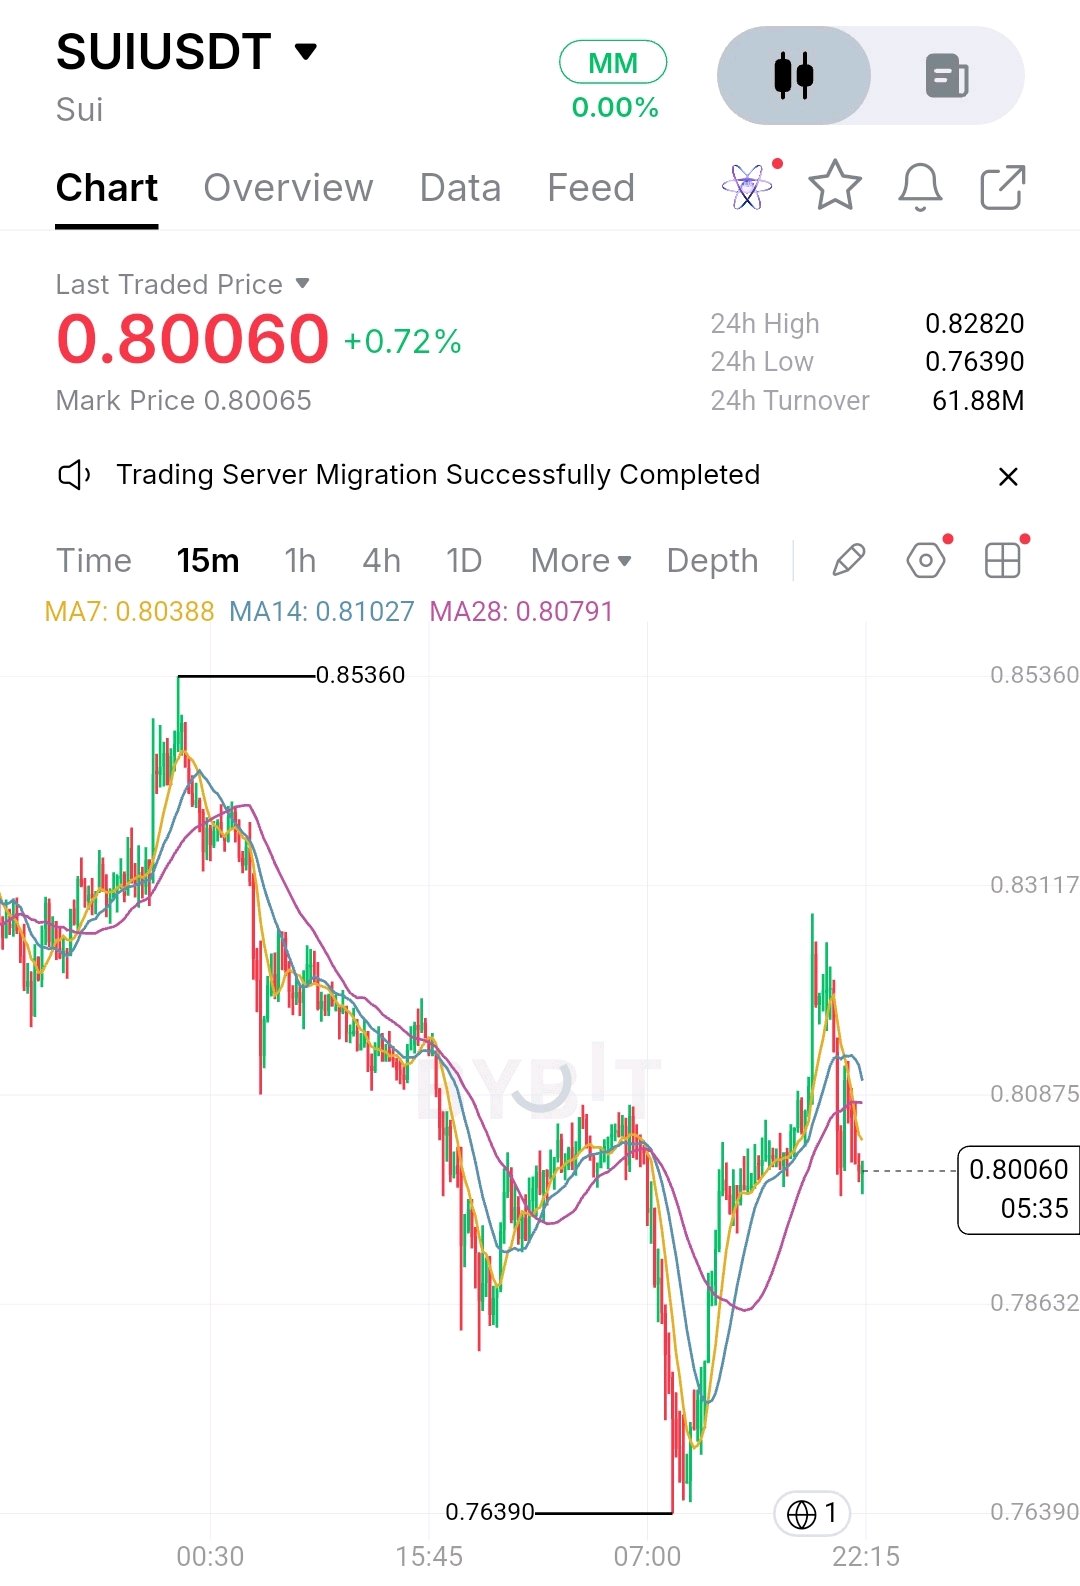
SUI just showed why a strong bounce doesn't automatically mean a trend reversal. After recovering from the $0.7639 low, buyers pushed price sharply higher, but the rally faced rejection near the $0.8282 area. Now comes the important part. SUI is trading at $0.8006, below all three moving averages: • MA7: $0.80388 • MA14: $0.81027 • MA28: $0.80791 The interesting detail is that the short-term MA structure has turned bearish again after the recovery. I'm watching the $0.8040–$0.8103 zone closely. Buyers need to reclaim this area and hold above it before I consider the recovery gaining strength. Two scenarios matter now: 🟢 Bullish: Reclaim $0.8103, opening the possibility of another move toward $0.8282. 🔴 Bearish: Lose $0.7863, increasing the risk of a retest of $0.7639. My takeaway: The bounce is real, but buyers still haven't proven they can sustain control. Would you trust this recovery, or wait for confirmation? $SUIUSDT #IMPACTbyTrade

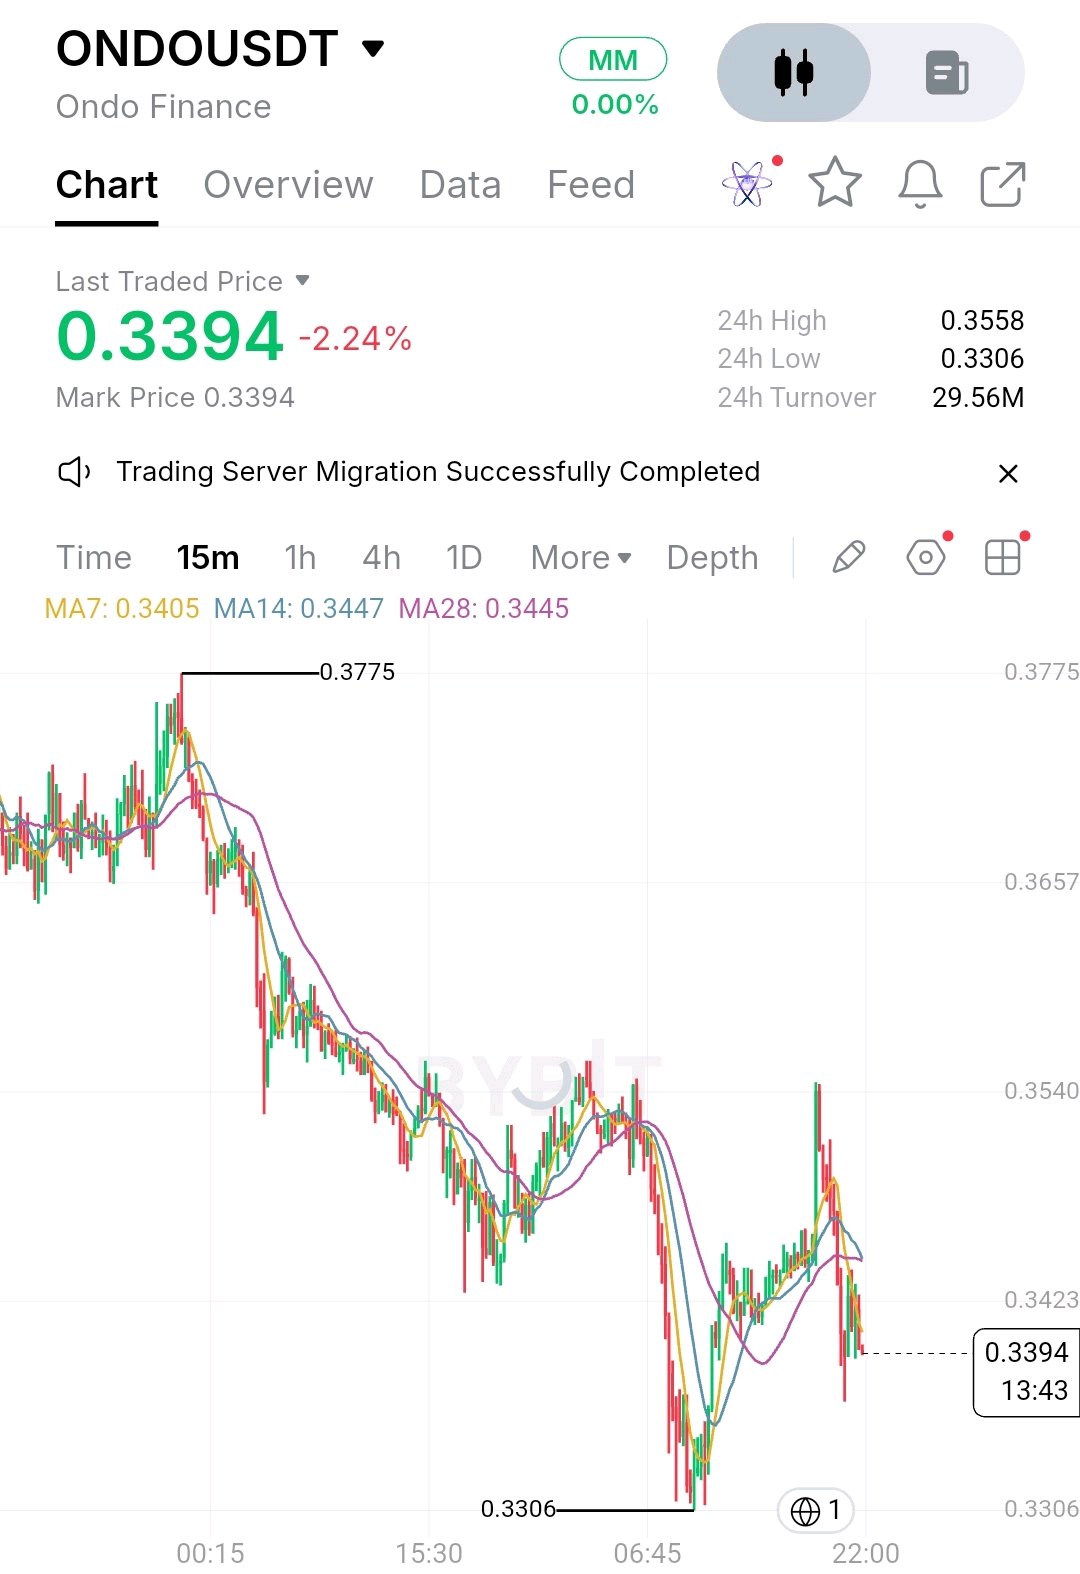
ONDO is showing why a bounce doesn't automatically mean a reversal. After recovering from $0.3306, ONDO pushed toward $0.3540 but failed to sustain the move. Sellers stepped back in, sending price down to $0.3394. Here's the detail I'm watching: Price is now trading below all three short-term moving averages: - MA7: $0.3405 - MA14: $0.3447 - MA28: $0.3445 That puts the short-term recovery under pressure. My levels to watch: 🔹 $0.3423: First area to reclaim. 🔹 $0.3445–$0.3447: MA resistance zone. 🔹 $0.3306: Critical recent swing low. A reclaim of the moving averages could open the door to another recovery attempt. But if $0.3306 breaks, downside pressure could accelerate. I'm not buying this bounce blindly. I want to see buyers prove they can regain control first. Would you wait for a reclaim or watch for a breakdown? $ONDOUSDT #IMPACTbyTrade
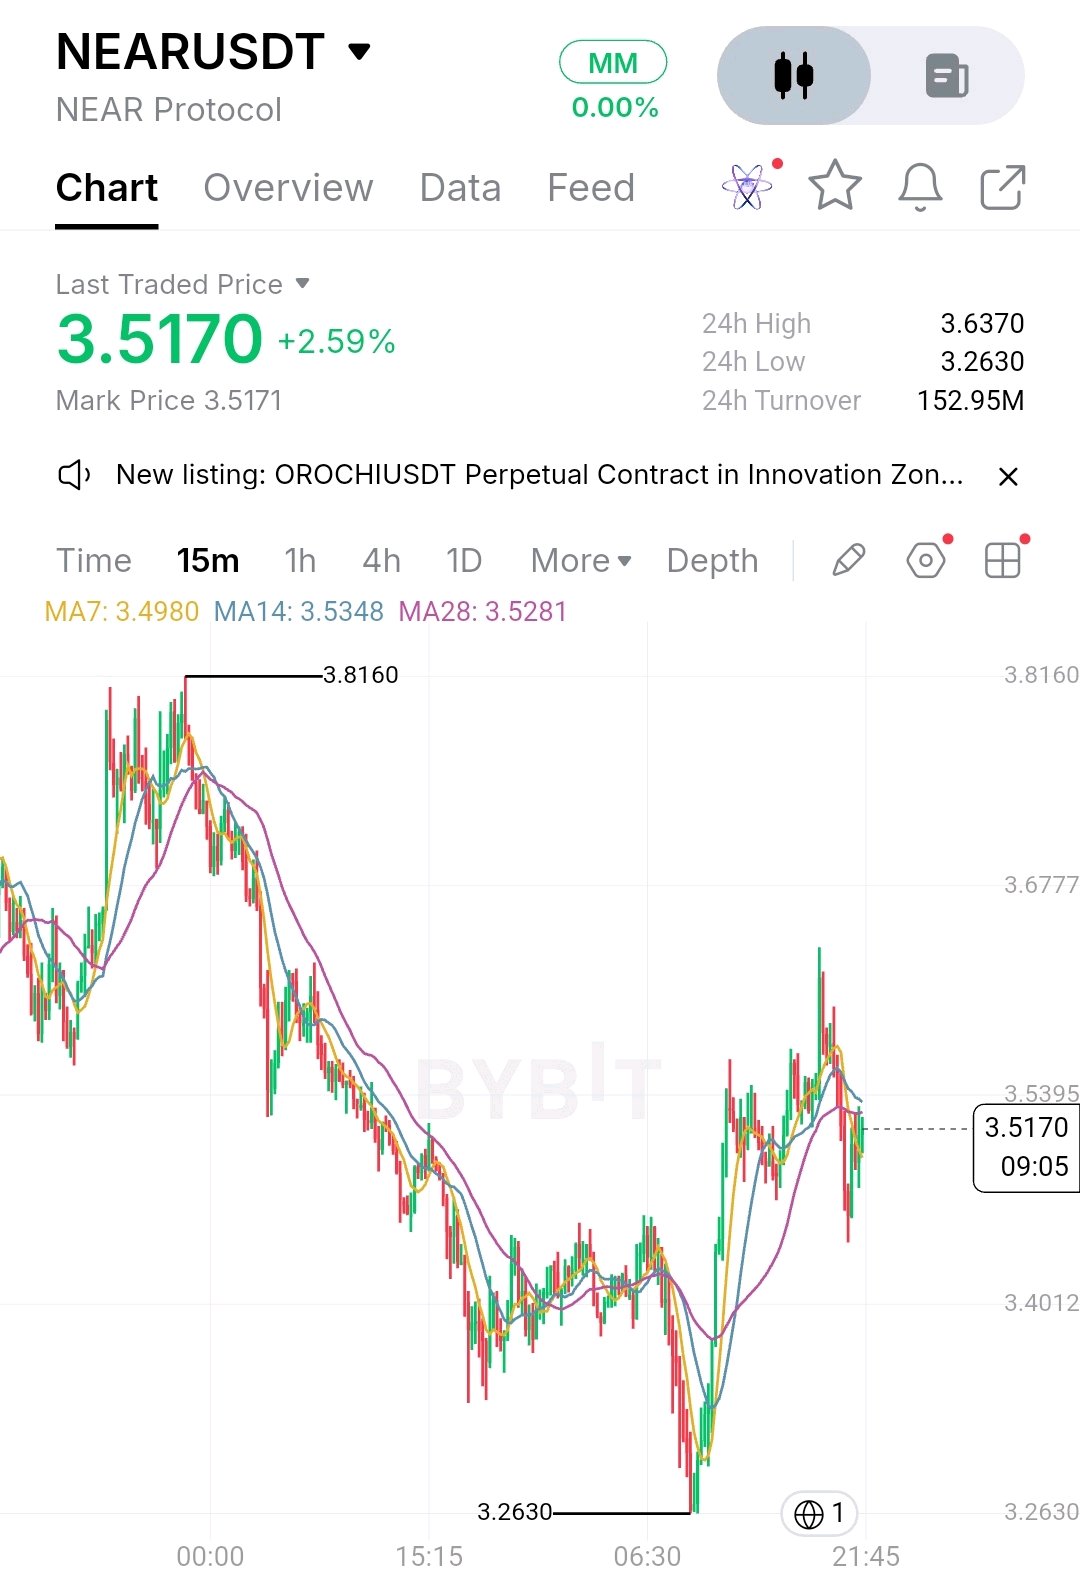
NEAR is recovering, but there’s one important detail traders shouldn't ignore. 👀 After dropping to $3.263, NEAR staged a sharp recovery, climbing back above $3.50. But the real test is happening now. On the 15M chart, price is trading at $3.5170, while the MA14 ($3.5348) and MA28 ($3.5281) are still overhead. That means the rebound has improved short-term momentum, but buyers haven't fully reclaimed control. Here's what I'm watching: 🟢 Bullish: A sustained move above $3.535 could open the door toward $3.58 and the $3.637 daily high. 🔴 Bearish: Failure to reclaim this moving-average cluster could send price back toward $3.49, with $3.40 as a deeper support zone. The interesting part? NEAR has recovered significantly from its daily low, but the next resistance test will determine whether this is a genuine trend shift or just a relief bounce. I'm watching confirmation, not chasing the recovery. Would you trust buyers to push NEAR above $3.54? $NEARUSDT #IMPACTbyTrade
GRAMUSDT has recovered from its 24H low, but there is one important detail I'm watching. 👀 Price dropped sharply from $1.2900 to $1.1180 before stabilizing around $1.1450. Now, the 15M chart shows something interesting: MA7, MA14 and MA28 have converged around $1.141–$1.143, with price trading slightly above all three. This suggests short-term selling pressure is cooling, but it doesn't confirm a bullish reversal. Here's what matters next: • Bullish: Holding above $1.141 and reclaiming $1.15–$1.16 could open the door to a stronger recovery. • Bearish: Losing the $1.141 area puts the $1.1180 low back in focus. I'm watching for a confirmed breakout rather than chasing this consolidation. The key question: Is this the beginning of a recovery, or simply a pause before another leg down? $GRAMUSDT #IMPACTbyTrade