POOKiEE
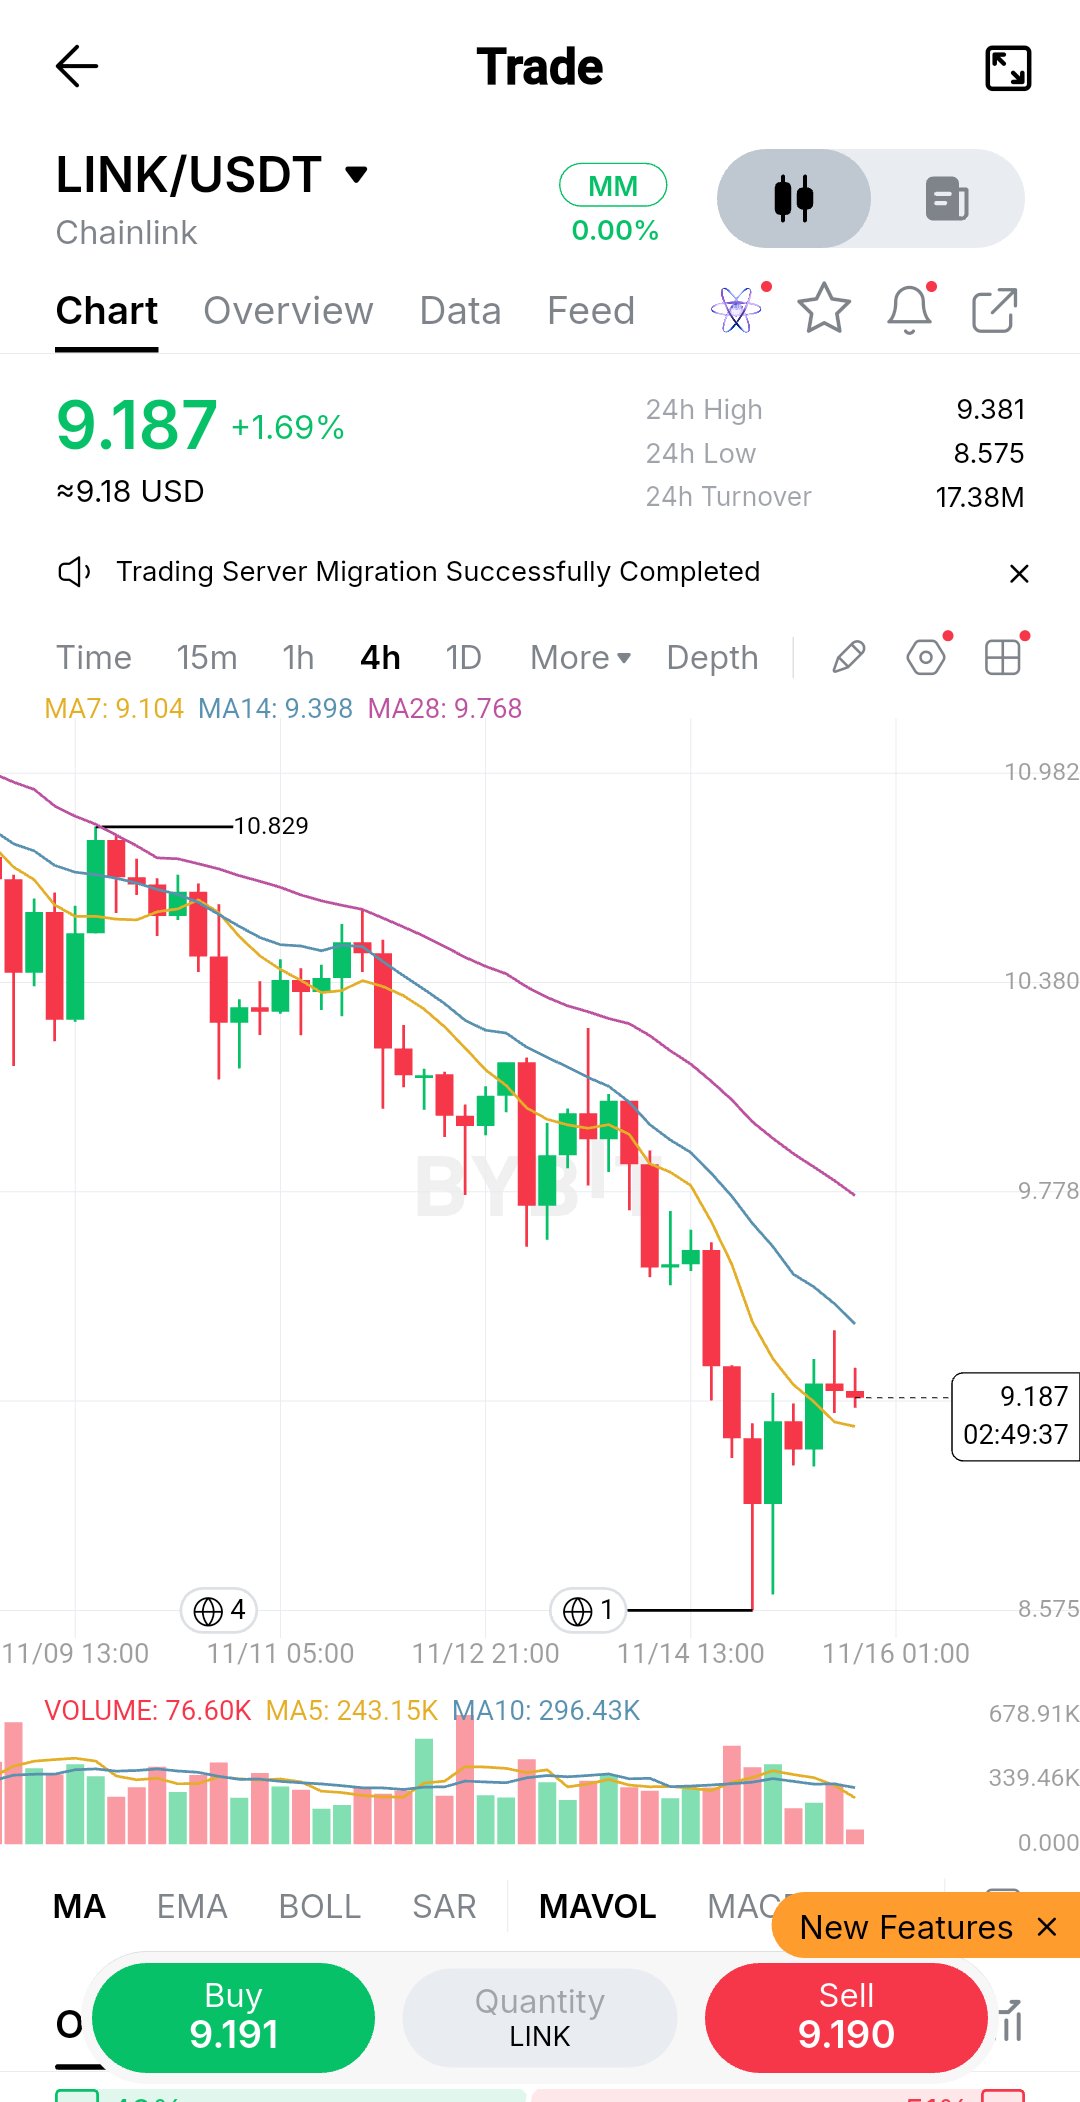
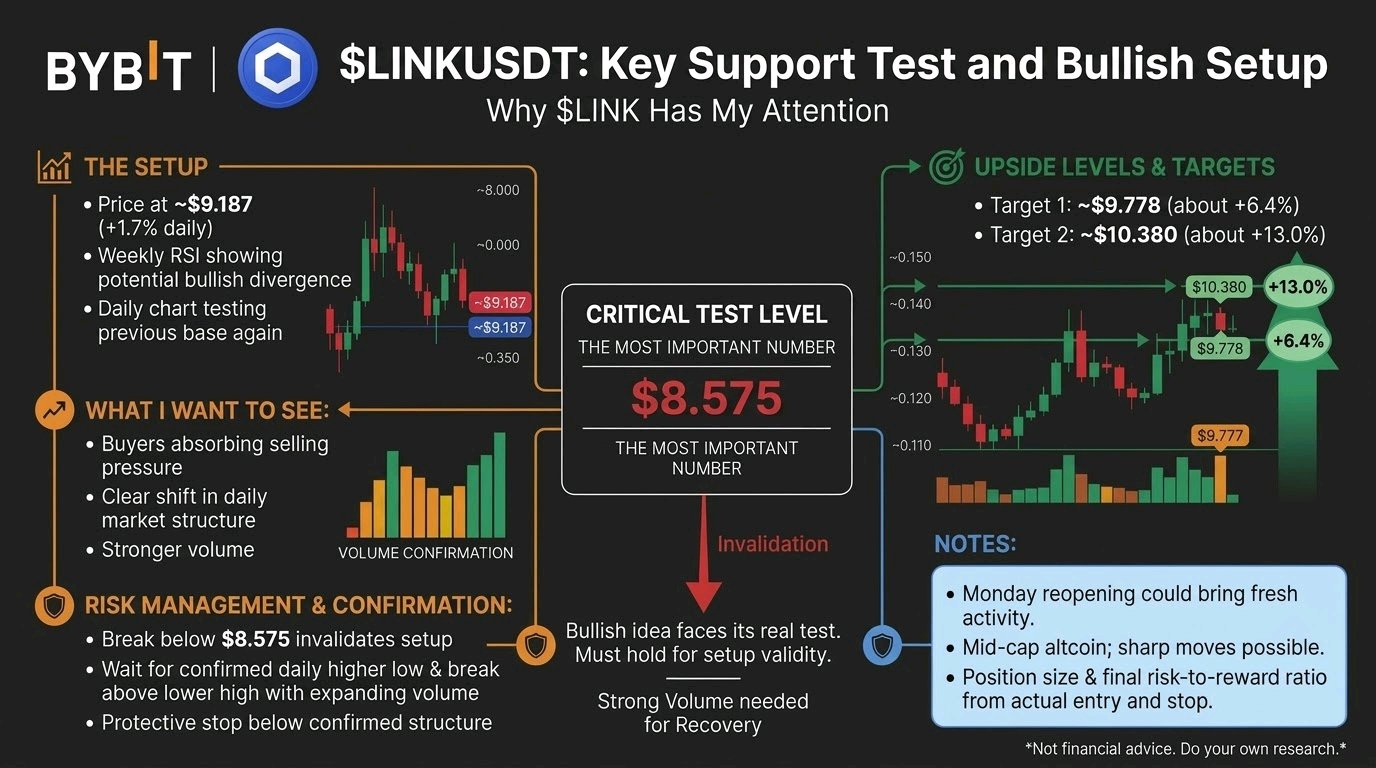
One red line. Two upside levels. This is why $LINKUSDT has my attention. The most important number on my chart is $8.575. That's where my bullish idea faces its real test. The setup $LINK is up about 1.7% on the day at roughly $9.187 after a bounce off the lows, and it is trading far below its prior highs after a steep multi-day slide. Weekly RSI analysis suggests a possible bullish divergence. The daily chart has already shown an initial reaction, and price is now testing that base again. What I want to see is buyers absorbing the selling pressure, followed by a clear shift in daily market structure. If that happens with stronger volume, I'm watching two swing levels: 🎯 Target 1: ~$9.778 (about +6.4% from $9.187) 🎯 Target 2: ~$10.380 (about +13% from $9.187) These are ambitious scenarios, not guaranteed returns. Monday's reopening of traditional markets could bring fresh activity, but $LINK needs its own buying volume to support a meaningful recovery. As a mid-cap altcoin, sharp moves can happen in either direction. Management: If price breaks below $8.575 and cannot recover that level, my bullish setup is no longer valid. For a new position, I want a confirmed daily higher low, a break above the latest lower high, and expanding volume. The protective stop belongs below the confirmed structure. Position size and the final risk-to-reward ratio must be calculated from the actual entry and stop, not assumed in advance. I'm heavily bullish on $LINK's recovery potential, but the next volume-backed move will determine whether this remains a promising chart or becomes a trade worth taking. Not financial advice. Do your own research and manage your risk. #IMPACTbyTrade
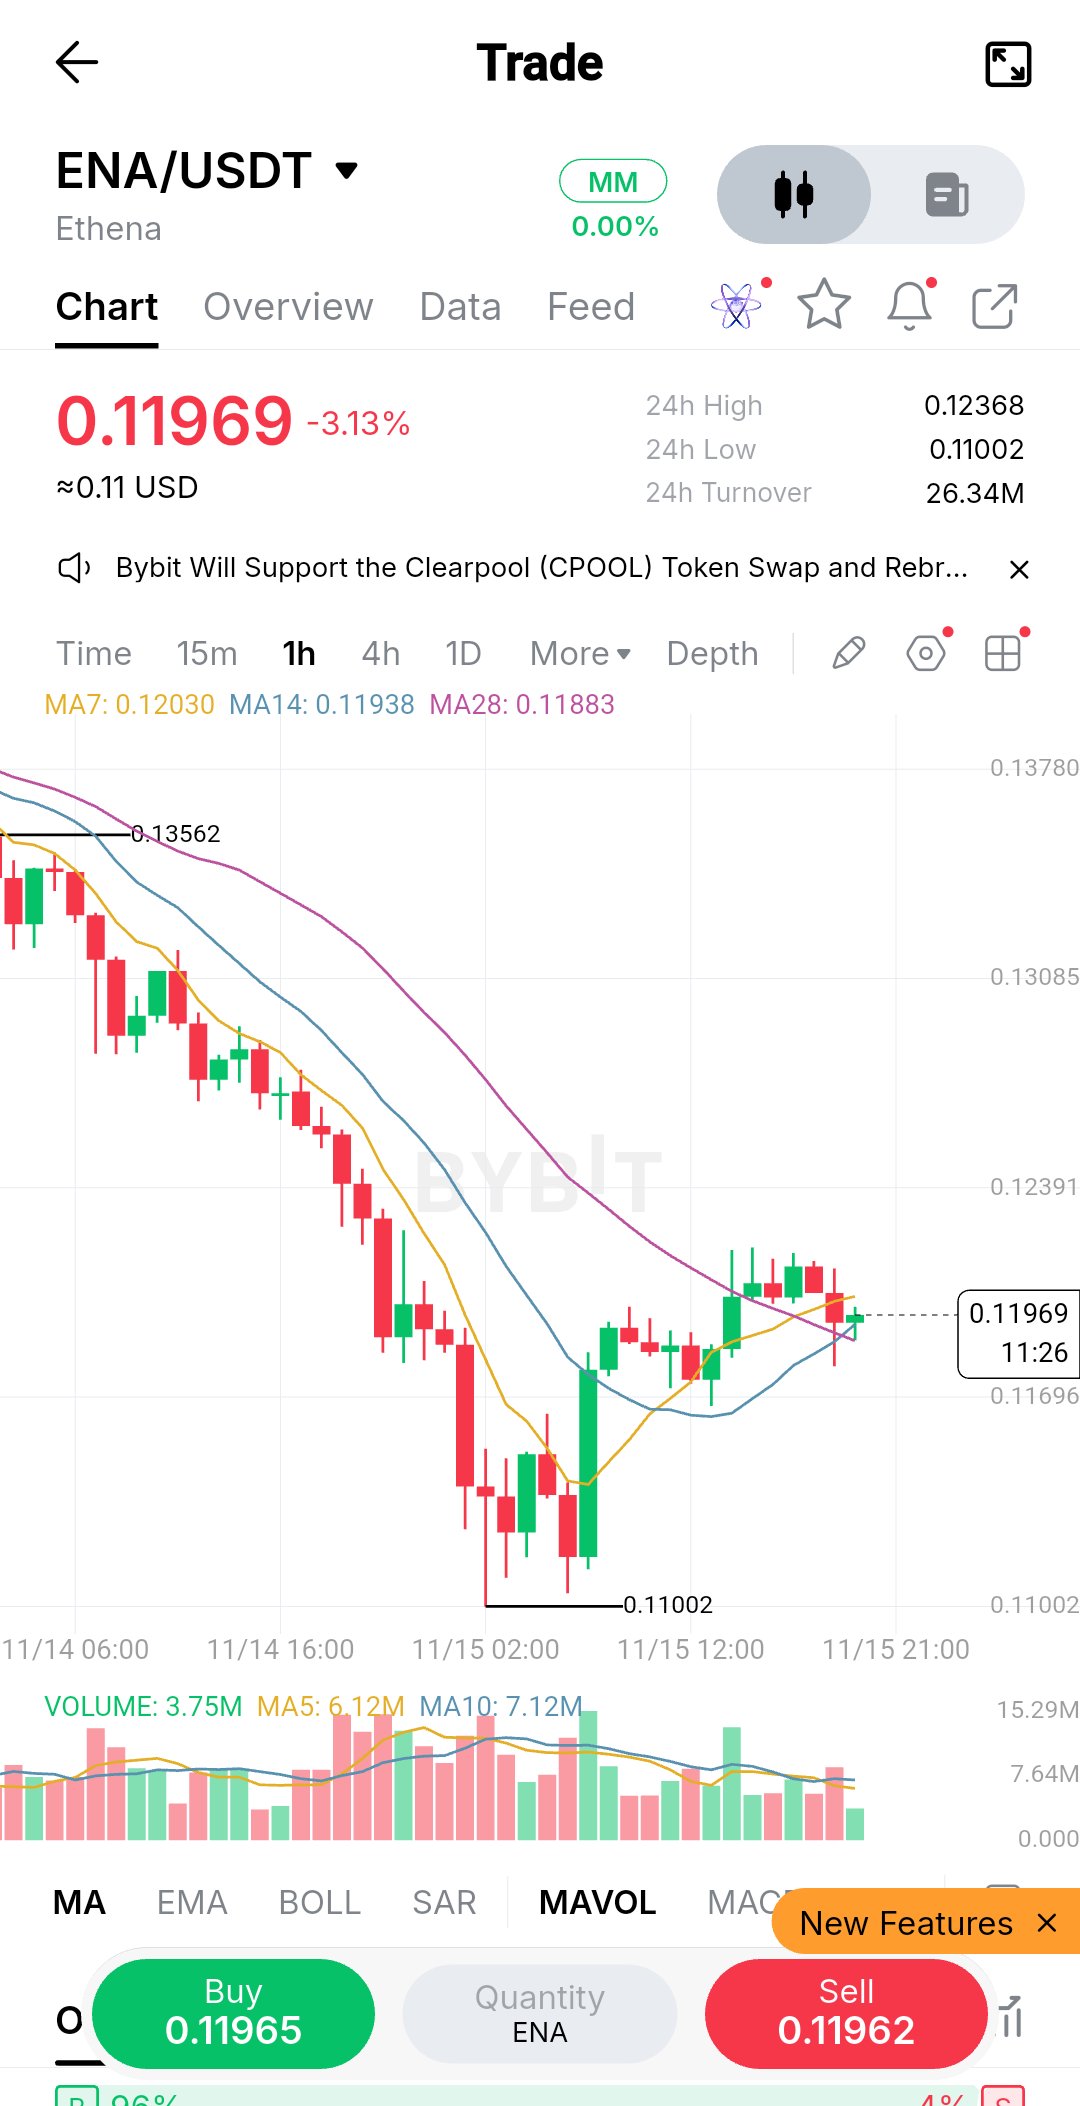
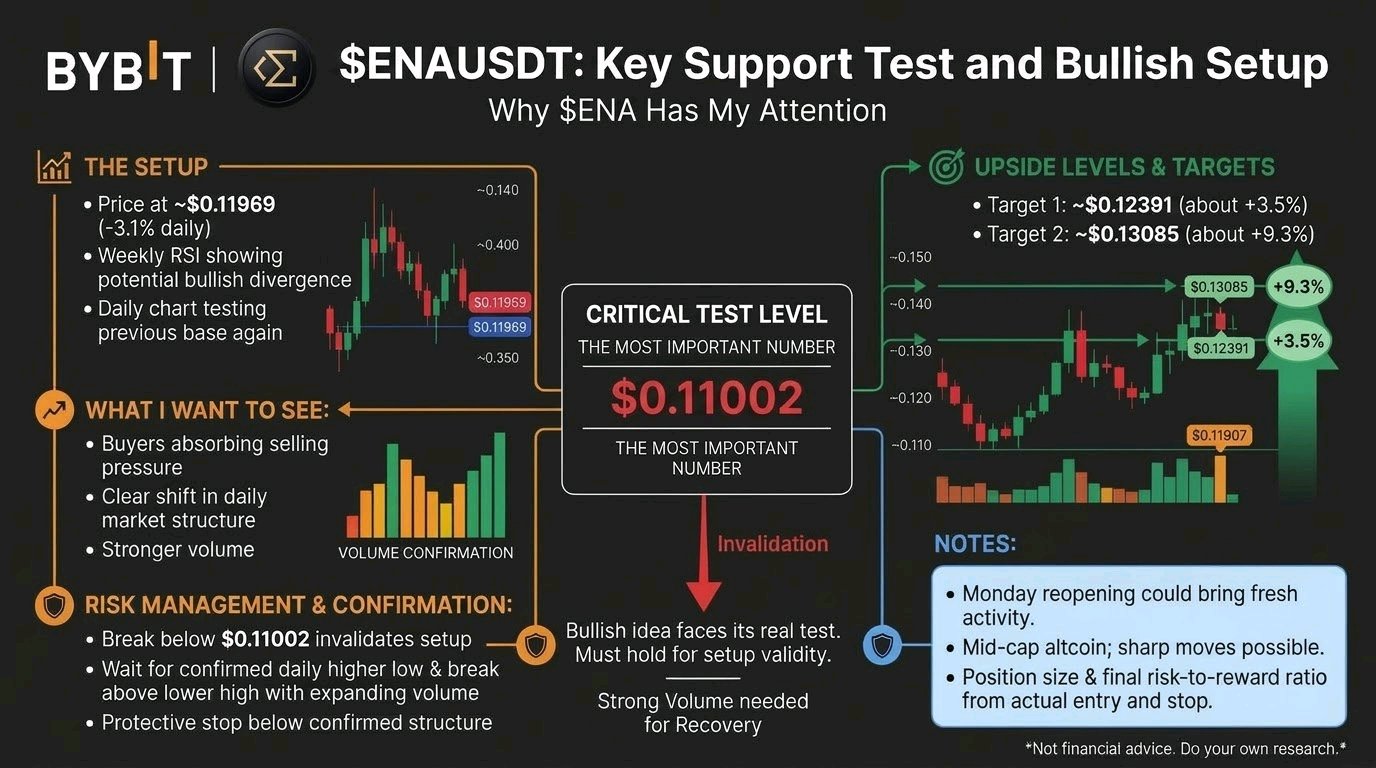
One red line. Two upside levels. This is why $ENAUSDT has my attention. The most important number on my chart is $0.11002. That's where my bullish idea faces its real test. The setup $ENA is down about 3.1% on the day at roughly $0.11969, and it is trading far below its prior highs after a steep multi-day slide. Weekly RSI analysis suggests a possible bullish divergence. The daily chart has already shown an initial reaction, and price is now testing that base again. What I want to see is buyers absorbing the selling pressure, followed by a clear shift in daily market structure. If that happens with stronger volume, I'm watching two swing levels: 🎯 Target 1: ~$0.12391 (about +3.5% from $0.11969) 🎯 Target 2: ~$0.13085 (about +9.3% from $0.11969) These are ambitious scenarios, not guaranteed returns. Monday's reopening of traditional markets could bring fresh activity, but $ENA needs its own buying volume to support a meaningful recovery. As a mid-cap altcoin, sharp moves can happen in either direction. Management: If price breaks below $0.11002 and cannot recover that level, my bullish setup is no longer valid. For a new position, I want a confirmed daily higher low, a break above the latest lower high, and expanding volume. The protective stop belongs below the confirmed structure. Position size and the final risk-to-reward ratio must be calculated from the actual entry and stop, not assumed in advance. I'm heavily bullish on $ENA's recovery potential, but the next volume-backed move will determine whether this remains a promising chart or becomes a trade worth taking. Not financial advice. Do your own research and manage your risk. #IMPACTbyTrade
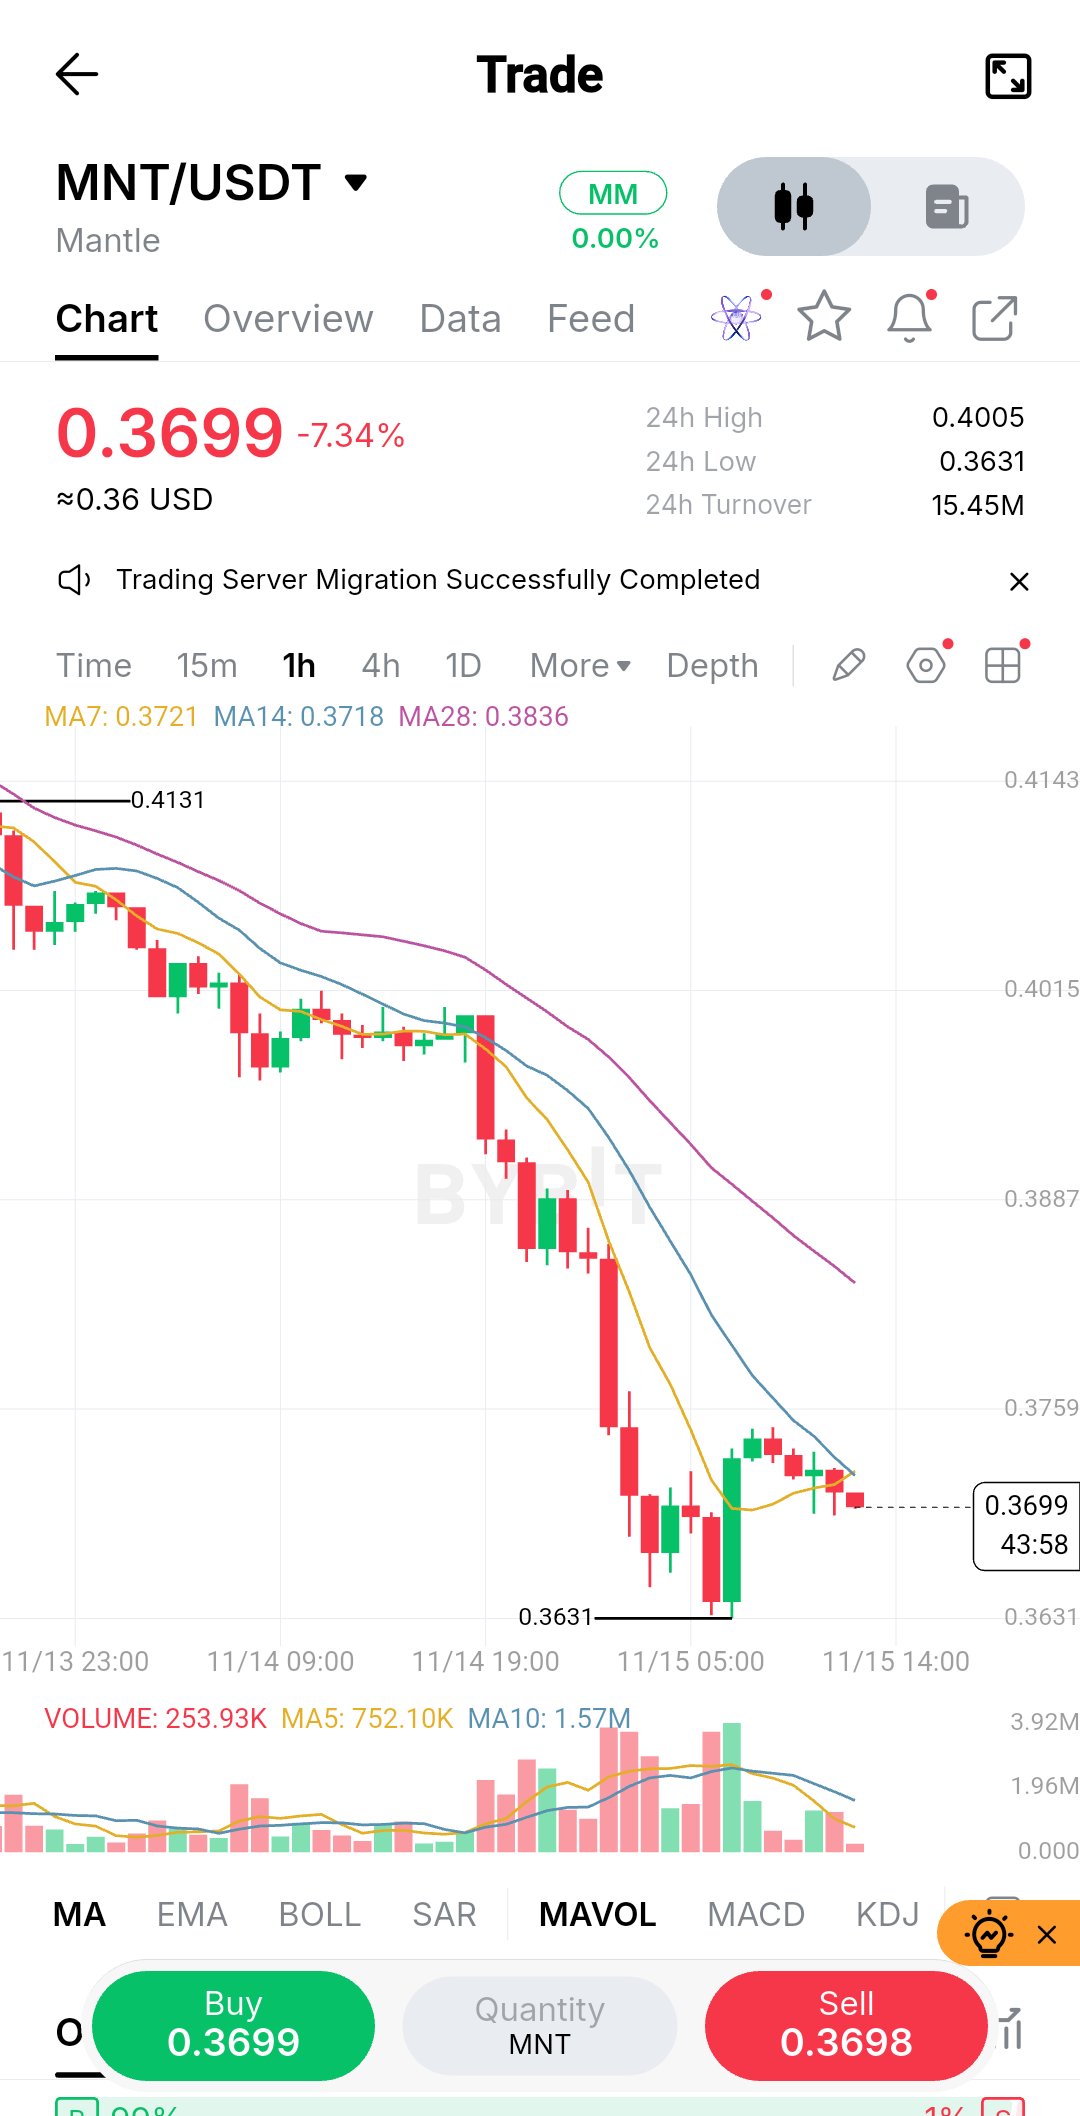
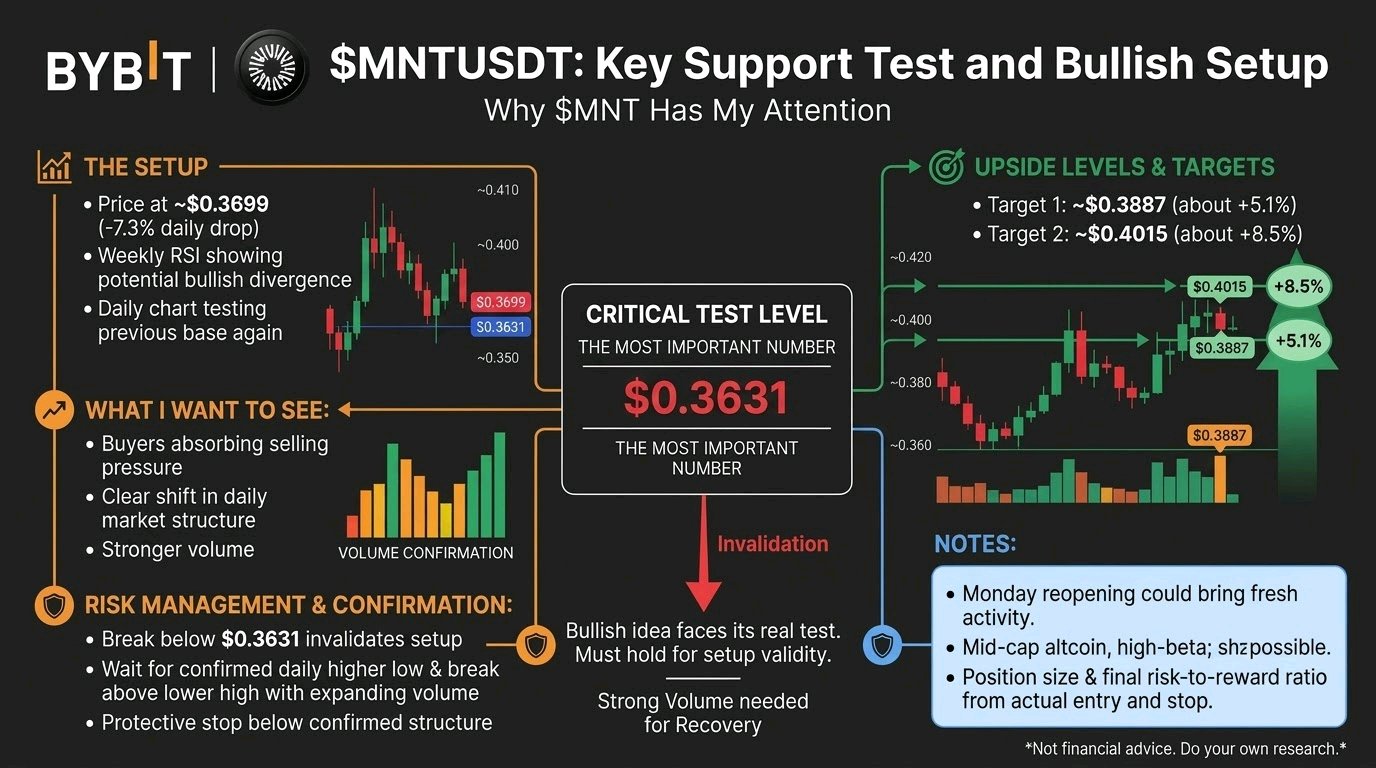
One red line. Two upside levels. This is why $MNTUSDT has my attention. The most important number on my chart is $0.3631. That's where my bullish idea faces its real test. The setup $MNT is down about 7.3% on the day at roughly $0.3699, and it is trading far below its prior highs after a steep multi-day slide. Weekly RSI analysis suggests a possible bullish divergence. The daily chart has already shown an initial reaction, and price is now testing that base again. What I want to see is buyers absorbing the selling pressure, followed by a clear shift in daily market structure. If that happens with stronger volume, I'm watching two swing levels: 🎯 Target 1: ~$0.3887 (about +5.1% from $0.3699) 🎯 Target 2: ~$0.4015 (about +8.5% from $0.3699) These are ambitious scenarios, not guaranteed returns. Monday's reopening of traditional markets could bring fresh activity, but $MNT needs its own buying volume to support a meaningful recovery. As a mid-cap altcoin, sharp moves can happen in either direction, and a -7% day shows how fast it can go. Management: If price breaks below $0.3631 and cannot recover that level, my bullish setup is no longer valid. For a new position, I want a confirmed daily higher low, a break above the latest lower high, and expanding volume. The protective stop belongs below the confirmed structure. Position size and the final risk-to-reward ratio must be calculated from the actual entry and stop, not assumed in advance. I'm heavily bullish on $MNT's recovery potential, but the next volume-backed move will determine whether this remains a promising chart or becomes a trade worth taking. Not financial advice. Do your own research and manage your risk. #IMPACTbyTrade $MNTUSDT
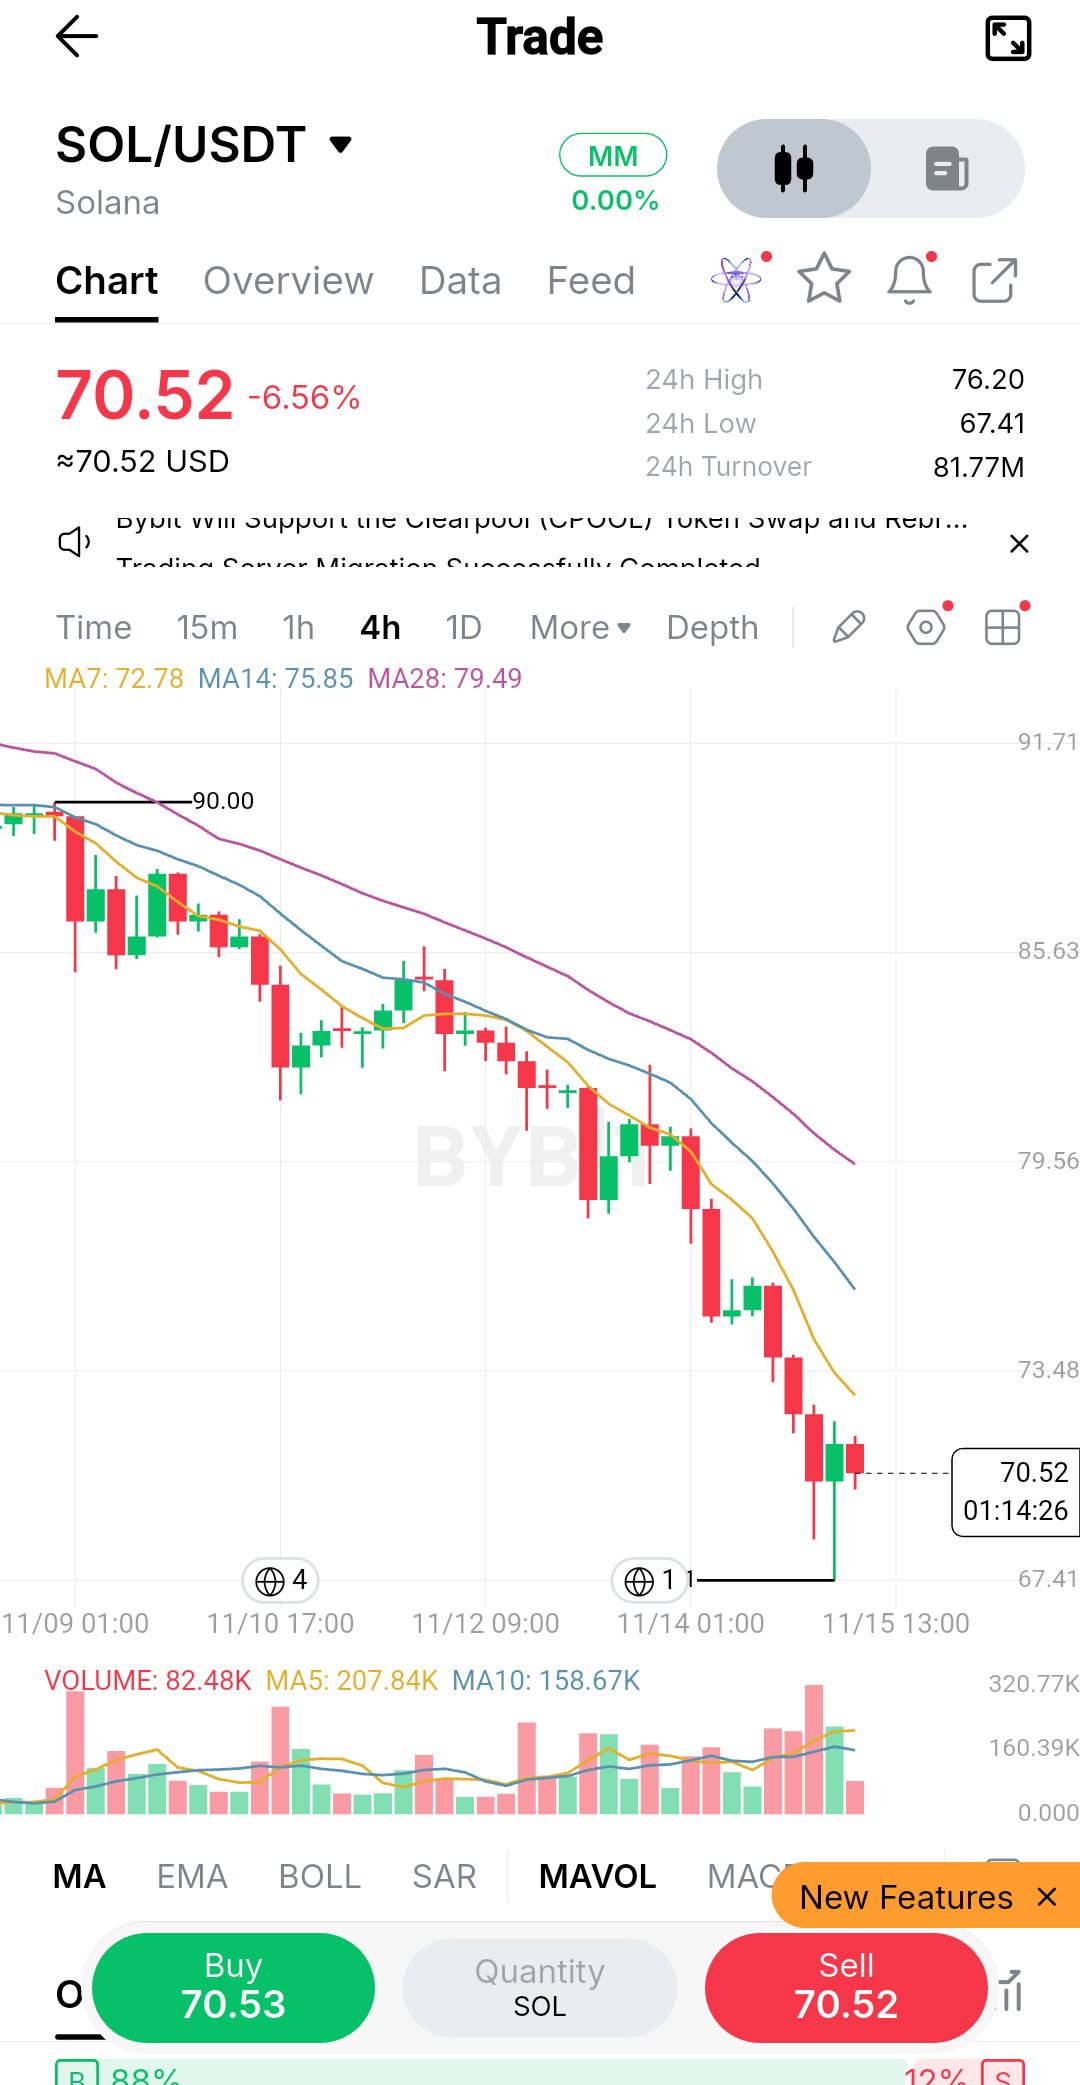
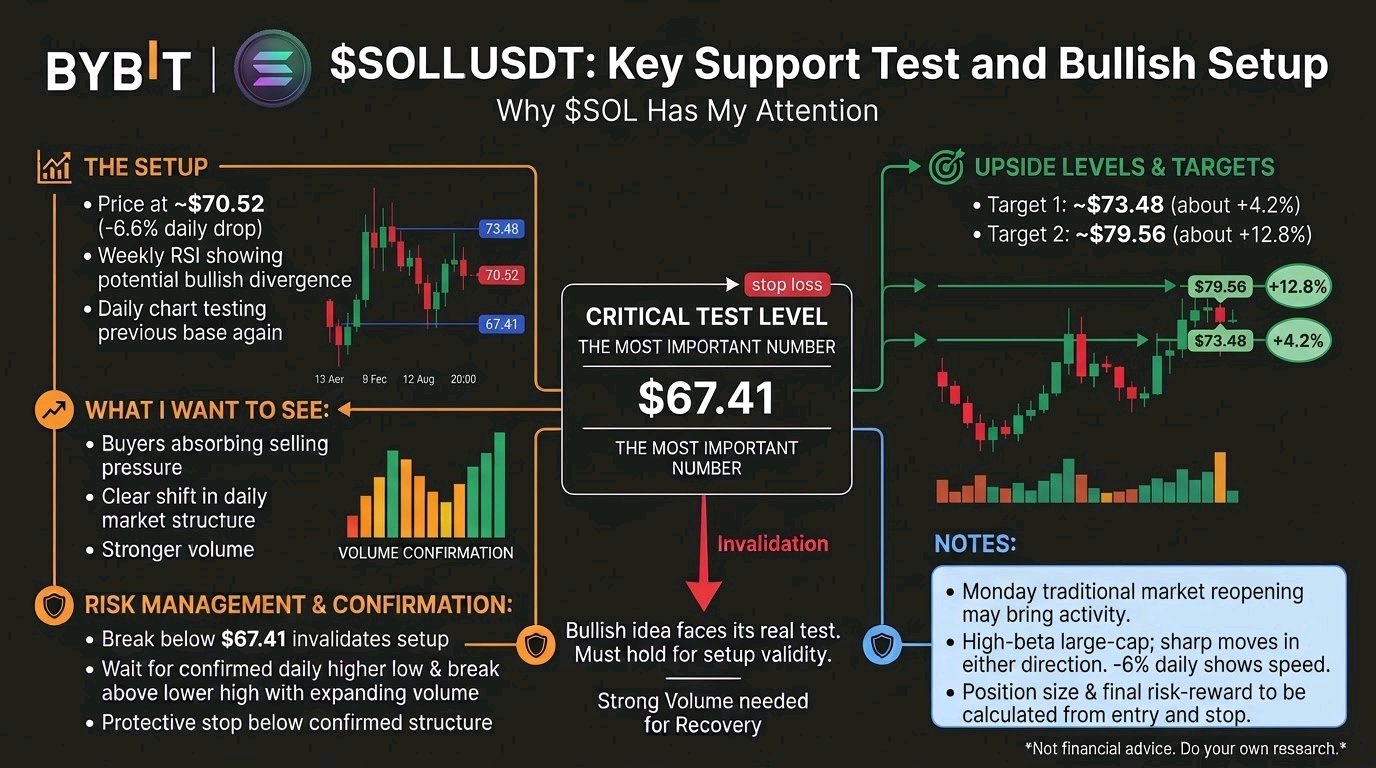
One red line. Two upside levels. This is why $SOLUSDT has my attention. The most important number on my chart is $67.41. That's where my bullish idea faces its real test. The setup $SOL is down about 6.6% on the day at roughly $70.52, and it is trading far below its prior highs after a steep multi-day slide. Weekly RSI analysis suggests a possible bullish divergence. The daily chart has already shown an initial reaction, and price is now testing that base again. What I want to see is buyers absorbing the selling pressure, followed by a clear shift in daily market structure. If that happens with stronger volume, I'm watching two swing levels: 🎯 Target 1: ~$73.48 (about +4.2% from $70.52) 🎯 Target 2: ~$79.56 (about +12.8% from $70.52) These are ambitious scenarios, not guaranteed returns. Monday's reopening of traditional markets could bring fresh activity, but $SOL needs its own buying volume to support a meaningful recovery. As a high-beta large-cap, sharp moves can happen in either direction, and a -6% day shows how fast it can go. Management: If price breaks below $67.41 and cannot recover that level, my bullish setup is no longer valid. For a new position, I want a confirmed daily higher low, a break above the latest lower high, and expanding volume. The protective stop belongs below the confirmed structure. Position size and the final risk-to-reward ratio must be calculated from the actual entry and stop, not assumed in advance. I'm heavily bullish on $SOL's recovery potential, but the next volume-backed move will determine whether this remains a promising chart or becomes a trade worth taking. Not financial advice. Do your own research and manage your risk. #IMPACTbyTrade
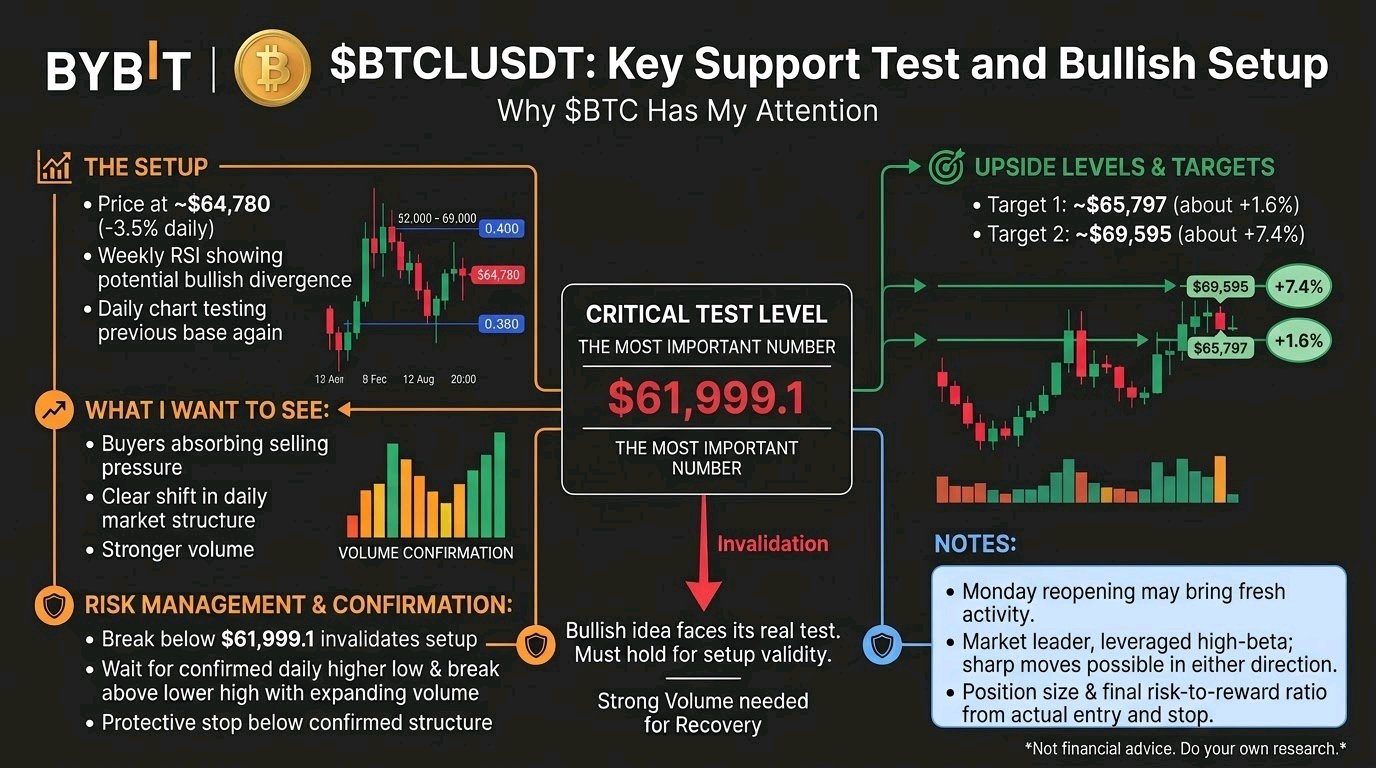
One red line. Two upside levels. This is why $BTCUSDT has my attention. The most important number on my chart is $61,999.1. That's where my bullish idea faces its real test. The setup $BTC is down about 3.5% on the day at roughly $64,780, and it is trading far below its prior highs after a steep multi-day slide. Weekly RSI analysis suggests a possible bullish divergence. The daily chart has already shown an initial reaction, and price is now testing that base again. What I want to see is buyers absorbing the selling pressure, followed by a clear shift in daily market structure. If that happens with stronger volume, I'm watching two swing levels: 🎯 Target 1: ~$65,797 (about +1.6% from $64,780) 🎯 Target 2: ~$69,595 (about +7.4% from $64,780) These are ambitious scenarios, not guaranteed returns. Monday's reopening of traditional markets could bring fresh activity, but $BTC needs its own buying volume to support a meaningful recovery. Even as the market leader, it is a leveraged, high-beta market, so sharp moves can happen in either direction. Management: If price breaks below $61,999.1 and cannot recover that level, my bullish setup is no longer valid. For a new position, I want a confirmed daily higher low, a break above the latest lower high, and expanding volume. The protective stop belongs below the confirmed structure. Position size and the final risk-to-reward ratio must be calculated from the actual entry and stop, not assumed in advance. I'm heavily bullish on $BTC's recovery potential, but the next volume-backed move will determine whether this remains a promising chart or becomes a trade worth taking. Not financial advice. Do your own research and manage your risk. #IMPACTbyTrade
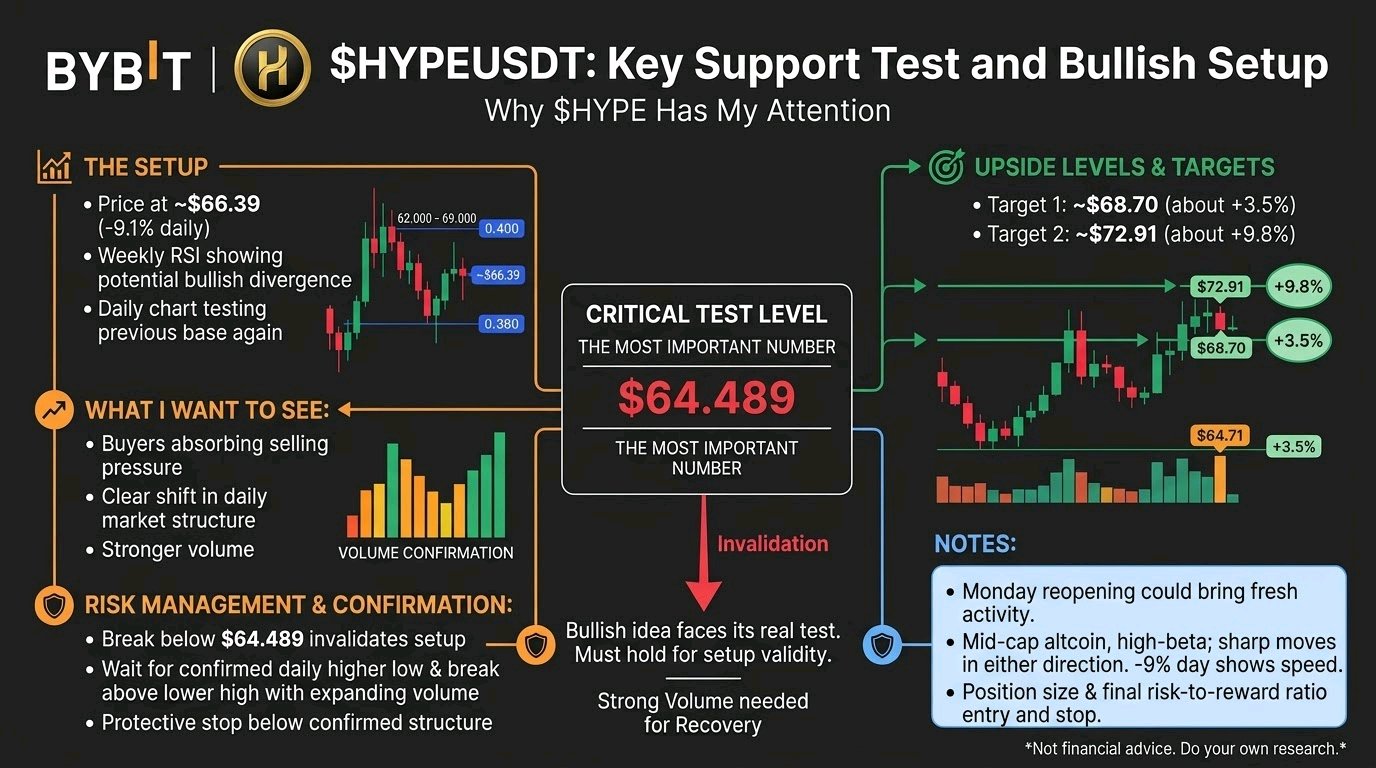
One red line. Two upside levels. This is why $HYPEUSDT has my attention. The most important number on my chart is $64.489. That's where my bullish idea faces its real test. The setup $HYPE is down about 9.1% on the day at roughly $66.39, and it is trading far below its prior highs after a sharp multi-day slide. Weekly RSI analysis suggests a possible bullish divergence. The daily chart has already shown an initial reaction, and price is now testing that base again. What I want to see is buyers absorbing the selling pressure, followed by a clear shift in daily market structure. If that happens with stronger volume, I'm watching two swing levels: 🎯 Target 1: ~$68.70 (about +3.5% from $66.39) 🎯 Target 2: ~$72.91 (about +9.8% from $66.39) These are ambitious scenarios, not guaranteed returns. Monday's reopening of traditional markets could bring fresh activity, but $HYPE needs its own buying volume to support a meaningful recovery. As a high-beta mid-cap, sharp moves can happen in either direction, and a -9% day shows how fast it can go. Management: If price breaks below $64.489 and cannot recover that level, my bullish setup is no longer valid. For a new position, I want a confirmed daily higher low, a break above the latest lower high, and expanding volume. The protective stop belongs below the confirmed structure. Position size and the final risk-to-reward ratio must be calculated from the actual entry and stop, not assumed in advance. I'm heavily bullish on $HYPE's recovery potential, but the next volume-backed move will determine whether this remains a promising chart or becomes a trade worth taking. Not financial advice. Do your own research and manage your risk. #IMPACTbyTrade
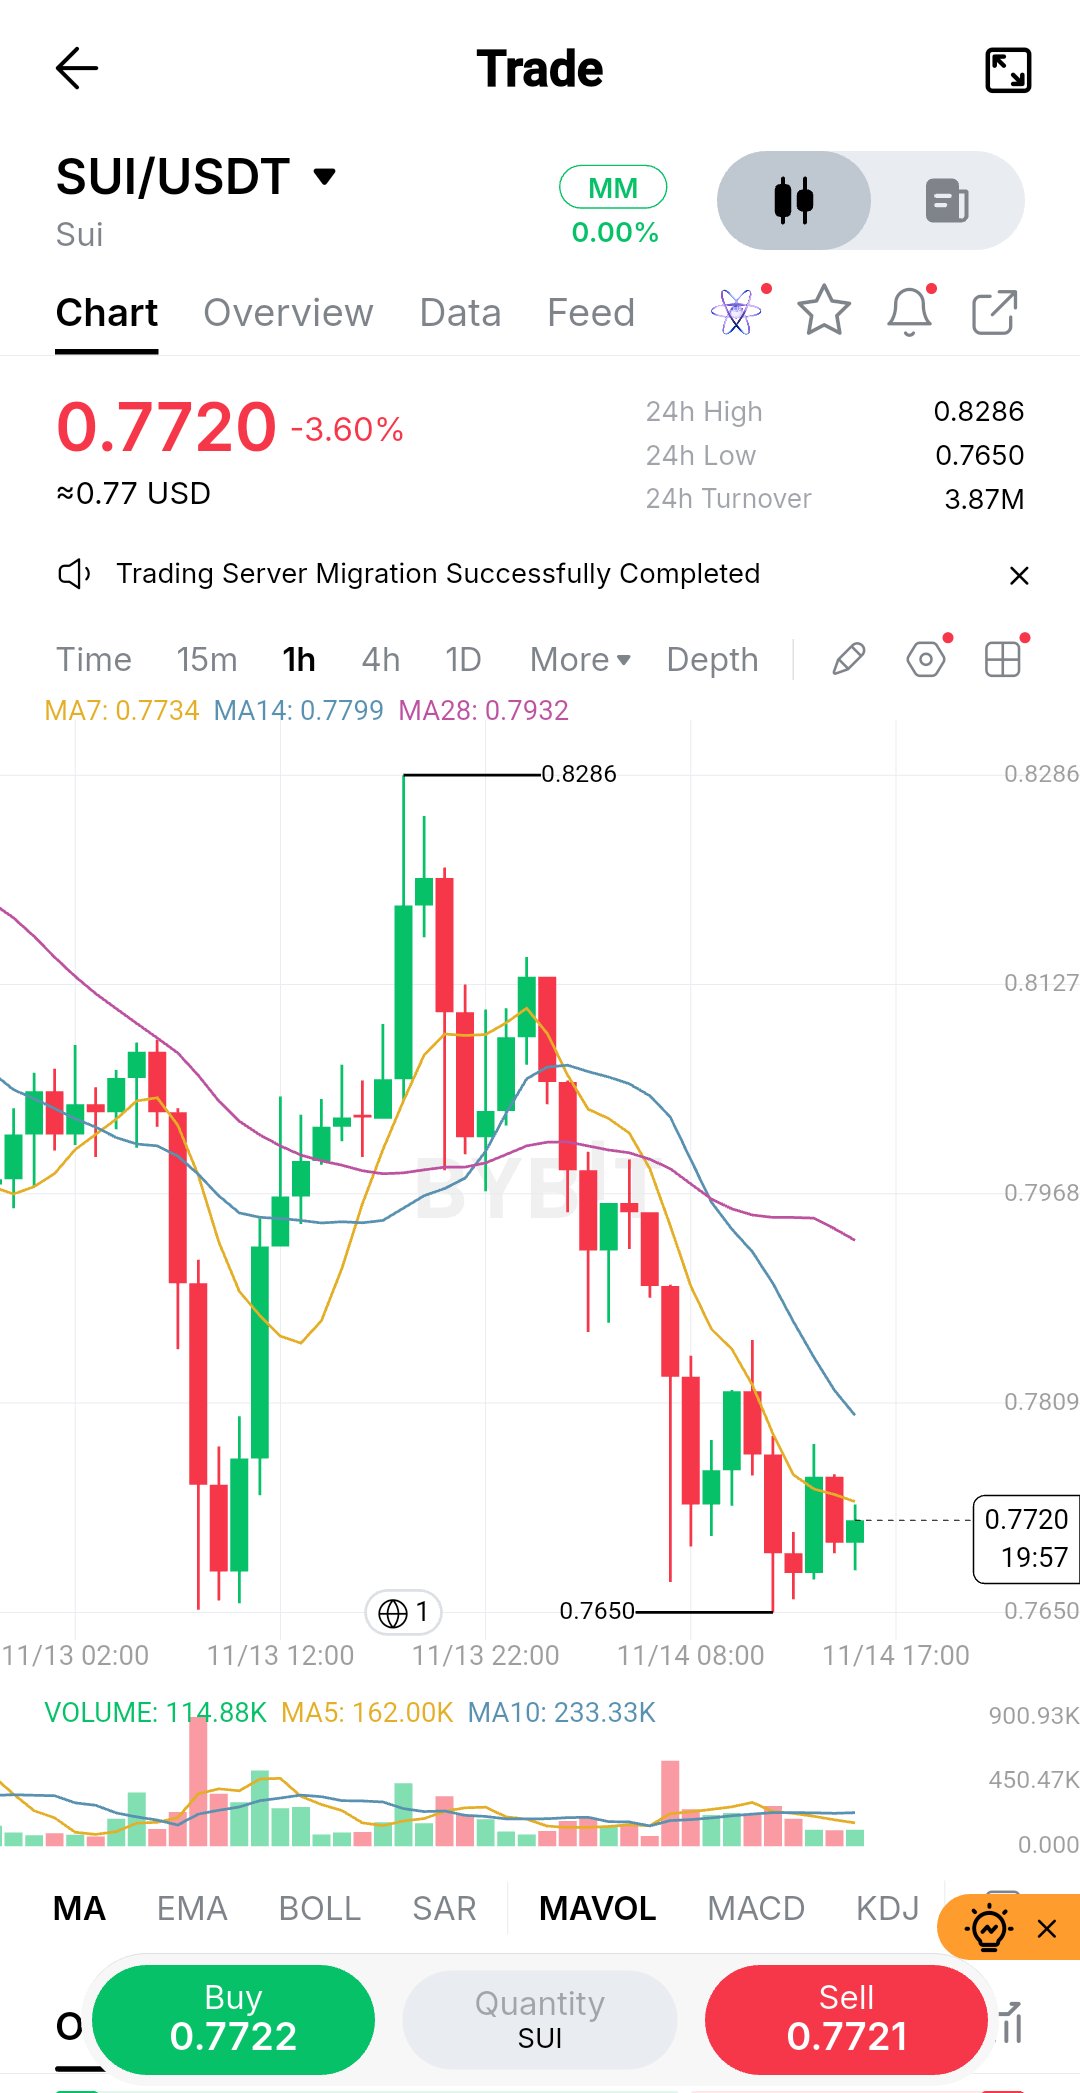
One red line. Two upside levels. This is why $SUIUSDT has my attention. The most important number on my chart is $0.7650. That's where my bullish idea faces its real test. The setup $SUI is down about 3.6% on the day at roughly $0.7720, and it is trading well below its prior highs. Weekly RSI analysis suggests a possible bullish divergence. The daily chart has already shown an initial reaction, and price is now testing that base again. What I want to see is buyers absorbing the selling pressure, followed by a clear shift in daily market structure. If that happens with stronger volume, I'm watching two swing levels: 🎯 Target 1: ~$0.7968 (about +3.2% from $0.7720) 🎯 Target 2: ~$0.8286 (about +7.3% from $0.7720), the recent swing high These are ambitious scenarios, not guaranteed returns. Monday's reopening of traditional markets could bring fresh activity, but $SUI needs its own buying volume to support a meaningful recovery. As a mid-cap altcoin, sharp moves can happen in either direction. Management: If price breaks below $0.7650 and cannot recover that level, my bullish setup is no longer valid. For a new position, I want a confirmed daily higher low, a break above the latest lower high, and expanding volume. The protective stop belongs below the confirmed structure. Position size and the final risk-to-reward ratio must be calculated from the actual entry and stop, not assumed in advance. I'm heavily bullish on $SUI's recovery potential, but the next volume-backed move will determine whether this remains a promising chart or becomes a trade worth taking. Not financial advice. Do your own research and manage your risk. #IMPACTbyTrade

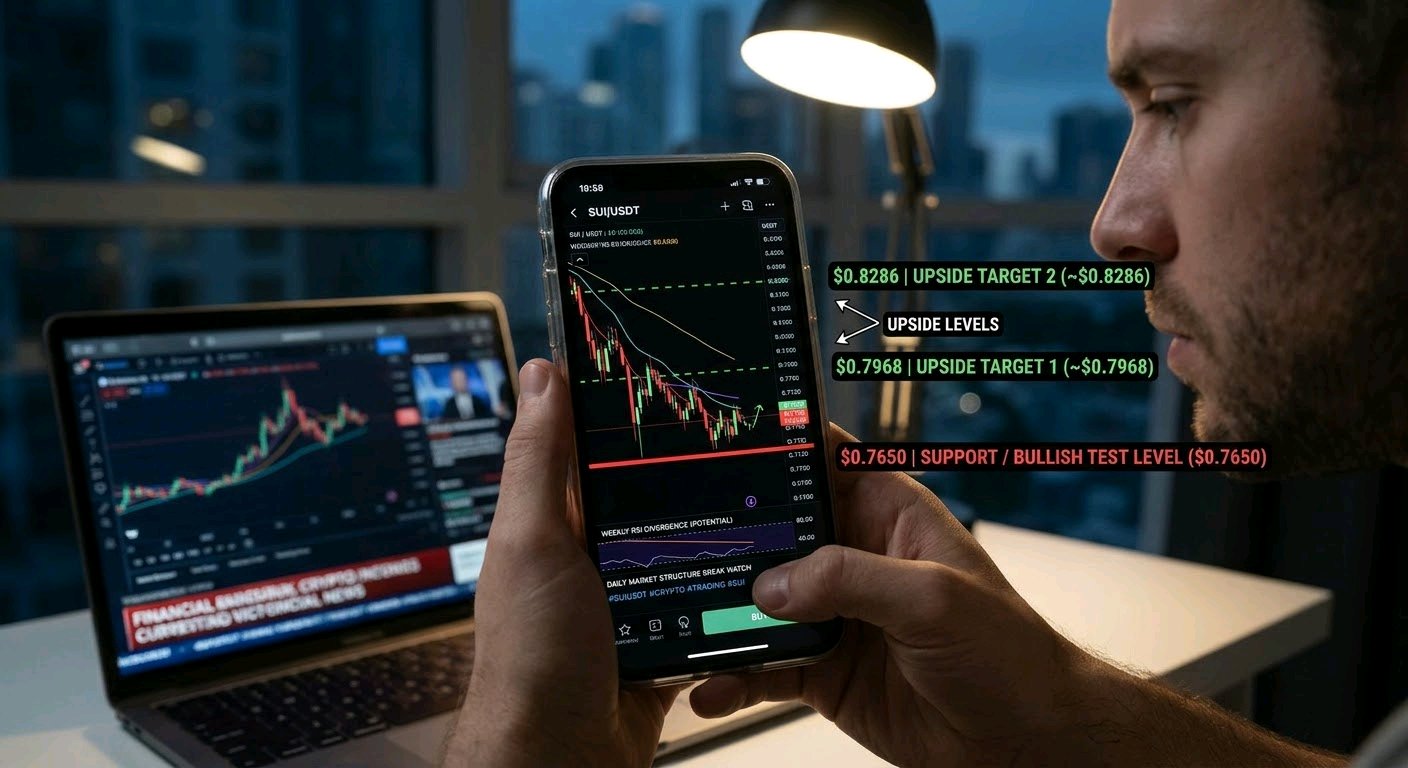
One red line. Two upside levels. This is why $ETHUSDT has my attention. The most important number on my chart is $1,878.00. That's where my bullish idea faces its real test. The setup $ETH is down about 2% on the day at roughly $1,904, and it is trading far below its prior highs after a steep multi-day slide. Weekly RSI analysis suggests a possible bullish divergence. The daily chart has already shown an initial reaction, and price is now testing that base again. What I want to see is buyers absorbing the selling pressure, followed by a clear shift in daily market structure. If that happens with stronger volume, I'm watching two swing levels: 🎯 Target 1: ~$1,981.75 (about +4.1% from $1,904) 🎯 Target 2: ~$2,085.51 (about +9.5% from $1,904) These are ambitious scenarios, not guaranteed returns. Monday's reopening of traditional markets could bring fresh activity, but $ETH needs its own buying volume to support a meaningful recovery. As a large-cap it is still a high-beta asset, so sharp moves can happen in either direction. Management: If price breaks below $1,878.00 and cannot recover that level, my bullish setup is no longer valid. For a new position, I want a confirmed daily higher low, a break above the latest lower high, and expanding volume. The protective stop belongs below the confirmed structure. Position size and the final risk-to-reward ratio must be calculated from the actual entry and stop, not assumed in advance. I'm heavily bullish on $ETH's recovery potential, but the next volume-backed move will determine whether this remains a promising chart or becomes a trade worth taking. Not financial advice. Do your own research and manage your risk. #IMPACTbyTrade

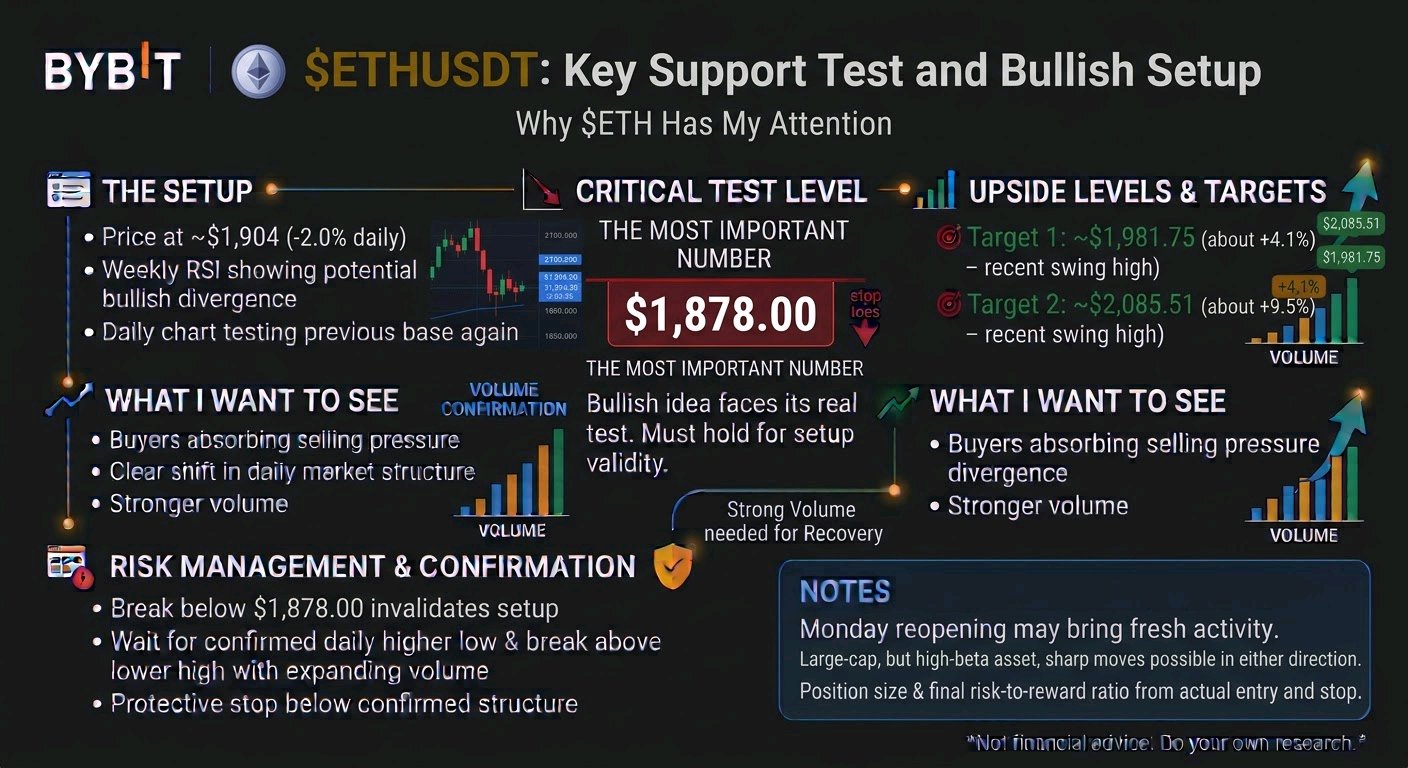
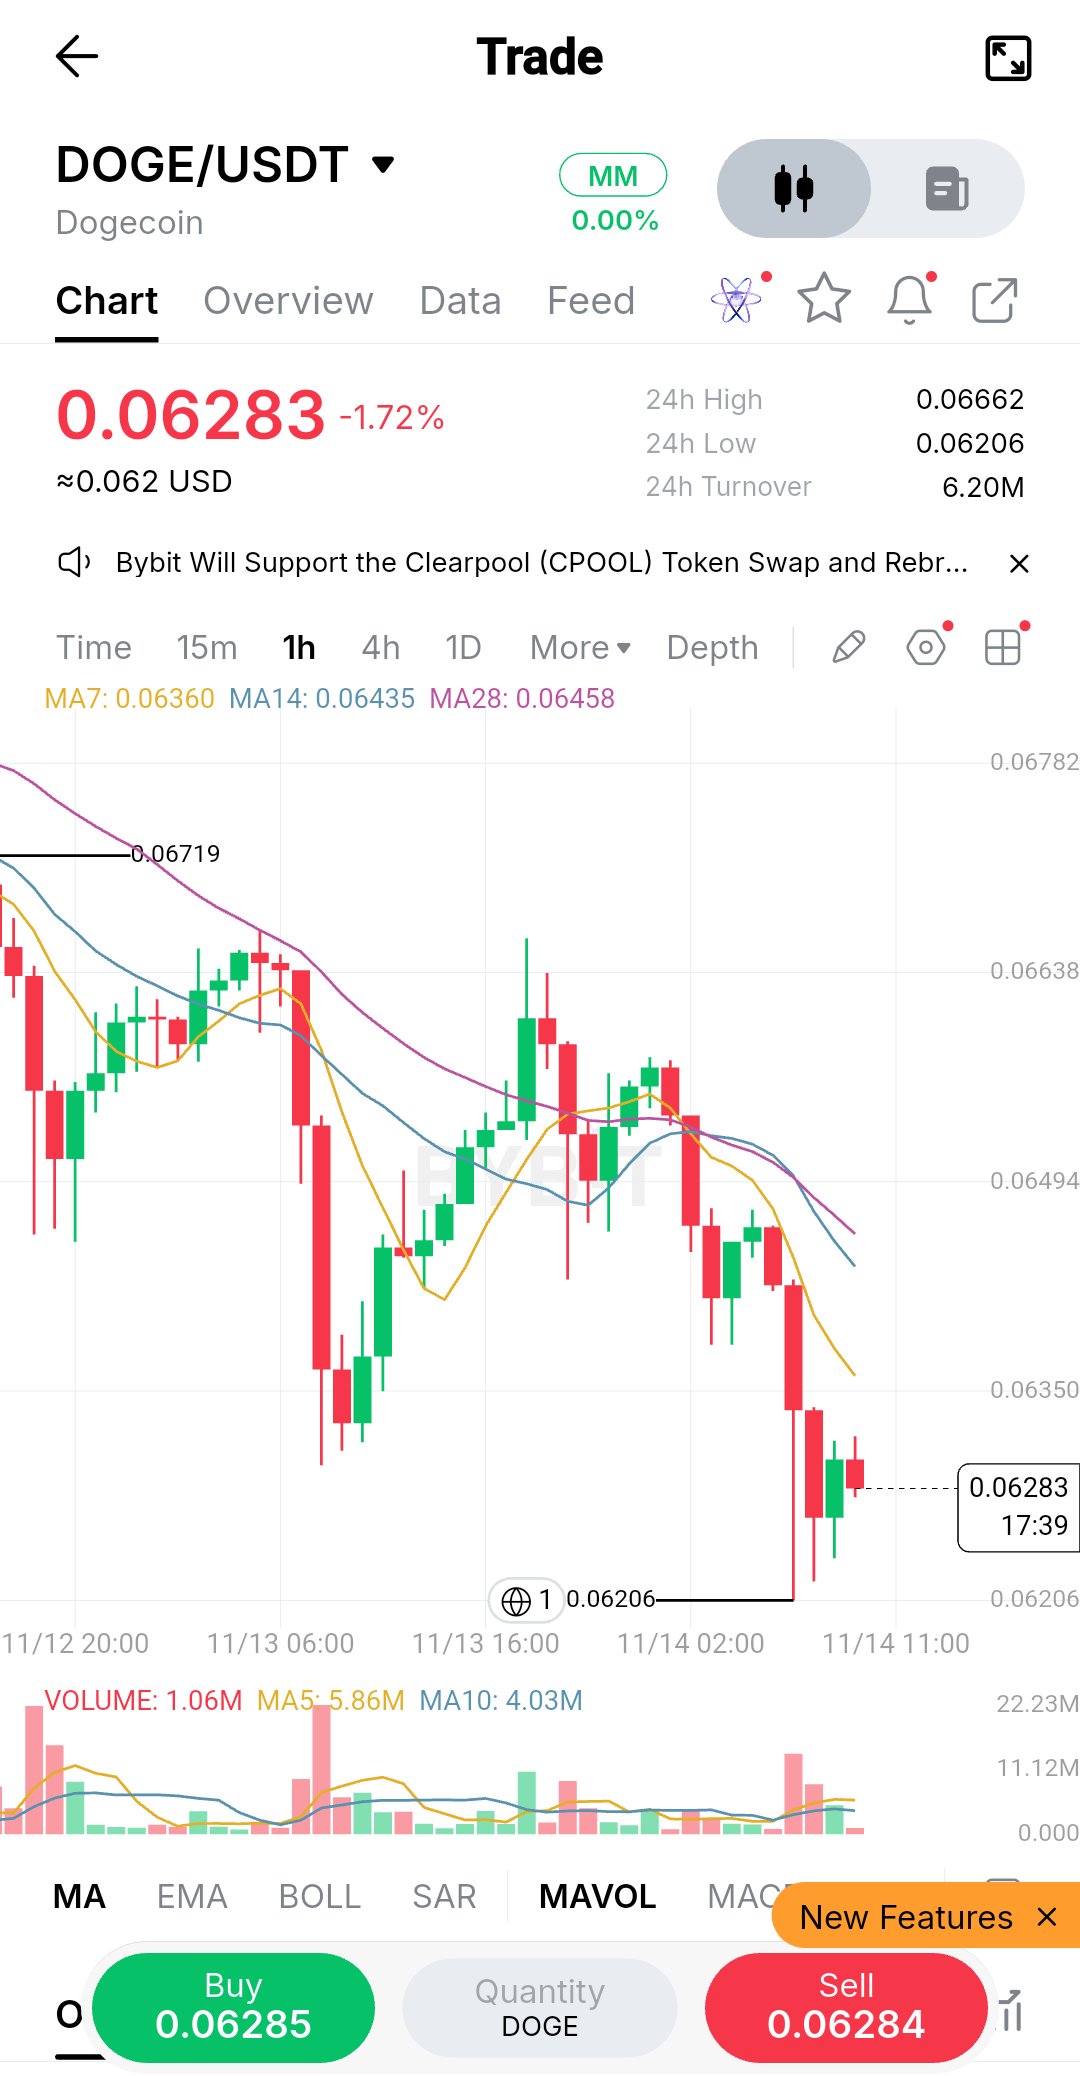
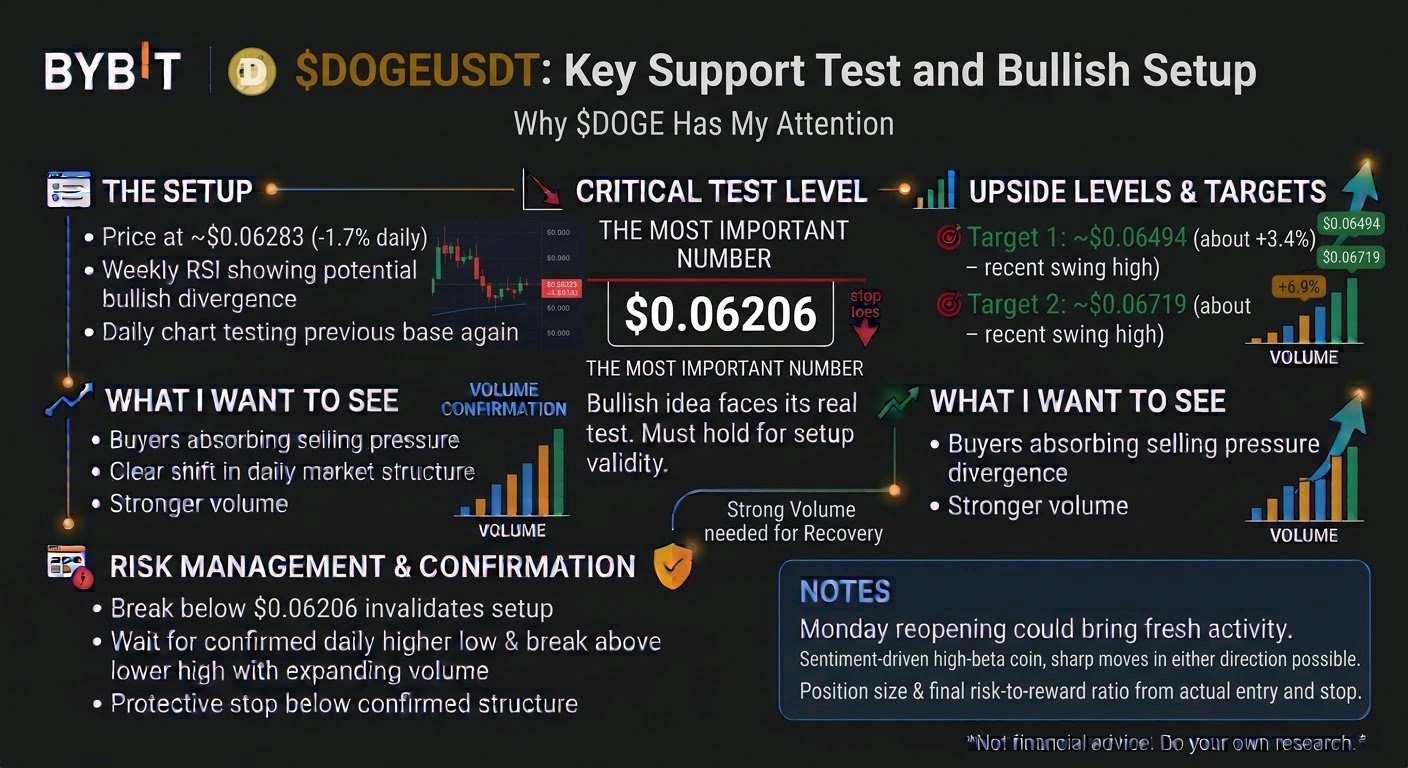
One red line. Two upside levels. This is why $DOGEUSDT has my attention. The most important number on my chart is $0.06206. That's where my bullish idea faces its real test. The setup $DOGE is down about 1.7% on the day at roughly $0.06283, and it is trading well below its prior highs. Weekly RSI analysis suggests a possible bullish divergence. The daily chart has already shown an initial reaction, and price is now testing that base again. What I want to see is buyers absorbing the selling pressure, followed by a clear shift in daily market structure. If that happens with stronger volume, I'm watching two swing levels: 🎯 Target 1: ~$0.06494 (about +3.4% from $0.06283) 🎯 Target 2: ~$0.06719 (about +6.9% from $0.06283), the recent swing high These are ambitious scenarios, not guaranteed returns. Monday's reopening of traditional markets could bring fresh activity, but $DOGE needs its own buying volume to support a meaningful recovery. As a high-beta, sentiment-driven coin, sharp moves can happen in either direction. Management: If price breaks below $0.06206 and cannot recover that level, my bullish setup is no longer valid. For a new position, I want a confirmed daily higher low, a break above the latest lower high, and expanding volume. The protective stop belongs below the confirmed structure. Position size and the final risk-to-reward ratio must be calculated from the actual entry and stop, not assumed in advance. I'm heavily bullish on $DOGE's recovery potential, but the next volume-backed move will determine whether this remains a promising chart or becomes a trade worth taking. Not financial advice. Do your own research and manage your risk. #IMPACTbyTrade
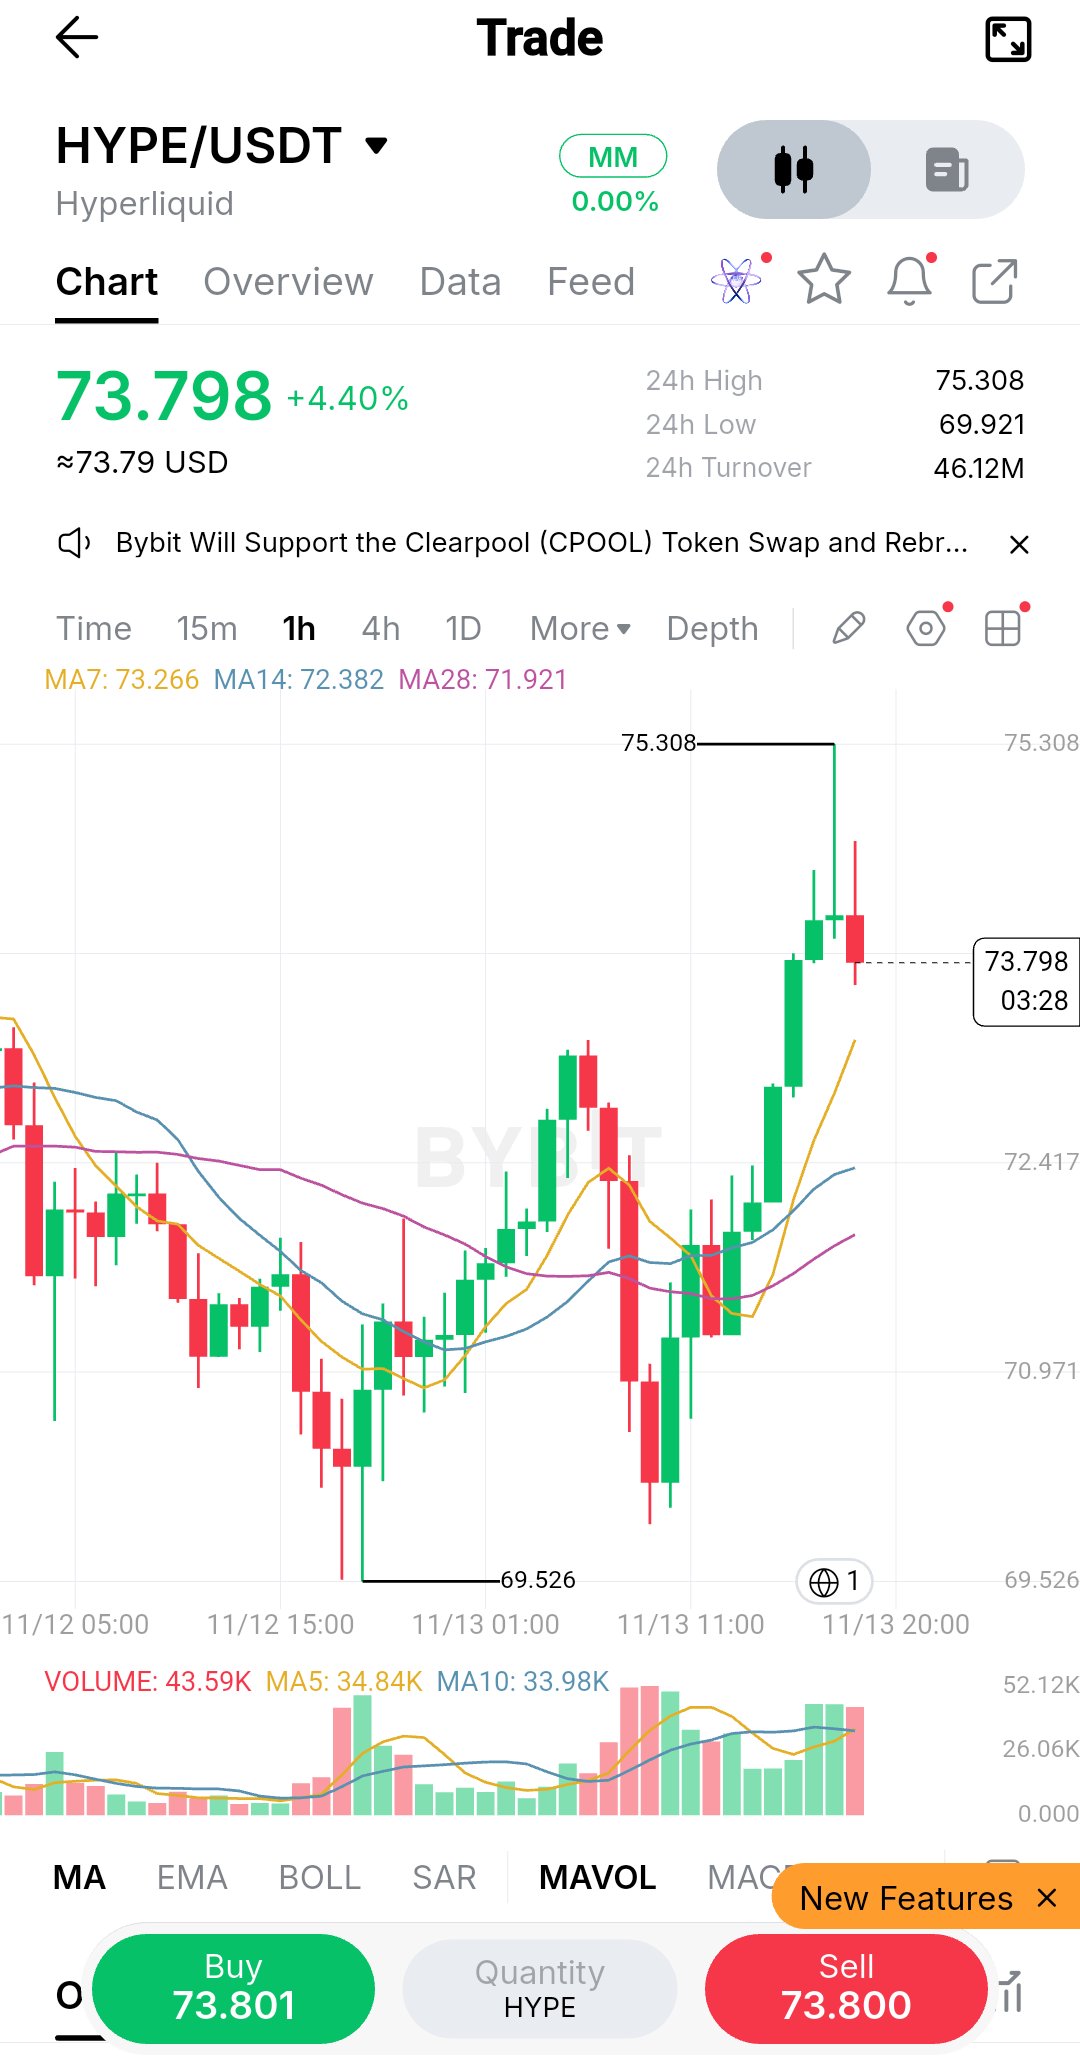
One red line. Two upside levels. This is why $QNTUSDT has my attention. The most important number on my chart is $154.97. That's where my bullish idea faces its real test. The setup $QNT is down about 1.3% on the day at roughly $156.93, and it is trading well below its recent highs. Weekly RSI analysis suggests a possible bullish divergence. The daily chart has already shown an initial reaction, and price is now testing that base again. What I want to see is buyers absorbing the selling pressure, followed by a clear shift in daily market structure. If that happens with stronger volume, I'm watching two swing levels: 🎯 Target 1: ~$163.84 (about +4.4% from $156.93) 🎯 Target 2: ~$168.95 (about +7.7% from $156.93), the recent swing high These are ambitious scenarios, not guaranteed returns. Monday's reopening of traditional markets could bring fresh activity, but $QNT needs its own buying volume to support a meaningful recovery. Its relatively small market size also means sharp moves can happen in either direction, and thin turnover (about 2M daily) can exaggerate them. Management: If price breaks below $154.97 and cannot recover that level, my bullish setup is no longer valid. For a new position, I want a confirmed daily higher low, a break above the latest lower high, and expanding volume. The protective stop belongs below the confirmed structure. Position size and the final risk-to-reward ratio must be calculated from the actual entry and stop, not assumed in advance. I'm heavily bullish on $QNT's recovery potential, but the next volume-backed move will determine whether this remains a promising chart or becomes a trade worth taking. Not financial advice. Do your own research and manage your risk. #IMPACTbyTrade
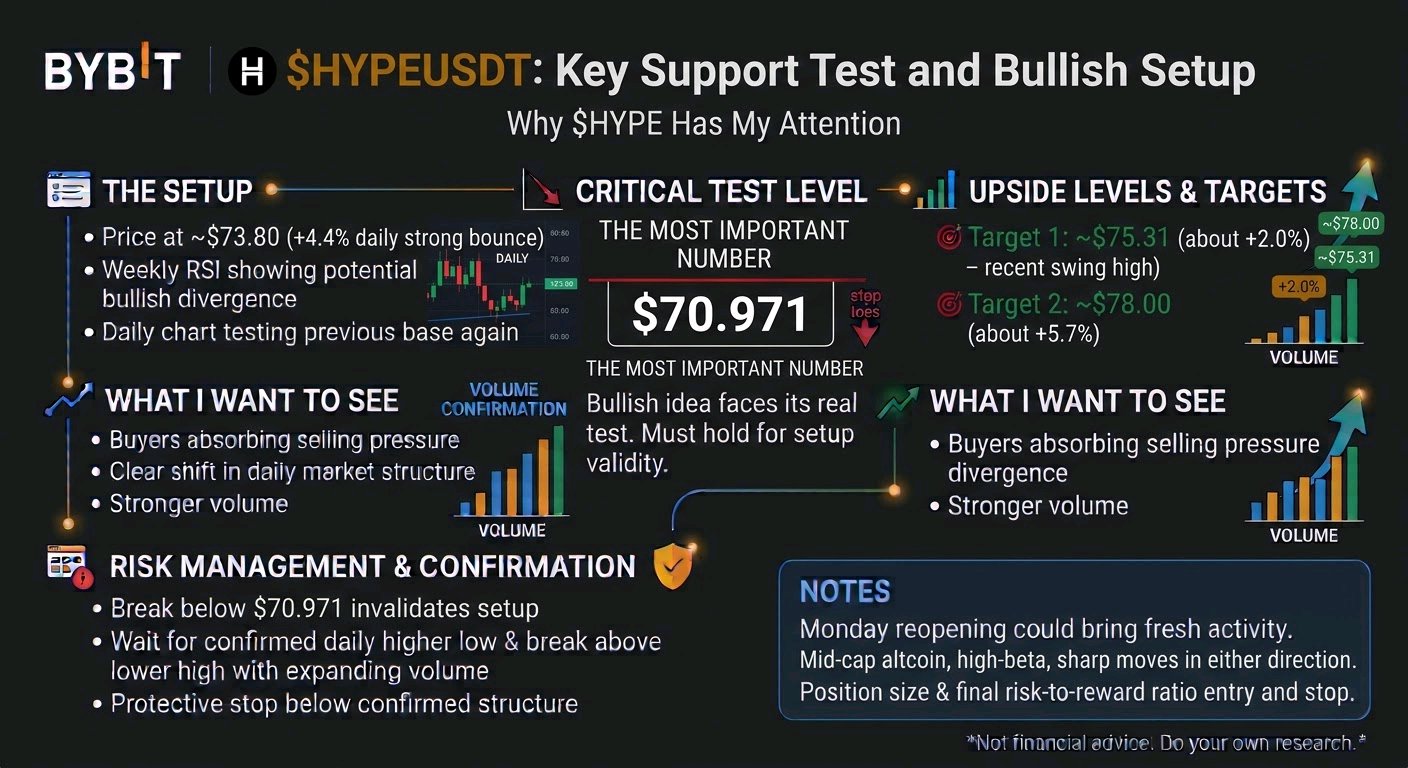
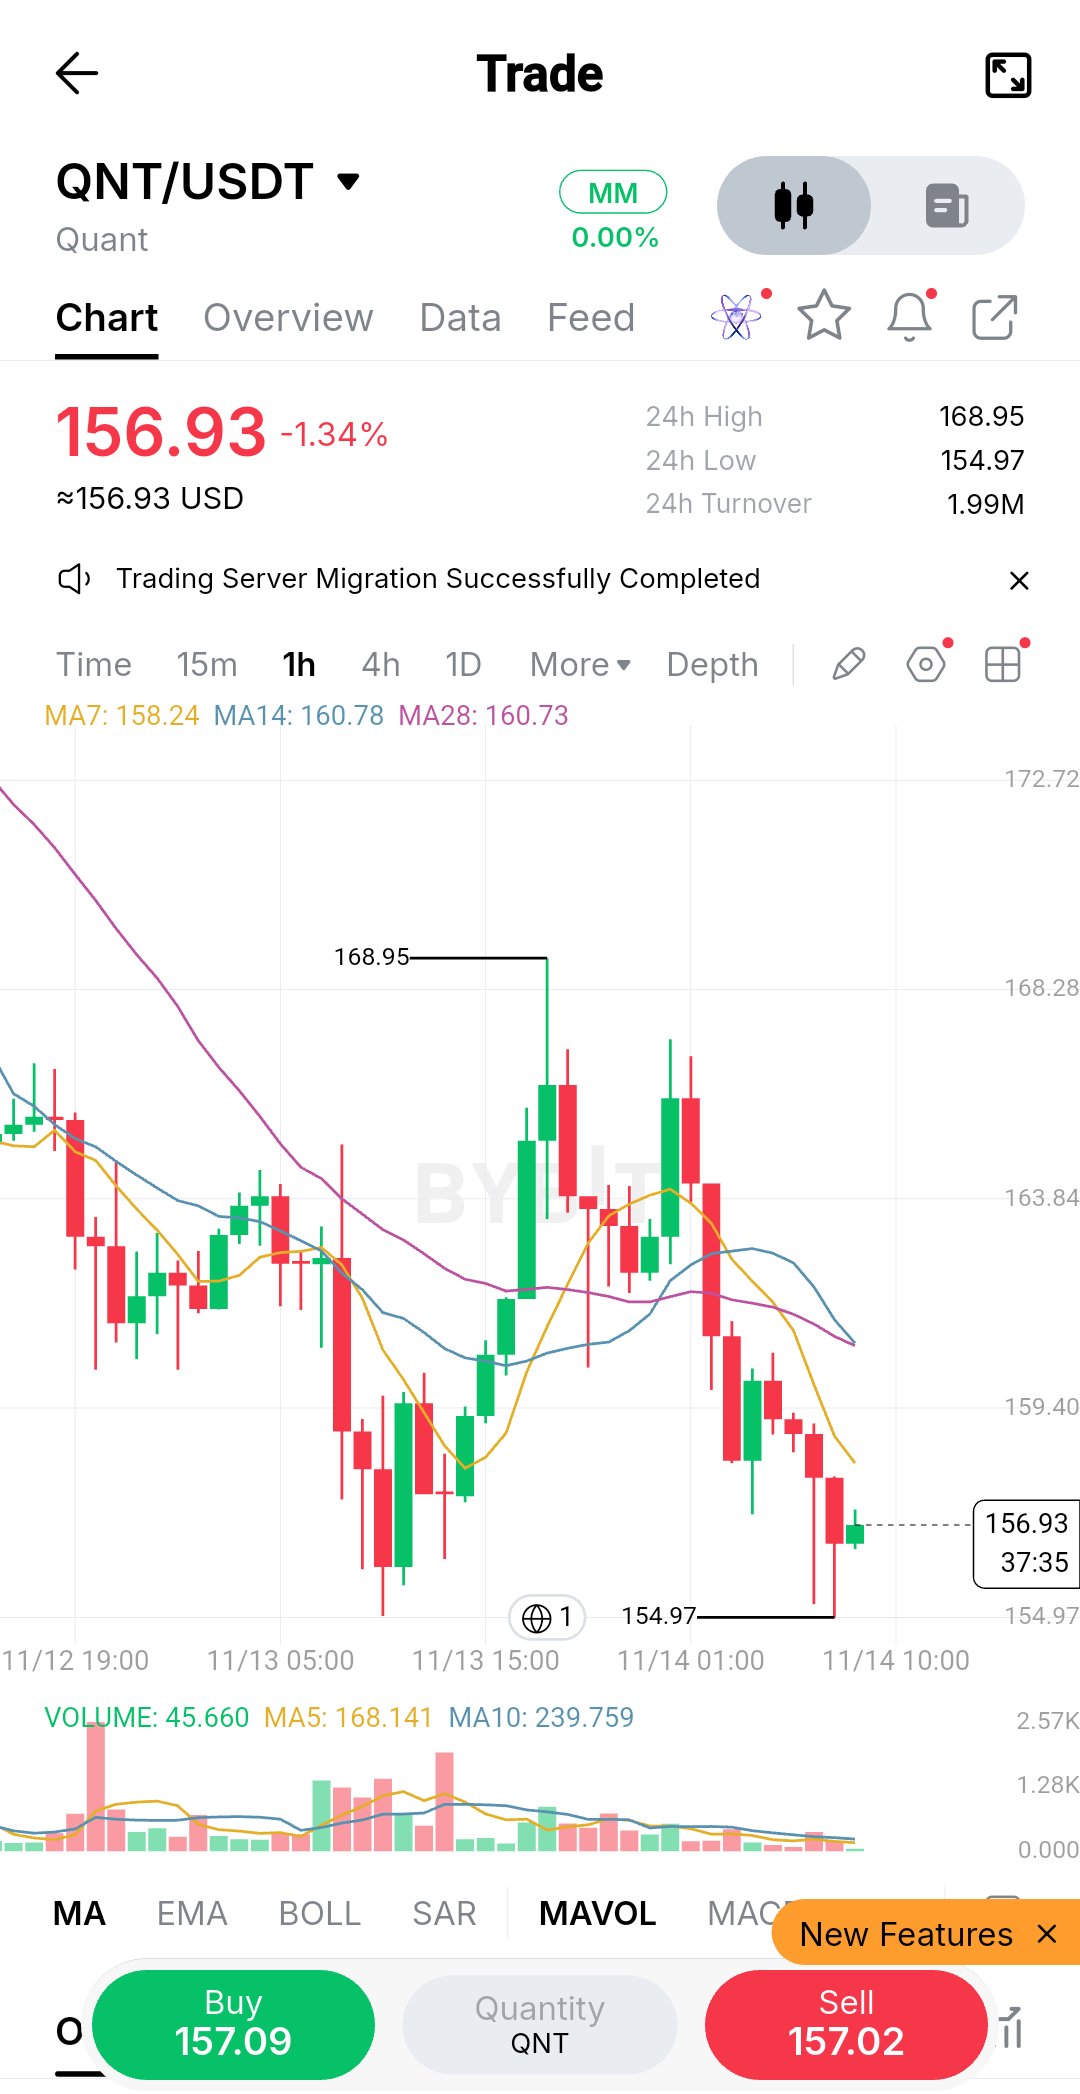

One red line. Two upside levels. This is why $HYPEUSDT has my attention. The most important number on my chart is $70.971. That's where my bullish idea faces its real test. The setup $HYPE is up about 4.4% on the day at roughly $73.80 after a strong bounce off the lows, and I'm watching whether it can keep building from here. Weekly RSI analysis suggests a possible bullish divergence. The daily chart has already shown an initial reaction, and price is now testing that base again. What I want to see is buyers absorbing the selling pressure, followed by a clear shift in daily market structure. If that happens with stronger volume, I'm watching two swing levels: 🎯 Target 1: ~$75.31 (about +2% from $73.80), the recent swing high 🎯 Target 2: ~$78.00 (about +5.7% from $73.80) These are ambitious scenarios, not guaranteed returns. Monday's reopening of traditional markets could bring fresh activity, but $HYPE needs its own buying volume to support a meaningful recovery. As a high-beta mid-cap, sharp moves can happen in either direction. Management: If price breaks below $70.971 and cannot recover that level, my bullish setup is no longer valid. For a new position, I want a confirmed daily higher low, a break above the latest lower high, and expanding volume. The protective stop belongs below the confirmed structure. Position size and the final risk-to-reward ratio must be calculated from the actual entry and stop, not assumed in advance. I'm heavily bullish on $HYPE's recovery potential, but the next volume-backed move will determine whether this remains a promising chart or becomes a trade worth taking. Not financial advice. Do your own research and manage your risk. #IMPACTbyTrade

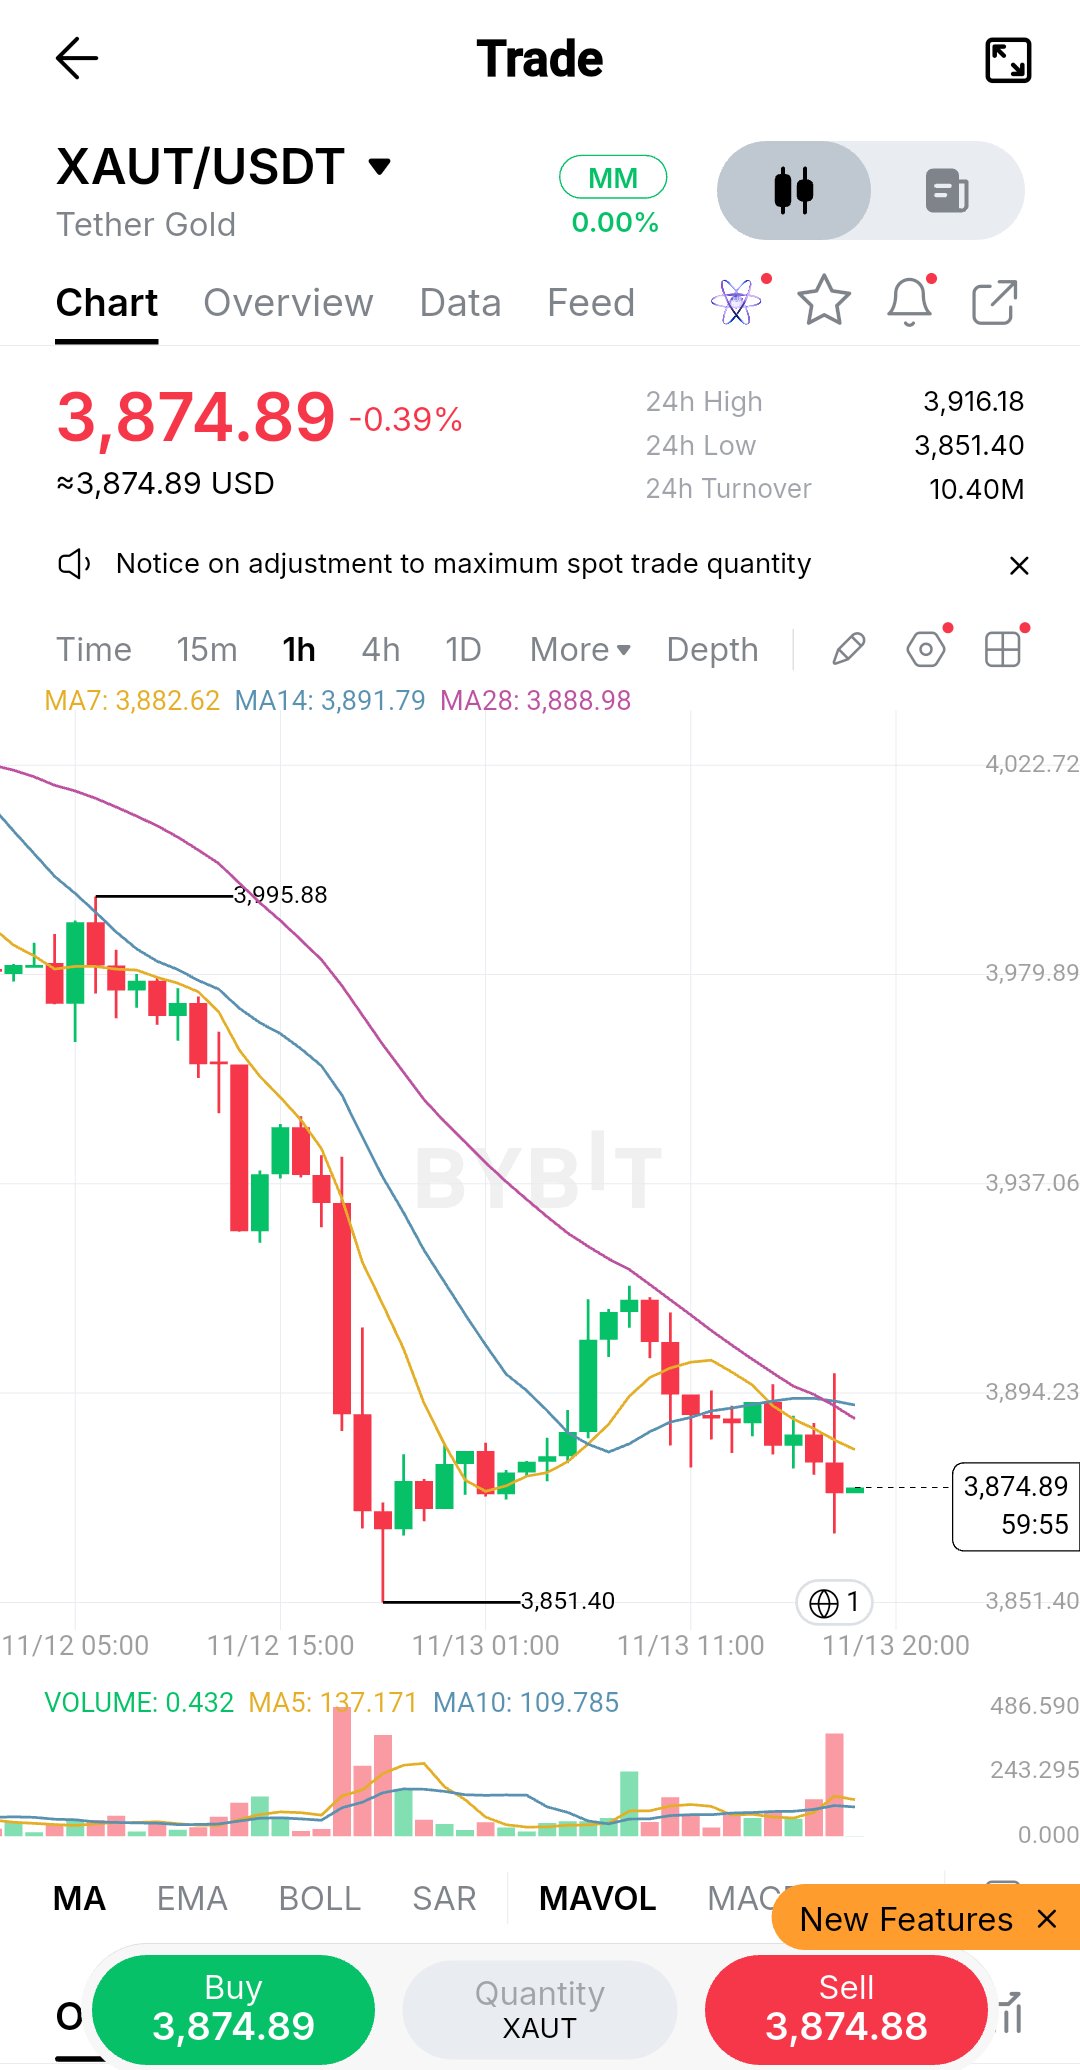
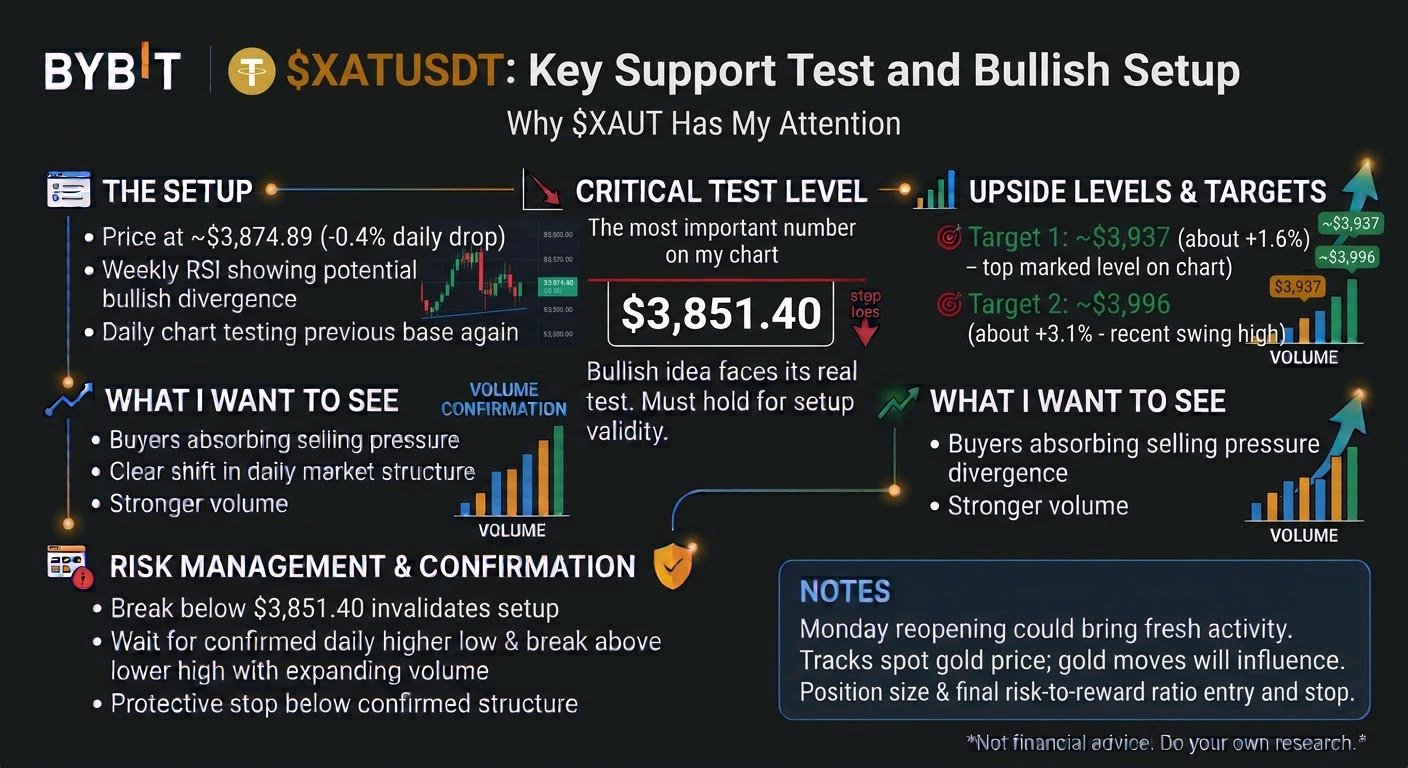
One red line. Two upside levels. This is why $XAUTUSDT has my attention. The most important number on my chart is $3,851.40. That's where my bullish idea faces its real test. The setup $XAUT is down about 0.4% on the day at roughly $3,874.89, and it is trading below its recent highs after a steady pullback. Weekly RSI analysis suggests a possible bullish divergence. The daily chart has already shown an initial reaction, and price is now testing that base again. What I want to see is buyers absorbing the selling pressure, followed by a clear shift in daily market structure. If that happens with stronger volume, I'm watching two swing levels: 🎯 Target 1: ~$3,937 (about +1.6% from $3,874.89) 🎯 Target 2: ~$3,996 (about +3.1% from $3,874.89), the recent swing high These are ambitious scenarios, not guaranteed returns. Monday's reopening of traditional markets could bring fresh activity, but $XAUT needs its own buying volume to support a meaningful recovery. As a gold-backed token, it also tracks the spot gold price, so moves in gold can push it in either direction. Management: If price breaks below $3,851.40 and cannot recover that level, my bullish setup is no longer valid. For a new position, I want a confirmed daily higher low, a break above the latest lower high, and expanding volume. The protective stop belongs below the confirmed structure. Position size and the final risk-to-reward ratio must be calculated from the actual entry and stop, not assumed in advance. I'm heavily bullish on $XAUT's recovery potential, but the next volume-backed move will determine whether this remains a promising chart or becomes a trade worth taking. Not financial advice. Do your own research and manage your risk. #IMPACTbyTrade

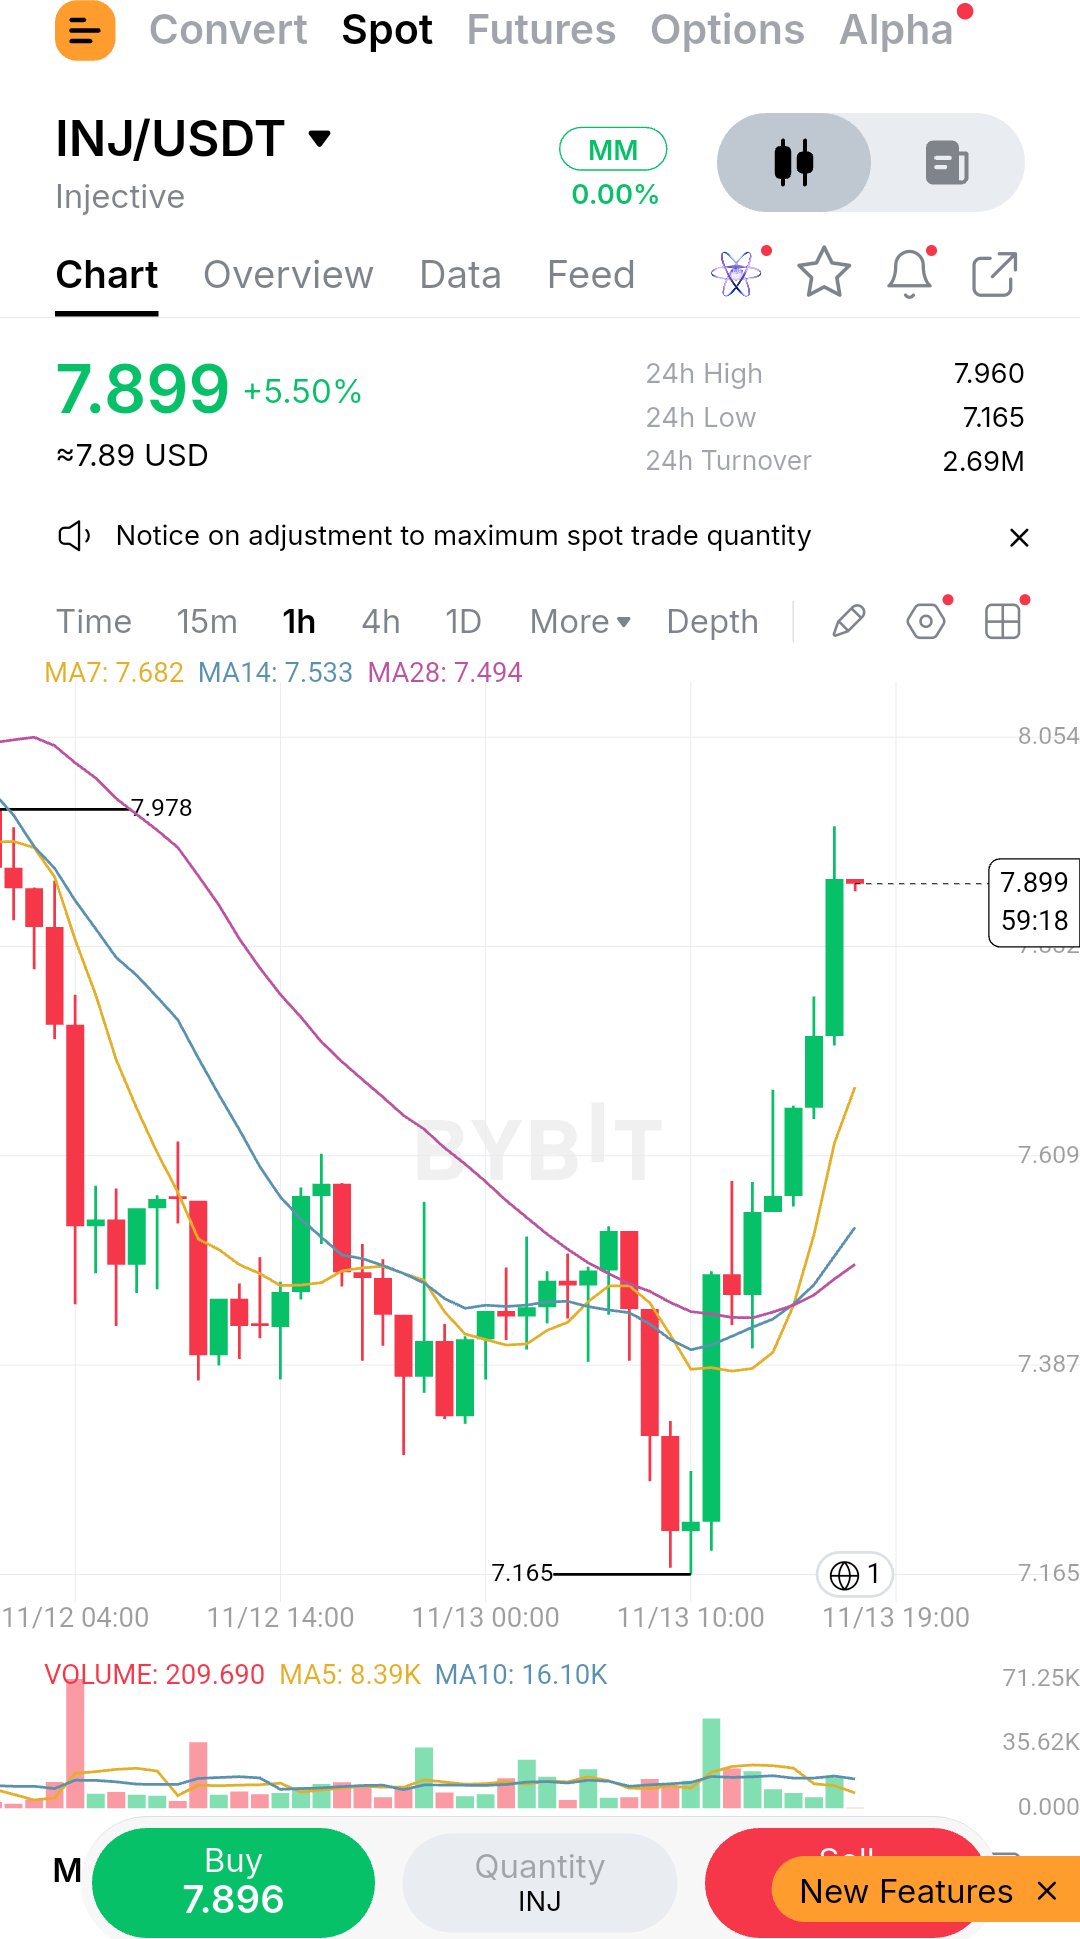
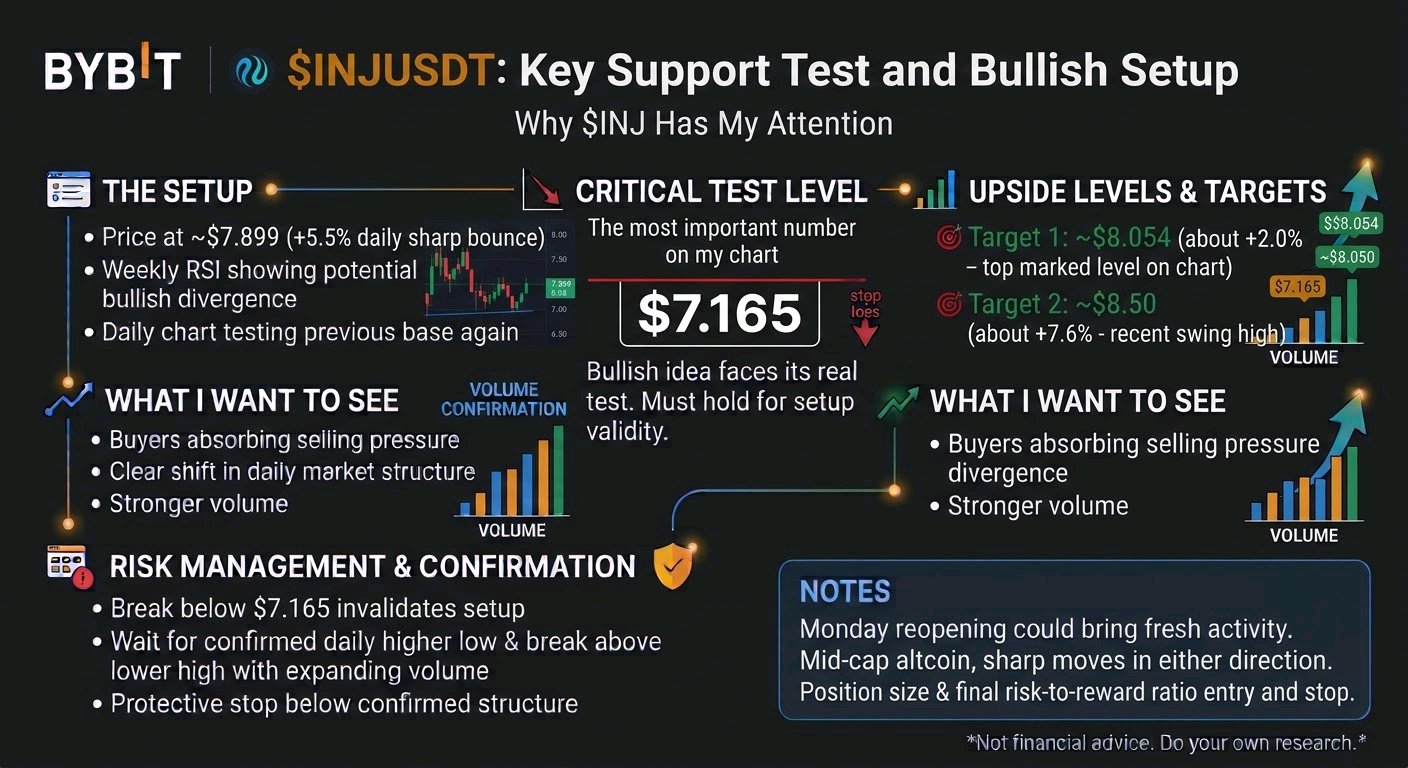
One red line. Two upside levels. This is why $INJUSDT has my attention. The most important number on my chart is $7.165. That's where my bullish idea faces its real test. The setup $INJ is up about 5.5% on the day at roughly $7.899 after a sharp bounce, and it is trading well below its prior highs. Weekly RSI analysis suggests a possible bullish divergence. The daily chart has already shown an initial reaction, and price is now testing that base again. What I want to see is buyers absorbing the selling pressure, followed by a clear shift in daily market structure. If that happens with stronger volume, I'm watching two swing levels: 🎯 Target 1: ~$8.054 (about +2% from $7.899), the chart's top marked level 🎯 Target 2: ~$8.50 (about +7.6% from $7.899) These are ambitious scenarios, not guaranteed returns. Monday's reopening of traditional markets could bring fresh activity, but $INJ needs its own buying volume to support a meaningful recovery. As a mid-cap altcoin, sharp moves can happen in either direction. Management: If price breaks below $7.165 and cannot recover that level, my bullish setup is no longer valid. For a new position, I want a confirmed daily higher low, a break above the latest lower high, and expanding volume. The protective stop belongs below the confirmed structure. Position size and the final risk-to-reward ratio must be calculated from the actual entry and stop, not assumed in advance. I'm heavily bullish on $INJ's recovery potential, but the next volume-backed move will determine whether this remains a promising chart or becomes a trade worth taking. Not financial advice. Do your own research and manage your risk. #IMPACTbyTrade

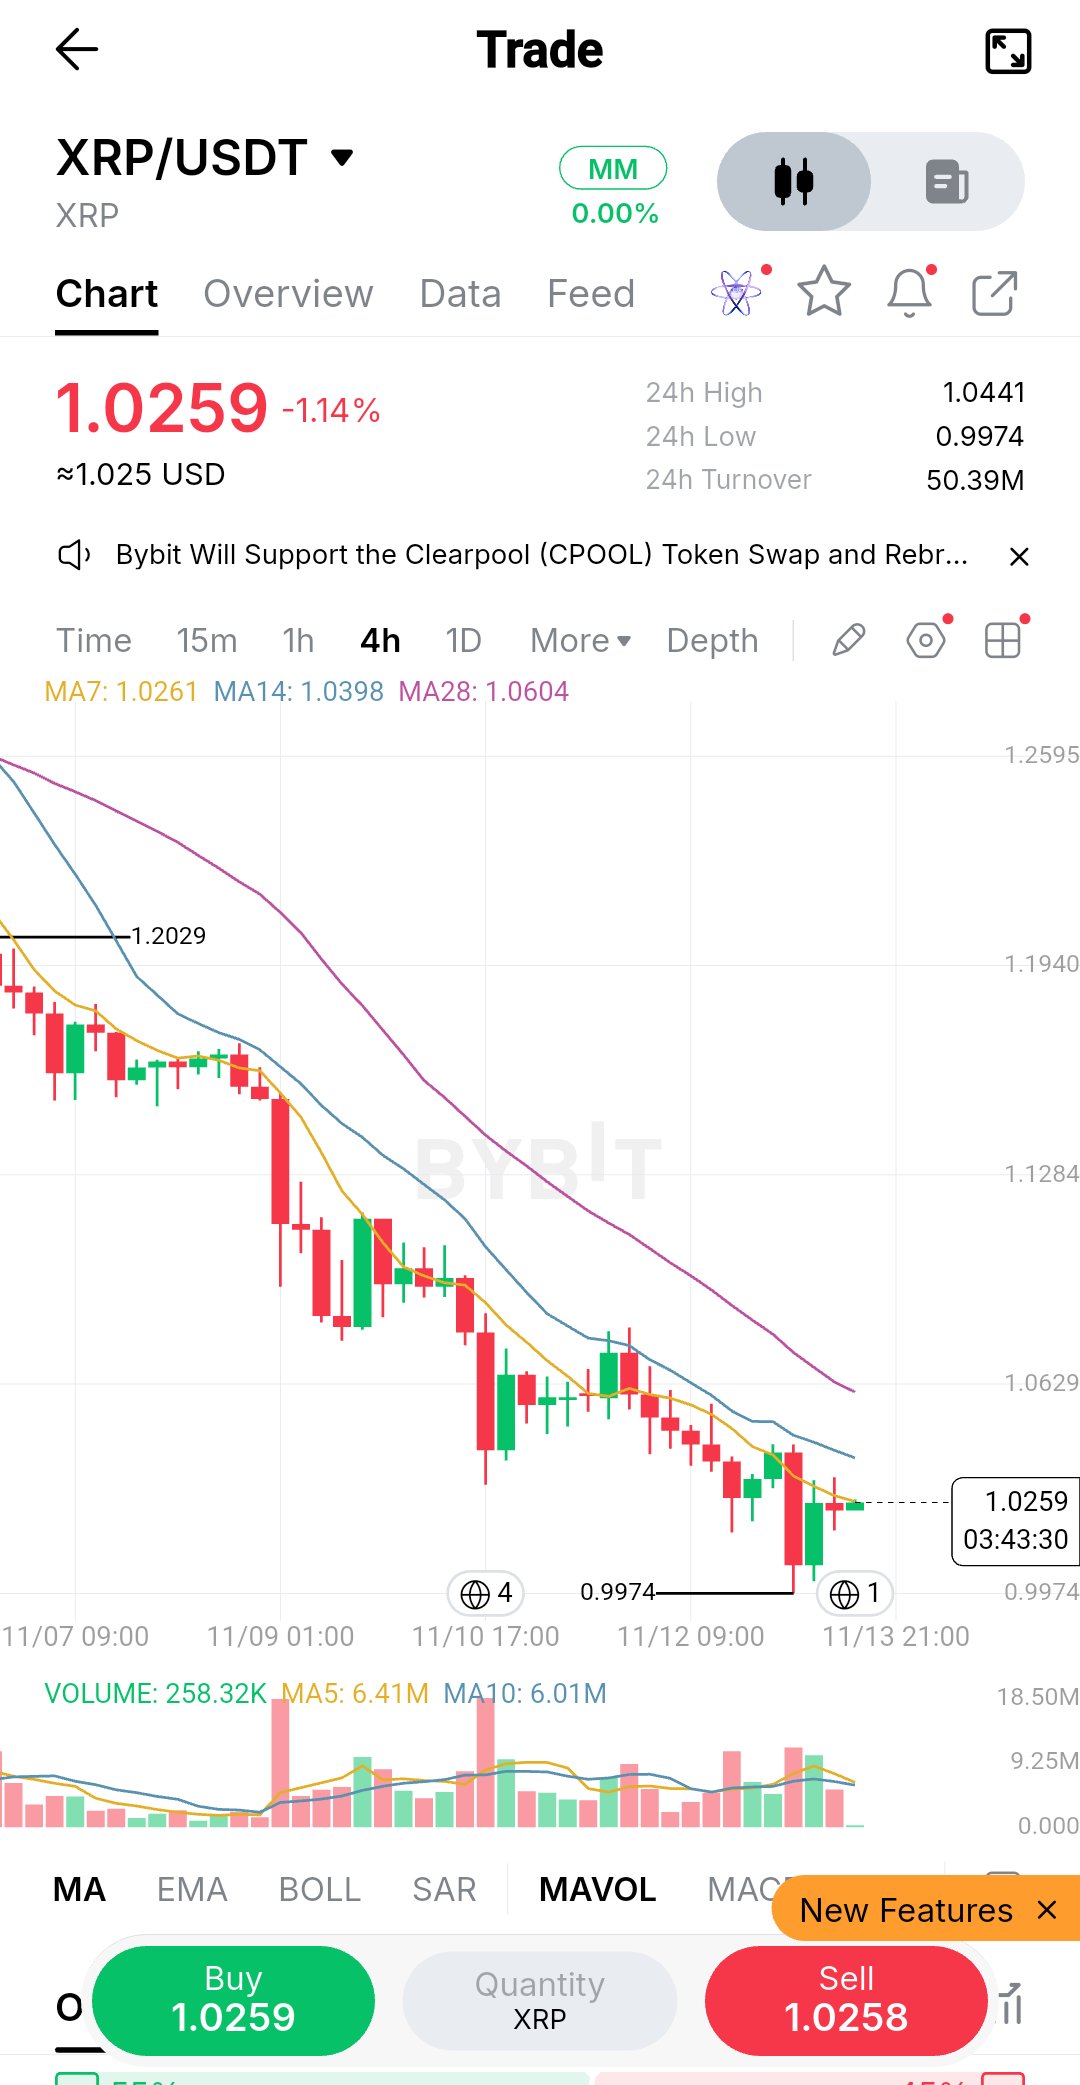
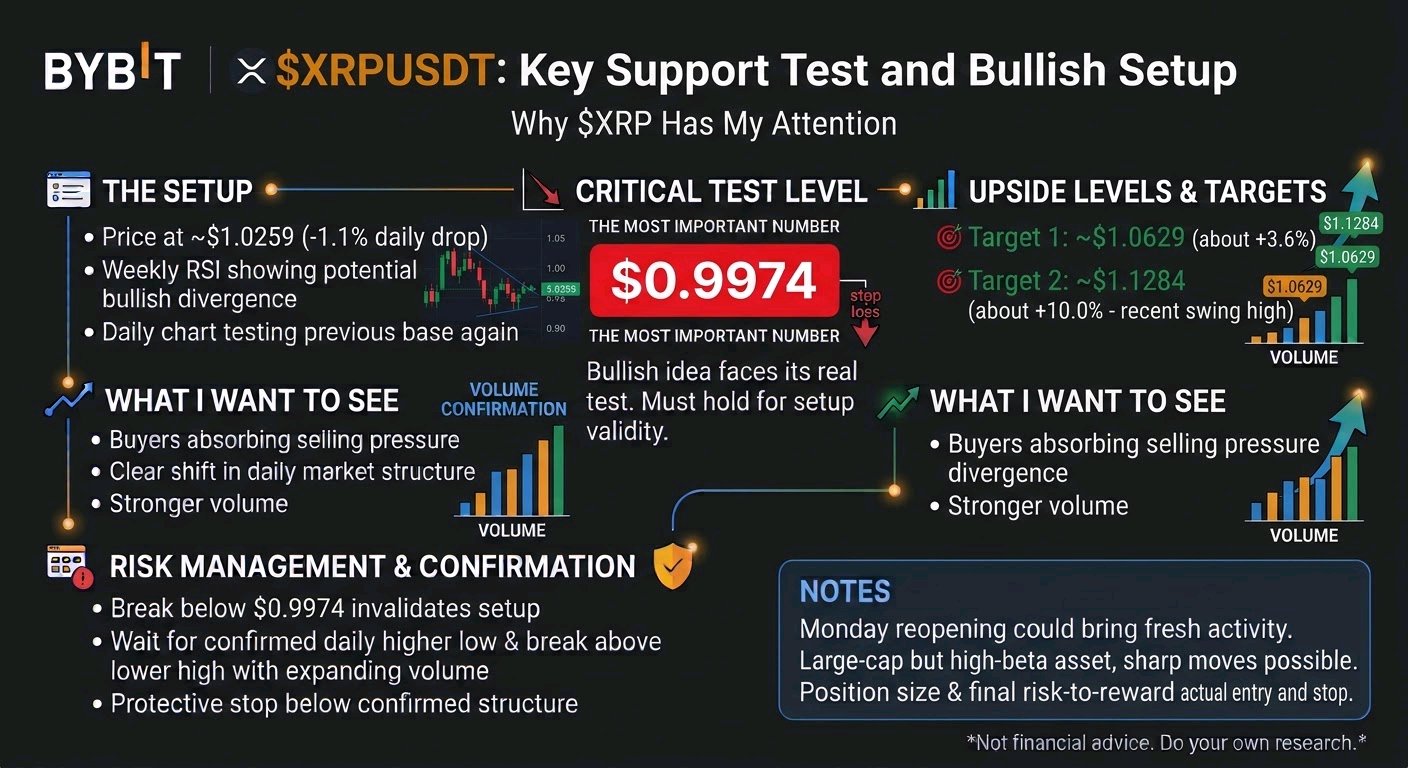
One red line. Two upside levels. This is why $XRPUSDT has my attention. The most important number on my chart is $0.9974. That's where my bullish idea faces its real test. The setup $XRP is down about 1.1% on the day at roughly $1.0259, and it is trading far below its prior highs after a long grind lower. Weekly RSI analysis suggests a possible bullish divergence. The daily chart has already shown an initial reaction, and price is now testing that base again. What I want to see is buyers absorbing the selling pressure, followed by a clear shift in daily market structure. If that happens with stronger volume, I'm watching two swing levels: 🎯 Target 1: ~$1.0629 (about +3.6% from $1.0259) 🎯 Target 2: ~$1.1284 (about +10% from $1.0259) These are ambitious scenarios, not guaranteed returns. Monday's reopening of traditional markets could bring fresh activity, but $XRP needs its own buying volume to support a meaningful recovery. As a high-beta large-cap, sharp moves can happen in either direction. Management: If price breaks below $0.9974 and cannot recover that level, my bullish setup is no longer valid. For a new position, I want a confirmed daily higher low, a break above the latest lower high, and expanding volume. The protective stop belongs below the confirmed structure. Position size and the final risk-to-reward ratio must be calculated from the actual entry and stop, not assumed in advance. I'm heavily bullish on $XRP's recovery potential, but the next volume-backed move will determine whether this remains a promising chart or becomes a trade worth taking. Not financial advice. Do your own research and manage your risk. #IMPACTbyTrade

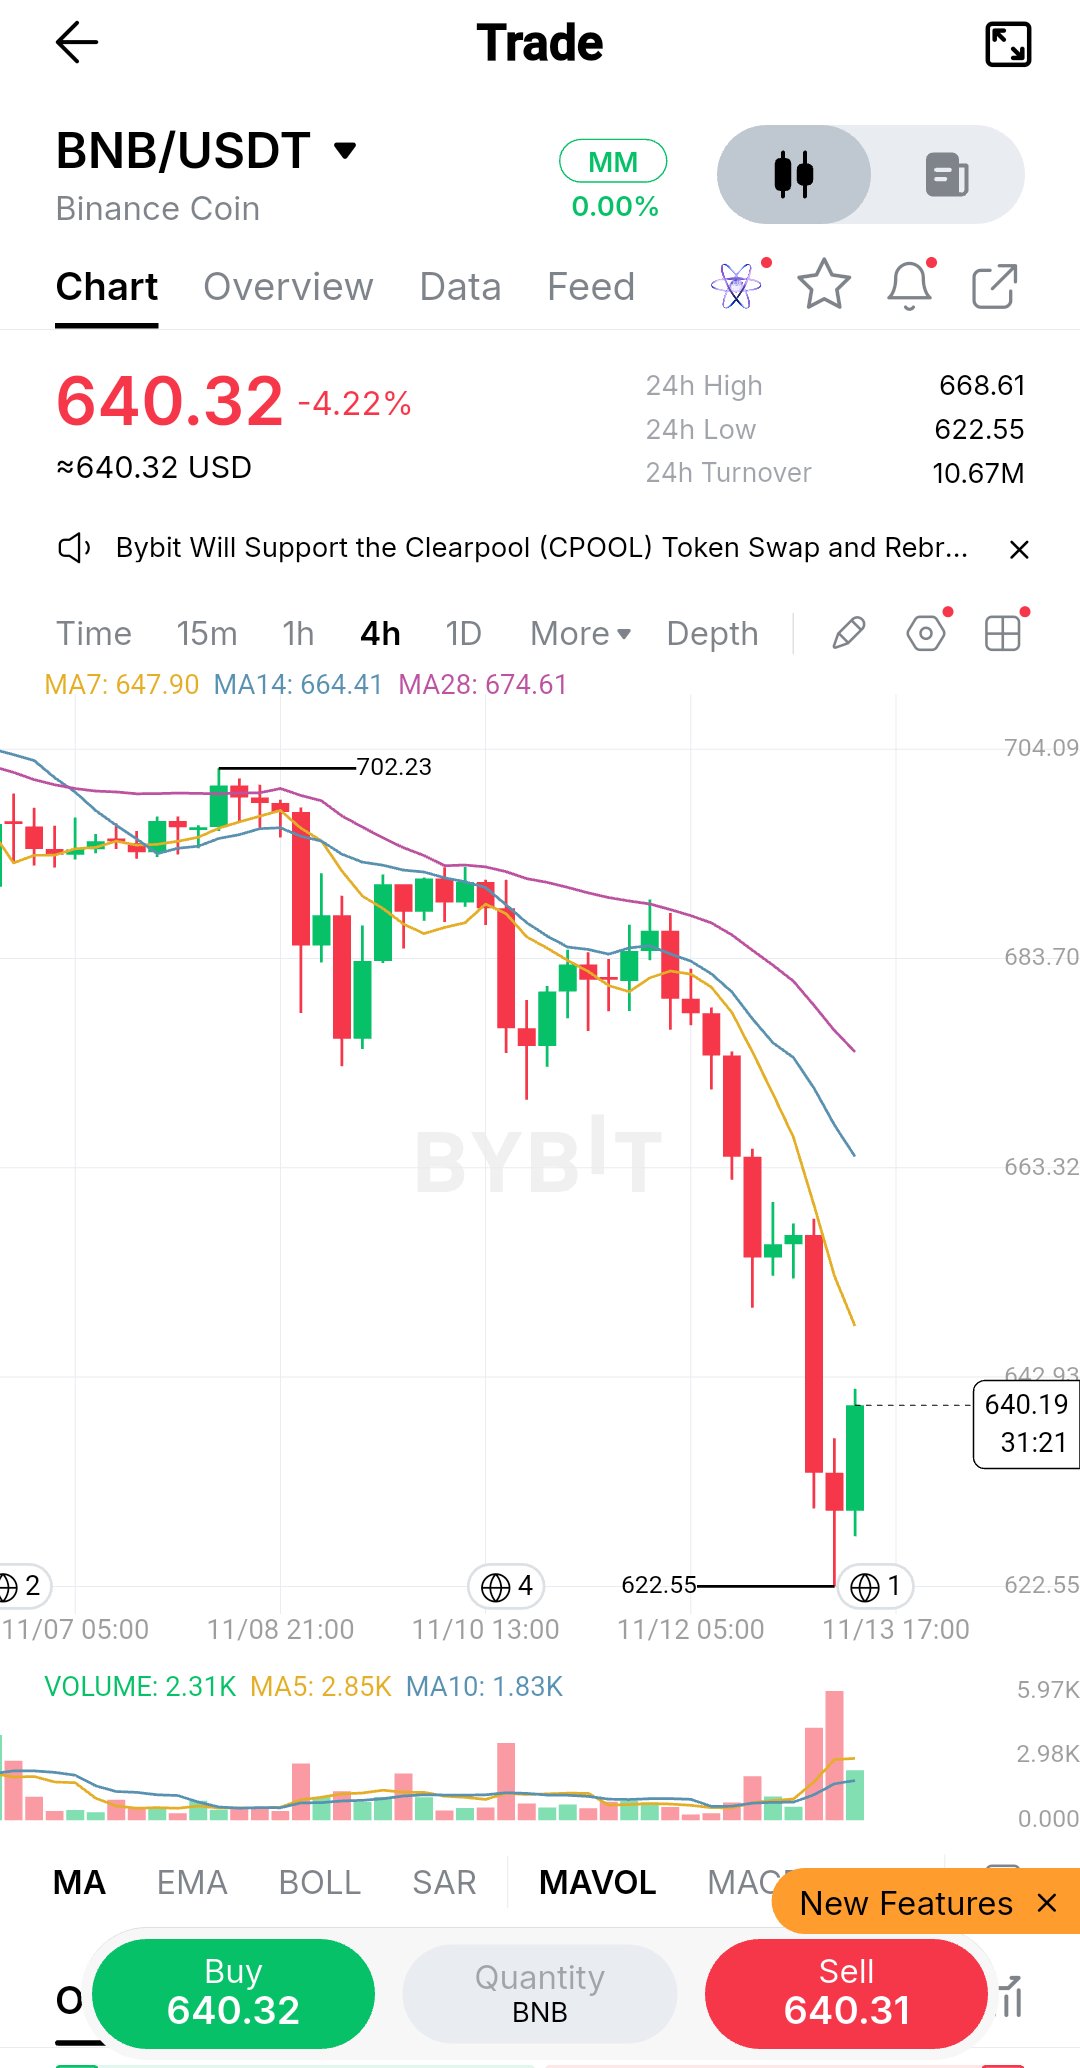
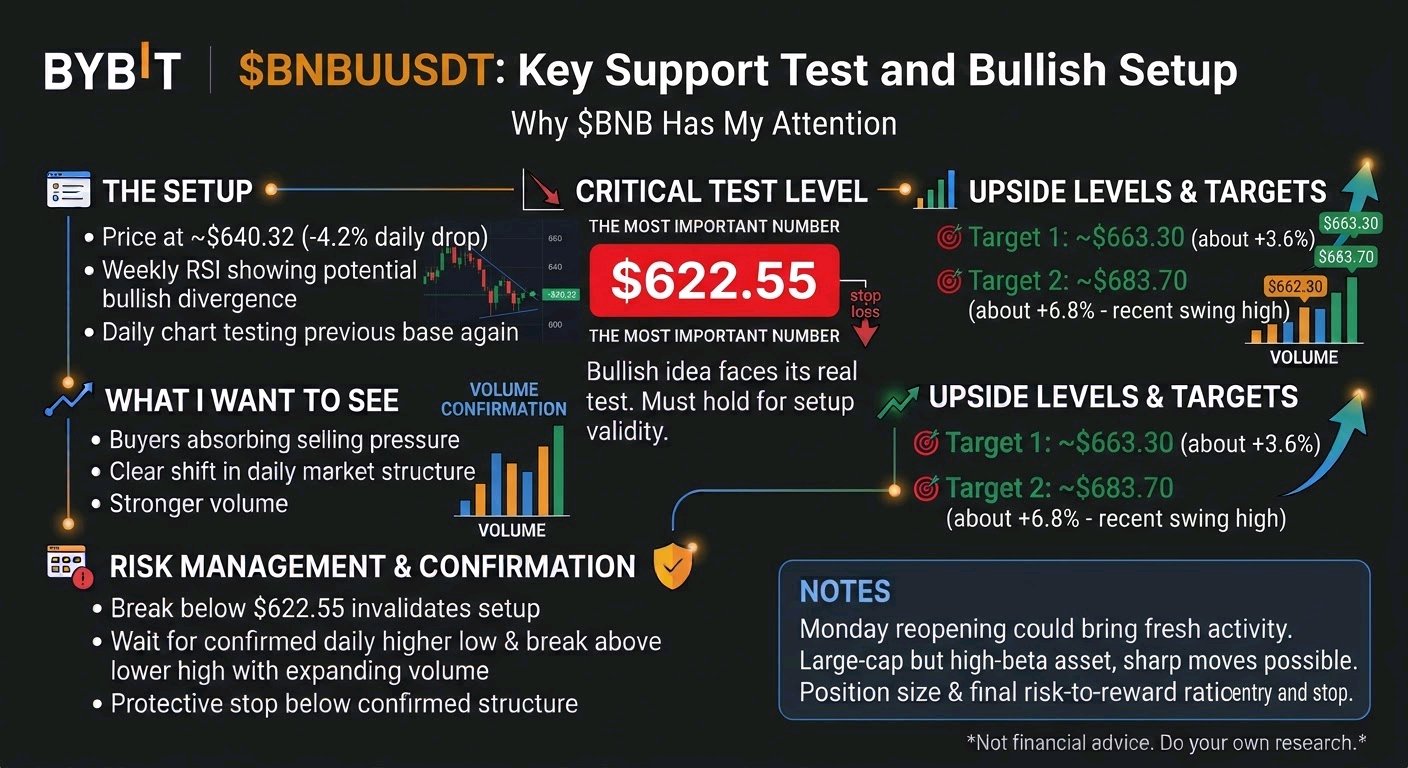
One red line. Two upside levels. This is why $BNBUSDT has my attention. The most important number on my chart is $622.55. That's where my bullish idea faces its real test. The setup $BNB has dropped about 4.2% on the day to roughly $640.32, and it is trading well below its prior highs. Weekly RSI analysis suggests a possible bullish divergence. The daily chart has already shown an initial reaction, and price is now testing that base again. What I want to see is buyers absorbing the selling pressure, followed by a clear shift in daily market structure. If that happens with stronger volume, I'm watching two swing levels: 🎯 Target 1: ~$663.30 (about +3.6% from $640.32) 🎯 Target 2: ~$683.70 (about +6.8% from $640.32) These are ambitious scenarios, not guaranteed returns. Monday's reopening of traditional markets could bring fresh activity, but $BNB needs its own buying volume to support a meaningful recovery. As a large-cap it is still a high-beta asset, so sharp moves can happen in either direction. Management: If price breaks below $622.55 and cannot recover that level, my bullish setup is no longer valid. For a new position, I want a confirmed daily higher low, a break above the latest lower high, and expanding volume. The protective stop belongs below the confirmed structure. Position size and the final risk-to-reward ratio must be calculated from the actual entry and stop, not assumed in advance. I'm heavily bullish on $BNB's recovery potential, but the next volume-backed move will determine whether this remains a promising chart or becomes a trade worth taking. Not financial advice. Do your own research and manage your risk. #IMPACTbyTrade

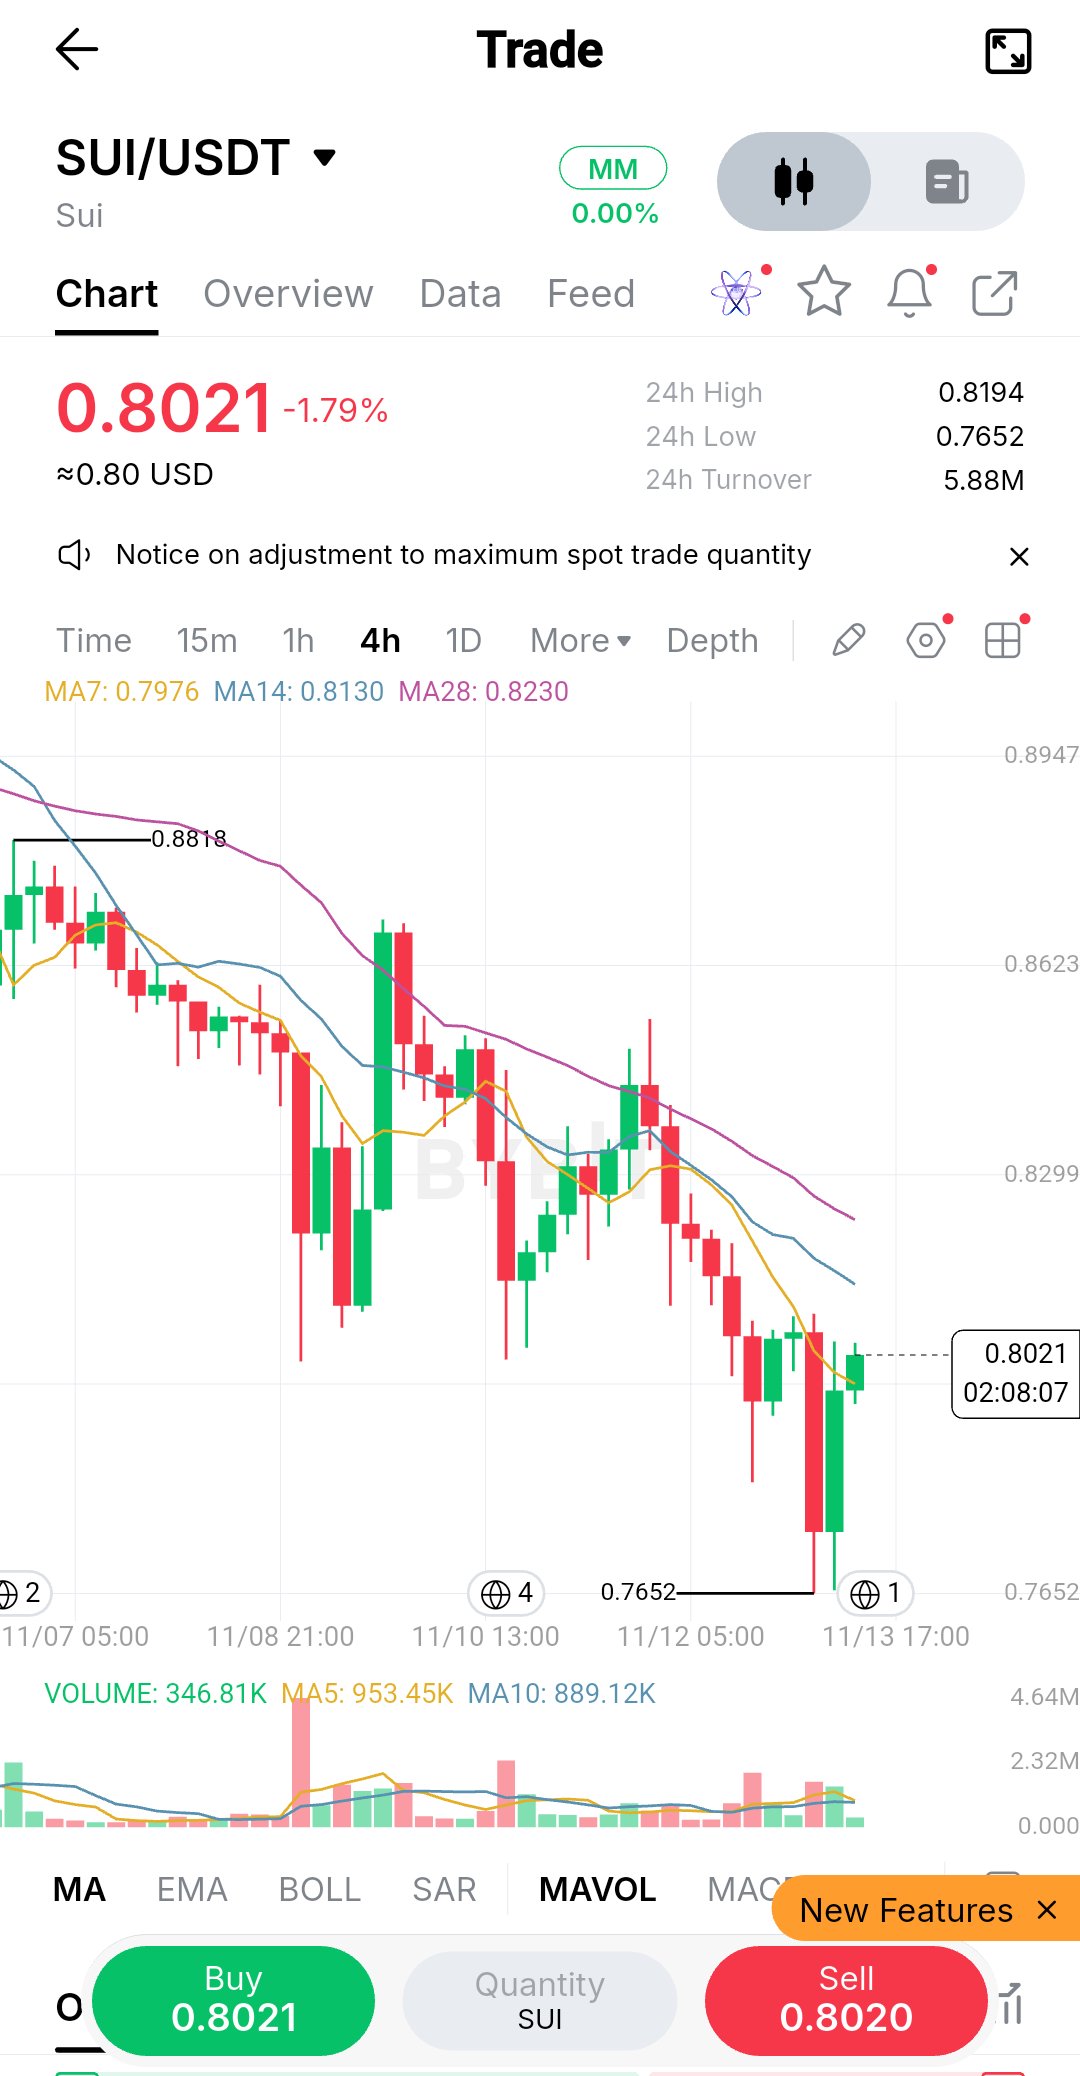
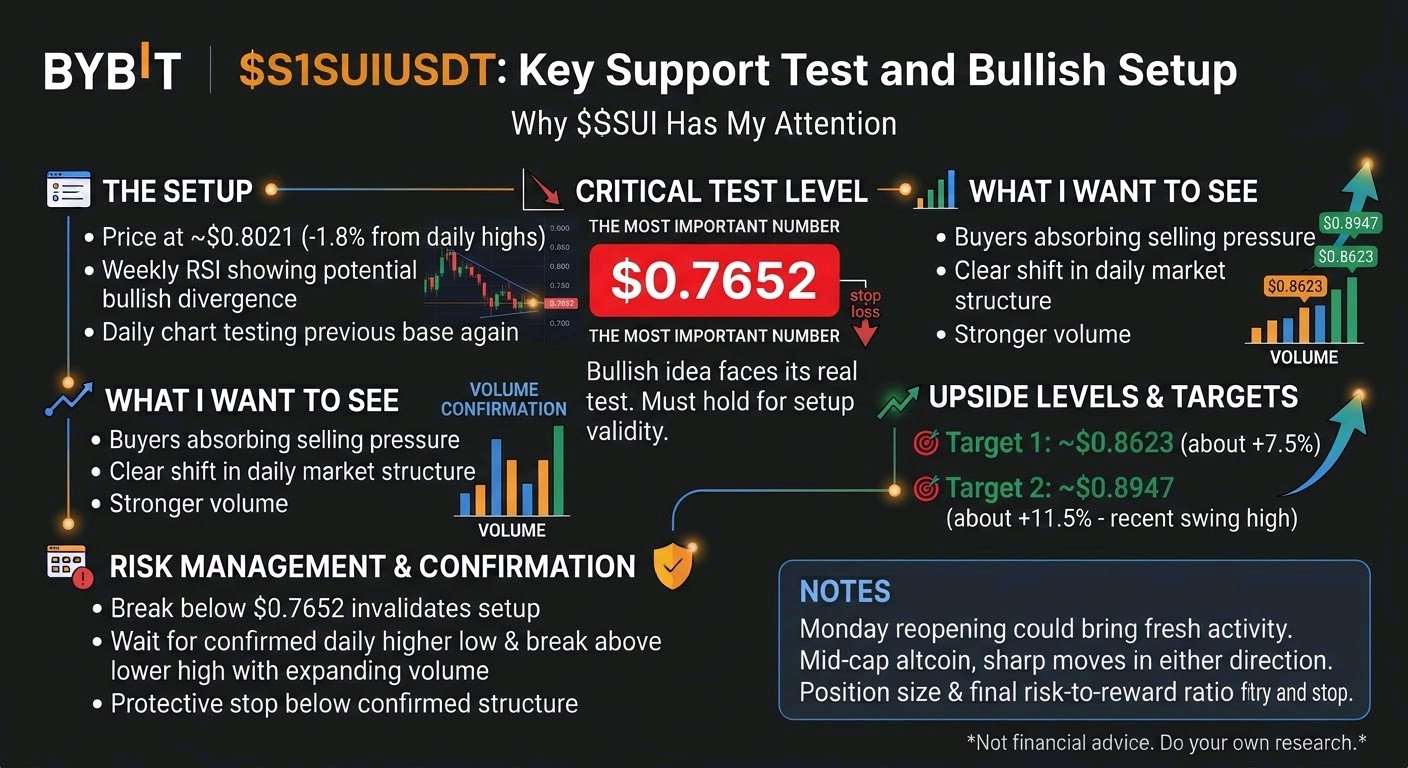
One red line. Two upside levels. This is why $SUIUSDT has my attention. The most important number on my chart is $0.7652. That's where my bullish idea faces its real test. The setup $SUI is down about 1.8% on the day at roughly $0.8021, and it is trading well below its prior highs. Weekly RSI analysis suggests a possible bullish divergence. The daily chart has already shown an initial reaction, and price is now testing that base again. What I want to see is buyers absorbing the selling pressure, followed by a clear shift in daily market structure. If that happens with stronger volume, I'm watching two swing levels: 🎯 Target 1: ~$0.8623 (about +7.5% from $0.8021) 🎯 Target 2: ~$0.8947 (about +11.5% from $0.8021) These are ambitious scenarios, not guaranteed returns. Monday's reopening of traditional markets could bring fresh activity, but $SUI needs its own buying volume to support a meaningful recovery. As a mid-cap altcoin, sharp moves can happen in either direction. Management: If price breaks below $0.7652 and cannot recover that level, my bullish setup is no longer valid. For a new position, I want a confirmed daily higher low, a break above the latest lower high, and expanding volume. The protective stop belongs below the confirmed structure. Position size and the final risk-to-reward ratio must be calculated from the actual entry and stop, not assumed in advance. I'm heavily bullish on $SUI's recovery potential, but the next volume-backed move will determine whether this remains a promising chart or becomes a trade worth taking. Not financial advice. Do your own research and manage your risk. #IMPACTbyTrade

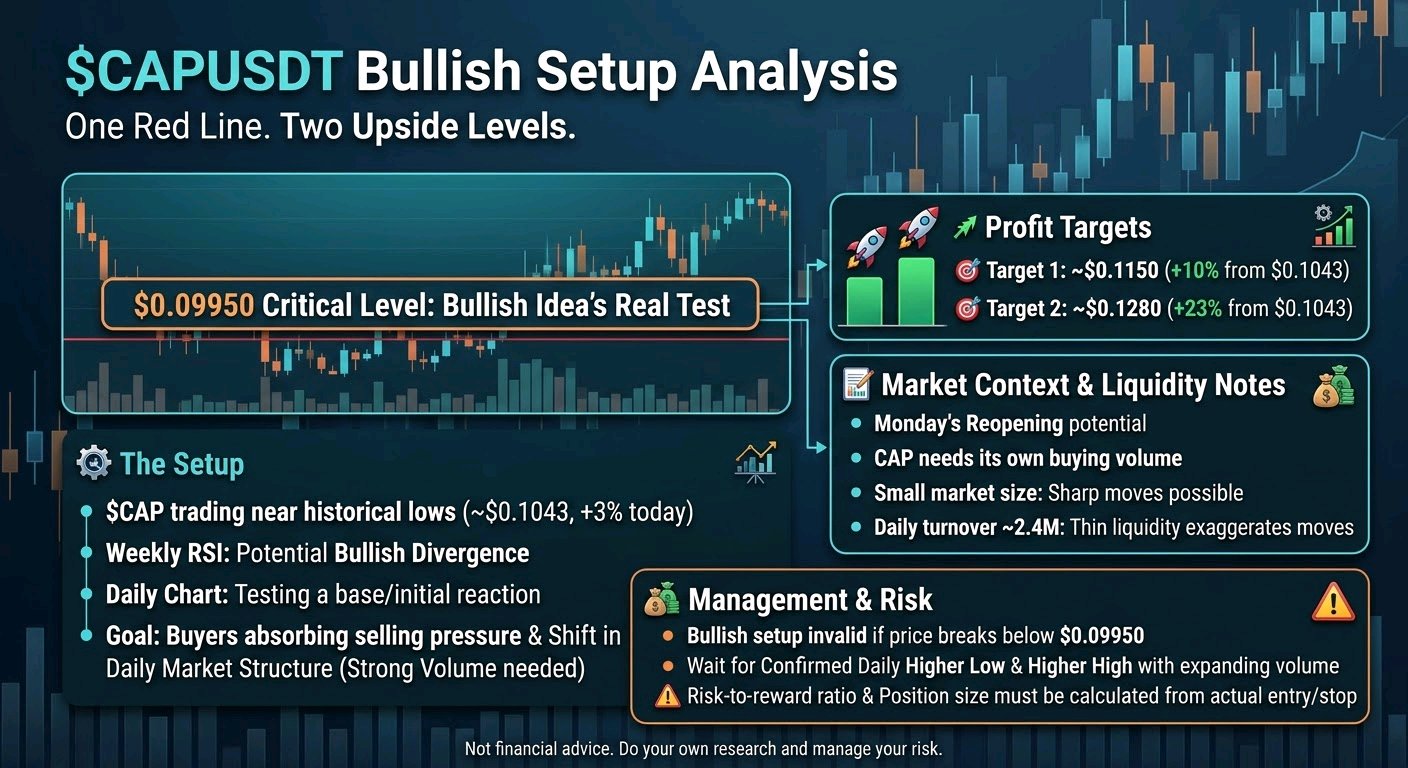
One red line. Two upside levels. This is why $CAPUSDT has my attention. The most important number on my chart is $0.09950. That's where my bullish idea faces its real test. The setup $CAP is trading near historical lows, up about 3% on the day at roughly $0.1043. Weekly RSI analysis suggests a possible bullish divergence. The daily chart has already shown an initial reaction, and price is now testing that base again. What I want to see is buyers absorbing the selling pressure, followed by a clear shift in daily market structure. If that happens with stronger volume, I'm watching two swing levels: 🎯 Target 1: ~$0.1150 (about +10% from $0.1043) 🎯 Target 2: ~$0.1280 (about +23% from $0.1043) These are ambitious scenarios, not guaranteed returns. Monday's reopening of traditional markets could bring fresh activity, but $CAP needs its own buying volume to support a meaningful recovery. Its relatively small market size also means sharp moves can happen in either direction. Daily turnover is only about 2.4M, so thin liquidity can exaggerate both pumps and dumps. Management: If price breaks below $0.09950 and cannot recover that level, my bullish setup is no longer valid. For a new position, I want a confirmed daily higher low, a break above the latest lower high, and expanding volume. The protective stop belongs below the confirmed structure. Position size and the final risk-to-reward ratio must be calculated from the actual entry and stop, not assumed in advance. I'm heavily bullish on $CAP's recovery potential, but the next volume-backed move will determine whether this remains a promising chart or becomes a trade worth taking. Not financial advice. Do your own research and manage your risk. #IMPACTbyTrade

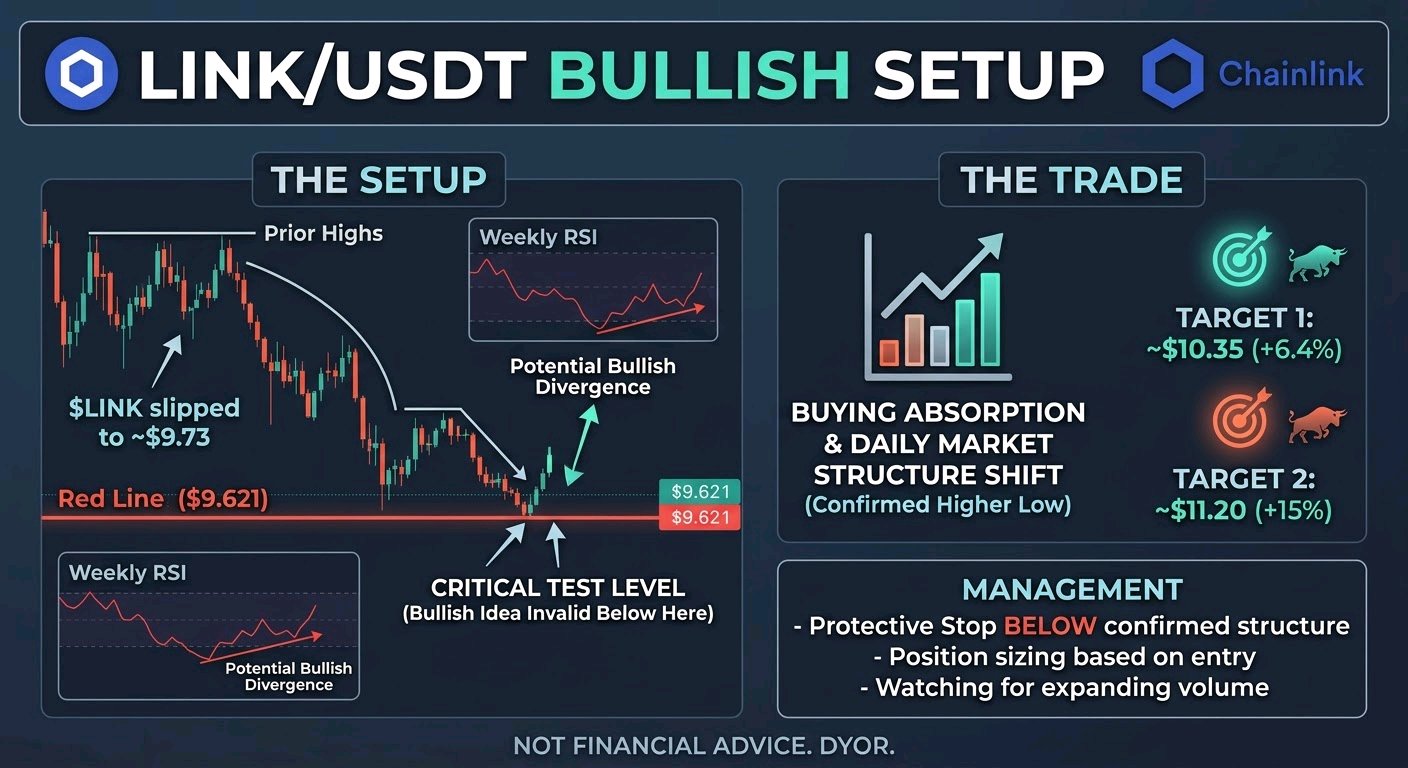
One red line. Two upside levels. This is why $LINKUSDT has my attention. The most important number on my chart is $9.621. That's where my bullish idea faces its real test. The setup $LINK has slipped about 3.6% on the day to roughly $9.73, and it is trading well below its prior highs. Weekly RSI analysis suggests a possible bullish divergence. The daily chart has already shown an initial reaction, and price is now testing that base again. What I want to see is buyers absorbing the selling pressure, followed by a clear shift in daily market structure. If that happens with stronger volume, I'm watching two swing levels: 🎯 Target 1: ~$10.35 (about +6.4% from $9.73) 🎯 Target 2: ~$11.20 (about +15% from $9.73) These are ambitious scenarios, not guaranteed returns. Monday's reopening of traditional markets could bring fresh activity, but $LINK needs its own buying volume to support a meaningful recovery. Its market size is also modest next to the majors, so sharp moves can happen in either direction. Management: If price breaks below $9.621 and cannot recover that level, my bullish setup is no longer valid. For a new position, I want a confirmed daily higher low, a break above the latest lower high, and expanding volume. The protective stop belongs below the confirmed structure. Position size and the final risk-to-reward ratio must be calculated from the actual entry and stop, not assumed in advance. I'm heavily bullish on $LINK's recovery potential, but the next volume-backed move will determine whether this remains a promising chart or becomes a trade worth taking. Not financial advice. Do your own research and manage your risk. #IMPACTbyTrade

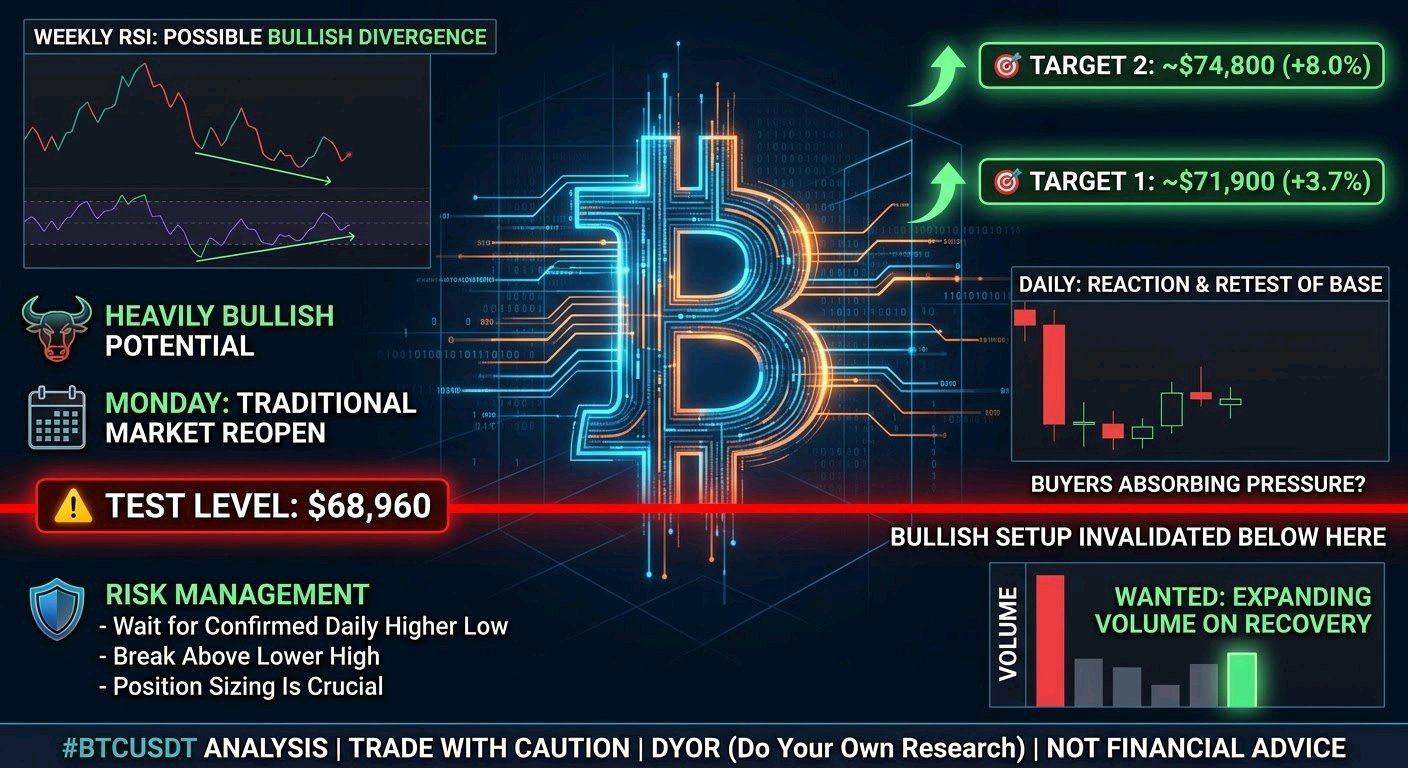
One red line. Two upside levels. This is why $BTCUSDT has my attention. The most important number on my chart is $68,960. That's where my bullish idea faces its real test. The setup $BTC has sold off hard, down about 6% on the day to roughly $69,300, and it is trading far below its prior highs. Weekly RSI analysis suggests a possible bullish divergence. The daily chart has already shown an initial reaction, and price is now testing that base again. What I want to see is buyers absorbing the selling pressure, followed by a clear shift in daily market structure. If that happens with stronger volume, I'm watching two swing levels: 🎯 Target 1: ~$71,900 (about +3.7% from $69,300) 🎯 Target 2: ~$74,800 (about +8% from $69,300) These are ambitious scenarios, not guaranteed returns. Monday's reopening of traditional markets could bring fresh activity, but $BTC needs its own buying volume to support a meaningful recovery. Even with its size, a market this leveraged can move sharply in either direction, and the last candles show how fast. Management: If price breaks below $68,960 and cannot recover that level, my bullish setup is no longer valid. For a new position, I want a confirmed daily higher low, a break above the latest lower high, and expanding volume. The protective stop belongs below the confirmed structure. Position size and the final risk-to-reward ratio must be calculated from the actual entry and stop, not assumed in advance. I'm heavily bullish on $BTC's recovery potential, but the next volume-backed move will determine whether this remains a promising chart or becomes a trade worth taking. Not financial advice. Do your own research and manage your risk. #IMPACTbyTrade

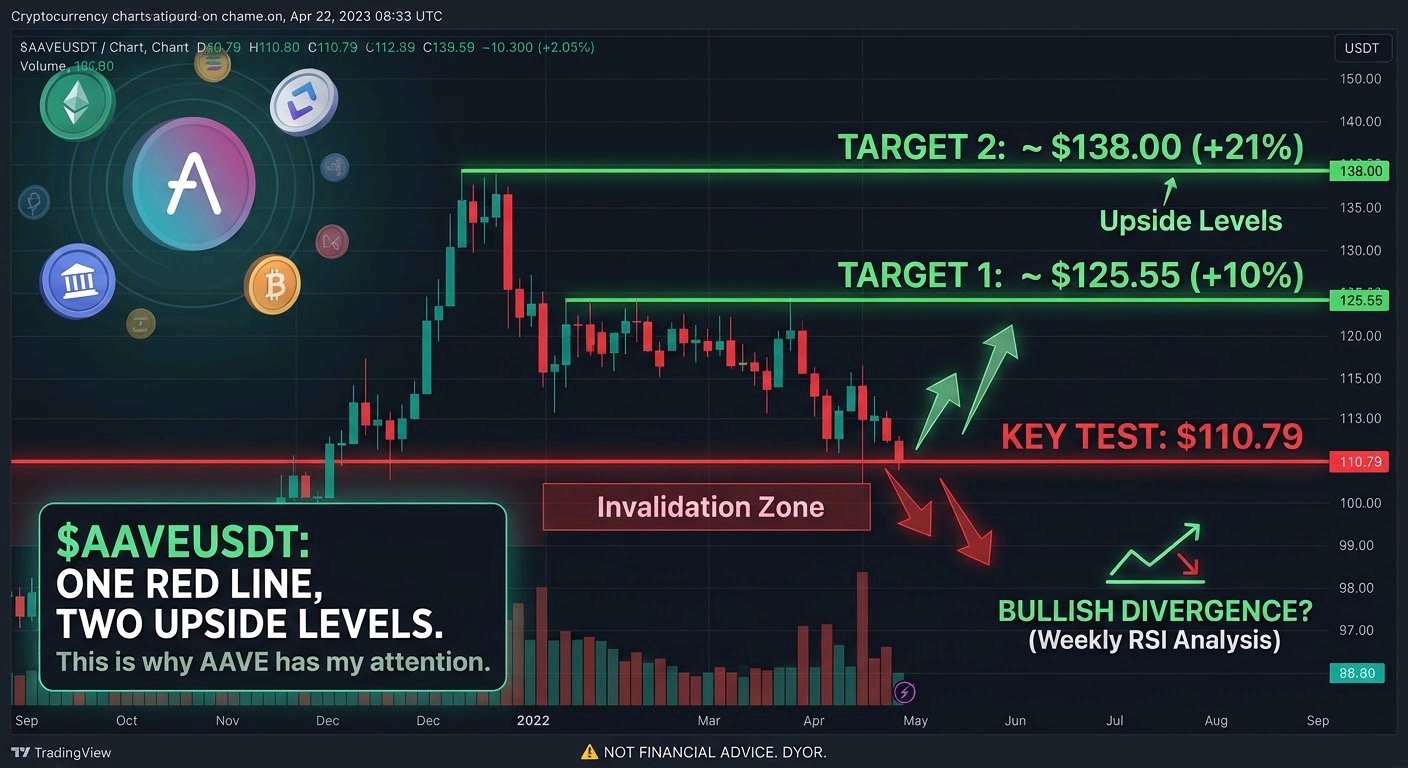
One red line. Two upside levels. This is why $AAVEUSDT has my attention. The most important number on my chart is $110.79. That's where my bullish idea faces its real test. 📉 The setup $AAVE is trading near its recent lows after a sharp ~8% daily drop. Weekly RSI analysis suggests a possible bullish divergence. The daily chart has already shown an initial reaction, and price is now testing that base again. 👀 What I want to see Buyers absorbing the selling pressure, followed by a clear shift in daily market structure. 🎯 If that happens with stronger volume, I'm watching two swing targets: ~$125.55 (previous swing high): roughly +10% from $114.03 ~$138.00 (next resistance zone): roughly +21% from $114.03 These are ambitious scenarios, not guaranteed returns. 🌍 Monday's reopening of traditional markets could bring fresh activity, but $AAVE needs its own buying volume to support a meaningful recovery. Its relatively modest market size also means sharp moves can happen in either direction. Management: If price breaks below $110.79 and cannot recover that level, my bullish setup is no longer valid. For a new position, I want a confirmed daily higher low, a break above the latest lower high, and expanding volume. The protective stop belongs below the confirmed structure. Position size and the final risk-to-reward ratio must be calculated from the actual entry and stop, not assumed in advance. I'm heavily bullish on $AAVE's recovery potential, but the next volume-backed move will determine whether this remains a promising chart or becomes a trade worth taking. Not financial advice. Do your own research and manage your risk. #IMPACTbyTrade