rubina
Crypto lover
ARB Bounces 10% From $0.12284 — But the $0.1377 Resistance Is Still Blocking Recovery ARB has made a noticeable recovery from $0.12284, and buyers have managed to bring the price back toward $0.136. However, there is an important difference between recovering from a local low and actually reversing a downtrend. Right now, ARB is showing short-term strength, but the 4H chart has not yet confirmed a bullish reversal. ARB/USDT: $0.13627 | +1.97% The 4H chart is approaching a critical decision zone The current moving averages are: - MA7: $0.13277 - MA14: $0.13768 - MA28: $0.14476 Price has reclaimed the 4H MA7, which is a positive short-term development. But it is still trading below MA14 and MA28. This makes the $0.1377–$0.1448 region important. Buyers need to reclaim this area to improve the broader structure. Until then, the recovery remains vulnerable to another rejection. Short-term buyers are showing some strength On the 15-minute chart, ARB is trading above its moving averages: - MA7: $0.13567 - MA14: $0.13544 - MA28: $0.13561 The averages are tightly grouped around the current price, suggesting short-term consolidation after the rebound. However, displayed volume is 88.37K, below both MA5 at 250.59K and MA10 at 216.69K. That tells me the recovery still needs stronger participation before treating it as a convincing breakout. Levels that matter Resistance - $0.13735: 24H high - $0.13768: 4H MA14 - $0.14214: Nearby higher-timeframe chart resistance - $0.14476: 4H MA28 Support - $0.1354–$0.1357: Short-term moving-average support - $0.13249: Nearby 15M chart support - $0.12766: Lower chart support - $0.12284: Recent major swing low Trading outlook Bias: WAIT for breakout confirmation. A sustained move above $0.1377, supported by stronger volume, could open the way toward $0.1421 and potentially $0.1448. But if ARB fails around $0.1373–$0.1377 and loses the $0.1354 area, the recovery could weaken. A break below $0.13249 would make a retest of lower support increasingly possible. A move below $0.12284 would invalidate the current recovery structure. The setup is improving on the lower timeframe, but I would not confuse a relief bounce with a confirmed trend reversal. The next reaction around $0.1377 is likely to tell us much more. Would you consider ARB bullish only after a 4H close above $0.1377, or do you think the current recovery already has enough strength to continue? $ARBUSDT #ByXIMPACT
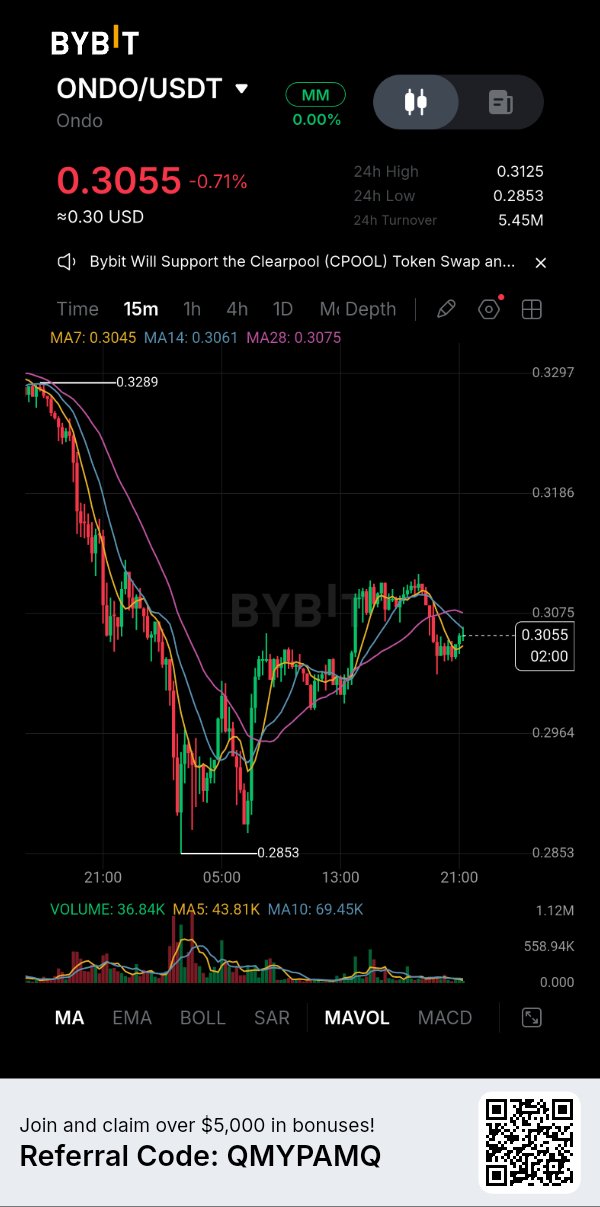
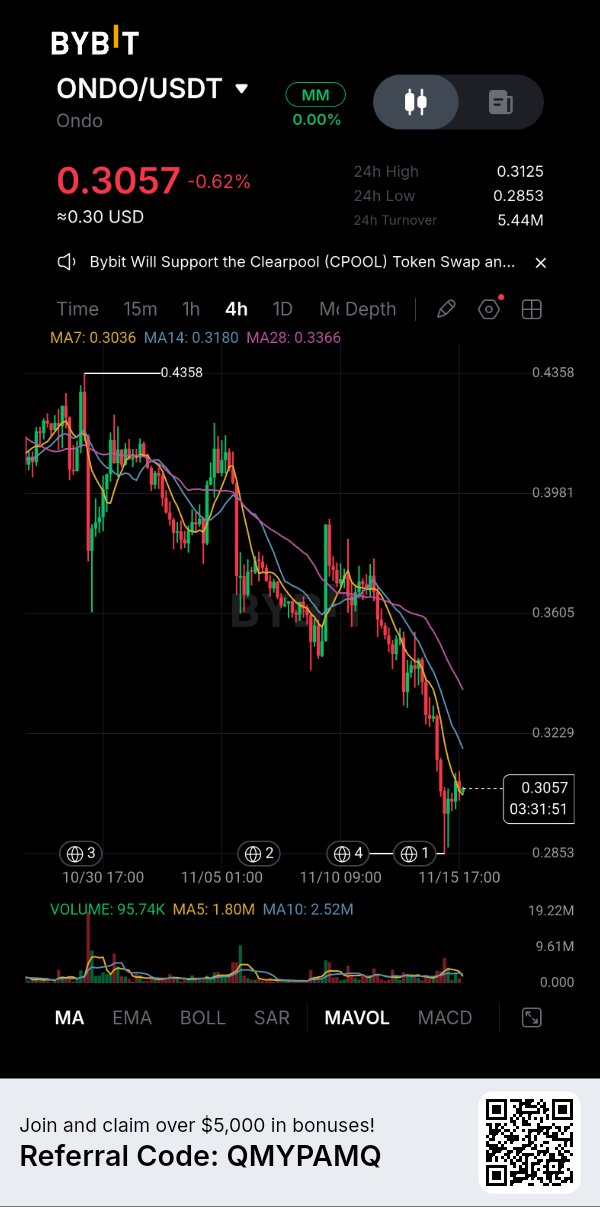
ONDO Reclaims $0.30 — But the 4H Trend Still Has Something to Prove ONDO is showing signs of short-term stabilization after dropping to $0.2853. Price has recovered toward $0.3055, but I am paying more attention to what happens around the $0.3075–$0.3125 resistance area than to the bounce itself. The recovery is visible. A confirmed trend reversal is not. ONDO/USDT: $0.3055 | -0.71% The 4H chart is still under pressure The current 4H moving averages are: - MA7: $0.3036 - MA14: $0.3180 - MA28: $0.3366 ONDO has moved back above MA7, which suggests that buyers are attempting to establish short-term support. However, price remains below MA14 and MA28. That distinction matters. The nearest average has been reclaimed, but the broader trend has not yet improved enough to support a confident bullish position. The 15-minute chart shows a tight resistance cluster The current 15m moving averages are: - MA7: $0.3045 - MA14: $0.3061 - MA28: $0.3075 Price is trading around the short-term averages but remains below MA14 and MA28. The $0.3061–$0.3075 zone is therefore an immediate test for buyers. There is also a volume concern. The displayed 15m volume is 36.84K, compared with MA5 at 43.81K and MA10 at 69.45K. Participation is relatively weak. I would want to see volume expand alongside a breakout rather than assume that the recovery has enough strength to continue. The important levels Resistance - $0.3061–$0.3075: 15m moving-average resistance - $0.3125: 24H high - $0.3180: 4H MA14 - $0.3366: 4H MA28 Support - $0.3045: 15m MA7 - $0.3036: 4H MA7 - $0.2964: Nearby chart support - $0.2853: Recent low and major downside reference My trading outlook Bias: Cautious — short-term recovery, broader trend still bearish. If ONDO reclaims $0.3075 and holds above it with stronger volume, the next test would be $0.3125. A sustained move above $0.3125 would improve the recovery structure and bring $0.3180 into focus. However, rejection from the $0.3061–$0.3075 zone followed by a loss of $0.3036 would weaken the rebound. Below that, $0.2964 becomes an important support reference, with $0.2853 remaining the major low. A decisive break below $0.2853 would invalidate the current recovery attempt. I would avoid chasing a long position directly into resistance. The better setup is a confirmed reclaim with volume or a clear rejection that establishes the next direction. What matters more to you here: ONDO holding above $0.3036 and building a base, or reclaiming $0.3125 before considering the recovery genuine? $ONDOUSDT #IMPACTbyTrade
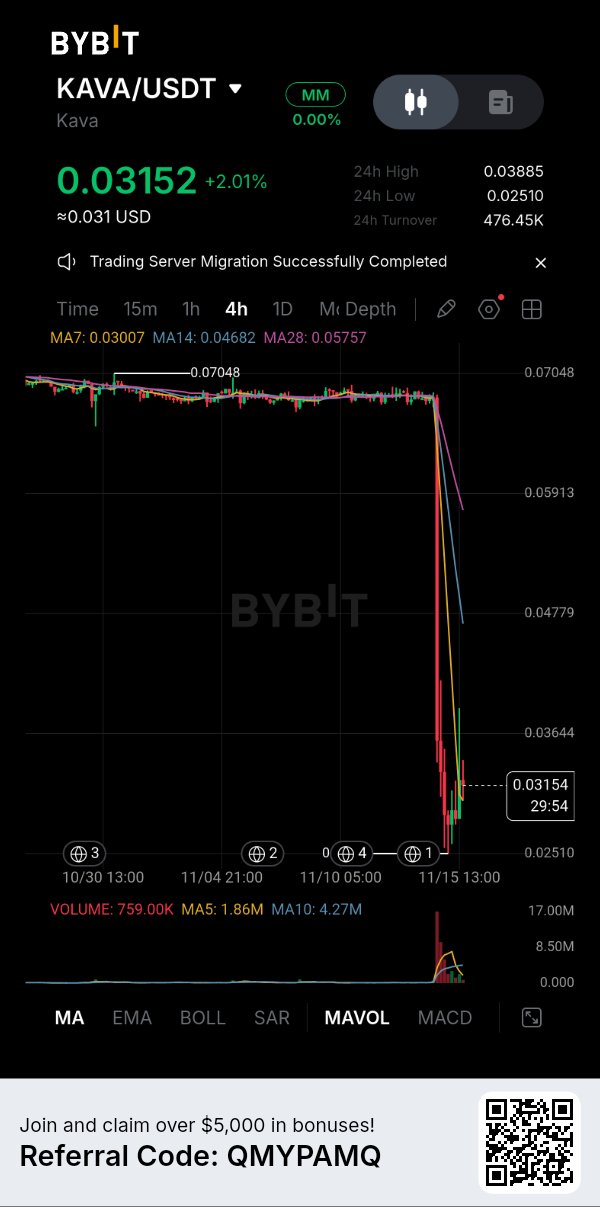
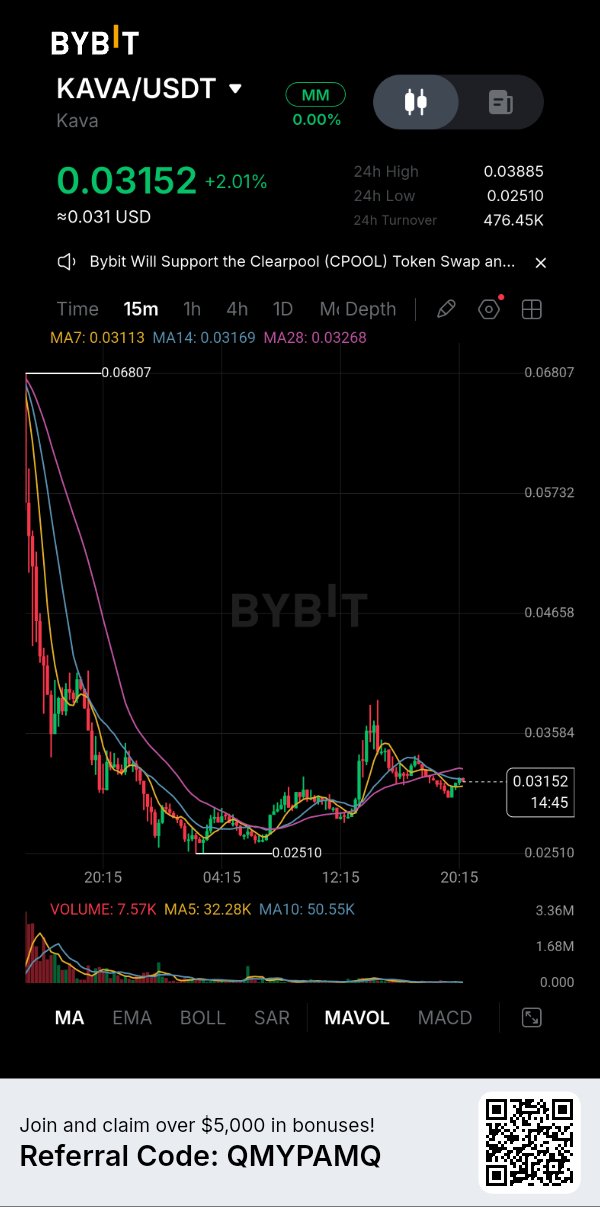
KAVA Rebounds From $0.02510 But One Recovery Does Not Reverse This Downtrend KAVA is showing a small recovery around $0.03152, but the bigger chart tells a much more difficult story. Price collapsed from the $0.068 area toward $0.02510 before buyers stepped in. That bounce is worth watching, but I would not call it a trend reversal yet. The key issue is the distance between the current price and the higher-timeframe moving averages. Buyers have recovered some ground, but they still have major resistance to overcome. KAVA/USDT: $0.03152 | +2.01% The 4H trend remains heavily damaged The displayed 4H moving averages are: - MA7: $0.03007 - MA14: $0.04682 - MA28: $0.05757 KAVA is back above MA7, which supports the idea of a short-term rebound. However, it remains far below MA14 and MA28. This gap shows how much downside pressure the market has experienced. The 4H volume is approximately 759K, compared with MA5 at 1.86M and MA10 at 4.27M. The current participation is much weaker than those averages, so the recovery still needs stronger buying activity. The 15-minute chart shows a smaller battle The 15m moving averages are: - MA7: $0.03113 - MA14: $0.03169 - MA28: $0.03268 Price is hovering around MA7 but remains below MA14 and MA28. This creates an immediate resistance zone around $0.03169–$0.03268. The chart also shows a previous recovery attempt toward the $0.03584 area. If buyers can reclaim the moving-average cluster and then break that level with stronger volume, the rebound could gain credibility. The levels I am watching Resistance - $0.03169–$0.03268: 15m moving-average zone - $0.03584: Nearby recovery resistance - $0.03644–$0.03885: Higher resistance area Support - $0.03113: 15m MA7 - $0.03007: 4H MA7 - $0.02510: Recent major low My trading outlook Bias: WAIT — the broader trend remains bearish, but chasing a short after such a sharp collapse carries its own risk. If KAVA reclaims $0.03268 and then clears $0.03584 with stronger volume, the recovery could extend toward $0.03644. On the other hand, rejection below the moving-average cluster followed by a loss of $0.03007 would weaken the rebound. A move back toward $0.02510 would then become a serious possibility. The $0.02510 low is the key invalidation reference for the current recovery attempt: a decisive break below it would show that buyers failed to protect the recent bottom. I would rather wait for confirmation than enter simply because the price has bounced from its low. What is your reading of KAVA here: are buyers building a genuine base above $0.030, or is this recovery likely to face another rejection near $0.03584?$KAVAUSDT #ByXIMPACT
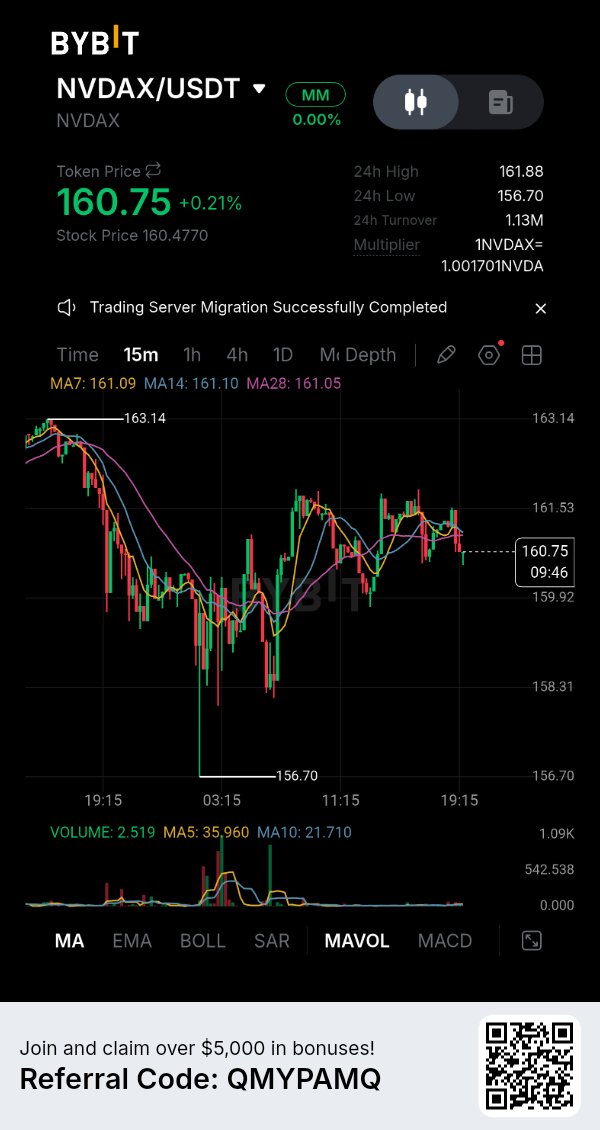
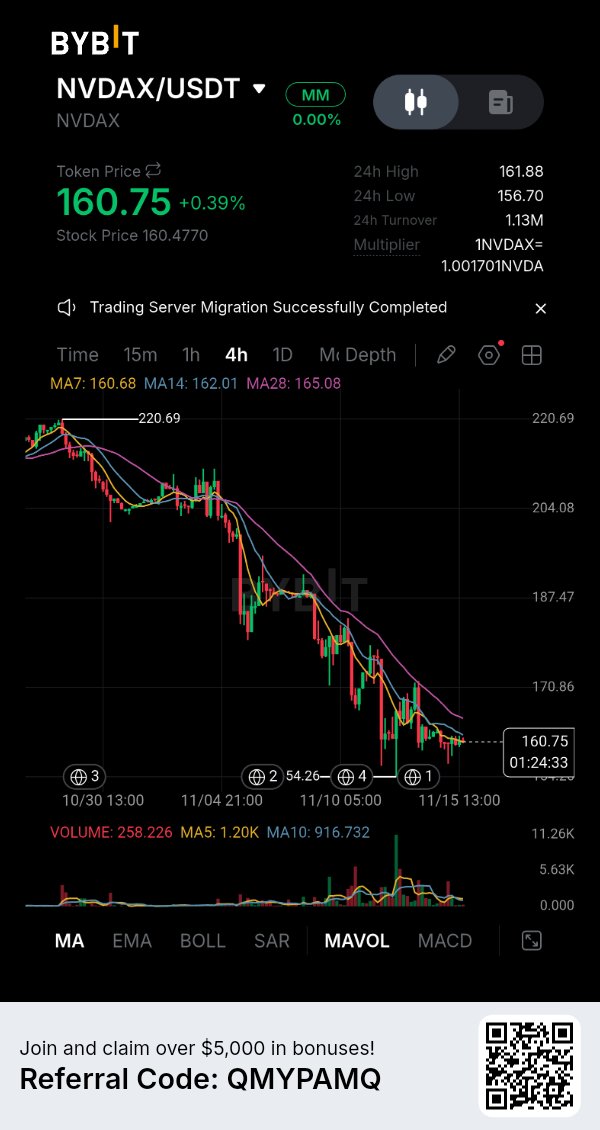
NVDAX Is Struggling Below $161 Is This Recovery Already Losing Momentum? NVDAX is trading around $160.75 after recovering from the $156.70 low, but the latest chart structure raises an important question: are buyers building a base, or is this simply a pause within a larger downtrend? The 4H chart still shows a clear sequence of lower highs. Price has fallen significantly from the previous $220.69 area, and the moving averages continue to reflect broader weakness. Current NVDAX Price: $160.75 Underlying NVDA stock price displayed: $160.4770 The 4H trend is still the bigger concern The current 4H moving averages are: - MA7: $160.68 - MA14: $162.01 - MA28: $165.08 Price is sitting close to MA7 but remains below MA14 and MA28. This means the recent recovery has not yet repaired the broader bearish structure. For buyers, reclaiming $162.01 and then $165.08 would be an important improvement. Until then, rallies may continue to face selling pressure. The 15-minute chart shows hesitation The short-term moving averages are tightly grouped: - MA7: $161.09 - MA14: $161.10 - MA28: $161.05 NVDAX is currently trading below this cluster. That makes the $161.05–$161.10 area an immediate decision zone. The price previously rebounded toward $163.14, but it has not maintained that strength. More importantly, displayed volume is only 2.519, compared with MA5 volume of 35.960 and MA10 volume of 21.710. That weak participation makes it difficult to trust the recovery as a confirmed bullish move. The levels that matter now Resistance - $161.05–$161.10: Immediate moving-average cluster - $161.88: 24H high - $163.14: Recent 15m swing high - $165.08: 4H MA28 Support - $159.92: Nearby 15m chart level - $158.31: Lower visible chart support - $156.70: Recent 24H low My trading outlook Bias: Bearish on the 4H timeframe; short-term direction needs confirmation. A sustained move above $161.10, followed by a reclaim of $161.88 and $163.14 with stronger volume, would give buyers a better opportunity to challenge the broader downtrend. On the other hand, rejection around the moving-average cluster followed by a break below $159.92 could expose $158.31 and potentially $156.70 again. I would avoid chasing either direction while price remains trapped around this decision zone. A confirmed breakdown or a convincing reclaim is more useful than guessing the next candle. One important distinction: NVDAX is a tokenized representation linked to NVIDIA stock, so its trading structure and token-specific liquidity should not automatically be treated as identical to the underlying stock market. What would convince you that NVDAX has finally found a bottom: a strong reclaim above $163.14, or a successful hold of $156.70 followed by a higher low? $NVDAXUSDT #IMPACTbyTrade
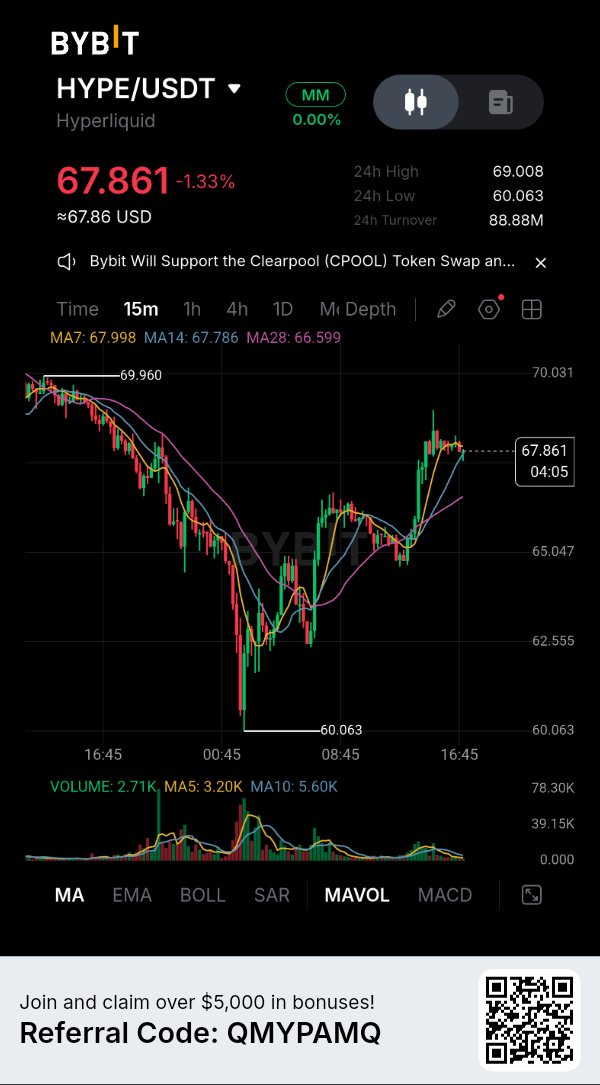
HYPE Has Recovered From $60 But the $70 Resistance Could Decide Its Next Move The latest HYPE recovery is worth watching because buyers have managed to pull the price back from $60.06 to nearly $68 after a sharp sell-off. But there is an important detail in the chart: the short-term structure is improving much faster than the higher timeframe. On the 1H chart, price has reclaimed all three moving averages, while the 4H chart is still facing resistance overhead. This tells me buyers are returning, but they have not yet reversed the broader trend. The $69–$71 region is where this recovery will face its real test. HYPE/USDT: $67.849 | Down approximately 1.37% The Daily chart still carries a bearish structure HYPE remains below all three Daily moving averages: - MA7: $70.892 - MA14: $75.493 - MA28: $78.575 The decline from the previous high near $98.04 has created a clear sequence of lower highs and lower lows. The first major improvement would be a sustained reclaim of the Daily MA7 near $70.89. Until then, the larger trend remains under pressure. The 4H chart is showing an early recovery, not a confirmed reversal The current 4H moving averages are: - MA7: $66.315 - MA14: $68.698 - MA28: $70.338 Price has moved above the 4H MA7, which is encouraging. However, it remains below the MA14 and MA28. This creates an important resistance zone between $68.70 and $70.34. A sustained move above this area would make the recovery much more convincing. The 1H chart is where buyers have made progress The 1H moving averages are: - MA7: $66.844 - MA14: $65.891 - MA28: $66.124 HYPE is currently above all three. This is a positive short-term signal and suggests that the bounce from the $60.06 low has improved the hourly structure. However, the 15-minute chart shows price near its MA7 of $67.998, with the MA14 at $67.786 and MA28 at $66.599. The immediate momentum is therefore not completely settled. Buyers need to hold the short-term moving-average area and push through the recent $69.008 high. Derivatives data shows how aggressive the previous sell-off was A November 15 market-data snapshot from CoinGlass showed approximately $86.35 million in HYPE futures liquidations over 24 hours, with around 99% coming from long positions. Open interest was down approximately 7.55%, while futures volume had increased sharply. This suggests that a substantial amount of leveraged long exposure was flushed out during the decline. Such an event can create conditions for a relief bounce, but it does not automatically confirm a lasting bullish reversal. These derivatives figures are a separate market-data snapshot, not a reading from the exact moment of the Bybit screenshot. Key levels I am watching Resistance - $67.998: 15m MA7 - $68.698: 4H MA14 - $69.008: Recent 24H high - $70.338–$70.892: 4H MA28 and Daily MA7 - $75.493: Daily MA14 Support - $67.786–$66.599: Short-term moving-average area - $66.315: 4H MA7 - $65.047: Nearby chart support - $63.874: Lower chart support - $60.063: Recent swing low My trading outlook Current bias: WAIT FOR CONFIRMATION — short-term recovery, broader trend still bearish. If HYPE holds above the $66.60–$66.84 area and reclaims $68.70, buyers could make another attempt toward $69.008 and then $70.34. A sustained breakout above $70.89 would be a much stronger signal that the Daily trend is beginning to improve. However, if price loses $66.60 and then breaks below $65.047, the recovery could weaken and expose the $63.874 area. I would not chase this bounce blindly. The hourly chart has improved, but the higher timeframes still need confirmation. Do you think HYPE can reclaim $70 and turn this recovery into a trend reversal, or will sellers defend the $69–$71 resistance zone again? $HYPEUSDT #IMPACTbyTrade

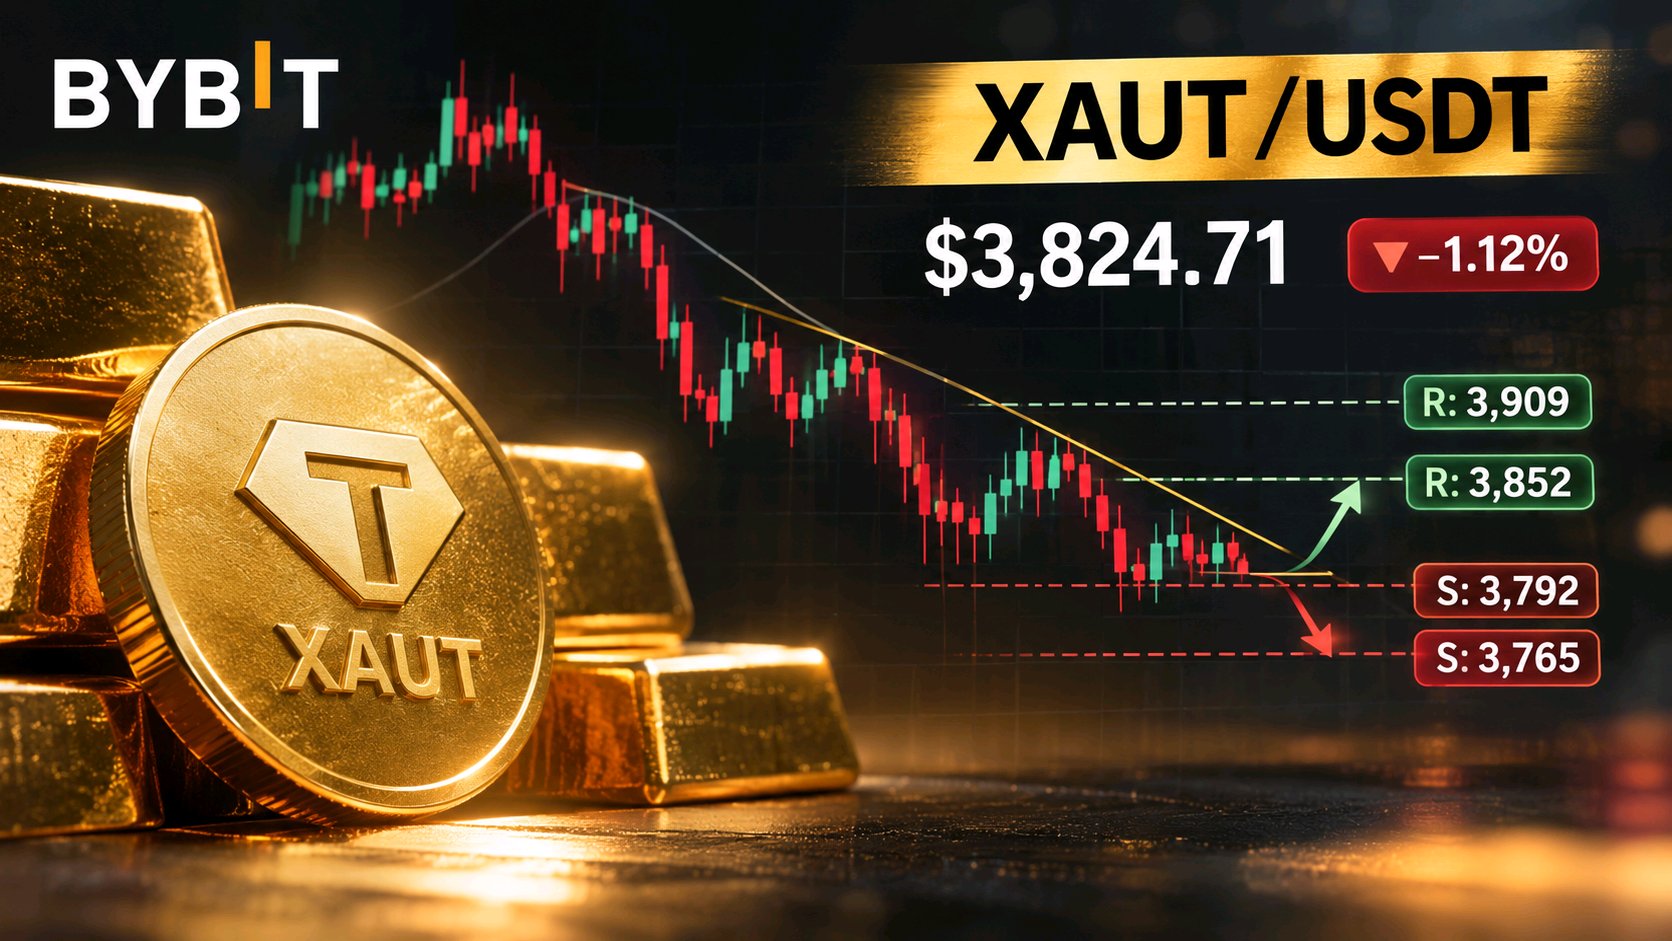
XAUT Drops Below $3,850 — Is Gold Preparing for Another Recovery or More Downside? The latest move in Tether Gold caught my attention because this is not just another crypto chart reacting to market sentiment. XAUT follows the underlying gold market, and the recent weakness in bullion is now clearly reflected in its price action. After trading near $4,130 on the 4H chart, XAUT has fallen toward $3,765.91 before recovering to around $3,824.71. Buyers have managed to stabilize the price, but the bigger trend is still pointing downward. The important question now is whether this recovery can reclaim $3,850–$3,900 or whether sellers will use the bounce to push price lower again. XAUT/USDT: $3,824.71 | Down approximately 1.12% The Daily chart remains under bearish pressure XAUT is trading below all three Daily moving averages: - MA7: $3,930.15 - MA14: $3,976.73 - MA28: $3,994.61 This is a clear sign that the broader structure has weakened. The decline from the previous high near $4,679.80 has created a sequence of lower highs and lower lows. Until buyers reclaim the $3,930–$3,995 region, I would remain cautious about calling this a sustained recovery. The 4H chart shows a possible stabilization attempt The 4H moving averages currently stand at: - MA7: $3,830.39 - MA14: $3,852.16 - MA28: $3,909.27 Price is hovering just below the MA7, while the MA14 and MA28 remain overhead resistance. The recent low at $3,765.91 is the key support reference. Buyers reacted there, but they still need to reclaim $3,852 and then challenge $3,900 to improve the short-term structure. The 15-minute chart is trying to build a base The short-term moving averages are tightly clustered: - MA7: $3,825.98 - MA14: $3,823.33 - MA28: $3,821.86 Price is trading slightly above this cluster, suggesting that the immediate selling pressure has eased. However, the displayed current volume is very low compared with the moving-average volume readings. This means the latest stabilization does not yet provide convincing evidence of strong fresh demand. Why the gold market matters for XAUT There is an important macro factor behind this decline. Recent gold-market reporting linked bullion weakness to stronger US inflation concerns, hawkish Federal Reserve commentary and a stronger dollar. Higher interest-rate expectations can put pressure on gold because the metal does not generate interest income. Reuters reported that gold was heading toward its worst weekly performance in roughly four months after a sharp decline earlier in the week. There is also a positive development specific to XAUT: KPMG recently issued an unqualified audit opinion on TG Commodities' 2025 financial statements. The reported gold holdings were 520,089.350 fine troy ounces against 520,089.300 XAUT tokens for that reporting period. This improves transparency around the reported backing, but it does not remove market-price risk or guarantee future performance. Key levels I am watching Resistance - $3,830: 4H MA7 - $3,852: 4H MA14 - $3,871: Recent 24H high - $3,909: 4H MA28 - $3,930–$3,995: Daily moving-average resistance zone Support - $3,823–$3,821: 15m moving-average cluster - $3,792: Nearby chart support - $3,765.91: Recent swing low - $3,750: Psychological support reference My trading outlook Current bias: BEARISH, with an early stabilization attempt. If XAUT fails to reclaim $3,852 and loses the $3,792 support area, another test of $3,765.91 becomes possible. A decisive break below $3,765.91 would increase downside risk, with $3,750 becoming another level to monitor. On the other hand, a sustained recovery above $3,871 followed by a reclaim of $3,909 would be a stronger indication that buyers are regaining control. I would not chase either direction blindly. XAUT needs confirmation from both its own chart and the underlying gold market. Do you think gold can recover and pull XAUT back above $3,900, or will the stronger dollar and interest-rate pressure keep sellers in control? $XAUTUSDT #IMPACTbyTrade

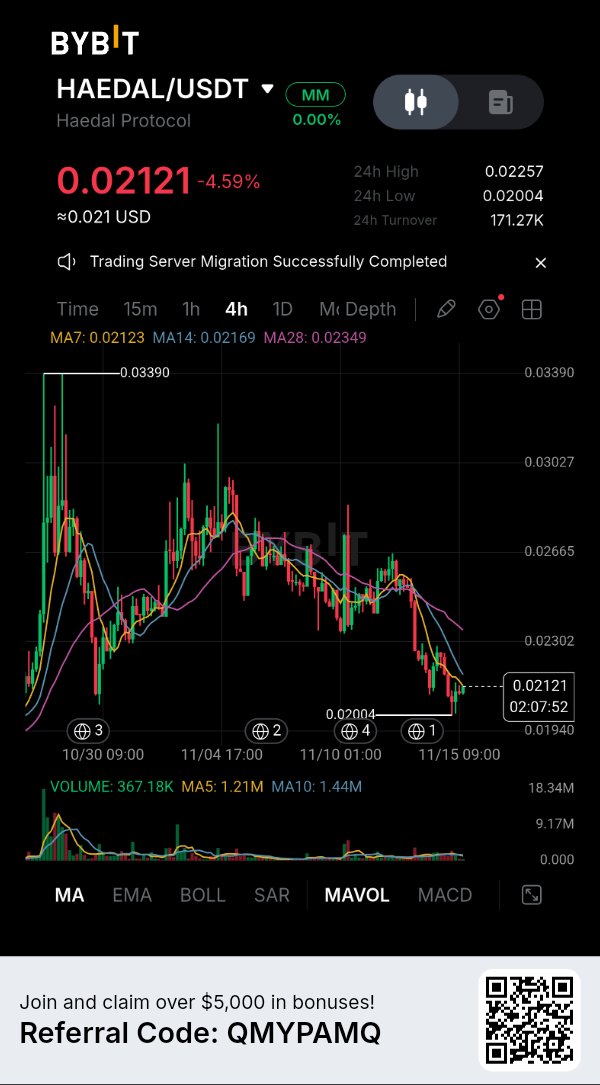
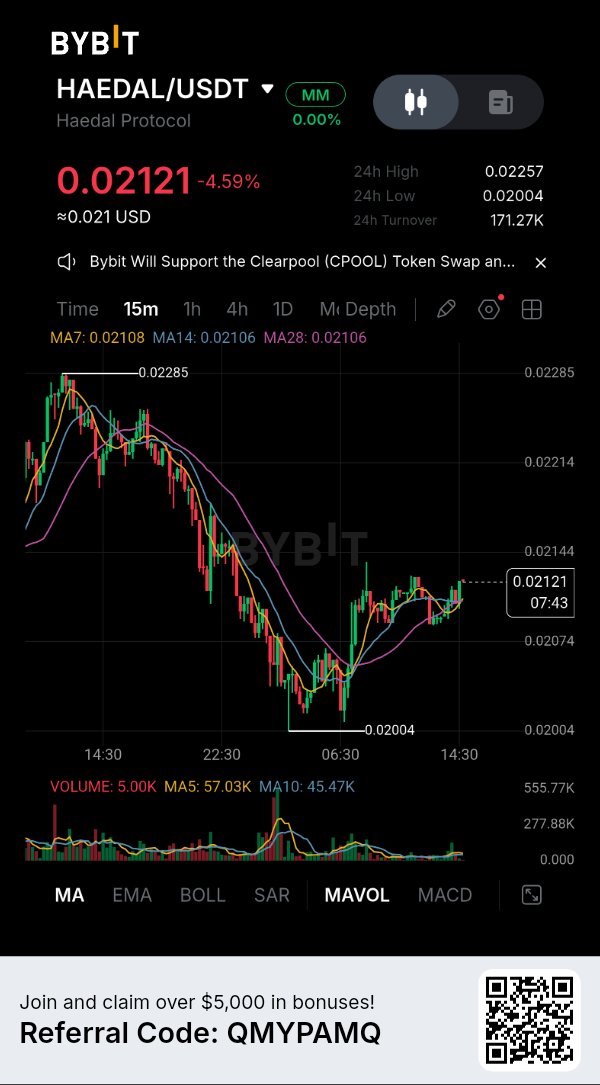
HAEDAL Is Holding Near $0.021 — But Is This Recovery Strong Enough to Reverse the Trend? Something interesting is happening with HAEDAL after its latest decline. Price dropped toward $0.02004 before buyers stepped in and pushed it back to $0.02121. That reaction shows that demand is still present around the recent lows, but I am not seeing enough confirmation to call this a bullish reversal yet. The short-term charts are beginning to stabilize, while the Daily structure remains weak. What matters now is whether buyers can turn this small recovery into a sustained move above $0.0217–$0.0235. HAEDAL/USDT: $0.02121 | Down approximately 4.59% The Daily chart is still bearish HAEDAL remains below all three Daily moving averages: - MA7: $0.02313 - MA14: $0.02517 - MA28: $0.02342 This shows that the broader trend is still under pressure. The recent decline from the spike near $0.03390 has damaged the Daily structure, and buyers have not yet reclaimed the important moving-average levels. The 4H chart shows an important support reaction The current 4H moving averages are: - MA7: $0.02123 - MA14: $0.02169 - MA28: $0.02349 Price is sitting almost exactly at the MA7, but remains below the MA14 and MA28. That makes $0.02123–$0.02169 the first resistance area to watch. A sustained recovery above this zone would improve the short-term picture. The MA28 near $0.02349 remains a bigger challenge. The recent low at $0.02004 is particularly important. Buyers reacted strongly there, but that support needs to hold if the recovery is going to develop further. Short-term momentum is improving, but volume is missing On the 15-minute chart, HAEDAL is trading around $0.02121, slightly above the displayed moving averages: - MA7: $0.02108 - MA14: $0.02106 - MA28: $0.02106 This is a positive short-term development, suggesting that the immediate selling pressure has eased. However, displayed 15-minute volume is approximately 5K, compared with MA5 volume of 57.03K and MA10 volume of 45.47K. That is a major difference. Price has stabilized, but trading participation remains weak. I would like to see stronger volume before trusting another breakout attempt. The fundamental side: Haedal's role in the Sui ecosystem HAEDAL is the governance token of Haedal Protocol, a liquid-staking project built on Sui. The protocol allows users to stake SUI and receive haSUI, a liquid-staking token that can remain active in DeFi rather than leaving the user's capital completely idle. There is real protocol activity to examine. DefiLlama currently reports approximately $25.65 million in TVL for Haedal Protocol, with around $36,733 in fees generated over the last 30 days. However, there is a caution here: the same data shows TVL declining approximately 34.9% over the past 30 days. This is worth monitoring because continued TVL contraction could indicate weaker capital participation in the ecosystem. Token supply is another factor. HAEDAL has a total supply of 1 billion tokens, with 15% allocated to investors and 20% to the team and advisors. Those allocations follow lockup and linear vesting schedules, making future circulating-supply changes important to monitor. The protocol has an established liquid-staking use case, but token demand still needs to be supported by ecosystem growth and market participation. Key levels I am watching Resistance - $0.02123: 4H MA7 - $0.02169: 4H MA14 - $0.02257: Recent 24H high - $0.02349: 4H MA28 Support - $0.02106: 15m moving-average cluster - $0.02074: Nearby chart support - $0.02004: Recent swing low - $0.01940: Lower chart support reference My trading outlook Current bias: WAIT for confirmation — short-term stabilization, broader trend still bearish. If HAEDAL reclaims $0.02169 and holds above it with stronger volume, the next challenge would be $0.02257. A successful break could bring the $0.02349 area into focus. However, if price loses $0.02106 and selling pressure returns, the $0.02074 area becomes important. A decisive break below $0.02004 would invalidate the current recovery attempt and increase downside risk. For now, I see buyers defending support, but not yet proving that they can control the larger trend. What interests you more about HAEDAL right now: the bounce from $0.02004, or the declining TVL that could make the recovery harder to sustain? $HAEDALUSDT #IMPACTbyTrade
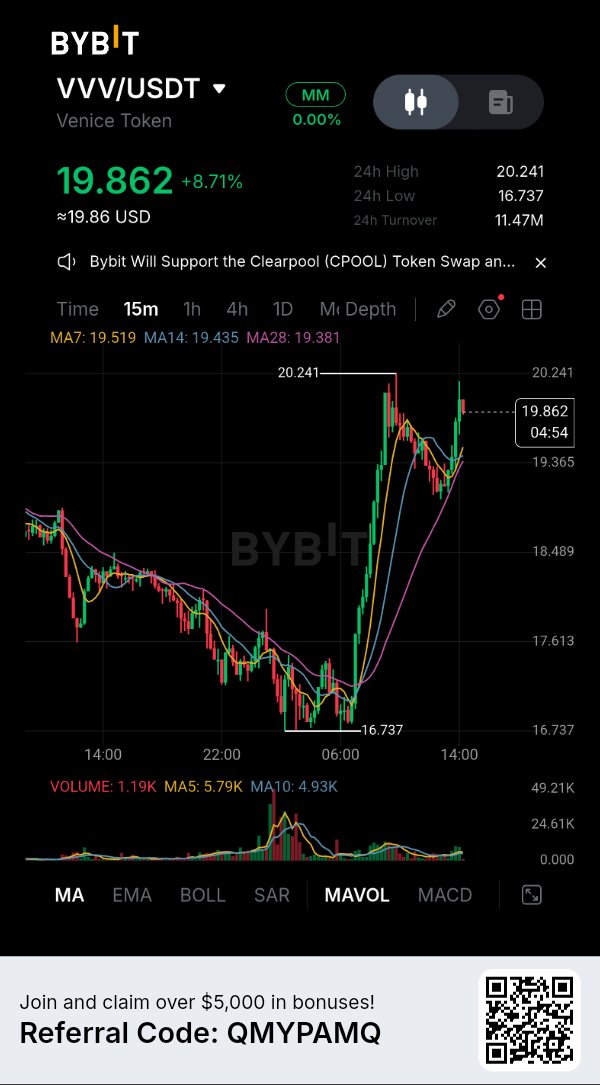
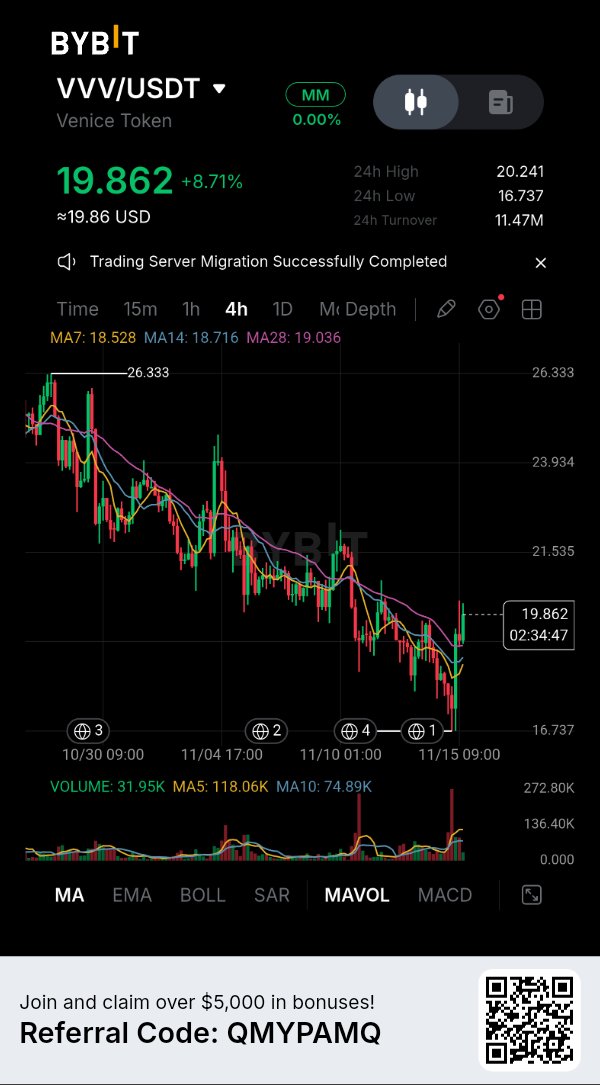
VVV Is Up Nearly 9% — But Can Buyers Turn This Bounce Into a Real Trend Reversal? The move in Venice Token is getting interesting, especially after buyers stepped in near $16.73 and pushed price back toward $20. But there is something I don't want to overlook: VVV has recovered strongly on the lower timeframes, while the Daily chart is still facing a major resistance cluster. This creates an important situation for traders. The short-term momentum is improving, but the bigger trend has not fully turned bullish yet. The next reaction around $20.24 could tell us whether this rally has enough strength to continue. VVV/USDT: $19.862 | +8.71% The Daily chart is showing early improvement VVV is now trading above its Daily MA7, but remains below the MA14 and MA28: - MA7: $19.413 - MA14: $20.280 - MA28: $22.433 This is an important distinction. Buyers have reclaimed the fastest moving average, which is a positive short-term development, but the $20.28 area is the first major Daily resistance to overcome. A sustained move above that level would improve the recovery structure. The MA28 near $22.43 remains a bigger challenge. The 4H structure has turned more constructive The 4H moving averages are now below the current price: - MA7: $18.528 - MA14: $18.716 - MA28: $19.036 This is encouraging because price has moved above the entire 4H moving-average cluster. However, the recent high at $20.241 is still acting as an immediate resistance reference. A clean breakout and successful retest would provide stronger confirmation that buyers are maintaining control. Short-term momentum is positive, but volume needs attention On the 15-minute chart, VVV is trading above all three moving averages: - MA7: $19.519 - MA14: $19.435 - MA28: $19.381 That supports the current recovery attempt. But there is one warning: the displayed 15-minute volume is approximately 1.19K, below the MA5 volume of 5.79K and MA10 volume of 4.93K. The 4H volume is also below its displayed averages. So although price momentum has improved, stronger participation is still needed to confirm another breakout. The fundamental story behind VVV Venice is not just another AI-themed token. Its ecosystem connects token ownership with actual AI compute utility. According to Venice's official documentation: - VVV can be staked to earn token emissions. - Staked VVV can be locked to mint DIEM. - Each staked DIEM provides $1 per day in Venice API credits. - Staking at least 100 VVV also provides access to Venice Pro features, subject to the platform's terms. There is also a supply-side mechanism worth watching. Venice uses part of its platform revenue to buy and burn VVV. Its August 2026 tokenomics update also confirmed that annual emissions were reduced to 2 million VVV from October 1, 2026. These mechanisms create a connection between ecosystem usage, token utility and supply reduction. However, they do not guarantee that market demand will always exceed selling pressure. Key levels I am watching Resistance - $20.241: Recent 24H high - $20.280: Daily MA14 - $22.433: Daily MA28 - $22.85: Higher chart resistance area Support - $19.519: 15m MA7 - $19.036: 4H MA28 - $18.716: 4H MA14 - $18.528: 4H MA7 - $16.737: Recent major swing low My trading outlook Current bias: BULLISH recovery, but breakout confirmation is still needed. I would like to see VVV break above $20.241–$20.280 with stronger volume and hold that area on a retest. That would provide a better case for a move toward $22.43. If price fails at resistance and slips below $19.036, the recovery could lose momentum, with $18.71–$18.52 becoming the next support zone to watch. A break below $16.737 would invalidate the current recovery structure and put the broader bearish trend back in focus. For now, VVV has shown that buyers are willing to defend the lower levels. The next challenge is proving they can sustain demand above $20. Do you think VVV can break above $20.28 and continue toward $22.43, or will sellers use this recovery to create another rejection?$VVVUSDT #IMPACTbyTrade
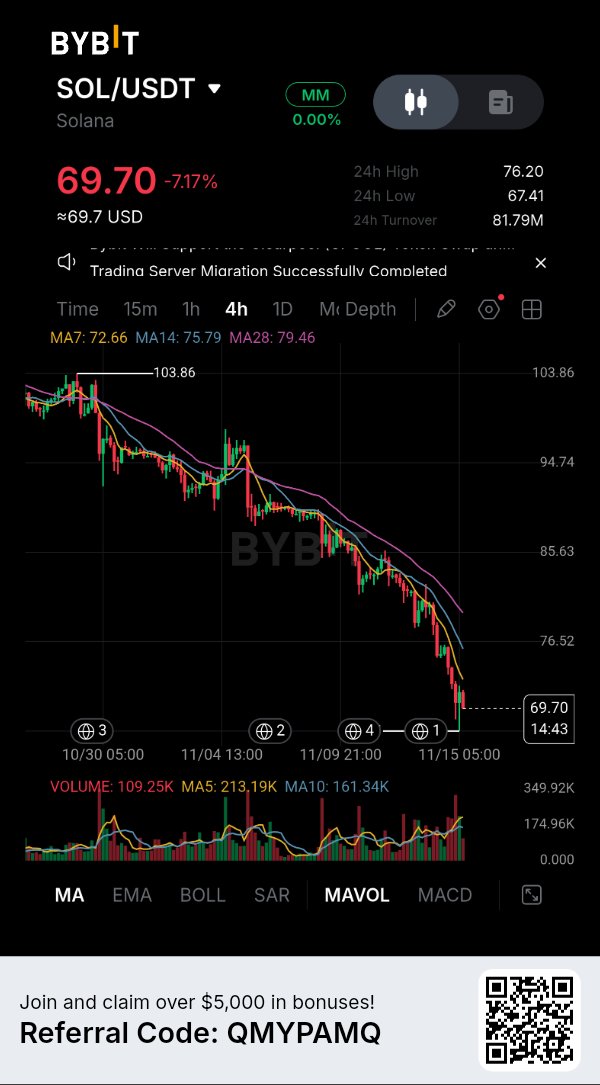
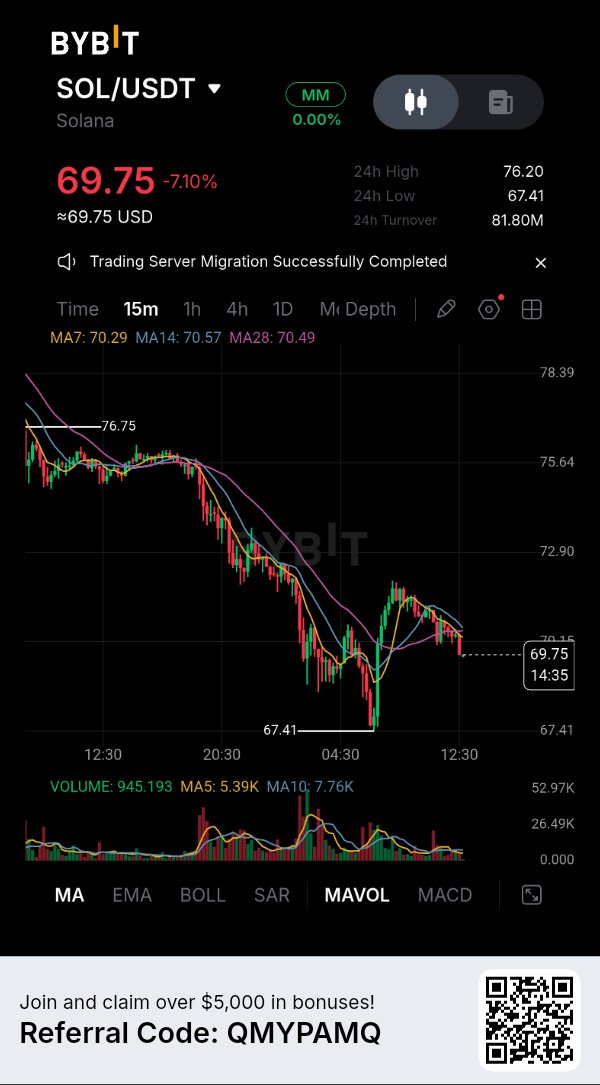
SOL Is Approaching a Critical Support Zone Can Buyers Stop the Slide? Something important is happening on Solana's chart, and the $67 area is becoming increasingly difficult to ignore. SOL has dropped sharply from its previous recovery levels and is now trading around $69.75, down more than 7% on the day. What makes this move concerning is that the Daily and 4H charts are both showing persistent selling pressure, while the latest bounce has failed to reclaim important moving averages. Buyers have defended $67.41 once, but the bigger question is whether they have enough strength to defend it again. SOL/USDT: $69.75 | Down approximately 7.10% The Daily chart is still firmly bearish Solana is trading below all three Daily moving averages: - MA7: $79.04 - MA14: $84.96 - MA28: $93.03 The gap between price and these averages shows how much the broader structure has weakened. SOL has also fallen substantially from its previous swing high near $124.96. Until buyers reclaim the Daily MA7, I would be cautious about calling this a meaningful trend reversal. The 4H chart shows sellers maintaining control The 4H moving averages are also positioned above price: - MA7: $72.66 - MA14: $75.79 - MA28: $79.46 This is a bearish alignment. SOL remains below all three averages, and the recent sequence of lower highs and lower lows suggests that sellers still control the broader 4H structure. A recovery above $72.66 would be the first improvement worth watching. Reclaiming $75.79 would provide stronger evidence that buyers are regaining control. The short-term bounce is losing momentum On the 15-minute chart, SOL recovered from $67.41 toward the $70 area, but the latest price is struggling below: - MA7: $70.29 - MA14: $70.57 - MA28: $70.49 This resistance cluster is important. If buyers cannot reclaim it, the recent rebound could lose momentum. Daily volume is also relatively weak: approximately 327K against MA5 volume of 663.41K and MA10 volume of 597.32K. The recovery needs stronger participation to become convincing. What is happening in the derivatives market? There is another reason I am watching SOL carefully. Liqwall's November 15 data showed approximately $91.5 million in SOL futures liquidations over 24 hours, with around 93% coming from long positions. Funding was negative across exchanges, while open interest was approximately $2.41 billion. CoinGlass also reported total SOL futures open interest down around 7.15% over 24 hours, suggesting leveraged positions were being unwound alongside the price decline. This points to significant pressure on leveraged buyers. However, a liquidation-driven decline can sometimes create conditions for a relief bounce, so I would not assume selling will continue in a straight line. Key levels I am watching Resistance - $70.29–$70.57: Immediate 15m moving-average cluster - $72.66: 4H MA7 - $75.79–$76.20: Major nearby resistance zone - $79.46: 4H MA28 Support - $69.00: Nearby psychological area - $67.41: Recent swing low and key support - $65.00: Potential downside reference if support breaks My trading outlook Current bias: BEARISH — but I would avoid chasing a short directly into $67.41 support. If SOL fails to reclaim $70.57 and loses momentum again, another test of $67.41 becomes possible. A decisive break below $67.41 could expose the $65 area, although I would want to see confirmation rather than assume an immediate continuation. On the other hand, a sustained recovery above $72.66 would be the first meaningful improvement. A reclaim of $75.79 would make me reassess the bearish setup more seriously. For now, the higher timeframes favor sellers, but the recent liquidation pressure means a sharp countertrend bounce remains possible. What is your view on SOL right now: will buyers defend $67.41 and attempt a recovery toward $75, or are we preparing for another breakdown below support? $SOLUSDT #IMPACTbyTrade
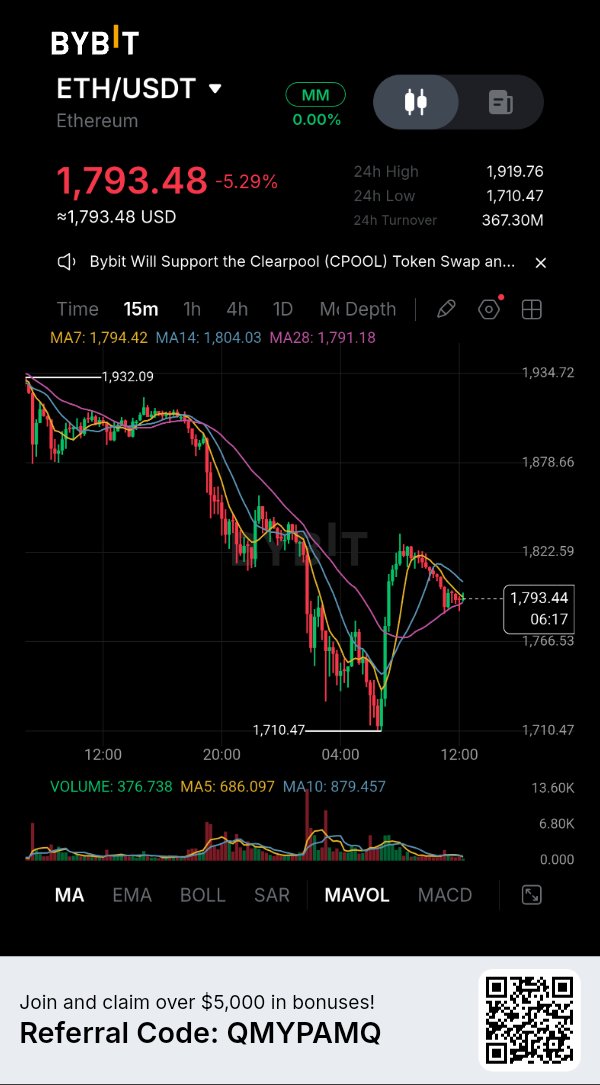
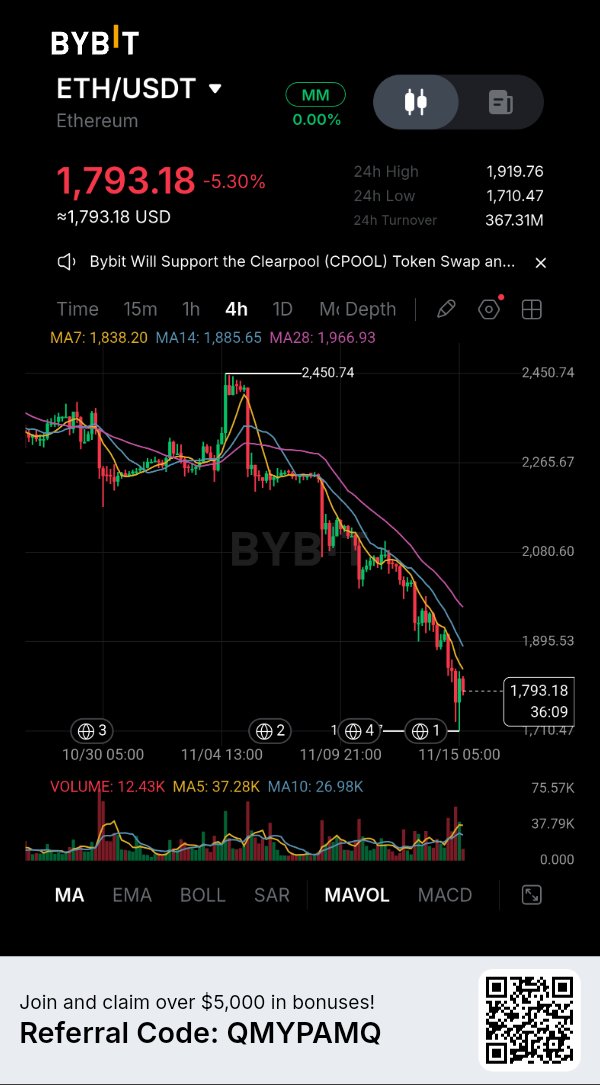
ETH Has Bounced From $1,710, But Buyers Still Have a Major Battle Ahead The latest ETH move is a reminder of how quickly market sentiment can change. Ethereum has fallen below $1,800 after losing the $2,000 area, and the rebound from $1,710 has brought some buyers back into the market. But looking at the Daily and 4H structures, I still see sellers controlling the broader trend. The short-term bounce is worth watching, yet the real question is whether buyers can reclaim important resistance levels or whether this recovery will become another opportunity for sellers. ETH/USDT: $1,792.76 | Down approximately 5.47% The Daily chart remains under heavy pressure Ethereum is trading below all three Daily moving averages: - MA7: $1,965.25 - MA14: $2,110.99 - MA28: $2,229.07 This alignment reflects a weak higher-timeframe structure. ETH has also fallen significantly from its previous swing high near $2,807.60. Until price starts reclaiming these moving averages, I would be cautious about calling this a sustained recovery. The 4H structure shows sellers still have control The 4H moving averages are: - MA7: $1,838.20 - MA14: $1,885.65 - MA28: $1,966.93 Price remains below all three. The first important recovery test is around $1,838, followed by the $1,885–$1,967 resistance region. A rejection around these levels could bring selling pressure back. A sustained reclaim, supported by stronger volume, would provide a more constructive signal. The short-term bounce needs confirmation On the 15-minute chart, ETH rebounded from $1,710.47 and recovered toward $1,793. However, price is still struggling around the short-term moving averages: - MA7: $1,794.42 - MA14: $1,804.03 - MA28: $1,791.18 The recovery has not yet established a convincing short-term breakout. Buyers need to hold the reclaimed area and build momentum above $1,804. What is happening beyond the chart? There are several reasons why the current market remains under pressure. Recent market reporting points to heavy leveraged liquidations across crypto, with ETH experiencing substantial long-position liquidations. This suggests forced selling has contributed to the sharp decline rather than the move being driven by ordinary spot selling alone. Spot Ethereum ETFs have also experienced significant November outflows. CoinStats reported approximately $695.9 million in net outflows through November 11, adding another source of pressure on market sentiment. There is a contrasting longer-term development, though: Ethereum staking reportedly reached approximately 44.6 million ETH, around 36.5% of supply. That shows substantial participation in network staking, but it does not guarantee immediate buying pressure. Sources: CoinStats, November 15; Ethereum Institutional, November 5. Key levels I am watching Resistance - $1,804: Immediate 15m MA14 - $1,838: 4H MA7 - $1,885–$1,895: 4H MA14 and nearby chart resistance - $1,967: 4H MA28 and Daily MA7 Support - $1,791: Nearby 15m MA28 - $1,766: Short-term chart support - $1,710: Recent swing low - $1,700: Psychological support area My trading outlook Current bias: BEARISH, but I would avoid chasing a short directly into support. A recovery above $1,804 followed by a sustained reclaim of $1,838 could improve the short-term picture. If ETH gets rejected around $1,838–$1,885 and loses $1,766, sellers could attempt another move toward $1,710. A decisive break below $1,710 would expose the market to further downside, while a stronger recovery above $1,967 would force me to reassess the bearish outlook. For now, I see a relief bounce inside a broader downtrend, not a confirmed reversal. I want buyers to prove their strength before changing that view. What are you watching more closely: ETH reclaiming $1,850 and recovering toward $1,967, or another rejection that sends price back toward $1,710? $ETHUSDT #ByXIMPACT
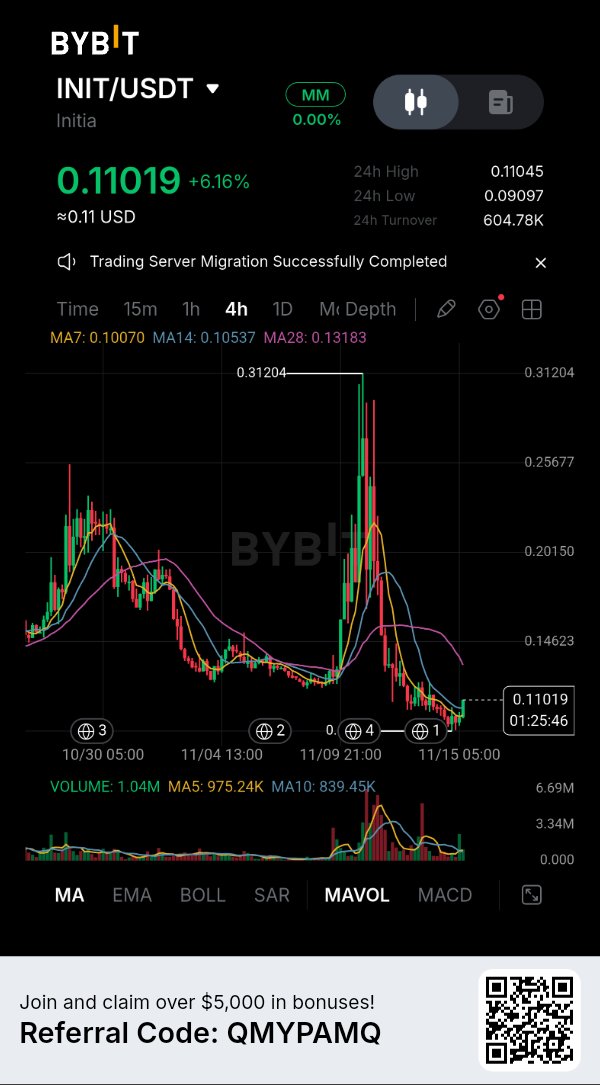
INIT Is Rebounding, But a Major Security Question Still Hangs Over the Recovery There is something unusual about INIT's current price action. After spending days under heavy selling pressure, the token has started climbing again and is now trading around $0.11019, up more than 6% on the day. Buyers are clearly trying to defend the recent lows, but I would be careful about calling this a confirmed reversal. The chart is improving in the short term, while the bigger structure remains damaged. And there is another factor traders cannot afford to overlook: Initia's recent security incident and the uncertainty surrounding its network recovery. INIT/USDT: $0.11019 | +6.16% The 4H chart shows an early recovery, not a confirmed trend reversal INIT has moved back above its 4H moving averages: - MA7: $0.10070 - MA14: $0.10537 - MA28: $0.13183 This is an encouraging short-term development. Buyers have reclaimed the faster averages, but the MA28 remains significantly above price. That means the broader recovery still faces resistance. The chart also shows how sharply INIT fell after its previous spike toward $0.31204. Until price starts forming stronger higher highs and higher lows, I would treat this as an early recovery attempt rather than a complete trend change. Volume is improving, but participation needs to continue The displayed 4H volume is around 1.04M, compared with MA5 volume of 975.24K and MA10 volume of 839.45K. That suggests recent activity has picked up modestly. However, one stronger volume reading is not enough to confirm sustained accumulation. I want to see buyers continue supporting the move during the next resistance test. The fundamental situation is the biggest issue Initia has faced two serious security incidents within a short period. Following the October 23 incident, the team announced that the network and rollups had resumed operations on November 2 after security measures and recovery work. However, another incident emerged on November 9–10. According to Initia's November 10 update, compromised infrastructure credentials enabled an attacker to validate fraudulent IBC withdrawals from five rollups. The team reported approximately $3.27M in assets moved, with around $2.16M remaining on the halted L1. One important distinction: Initia stated that no INIT tokens were withdrawn by the attacker. The team said it intends to restore the backing of affected assets and is rebuilding infrastructure in an isolated environment. It also warned that the process would take longer than a routine network restart. This matters because a token can bounce on an exchange chart even while important parts of its underlying ecosystem remain under recovery. Key levels I am watching Resistance - $0.11045: Recent 24H high - $0.13183: 4H MA28 - $0.14623: Higher chart resistance area Support - $0.10537: 4H MA14 - $0.10070: 4H MA7 - $0.09097: Recent 24H low area My trading outlook Current bias: WAIT — short-term recovery, but significant fundamental risk remains. A sustained move above $0.11045 would be the first sign that buyers are extending the rebound. The next major technical challenge is the 4H MA28 near $0.13183. If price loses $0.10537 and then $0.10070, the recovery could start weakening. A break below $0.09097 would put the recent low area back under pressure. But I would not treat a technical breakout as sufficient confirmation while the network recovery situation remains unresolved. I want clear official updates on network operations, asset backing and security before considering a more confident bullish view. For now, the chart deserves attention, but capital protection comes first. What do you think matters more for INIT right now: the technical recovery above $0.11, or the team's ability to restore confidence after the security incidents? $INITUSDT #ByXIMPACT
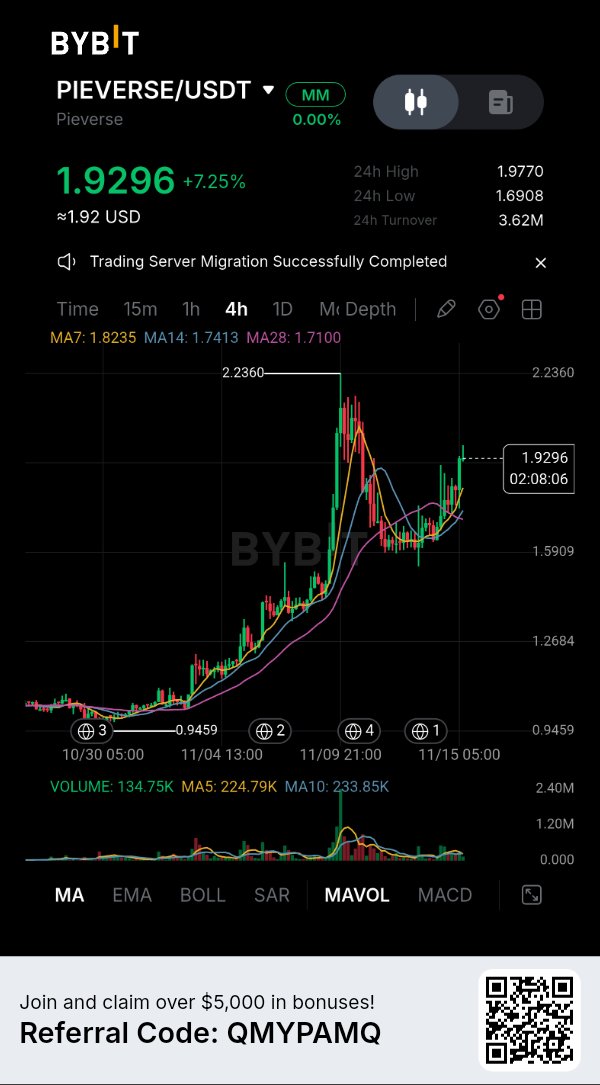
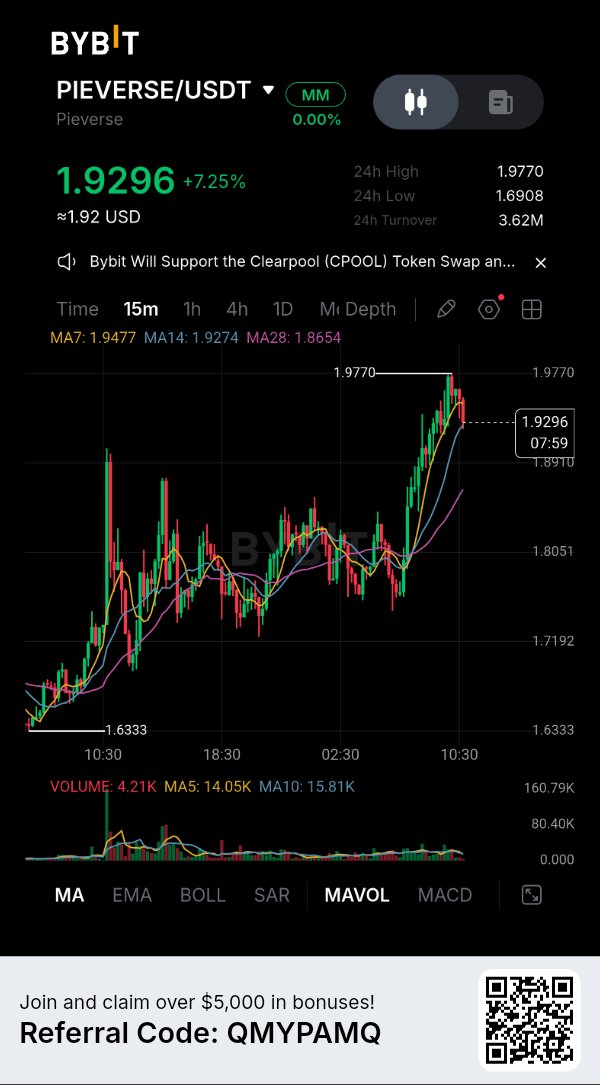
PIEVERSE Buyers Are Strong, But Is the Rally Running Out of Steam? I've been following PIEVERSE's latest move, and the chart is showing an interesting shift. After recovering strongly from the $1.69 area, price has climbed toward $1.98, bringing buyers back into control of the short-term structure. But I don't want to judge this rally by price alone. Volume is cooling across the timeframes, and the token is approaching a resistance area where the next move could decide whether this recovery continues or turns into profit-taking. PIEVERSE/USDT: $1.9296 | +7.25% The higher-timeframe structure is bullish The Daily chart shows a strong recovery from the recent base near $1.03, with price now trading above all three moving averages: - MA7: $1.7867 - MA14: $1.5311 - MA28: $1.2847 The 4H structure is also constructive: - MA7: $1.8235 - MA14: $1.7413 - MA28: $1.7100 Price remains above these averages, suggesting buyers still have control of the broader recovery. However, the previous 4H swing high near $2.2360 remains an important reference point. The short-term warning I am watching On the 15-minute chart, PIEVERSE is trading around $1.9296, slightly below the MA7 at $1.9477, while holding near the MA14 at $1.9274 and above the MA28 at $1.8654. That tells me short-term momentum has cooled after the recent push toward $1.9770. There is another detail worth watching: volume on the 15m, 4H and Daily charts is currently below the displayed MA5 and MA10 volume averages. The rally has been impressive, but buyers need stronger participation to confirm another breakout. Fundamental factor: Token supply matters PIEVERSE has a scheduled vesting and token-unlock transition around November 14. Tokenomics tracking identifies a release event on that date, while Coinranking reports that team, advisor and investor allocations begin linear vesting after their lockup period. This does not mean those tokens are automatically being sold. However, additional available supply can create an overhang, especially after a sharp rally. I would watch how the market absorbs this supply rather than assume it will cause an immediate decline. Key levels on my watchlist Resistance - $1.9477: Immediate 15m MA7 - $1.9770: Recent intraday high - $2.10: Potential upside area if breakout momentum builds - $2.2360: Previous major swing high Support - $1.9274: Immediate 15m MA14 - $1.8654: 15m MA28 - $1.8235: 4H MA7 - $1.7100–$1.6908: Deeper support zone My trading outlook Bias: WAIT for breakout confirmation — broader structure remains bullish. I would not chase PIEVERSE immediately after a 7% move. A convincing break above $1.9770, supported by stronger volume and a successful retest, could open the way toward $2.10 and potentially $2.2360. On the other hand, losing $1.8654 could weaken the short-term structure and bring $1.8235 into focus. A deeper move below $1.7100 would make me reassess the broader recovery. What matters most now is confirmation, not excitement. The trend is constructive, but the next breakout needs participation from buyers. Are you watching PIEVERSE for a clean breakout above $1.9770, or do you think the cooling volume is warning of a deeper pullback first? $PIEVERSEUSDT #IMPACTbyTrade
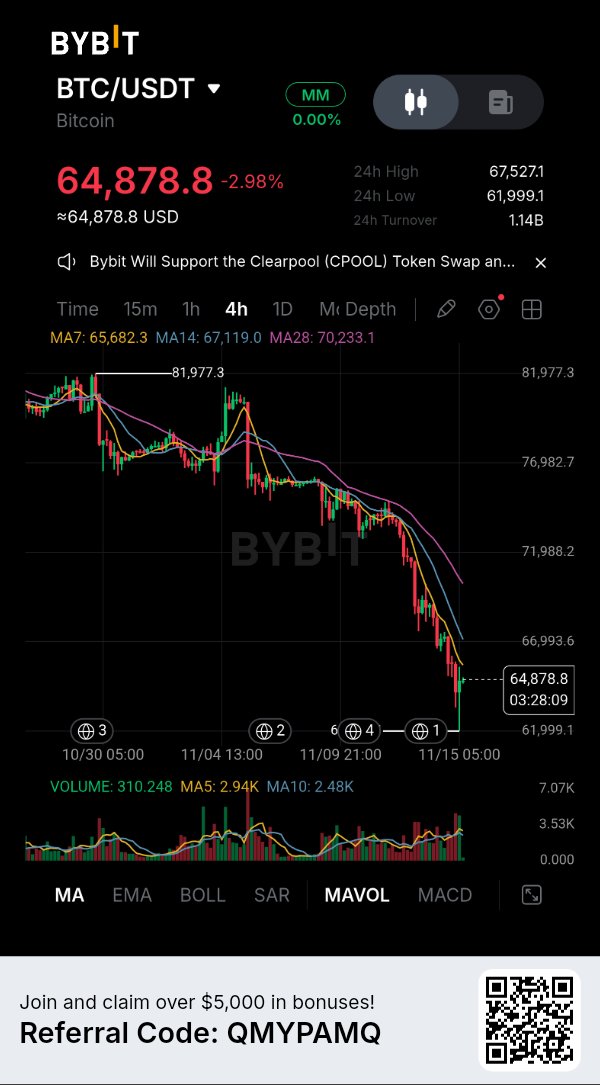
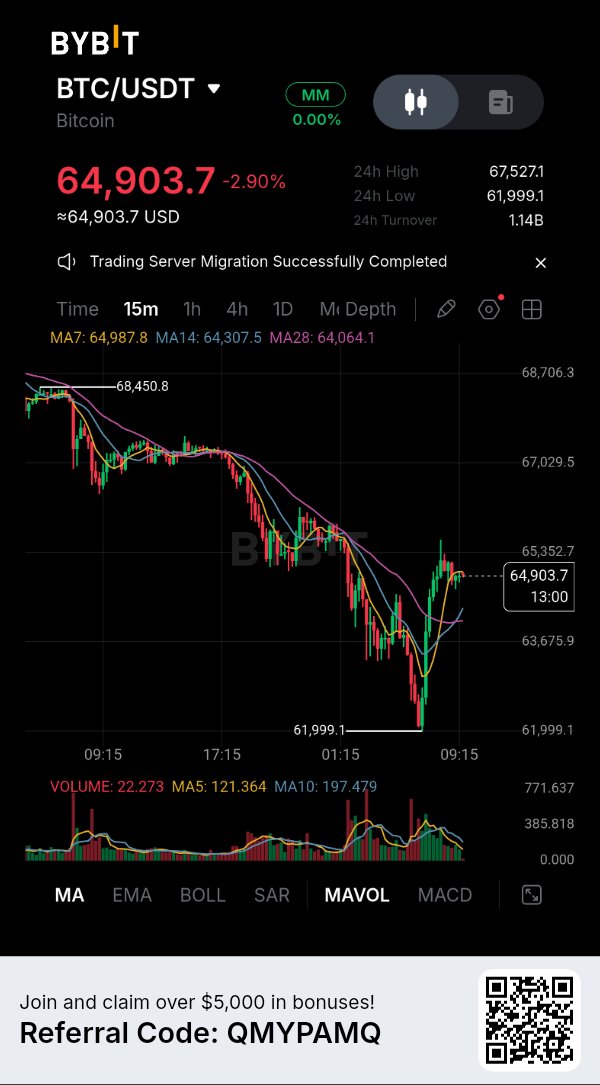
BTC Is Bouncing, But Has the Market Actually Reversed? Bitcoin has recovered from $61,999, but I’m not convinced this is a genuine trend reversal yet. The important question is not how sharply BTC bounced — it is whether buyers can reclaim the levels that sellers have been defending. BTC is trading around $64,865, down approximately 2.96%. The recent 24-hour range is $61,999–$67,527, showing just how aggressive the selling pressure has been. The higher-timeframe structure is still bearish. On the daily chart, BTC is trading below all three moving averages: - MA7: $70,281 - MA14: $73,528 - MA28: $76,987 This alignment reflects sustained downside pressure. The 4H chart tells a similar story: price remains below the MA7 at $65,682, MA14 at $67,119 and MA28 at $70,233. That is why I’m treating the current recovery cautiously. But there is one detail bears should not ignore. On the 15-minute chart, BTC has bounced strongly from $61,999 and recovered above the MA14 ($64,307) and MA28 ($64,064). Short-term buyers have stepped in, although price is still struggling around the MA7 near $64,987. This creates an important difference between short-term momentum and the broader trend. A recovery on the 15-minute chart does not automatically reverse the bearish 4H and daily structure. What is happening beyond the chart? The recent selloff has also been accompanied by heavy derivatives liquidations. CoinDesk reported approximately $1.64 billion in crypto liquidations over 24 hours on November 13, with around 88.6% coming from long positions. That suggests leveraged bullish traders were heavily squeezed. Coinbase Institutional also highlighted the $65K–$68K supply area and the importance of reclaiming the former $73K–$75K zone for a stronger recovery scenario. Sources: CoinDesk, November 13; Coinbase Institutional, November 13. My BTC trading outlook Current bias: BEARISH, but I would not chase a short directly into support after such a sharp decline. Resistance to watch: - $65,682 — immediate 4H MA7 - $67,119–$67,527 — important recovery and rejection zone - $70,233 — 4H MA28 Support to watch: - $64,000 — nearby short-term decision area - $61,999 — recent swing low - $60,000 — next psychological downside area Potential trade approach: I would prefer to see BTC attempt a recovery toward $65,682–$67,119 and then show a clear rejection before considering a short. A failed recovery would strengthen the bearish setup. If sellers push price below $61,999 with convincing follow-through, the $60,000 region becomes an important next downside area. However, if BTC reclaims $67,527 and holds above it, the immediate bearish setup needs reassessment. A stronger recovery above $70,233 would weaken the short-term bearish case further. The key point: BTC has bounced, but the higher timeframes have not confirmed a reversal. I want to see buyers reclaim resistance before calling this a recovery. Do you think this is the beginning of a genuine BTC reversal, or just a relief bounce before sellers attempt another move lower?$BTCUSDT #ByXIMPACT
STRK is facing another serious test, and the latest price action suggests that sellers are still controlling the broader trend. But after a decline of more than 10%, is there enough downside momentum left, or could buyers trigger a short-term recovery? STRK is trading around $0.03337 on Bybit, down approximately 10.01%. The displayed 24-hour high is $0.03713, the low is $0.03199, and turnover stands at approximately $3.59M. 1. Market Structure: Sellers Remain in Control The 4H chart shows a persistent sequence of lower highs and lower lows. STRK has declined from the $0.04840 region toward $0.03199, with selling pressure accelerating during the latest breakdown. The current bounce toward $0.03337 has not yet changed the broader bearish structure. 2. Moving Average Analysis 4H moving averages: - MA7: $0.03466 - MA14: $0.03590 - MA28: $0.03664 Price remains below all three moving averages. Their bearish alignment confirms that sellers still have the advantage. 15-minute moving averages: - MA7: $0.03307 - MA14: $0.03297 - MA28: $0.03298 The shorter timeframe shows a small recovery, with price above these averages. However, this looks more like a relief bounce than a confirmed reversal. Daily moving averages: - MA7: $0.03632 - MA14: $0.03841 - MA28: $0.04356 The daily structure is particularly weak, with price trading significantly below all three averages. 3. Important Support and Resistance Levels Immediate resistance: $0.03486 Next resistance: $0.03629–$0.03664 Major resistance: $0.03713 Stronger resistance: $0.04087 Immediate support: $0.03199 A confirmed breakdown below $0.03199 could expose further downside. On the other hand, reclaiming $0.03486 would be the first sign of improving short-term momentum. 4. Volume Analysis: Selling Pressure Needs Monitoring 4H volume: 5.55M MA5: 18.92M MA10: 12.44M Current volume is below both averages, despite the sharp price decline. This suggests that the latest selling activity needs further confirmation rather than assuming another immediate breakdown. A fresh increase in red volume alongside a loss of $0.03199 would strengthen the bearish case. 5. Fundamental Analysis: Starknet's Latest Developments Starknet is an Ethereum Layer-2 network focused on scalability using STARK-based validity proofs. There are some important developments worth watching: - On November 11, StarkWare introduced block-sized proofs on Starknet Mainnet, supporting proofs covering up to 1.1 billion L2 gas. - Starknet v0.14.3 introduced BLAKE2s-256 hashing as part of its post-quantum security improvements. - Falcon signature verification improvements are another important step toward strengthening the network's post-quantum security infrastructure. These developments support Starknet's long-term technology narrative, but stronger network technology does not automatically translate into immediate STRK price appreciation. 6. Token Unlock: A Major Near-Term Risk One important event is scheduled for November 15, 2026. Approximately 127 million STRK tokens are scheduled to unlock, representing around 1.27% of the initial 10 billion supply. The scheduled allocation includes approximately: - 66.6M STRK for early contributors. - 60.4M STRK for investors. At the current market price, this represents several million dollars of potential additional supply. An unlock does not mean every recipient will sell, but it increases the importance of monitoring liquidity and selling pressure. 7. Broader Market Perspective STRK is facing both technical weakness and a near-term supply event. This combination makes it important to avoid assuming that a temporary bounce means the downtrend is over. Buyers need to demonstrate stronger demand before the broader outlook can improve. 8. My Trading Decision: SHORT BIAS, WAIT FOR CONFIRMATION I currently favor a bearish setup, but I would avoid chasing the existing decline. Bearish scenario: A confirmed breakdown below $0.03199 with increasing selling volume could provide another SHORT opportunity. Recovery scenario: A sustained move above $0.03486 could trigger a relief rally toward $0.03629–$0.03713. For now, the daily and 4H trends favor sellers. However, the short-term bounce and upcoming token unlock make risk management particularly important. The key question: Will STRK lose $0.03199 and continue its bearish trend, or can buyers reclaim $0.03486 before sellers take another shot? $STRKUSDT #ByXIMPACT
MX is showing signs of stabilization after a sharp selloff, but the current price action raises an important question: are buyers quietly building a recovery, or is this simply a pause before another move lower? MX is trading around $1.412 on Bybit, up approximately 0.07%. The displayed 24-hour high is $1.413, the low is $1.409, and turnover stands at approximately $11.13K. 1. Market Structure: A Downtrend Looking for Stability The 4-hour chart shows a significant decline from the $1.627 region toward the $1.401 low. Selling pressure accelerated during the breakdown, accompanied by a noticeable volume spike. Since then, price has entered a narrow consolidation range around $1.41. This is an important development, but sideways movement alone does not confirm a bullish reversal. 2. Moving Average Analysis Current 4H moving averages: - MA7: $1.411 - MA14: $1.411 - MA28: $1.413 Price is slightly above MA7 and MA14 but remains below MA28. The three averages are tightly grouped, indicating compression and a potential decision point. A sustained move above MA28 could improve short-term momentum. However, rejection around this area would keep sellers in control. 3. Important Support and Resistance Levels Immediate resistance: $1.413 Next resistance: $1.457 Major resistance: $1.514 Stronger resistance: $1.570 Immediate support: $1.409 Key support: $1.401 A confirmed breakout above $1.413 could open the way toward $1.457. On the downside, losing $1.409 could bring another test of $1.401. A breakdown below that level would weaken the recovery setup further. 4. Volume Analysis: Is Accumulation Happening? Current displayed volume: 1.27K MA5: 1.25K MA10: 1.85K Volume is close to its short-term average but remains below MA10. The earlier selloff produced a much larger volume expansion. Current activity is considerably quieter, suggesting that neither buyers nor sellers have established decisive control. I would like to see stronger green volume accompanying a breakout before considering a bullish entry. 5. Fundamental Analysis: What Gives MX Its Value? MX is the native ecosystem token of MEXC, and its utility extends beyond simple exchange speculation. Its ecosystem includes: - Kickstarter events and potential project-token airdrops. - Launchpool participation and staking opportunities. - Launchpad subscriptions using MX and other supported assets. - Trading fee deductions using MX. An important development came on February 4, 2026, when MEXC announced changes to its fee-discount structure. The previous 50% holder discount was temporarily suspended, while the 20% discount through MX fee deductions remained available for eligible trades. Another important tokenomics development is MEXC's MX Token 2.0 framework. The exchange previously reported completing its 100-million circulating-supply milestone and shifting greater attention toward ecosystem development and practical token utility. MEXC's buyback-and-burn mechanism also remains part of its tokenomics framework, with the exchange's FAQ describing a quarterly allocation of 40% of platform profits. These developments support the long-term utility narrative, but they do not guarantee immediate buying pressure. 6. Broader Market Considerations MX is closely connected to MEXC's exchange activity, ecosystem growth and user demand. Exchange-token performance can be affected by trading activity, competition between exchanges, token supply dynamics and broader crypto-market sentiment. Therefore, I would not evaluate MX using its chart alone. 7. My Trading Decision: WAIT I am not seeing enough confirmation to justify chasing a LONG at $1.412. Bullish scenario: A strong 4H close above $1.413, supported by increasing volume, could provide an initial recovery signal toward $1.457. Bearish scenario: Failure to reclaim $1.413 followed by a breakdown below $1.409 could bring $1.401 back into focus. For now, WAIT offers a better risk-management approach than entering without confirmation. The key level I am watching is $1.413. If buyers reclaim it with genuine volume, the recovery picture could change. What is your view on MX? Is this consolidation the beginning of a recovery, or are sellers preparing another move toward $1.401? $MXUSDT #IMPACTbyTrade
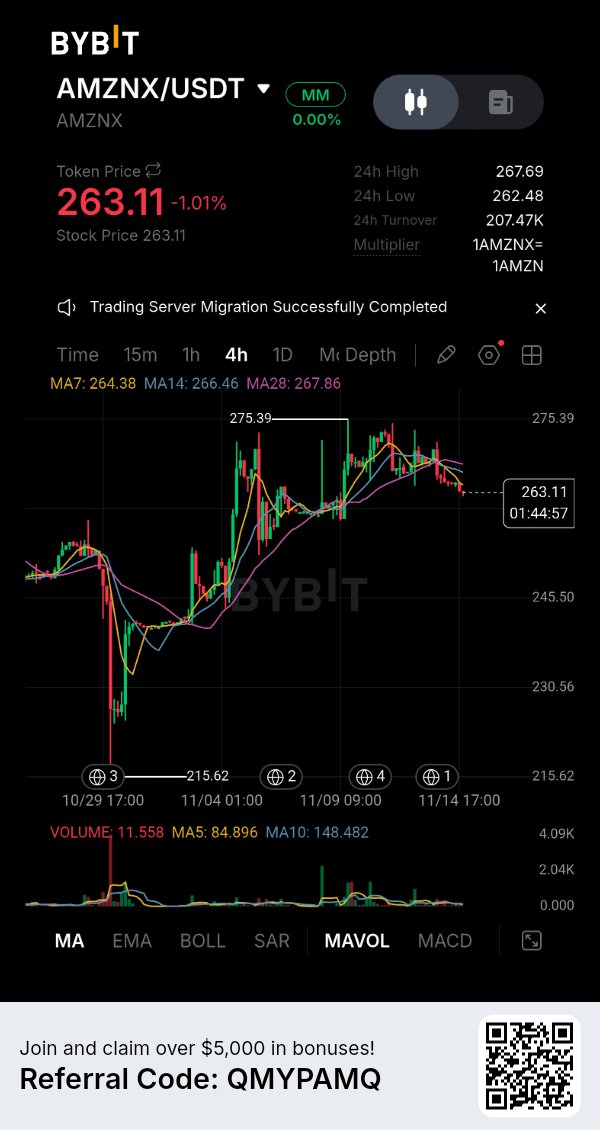
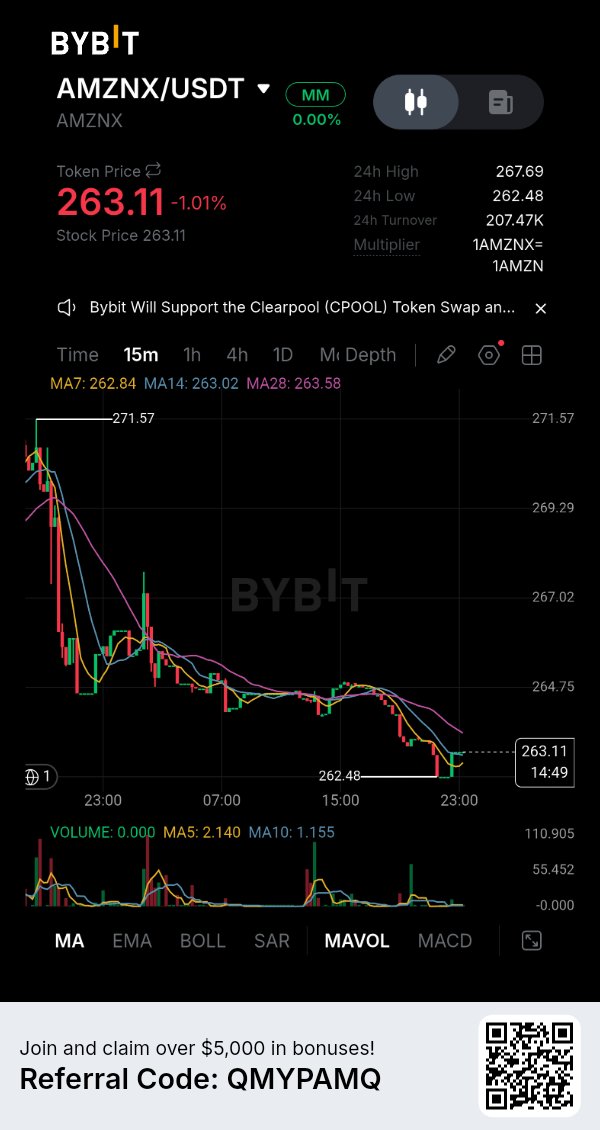
AMZNX is showing an interesting battle between buyers and sellers, but the latest pullback raises an important question: is this just a healthy correction, or are sellers preparing for another leg lower? AMZNX is trading around $263.11 on Bybit, down approximately 1.01%. The displayed 24-hour high is $267.69, while the low stands at $262.48, with turnover around $207.47K. Since AMZNX represents tokenized exposure to Amazon stock, its price action should also be evaluated alongside the underlying NASDAQ-listed AMZN shares. 4H Technical Analysis: Short-Term Momentum Is Weakening The 4-hour chart shows that AMZNX previously recovered strongly from the $215.62 region and climbed toward $275.39. However, buyers have struggled to maintain momentum near the recent highs. Current moving averages: MA7: $264.38 MA14: $266.46 MA28: $267.86 Price is trading below all three moving averages. This suggests sellers currently have the short-term advantage. The MA7 is also below MA14 and MA28, creating a bearish short-term alignment. 15-Minute Chart: A Small Recovery Attempt The shorter timeframe shows an attempt to stabilize around $262.48. Moving averages: MA7: $262.84 MA14: $263.02 MA28: $263.58 Price has recovered slightly from the intraday low, but remains below MA28. This is not yet enough to confirm a bullish reversal. Daily Structure: The Bigger Picture The daily chart provides a more mixed picture. MA7: $266.58 MA14: $260.50 MA28: $255.39 Although the current price is below MA7, it remains above MA14 and MA28. This means the broader recovery structure has not completely broken down, even though short-term selling pressure is increasing. Important Support and Resistance Levels Immediate resistance: $264.38 Next resistance: $266.46–$267.69 Major resistance: $275.39 Immediate support: $262.48 Next support: $260.50 Stronger support: $255.39 Major support: $245.50 A sustained move above $267.69 with strong volume could improve the bullish outlook and bring $275.39 back into focus. However, losing $262.48 could expose the $260.50 and $255.39 support zones. Volume Analysis: Buyers Need to Prove Themselves The displayed 4H volume is approximately 11.558, compared with MA5 at 84.896 and MA10 at 148.482. Participation appears relatively weak compared with the displayed volume averages. Without stronger buying activity, a recovery toward resistance may struggle to continue. Fundamental Perspective: Amazon's Business Developments AMZNX tracks Amazon's underlying stock performance, so developments affecting Amazon can influence its market direction. One notable recent development is Amazon's reported 600-megawatt computing power agreement with Fermi for a Texas data-center project. This highlights Amazon's continued investment in AI and cloud infrastructure, although the project also involves execution and financing considerations. Amazon shares closed at $266.66 on November 13, down approximately 0.29% during the session. My Trading Outlook: WAIT I would not chase a LONG while AMZNX remains below its short-term moving averages. A convincing breakout above $267.69 with increasing volume would provide a better bullish confirmation. On the other hand, a breakdown below $262.48 could create another bearish opportunity toward $260.50 and potentially $255.39. The key is to let price confirm its direction rather than predicting a reversal too early. What would you prefer here: a LONG after a confirmed $267.69 breakout, or a SHORT if $262.48 support fails? $AMZNXUSDT #WSOT2026
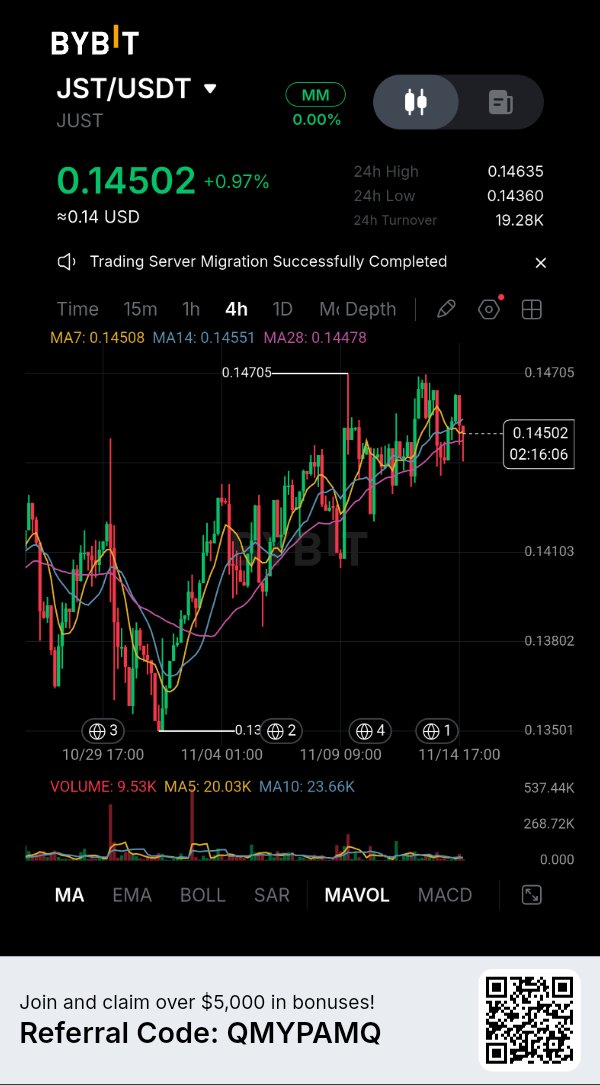
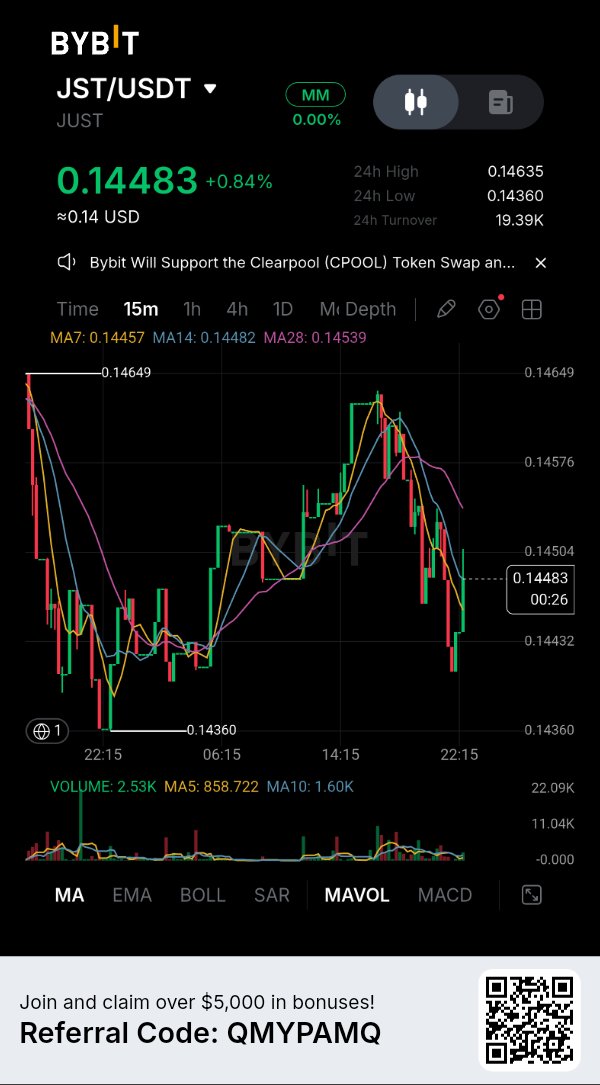
JST is holding near the upper end of its recent trading range, but there is an important difference between a healthy consolidation and a breakout that is running out of momentum. JUST (JST) is trading around $0.14483 on Bybit, up approximately 0.84%. The 24-hour high stands at $0.14635, while the low is $0.14360. The key question is whether buyers can finally push through resistance and establish a stronger upward move. Daily Structure: Bulls Still Have an Advantage The daily chart shows a significant recovery from the lower price region, followed by consolidation near recent highs. Moving averages: MA7: $0.14456 MA14: $0.14286 MA28: $0.14115 Price is holding above all three moving averages, with bullish alignment. This keeps the broader technical structure constructive. The immediate challenge is the $0.14635–$0.14705 resistance zone. A daily breakout above this area could strengthen the bullish outlook. 4H Chart: Momentum Needs Confirmation Current 4H moving averages: MA7: $0.14508 MA14: $0.14551 MA28: $0.14478 The current price is hovering around these averages. This suggests consolidation rather than a clearly established short-term trend. Buyers need to reclaim $0.14551 and defend the $0.14478 area to improve the structure. 15-Minute Chart: A Critical Short-Term Battle 15-minute moving averages: MA7: $0.14457 MA14: $0.14482 MA28: $0.14539 Price recently dropped toward $0.14360 before attempting a recovery. The latest bounce is encouraging, but the MA28 near $0.14539 remains an important hurdle. A sustained move above $0.14539 could bring $0.14635 and $0.14649 into focus. Volume Analysis: Participation Is Still Weak 15-minute volume: 2.53K MA5: 858.72 MA10: 1.60K 4H volume: 9.53K MA5: 20.03K MA10: 23.66K Daily volume: 100.90K MA5: 185.09K MA10: 234.27K The latest 4H and daily volume readings remain below their respective averages. Buyers need stronger participation to confirm a breakout rather than relying on price movement alone. Fundamental Perspective: JUST Buyback and Burn JST is the governance token of JUST DAO, operating on the TRON network. Its utility includes governance participation and decisions concerning protocol parameters and ecosystem development. One important fundamental development is its revenue-funded buyback and burn mechanism. According to the official JustLend documentation, protocol and eligible ecosystem revenues are used to repurchase JST and permanently remove tokens from circulation. A November 5 TRON-commissioned report stated that five buyback-and-burn rounds had removed approximately 1.881 billion JST, representing more than 19% of the original maximum supply. This creates an interesting long-term supply narrative, although token burns do not guarantee immediate price appreciation. There are no further scheduled vesting unlocks according to the available token unlock schedule, another factor worth monitoring alongside actual circulating supply. Important Price Levels Resistance: $0.14539 – Short-term MA28 $0.14635 – 24H high $0.14649 – Recent chart resistance $0.14705 – Daily chart high $0.15000 – Potential psychological target Support: $0.14456 – Daily MA7 $0.14360 – 24H low $0.14286 – Daily MA14 $0.14115 – Daily MA28 My Trading Outlook: WAIT FOR CONFIRMATION JST has a constructive daily structure, but the short-term chart still needs stronger buying pressure. A sustained breakout above $0.14649 with expanding volume would make a LONG setup more attractive. If price loses $0.14360, a deeper pullback toward $0.14286 becomes possible. I would rather wait for confirmation than chase a breakout that hasn't proved itself. JST has an interesting combination of improving technical structure and a revenue-backed buyback mechanism, but the next move still depends on actual market demand. Would you take a LONG after a confirmed $0.14649 breakout, or wait for a retest of $0.14360 before entering? $JSTUSDT #ByXIMPACT
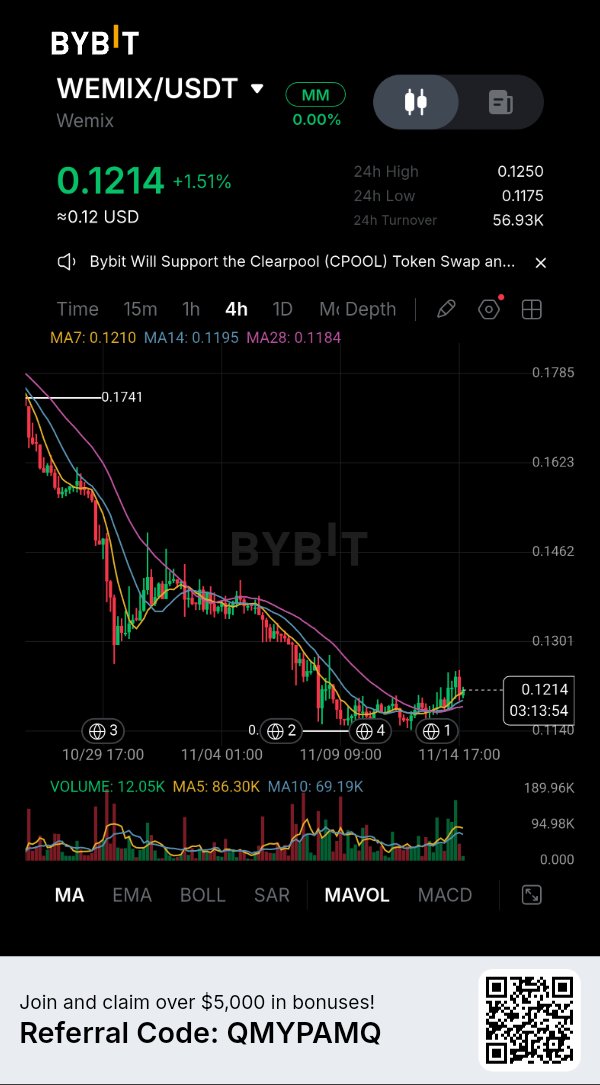
WEMIX is showing its first meaningful signs of stabilization after an extended decline, but I wouldn't call this a confirmed trend reversal just yet. WEMIX is trading around $0.1214 on Bybit, up approximately 1.51%. The 24-hour high is $0.1250, while the low stands at $0.1175. What makes this setup interesting is that price is now attempting to build a recovery after falling from the $0.1741 region. 4H Technical Structure The moving averages are starting to favor short-term buyers: MA7: $0.1210 MA14: $0.1195 MA28: $0.1184 Price is currently above all three averages, and their bullish alignment suggests improving short-term momentum. However, the larger 4H structure remains bearish. A recovery above the moving averages is encouraging, but buyers still need to prove they can sustain higher prices. Key Support and Resistance Immediate resistance: $0.1250 Next resistance: $0.1301 Higher resistance: $0.1462 Major resistance: $0.1623 Immediate support: $0.1175 Stronger support: $0.1140 A convincing breakout above $0.1250 could open the way toward $0.1301. Failure to hold $0.1175 would weaken the recovery and potentially bring $0.1140 back into focus. Volume: The Missing Confirmation Current volume: 12.05K MA5: 86.30K MA10: 69.19K The latest volume is significantly below its averages. This is something I wouldn't ignore. Price is recovering, but participation needs to increase before treating this move as a reliable breakout. Fundamental Developments WEMIX is an EVM-compatible blockchain ecosystem focused on gaming, DeFi and digital assets, secured through its SPoA consensus mechanism. An important recent development is its Q3 2026 quarterly report, published on November 11. The report showed approximately 2 million WEMIX in net total supply growth during Q3, while circulating supply increased by approximately 31.4 million, primarily due to the July 1 distribution-plan conversion. This supply development deserves attention because increasing circulating supply can create additional selling pressure. WEMIX also recently published ecosystem updates, including WEMIX PLAY improvements and its ongoing security bug bounty initiative. One important data limitation: current CoinGlass coverage does not provide WEMIX perpetual futures open interest or funding rates. Therefore, I would not use unverified derivatives positioning to justify a trade. My Trading Outlook: WAIT FOR CONFIRMATION The short-term structure is improving, but the broader trend has not completely changed. I would like to see WEMIX break and hold above $0.1250 with stronger volume before considering a LONG setup. If buyers fail to defend $0.1175, another test of $0.1140 becomes possible. For now, chasing the recovery without volume confirmation doesn't look attractive. The real test is whether WEMIX can turn this stabilization into a sustainable trend reversal. Would you consider a LONG above $0.1250, or wait for a pullback toward $0.1175 before making a decision? $WEMIXUSDT #IMPACTbyTrade
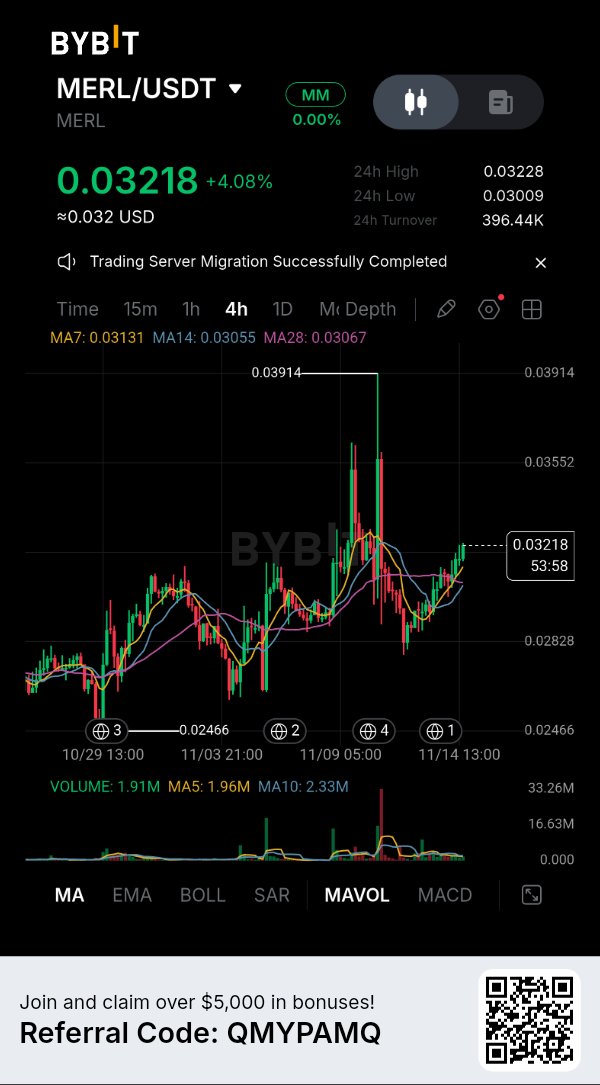
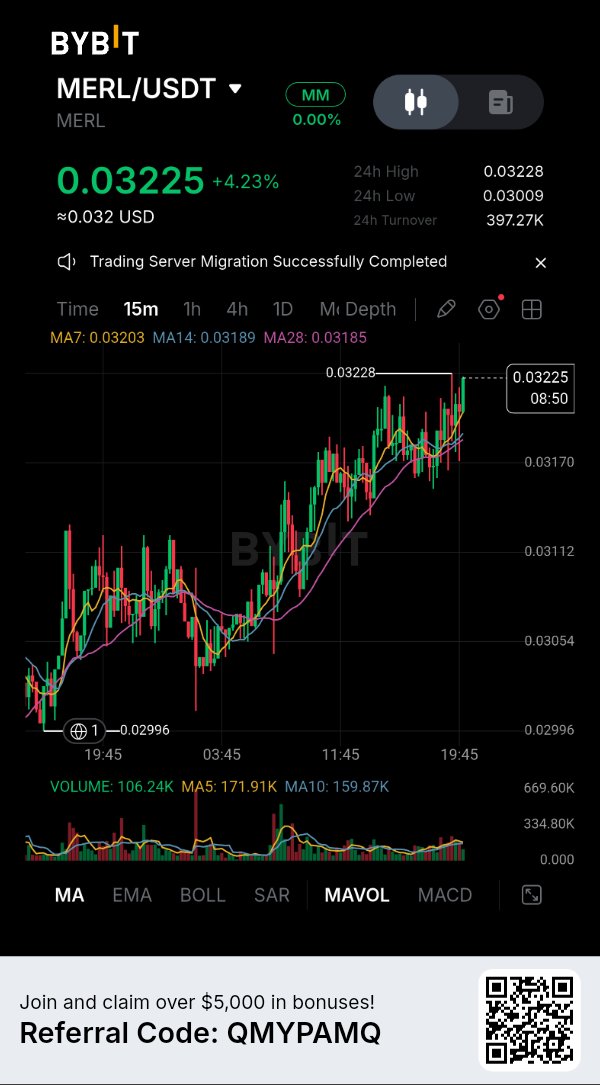
MERL is approaching a critical resistance zone, and the interesting part is that buyers are gaining control without fully confirming a breakout yet. Merlin Chain is trading around $0.03225 on Bybit, up approximately 4.23%. Price has recovered from the $0.03009 intraday low and is now testing the $0.03228 area. What matters now is whether buyers can turn this recovery into a sustained move rather than another rejection near resistance. Daily Structure: Buyers Have the Advantage The daily chart is showing improving momentum. Moving averages: MA7: $0.03088 MA14: $0.03017 MA28: $0.02868 Price is trading above all three moving averages, with bullish alignment. This supports the recovery structure. The daily chart also shows a previous major high near $0.03914. However, that level remains a distant resistance rather than an immediate target. 4H Chart: Recovery Is Developing The 4-hour moving averages are: MA7: $0.03131 MA14: $0.03055 MA28: $0.03067 MERL is holding above these averages after recovering from the $0.02466 region. This is encouraging, but the previous rejection around $0.03914 shows that sellers can still create significant volatility. 15-Minute Chart: Immediate Breakout Test Short-term moving averages: MA7: $0.03203 MA14: $0.03189 MA28: $0.03185 These averages are clustered closely together beneath the current price. The immediate resistance is $0.03228. A convincing move above this level, supported by expanding volume, could open the way toward $0.03346 and then $0.03552. If price fails to hold above the short-term averages, a retest of $0.03170 or $0.03099 becomes possible. Volume: An Important Confirmation Signal 15-minute volume: 106.24K MA5: 171.91K MA10: 159.87K 4H volume: 1.91M MA5: 1.96M MA10: 2.33M Daily volume: 8.07M MA5: 22.71M MA10: 18.21M The latest volume readings are below their respective averages. This is important because price strength without stronger participation can produce a false breakout. Broader market data also shows MERL futures activity exceeding spot volume, with open interest increasing. This suggests growing derivatives participation, but also creates liquidation risk. Fundamental Picture: Merlin's Bitcoin DeFi Narrative Merlin Chain is a Bitcoin Layer 2 ecosystem focused on bringing Bitcoin assets and DeFi applications into a more scalable environment through technologies including zkEVM and BitVM. Its long-term narrative depends on actual ecosystem adoption, liquidity and application activity, not simply token price appreciation. There is also a supply factor traders should watch: the next scheduled token unlock is December 1, 2026, involving approximately 38.6 million MERL, or around 1.8% of total supply. This could create additional selling pressure if recipients decide to distribute their tokens. No verified new announcement currently establishes a fresh fundamental catalyst for today's price movement. Important Price Levels Immediate resistance: $0.03228 Next resistance: $0.03346 Higher resistance: $0.03552 Major resistance: $0.03914 Immediate support: $0.03170 Next support: $0.03099 Stronger support: $0.03009 A confirmed breakout above $0.03228 with increasing volume would improve the bullish outlook. Failure to hold $0.03099 would weaken the short-term recovery. My Trading Outlook: WAIT FOR CONFIRMATION MERL currently has a constructive daily structure, and the 4H recovery is encouraging. However, the short-term volume readings are not yet providing strong breakout confirmation. I would prefer to see a sustained move above $0.03228 before considering a LONG setup. If buyers fail to defend $0.03099, the possibility of another downward move increases. The bigger question is whether this is the beginning of a stronger Merlin Chain recovery or simply a temporary bounce inside a volatile market. Would you take a LONG after a confirmed $0.03228 breakout, or wait for a pullback toward support before entering? $MERLUSDT #ByXIMPACT
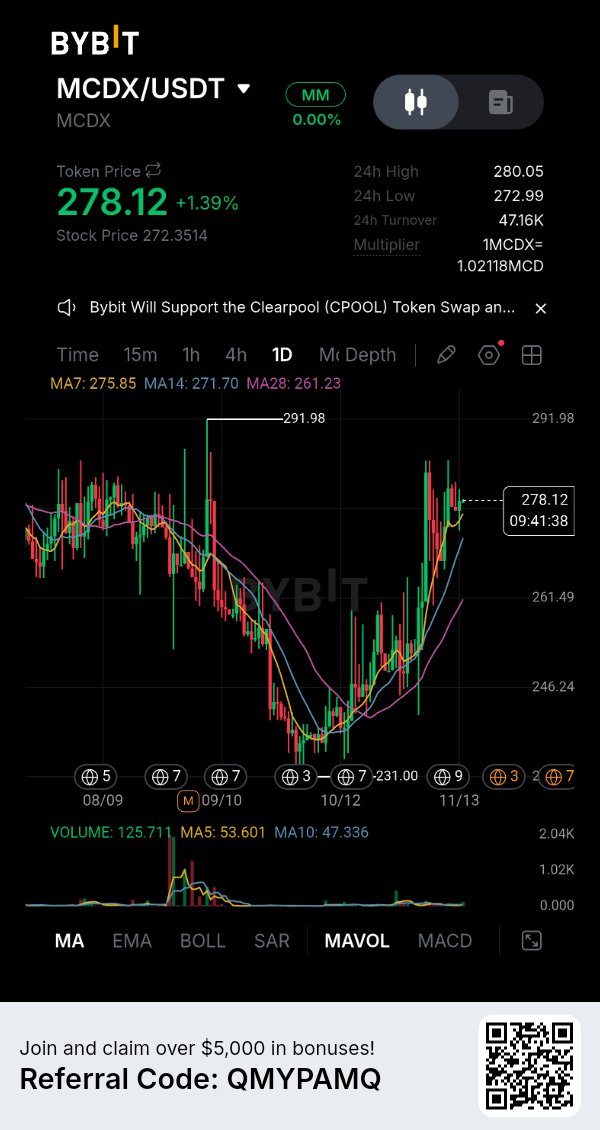
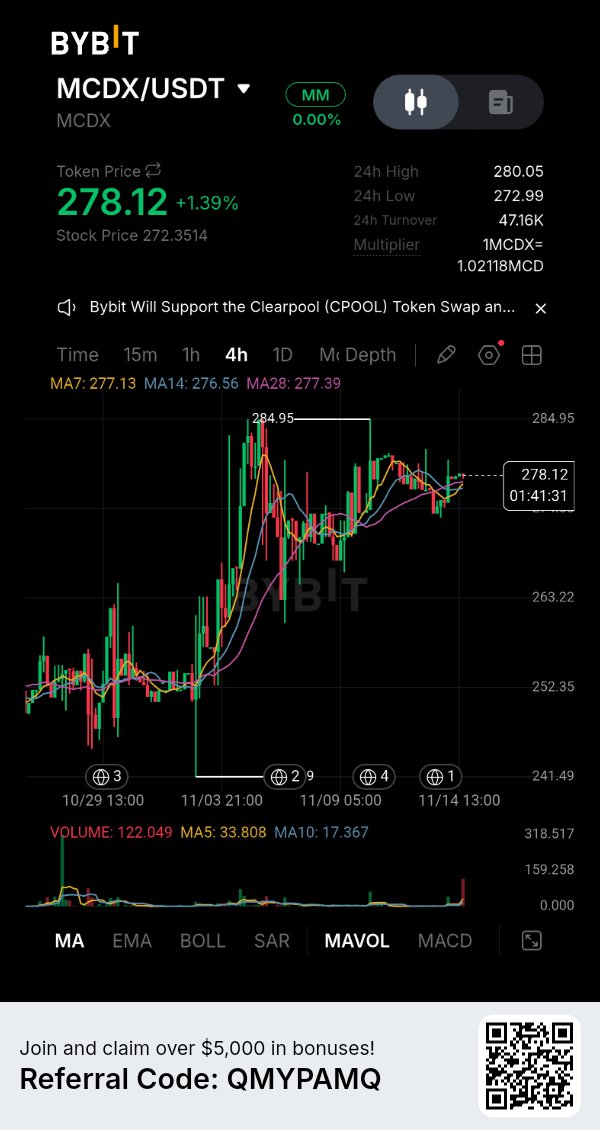
Something interesting is happening with MCDX, and I'm paying more attention to how price behaves after its recent breakout than to the current 1.39% gain. MCDX is trading around $278.12 on Bybit, up 1.39%, after recovering from $272.99 and reaching an intraday high of $280.05. Buyers pushed price higher, but the market has started consolidating around $278. The important question is whether this pause becomes a base for another move or the beginning of a deeper correction. The Daily Chart Shows Recovery Strength Daily moving averages: MA7: $275.85 MA14: $271.70 MA28: $261.23 Price is above all three averages, with the shorter averages positioned above the longer-term average. This supports the improving daily structure. The first support is $275.85, followed by $271.70. As long as these levels hold, the broader recovery remains constructive. The 4H Chart Shows Buyers Still Have an Opportunity 4H moving averages: MA7: $277.13 MA14: $276.56 MA28: $277.39 Price remains above all three averages. The $276.56-$277.39 region is an important support cluster. Holding this area would strengthen the bullish case, while $284.95 remains the next major resistance. Short-Term Consolidation 15-minute moving averages: MA7: $277.95 MA14: $278.12 MA28: $278.05 These averages are tightly compressed around the current price, showing short-term consolidation. A breakout above $280.05 with stronger volume would provide better confirmation than sideways trading around these averages. Volume Analysis 15-minute volume: 0.000 MA5: 24.285 MA10: 12.204 4H volume: 122.049 MA5: 33.808 MA10: 17.367 Daily volume: 125.711 MA5: 53.601 MA10: 47.336 The 4H and daily readings are above their displayed averages, although the latest 15-minute volume is not confirming the move. This suggests broader participation, but another breakout needs fresh buying activity. Fundamentals: McDonald's Latest Results McDonald's reported its Q3 2026 results on November 4. Global comparable sales increased 1.5%, while global systemwide sales grew 4% to more than $38 billion. Operating income increased 7%, and diluted EPS reached $3.51, up 10% year over year. However, US comparable sales declined 0.2%, showing continued challenges with customer traffic and affordability. Management highlighted improving trends following value-focused promotions, but execution remains important. The underlying business therefore shows encouraging earnings growth, although risks remain. An Important Detail About MCDX MCDX is McDonald's xStock, a tokenized tracker certificate linked to McDonald's Corporation. Bybit displays an underlying stock price of $272.3514 and a multiplier of: 1 MCDX = 1.02118 MCD This explains why the token trades around $278.12 rather than matching the underlying share price. MCDX provides economic exposure to the underlying stock, but it is not equivalent to directly owning McDonald's shares or receiving shareholder voting rights. Important Price Levels $272.99 - Recent intraday support $275.85 - Daily MA7 support $276.56-$277.39 - 4H support cluster $278.12 - Current price $280.05 - Immediate breakout resistance $284.95 - Major 4H resistance $291.98 - Previous daily high A sustained breakout above $280.05 could bring $284.95 into focus. A successful move above that level could reopen the path towards $291.98. On the downside, losing $276.56-$277.39 would weaken the short-term structure. A breakdown below $272.99 would require reassessing the recovery. My Trading Outlook: WAIT FOR BREAKOUT CONFIRMATION I'm cautiously bullish because price is holding above the daily and 4H moving averages. However, consolidation is not the same as a confirmed continuation. I want to see buyers break and sustain above $280.05 with stronger volume. Until then, chasing the current move doesn't offer convincing confirmation. MCDX is interesting because its improving technical structure coincides with encouraging underlying earnings performance. The next move will tell us whether buyers are preparing for another expansion or whether this rally needs a deeper correction. Would you consider MCDX above $280.05 a genuine breakout opportunity, or wait for stronger confirmation near $284.95?$MCDXUSDT #ByXIMPACT