Kashi Khan tumsa
#ByXIMPACT $FFUSDT is showing a stronger short-term rebound, but the quality of buying still raises questions. Falcon Finance is trading around $0.0953, up approximately 4.5% over 24 hours. The 1H and 4H moves are positive, yet the 30-day performance remains down around 11%. This looks like improving momentum, not a confirmed higher-timeframe recovery. CoinGlass +1 The 4H RSI is around 64, while the daily RSI is approximately 48. Short-term buyers have gained control, but the daily momentum picture is still relatively neutral. The important development is the move above $0.0940. This was a previous resistance area and daily pivot. Holding it during a pullback would strengthen the bullish case. The immediate obstacle is the $0.0955 area, near the current 24H high. Key levels: * Support / Defense: $0.0940 * Breakout confirmation: $0.0955 * Next resistance / Target: $0.0994 * Major downside support: $0.0901 I would not chase a long position directly into resistance. My conditional setup is to wait for a convincing break above $0.0955 and a successful retest. A daily close below $0.0901 would invalidate the improving structure. COINOTAG +1 One detail deserves more attention: futures turnover is approximately $29.3M, compared with just $3.3M in spot volume. Derivatives activity is roughly nine times spot activity. That suggests leverage is playing a much larger role than actual spot demand. A breakout without stronger spot participation could easily become a liquidity trap. CoinGlass Fundamentally, Falcon's expansion of USDf collateral eligibility to include Kyrgyzstan's KGST stablecoin is a meaningful ecosystem development. Its September report also showed $1.21B in USDf supply and 156.47% reserve backing. However, protocol growth still needs to translate into sustainable demand for FF. Falcon Finance My conclusion: If FF holds $0.0940 and clears $0.0955, $0.0994 becomes the next area to watch. Failure to defend $0.0940 would shift attention back toward $0.0901. Will spot buyers finally confirm this breakout, or is futures-driven positioning making another rejection more likely?

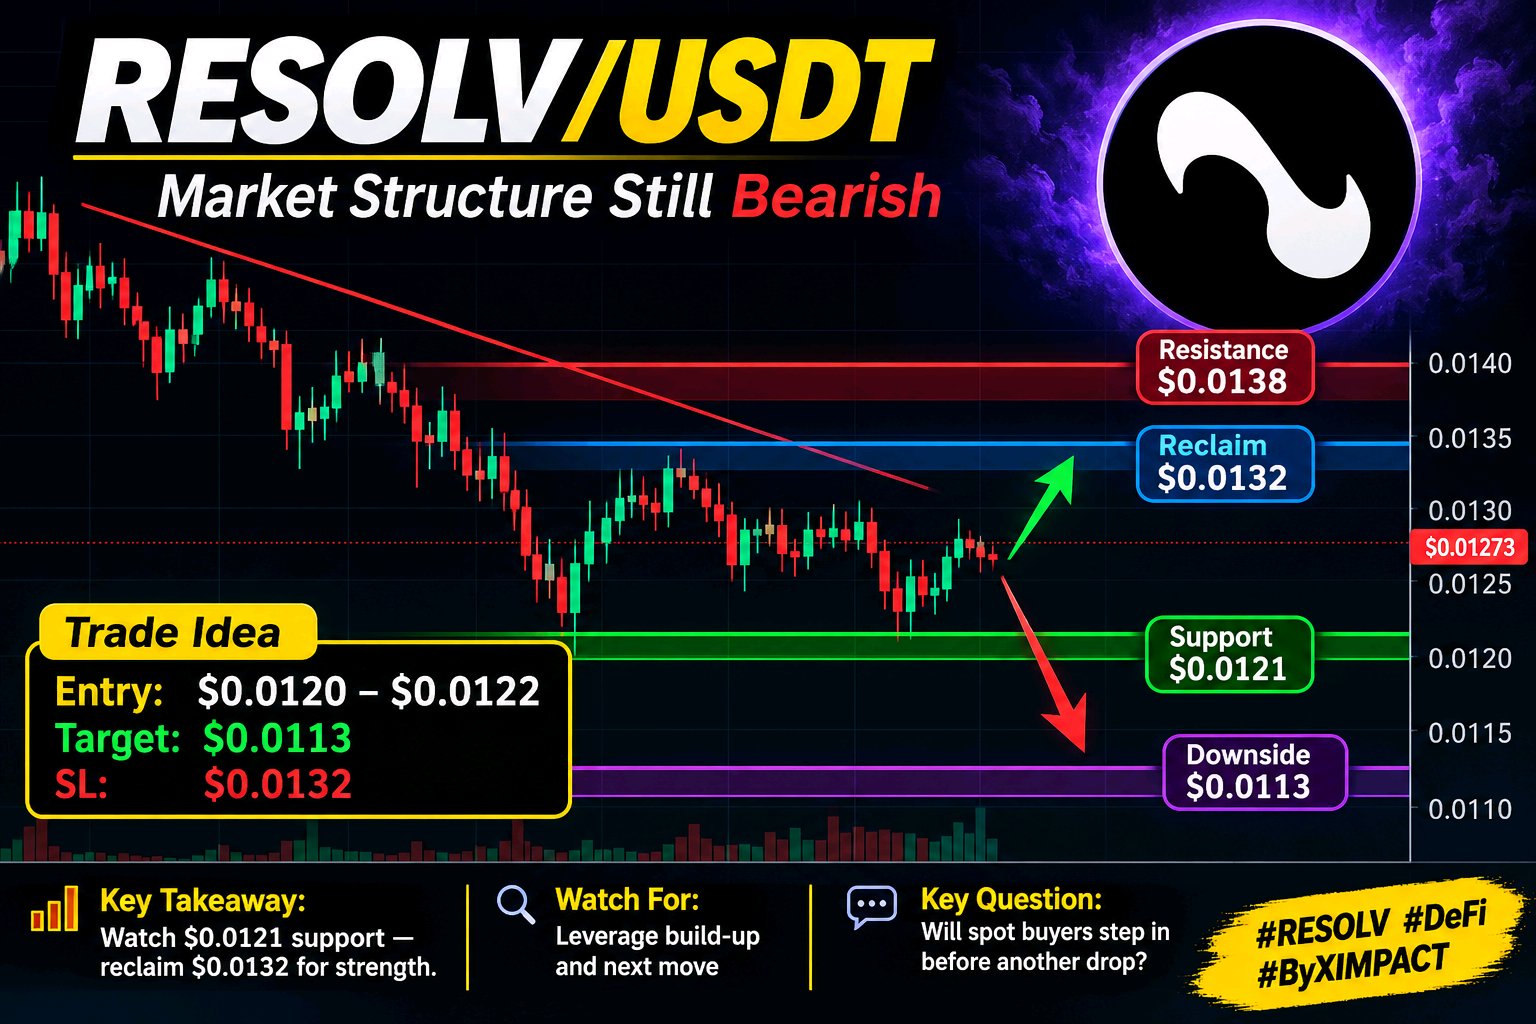
#ByXIMPACT $RESOLVUSDT is showing a bounce after testing fresh lows, but the derivatives market is expanding faster than genuine spot demand. That difference deserves attention. RESOLV is trading around $0.01273, down approximately 0.55% over 24 hours, after moving between $0.01140 and $0.01353. The recovery from the low has not yet repaired the broader structure. Short-term buyers need to reclaim $0.0132, while the 4H and daily trends remain bearish. RSI readings of 44.3 on 4H and 37.2 on daily confirm that momentum is still weak. CoinGlass +1 Derivatives are sending a warning. Open Interest has increased 16.21% to $6.17M, while futures volume jumped 229.67% to $9.97M. Futures turnover is roughly 10.5 times spot volume. Meanwhile, around $45.63K in liquidations were recorded, with 95% coming from longs. Funding remains positive at 0.0100% per 8 hours. This suggests leverage is returning, but the spot market has not yet demonstrated enough strength to validate a sustained recovery. CoinGlass Key levels I'm watching: * Support / Defense: $0.0121 — important daily support. * Reclaim: $0.0132 — regaining this pivot would improve short-term structure. * Resistance: $0.0138 — a stronger confirmation level. * Downside: $0.0113 — next important support if $0.0121 fails. COINOTAG Conditional trade thesis: I would avoid chasing a position at current prices. A short setup becomes more interesting around $0.0120–$0.0122 only after a confirmed breakdown and failed reclaim. Target: $0.0113. Invalidation: $0.0132. One overlooked factor is supply pressure: DefiLlama lists an 18.24M RESOLV unlock for November 26, equal to approximately 3.54% of circulating supply. It does not guarantee selling, but it adds another consideration while liquidity remains limited. DefiLlama If $0.0121 holds and $0.0132 is reclaimed, the bearish setup weakens. If support breaks, $0.0113 becomes relevant. Will spot buyers step in before leverage builds further, or is RESOLV still vulnerable to another liquidity sweep?
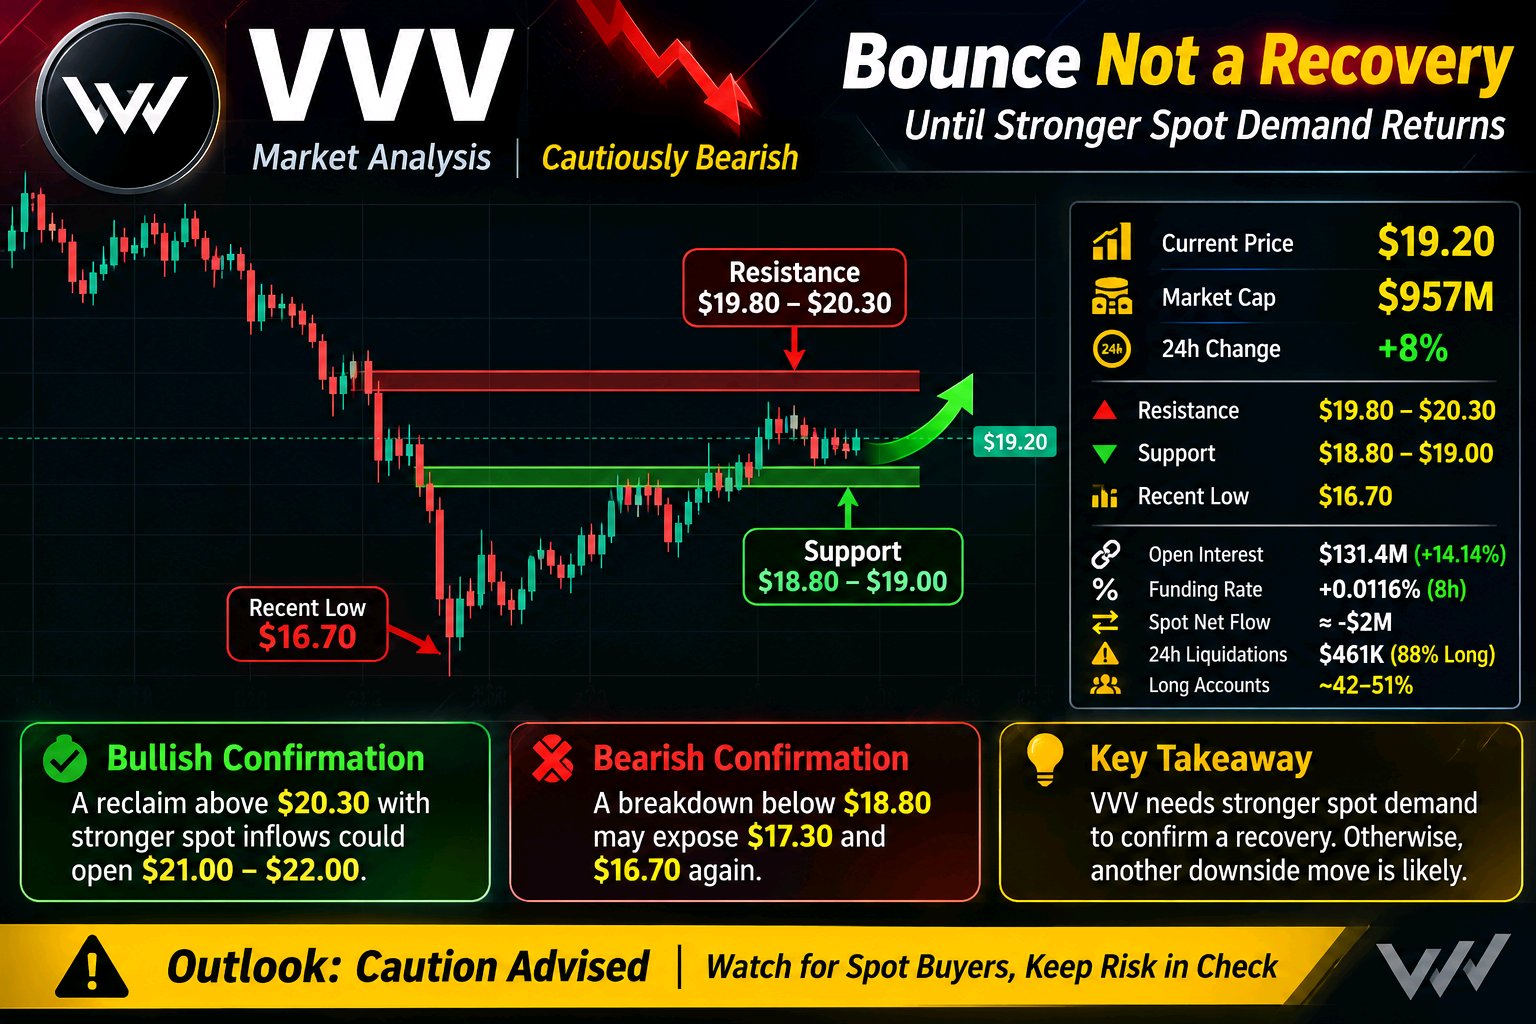
#ByXIMPACT $VVVUSDT is attempting to regain bullish momentum, but the market still needs stronger confirmation. Price is holding near $19.20, with resistance at $19.80–$20.30 and support around $18.80–$19.00. Rising open interest and positive funding suggest leverage is returning. Without stronger spot demand, another downside move remains possible. A clean breakout above $20.30 could open the door toward $21–$22. Until then, patience and risk management matter.
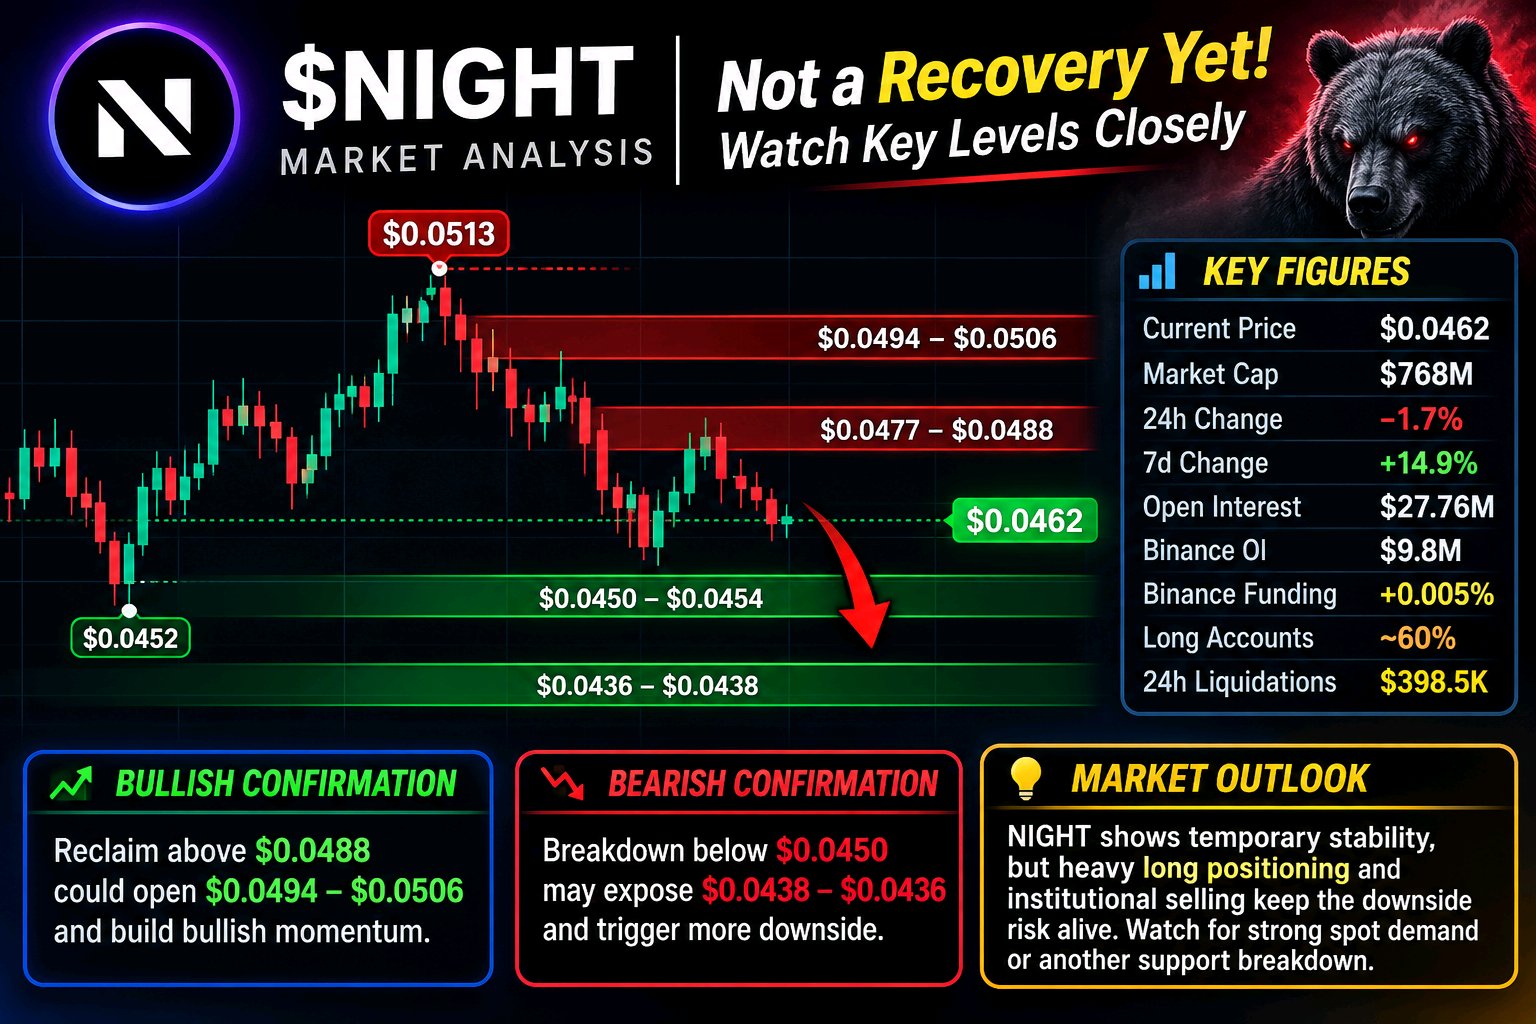
#ByXIMPACT $NIGHTUSDT (Midnight) — Market Structure, Liquidity & Derivatives Analysis NIGHT is trading around $0.0462, following a rejection from the recent $0.0513 high and a pullback toward $0.0452. I am not treating the current stabilization as a confirmed recovery. The weekly structure remains positive, but the short-term picture is more complicated. Spot inflows are competing with rising futures open interest, while leveraged positioning remains tilted toward longs. The key question is whether genuine spot demand can absorb selling pressure before another liquidity sweep develops. NIGHT has a market capitalization of approximately $768 million. It is down around 1.7% over 24 hours but remains approximately 14.9% higher over seven days. The rejection from $0.0513 toward $0.0452 represents an approximately 11.9% retracement. Price is now attempting to stabilize above the $0.0450–$0.0454 support area. Immediate resistance sits around $0.0477–$0.0488, followed by $0.0494–$0.0506. A sustained reclaim of these levels would improve the short-term structure, but the market still needs stronger confirmation before the broader recovery narrative becomes credible. CoinGlass +2 NIGHT does not have the same established ETF-flow channel as Bitcoin or Ethereum, so exchange-flow data is more relevant here. The latest available aggregate flow snapshot shows approximately $2.2 million in spot net inflows, compared with around $6.5 million in futures net outflows. This suggests some spot demand is present, but it does not establish sustained institutional accumulation. The divergence between spot and derivatives activity needs monitoring, particularly while price struggles to reclaim nearby resistance. There is not enough verified evidence to claim that large institutions are consistently accumulating NIGHT. CoinGlass The immediate range is approximately $0.0452–$0.0488, following the rejection near $0.0513. A narrow trading range after a sharp move does not automatically indicate accumulation. It can also represent temporary balance before another expansion in volatility. Spot volume has increased, but stronger and sustained buying participation is still required to absorb supply around resistance. A breakdown below $0.0450 would put the next support levels under pressure. Aggregate open interest across exchanges is approximately $27.76 million, up around 10.9% over 24 hours. Binance-specific open interest is approximately $9.8 million, also showing an increase of roughly 11%. Binance funding is around +0.005% per four hours, meaning longs are paying shorts. Approximately 60% of Binance accounts are positioned long, while top traders are around 57% long by position size. This is a meaningful long-side imbalance. However, rising open interest alongside price weakness also indicates growing short participation. The market is not one-sided, but the long-heavy account distribution creates vulnerability if support breaks. Approximately $398,500 in liquidations occurred over 24 hours, with 56% attributed to longs. CoinGlass +2 * Current price area: $0.0462 * Market capitalization: $768M * Immediate resistance: $0.0477–$0.0488 * Higher resistance: $0.0494–$0.0506 * First support: $0.0450–$0.0454 * Next support: $0.0436–$0.0438 * Recent low: $0.0452 * Aggregate open interest: $27.76M * Binance open interest: $9.8M * Binance funding: +0.005% * Binance accounts long: Approximately 60% * 24-hour liquidations: $398.5K 7\. Confirmation Levels Bullish confirmation: A sustained reclaim above $0.0488 would improve the short-term structure and open the way toward $0.0494–$0.0506. A stronger move above $0.0513 would provide more convincing evidence that buyers are regaining control. Bearish confirmation: A decisive breakdown below $0.0450 would expose the $0.0438–$0.0436 support zone. Losing that region would increase the risk of additional long liquidations and a deeper retracement. NIGHT is showing temporary stability, and its weekly performance remains constructive. However, rising open interest, positive funding and a long-heavy account distribution create conditions where a failed support level could trigger further liquidation pressure. Spot inflows are encouraging, but they have not yet produced a decisive resistance reclaim. The next meaningful signal is whether spot buyers return with enough strength to absorb selling while leverage remains controlled, or whether another support breakdown triggers fresh long liquidations
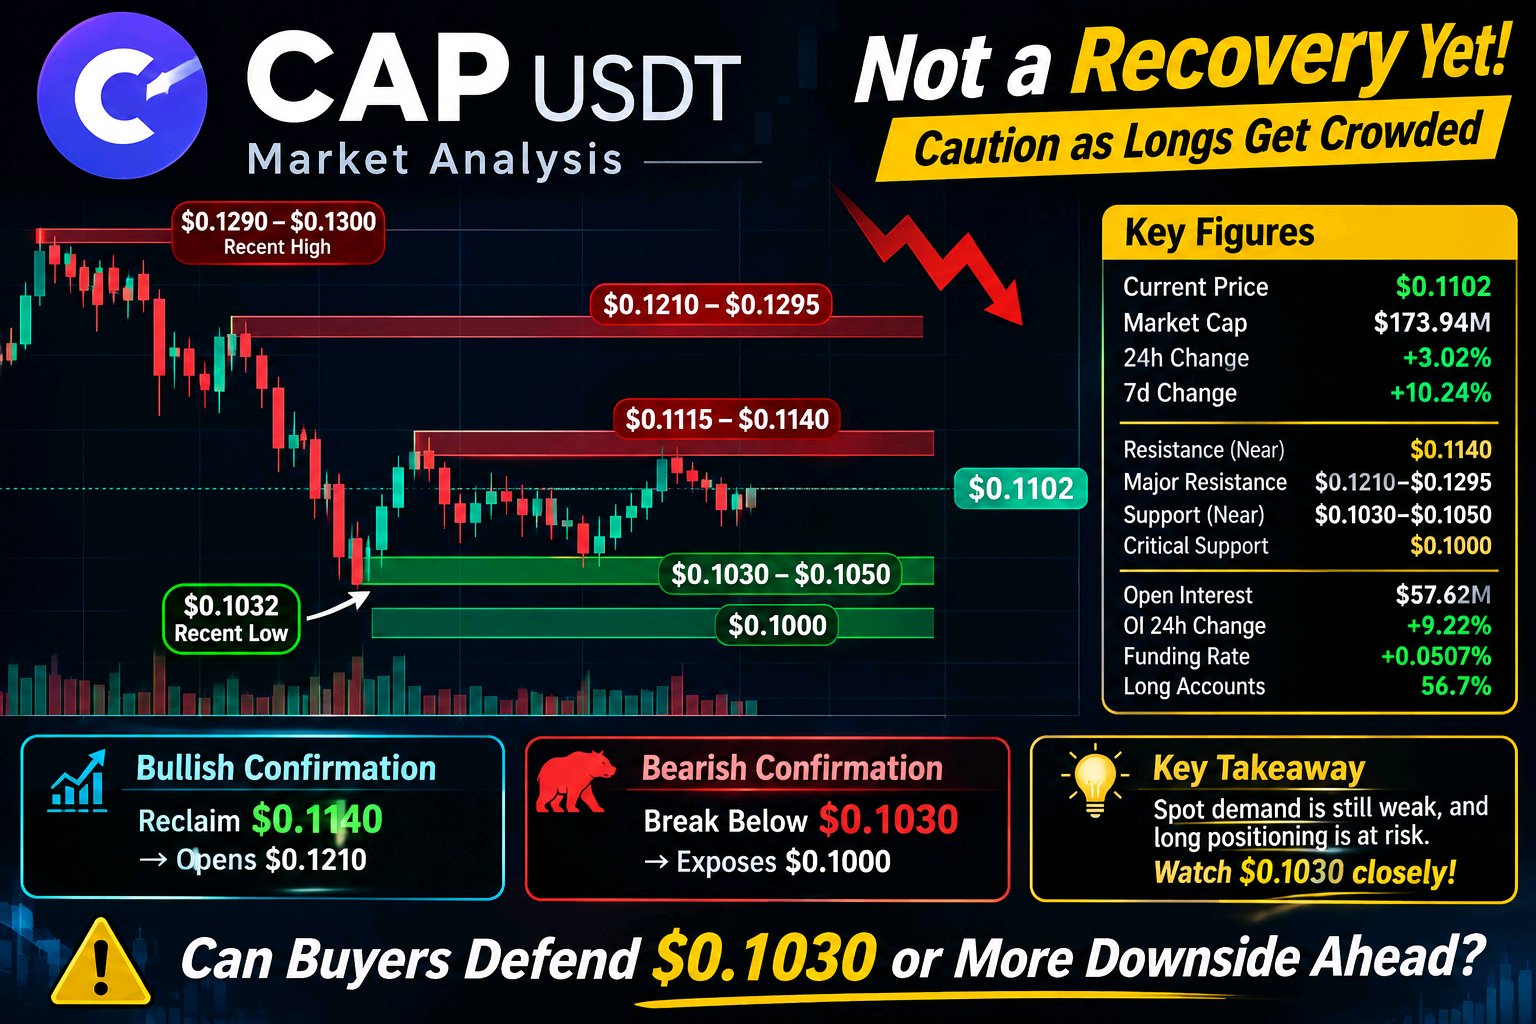
#ByXIMPACT $CAPUSDT is trading around $0.1102, following a sharp rejection from the $0.1290–$0.1300 area and a recent decline toward $0.1032. I am not treating the current stabilization as a confirmed recovery yet. The bigger concern is the divergence between spot demand and derivatives activity, with open interest rising, funding remaining strongly positive, and long positioning becoming increasingly crowded. CAP is up approximately 3.02% over 24 hours and 10.24% over seven days, with a market capitalization near $173.9 million. However, price remains approximately 14.6% below its recent high. The immediate resistance zone is $0.1115–$0.1140, followed by $0.1210–$0.1295. On the downside, initial support sits around $0.1030–$0.1050, with stronger structural support near $0.1000. A sustained reclaim of $0.1140 would improve the short-term structure and potentially open a move toward $0.1210. Until then, the latest bounce remains vulnerable to another rejection. CoinGlass +1 The spot-versus-futures divergence deserves attention. Recent exchange-aggregated data shows approximately $1.7 million in net spot outflows, while futures open interest has increased to approximately $57.62 million. Spot volume is around $31.35 million against $137.20 million in futures volume. This suggests derivatives are playing a much larger role in current activity than spot participation. There is no verified ETF-flow catalyst applicable to CAP, so exchange flows and large-position activity provide a more relevant picture. The available data does not confirm a specific institutional liquidation event or exchange-related catalyst. CoinGlass +1 CAP is attempting to stabilize between approximately $0.1030 and $0.1140 after its rejection from the recent high. However, a narrow trading range following a sharp decline is not evidence of accumulation. The fact that futures activity remains significantly higher than spot activity raises an important question: are genuine spot buyers absorbing available supply, or is leverage temporarily supporting the price? Stronger spot buying participation is necessary to establish a more durable upward structure. Derivatives positioning is becoming increasingly important. * Aggregated open interest: approximately $57.62 million. * 24-hour OI increase: approximately 9.22%. * Funding rate: approximately +0.0507% per 8 hours. * Binance global accounts: approximately 56.7% long. * Binance top-trader positions: approximately 68.8% long. Positive funding means long positions are paying shorts to maintain exposure. The elevated funding rate, combined with rising open interest, suggests increasing leverage and bullish positioning. This creates vulnerability if support breaks. A move below $0.1030 could force leveraged longs to reduce exposure, potentially accelerating selling pressure. CoinGlass +1 | Metric | Level | | --------------------- | --------------- | | Current price | $0.1102 | | Market capitalization | $173.94M | | Immediate resistance | $0.1140 | | Major resistance | $0.1210–$0.1295 | | First support | $0.1030–$0.1050 | | Critical support | $0.1000 | | Recent low | $0.1032 | | Open interest | $57.62M | | OI 24h change | +9.22% | | Funding rate | +0.0507% | | Long accounts | 56.7% | CoinGlass +2 Bullish confirmation: A sustained reclaim of $0.1140, supported by stronger spot volume and controlled funding, would improve the structure and open the possibility of testing $0.1210 and eventually $0.1295. Bearish confirmation: A decisive breakdown below $0.1030 would expose $0.1000, followed by $0.0900 if selling pressure accelerates. CAP is showing temporary stability, and its recent seven-day performance remains positive. However, the current move is competing with negative spot-flow readings, rising open interest, elevated positive funding, and heavily long-tilted top-trader positioning. The decisive signal is whether genuine spot buyers return while leverage remains controlled, or whether another support breakdown triggers fresh long liquidations. Until that distinction becomes clear, this bounce deserves caution rather than being treated as a confirmed recovery.
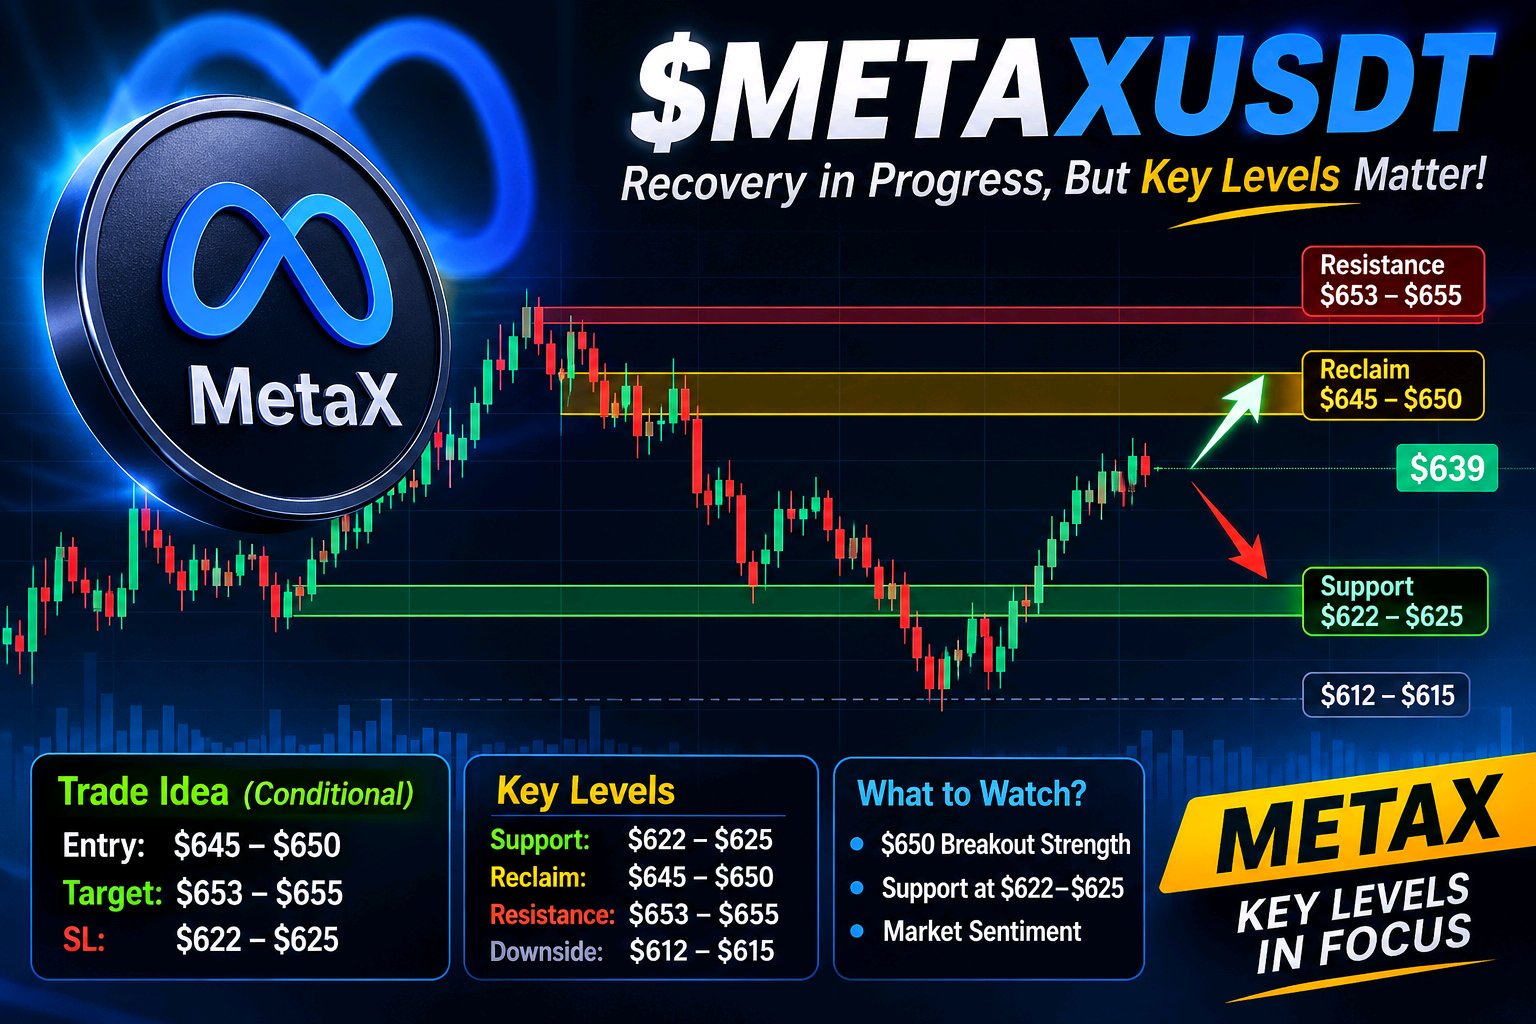
#ByXIMPACT $METAXUSDT is recovering, but the bigger structure still needs confirmation. Trading near $639, METAX is up roughly 2% over 24 hours after rebounding from the $622–$625 area. The latest completed daily session traded between $624.81 and $644.62. Buyers have returned, but they have not cleared the main resistance yet. Bybit +1 The short-term battle is around $644–$650. Recent sessions show a recovery from the November 11–12 decline, but the move is still inside a broader range. TradingView's technical summary currently rates the daily picture Neutral while the weekly outlook remains Sell. That makes it too early to call this a confirmed trend reversal. TradeAlmanac +1 Key levels: * Support / Defense: $622–$625 — recent lows where buyers stepped in. * Reclaim: $645–$650 — clearing this zone would strengthen the recovery. * Resistance: $653–$655 — previous rejection area. * Downside: $612–$615, followed by $598 — relevant if support breaks. I would not force an entry around $639. A sustained reclaim of $650 with stronger spot participation would offer a better confirmation. Bybit's METAXUSDT listing is a spot pair, so I am not using unverified futures OI, funding or liquidation figures to manufacture a derivatives thesis. TradingView +1 The fundamental picture adds another layer. Meta reported 26% year-over-year Q3 revenue growth, but its 2026 capital expenditure outlook stands at $135–145 billion. The opportunity is AI-driven growth; the risk is whether future monetization justifies that investment burden. Meta Reports Third Quarter 2026 Results +1 One detail worth watching: xStocks can trade on secondary markets 24/7, while issuer issuance and redemption operate 24/5. Weekend price movements can therefore be influenced more by token-market liquidity than fresh underlying equity trading. xStocks Docs +1 If $622–$625 holds and $650 is reclaimed, $653–$655 becomes the next test. Lose support, and $612–$615 returns to focus. Would you trust a $650 breakout during the weekend, or wait for confirmation when the underlying equity market reopens?
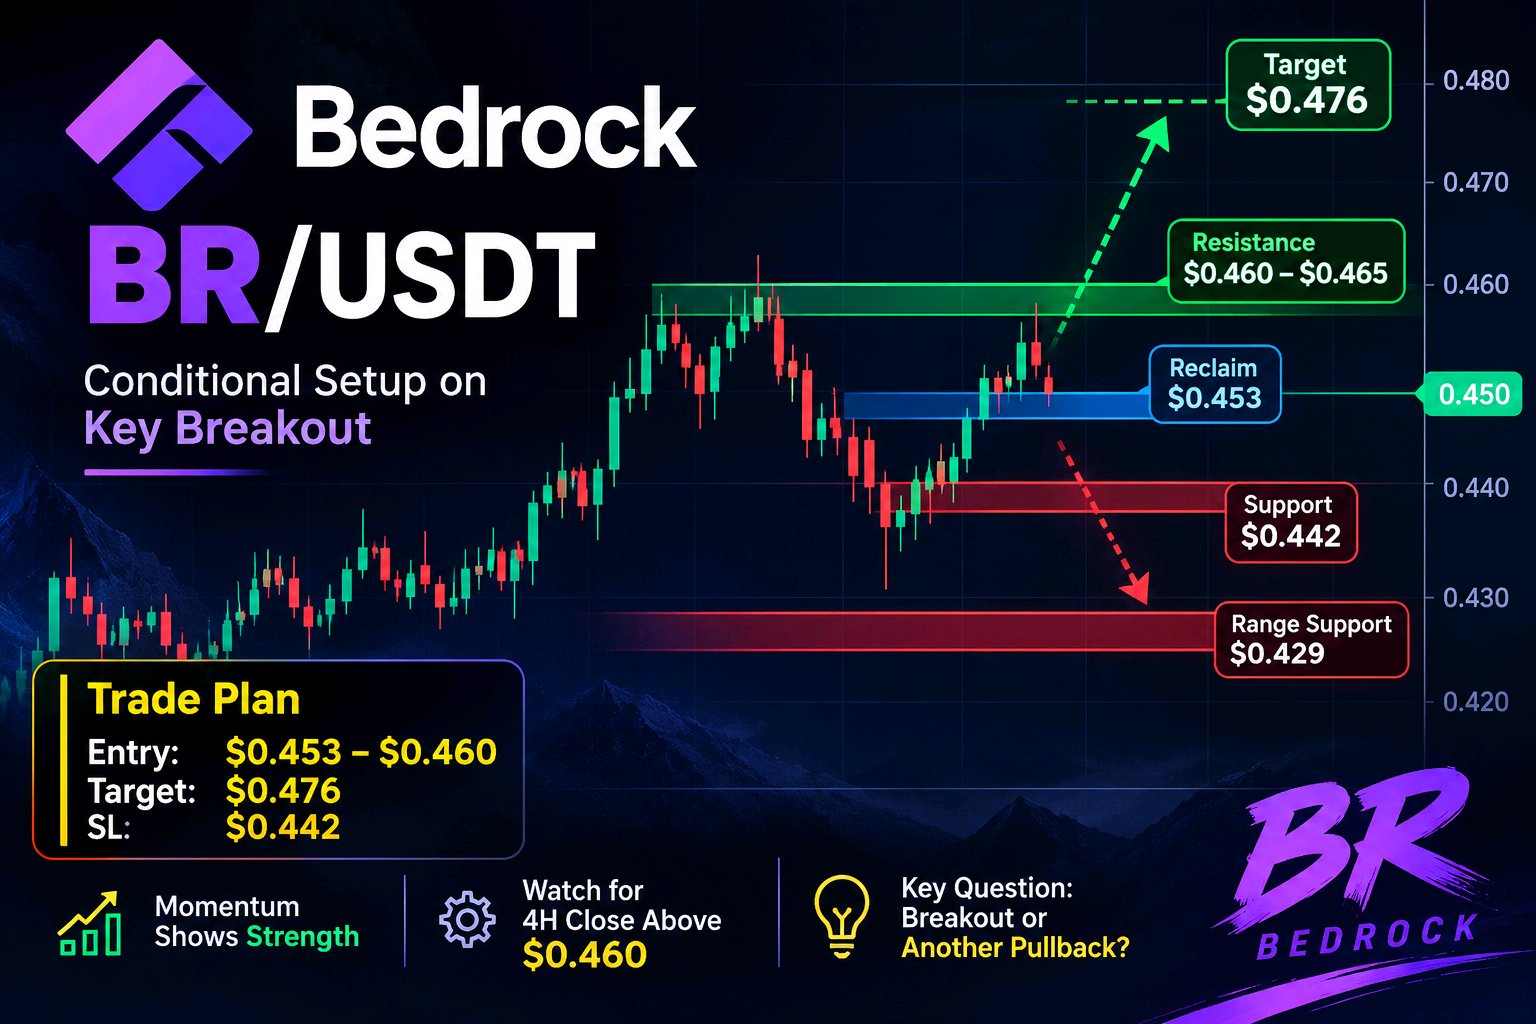
#ByXIMPACT $BRUSDT is showing resilience while BTC and ETH remain under selling pressure, but I’m not ready to call this a confirmed breakout. The real test is whether buyers can turn nearby resistance into support. BR is trading around $0.45, up roughly 1.6% over 24 hours. Short-term momentum has improved, with positive 1H and 4H readings, but price is approaching a resistance cluster where continuation needs confirmation. The levels I’m tracking: - Support: $0.442 — the daily pivot and first defense. - Range support: $0.429 — a break here would weaken the recovery. - Reclaim: $0.453 — needs to hold as support. - Resistance: $0.460–$0.465 — the area bulls must clear. - Upside target: $0.476 if the breakout holds. Trade thesis: I would not chase the current price. A conditional long becomes interesting after a 4H close above $0.460 and a successful retest. Entry: $0.453–$0.460 after confirmation Target: $0.476 Invalidation/SL: $0.442 Derivatives add another layer. Open interest is around $22.24M, up 4.97%, while longs accounted for 84% of approximately $12.38K in 24-hour liquidations. Leverage is increasing, but long positions are still getting caught. One overlooked detail is Bedrock's fundamentals: protocol TVL is around $275.6M, down 26.8% over 30 days. That divergence matters. A rising token price without improving ecosystem activity deserves extra scrutiny. BTC and ETH weakness also make an independent breakout harder to sustain. My approach: if BR holds $0.453 and clears $0.460–$0.465, $0.476 becomes relevant. Failure at $0.442 puts $0.429 and potentially $0.419 back in focus. Will buyers prove this move with stronger spot demand, or is derivatives activity doing most of the lifting?
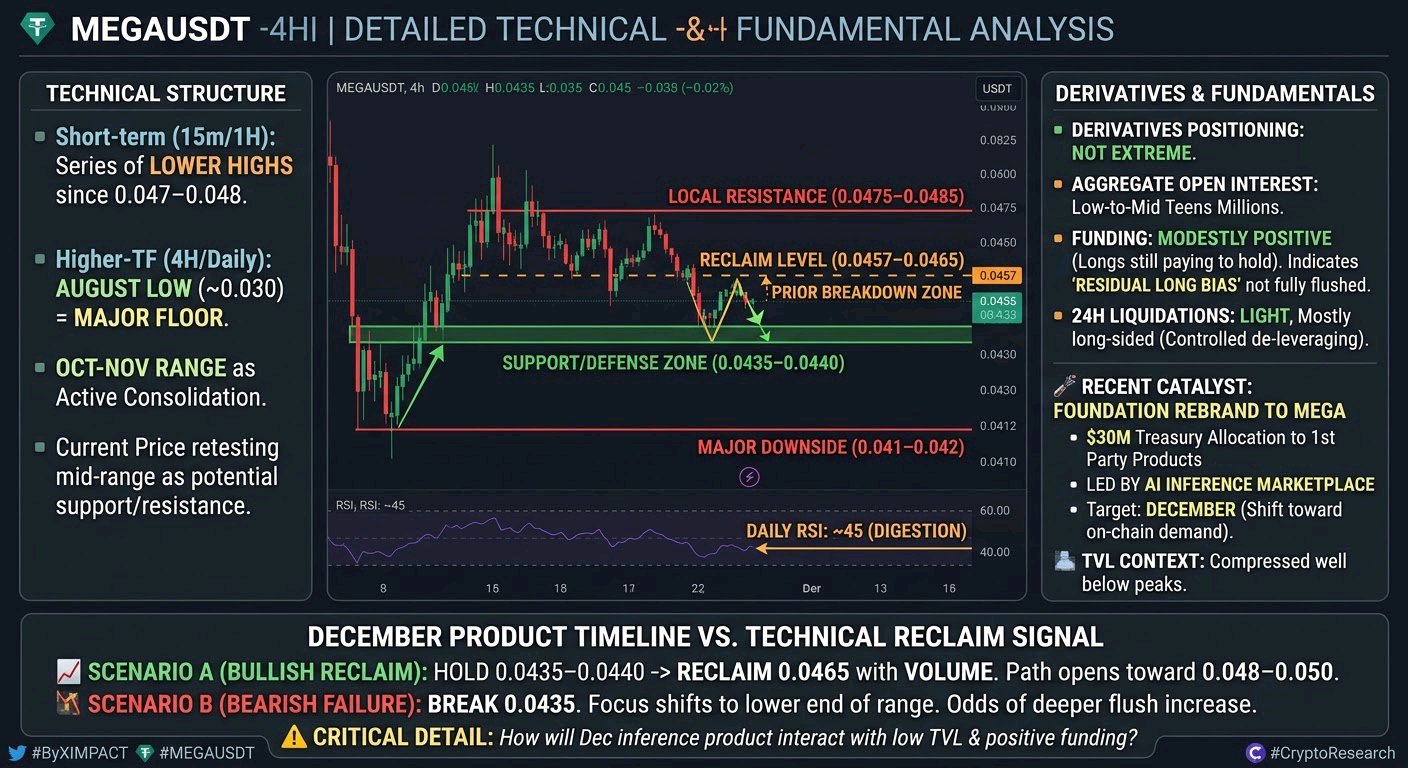
#ByXIMPACT $MEGAUSDT sits near 0.045 after a multi-day pullback from the early-November region above 0.05, even as the broader market sits in extreme fear with BTC holding the low 67k area and ETH near 1900. Price is coiling just above the recent 24h lows while funding remains modestly positive across major venues, with longs still paying to stay in. The short-term structure on 15m/1H has been a series of lower highs since the rejection near 0.047–0.048, but the 4H/Daily still shows the August low near 0.030 as the major higher-timeframe floor and the October–November range as the active consolidation zone. Current price is retesting the underside of the mid-range that previously acted as support on the way up. RSI on the daily has cooled into the mid-40s, consistent with digestion rather than panic selling. Derivatives positioning is not extreme. Aggregate open interest sits in the low-to-mid teens of millions of dollars, with Bybit’s share relatively modest. 24h liquidations have been light and mostly long-sided on the dips, which suggests the move lower has been more controlled de-leveraging than a cascade. Positive funding indicates residual long bias that has not yet been fully flushed. The recent catalyst is the foundation’s rebrand to MEGA and the explicit $30 million treasury allocation toward first-party products, led by an AI inference marketplace targeted for December. That is a clear shift from pure chain infrastructure toward on-chain demand generation. Whether the market prices in any incremental activity before the launch remains the open question, especially with TVL still compressed well below earlier peaks. Key levels I am watching: Support / Defense: 0.0435–0.0440 (recent swing lows and the floor of the current range) Reclaim: 0.0457–0.0465 (prior breakdown zone that needs to be recovered for structure to improve) Resistance: 0.0475–0.0485 (recent local highs) Major downside: 0.041–0.042 (October low region) If price holds the 0.0435–0.0440 zone and reclaims 0.0465 with rising volume, the path toward 0.048–0.050 reopens as the next logical area. Failure of 0.0435 would shift focus to the lower end of the broader range and increase the odds of a deeper flush while positive funding still exists. One detail that still feels under-discussed is how the December inference product could interact with the current low TVL and residual long positioning: any genuine early traction would arrive against a relatively clean derivatives backdrop, while a quiet launch would leave the existing longs exposed into a thin market. Does the December product timeline matter more for positioning here, or is the immediate technical reclaim of 0.0465 the cleaner signal given the broader market weakness?
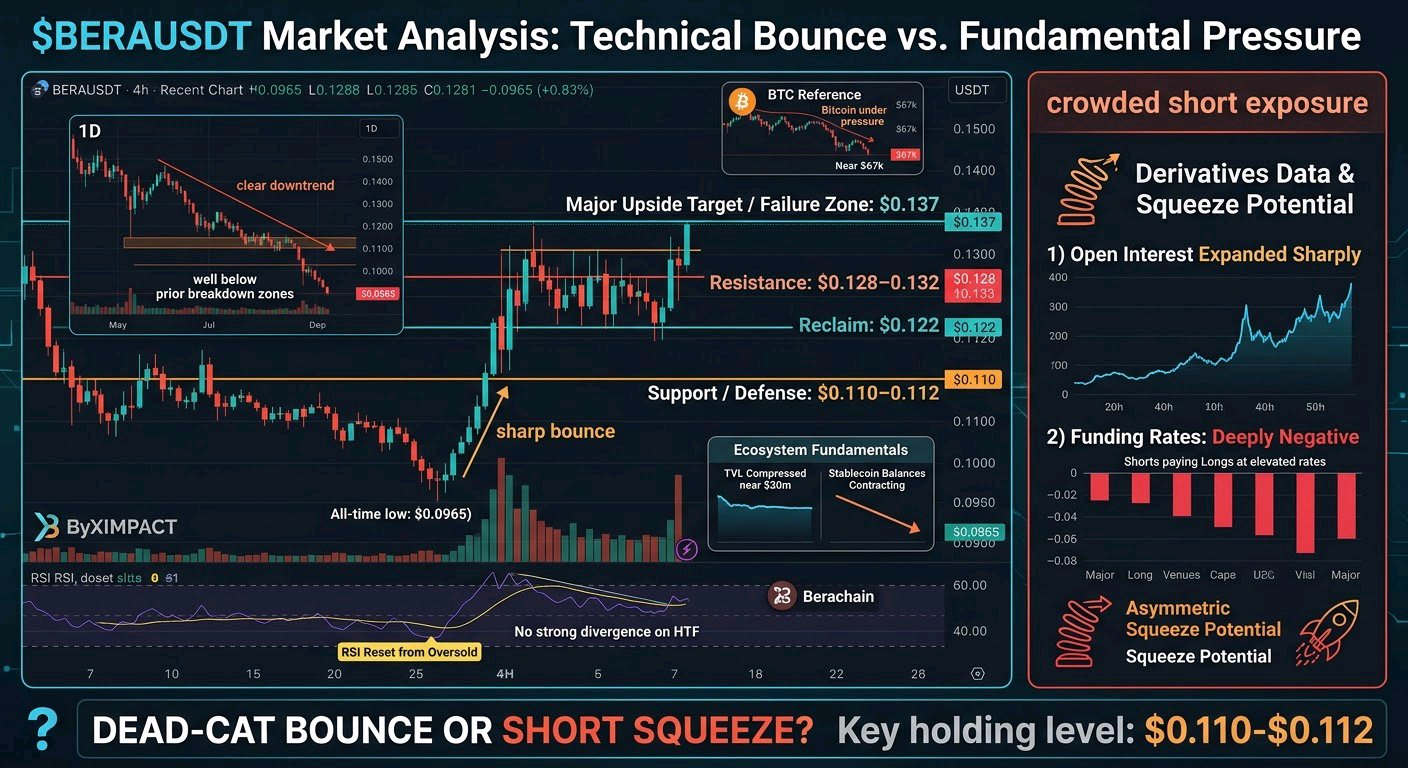
#ByXIMPACT $BERAUSDT just printed a sharp bounce off its all-time low while Bitcoin sits under pressure near $67k. Price reclaimed the $0.11 area after tagging roughly $0.0965 two days ago, ran as high as the mid-$0.13s, and is now consolidating with volume still elevated. The short-term structure on the 1H/4H flipped constructive after the flush. Buyers defended the extreme low and forced a higher low, but the daily remains in a clear downtrend with price still well below prior breakdown zones. RSI on the 4H has reset from oversold without yet showing strong divergence on higher timeframes. The current level matters because it sits right at the edge of the recent rebound base—holding here keeps the short-term recovery intact; losing it reopens the path back toward the ATL. Derivatives data shows open interest expanded sharply alongside the move while funding rates sit deeply negative across major venues. Shorts are paying longs at elevated rates, which creates asymmetric squeeze potential if price can hold and push higher. That positioning is the overlooked detail most pure chart readers miss: the bounce is not just technical—it is occurring into crowded short exposure. No fresh project catalyst explains the move. Ecosystem TVL remains compressed near $30m with stablecoin balances still contracting, so the rebound looks more like a liquidity-driven reaction to extreme oversold conditions than a fundamental shift. Key levels I am watching: Support / Defense: $0.110–0.112 (recent rebound base) Reclaim: $0.122 (first meaningful resistance from the bounce) Resistance: $0.128–0.132 Major upside target / failure zone: $0.137 (24h high) or back below $0.100 if the base fails If $BERA holds the $0.110–0.112 zone and reclaims $0.122 with follow-through volume, the short-term structure improves and $0.128–0.137 becomes the next area of interest. If $0.110 fails cleanly, the bounce thesis weakens and a retest of the ATL region becomes the higher-probability path. Does the extreme negative funding make a short squeeze more likely from here, or is this still just a dead-cat bounce inside a larger downtrend?
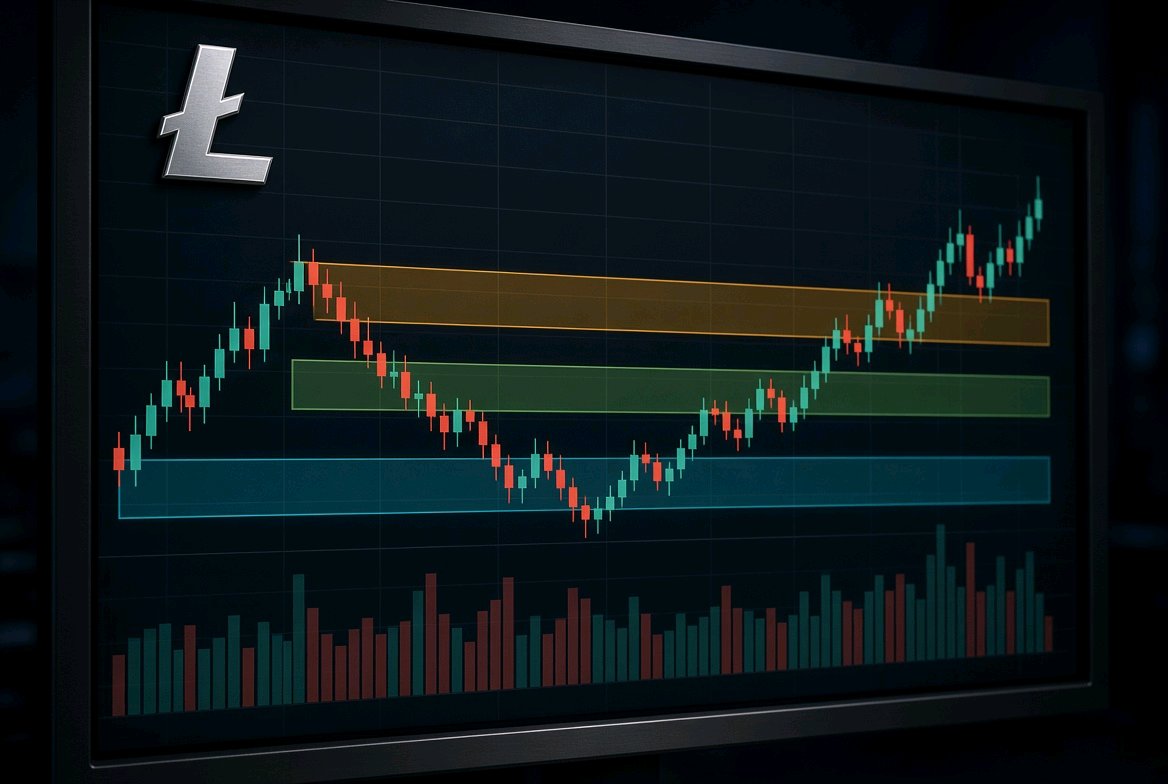
#ByXIMPACT $LTCUSDT sits near $48.8–49.2 after probing the mid-$47s, with daily RSI still hovering in the low 30s. The contradiction is clear: a multi-week decline has flushed leveraged longs hard, yet the higher-timeframe structure remains firmly lower and Bitcoin’s own weakness is keeping any bounce contained. No clean high-conviction directional trade is justified right now. The evidence points to a conditional long only on a decisive reclaim of the recent breakdown zone, not a blind buy into the current range. Recent price action shows a steady grind lower from the low-$50s, with the sharpest leg arriving when price lost the $50–51 area that had previously acted as short-term support. On the 4H the structure is still series of lower highs; on the daily the price remains well below the 20- and 50-period averages. The $47.7–48.1 zone is the immediate defense that has so far attracted buyers, but it has not yet produced a higher low that would change the character of the move. Derivatives data adds context without forcing a thesis. Open interest sits near $350M and has been relatively stable through the latest decline, while the bulk of recent liquidations have been long-side. Funding remains modestly negative. That combination suggests the forced selling has already occurred, yet fresh aggressive short positioning has not fully taken over. A further push lower would therefore need fresh spot or futures selling rather than another cascade of longs. The fundamental backdrop is not empty. LitVM’s LiteForge testnet migration to new infrastructure and the Foundation’s public note that mainnet is approaching keep the smart-contract narrative alive. That development could eventually improve demand for LTC as gas and settlement, but it is not yet translating into price support while the broader market is risk-off. Key levels that matter: Support / Defense: $47.7–48.1 — the zone that absorbed the latest flush and the lower Bollinger band region on the daily. Reclaim: $49.6–50.0 — recovery of the breakdown area that would start neutralizing the short-term bearish structure. Resistance: $50.4–51.0 — prior swing highs and the first meaningful supply. Major downside: $46.0–46.5 — next measured support if the current defense fails. Second-order observation: the market has already liquidated a large portion of the long leverage that was present at higher levels. If price can hold the $47.7–48.1 band while Bitcoin stabilizes, the absence of remaining long fuel reduces the probability of a cascade-style continuation lower and raises the odds of a range or short-covering bounce. Conversely, a clean break of that band with rising OI would signal that new shorts are in control. If $LTCUSDT holds $47.7–48.1 and reclaims $49.6–50.0 on expanding volume, the structure improves and $51.5–52 becomes the next area worth watching. If the defense fails and price closes below $47.7 with follow-through, the path opens toward the mid-$46s and the thesis shifts to waiting for a deeper base. Is the $49.6–50.0 reclaim the more important near-term signal, or does the still-bearish daily structure make another test of the $47.7 zone the higher-probability path while Bitcoin remains soft?
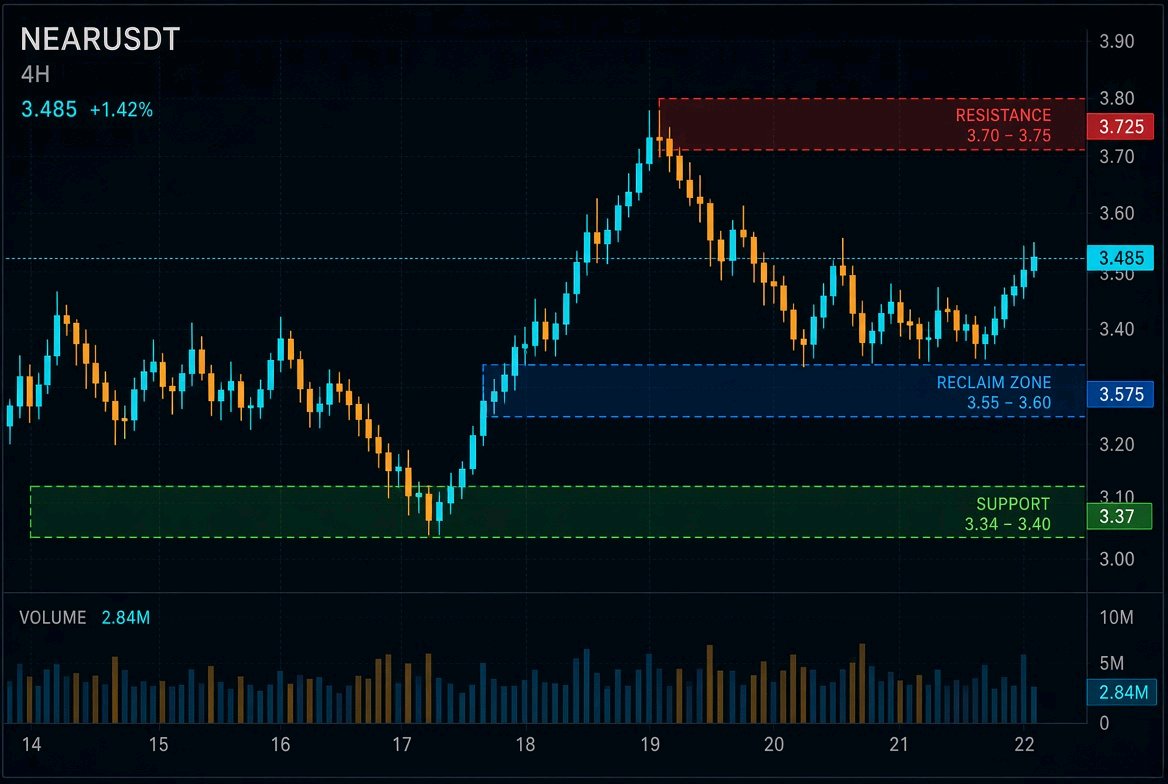
#ByXIMPACT $NEARUSDT Price is holding near $3.43 after slicing through the $3.50–3.60 zone that previously acted as support, while daily RSI sits in the mid-30s. The short-term bounce off the $3.27–3.34 lows looks more like short-covering than a structural reclaim. On the 4H the sequence of lower highs remains intact; each rally attempt has been sold into. The daily chart still shows a clear downtrend from the October peak near $6, with price now testing the lower end of the multi-week range. The $3.40 area is the immediate decision point—holding it keeps the recent base alive, losing it opens the path back toward the $3.20–3.25 cluster that marked the November 12 flush. Funding has stayed positive around +0.01% while open interest across major venues sits near $600M+. Longs continue to pay, and the last 24 hours of liquidations have been heavily skewed toward the long side. That combination usually means residual leverage is still leaning long even as price grinds lower. A further break of support would force those positions to exit into already thin demand. No single fundamental catalyst is driving the current tape; the broader market remains in risk-off mode with BTC dominance elevated and alt liquidity selective. NEAR’s own activity metrics have not offset the technical and positioning pressure. Key levels Support / defense: $3.34–3.40 (recent swing lows and the zone that absorbed the last flush) Reclaim: $3.55–3.60 (prior breakdown level; a 4H close back above would improve the short-term structure) Resistance: $3.70–3.75 (next supply shelf) Major downside: $3.20–3.25 (next liquidity pocket if $3.34 fails) If $3.40 holds and price reclaims $3.55 on rising volume, the immediate short bias softens and $3.70 becomes the next area to watch. If $3.34 breaks with acceleration in long liquidations, the thesis flips and $3.20–3.25 is the logical next magnet. Is the persistent positive funding more of a warning that another long flush is still possible, or does the $3.34 hold finally force shorts to cover?
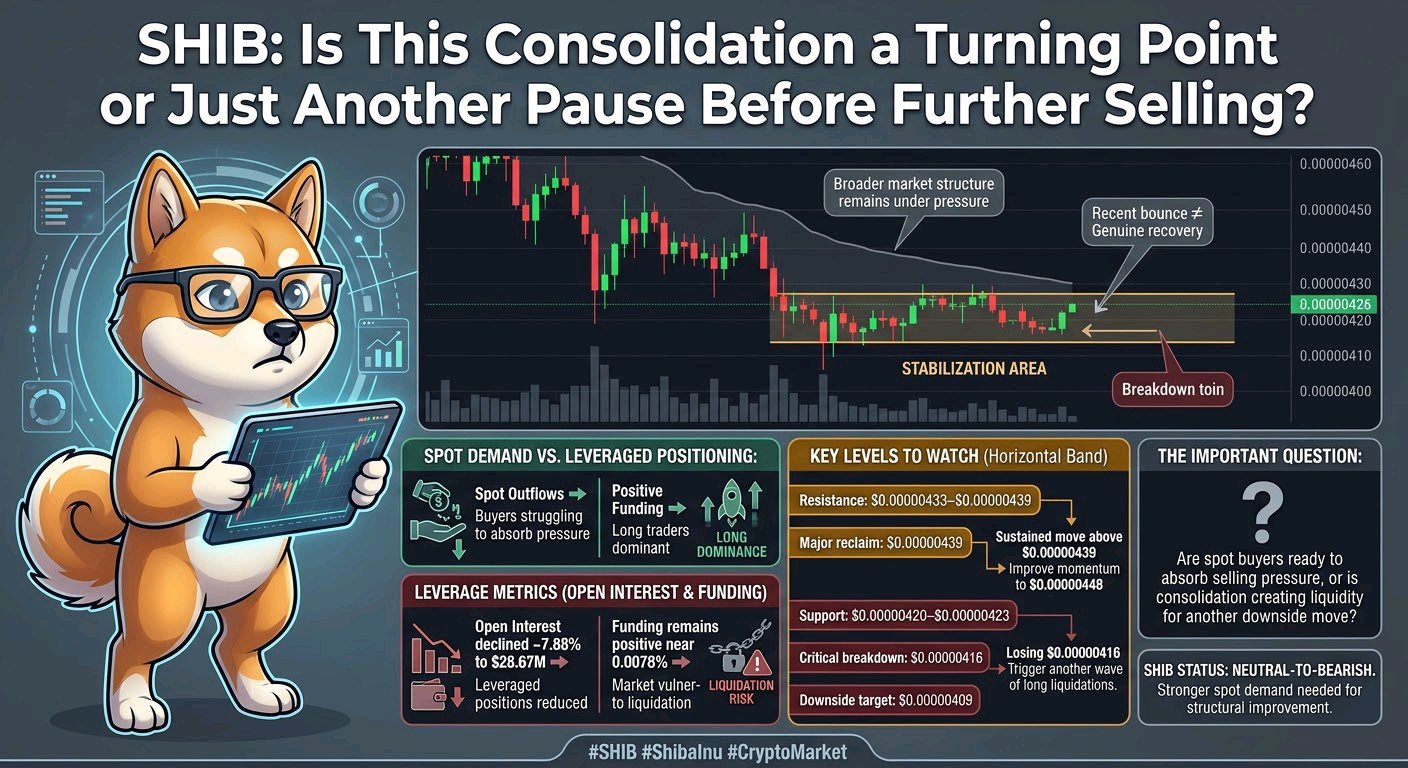
#ByXIMPACT $SHIBUSDT : Is This Consolidation a Turning Point or Just Another Pause Before Further Selling? SHIB is showing signs of short-term stabilization near $0.00000426, but the broader market structure remains under pressure. The recent bounce is not enough to confirm a genuine recovery. The biggest concern is the imbalance between spot demand and leveraged positioning. Spot outflows suggest buyers are still struggling to absorb selling pressure, while positive funding indicates that long traders remain dominant. Open interest has declined approximately 7.88% to $28.67M, suggesting leveraged positions are being reduced. Meanwhile, funding remains positive near 0.0078%, leaving the market vulnerable to another liquidation event. Key Levels to Watch: - Resistance: $0.00000433–$0.00000439 - Major reclaim: $0.00000439 - Support: $0.00000420–$0.00000423 - Critical breakdown: $0.00000416 - Downside target: $0.00000409 A sustained move above $0.00000439 could improve short-term momentum and open the door toward $0.00000448. However, losing $0.00000416 could trigger another wave of long liquidations. The important question is whether spot buyers are finally ready to absorb selling pressure, or whether this consolidation is simply creating liquidity for another downside move. For now, SHIB remains neutral-to-bearish until stronger spot demand confirms a structural improvement.
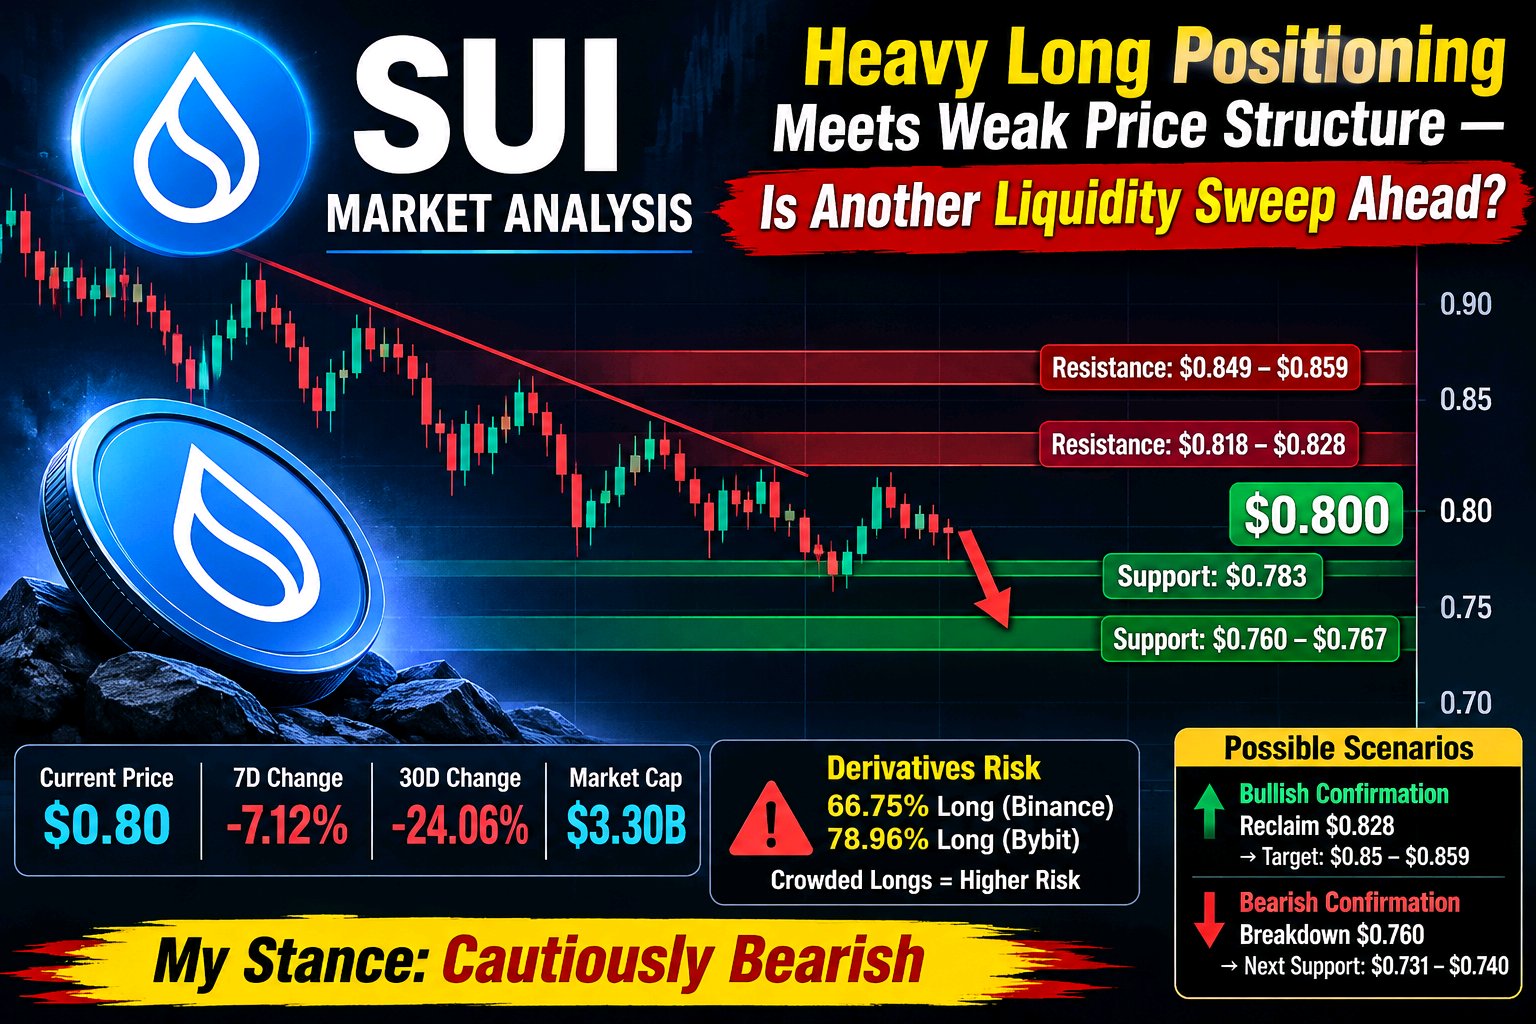
#ByXIMPACT $SUIUSDT is trading around $0.80, but the current price stability does not yet confirm a genuine recovery. The biggest concern is the imbalance in derivatives positioning. Around 66.75% of Binance accounts and 78.96% of Bybit accounts are positioned long. This creates potential downside vulnerability if buyers fail to defend key support levels. Key Levels to Watch: - Current Price: $0.80 - Resistance: $0.818–$0.828 - Major Resistance: $0.849–$0.859 - Support: $0.783 - Critical Support: $0.760–$0.767 Bullish Scenario: A strong reclaim of $0.828 could open the door toward $0.85–$0.859. Bearish Scenario: Losing $0.760 could trigger another liquidity sweep toward $0.731–$0.740. My outlook remains cautiously bearish until stronger spot demand confirms a reversal. The real question is simple: Are spot buyers ready to absorb selling pressure, or are crowded longs preparing for another liquidation event?
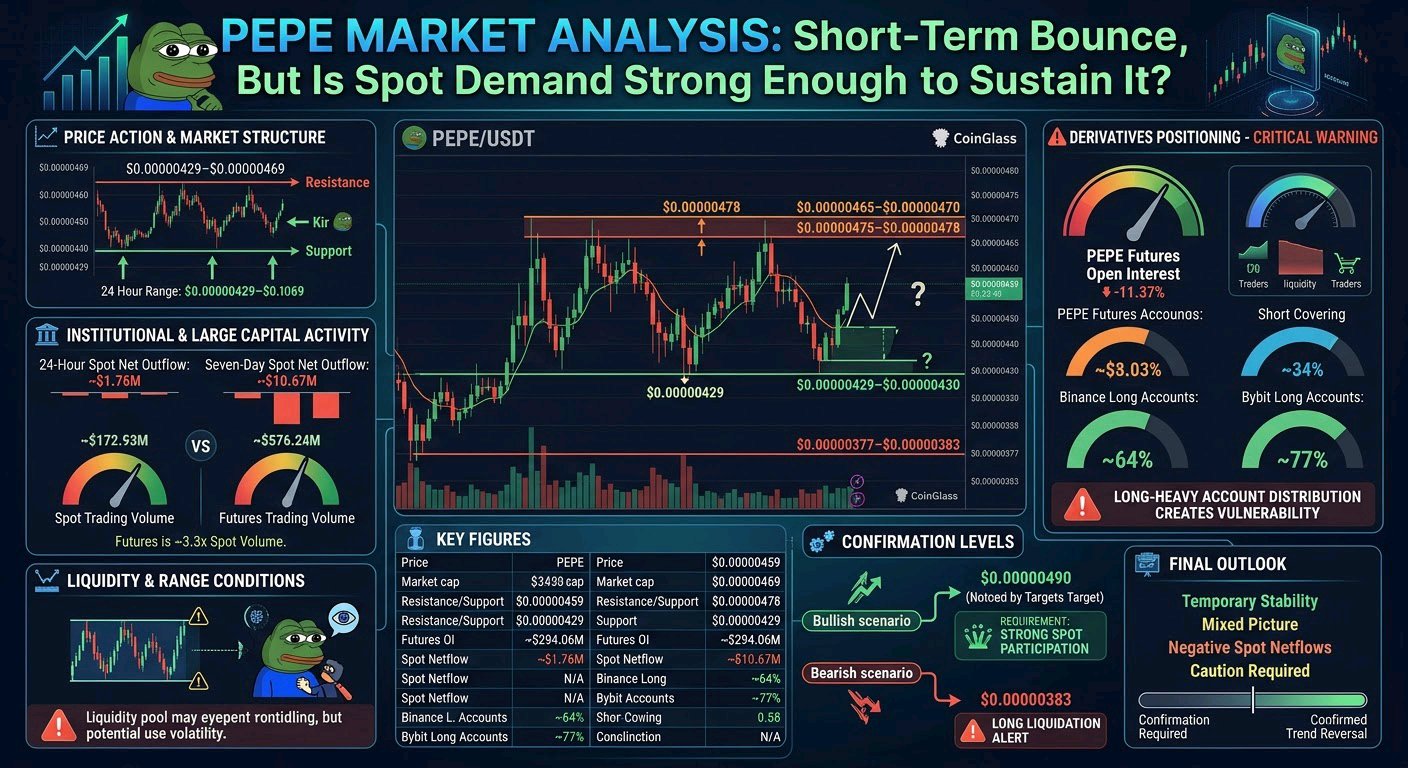
#ByXIMPACT $PEPEUSDT : A BOUNCE IS HAPPENING, BUT THE REAL RECOVERY IS STILL UNCONFIRMED! $PEPE is showing short-term strength after bouncing from $0.00000429 toward $0.00000459. However, the bigger picture still demands caution. Here’s what traders should watch: 📊 Key Resistance: - $0.00000465–$0.00000470 - $0.00000475–$0.00000478 🟢 Bullish Scenario: A strong 4H breakout above $0.00000478 could open the door toward $0.00000490–$0.00000495. 🔴 Bearish Scenario: Losing $0.00000429 could expose $0.00000383–$0.00000377, especially if leveraged longs start getting liquidated. ⚠️ What Concerns Me? - Spot outflows remain negative. - Futures open interest is down 11.37%. - Long positioning remains heavily concentrated. - Futures volume is significantly higher than spot volume. This suggests the current bounce may be driven partly by short covering rather than strong fresh spot demand. My Take: PEPE has momentum, but momentum alone doesn't confirm a trend reversal. I'm watching $0.00000478 closely. Until buyers reclaim that level with convincing spot volume, I remain cautious. Don't confuse a temporary bounce with a confirmed recovery.
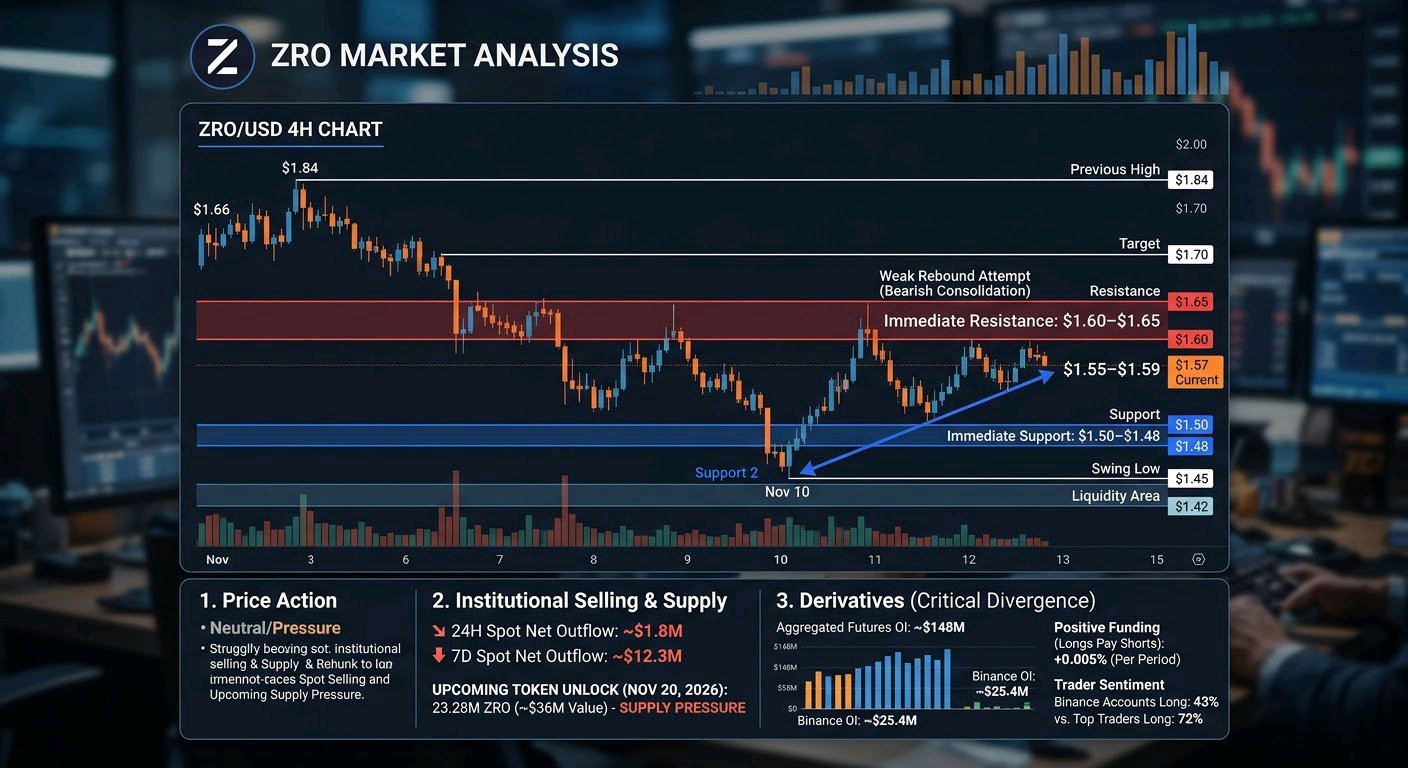
ZRO is trading around $1.55–$1.59, following a decline from the $1.66 area to a recent low near $1.45 on November 10. The subsequent rebound is worth watching, but I am not treating this consolidation as a confirmed recovery yet. The bigger concern is persistent spot selling, derivatives-driven activity, and an upcoming token unlock that could introduce additional supply. ZRO has recovered approximately 9% from its recent $1.45 low, but the broader short-term structure remains under pressure. * Current price: $1.55–$1.59 * Approximate market capitalization: $620M–$645M * Immediate resistance: $1.60–$1.65 * First support: $1.50–$1.48 * Recent swing low: $1.45 A sustained move above $1.65 would improve the short-term structure and potentially open the $1.70–$1.84 region. However, repeated rejection around resistance would keep the lower-high structure intact. CoinMarketCap +1 The spot market is showing an important warning signal. CoinGlass data indicates approximately: * $1.6M–$2M in 24-hour spot net outflows. * Approximately $12.3M in seven-day spot net outflows. * Around $85.6M in futures volume against $16.35M in spot volume. This means futures activity is significantly outweighing genuine spot participation. Futures buying alongside spot selling creates an unstable foundation for a recovery. Another concern is the upcoming November 20 token unlock, estimated at approximately 23.28M ZRO, worth around $36M at the quoted valuation. This represents an additional potential supply overhang. CoinGlass +1 ZRO is attempting to stabilize after its decline, but the $1.48–$1.65 region remains important. A narrow trading range following a sharp decline does not automatically indicate accumulation. It can also represent temporary equilibrium before another liquidity expansion. Stronger spot buying is necessary to absorb existing selling pressure. Without that confirmation, a return toward $1.48 and potentially $1.45 remains possible. Current derivatives data presents a mixed picture. * Aggregated futures open interest: approximately $148M. * Binance perpetual open interest: approximately $25.4M. * Funding rate: approximately +0.005% per period on Binance. * Aggregated funding: approximately +0.0068% per 8 hours. * Binance accounts long: approximately 43%. * Top traders' positions: approximately 72% long by size. This distinction matters. The broader account distribution is not overwhelmingly long, but larger trader positions are considerably more long-tilted. Positive funding means longs are paying shorts. If support breaks while larger leveraged positions remain exposed, another round of long liquidations could accelerate downside volatility. Seandra AI +1 | Metric | Level | | ------------------------ | ------------ | | Current price area | $1.55–$1.59 | | Market cap | $620M–$645M | | Immediate resistance | $1.60–$1.65 | | First support | $1.50–$1.48 | | Recent low | $1.45 | | Aggregated futures OI | ~$148M | | Binance OI | ~$25.4M | | Binance funding | +0.005% | | Binance accounts long | 43% | | Top traders long by size | 72% | | Upcoming unlock | Nov 20, 2026 | Bullish confirmation: A sustained reclaim above $1.65 with increasing spot volume would be the first meaningful improvement. That could open a move toward $1.70 and subsequently $1.84. Bearish confirmation: A decisive breakdown below $1.48 would expose the recent $1.45 low. Losing that level could bring the $1.42 liquidity area into focus. ZRO is showing temporary stability, but the underlying evidence does not yet establish a sustainable recovery. Negative spot flows, futures-heavy participation, concentrated larger-trader long exposure, and the upcoming token unlock remain competing pressures. The decisive question is whether genuine spot buyers return and absorb selling while leverage stays controlled, or whether another support breakdown triggers fresh long liquidations. For now, ZRO remains neutral-to-bearish until $1.65 is convincingly reclaimed. #ByXIMPACT $ZROUSDT
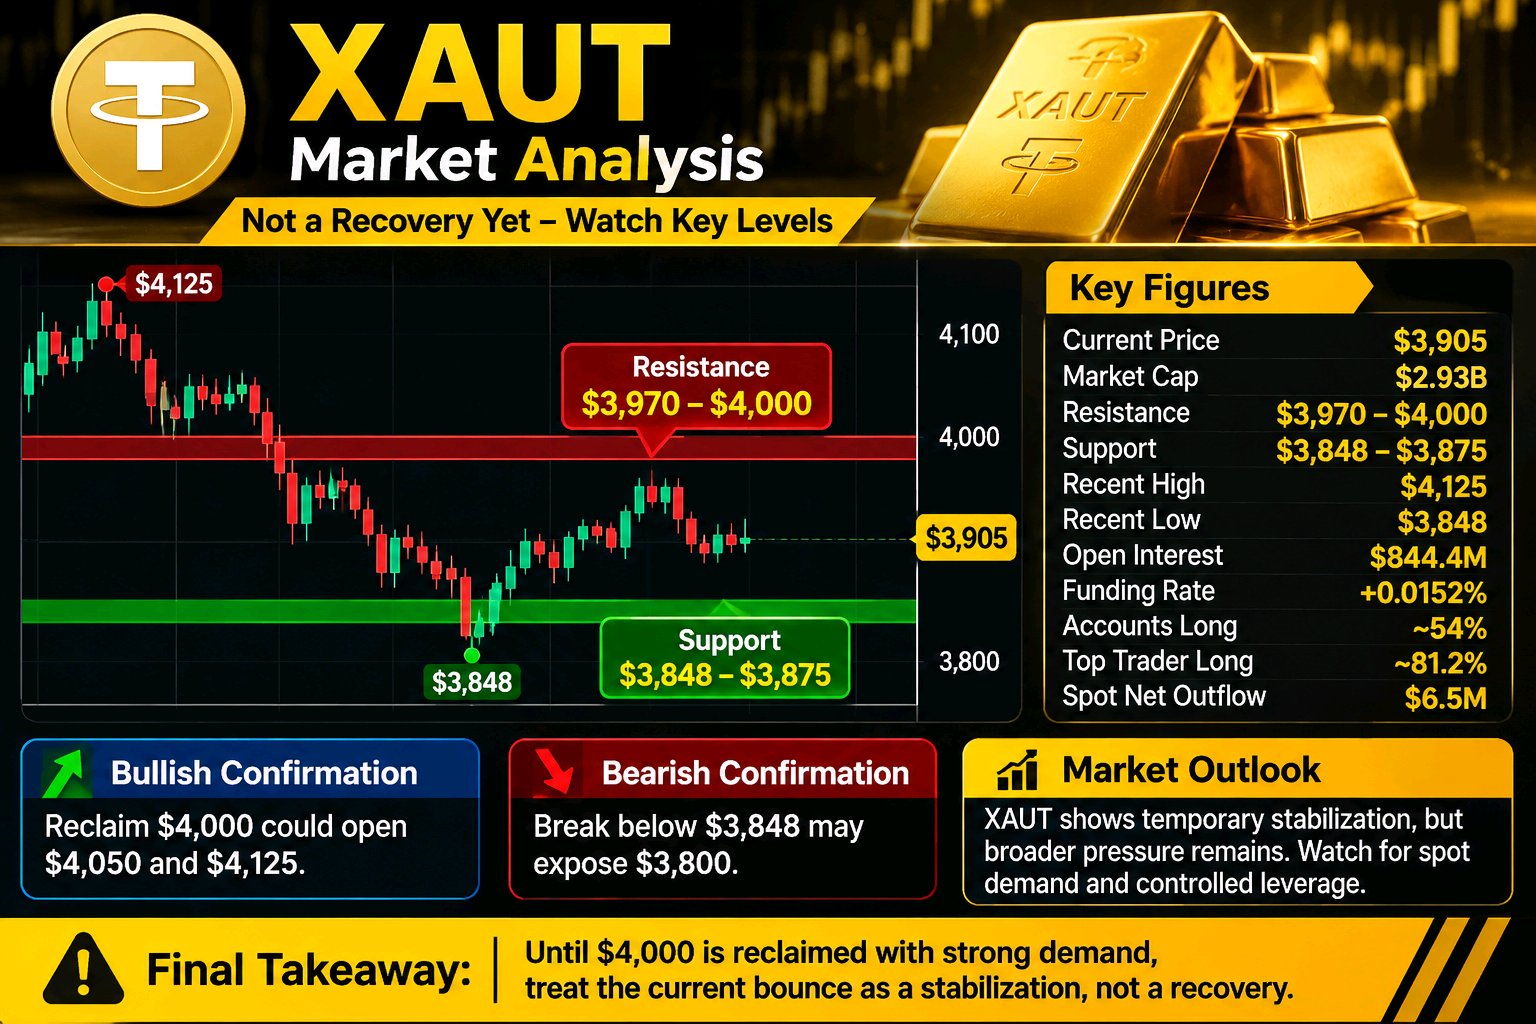
#ByXIMPACT $XAUTUSDT is trading around $3,905, following a decline from the $4,125 area toward a recent low near $3,848. The latest bounce is not yet convincing enough to call a recovery. The bigger concern is continued selling pressure in spot markets while derivatives positioning remains tilted toward leveraged longs, creating the possibility of another downside liquidity sweep. XAUT has declined approximately 3.5% over seven days and around 6.7% from its recent $4,125 high to the $3,848 low. Market capitalization is approximately $2.93 billion. The immediate resistance zone sits at $3,970–$4,000, while initial support remains around $3,848–$3,875. A sustained reclaim of $4,000 would improve the short-term structure and potentially open a move toward $4,050 and $4,125. However, the broader 30-day and 90-day trends remain negative, so one recovery attempt is not enough to establish a trend reversal. XAUT's market structure requires a different institutional-flow perspective because it is backed by physical gold rather than being a conventional ETF. The latest derivatives and flow snapshot shows approximately: * Spot net outflows: $6.5 million. * Futures net outflows: $15.7 million. * Open interest increased approximately 5.74% despite negative price performance. This combination suggests that capital positioning is expanding without convincing spot demand supporting the price. One positive fundamental development is Tether Gold's November 12 announcement of a completed KPMG audit. The audit covered allocated gold backing worth approximately $2.246 billion at December 31, 2025. This improves reserve transparency but does not independently confirm fresh market demand. Tether +2 The $3,848–$4,000 area is becoming an important short-term trading range following the rejection near $4,125. A narrow range after a decline should not automatically be interpreted as accumulation. The market needs stronger spot buying and sustained volume to demonstrate that buyers are absorbing available supply. A breakdown below $3,848 could expose the psychological $3,800 level. Derivatives remain an important source of risk. * Open Interest: Approximately $844.4 million. * OI change: +5.74%. * Funding rate: +0.0152% per 8 hours. * Futures volume: Approximately $560 million. * 24-hour liquidations: Approximately $1.01 million. * Long liquidation share: Approximately 97%. A separate exchange-positioning snapshot shows roughly 54% of accounts holding longs, while top traders hold approximately 81.2% long exposure by position size. Positive funding means long positions are paying shorts. Combined with elevated open interest and substantial long liquidations, this creates vulnerability if support fails. CoinGlass +1 | Metric | Level | | ------------------------- | ------------- | | Current price | $3,905 | | Market cap | $2.93B | | Resistance | $3,970–$4,000 | | Support | $3,848–$3,875 | | Recent high | $4,125 | | Recent low | $3,848 | | Open interest | $844.4M | | Funding | +0.0152% | | Accounts long | ~54% | | Top trader positions long | ~81.2% | | Spot net outflow | $6.5M | Bullish confirmation: A sustained reclaim of $4,000 would improve market structure, potentially opening $4,050 and $4,125. Strong spot volume and declining leverage would make this move more credible. Bearish confirmation: A decisive 4-hour breakdown below $3,848 would expose $3,800. Continued negative spot flows and elevated long exposure could accelerate the move through fresh long liquidations. XAUT is showing temporary stabilization, but the broader structure remains under pressure. Recent reserve-audit progress improves fundamental transparency, yet token-market outflows and increasingly leveraged positioning remain important concerns. The decisive question is whether genuine spot buyers return and absorb selling pressure while derivatives leverage remains controlled, or whether another support breakdown triggers fresh long liquidations. Until $4,000 is reclaimed with convincing spot demand, the current bounce should be treated as a stabilization attempt rather than a confirmed recovery.
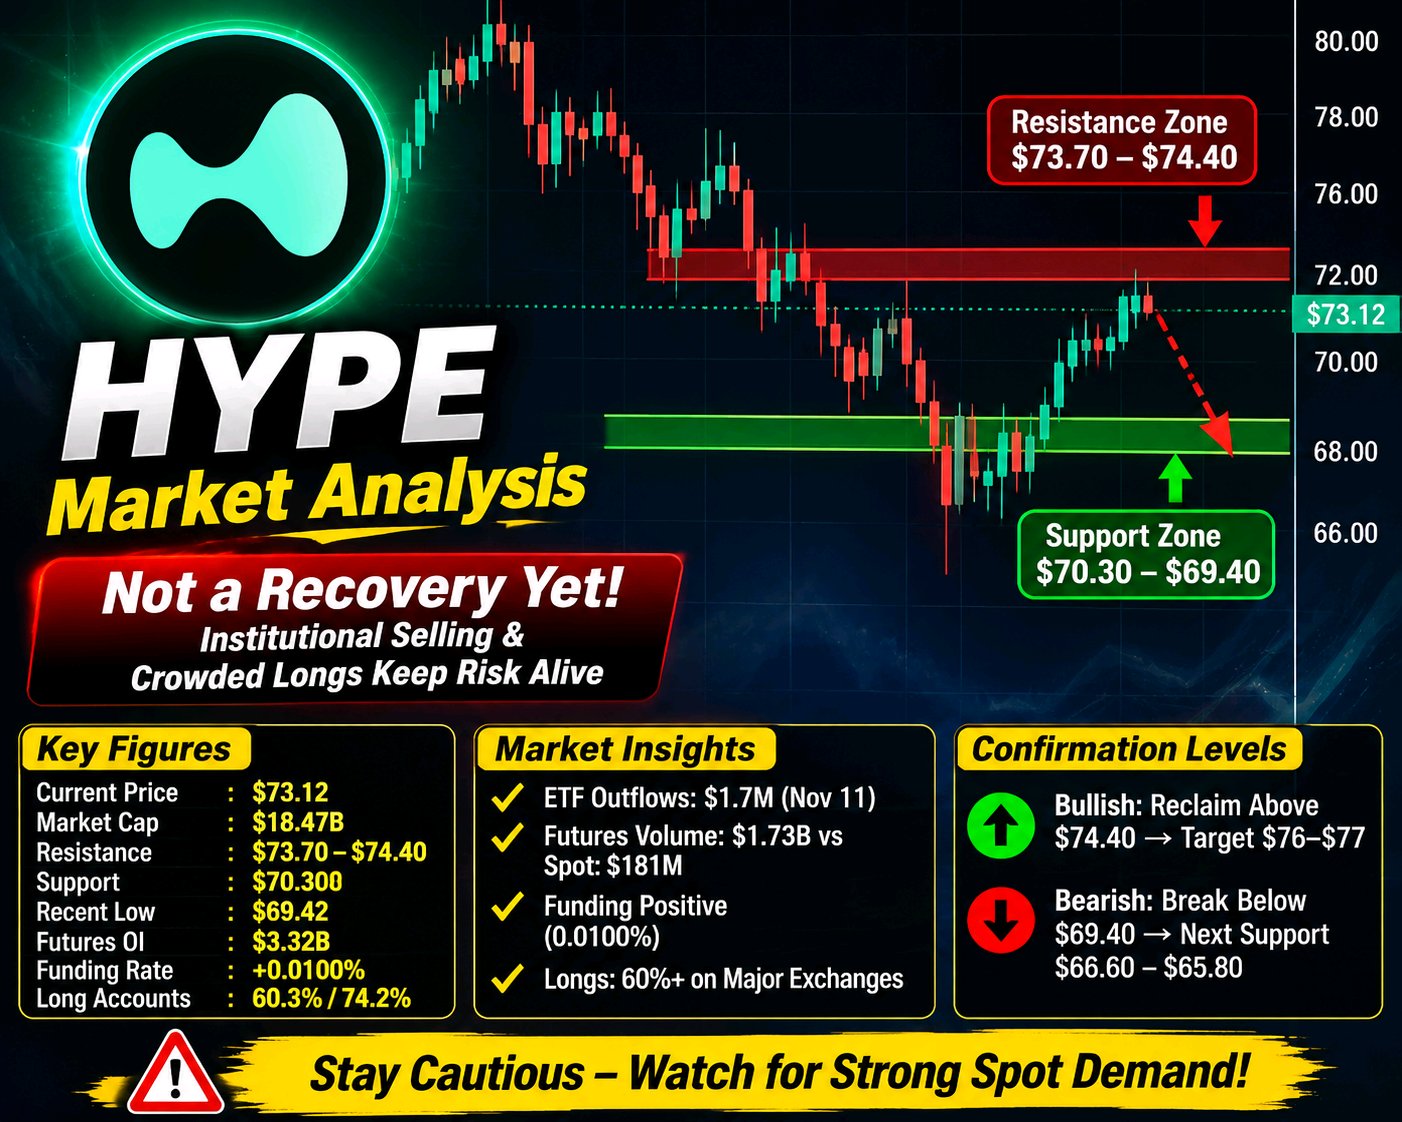
#ByXIMPACT $HYPEUSDT is trading around $73.12, attempting to stabilize after testing a recent low near $69.42. The bounce is not yet a confirmed recovery. The broader concern remains institutional outflows, weak spot participation and derivatives positioning that still carries meaningful downside risk. HYPE has recovered approximately 5.3% from its recent low but remains down roughly 6.8% over seven days and around 25% below its September all-time high. Market capitalization is approximately $18.47 billion. The immediate resistance zone sits at $73.70–$74.40, while initial support is concentrated around $70.30–$69.40. A sustained reclaim above $74.40 would improve the short-term structure and potentially open a move toward $76–$77. However, the 4H and daily technical outlooks remain bearish. Demand remains inconsistent. HYPE spot ETFs recorded approximately $1.7 million in net outflows on November 11, although that figure was still based on partial reporting. Across the previous 30 trading days, reported ETF flows showed approximately $60.6 million in net outflows. Tracked large wallets also show a cautious stance: one seven-day dataset recorded $37.2 million in HYPE distribution against only $1.6 million in accumulation, alongside $12.1 million in additional short positioning. These figures do not establish that every large investor is selling, but they do not provide strong evidence of sustained accumulation either. HYPE is attempting to hold above the $70–$73 region following its recent decline. However, 24-hour futures volume is approximately $1.73 billion, compared with roughly $181 million in spot volume. Futures activity is therefore substantially higher than direct spot participation. A narrow trading range following a sharp decline should not automatically be interpreted as accumulation. Stronger spot demand is needed to absorb available supply and establish a more durable floor. Total tracked futures open interest is approximately $3.32 billion, up around 2.74% over 24 hours. Funding remains positive near 0.0100%, equivalent to roughly 10.9% annualized. Account positioning is particularly important: * Binance: approximately 60.3% long. * Bybit: approximately 74.2% long. * 24-hour liquidations: approximately $7.04 million. * Long liquidations: approximately $6.87 million. Tracked high-value Hyperliquid wallets show a different picture, with approximately $649 million in shorts against $522 million in longs. This divergence suggests that ordinary exchange accounts remain long-leaning while tracked large wallets are more defensive. If support breaks, crowded long exposure could create another liquidation-driven decline. * Current price: $73.12 * Market capitalization: $18.47B * Immediate resistance: $73.70–$74.40 * First support: $70.30 * Recent low: $69.42 * Next downside support: $66.60–$65.80 * Futures open interest: $3.32B * Funding rate: +0.0100% * Long accounts: 60.3% Binance / 74.2% Bybit * ETF net outflow: $1.7M on November 11 (partial reporting) Bullish confirmation: A sustained reclaim above $74.40 would weaken immediate bearish pressure and open the possibility of a move toward $76–$77. Stronger confirmation requires rising spot participation and controlled open interest. Bearish confirmation: A decisive breakdown below $69.40 would expose the $66.60–$65.80 region, where additional long liquidations could intensify selling pressure. HYPE is showing temporary stability, but stability alone is not evidence of a trend reversal. ETF outflows, tracked whale distribution and elevated leveraged positioning remain important risks. The decisive question is whether spot buyers return strongly enough to absorb selling pressure while leverage remains controlled, or whether another support breakdown triggers fresh long liquidations. Until that becomes clear, the recovery attempt deserves caution rather than bullish conviction.
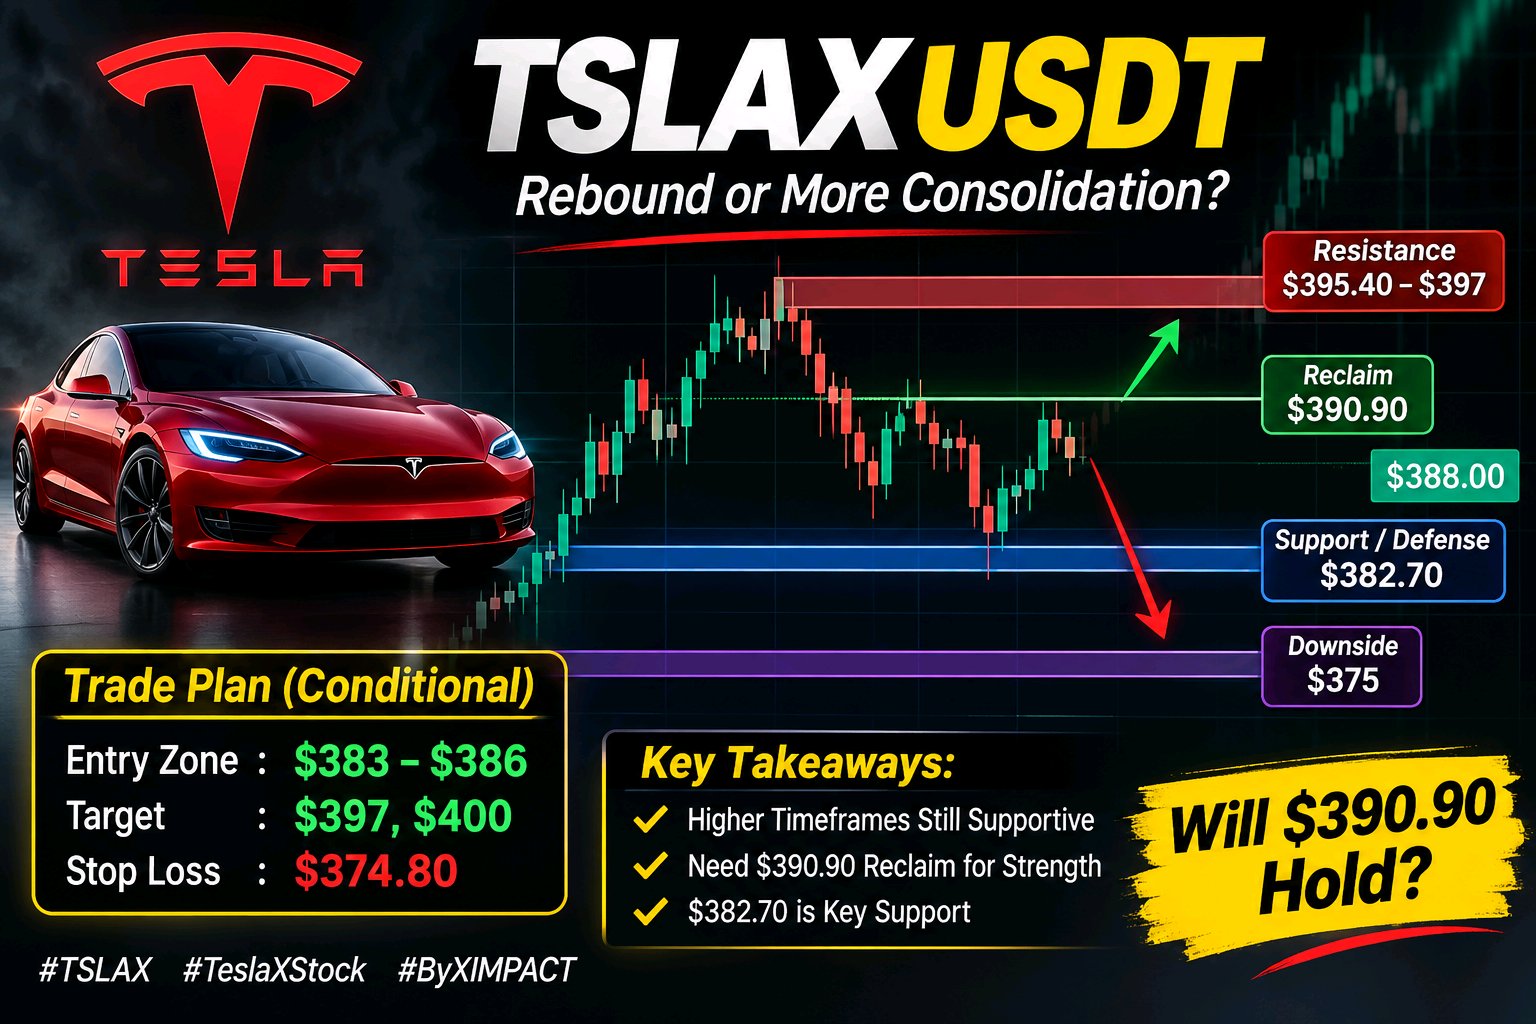
#ByXIMPACT $TSLAXUSDT is showing an interesting disconnect: the higher timeframes support the rebound, but price still needs to prove it can hold above the next resistance zone. TSLAX is trading around $388, up approximately 0.3% over 24 hours, with a recent range of $384.65–$394.71. Tesla shares closed November 11 at $390.84 after gaining 2.91%, but TSLAX is still struggling to establish acceptance above that reference level. CoinGecko +1 The timeframe picture is mixed. The 15-minute reading is neutral, while 1H, 4H and Daily signals lean bullish. Weekly remains bearish. Daily RSI around 54 also suggests positive but not overheated momentum. This looks more like an intermediate rebound facing short-term consolidation than a confirmed long-term trend reversal. FXEmpire +1 Trade thesis: I would avoid chasing price here. A conditional long becomes more interesting if $383–$386 holds and buyers reclaim $390.90. Entry zone: $383–$386 Target: $397, with $400 as the next extension Invalidation/SL: $374.80 Key levels: * Support/Defense: $382.70 — important daily support. * Reclaim: $390.90 — previous close and daily pivot. * Resistance: $395.40–$397 — recent high and resistance cluster. * Downside: $375 — next meaningful support if the defense fails. COINOTAG +1 Aggregated TSLAX perpetual open interest is around $977K, just 1.4% of market cap, while funding is slightly positive at 0.0061%. That suggests some long positioning, but not an obviously crowded leverage trade. CoinGecko One catalyst worth watching is Finland's provisional approval of Tesla Assisted Driving. It supports Tesla's European software-expansion narrative, although EU-wide approval is still unresolved. Reuters The overlooked detail: TSLAX tracks Tesla's underlying share price. Actual TSLA demand and Nasdaq trading conditions matter more here than a Bitcoin-led altcoin move. Backed Assets If $382.70 holds and $390.90 is reclaimed, $397–$400 becomes relevant. Lose support, and $375 comes back into focus. Would you prioritize a confirmed $390.90 reclaim, or wait for buyers to prove themselves around $382.70 first?
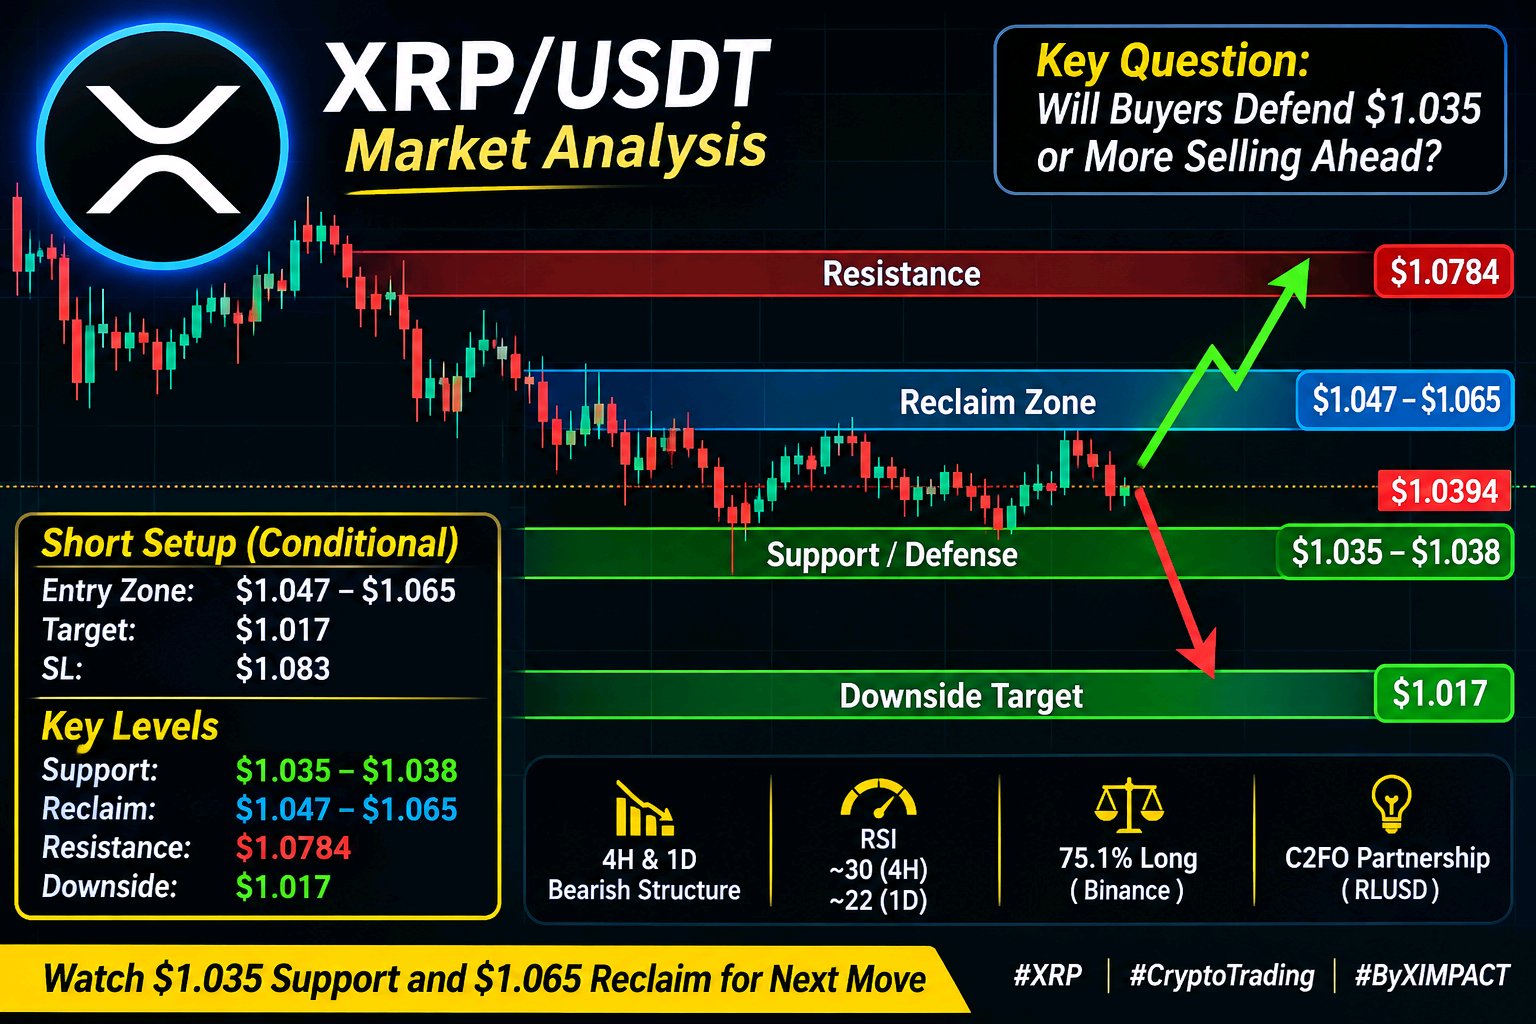
#ByXIMPACT $XRPUSDT is approaching a critical support area, but the current price action still looks more like selling pressure than a genuine recovery. XRP is trading around $1.0394, down approximately 1.77% over 24 hours, with the latest Binance perpetual range between $1.0352 and $1.0805. The short-term picture remains weak. Both 1H and 4H taker-flow readings show strong selling pressure. On the higher timeframes, the 4H and daily structures remain bearish. RSI is around 30.1 on 4H and 22.5 on the daily chart. This signals an oversold market, but oversold conditions alone do not confirm a reversal. My preferred approach is to avoid chasing shorts directly into support. I would rather watch for a weak recovery followed by rejection. Conditional short setup: Entry zone: $1.047–$1.065 Target: $1.017 Invalidation: $1.083 Key levels: Support/Defense: $1.035–$1.038. This area is close to the current 24H low. Reclaim: $1.047–$1.065. Holding above this region would improve short-term structure. Resistance: $1.0784. A reclaim would challenge the bearish setup. Downside: $1.017. This is the next important support area if current defense fails. Derivatives positioning adds another concern. Around 75.1% of Binance XRP perpetual accounts are long, while funding remains positive at 0.0096% per eight hours. That means long holders are still paying shorts despite aggressive selling. Another downside move could force additional long-position unwinding. There is also a fundamental detail worth separating from price action. Ripple's recent C2FO partnership brings trade-finance settlement onto XRPL using RLUSD. That supports ecosystem activity, but RLUSD settlement does not automatically translate into immediate spot demand for XRP. Bitcoin and Ethereum weakness are adding pressure to the broader market. If XRP defends $1.035 and reclaims $1.065–$1.078, I would reconsider the bearish view. A clean breakdown below $1.035 puts $1.017 back in focus. Will buyers defend $1.035 before leveraged long positioning creates another wave of selling?
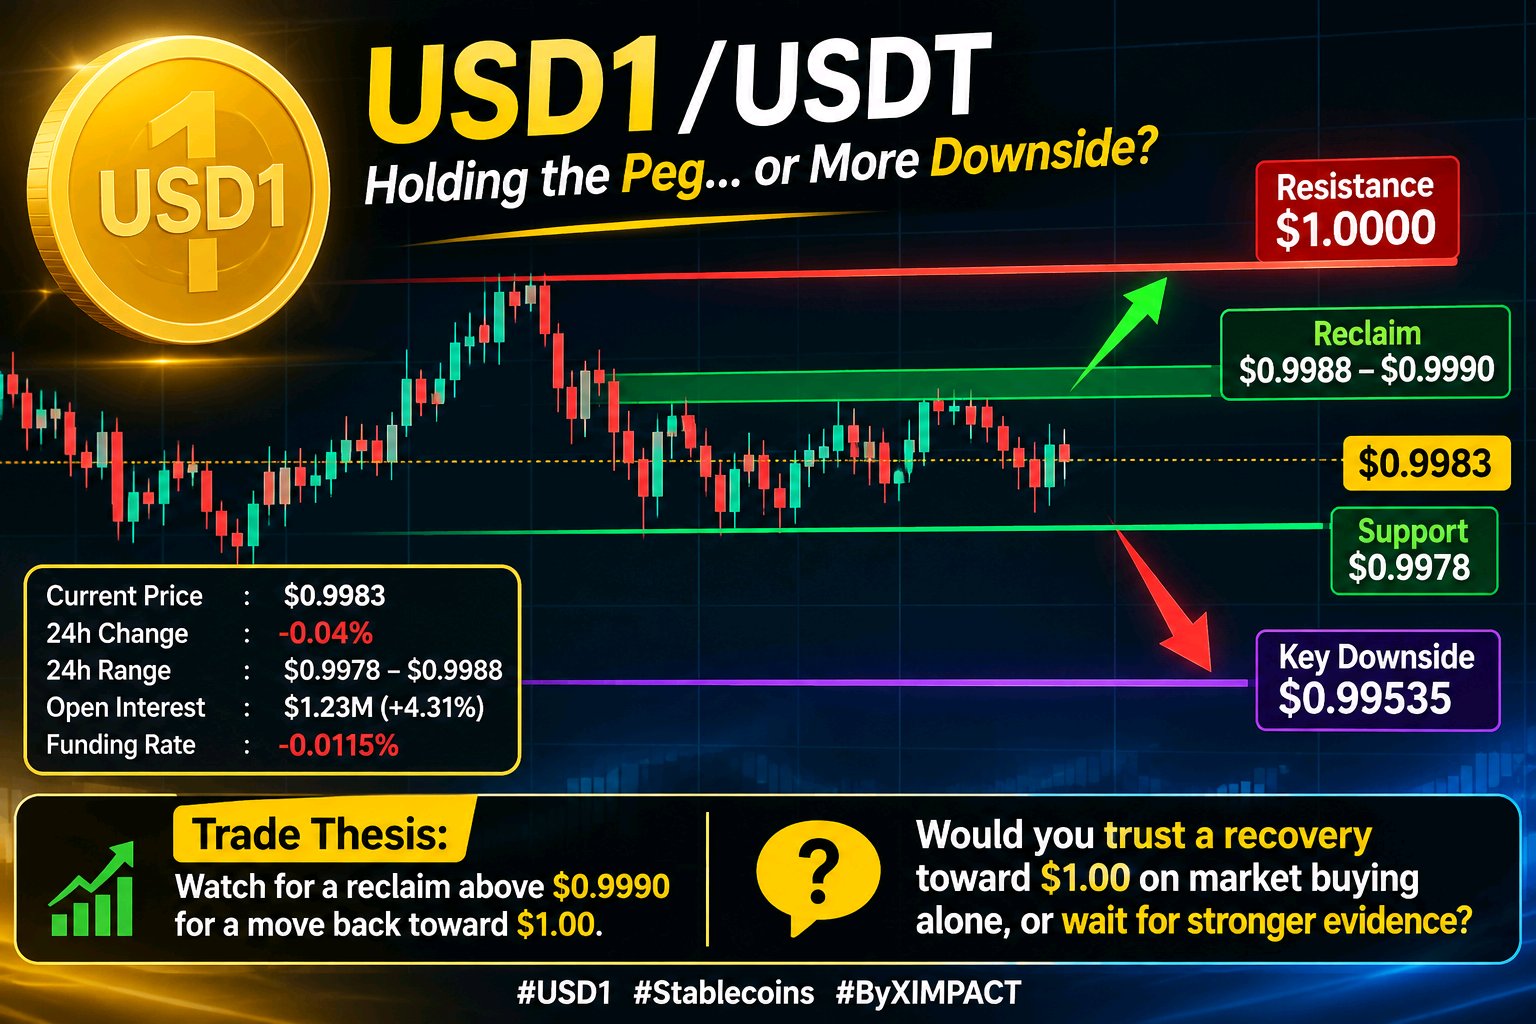
#ByXIMPACT $USD1USDT is showing a small discount to its dollar peg, but the important detail is that the market has not yet produced a convincing recovery toward $1.00. USD1 is trading near $0.9983, down approximately 0.04% over 24 hours. Its observed daily range is $0.9978–$0.9988. The 1H chart shows a modest 0.02% uptick, while the 4H move remains flat. The broader 7-day structure is also nearly unchanged. This looks more like a tight peg-retest than a conventional breakout or breakdown. Reliable 15M data was not available, so I would avoid reading too much into microstructure. CoinGlass +1 My trade thesis: I would not force a leveraged long or short here. The more relevant opportunity is a conditional spot peg-recovery setup, provided liquidity and redemption access are understood. Key levels * Support / Defense: $0.9978 — the recent 24H low; losing it would expose the weaker weekly range. * Reclaim: $0.9988–$0.9990 — clearing this area would indicate buyers are pushing the discount narrower. * Resistance: $1.0000 — the actual dollar peg, not an arbitrary chart target. * Downside reference: $0.99535 — the recent 7-day low, relevant if selling pressure expands. CoinGlass +1 Derivatives positioning: Open Interest is around $1.23M, up 4.31%, while funding is negative at -0.0115%. Positions are building despite limited price movement, but derivatives activity is small relative to spot trading. I would not interpret this as a strong directional signal. CoinGlass One overlooked factor is the connection between USD1 reserves and the wider World Liberty Financial ecosystem. Its November 6 buyback announcement said reserve revenue could potentially help fund WLFI purchases. That may matter for the issuer's economics, but it does not automatically create additional USD1 demand or guarantee peg stability. Reuters BitGo lists monthly reserve attestations through September 2026, making continued transparency an important factor to monitor. BitGo If USD1 holds $0.9978 and reclaims $0.9990, a move back toward parity becomes more plausible. If the lower boundary breaks, I would watch $0.99535 rather than assume an immediate recovery. Would you trust a recovery toward $1.00 on market buying alone, or wait for stronger evidence of redemption and reserve confidence?