Marco
20503Me gusta0Compartir en el chat418Aficionados1Seguir
Professional Trader | Technical Analyst | Risk Management Focused | Helping traders navigate the markets through disciplined strategies and data-driven decision
Professional Trader | Technical Analyst | Risk Management Focused | Helping traders navigate the markets through disciplined strategies and data-driven decision
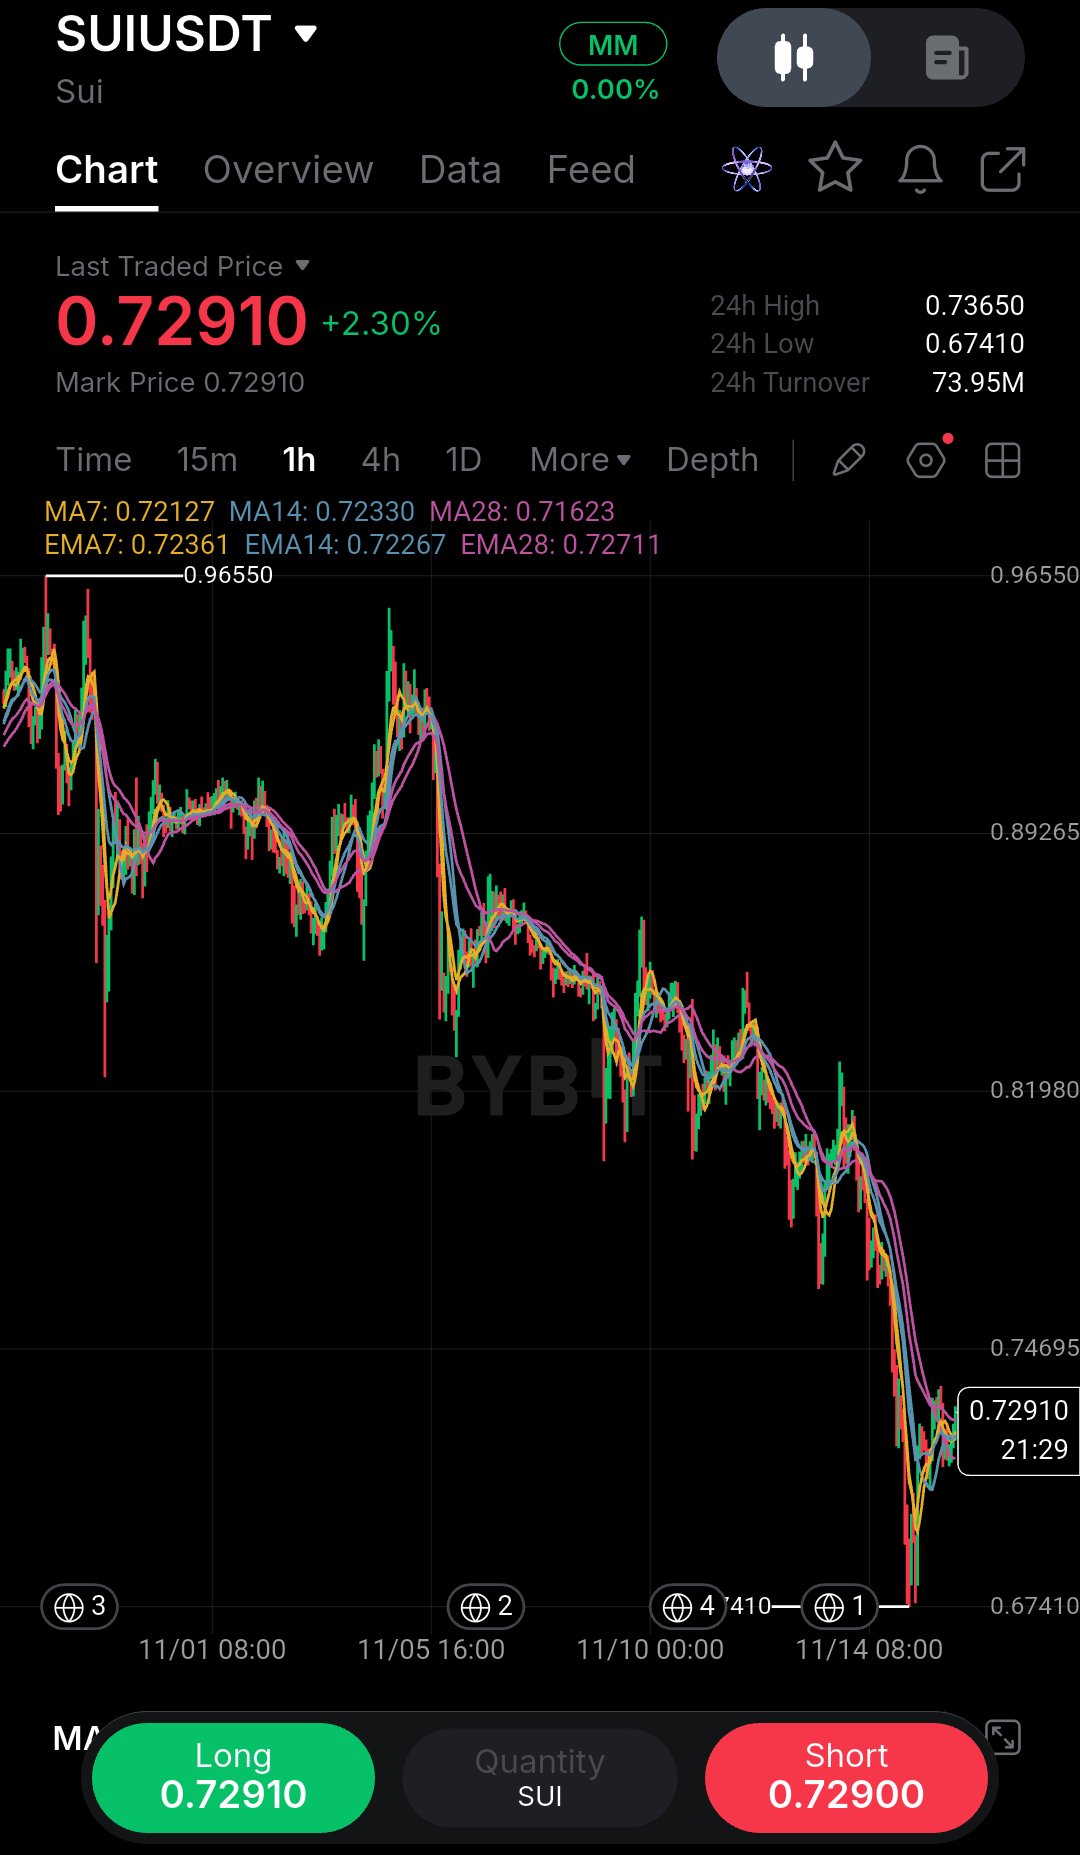
Casi ignoro esta gráfica de SUI hasta que noté cómo el precio estaba interactuando con los promedios móviles en el lado derecho. Mirando el marco temporal de 1 hora, la tendencia macro tuvo una caída fuerte desde el pico de 0.96550 hasta el mínimo de 0.67410. Pero haz zoom en la acción reciente del precio. La venta agresiva se estancó y hemos visto una recuperación fuerte y agresiva en forma de V que empujó el precio de vuelta hasta 0.72910 (+2.30%). Aquí está el detalle crítico: el precio se está negociando actualmente justo por encima de un clúster de promedios móviles desplegado. La MA7 (0.72127), la MA14 (0.72330) y la MA28 (0.71623) están actuando como soporte dinámico debajo de nosotros. Este es un cambio estructural de libro de texto. Cuando una tendencia bajista deja de hacer mínimos más bajos y el precio reclama agresivamente sus promedios móviles, señala que los vendedores están agotados. Sin embargo, estamos probando una zona de resistencia local, así que esto es un rebote táctico, no una reversión completa todavía. Una lección que he aprendido de intentar atrapar cuchillos cayendo es que no compras el fondo; compras la confirmación de un cambio de estructura. Plan de Trading: Sesgo: Alcista a corto plazo (Operando la recuperación). Zona de entrada: 0.7200 – 0.7250 (Buscando un ligero retroceso para volver a probar el clúster de MA). Stop Loss: 0.6740 (Justo por debajo del mínimo local reciente). Objetivo 1: 0.7365 (Máximo de 24h y resistencia inmediata). Objetivo 2: 0.8198 (Resistencia macro de rango medio). Objetivo 3: 0.8926 (Nivel de ruptura anterior). Riesgo/Recompensa: 1:2.5 Invalidación: Un cierre de vela de 1H por debajo de 0.7100, lo que señalaría una pérdida del soporte de la tendencia alcista local. No entres por FOMO a la mitad de este movimiento errático. Espera a que la vela horaria cierre fuerte, respeta tu stop loss y nunca arriesgues más de lo que puedes permitirte perder. ¿Crees que SUI finalmente está listo para un rally de alivio, o es solo una pausa antes de la siguiente pierna bajista? $SUIUSDT #ByXIMPACT
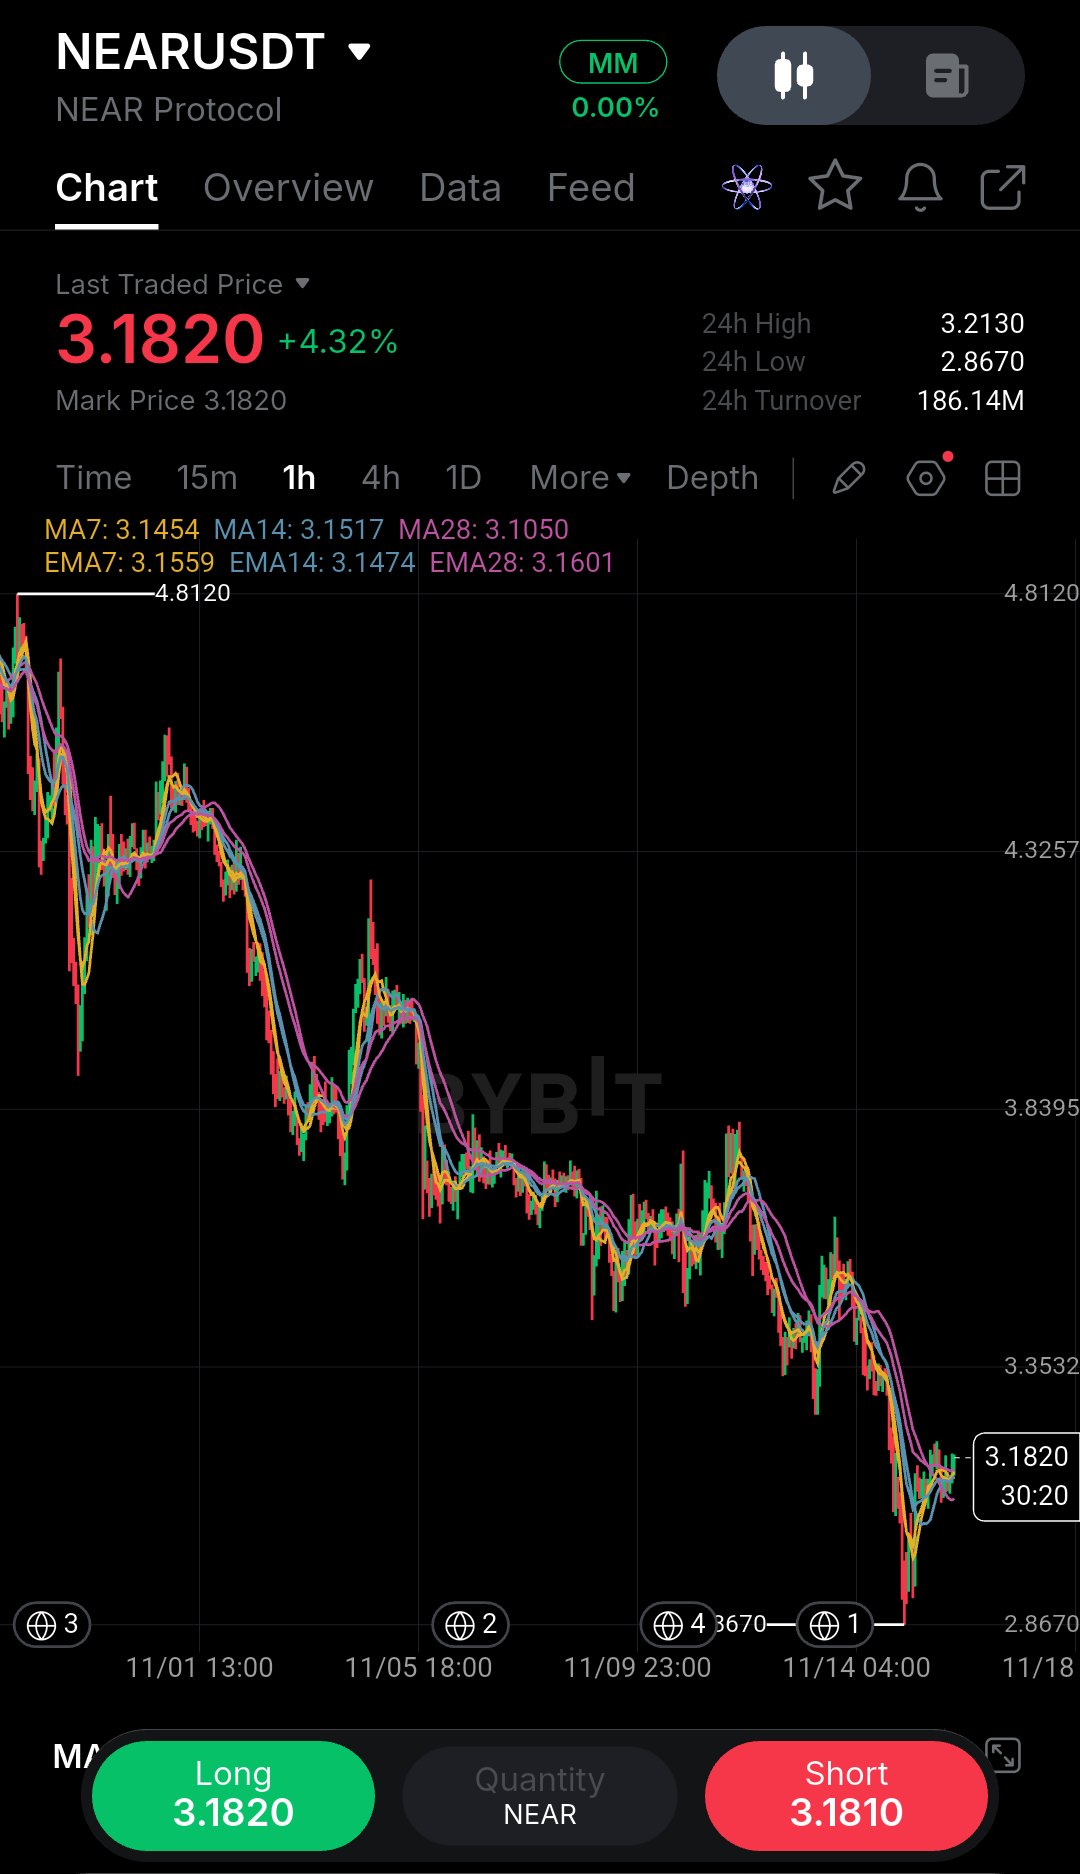
Casi ignoro este gráfico de NEAR hasta que noté cómo el precio estaba interactuando con las medias móviles en el lado derecho. Al ver la temporalidad de 1 hora, la tendencia macro tuvo un fuerte sangrado desde el pico de 4.8120 hasta el mínimo de 2.8670. Pero haz zoom en la acción del precio reciente. Las ventas agresivas se estancaron y hemos visto una recuperación fuerte y agresiva en forma de V que empujó el precio de regreso a 3.1820 (+4.32%). Aquí está el detalle crítico: el precio se está negociando actualmente justo por encima de un clúster de medias móviles abiertas. La MA7 (3.1454), la MA14 (3.1517) y la MA28 (3.1050) están actuando todas como soporte dinámico debajo de nosotros. Este es un cambio estructural de libro de texto. Cuando una tendencia bajista deja de hacer mínimos más bajos y el precio recupera agresivamente sus medias móviles, es señal de que los vendedores están agotados. Sin embargo, estamos probando una zona de resistencia local, así que esto es un rebote táctico, no una reversión completa todavía. Una lección que he aprendido de intentar atrapar cuchillos cayendo es que no compras el fondo; compras la confirmación de un cambio de estructura. Plan de Trading: Sesgo: Alcista a corto plazo (Operando la recuperación). Zona de entrada: 3.1000 – 3.1500 (Buscando un ligero retroceso para volver a probar el clúster de MA). Stop Loss: 2.8670 (Justo debajo del reciente mínimo local). Objetivo 1: 3.2130 (Máximo de 24h y resistencia inmediata). Objetivo 2: 3.3532 (Resistencia macro de rango medio). Objetivo 3: 3.8395 (Nivel de ruptura anterior). Riesgo/Recompensa: 1:2.5 Invalidación: Un cierre de vela de 1H por debajo de 3.0000, lo que señalaría una pérdida del soporte de la tendencia alcista local. No hagas FOMO en medio de este movimiento errático. Espera a que la vela de una hora cierre fuerte, respeta tu stop loss y nunca arriesgues más de lo que puedes permitirte perder. ¿Crees que NEAR finalmente está lista para un rally de alivio, o es solo una pausa antes del siguiente tramo a la baja? $NEARUSDT #ByXIMPACT
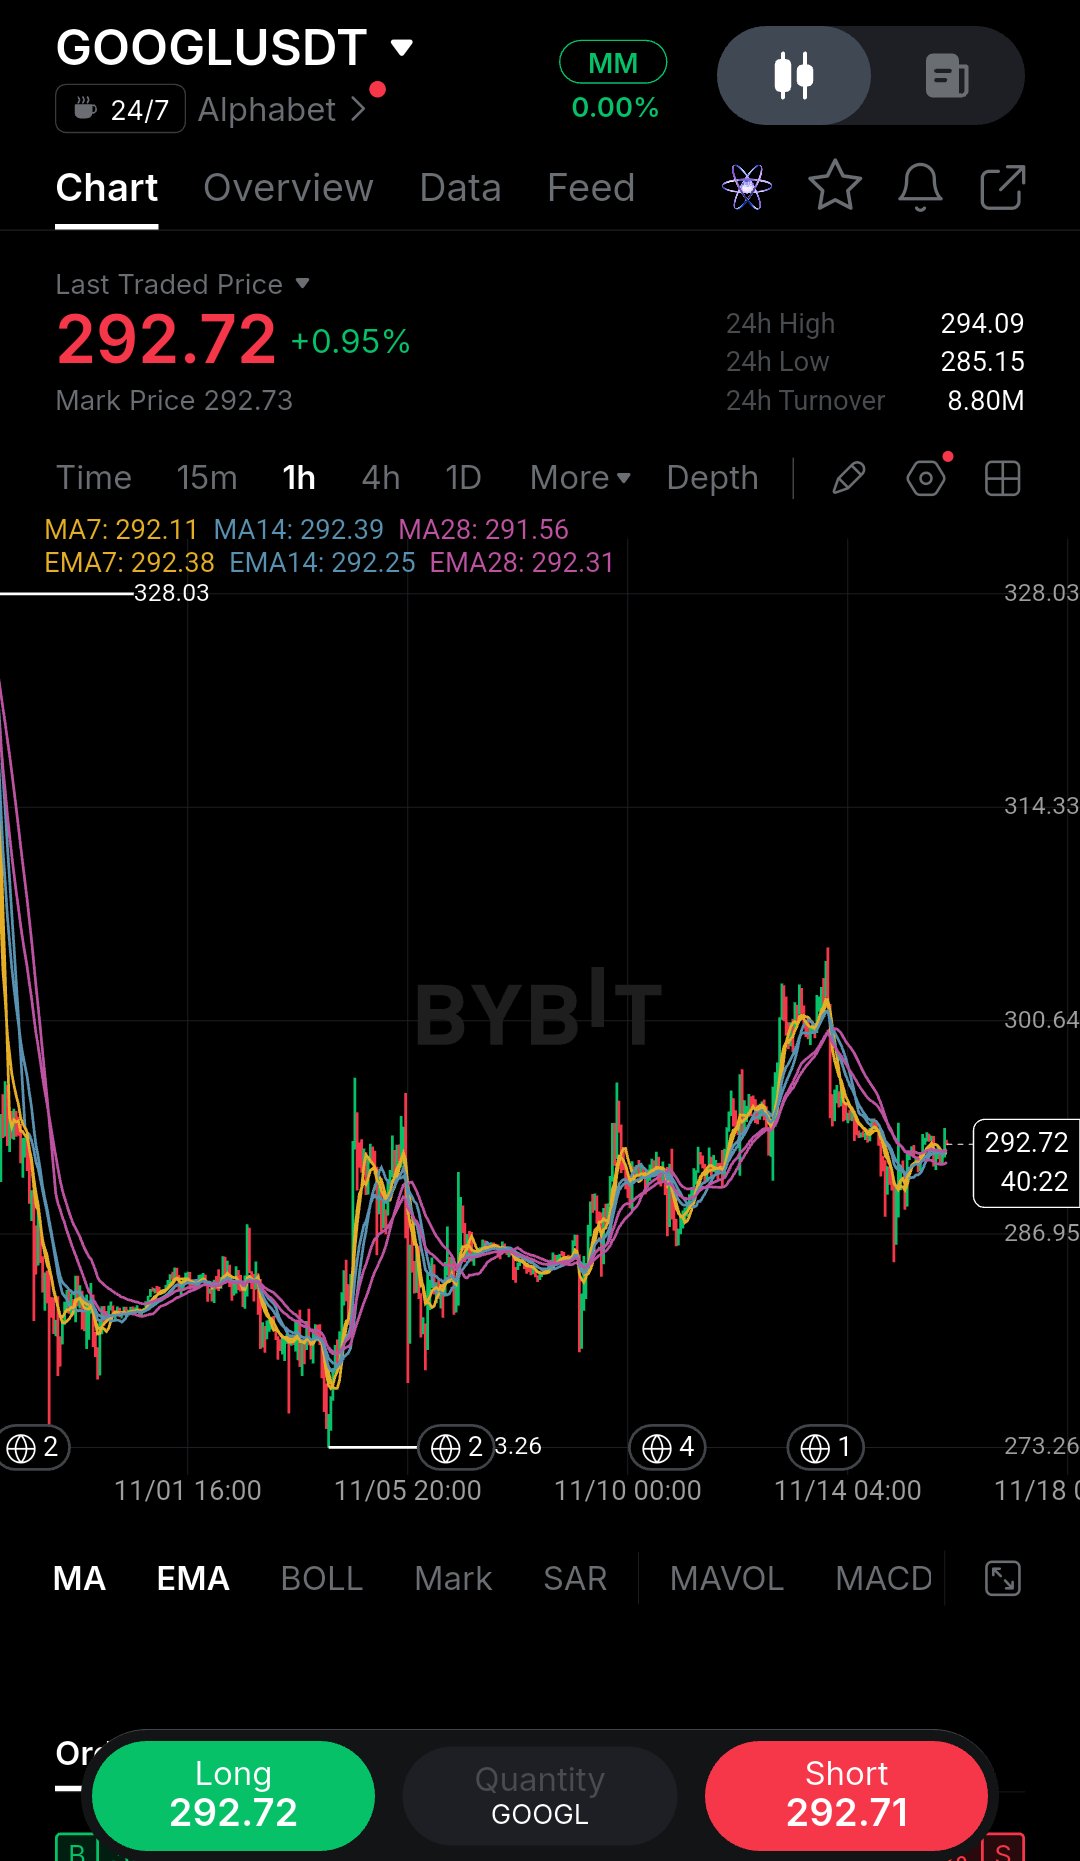
Casi ignoro esta gráfica de GOOGL hasta que noté cómo el precio estaba interactuando con las medias móviles en el lado derecho. Mirando el marco de tiempo de 1 hora, la tendencia macro tuvo una caída en cascada masiva desde el pico de 328.03 hasta el mínimo de 273.26. Pero al hacer zoom en la acción reciente del precio, las ventas agresivas se estancaron y hemos visto una recuperación constante, en forma de escalera, empujando el precio de vuelta a 292.72 (+0.95%). Aquí está el detalle crítico: el precio está actualmente atrapado dentro de un sándwich de medias móviles completamente plano. Las MA7 (292.11), MA14 (292.39) y MA28 (291.56) están todas comprimidas en un nudo apretado justo alrededor del precio actual. Esto es un libro de texto de compresión de volatilidad. Después de una caída masiva, cuando las MA se aplanan así, significa que el impulso de venta se ha secado por completo. El mercado se está enroscando, esperando un catalizador. Una lección que he aprendido al operar estas bases post-colapso es que no adivinas la dirección. Espero a que la vela de una hora cierre decisivamente fuera de este grupo antes de arriesgar capital. Plan de Trading: Sesgo: Neutral (Esperando una ruptura). Zona de Entrada: 294.20 – 294.50 (Solo con un cierre fuerte de 1H superando la resistencia local y el máximo de 24h). Stop Loss: 285.00 (Justo por debajo del mínimo local reciente). Objetivo 1: 300.64 (Resistencia de rango medio). Objetivo 2: 314.33 (Nivel de ruptura anterior). Objetivo 3: 328.03 (Pico macro). Riesgo/Beneficio: 1:2.5 Invalidación: Un cierre de vela de 1H por debajo de 289.00, señalando una ruptura de esta base y una reanudación de la tendencia bajista. No hagas FOMO en medio de este movimiento errático. Espera la vela de confirmación, respeta tu stop loss y nunca arriesgues más de lo que puedes permitirte perder. ¿Crees que GOOGL finalmente está encontrando un piso aquí, o es solo una pausa antes de la próxima caída? $GOOGLXUSDT #ByXIMPACT
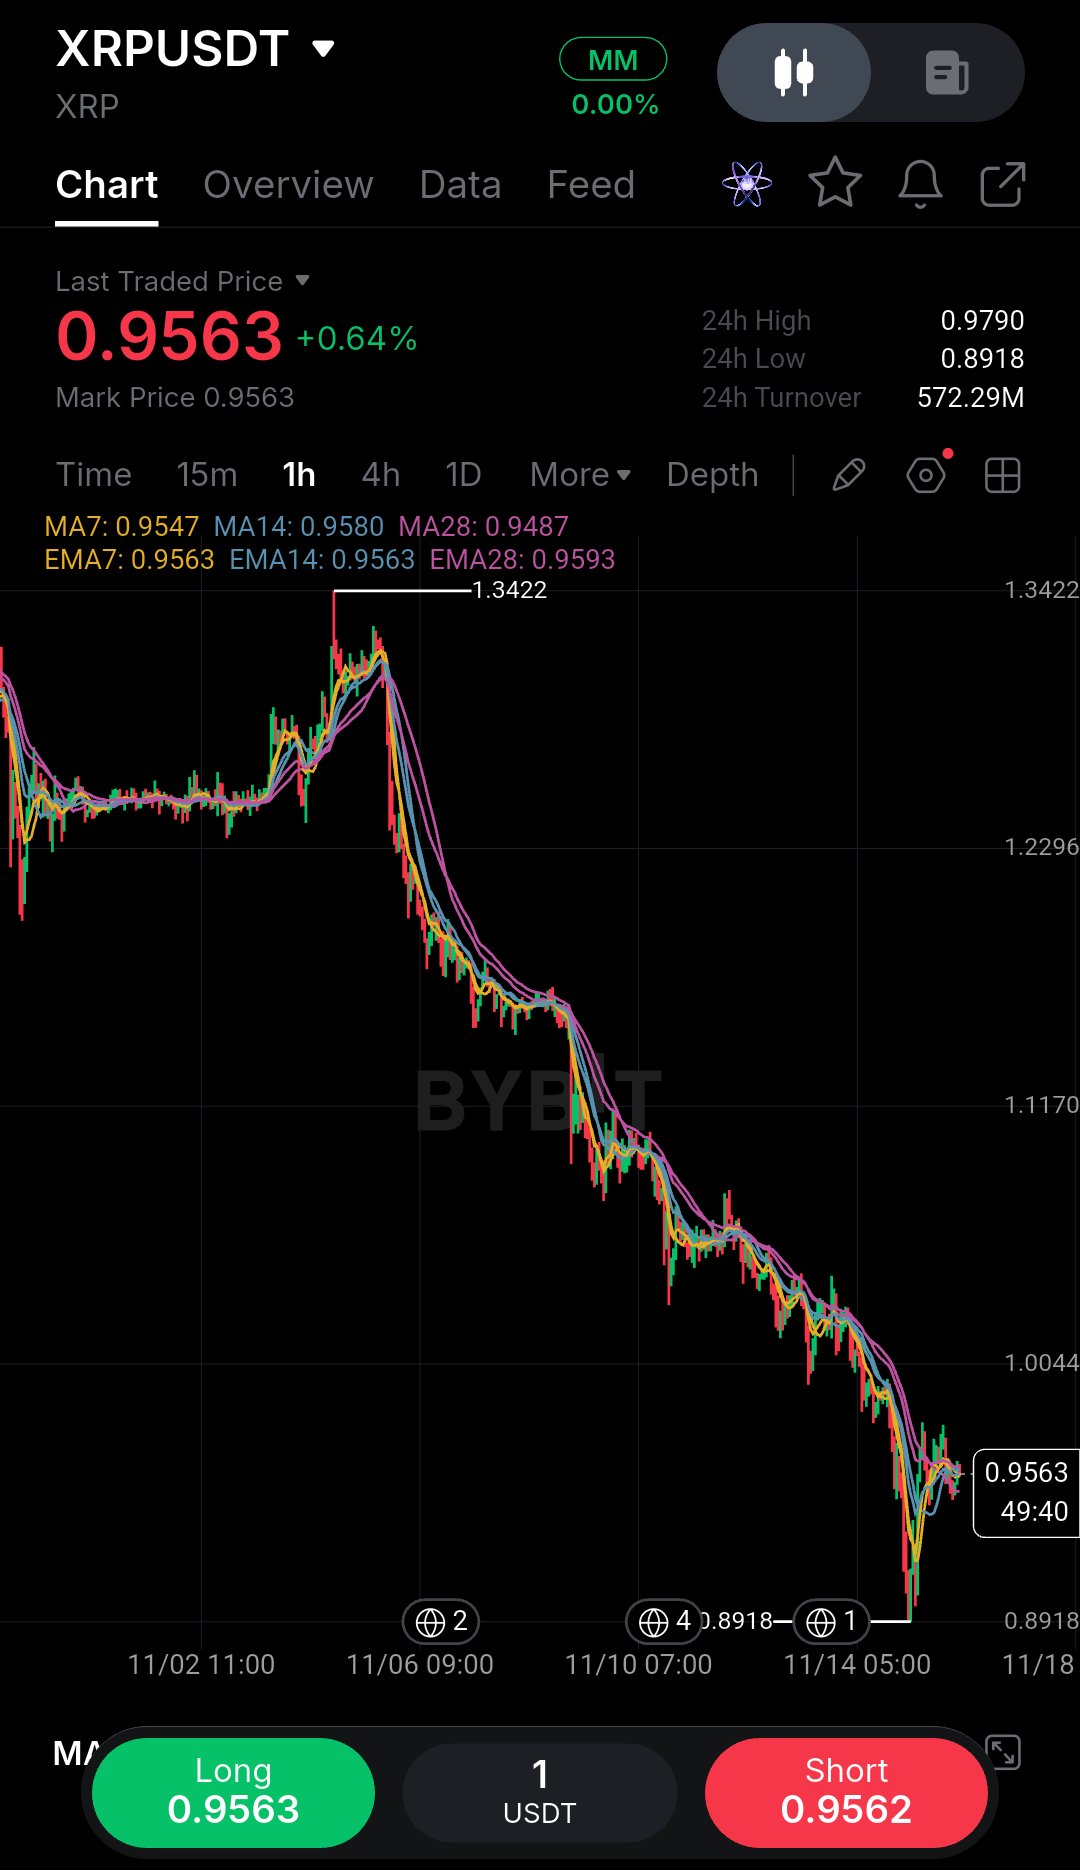
Casi ignoro este gráfico de XRP hasta que noté qué tan comprimido estaba el precio contra los promedios móviles en el lado derecho. Mirando la temporalidad de 1 hora, la tendencia macro es innegablemente bajista. Hemos estado en un desangre implacable desde el pico de 1.3422, imprimiendo una larga secuencia de máximos más bajos y mínimos más bajos. Pero miren de cerca la acción reciente del precio. Después de un desplome hasta el mínimo de 0.8918, la venta agresiva se estancó. El precio rebotó a 0.9563, y aquí está el detalle crítico: el precio está actualmente atrapado dentro de un sándwich de promedios móviles completamente plano. La MA7 (0.9547), MA14 (0.9580) y MA28 (0.9487) están todas comprimidas en un nudo apretado justo alrededor del precio actual. Esto es un libro de texto sobre compresión de volatilidad (squeeze). Después de una caída masiva, cuando los promedios móviles se aplanan así, significa que el impulso vendedor se ha agotado por completo. El mercado se está contrayendo, esperando un catalizador. Una lección que he aprendido al operar estas bases post-colapso es que no debes adivinar la dirección. Espero a que la vela de una hora cierre decisivamente fuera de este grupo antes de arriesgar capital. Plan de Trading: Sesgo: Neutral (Esperando una ruptura). Zona de Entrada: 0.9790 – 0.9800 (Solo con un cierre fuerte de 1H superando la resistencia local y el máximo de 24h). Stop Loss: 0.8900 (Justo debajo del mínimo macro reciente). Objetivo 1: 1.0044 (Resistencia de rango medio). Objetivo 2: 1.1170 (Nivel de ruptura anterior). Objetivo 3: 1.2296 (Resistencia macro). Riesgo/Recompensa: 1:2.5 Invalidación: Un cierre de vela de 1H por debajo de 0.9300, señalando una ruptura de esta base y una reanudación de la tendencia bajista. No hagas FOMO en medio de este serrucho. Espera la vela de confirmación, respeta tu stop loss y nunca arriesgues más de lo que puedes permitirte perder. ¿Crees que XRP finalmente está encontrando un piso aquí, o es solo una pausa antes de la siguiente caída? $XRPUSDT #ByXIMPACT
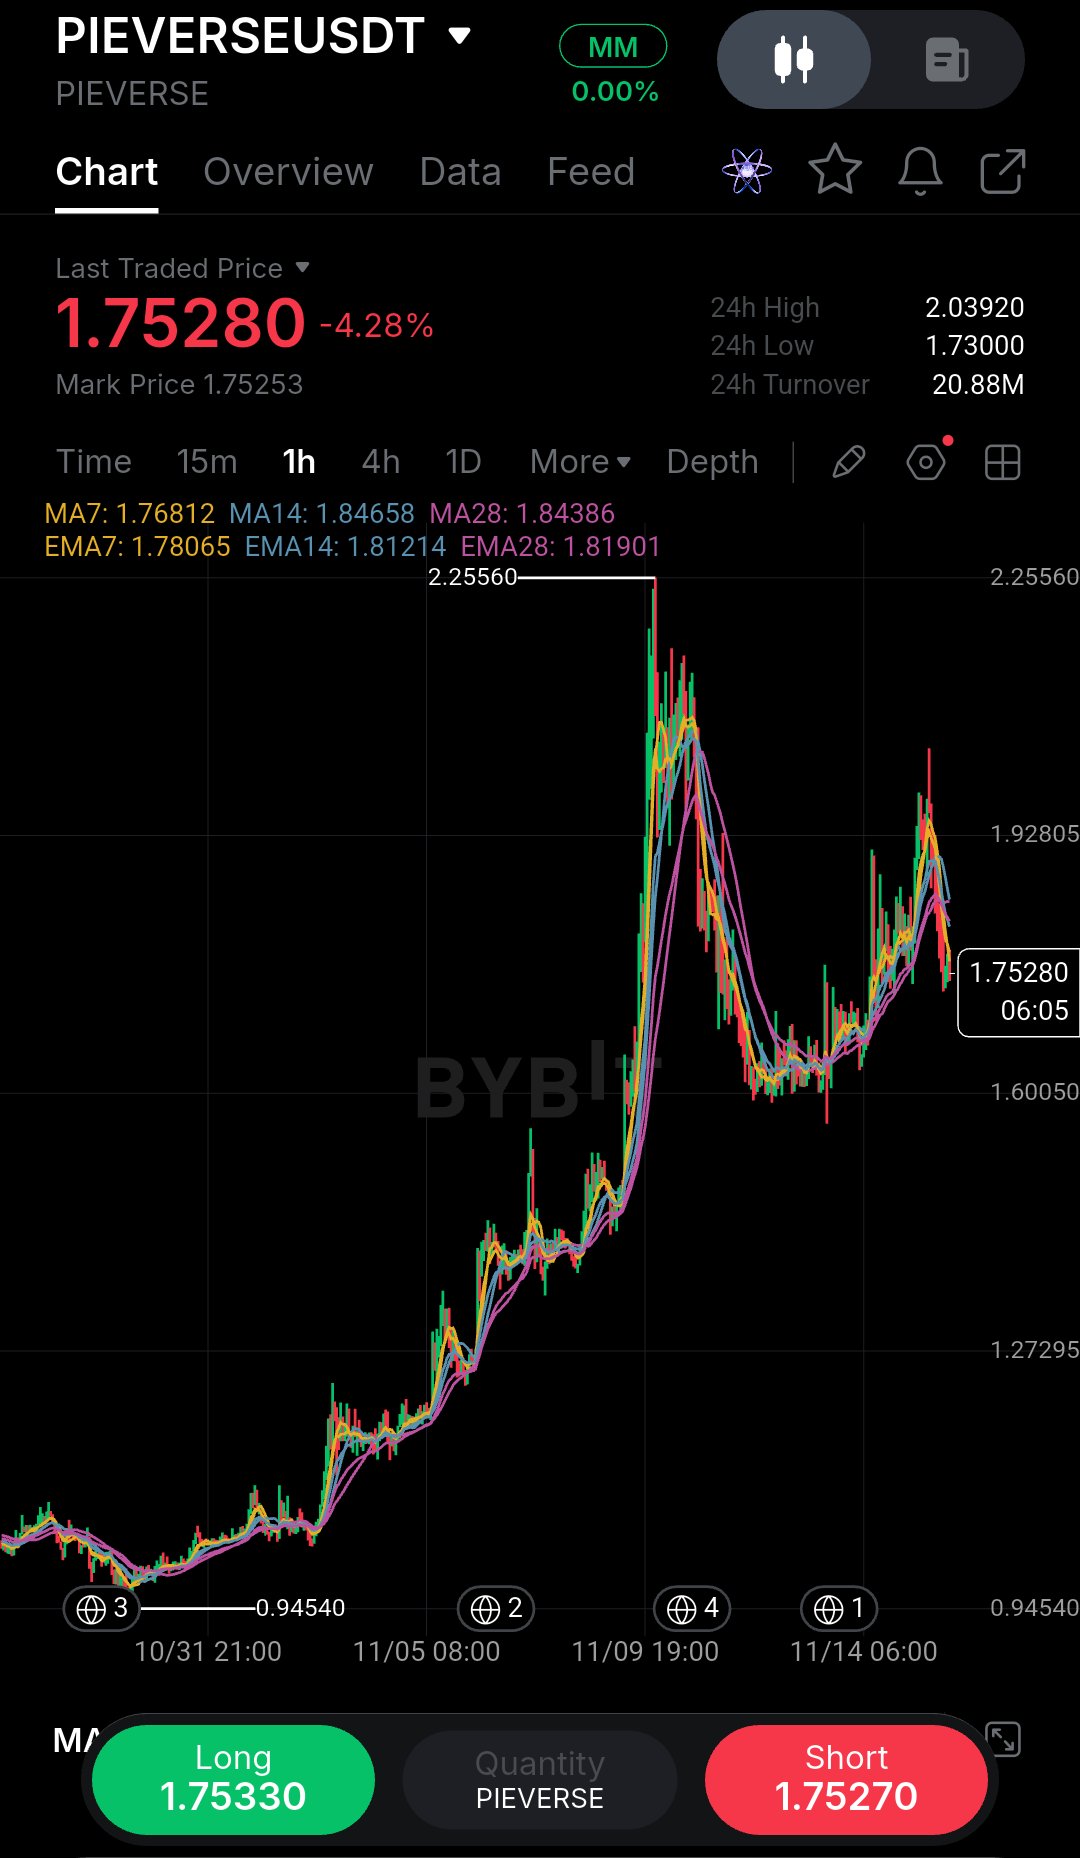
The first thing I ask myself looking at this PIEVERSE chart is whether I’d actually risk my own money here right now. Honestly, the answer is no—not in the middle of this heavy sell-off. But it’s a perfect example of why waiting for confirmation matters. Looking at the 1-hour timeframe, the macro trend is clearly bearish. We’ve bled from the 2.25560 peak, and the recent price action is pure capitulation. A heavy -4.28% drop just sliced straight through support, tagging a low of 1.73000. Right now, price is hovering at 1.75280, and the moving averages are stacked heavily above us. The MA7 (1.768), MA14 (1.846), and MA28 (1.843) are all fanning out to the downside. This is a textbook bearish alignment. When price goes vertical like this, there is very little structural support underneath it. A lesson I’ve learned from taking too many early entries is that oversold does not always mean it’s time to buy. I always let the market prove it can find a floor before entering. Trade Plan: Bias: Bearish (Waiting for a dead-cat bounce or structural base). Entry Zone: 1.8400 – 1.8500 (Looking for a retracement to the MA cluster, only if it forms a clear rejection). Stop Loss: 2.0390 (Above the previous breakdown block). Target 1: 1.7300 (Recent low). Target 2: 1.6005 (Macro swing low). Target 3: 1.5500 (Psychological support). Risk/Reward: 1:2.5 Invalidation: A 1H candle close back above 1.9000, signaling a massive V-shaped reversal. Do not FOMO into a falling candle. Wait for the market to cool off, respect your stop loss, and never risk more than you can afford to lose. Would you dare to catch this falling knife, or are you waiting for a clear reversal signal? $PIEVERSEUSDT #ByXIMPACT
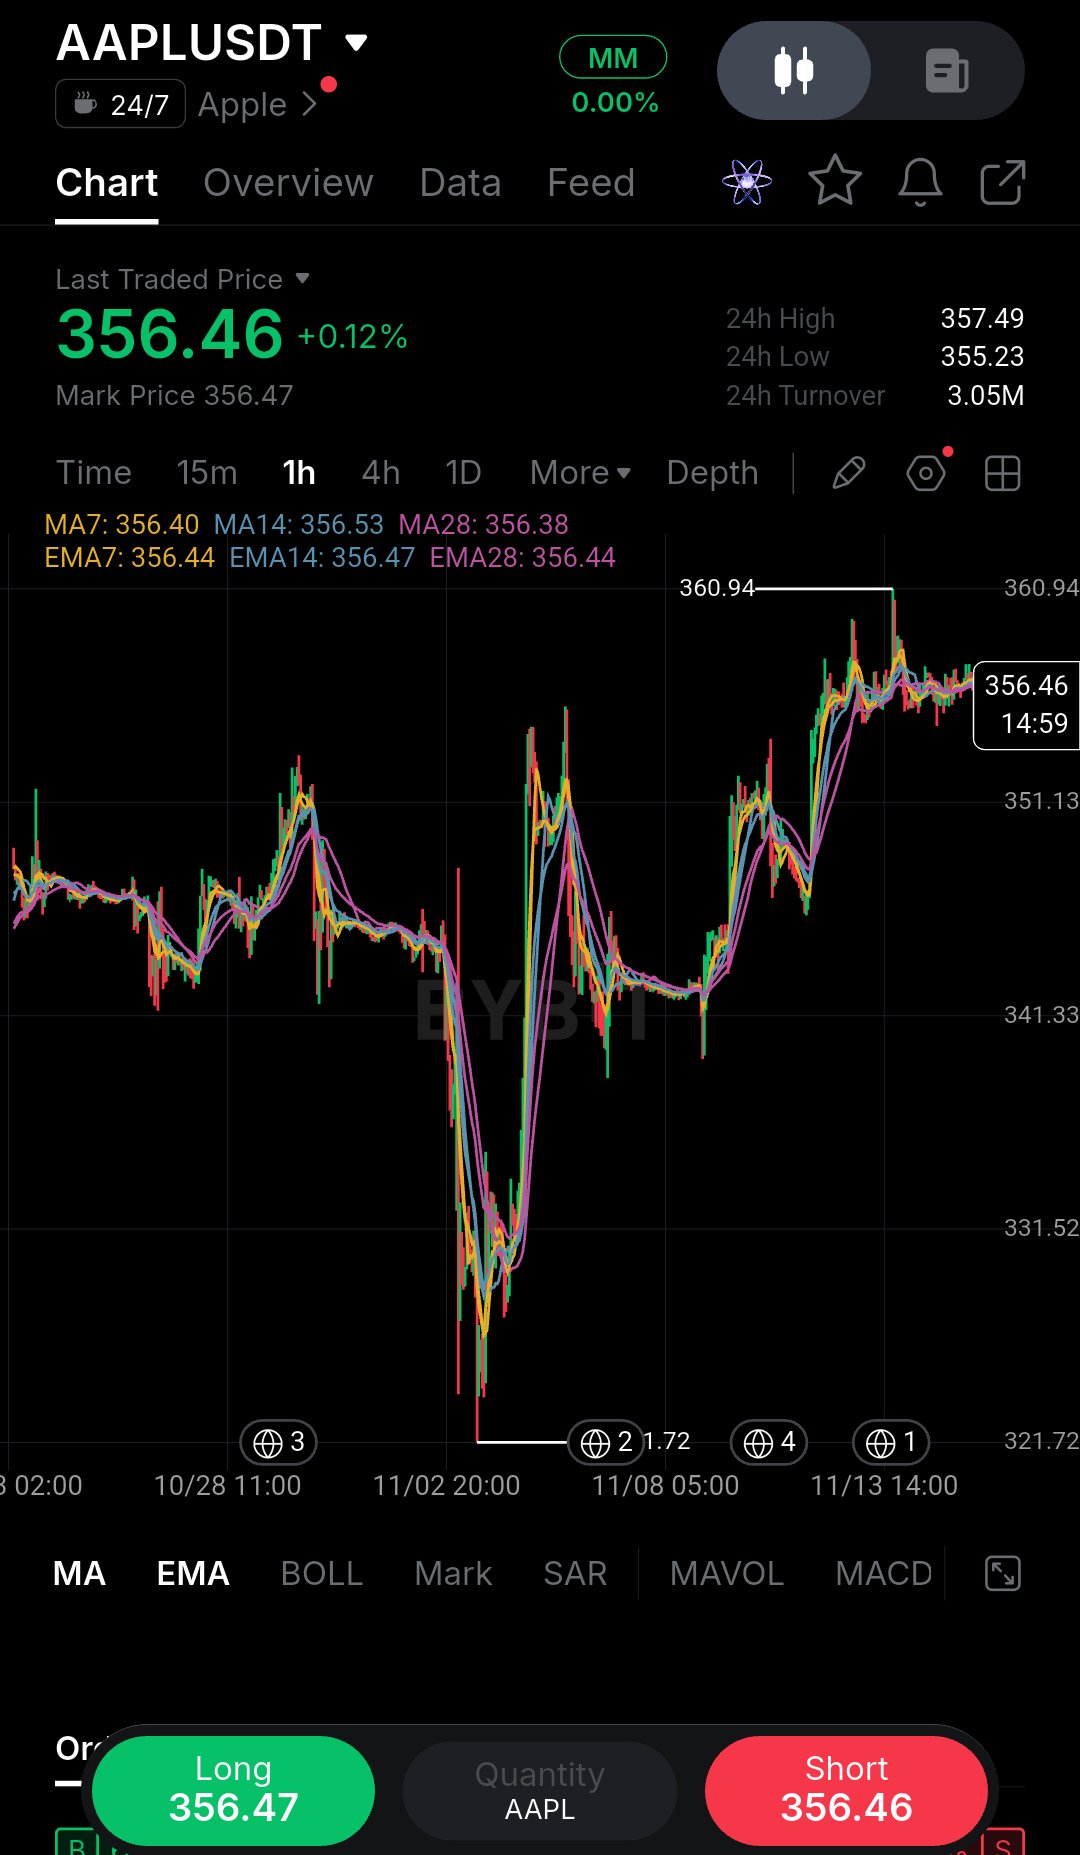
I almost ignored this AAPL chart until I noticed how tightly the price was compressing right under the moving averages. Looking at the 1-hour timeframe, the macro trend had a massive V-shaped flush down to the 321.72 low, but since then, the buyers have completely taken over. We are currently sitting at 356.46 (+0.12%), pushing up against the local highs. Here is the critical detail: price is currently trapped inside a completely flat moving average sandwich. The MA7 (356.40), MA14 (356.53), and MA28 (356.38) are all compressed into a tight knot right around the current price. This is a textbook volatility squeeze. After a massive recovery, when the MAs flatten out like this, it means the buying momentum has paused. The market is coiling, waiting for its next directional move. A lesson I've learned from trading these post-crash bases is that you don't guess the direction. I wait for the hourly candle to close decisively outside this cluster before risking capital. Trade Plan: Bias: Neutral (Waiting for a breakout or breakdown). Entry Zone: 357.60 – 357.80 (Only on a strong 1H close clearing the local resistance and 24h high). Stop Loss: 355.20 (Just below the recent local swing low). Target 1: 360.94 (Recent macro high). Target 2: 365.00 (Price discovery). Target 3: 370.00 (Extended target). Risk/Reward: 1:2.5 Invalidation: A 1H candle close below 355.00, signaling a breakdown of this base and a deeper pullback. Don't FOMO into the middle of this chop. Wait for the confirmation candle, respect your stop loss, and never risk more than you can afford to lose. Do you think AAPL breaks higher from this squeeze, or is it setting up for a deeper retracement? $AAPLXUSDT #ByXIMPACT
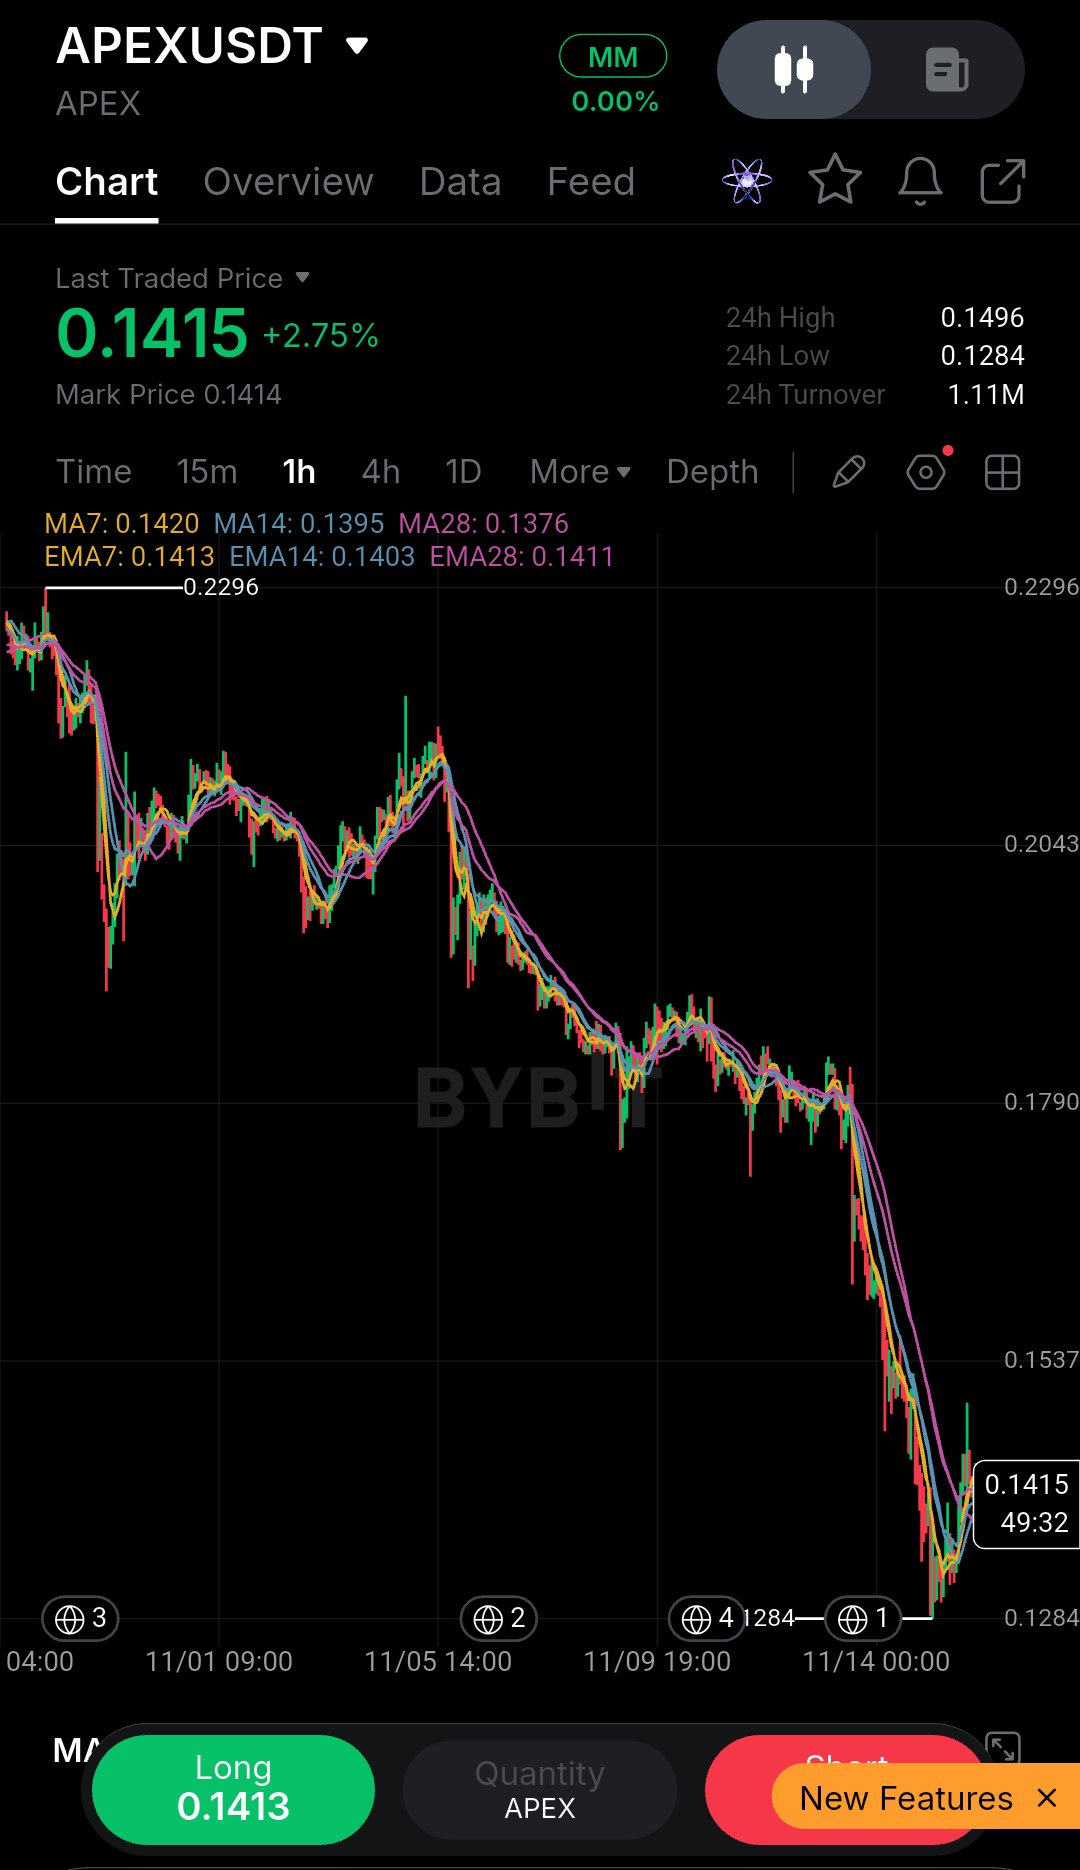
I almost ignored this APEX chart until I noticed how the price was interacting with the moving averages on the right side. Looking at the 1-hour timeframe, the macro trend had a heavy bleed from the 0.2296 peak down to the 0.1284 low. But zoom in on the recent price action. The aggressive selling stalled, and we’ve seen a strong, aggressive V-shaped recovery pushing the price back up to 0.1415 (+2.75%). Here is the critical detail: price is currently trading just above a fanned-out moving average cluster. The MA7 (0.1420), MA14 (0.1395), and MA28 (0.1376) are all acting as dynamic support beneath us. This is a textbook structural shift. When a downtrend stops making lower lows and price aggressively reclaims its moving averages, it signals that sellers are exhausted. However, we are testing a local resistance zone, so this is a tactical bounce, not a full reversal yet. A lesson I've learned from trying to catch falling knives is that you don't buy the bottom; you buy the confirmation of a structure shift. Trade Plan: Bias: Short-term bullish (Playing the recovery). Entry Zone: 0.1370 – 0.1400 (Looking for a slight pullback to retest the MA cluster). Stop Loss: 0.1280 (Just below the recent local swing low). Target 1: 0.1496 (24h high and immediate resistance). Target 2: 0.1790 (Mid-range macro resistance). Target 3: 0.2043 (Previous breakdown level). Risk/Reward: 1:2.5 Invalidation: A 1H candle close below 0.1330, which would signal a loss of the local uptrend support. Don't FOMO into the middle of this chop. Wait for the hourly candle to close strong, respect your stop loss, and never risk more than you can afford to lose. Do you think APEX is finally ready for a relief rally, or is this just a pause before the next leg down? $APEXUSDT #ByXIMPACT
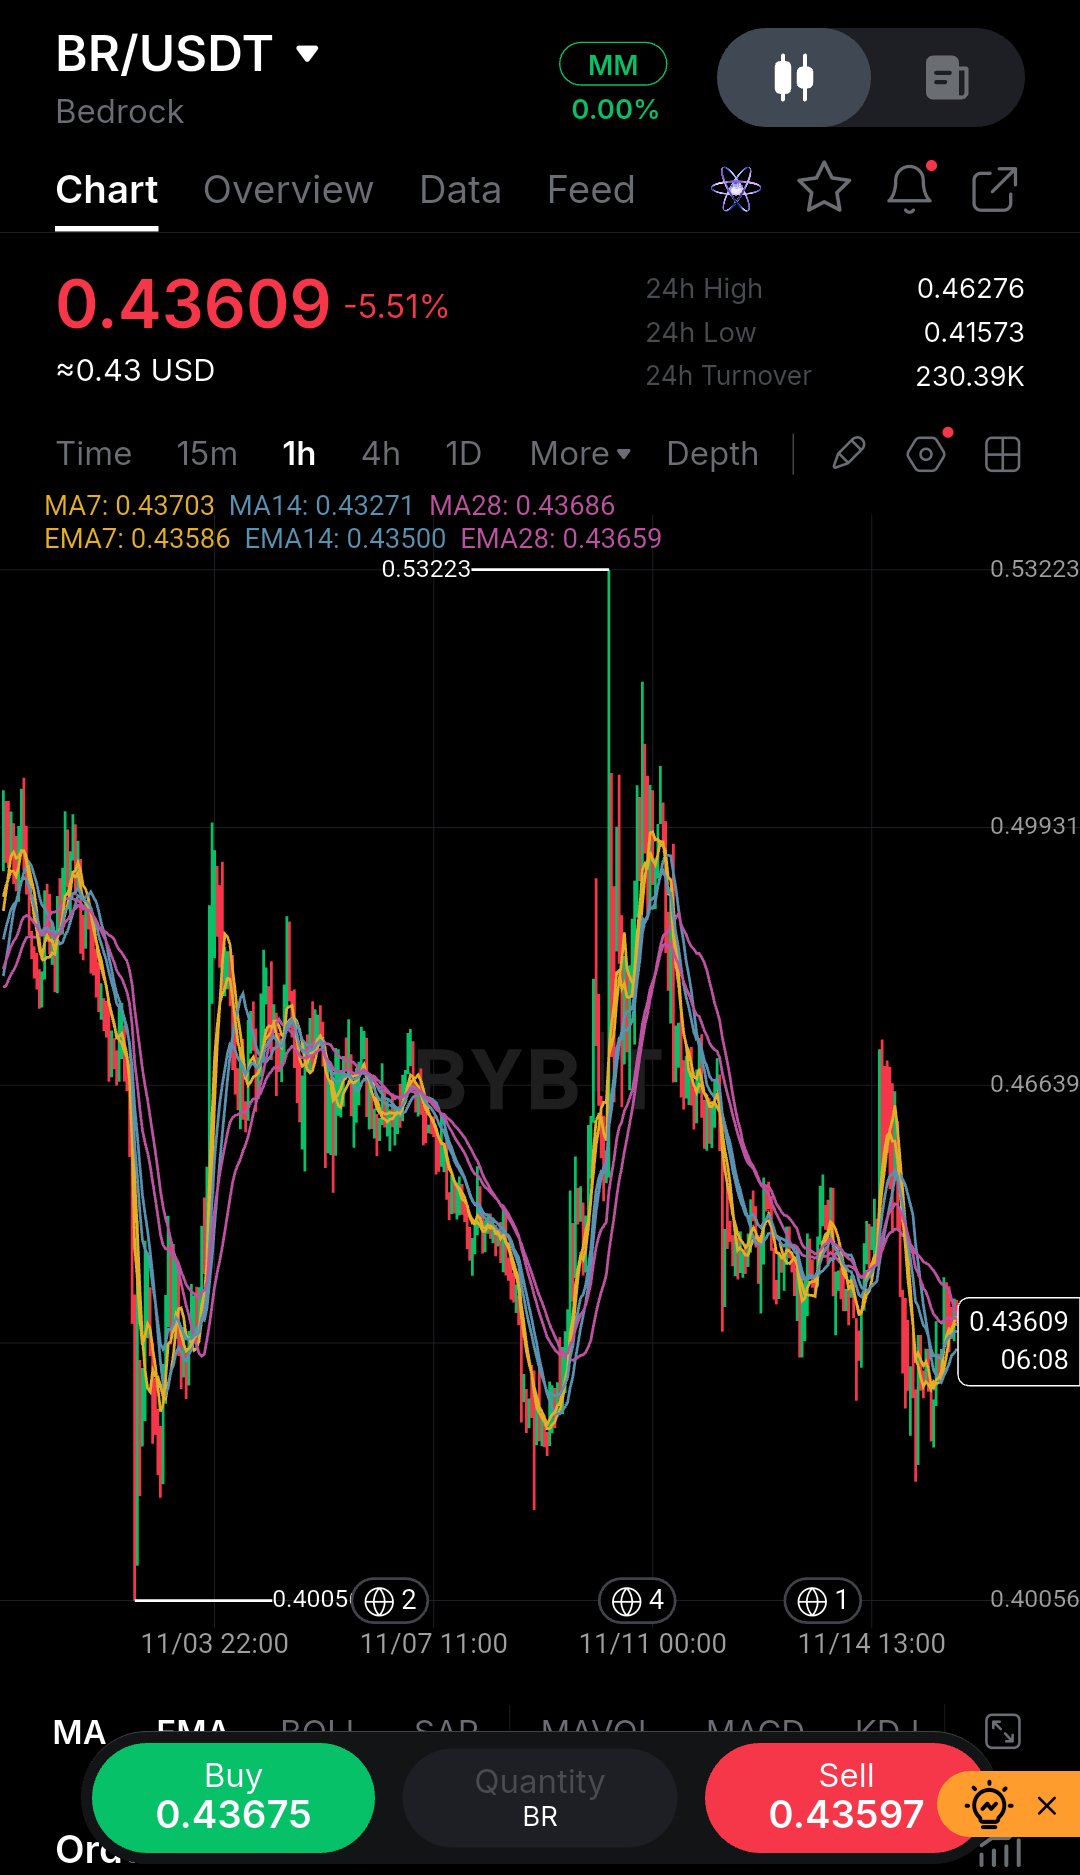
The first thing I ask myself looking at this BR chart is whether I’d actually risk my own money here right now. Honestly, the answer is no—not in the middle of this heavy sell-off. But it’s a perfect example of why waiting for confirmation matters. Looking at the 1-hour timeframe, the macro trend is clearly bearish. We’ve bled from the 0.53223 peak, and the recent price action is pure capitulation. A heavy -5.51% drop just sliced straight through support, tagging a low of 0.41573. Right now, price is hovering at 0.43609, and the moving averages are stacked heavily above us. The MA7 (0.43703), MA14 (0.43271), and MA28 (0.43686) are all acting as dynamic resistance. This is a textbook bearish alignment. When price goes vertical like this, there is very little structural support underneath it. A lesson I’ve learned from taking too many early entries is that oversold does not always mean it’s time to buy. I always let the market prove it can find a floor before entering. Trade Plan: Bias: Bearish (Waiting for a dead-cat bounce or structural base). Entry Zone: 0.44500 – 0.44800 (Looking for a retracement to the MA cluster, only if it forms a clear rejection). Stop Loss: 0.46200 (Above the previous breakdown block). Target 1: 0.41573 (Recent low). Target 2: 0.40056 (Macro swing low). Target 3: 0.39000 (Psychological support). Risk/Reward: 1:2.5 Invalidation: A 1H candle close back above 0.45500, signaling a massive V-shaped reversal. Do not FOMO into a falling candle. Wait for the market to cool off, respect your stop loss, and never risk more than you can afford to lose. Would you dare to catch this falling knife, or are you waiting for a clear reversal signal? $BRUSDT #ByXIMPACT
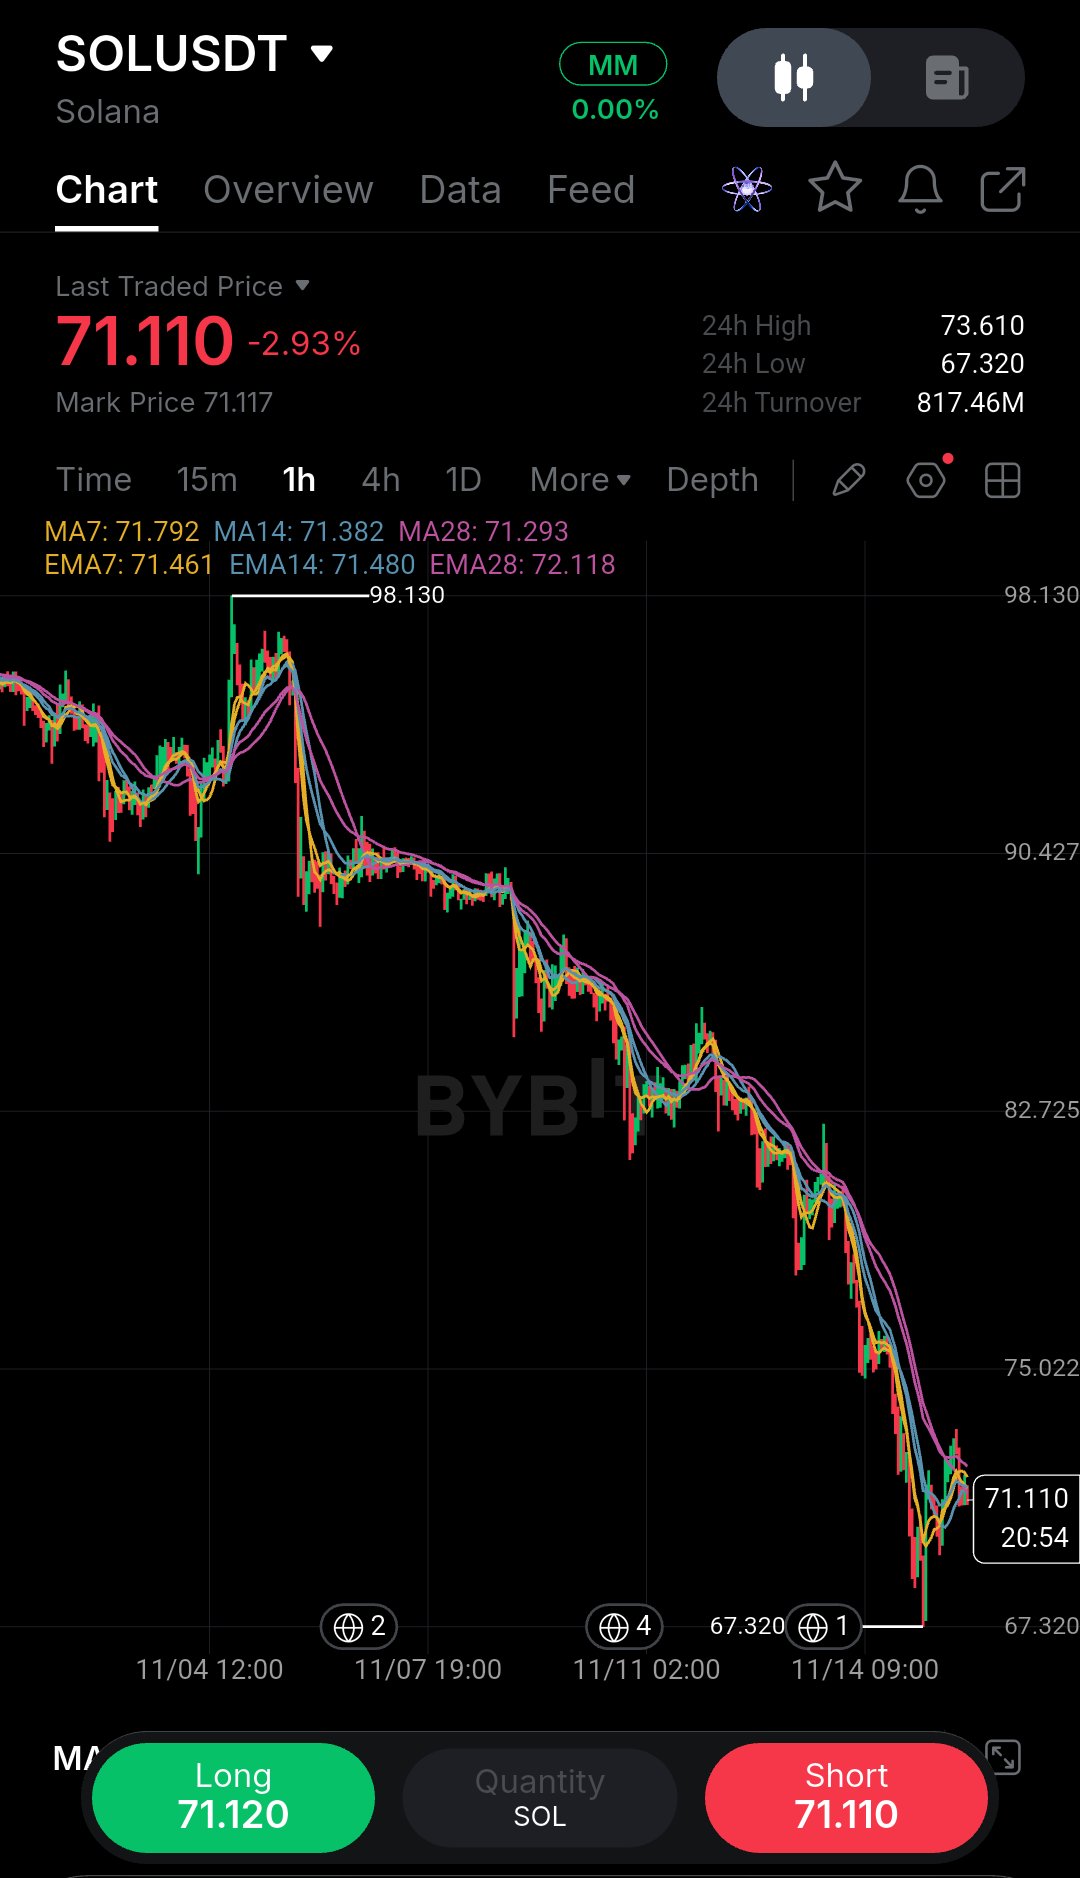
The first thing I ask myself looking at this SOL chart is whether I’d actually risk my own money here right now. Honestly, the answer is no—not in the middle of this heavy sell-off. But it’s a perfect example of why waiting for confirmation matters. Looking at the 1-hour timeframe, the macro trend is clearly bearish. We’ve bled from the 98.130 peak, and the recent price action is pure capitulation. A heavy -2.93% drop just sliced straight through support, tagging a low of 67.320. Right now, price is hovering at 71.110, and the moving averages are stacked heavily above us. The MA7 (71.792), MA14 (71.382), and MA28 (71.293) are all fanning out to the downside. This is a textbook bearish alignment. When price goes vertical like this, there is very little structural support underneath it. A lesson I’ve learned from taking too many early entries is that oversold does not always mean it’s time to buy. I always let the market prove it can find a floor before entering. Trade Plan: Bias: Bearish (Waiting for a dead-cat bounce or structural base). Entry Zone: 71.400 – 71.800 (Looking for a retracement to the MA cluster, only if it forms a clear rejection). Stop Loss: 73.600 (Above the previous breakdown block). Target 1: 67.320 (Recent low). Target 2: 65.000 (Psychological support). Target 3: 63.000 (Extended target). Risk/Reward: 1:2.5 Invalidation: A 1H candle close back above 72.500, signaling a massive V-shaped reversal. Do not FOMO into a falling candle. Wait for the market to cool off, respect your stop loss, and never risk more than you can afford to lose. Would you dare to catch this falling knife, or are you waiting for a clear reversal signal? $SOLUSDT #ByXIMPACT
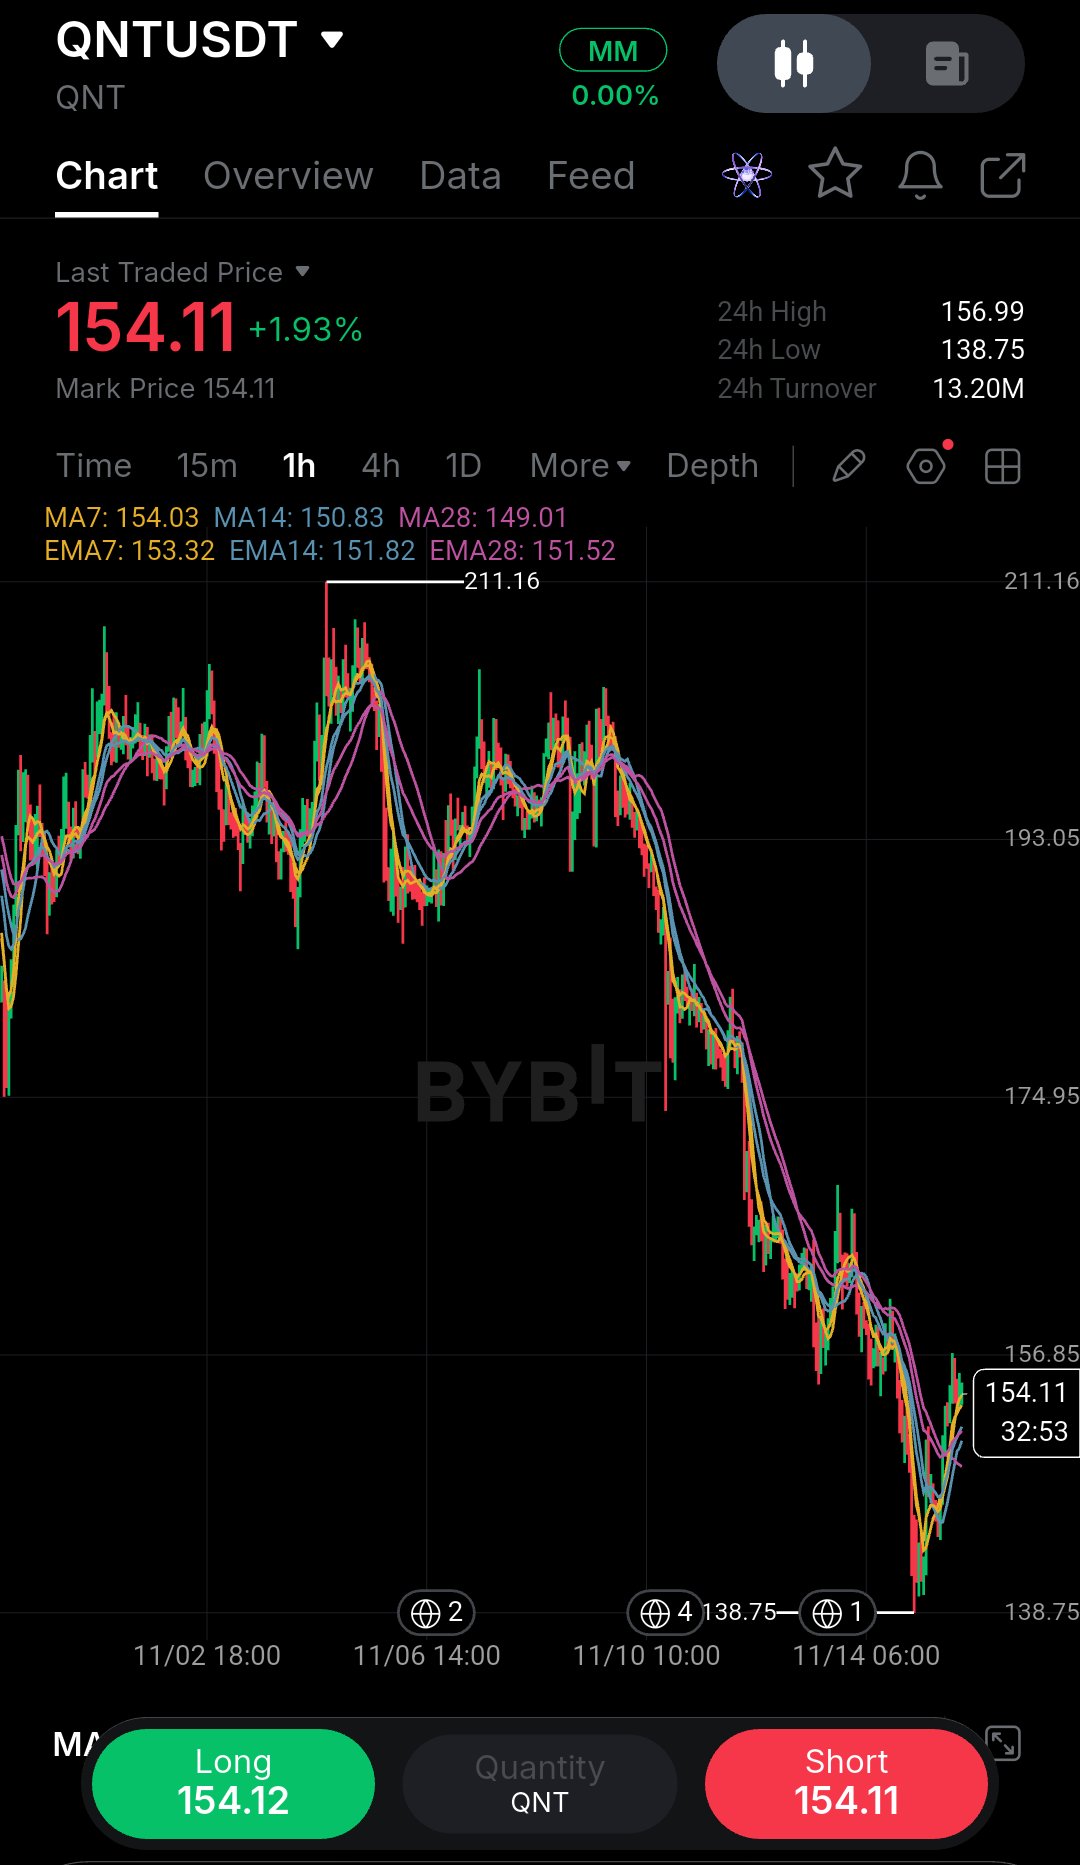
I almost ignored this QNT chart until I noticed how the price was interacting with the moving averages on the right side. Looking at the 1-hour timeframe, the macro trend had a heavy bleed from the 211.16 peak down to the 138.75 low. But zoom in on the recent price action. The aggressive selling stalled, and we’ve seen a strong, aggressive V-shaped recovery pushing the price back up to 154.11 (+1.93%). Here is the critical detail: price is currently trading just above a fanned-out moving average cluster. The MA7 (154.03), MA14 (150.83), and MA28 (149.01) are all acting as dynamic support beneath us. This is a textbook structural shift. When a downtrend stops making lower lows and price aggressively reclaims its moving averages, it signals that sellers are exhausted. However, we are testing a local resistance zone, so this is a tactical bounce, not a full reversal yet. A lesson I've learned from trying to catch falling knives is that you don't buy the bottom; you buy the confirmation of a structure shift. Trade Plan: Bias: Short-term bullish (Playing the recovery). Entry Zone: 150.00 – 153.00 (Looking for a slight pullback to retest the MA cluster). Stop Loss: 138.70 (Just below the recent local swing low). Target 1: 156.99 (24h high and immediate resistance). Target 2: 174.95 (Mid-range macro resistance). Target 3: 193.05 (Previous breakdown level). Risk/Reward: 1:2.5 Invalidation: A 1H candle close below 148.00, which would signal a loss of the local uptrend support. Don't FOMO into the middle of this chop. Wait for the hourly candle to close strong, respect your stop loss, and never risk more than you can afford to lose. Do you think QNT is finally ready for a relief rally, or is this just a pause before the next leg down? $QNTUSDT #ByXIMPACT
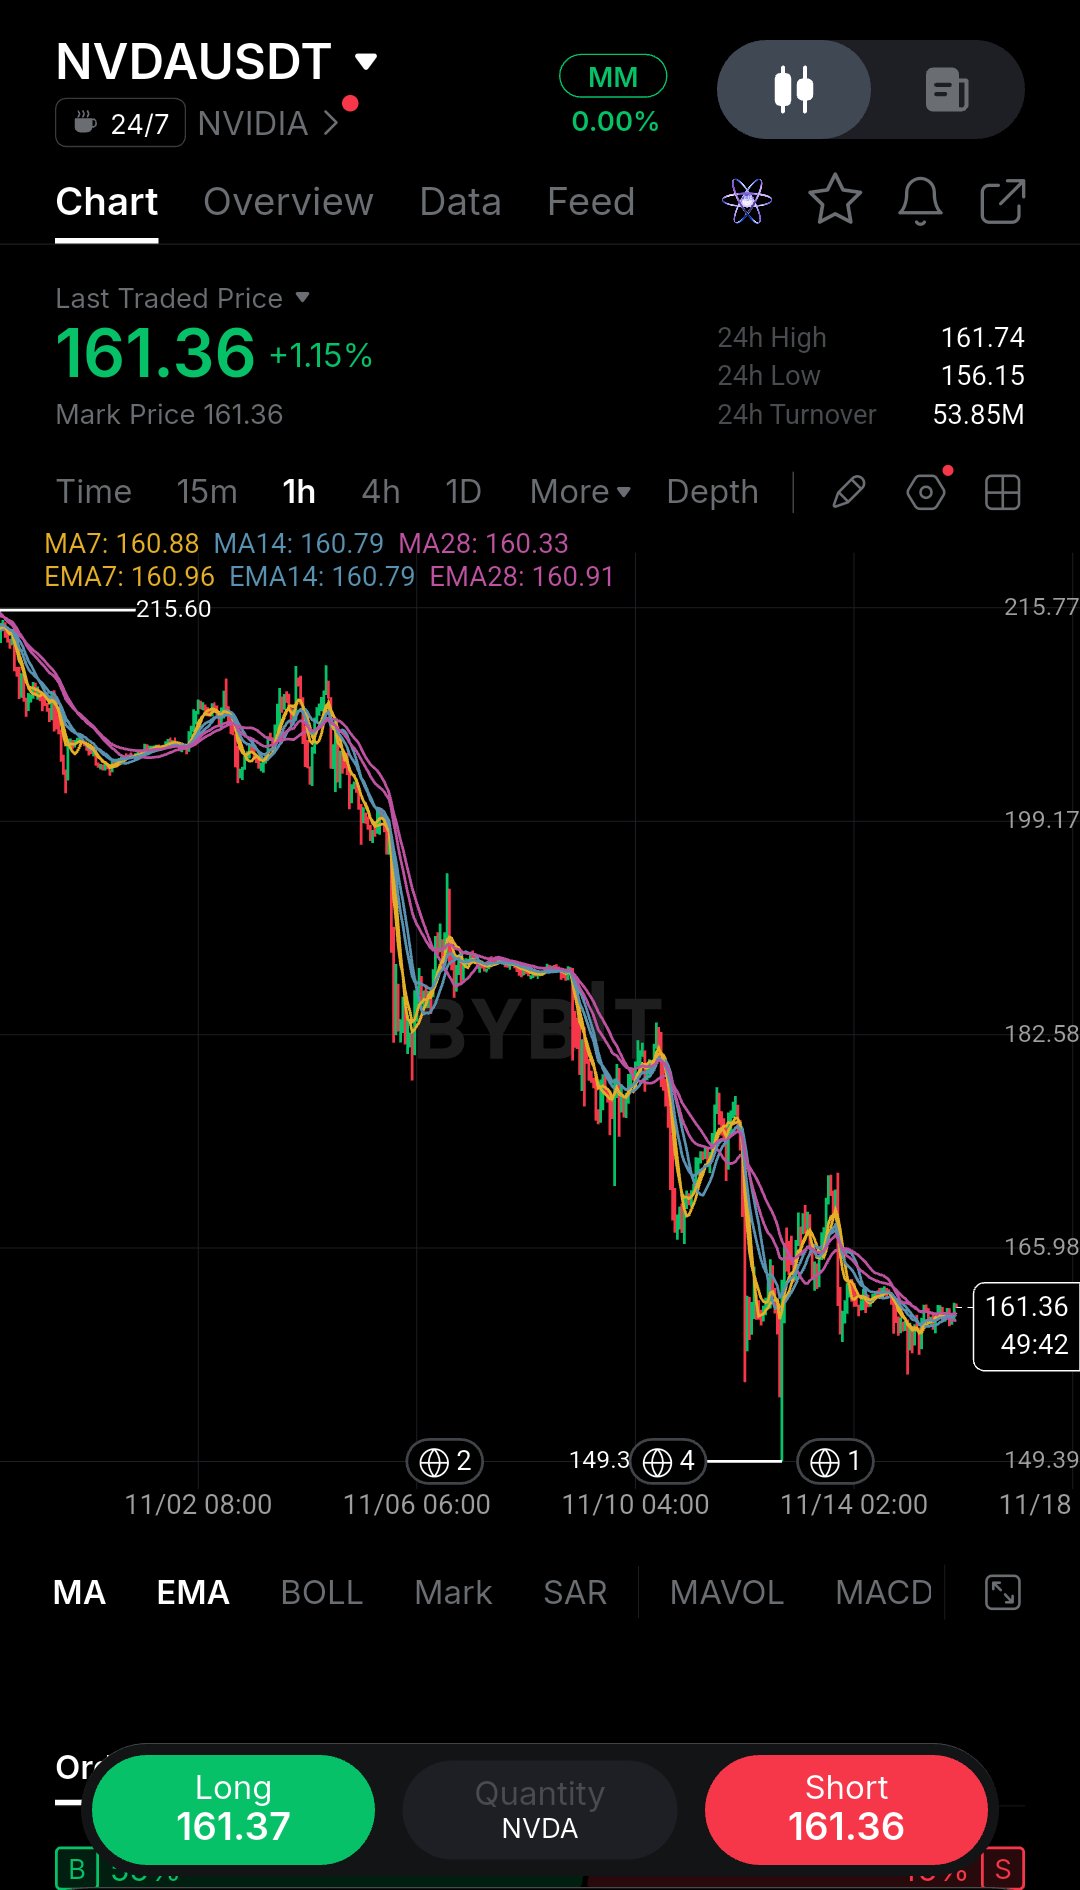
I almost ignored this NVDA chart until I noticed how tightly the price was compressing right under the moving averages. Looking at the 1-hour timeframe, the macro trend is undeniably bearish. We’ve been in a relentless bleed from the 215.60 peak, printing a long sequence of lower highs and lower lows. But zoom in on the recent price action. After flushing to the 149.39 low, the aggressive selling stalled. Price bounced back to 161.36, and here is the critical detail: price is currently trapped inside a flat moving average sandwich. The MA7 (160.88), MA14 (160.79), and MA28 (160.33) are all compressed into a tight knot right around the current price. This is a textbook volatility squeeze. After a massive drop, when the MAs flatten out like this, it means the selling momentum has completely dried up. The market is coiling, waiting for a catalyst. A lesson I've learned from trading these post-crash bases is that you don't guess the direction. I wait for the hourly candle to close decisively outside this cluster before risking capital. Trade Plan: Bias: Neutral (Waiting for a breakout). Entry Zone: 161.80 – 162.00 (Only on a strong 1H close clearing the local resistance and 24h high). Stop Loss: 156.00 (Just below the recent local swing low). Target 1: 165.98 (Mid-range resistance). Target 2: 182.58 (Previous breakdown level). Target 3: 199.17 (Macro resistance). Risk/Reward: 1:2.5 Invalidation: A 1H candle close below 159.00, signaling a breakdown of this base and a resumption of the downtrend. Don't FOMO into the middle of this chop. Wait for the confirmation candle, respect your stop loss, and never risk more than you can afford to lose. Do you think NVDA is finally finding a floor here, or is this just a pause before the next dump? $NVDAXUSDT #ByXIMPACT
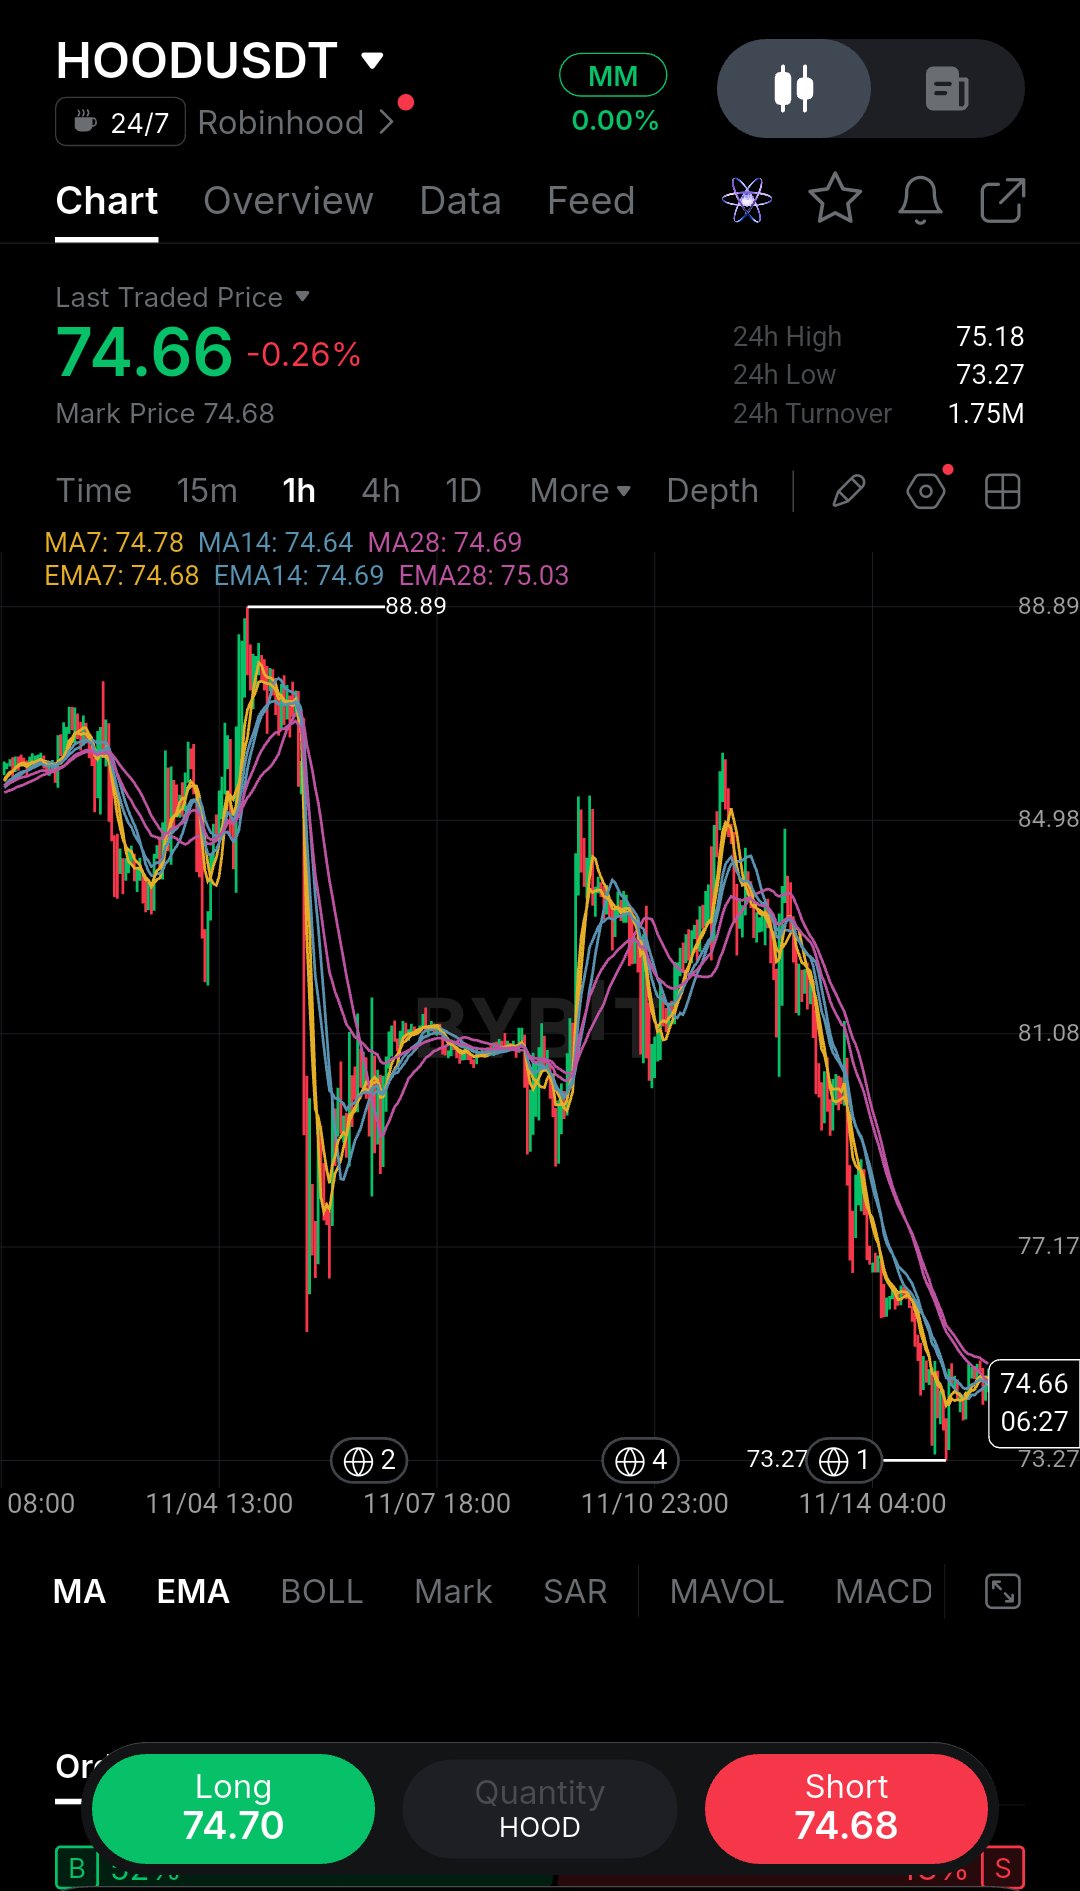
The first thing I ask myself looking at this HOOD chart is whether I’d actually risk my own money here right now. Honestly, the answer is no—not in the middle of this heavy sell-off. But it’s a perfect example of why waiting for confirmation matters. Looking at the 1-hour timeframe, the macro trend is clearly bearish. We’ve bled from the 88.89 peak, and the recent price action is pure capitulation. A heavy drop just sliced straight through support, tagging a low of 73.27. Right now, price is hovering at 74.66, and the moving averages are stacked heavily above us. The MA7 (74.78), MA14 (74.64), and MA28 (74.69) are all acting as dynamic resistance. This is a textbook bearish alignment. When price goes vertical like this, there is very little structural support underneath it. A lesson I’ve learned from taking too many early entries is that oversold does not always mean it’s time to buy. I always let the market prove it can find a floor before entering. Trade Plan: Bias: Bearish (Waiting for a dead-cat bounce or structural base). Entry Zone: 75.00 – 75.20 (Looking for a retracement to the MA cluster, only if it forms a clear rejection). Stop Loss: 77.20 (Above the previous breakdown block). Target 1: 73.27 (Recent low). Target 2: 71.00 (Psychological support). Target 3: 69.00 (Extended target). Risk/Reward: 1:2.5 Invalidation: A 1H candle close back above 76.50, signaling a massive V-shaped reversal. Do not FOMO into a falling candle. Wait for the market to cool off, respect your stop loss, and never risk more than you can afford to lose. Would you dare to catch this falling knife, or are you waiting for a clear reversal signal? $HOODXUSDT #ByXIMPACT
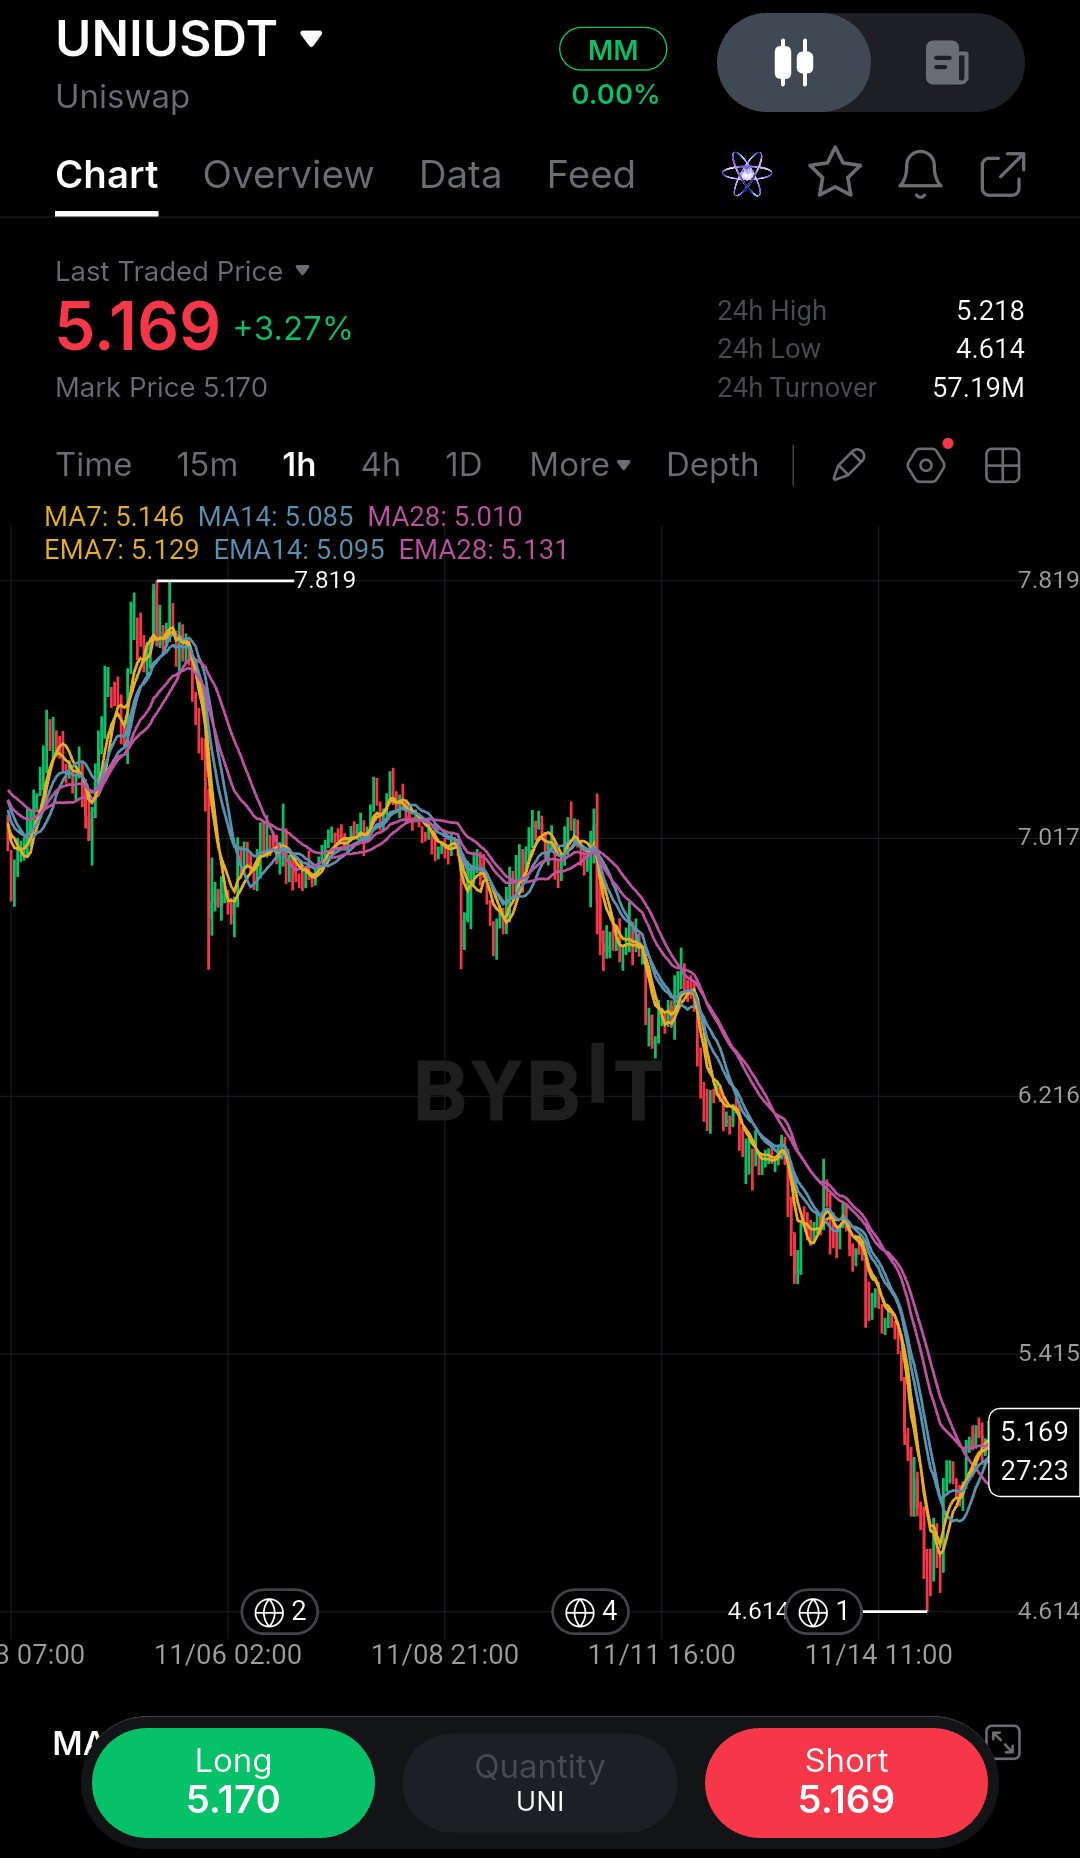
I almost ignored this UNI chart until I noticed how the price was interacting with the moving averages on the right side. Looking at the 1-hour timeframe, the macro trend had a heavy bleed from the 7.819 peak down to the 4.614 low. But zoom in on the recent price action. The aggressive selling stalled, and we’ve seen a strong, aggressive V-shaped recovery pushing the price back up to 5.169 (+3.27%). Here is the critical detail: price is currently trading just above a fanned-out moving average cluster. The MA7 (5.146), MA14 (5.085), and MA28 (5.010) are all acting as dynamic support beneath us. This is a textbook structural shift. When a downtrend stops making lower lows and price aggressively reclaims its moving averages, it signals that sellers are exhausted. However, we are testing a local resistance zone, so this is a tactical bounce, not a full reversal yet. A lesson I've learned from trying to catch falling knives is that you don't buy the bottom; you buy the confirmation of a structure shift. Trade Plan: Bias: Short-term bullish (Playing the recovery). Entry Zone: 5.050 – 5.120 (Looking for a slight pullback to retest the MA cluster). Stop Loss: 4.610 (Just below the recent local swing low). Target 1: 5.218 (24h high and immediate resistance). Target 2: 6.216 (Mid-range macro resistance). Target 3: 7.017 (Previous breakdown level). Risk/Reward: 1:2.5 Invalidation: A 1H candle close below 4.900, which would signal a loss of the local uptrend support. Don't FOMO into the middle of this chop. Wait for the hourly candle to close strong, respect your stop loss, and never risk more than you can afford to lose. Do you think UNI is finally ready for a relief rally, or is this just a pause before the next leg down? $UNIUSDT #ByXIMPACT
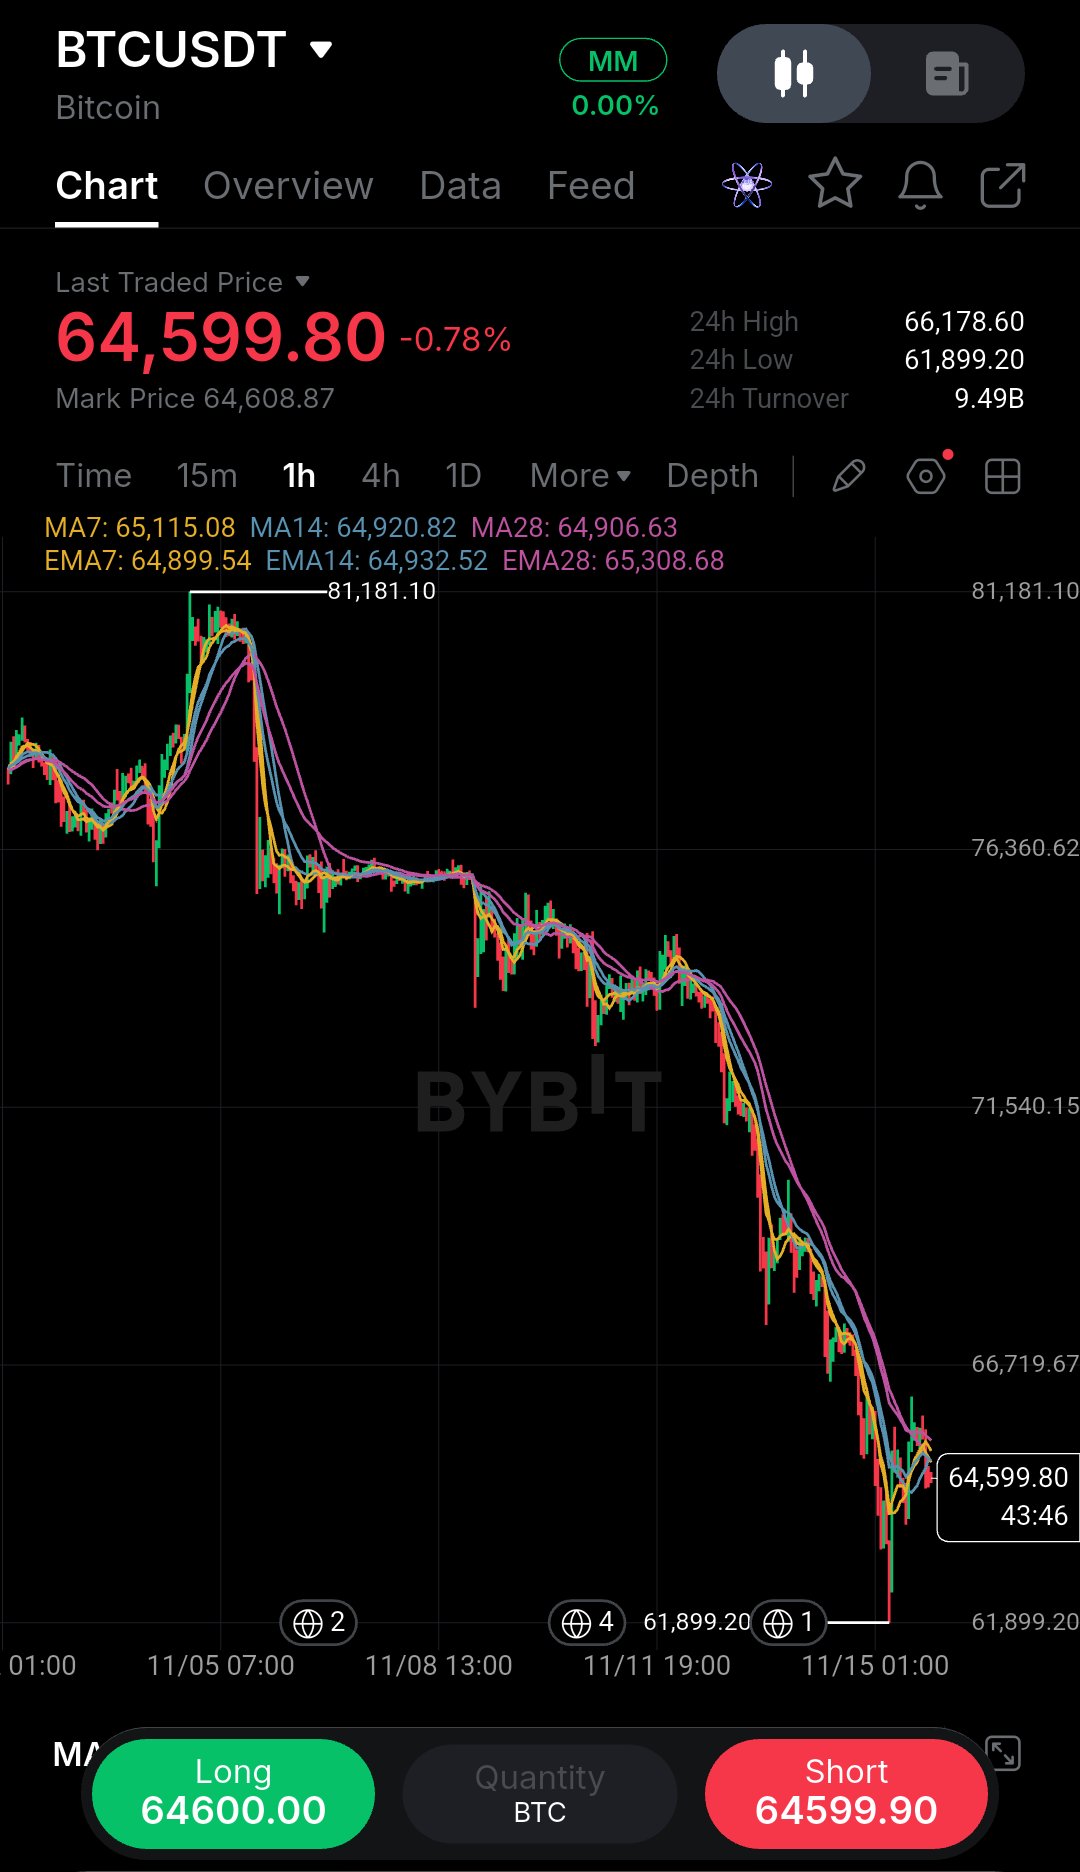
The first thing I ask myself looking at this BTC chart is whether I’d actually risk my own money here right now. Honestly, the answer is no—not in the middle of this heavy sell-off. But it’s a perfect example of why waiting for confirmation matters. Looking at the 1-hour timeframe, the macro trend is clearly bearish. We’ve bled from the 81,181 peak, and the recent price action is pure capitulation. A heavy -0.78% drop just sliced straight through support, tagging a low of 61,899.20. Right now, price is hovering at 64,599.80, and the moving averages are stacked heavily above us. The MA7 (65,115), MA14 (64,920), and MA28 (64,906) are all acting as dynamic resistance. This is a textbook bearish alignment. When price goes vertical like this, there is very little structural support underneath it. A lesson I’ve learned from taking too many early entries is that oversold does not always mean it’s time to buy. I always let the market prove it can find a floor before entering. Trade Plan: Bias: Bearish (Waiting for a dead-cat bounce or structural base). Entry Zone: 65,100 – 65,500 (Looking for a retracement to the MA cluster, only if it forms a clear rejection). Stop Loss: 66,200 (Above the previous breakdown block). Target 1: 61,899 (Recent low). Target 2: 60,000 (Psychological support). Target 3: 58,000 (Extended target). Risk/Reward: 1:2.5 Invalidation: A 1H candle close back above 66,000, signaling a massive V-shaped reversal. Do not FOMO into a falling candle. Wait for the market to cool off, respect your stop loss, and never risk more than you can afford to lose. Would you dare to catch this falling knife, or are you waiting for a clear reversal signal? $BTCUSDT #ByXIMPACT
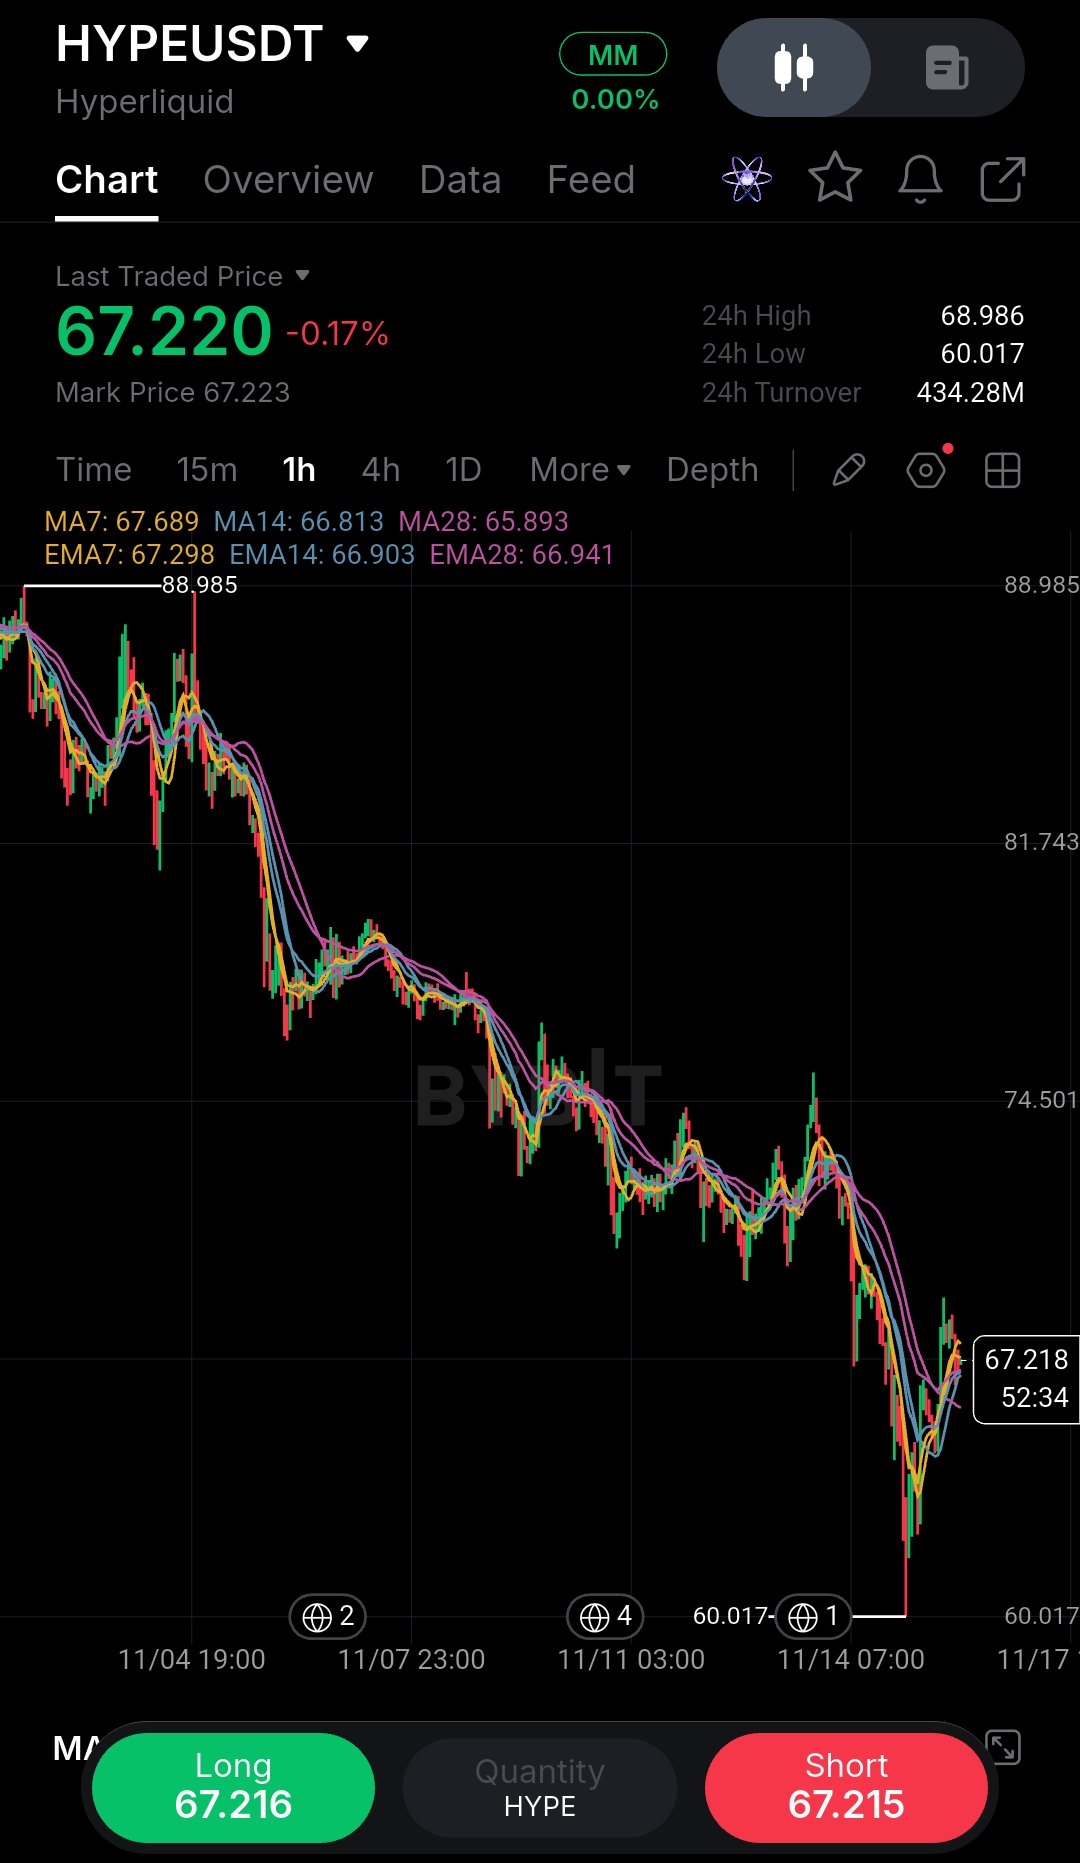
Casi ignoro este gráfico de HYPE hasta que noté cómo el precio estaba interactuando con los promedios móviles en el lado derecho. Mirando el marco de tiempo de 1 hora, la tendencia macro tuvo una caída fuerte desde el pico de 88.985 hasta el mínimo de 60.017. Pero haz zoom en la acción reciente del precio. La venta agresiva se estancó y hemos visto una recuperación fuerte y agresiva en forma de V que empujó el precio de nuevo hasta 67.220 (-0.17%). Aquí está el detalle crítico: el precio se está negociando actualmente justo en un clúster de promedios móviles extendidos. La MA7 (67.689), la MA14 (66.813) y la MA28 (65.893) están convergiendo justo en el precio actual. Este es un cambio estructural de libro de texto. Cuando una tendencia bajista deja de hacer mínimos más bajos y el precio recupera agresivamente sus promedios móviles, señala que los vendedores están agotados. Sin embargo, estamos probando una zona de resistencia local, así que esto es un rebote táctico, no una reversión completa todavía. Una lección que he aprendido de intentar atrapar cuchillos cayendo es que no compras el fondo; compras la confirmación de un cambio de estructura. Plan de Trading: Sesgo: Alcista a corto plazo (Jugando a la recuperación). Zona de Entrada: 65.900 – 66.800 (Buscando un ligero retroceso para volver a probar el clúster de MA). Stop Loss: 60.000 (Justo por debajo del reciente swing low local). Objetivo 1: 68.986 (Máximo de 24h y resistencia inmediata). Objetivo 2: 74.501 (Resistencia macro de rango medio). Objetivo 3: 81.743 (Nivel de ruptura anterior). Riesgo/Recompensa: 1:2.5 Invalidación: Un cierre de vela de 1H por debajo de 64.000, lo que señalaría una pérdida del soporte de la tendencia alcista local. No hagas FOMO en medio de este movimiento errático. Espera a que la vela horaria cierre con fuerza, respeta tu stop loss y nunca arriesgues más de lo que puedes permitirte perder. ¿Crees que HYPE finalmente está listo para un rally de alivio, o es solo una pausa antes de la siguiente pierna bajista? $HYPEUSDT #ByXIMPACT
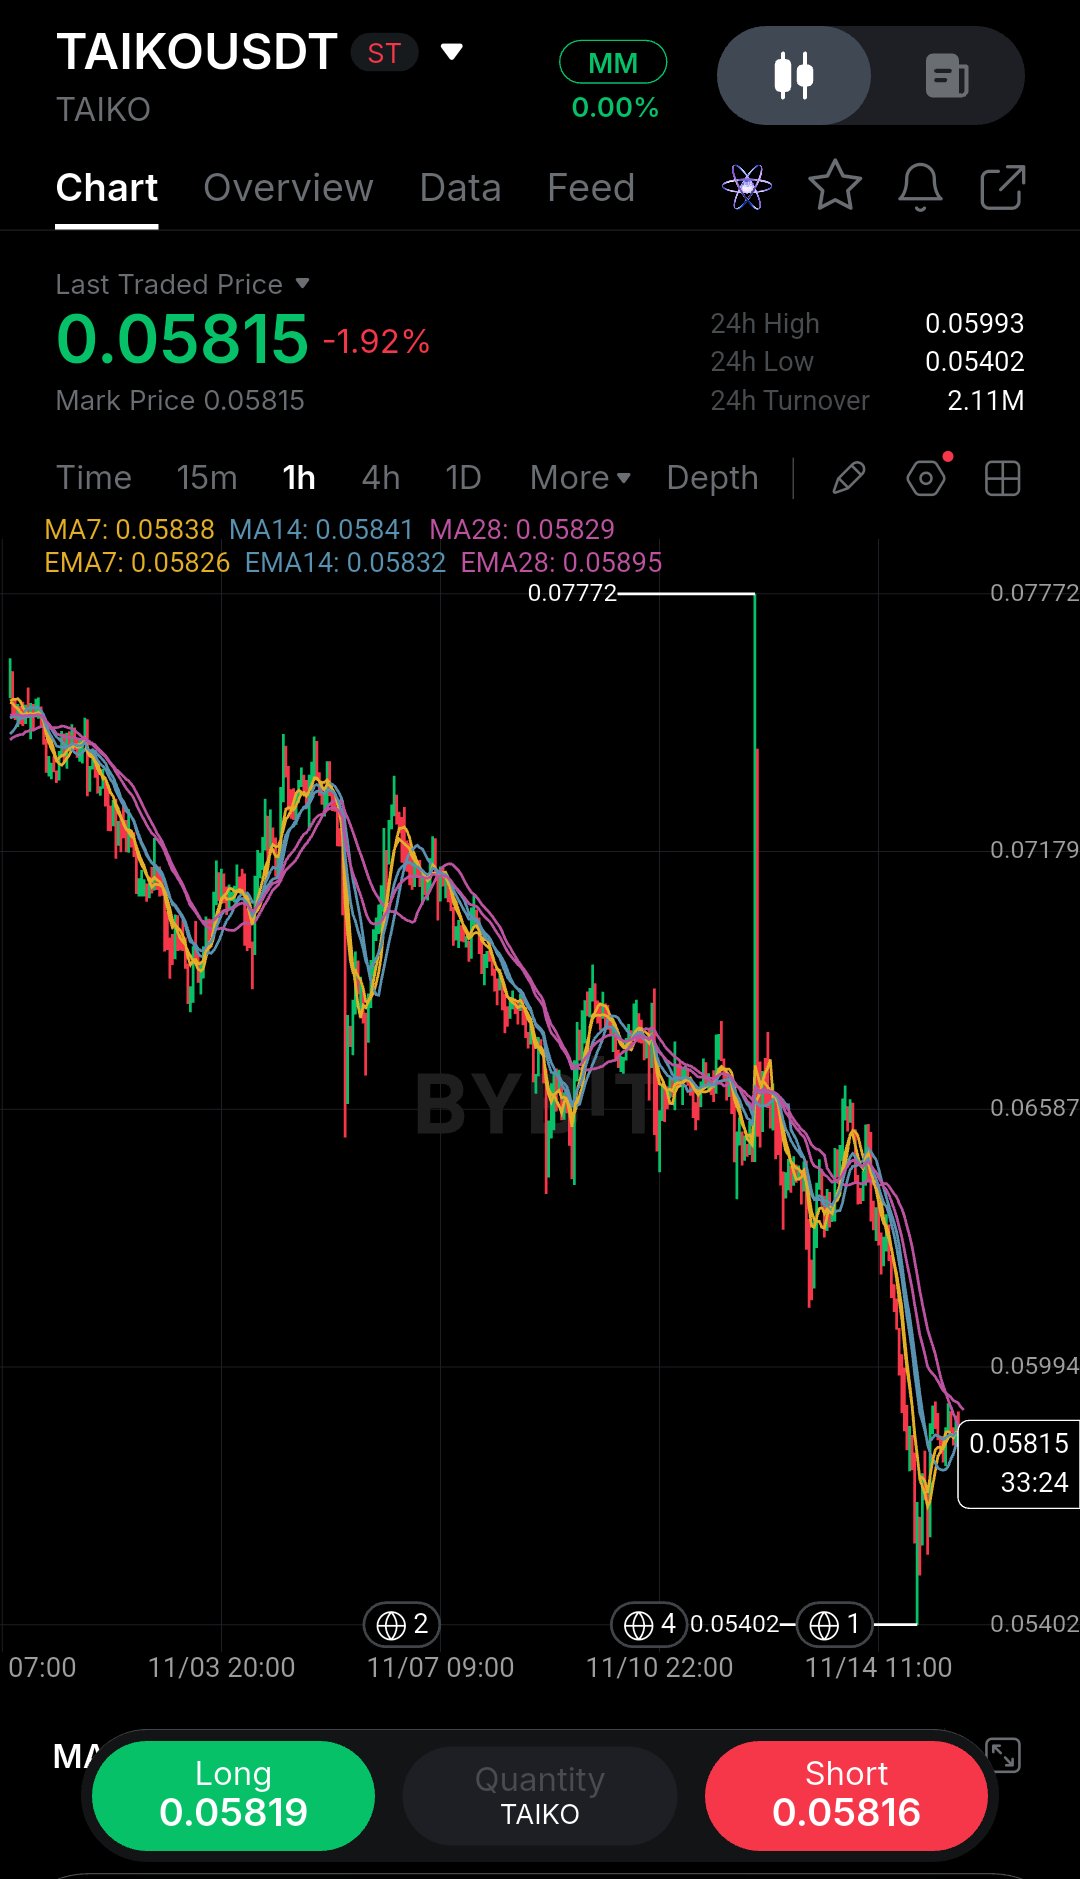
I almost ignored this TAIKO chart until I noticed how tightly the price was compressing against the moving averages on the right side. Looking at the 1-hour timeframe, the macro trend is undeniably bearish. We’ve been in a relentless bleed from the 0.07772 peak, printing a long sequence of lower highs and lower lows. But zoom in on the recent price action. After flushing to the 0.05402 low, the aggressive selling stalled. Price bounced back to 0.05815, and here is the critical detail: price is currently trapped inside a completely flat moving average sandwich. The MA7 (0.05838), MA14 (0.05841), and MA28 (0.05829) are all compressed into a tight knot right around the current price. This is a textbook volatility squeeze. After a massive drop, when the MAs flatten out like this, it means the selling momentum has completely dried up. The market is coiling, waiting for a catalyst. A lesson I've learned from trading these post-crash bases is that you don't guess the direction. I wait for the hourly candle to close decisively outside this cluster before risking capital. Trade Plan: Bias: Neutral (Waiting for a breakout). Entry Zone: 0.06000 – 0.06020 (Only on a strong 1H close clearing the local resistance and 24h high). Stop Loss: 0.05400 (Just below the recent macro swing low). Target 1: 0.06587 (Mid-range resistance). Target 2: 0.07179 (Previous breakdown level). Target 3: 0.07772 (Macro peak). Risk/Reward: 1:2.5 Invalidation: A 1H candle close below 0.05650, signaling a breakdown of this base and a resumption of the downtrend. Don't FOMO into the middle of this chop. Wait for the confirmation candle, respect your stop loss, and never risk more than you can afford to lose. Do you think TAIKO is finally finding a floor here, or is this just a pause before the next dump? $TAIKOUSDT #ByXIMPACT
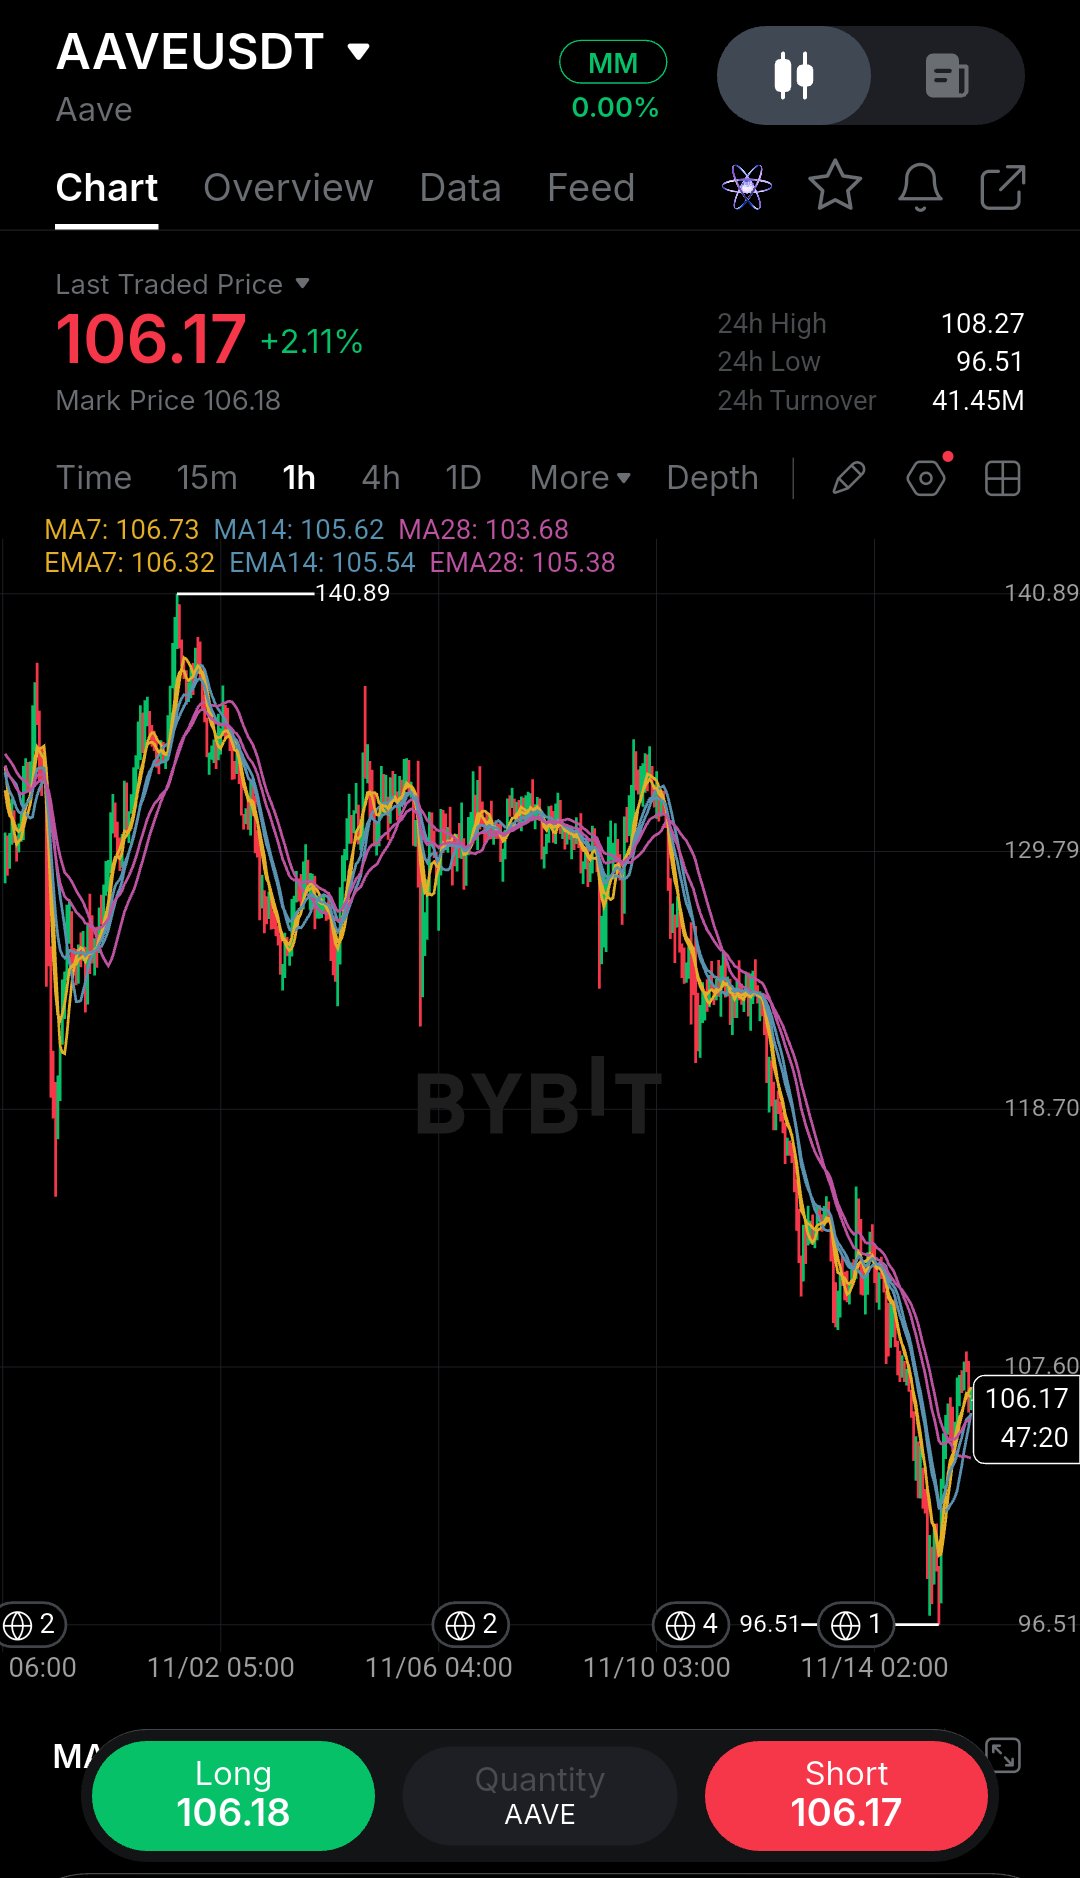
I almost ignored this AAVE chart until I noticed how the price was interacting with the moving averages on the right side. Looking at the 1-hour timeframe, the macro trend had a heavy bleed from the 140.89 peak down to the 96.51 low. But zoom in on the recent price action. The aggressive selling stalled, and we’ve seen a strong, aggressive V-shaped recovery pushing the price back up to 106.17 (+2.11%). Here is the critical detail: price is currently trading just above a fanned-out moving average cluster. The MA7 (106.73), MA14 (105.62), and MA28 (103.68) are all acting as dynamic support beneath us. This is a textbook structural shift. When a downtrend stops making lower lows and price aggressively reclaims its moving averages, it signals that sellers are exhausted. However, we are testing a local resistance zone, so this is a tactical bounce, not a full reversal yet. A lesson I've learned from trying to catch falling knives is that you don't buy the bottom; you buy the confirmation of a structure shift. Trade Plan: Bias: Short-term bullish (Playing the recovery). Entry Zone: 104.00 – 106.00 (Looking for a slight pullback to retest the MA cluster). Stop Loss: 96.50 (Just below the recent local swing low). Target 1: 108.27 (24h high and immediate resistance). Target 2: 118.70 (Mid-range macro resistance). Target 3: 129.79 (Previous breakdown level). Risk/Reward: 1:2.5 Invalidation: A 1H candle close below 102.00, which would signal a loss of the local uptrend support. Don't FOMO into the middle of this chop. Wait for the hourly candle to close strong, respect your stop loss, and never risk more than you can afford to lose. Do you think AAVE is finally ready for a relief rally, or is this just a pause before the next leg down? $AAVEUSDT #ByXIMPACT
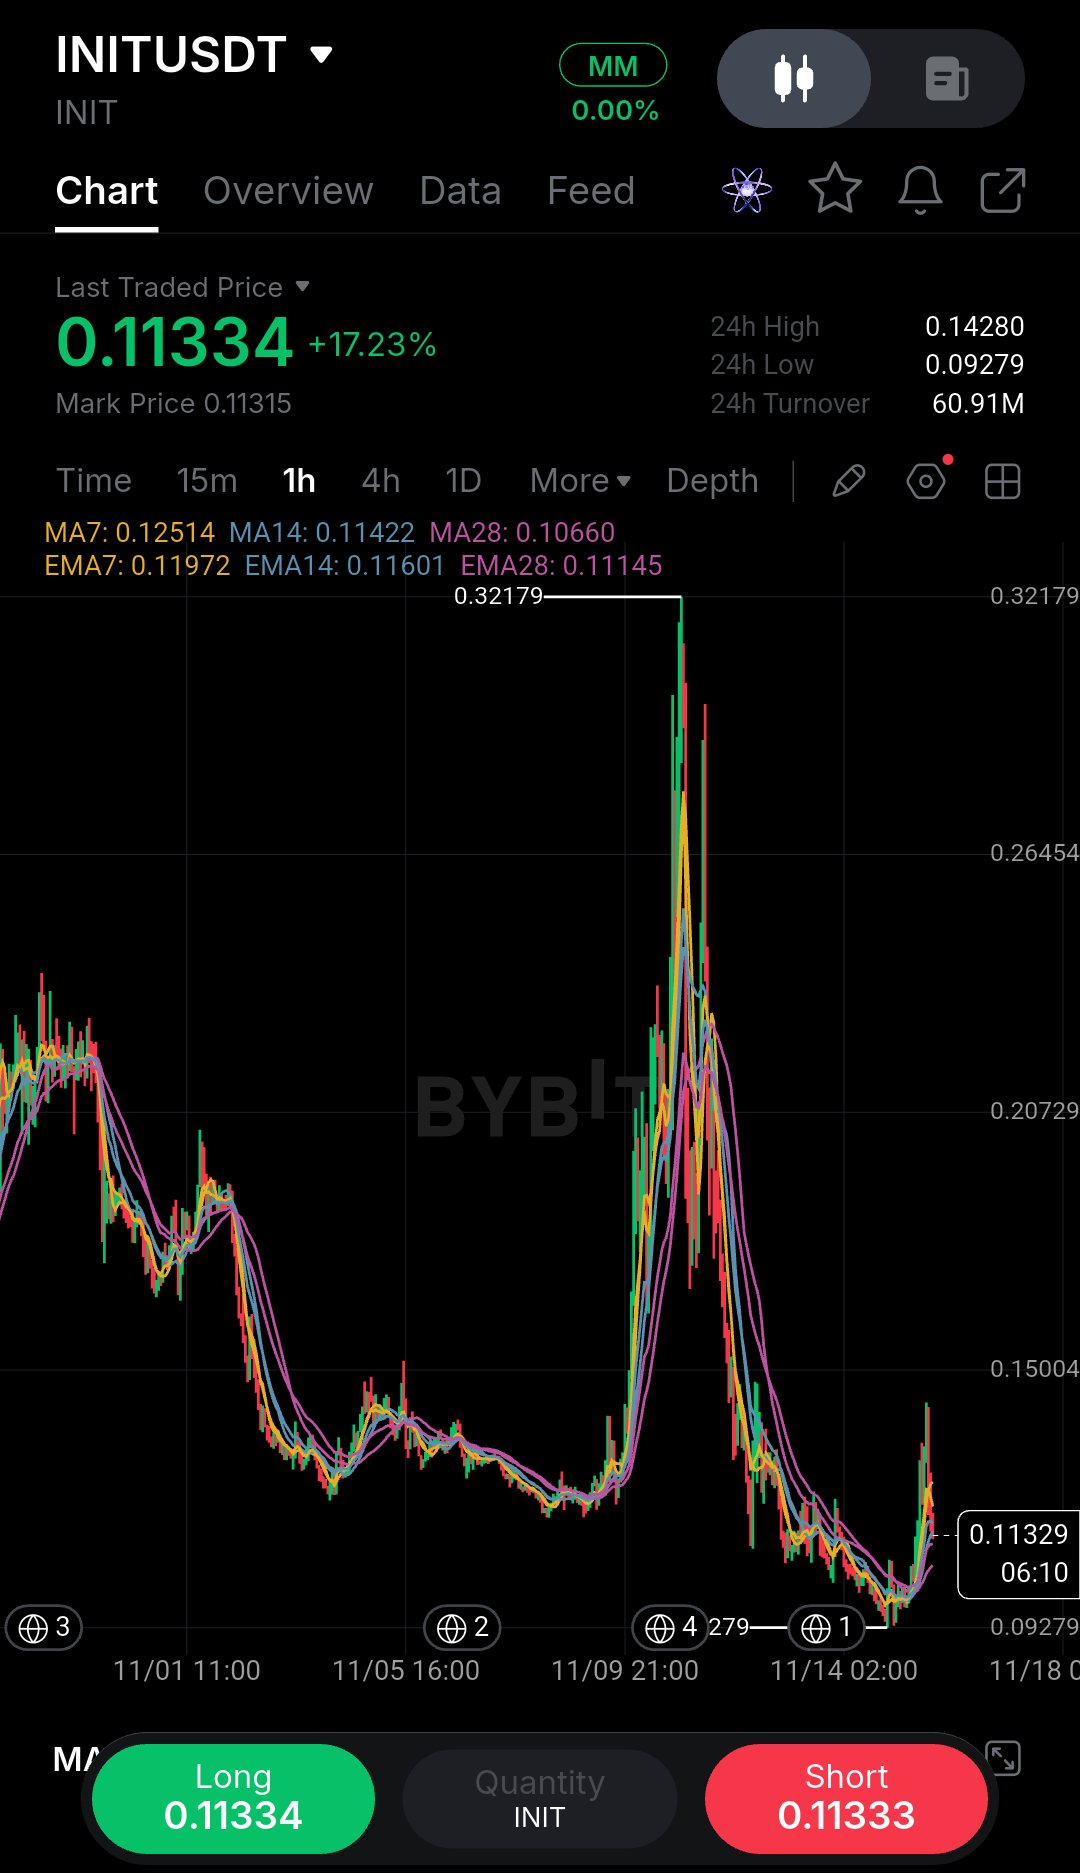
I almost ignored this INIT chart until I noticed how the price was interacting with the moving averages on the right side. Looking at the 1-hour timeframe, this chart is incredibly volatile. We saw a massive parabolic spike to 0.32179, followed by a brutal bleed all the way down to the 0.09279 low. But zoom in on the recent price action. The aggressive selling stalled, and we’ve just seen a strong impulse pushing the price back up to 0.11334 (+17.23%). Here is the critical detail: price is currently trading right at a fanned-out moving average cluster. The MA7 (0.12514), MA14 (0.11422), and MA28 (0.10660) are all converging right at the current price. This is a textbook structural shift. When a downtrend stops making lower lows and price aggressively reclaims its moving averages, it signals that sellers are exhausted. However, this move is getting extended. Chasing a green candle after a 17% spike is a great way to get trapped in a pullback. A lesson I've learned from chasing these reversals is that the initial impulse is often just the trap. I prefer to wait for the price to retest the moving averages before entering. Trade Plan: Bias: Short-term bullish (Playing the recovery). Entry Zone: 0.1060 – 0.1100 (Looking for a slight pullback to retest the MA28/MA14 cluster). Stop Loss: 0.0927 (Just below the recent local swing low). Target 1: 0.1428 (24h high and immediate resistance). Target 2: 0.2072 (Mid-range macro resistance). Target 3: 0.2645 (Previous breakdown level). Risk/Reward: 1:2.5 Invalidation: A 1H candle close back below 0.1000, signaling the bears are back in control. Don't FOMO into a vertical candle. Wait for the price to cool off and prove it can hold these levels, respect your stop loss, and never risk more than you can afford to lose. Do you think this recovery has legs, or is it just a lower high before the next dump? $INITUSDT #ByXIMPACT
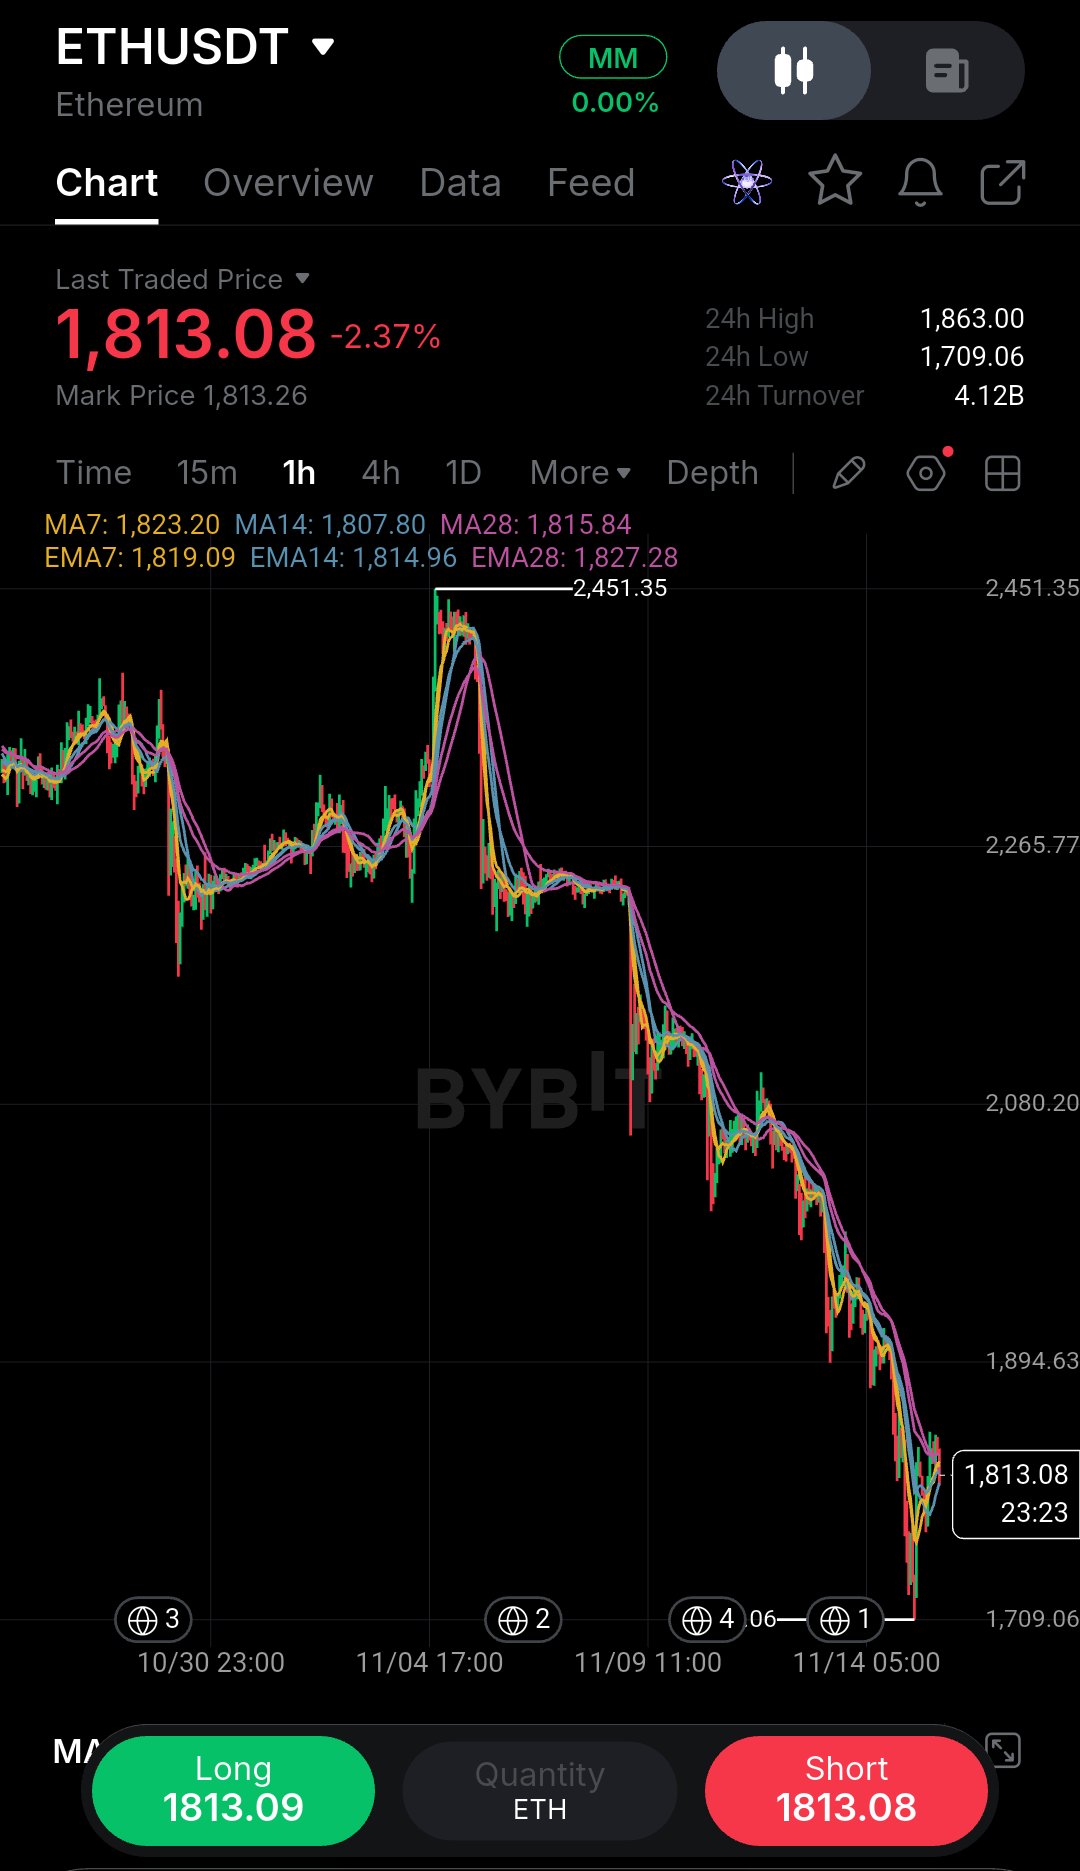
The first thing I ask myself looking at this ETH chart is whether I’d actually risk my own money here right now. Honestly, the answer is no—not in the middle of this heavy sell-off. But it’s a perfect example of why waiting for confirmation matters. Looking at the 1-hour timeframe, the macro trend is clearly bearish. We’ve bled from the 2,451.35 peak, and the recent price action is pure capitulation. A heavy -2.37% drop just sliced straight through support, tagging a low of 1,709.06. Right now, price is hovering at 1,813.08, and the moving averages are stacked heavily above us. The MA7 (1,823), MA14 (1,807), and MA28 (1,815) are all acting as dynamic resistance. This is a textbook bearish alignment. When price goes vertical like this, there is very little structural support underneath it. A lesson I’ve learned from taking too many early entries is that oversold does not always mean it’s time to buy. I always let the market prove it can find a floor before entering. Trade Plan: Bias: Bearish (Waiting for a dead-cat bounce or structural base). Entry Zone: 1,820.00 – 1,830.00 (Looking for a retracement to the MA cluster, only if it forms a clear rejection). Stop Loss: 1,863.00 (Above the previous breakdown block). Target 1: 1,709.06 (Recent low). Target 2: 1,680.00 (Psychological support). Target 3: 1,650.00 (Extended target). Risk/Reward: 1:2.5 Invalidation: A 1H candle close back above 1,850.00, signaling a massive V-shaped reversal. Do not FOMO into a falling candle. Wait for the market to cool off, respect your stop loss, and never risk more than you can afford to lose. Would you dare to catch this falling knife, or are you waiting for a clear reversal signal? $ETHUSDT #ByXIMPACT
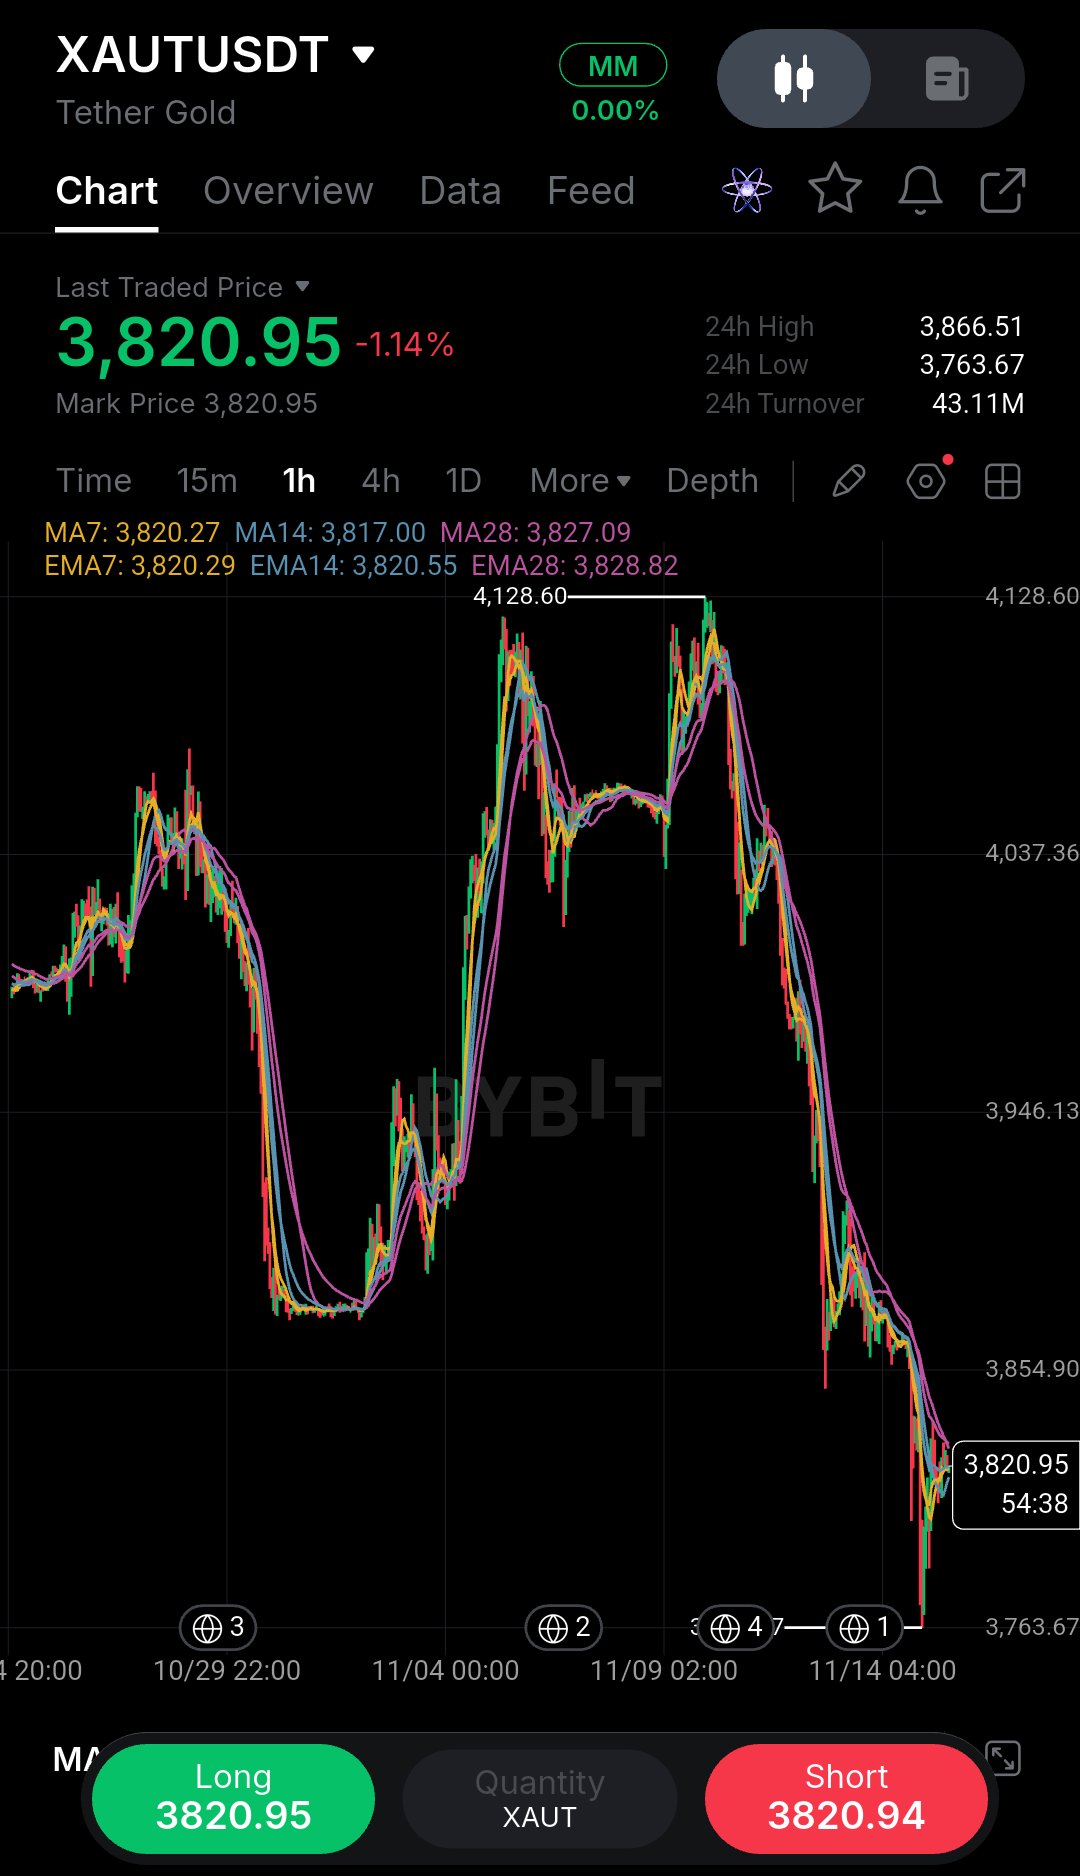
The first thing I ask myself looking at this XAUT chart is whether I’d actually risk my own money here right now. Honestly, the answer is no—not in the middle of this heavy sell-off. But it’s a perfect example of why waiting for confirmation matters. Looking at the 1-hour timeframe, the macro trend is clearly bearish. We’ve bled from the 4,128.60 peak, and the recent price action is pure capitulation. A heavy -1.14% drop just sliced straight through support, tagging a low of 3,763.67. Right now, price is hovering at 3,820.95, and the moving averages are stacked heavily above us. The MA7 (3,820.27), MA14 (3,817.00), and MA28 (3,827.09) are all acting as dynamic resistance. This is a textbook bearish alignment. When price goes vertical like this, there is very little structural support underneath it. A lesson I’ve learned from taking too many early entries is that oversold does not always mean it’s time to buy. I always let the market prove it can find a floor before entering. Trade Plan: Bias: Bearish (Waiting for a dead-cat bounce or structural base). Entry Zone: 3,825.00 – 3,830.00 (Looking for a retracement to the MA cluster, only if it forms a clear rejection). Stop Loss: 3,866.00 (Above the previous breakdown block). Target 1: 3,763.67 (Recent low). Target 2: 3,750.00 (Psychological support). Target 3: 3,700.00 (Extended target). Risk/Reward: 1:2.5 Invalidation: A 1H candle close back above 3,850.00, signaling a massive V-shaped reversal. Do not FOMO into a falling candle. Wait for the market to cool off, respect your stop loss, and never risk more than you can afford to lose. Would you dare to catch this falling knife, or are you waiting for a clear reversal signal? $XAUTUSDT #ByXIMPACT