BitXenMaster
30097Me gusta37Compartir en el chat342Aficionados14Seguir
Honest and simple 💖📈
Honest and simple 💖📈
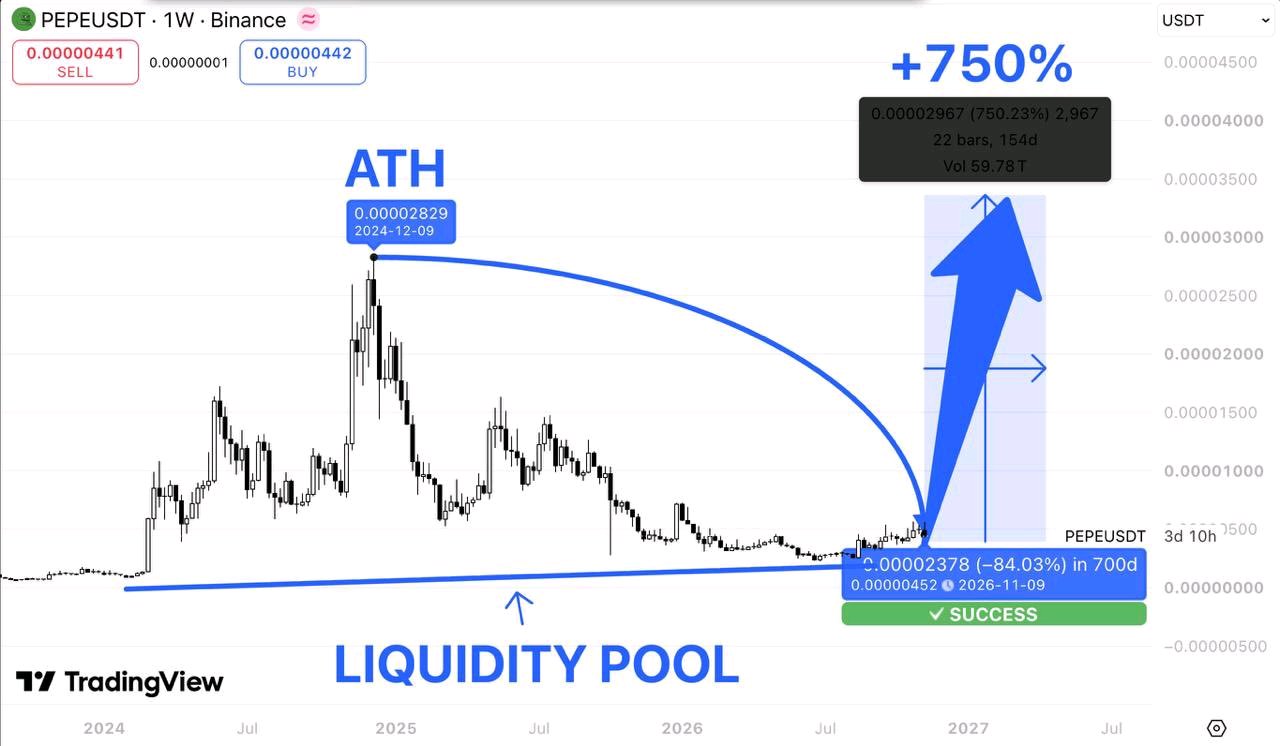
$PEPE is trading around $0.0000044.
And this weekly chart is showing a setup that could become very interesting. Remember when $PEPE reached its all-time high near $0.0000283 in December 2024? Since then, it's been a brutal correction. Lower highs. Failed recoveries. Months of persistent selling pressure. Now price is down more than 84% from its previous peak. But look at where we're sitting. $PEPE has returned to a major long-term liquidity zone, near the same historical price region that preceded its earlier explosive rallies. And that's what caught my attention. After months of declining prices, the market is beginning to stabilize near its lows. Could this be the foundation for another major expansion? Possibly. But buyers still need to confirm it. Here's my roadmap. $0.000007 — First resistance to reclaim. $0.000010 — Important psychological level. $0.000016 — Major historical resistance. $0.0000283 — Previous ATH. And $0.000034? That's my aggressive bull scenario. The chart illustrates a potential 750% rally from its marked historical reference point. But here's the important part. A return to historical support doesn't automatically mean the bottom is in. I want to see $PEPE establish higher lows, reclaim $0.000007, and eventually break above $0.000010 with sustained buying volume. That would provide stronger evidence that the weekly structure is shifting. Without those confirmations, the broader downtrend remains intact. Still, the psychology is fascinating. When $PEPE was trading near its all-time high, everyone wanted exposure. Now it's more than 80% below that peak, and sentiment looks very different. But meme coins can remain depressed for much longer than traders expect. The 750% projection is a speculative scenario, not a guaranteed outcome. For now, I'm watching whether buyers can defend this historical base. If the weekly structure finally reverses, $PEPE could become one of the more interesting recovery setups to follow.
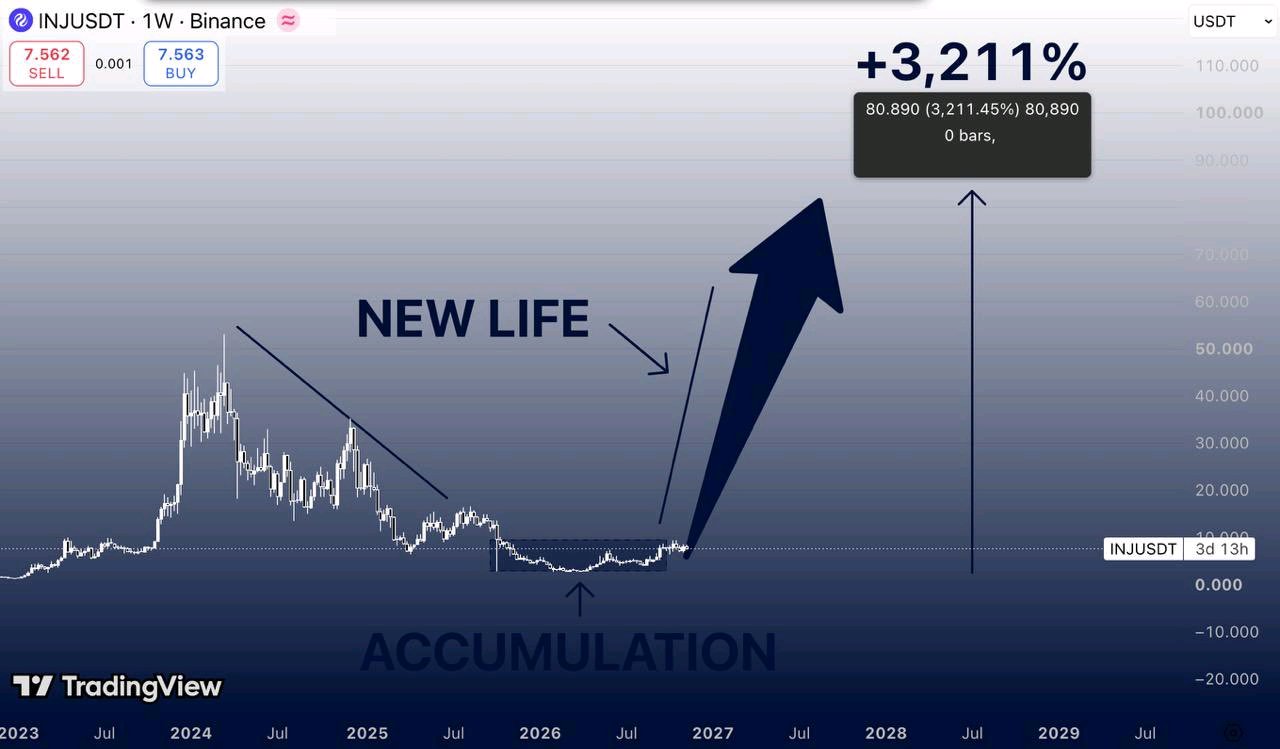
$INJ is trading around $7.56. And this weekly chart is starting to show something very interesting. Remember when $INJUSDT was trading above $50? Back in 2024, Injective was one of the strongest performers in the altcoin market. Then everything changed. Lower highs. Failed recoveries. Nearly three years of persistent selling pressure. But look at where price is sitting now. After a massive correction, $INJ has returned to a long-term accumulation zone near its historical lows. And something interesting is developing. Price has spent months consolidating inside this range, while the previous downtrend has started to lose momentum. Could this be the beginning of a new market cycle? Possibly. But the structure still needs confirmation. Here's my roadmap. $10 — First resistance to reclaim. $15–18 — Next important recovery zone. $30–35 — Major historical resistance. $45–50 — Previous cycle highs. $60 — Potential breakout continuation. And $80–85? That's my extreme bull scenario. The chart illustrates a potential 3,211% rally from its marked historical base. Sounds ambitious? Absolutely. But remember, $INJ has already demonstrated how aggressively it can move when market conditions turn favorable. Still, there's a massive difference between a potential accumulation zone and a confirmed bullish reversal. First, I want to see $INJ reclaim $10 and establish a clear sequence of higher highs and higher lows on the weekly timeframe. A sustained breakout above $15–18 would strengthen the case for a larger structural reversal. Without those confirmations, the broader downtrend remains a risk. But here's what makes this setup interesting. In 2024, traders were chasing $INJ above $40. Now it's trading below $8, and the excitement has almost completely disappeared. That doesn't automatically mean the bottom is in. But if buyers finally defend this long-term base and break the bearish structure, sentiment could change much faster than most expect. The $80 target is speculative. What matters first is whether $INJ can turn this consolidation into a genuine bullish trend. I'm watching the accumulation zone. The next major move could be worth paying attention to.
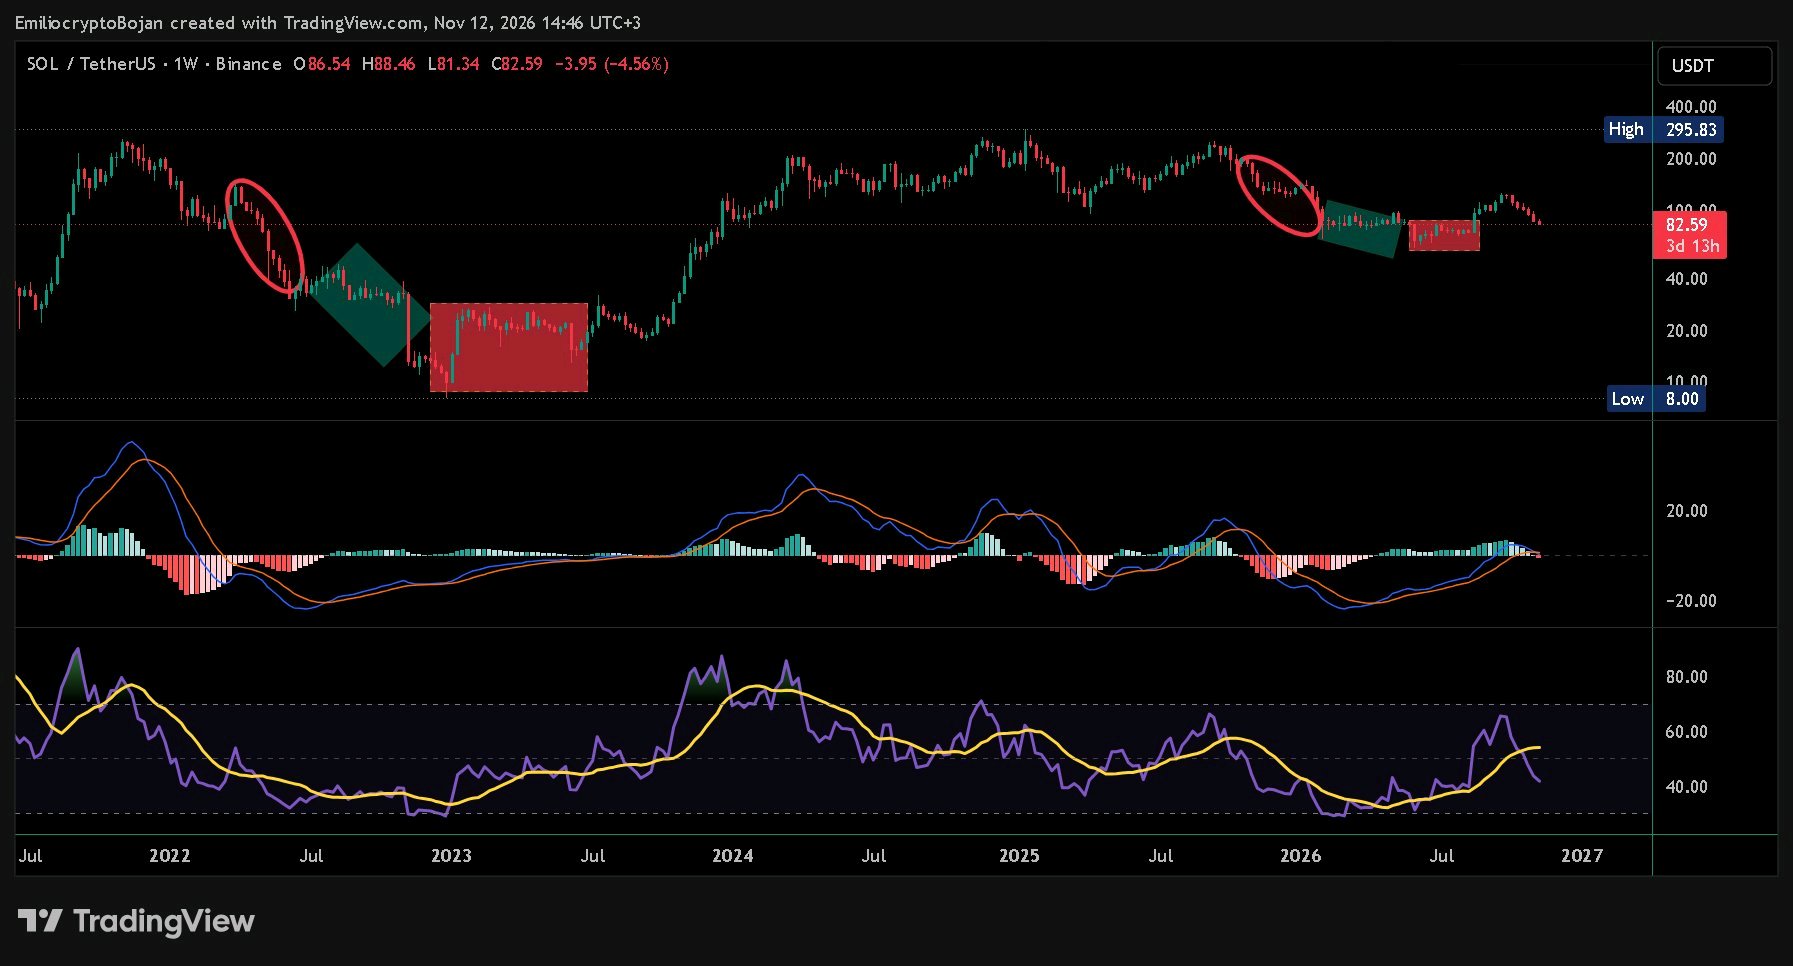
$SOLUSDT bulls are facing a huge blow today on the MACD. For the first time, we're seeing a negative histogram print on the weekly chart, signalling that sellers are gaining momentum and pushing for a bearish crossover. When the bears get their moment, we let them shine. But don't mistake that for abandoning the bigger picture. One thing I'm convinced of in this cycle is that we may not revisit the kind of lows we witnessed in May and June. That period marked a major transition for altcoins, moving from a bearish market structure toward a bullish phase. Take a closer look at my chart. I've drawn trend lines highlighting a repetitive pattern in how $SOL has behaved. We've seen a similar structure play out before, particularly in 2023. History doesn't have to repeat itself perfectly, but these similarities are worth watching. The market is testing conviction right now. Many will give up during this phase, while others will stay focused on the bigger picture. Whoever survives this dump deserves a 1,000x pump. 🚀 #WSOT2026 #USInflationRunsHotAndRateHikeBetsRise #SanDiskAnnounces8For1StockSplit #AnthropicIPOTestsTheAIBoom #BitcoinHitsTwoMonthLowAfterUSMidterms $BTCUSDT
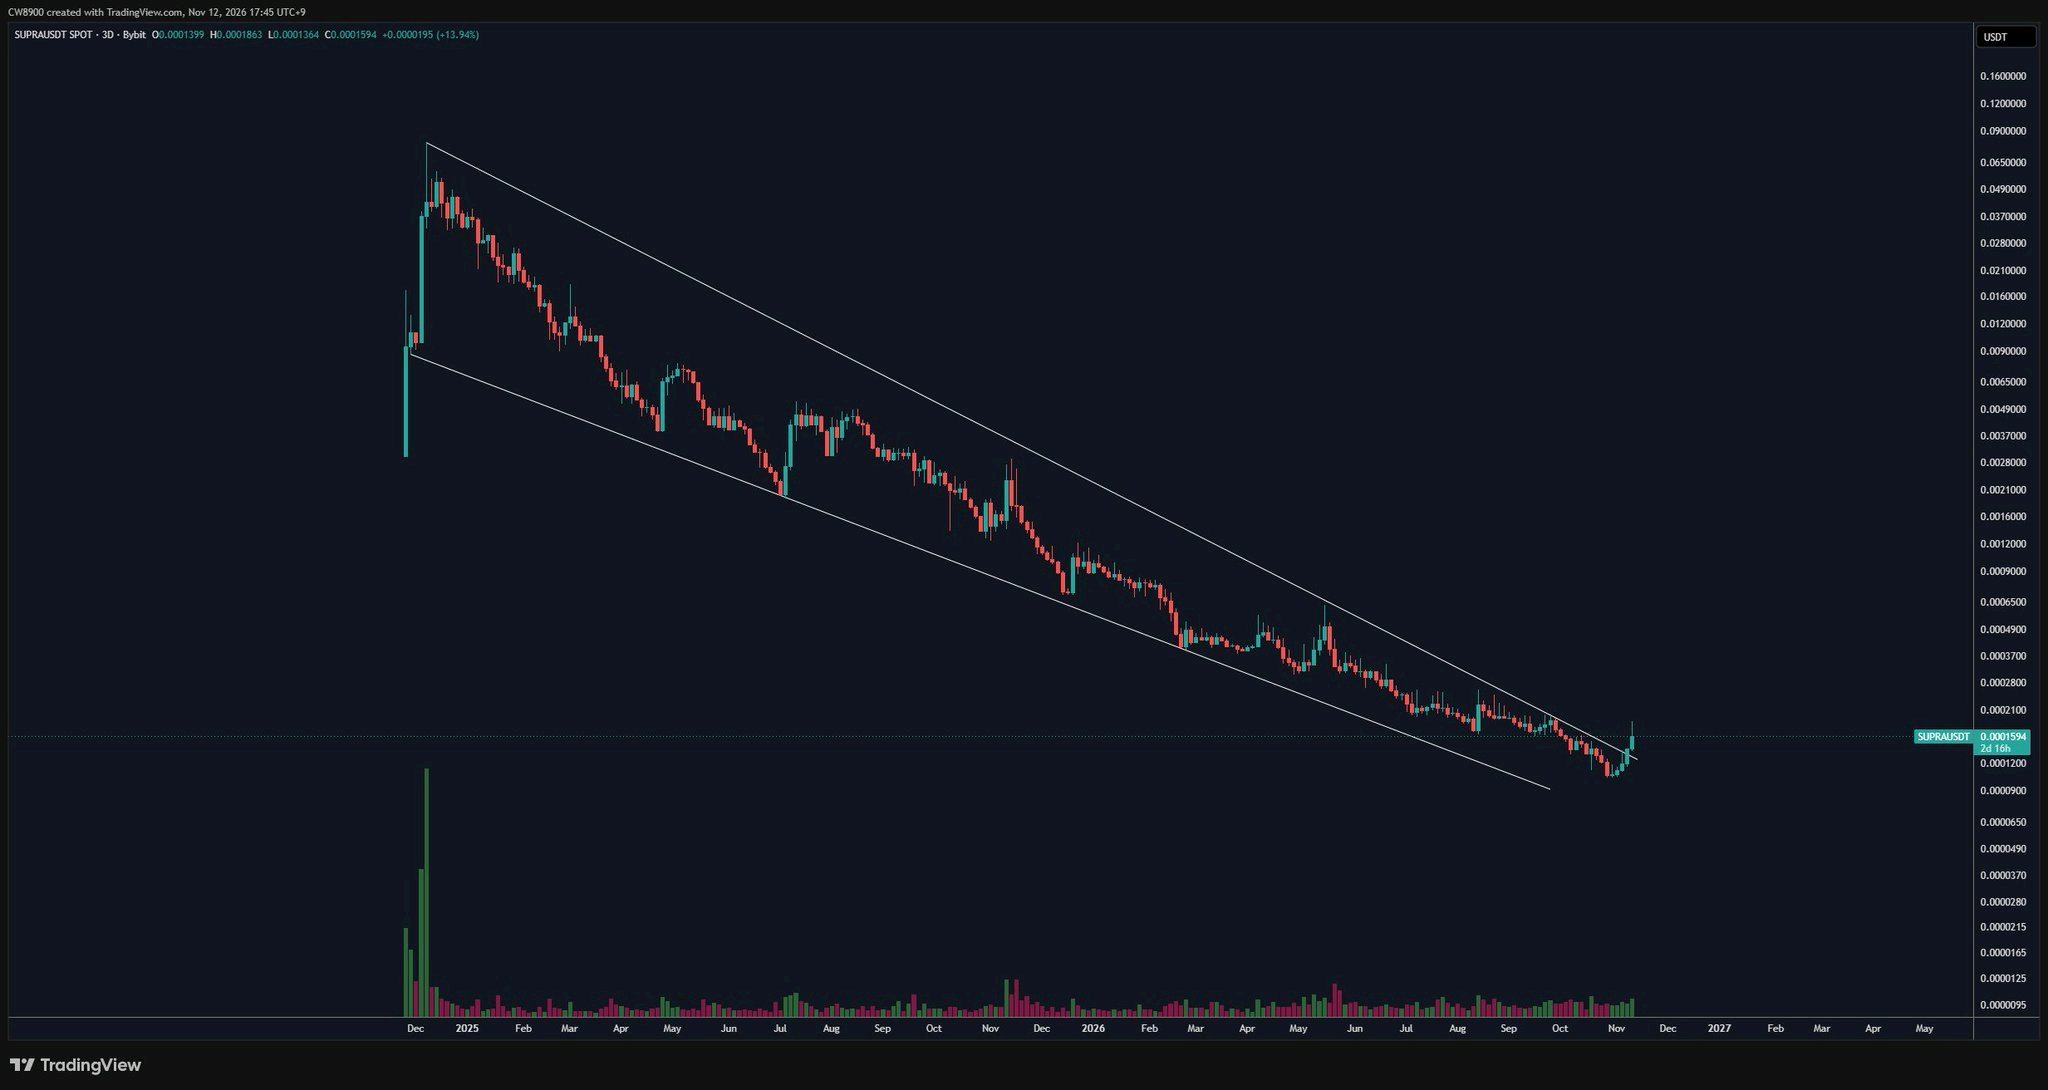
$SUPRAUSDT has broken out of a massive falling wedge pattern. The downtrend has ended, and an uptrend is beginning. #USPayrollsAndRateDecisionsDriveMacroWeek #NovUSCPIWatch #DeutscheBankLaunchesDigitalAssetCustody #AITechSelloffErases2Point5TrillionFromNasdaq100 #PiecesOf8
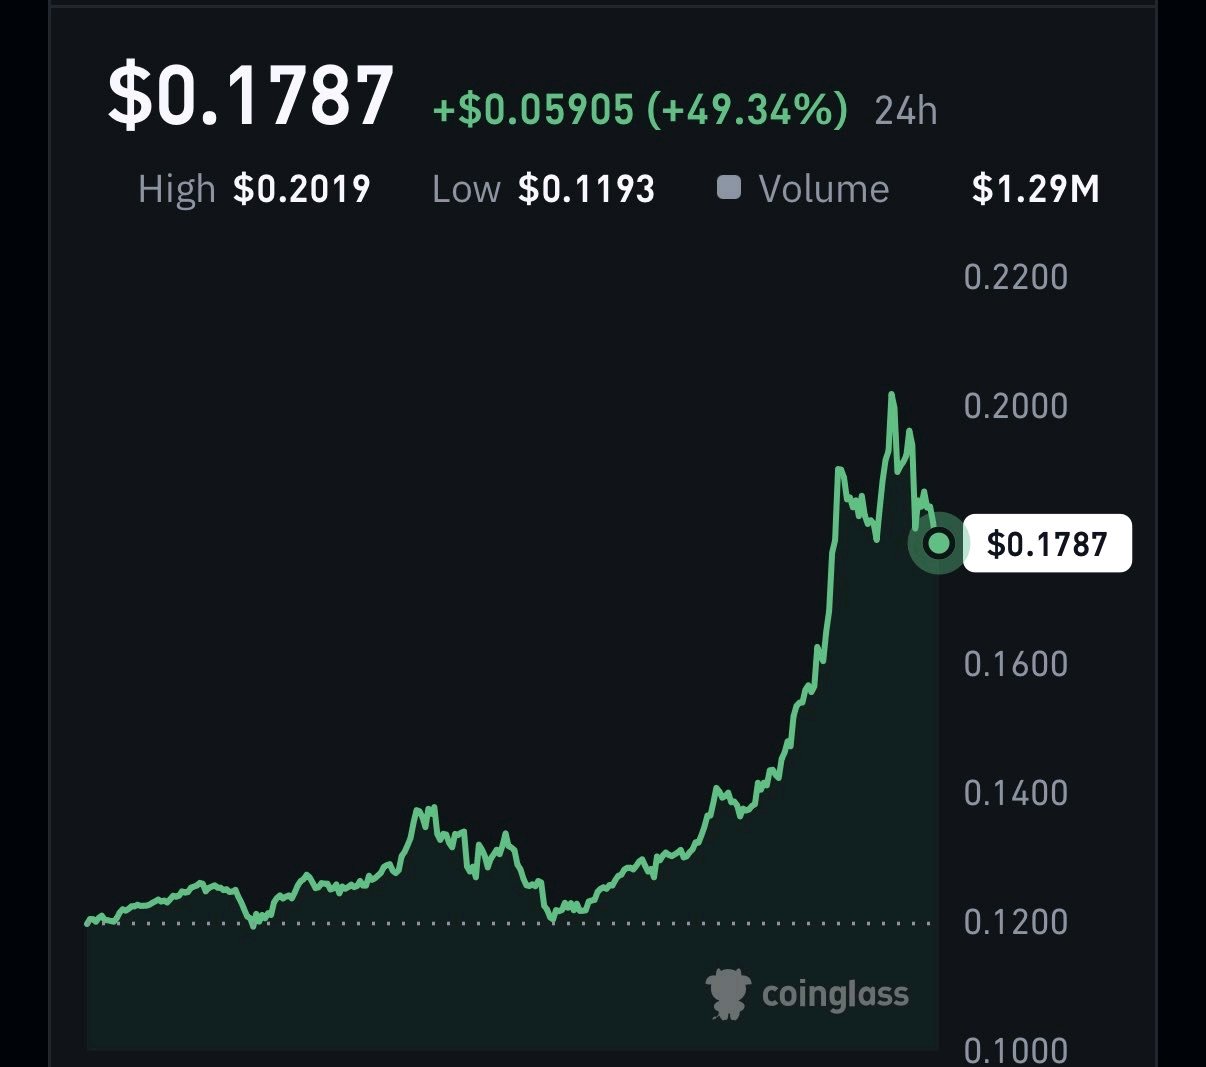
Let Me Tell You What I’m Watching on $INITUSDT First, look at the Open Interest.We can see that $INIT Open Interest is around $20.1M, up 130.65% in the last 24 hours. This is a significant increase in open positions. Trading activity and volume are also picking up, suggesting that market participation is increasing. But here’s what makes things interesting. The funding rates are extremely negative. Binance is showing around -1.3648%, Bybit around -2.0254%, and Hyperliquid around -2.6507%. This indicates that short positions are paying funding to long positions. At the same time, the short-term long/short ratio shows that around 58% of traders are short, while only 42% are long. So, we have sharply rising Open Interest, increasing volume, deeply negative funding rates, and more traders positioned short. In my view, if buying pressure continues, these heavily crowded short positions could create conditions for a short squeeze. However, with Open Interest rising so quickly, volatility and sudden price swings are also possible.Keep an eye on the next move. NFA. DYOR. #NovUSCPIWatch #WSOTPicktoEarn10U #WSOT2026 #USPayrollsAndRateDecisionsDriveMacroWeek #OilVolatilityTracksIranPeaceTalks
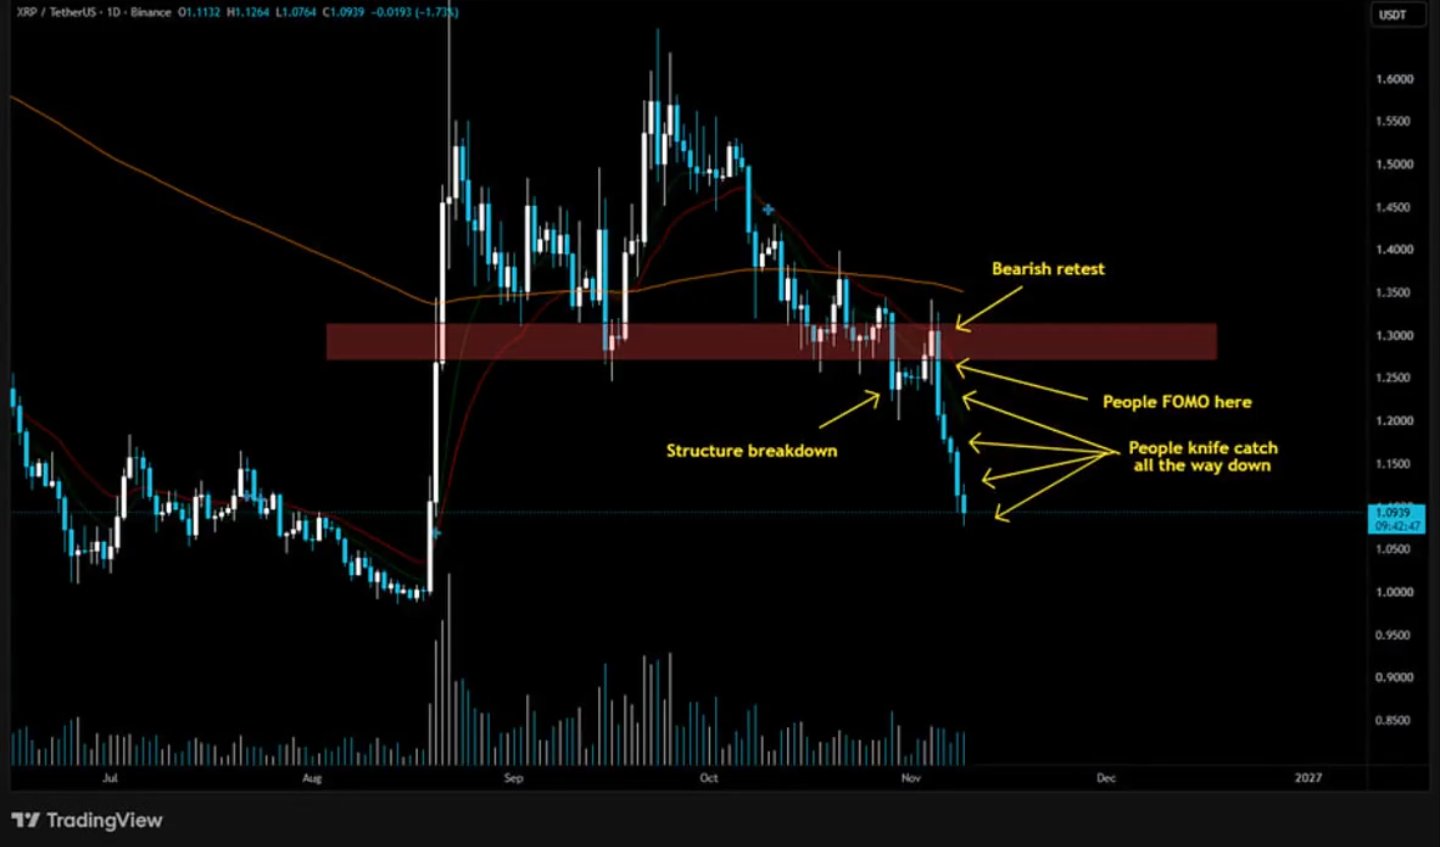
Just because $XRPUSDT is cheap doesn’t mean it’s a good buy. This recent downturn has taught the market an important lesson. When key support levels are decisively broken, a lower price does not necessarily represent a better buying opportunity. On the contrary, it often signals that sellers have taken control and that the market’s adjustment phase may not yet be over. Personally, I prefer to wait for the price to reclaim key levels and for buying interest to return before considering an entry. Levels to watch: $1.10 → $1.05 → $1.00 If support fails to hold, don’t rush to "buy the dip." Only look for potential rebound opportunities if the price manages to climb back above key resistance levels. Don’t try to catch a falling knife just to nail the absolute bottom. Protect your capital and wait for a genuine opportunity. #WSOT2026 #NovUSCPIWatch #WSOTPicktoEarn10U #USPayrollsAndRateDecisionsDriveMacroWeek #OilVolatilityTracksIranPeaceTalks $MNTUSDT
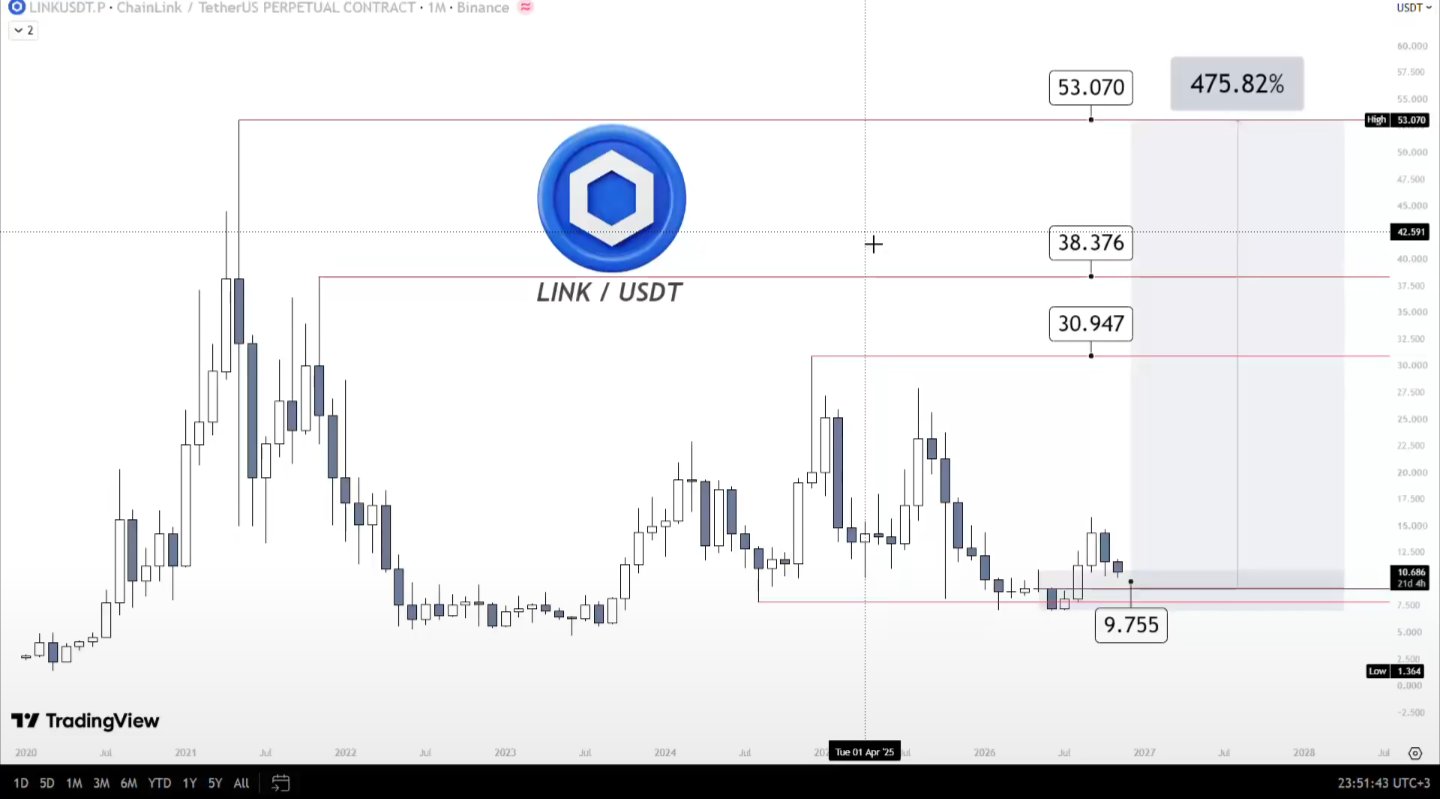
$LINKUSDT - A potential 500% opportunity🚀 I believe Chainlink is one of the most interesting infrastructure projects to accumulate ahead of the next major altcoin expansion. What is Chainlink? Chainlink is a decentralized oracle network connecting blockchains with real-world data and traditional financial infrastructure. Its technology enables smart contracts to access external data, transfer information between blockchains and support the tokenization of real-world assets (RWA) Why LINK? Main catalysts RWA adoption. Tokenization of stocks, bonds and other financial assets creates demand for reliable blockchain infrastructure. Institutional adoption. Chainlink has established integrations and partnerships involving SWIFT, Mastercard and major financial institutions. CCIP. Its cross-chain infrastructure enables secure communication and transfers between different blockchain networks. Chainlink Reserve. Revenue from network services can be converted into LINK, creating an additional source of token demand. Market psychology Most retail investors become interested in an asset after it has already delivered a significant move. I prefer identifying projects during periods of low market interest, when fundamentals continue developing but price action does not yet reflect that progress. This is where I see an interesting opportunity with LINK. Smart Money analysis My main accumulation interest is around 9.755$. I am monitoring liquidity below the current price and the possibility of a deeper correction before the next expansion. However, price does not necessarily have to reach 9.755$. If liquidity is collected earlier and bullish structure develops, the reversal could happen above this level. I will not chase the market. I want to accumulate where the risk-to-reward makes sense. My target: 53$ From the 9.75accumulation area represents approximately 443% upside. My thesis is based on three factors: Growing institutional adoption. Expansion of RWA and cross-chain infrastructure. A potential return of liquidity into fundamentally strong altcoins. The objective is simple: accumulate before the next major expansion, not after it. #WSOT2026 #NovUSCPIWatch #WSOTPicktoEarn10U #USPayrollsAndRateDecisionsDriveMacroWeek #OilVolatilityTracksIranPeaceTalks $ETHUSDT
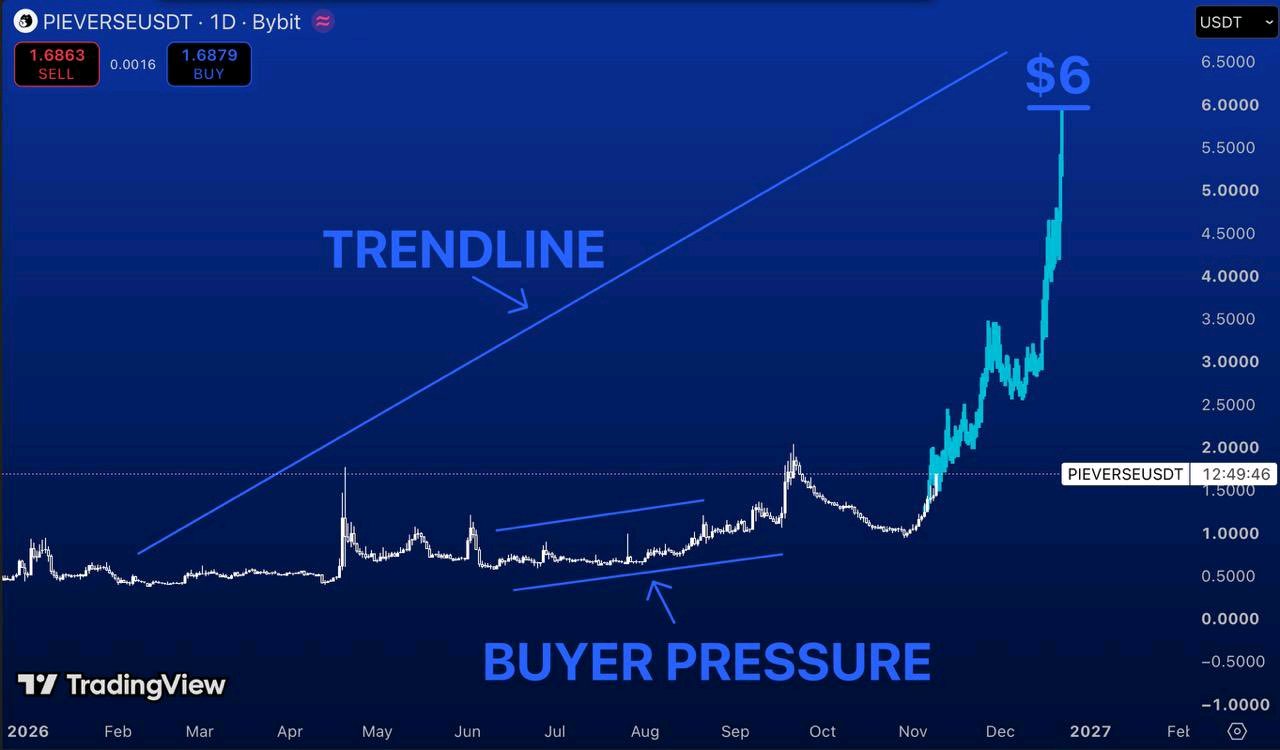
$PIEVERSEUSDT is trading around $1.69. And unlike most altcoins, this chart is actually showing signs of strength. Look at the daily timeframe. After months of consolidation, buyers started stepping in around $0.50–0.70. Higher lows began forming. Selling pressure weakened. Then price broke out and made a strong move toward $2. What's interesting is the structure behind that move. We're no longer looking at a coin stuck in a downtrend. We're looking at an asset attempting to establish a new bullish trend. Here's what I'm watching. $2 - The first major resistance to reclaim. $3–3.50 - The next area where sellers could step in. $4.50 - A potential continuation target. And $6? That's my aggressive bull scenario. The chart illustrates a possible move toward the upper trendline, but that doesn't make the target guaranteed. I want to see $PIEVERSE hold above $1.50 and continue building higher lows. Lose that structure, and the bullish thesis starts weakening. Because the most important part of this chart isn't the $6 target. It's whether buyers can keep control after the initial breakout. And right now, that's exactly what I'm watching. #WSOT2026 #NovUSCPIWatch #WSOTPicktoEarn10U #USPayrollsAndRateDecisionsDriveMacroWeek $MNTUSDT #OilVolatilityTracksIranPeaceTalks
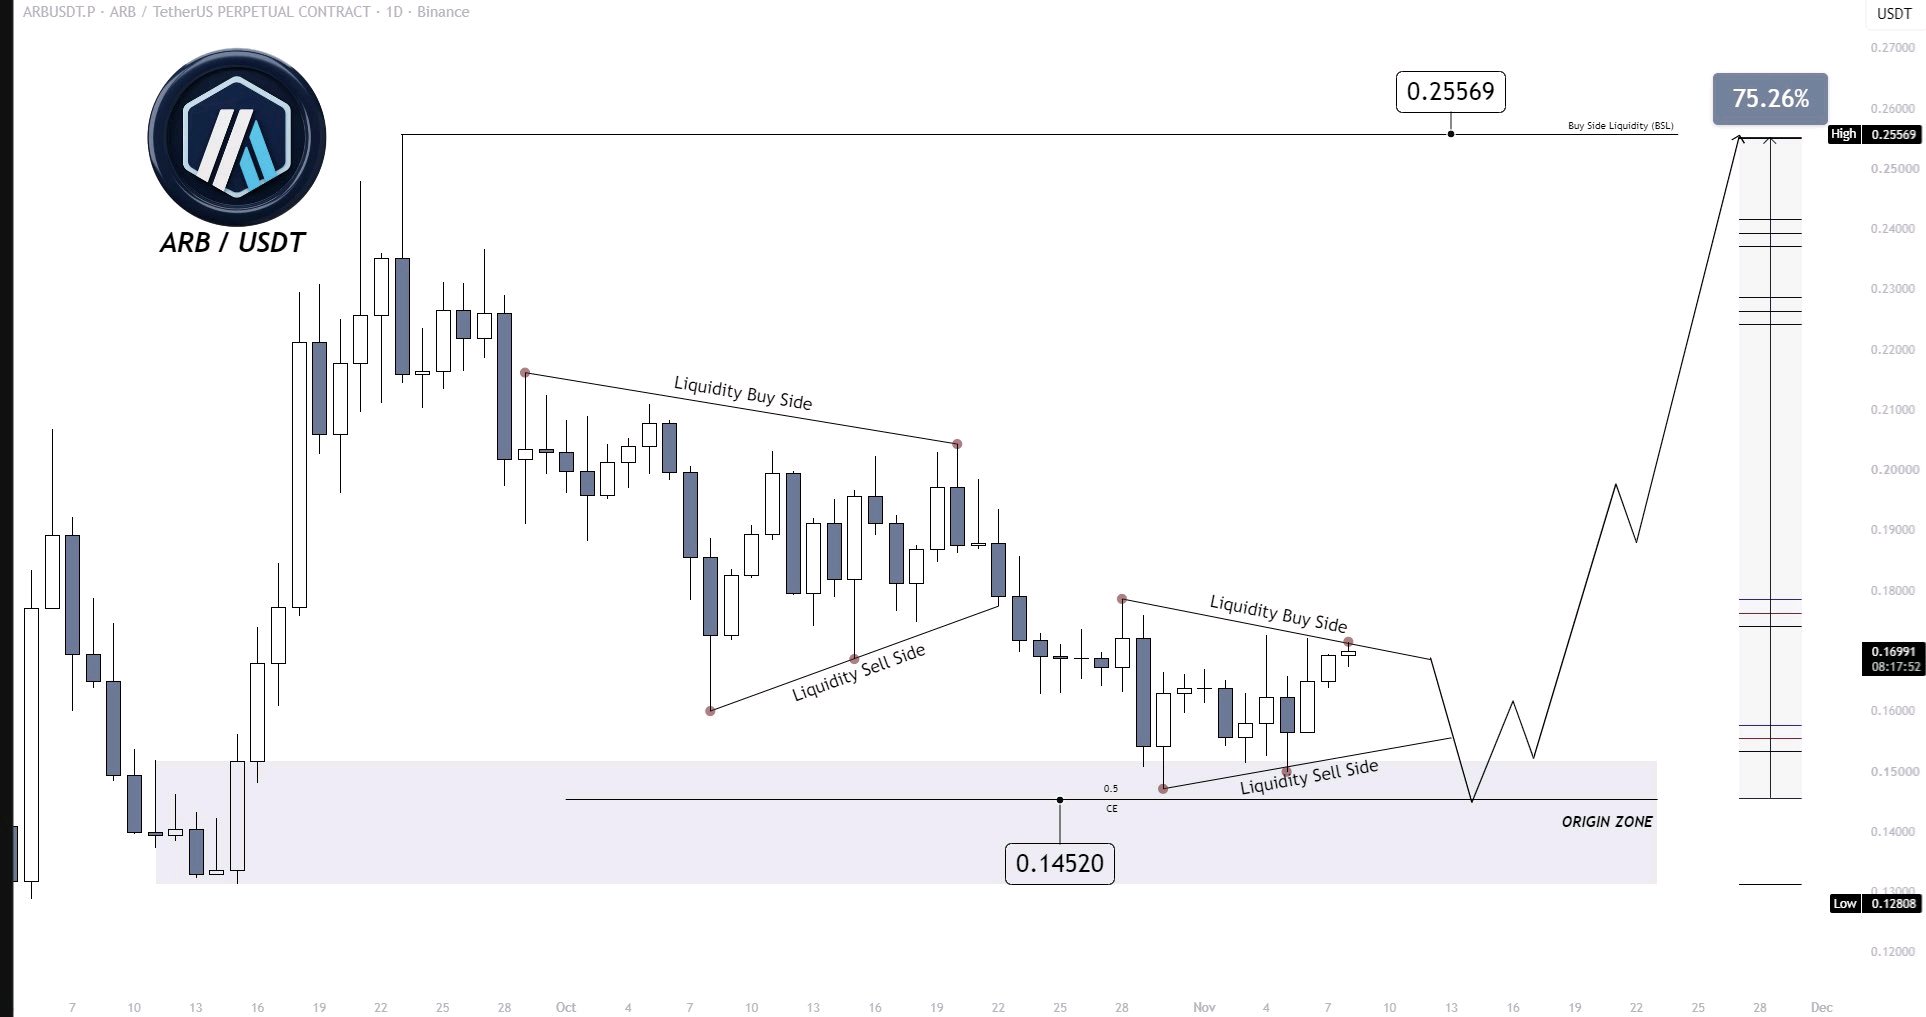
$ARBUSDT – Another liquidity manipulation before a potential reversal?👀 Previously, ARB formed a similar accumulation pattern, broke below the structure, but never retested our key 0.1452$ level Now, price appears to be forming almost the same setup again. The interesting part is what happens next. Will ARB break out and start moving higher, or are we about to see another liquidity sweep to the downside before a full reversal? My current expectation is a move lower, but I’m not rushing to open short positions. If price manages to reclaim the structure and establish itself above it, I’ll start looking for long opportunities instead. My targets: Short-term: 0.2557$ Long-term: 0.60$ #NovUSCPIWatch #WSOTPicktoEarn10U #USPayrollsAndRateDecisionsDriveMacroWeek #WSOT2026 #OilVolatilityTracksIranPeaceTalks $DOGEUSDT
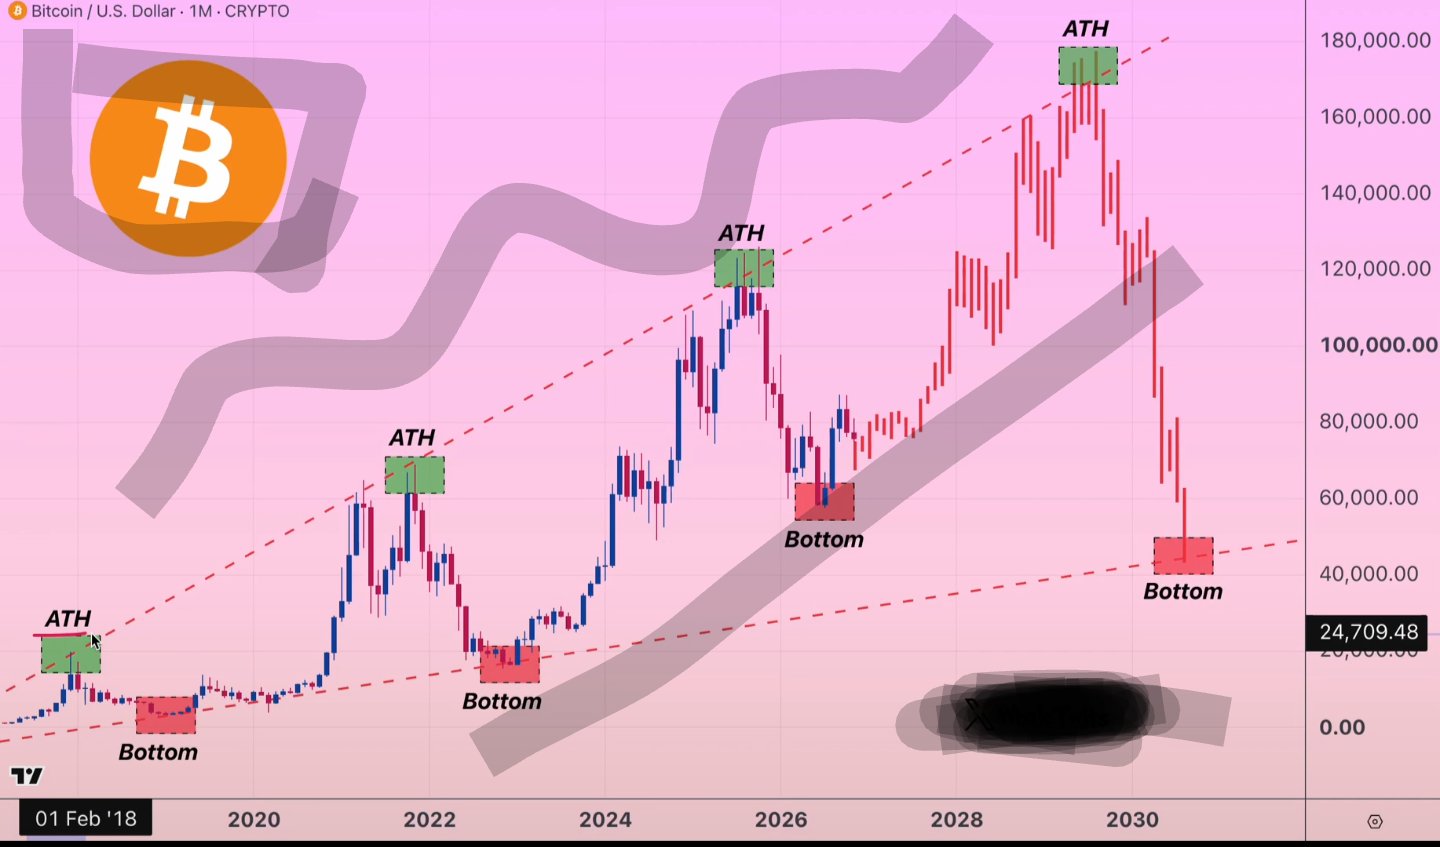
🚨 BITCOIN $BTCUSDT IS SETTING THE SAME TRAP THAT WIPED OUT RETAIL INVESTORS IN 2018 AND 2022. AND I BELIEVE THE NEXT MOVE COULD CREATE MILLIONAIRES. Look at this chart. 2018: CRASH → RECOVERY → NEW ALL-TIME HIGH. 2022: CRASH → RECOVERY → NEW ALL-TIME HIGH. 2026: CRASH → RECOVERY → NEW ALL-TIME HIGH? DIFFERENT YEARS. SAME MARKET PSYCHOLOGY. First, Bitcoin crashes. Retail investors panic. Everyone shouts that crypto is dead. Then selling pressure starts to fade. $BTC slowly recovers. But nobody believes it. “Just another dead cat bounce.” Then Bitcoin breaks through resistance. The rally accelerates. And suddenly, the same people who were afraid to buy start chasing the price higher. AT THE POINT WHEN THE BEST OPPORTUNITY MAY ALREADY HAVE PASSED THEM BY. Here’s what most investors don’t understand. The biggest opportunities usually don’t come when everyone is confident. They come when fear is everywhere. WHEN BUYING FEELS LIKE THE STUPIDEST POSSIBLE DECISION. I’ve seen this before. In November 2022, I told everyone that Bitcoin would bottom at $16,000. I also predicted the cycle top of $126,000 in October 2025. Now I’m preparing for the next big opportunity. BUT I’M NOT BUYING BLINDLY. I still believe there could be one final capitulation. And I want to see sellers exhausted, the key support level holding, and a confirmed reversal before I make my next move. Because if the historical cycle repeats, the prices everyone fears today could become the prices they desperately want to buy at. History is no guarantee. But ignoring the possibility of another major recovery could be a costly mistake. SAVE THIS CHART. Follow + turn on notifications. When I see my next big BUY signal, I’ll share it HERE FIRST. THE CROWD WON’T BE BULLISH UNTIL THEY SEE BITCOIN MAKING NEW HIGHS. I’M WAITING FOR THE OPPORTUNITY BEFORE THAT HAPPENS. DON’T LET FEAR MAKE YOUR DECISIONS FOR YOU. #WSOT2026 #NovUSCPIWatch #WSOTPicktoEarn10U #USPayrollsAndRateDecisionsDriveMacroWeek #BybitAIEvolving
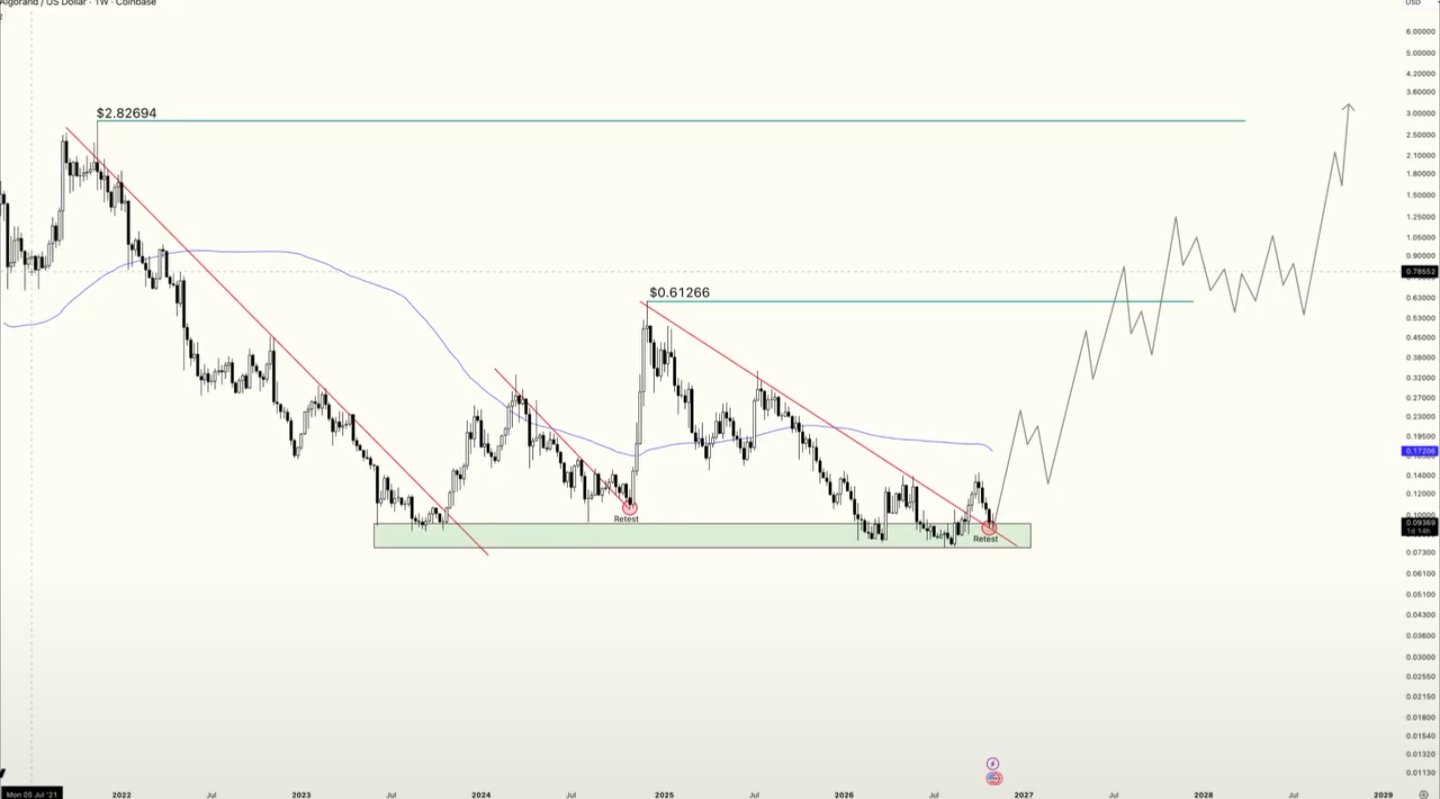
🚨 $ALGO IS TESTING ONE OF ITS MOST IMPORTANT LEVELS SINCE OCTOBER 2024. There's a historical pattern in Algorand that I'm watching closely: Break above a major bearish trendline. Retest that broken trendline. Strong rally follows. We've seen similar setups play out before. Right now, $ALGOUSDT has broken its long-term downtrend and is testing that trendline again. This is the level that matters. If support holds and buyers step in, the setup could become very interesting. I'm still confident in $ALGO's long-term potential, but I want to see confirmation before getting ahead of the market. $ALGO is one of the few altcoins I'm monitoring closely right now. Follow me and turn on notifications for more market updates. #ALGO #Algorand #Crypto #Altcoins #WSOTPicktoEarn10U #NovUSCPIWatch #USPayrollsAndRateDecisionsDriveMacroWeek #WSOT2026
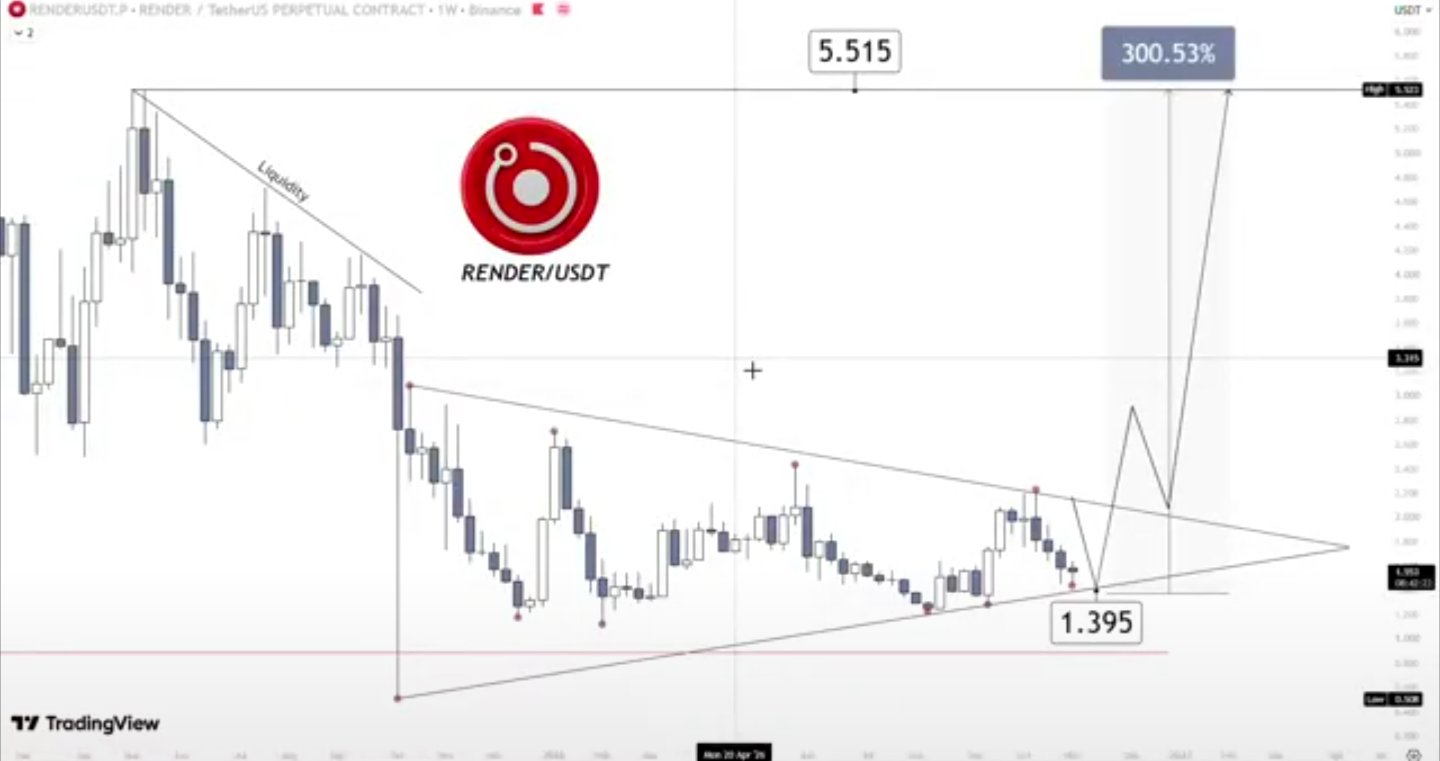
$RENDER – This structure deserves your attention🚨
One of the most interesting charts I’m watching right now. On the weekly timeframe, $RENDERUSDT is forming a large symmetrical triangle, with price approaching the apex of the structure. We’re also seeing massive liquidity sitting above the current price. Here’s why I’m paying attention: 1. Price is approaching a critical decision zone where a major breakout could develop. 2. A potential liquidity sweep towards 1.395$ could provide the final manipulation before a bullish reversal. 3. A confirmed breakout above the descending resistance could trigger a strong expansion towards the upper liquidity levels. But there’s another reason why I’m interested in $RENDER The fundamentals are developing: 1. The network has already processed more than 82.5 million rendered frames. 2. SaladCloud has introduced RENDER payments and rewards, expanding real-world demand within the ecosystem. 3. On November 16, Render will showcase Quantum Stargate, an immersive 8K artwork powered by its decentralized GPU network. This is exactly why I believe RENDER deserves a place on your watchlist. My chart shows a potential upside of approximately 300%, with 5.515$ as the major target. Of course, confirmation is everything. I want to see the structure break before considering the bullish scenario activated. Don’t ignore this chart. The next major move could be closer than many expect🚀 #MidtermsMarketWatch #AnthropicIPOTestsTheAIBoom #BOERateDecision #BybitAIEvolving #OilVolatilityTracksIranPeaceTalks
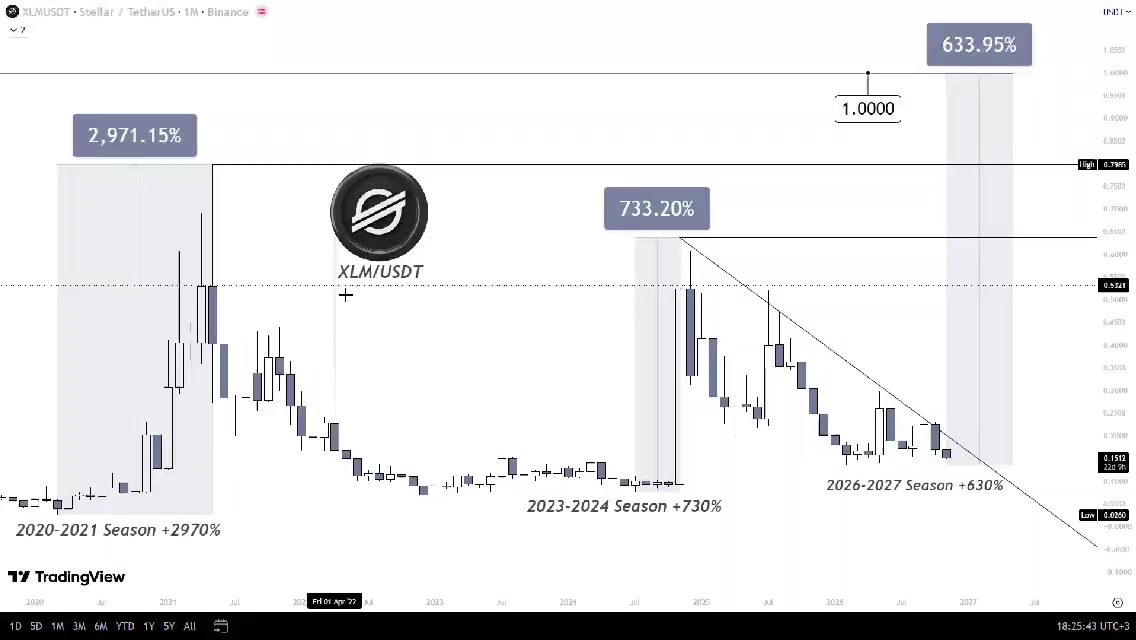
$XLMUSDT – Could Stellar be preparing for another 600%+ rally🚀 Let’s look at its historical performance. During the 2020–2021 bull market, XLM delivered an incredible +2970% rally. During the 2023–2024 season, it gained another +733% Now, heading into the 2026–2027 cycle, something interesting is developing. XLM is forming a large descending triangle on the monthly timeframe and is currently trading near its key historical lows. Here’s what I’m watching: 1. A breakout above the descending resistance. 2. A confirmed change in market structure. 3. Strong buying pressure and increasing volume. 4. A potential retest of the breakout zone before continuation. If this structure breaks to the upside, my chart maps a potential move of approximately +630% with 1$ as the target. But there’s one important factor I want everyone to pay attention to: Institutional adoption. Stellar is positioning itself as infrastructure for global payments and real-world asset tokenization. Its growing connections with major financial institutions could significantly strengthen the long-term ecosystem. If institutional adoption accelerates and capital flows back into the crypto market, XLM could become one of the interesting altcoin plays of the 2026–2027 cycle. History doesn’t guarantee a repeat, but this chart deserves attention. $XAUTUSDT
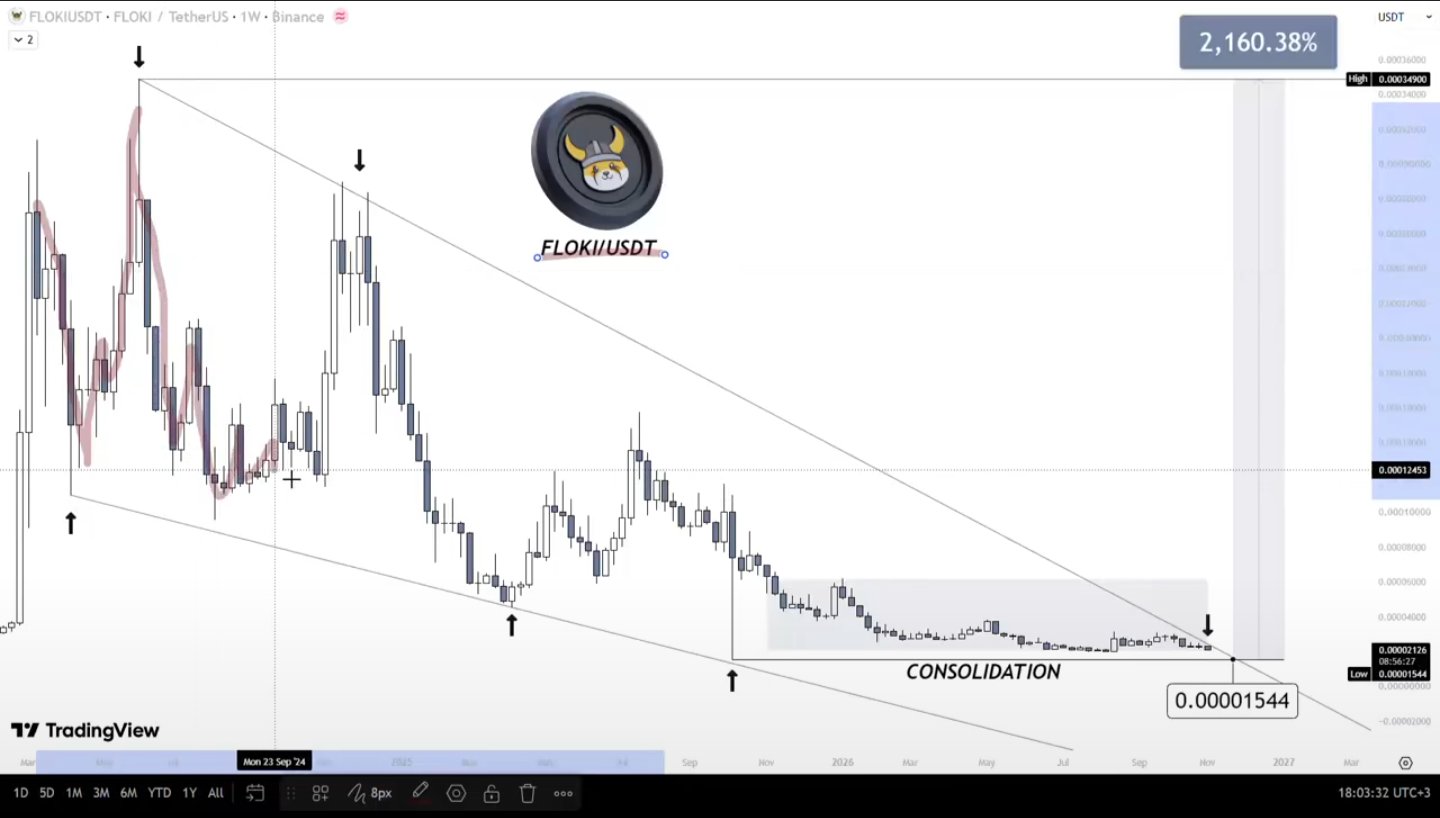
$FLOCKUSDT – Could this memecoin deliver a 2,000% rally during the 2026/27 bull run? 🚀 Here are 5 factors that could trigger a massive upside move: Massive meme coin season If capital starts flowing aggressively into the meme coin sector, FLOKI could become one of the major beneficiaries thanks to its established brand and large community. Valhalla ecosystem growth Valhalla is FLOKI flagship blockchain gaming project. If user adoption increases and the game attracts a larger audience, it could create additional demand for the ecosystem. Growing real utility FLOKI is building beyond the traditional memecoin narrative, with products such as FlokiFi, TokenFi, and its Trading Bot. Greater adoption could strengthen its long-term fundamentals. Exchange and institutional exposure Listings on major platforms, including Robinhood, alongside European ETP exposure, could help attract new investors and increase market accessibility. Token burns and growing demand Parts of the ecosystem’s revenue contribute to token burns. If product adoption grows while market demand increases, this could create a stronger supply-demand dynamic. My take: FLOKI already has something many new memecoins lack: brand recognition, an established community and a growing ecosystem. If the next bull run brings massive liquidity back into altcoins and meme coins, I believe FLOKI deserves a place on the watchlist. A 2000% move is an aggressive speculative scenario, not a guaranteed target. But this is exactly the kind of potential I will be watching during the next cycle. What do you think? Can $FLOKI deliver 20x+ in the next bull run?👀 #MidtermsMarketWatch #AnthropicIPOTestsTheAIBoom #BOERateDecision #BybitAIEvolving #OilVolatilityTracksIranPeaceTalks
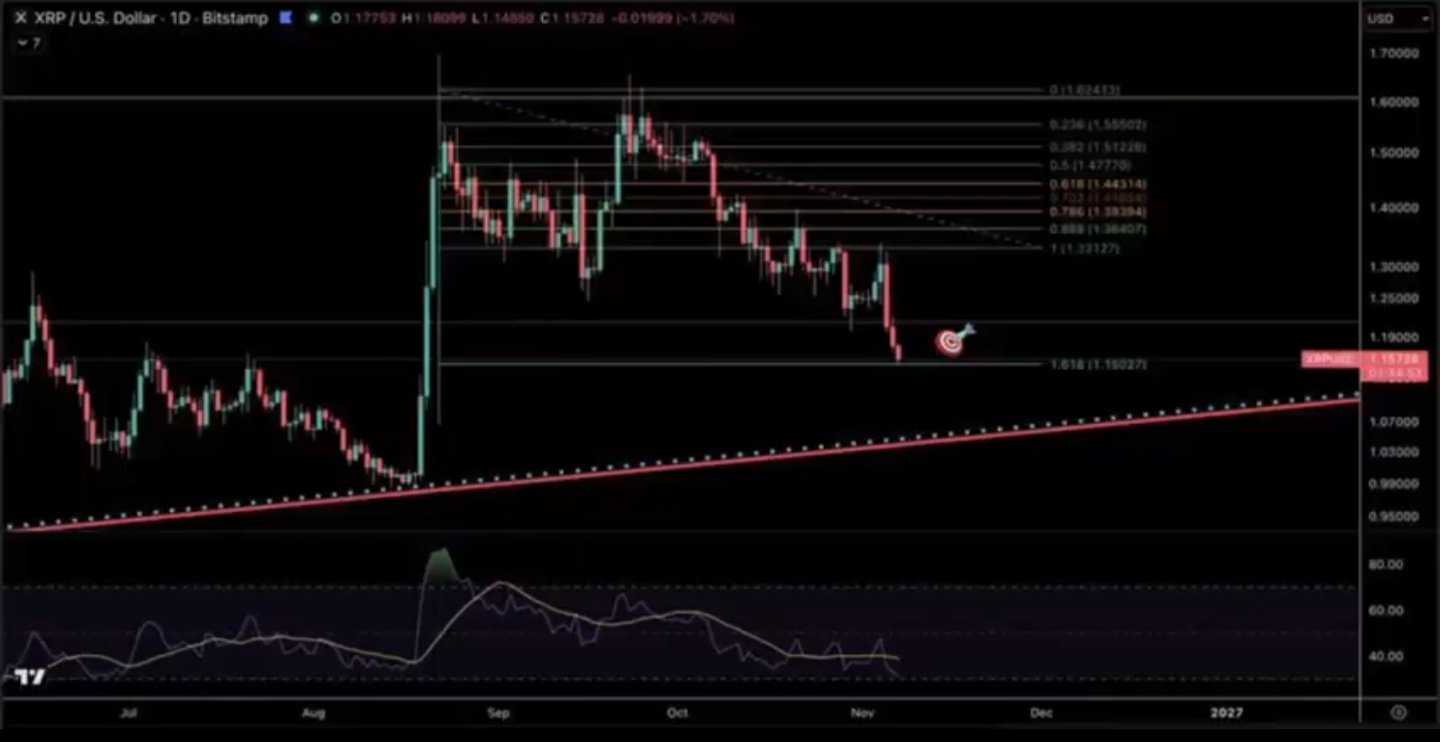
$XRPUSDT : $1.15 is a key support level to watch right now! Looking at the daily chart, XRP has undergone a significant pullback and is currently testing the 1.618 Fibonacci extension level near $1.15. This is a critical zone that the bulls need to defend. If $1.15 holds and we see a clear buying response, I expect the price to potentially stage a gradual rebound: $1.15 → $1.20 → $1.33 → $1.44 Notably, reclaiming $1.20 would serve as the first sign of improvement in the short-term trend. If $1.15 fails to hold, we should look toward the long-term upward trendline below—and be careful not to call a bottom too early. In my view, $1.15 is a level that warrants close attention, but a genuine reversal will require confirmation through price action. #XRP #Ripple #Crypto#Byximpact
No dejes que las fluctuaciones a corto plazo sacudan tu confianza en tu posición de $XRPUSDT. Al ver la estructura de la gráfica, $XRP está formando mínimos más altos y probando repetidamente el nivel de resistencia horizontal superior. Con los niveles de soporte subiendo gradualmente, es posible que el precio se esté preparando para una ruptura direccional significativa. Mi trayectoria de precio proyectada: $1.40 → $1.55 → $1.85 → $2.20+ Si el precio rompe la resistencia horizontal con un volumen alto y logra convertirla con éxito en soporte, podría abrir la puerta a más ganancias. Sin embargo, hasta que se confirme la ruptura, mantente atento a posibles "fakeouts" (falsas rupturas) y retrocesos. Evita tomar decisiones impulsivas motivadas por el pánico a corto plazo y nunca descuides la gestión de riesgos. Sé paciente, espera a que la tendencia se confirme y deja que el mercado demuestre la fuerza de los toros. #IMPACTbyTrade
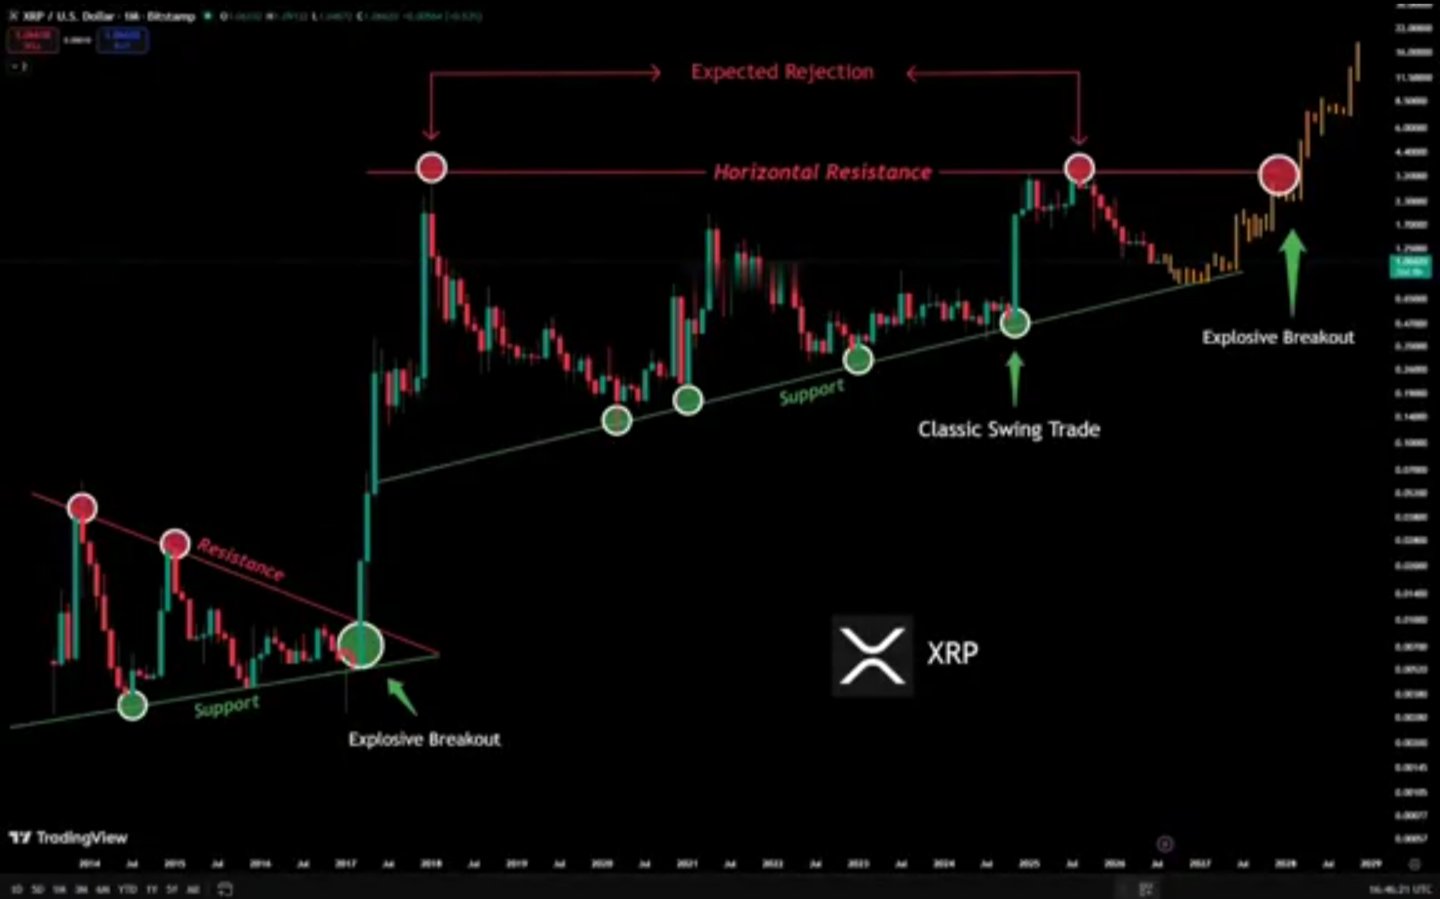
🚨 SI TIENES MÁS DE 18 AÑOS, LEE ESTO CON ATENCIÓN Los próximos 12 meses podrían ser los meses más importantes de tu vida financiera. Porque el mercado está preparando una de las mayores transferencias de riqueza de la historia. Primero, las acciones entran en la fase final de euforia. Luego, las cripto entran en el tipo de rally que hace que la gente crea que el ciclo NUNCA terminará. Y justo cuando todos se convencen de que son ricos... La recesión golpea. Aquí es donde se crearán Y se destruirán fortunas. Los próximos 12 meses podrían crear un número RÉCORD de nuevos millonarios. NO DESPERDICIES ESTA OPORTUNIDAD. La mayoría aún lo hará. Dudarán cuando deberían comprar. Sentirán FOMO cuando deberían vender. Y se darán cuenta de lo que pasó solo después de que esta fase haya terminado. Oportunidades como esta son extremadamente raras. Si estás leyendo esto ahora, no llegas tarde. No solo rastreo el precio. Rastreo el sentimiento, la liquidez y hacia dónde se mueve el dinero a continuación. Y te lo digo ahora: Sigues estando a tiempo. Pero no por mucho más. Recordatorio: Predije el último pico del ciclo de Bitcoin en $126,000 y les dije que compraran cuando Bitcoin estaba en $60K en junio. La próxima predicción podría ser aún más importante. La publicaré aquí, como siempre lo hago. Activa las notificaciones. Si aún no me sigues, más adelante entenderás por qué eso fue un error. $BTCUSDT #IMPACTbyTrade
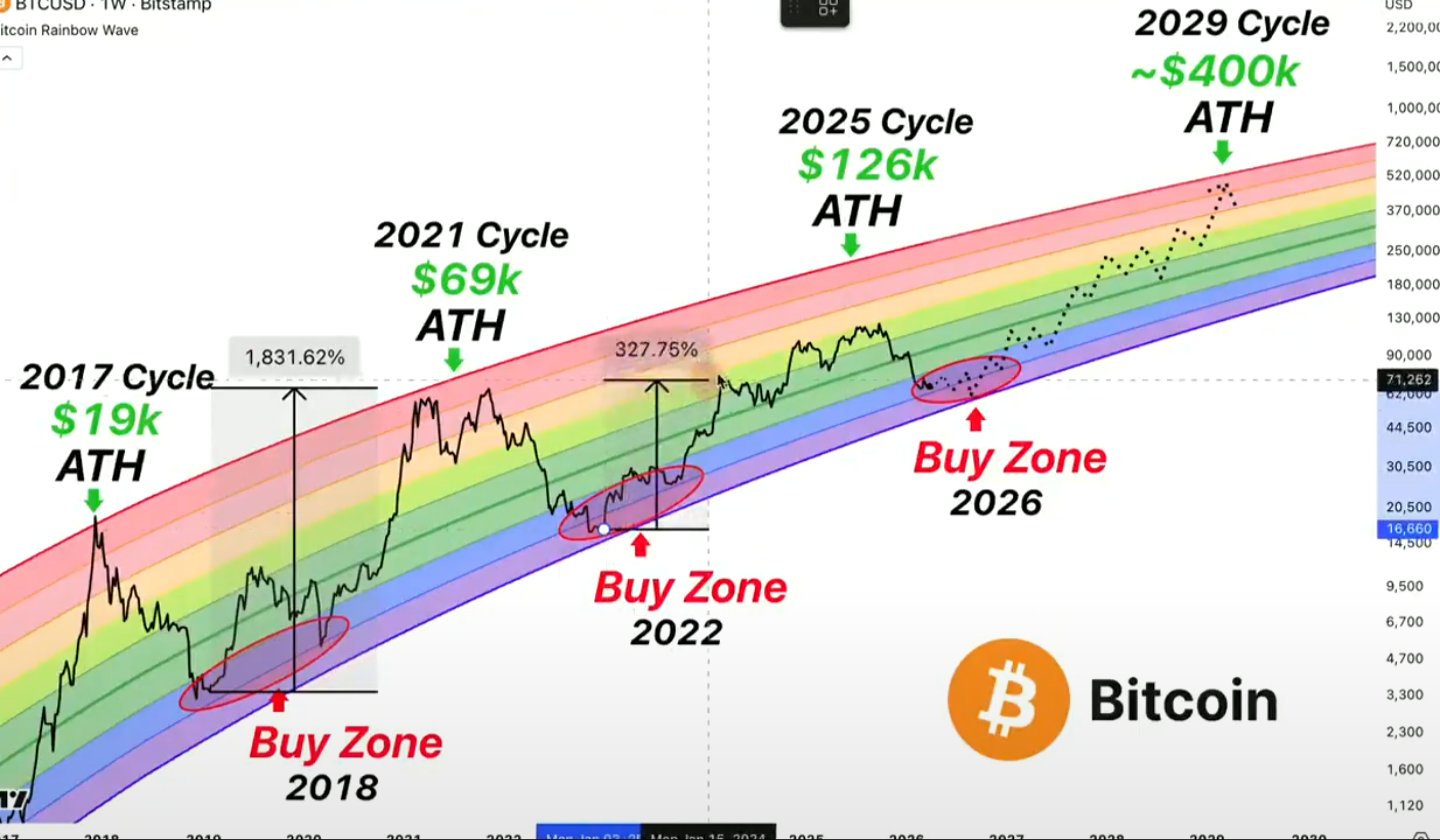
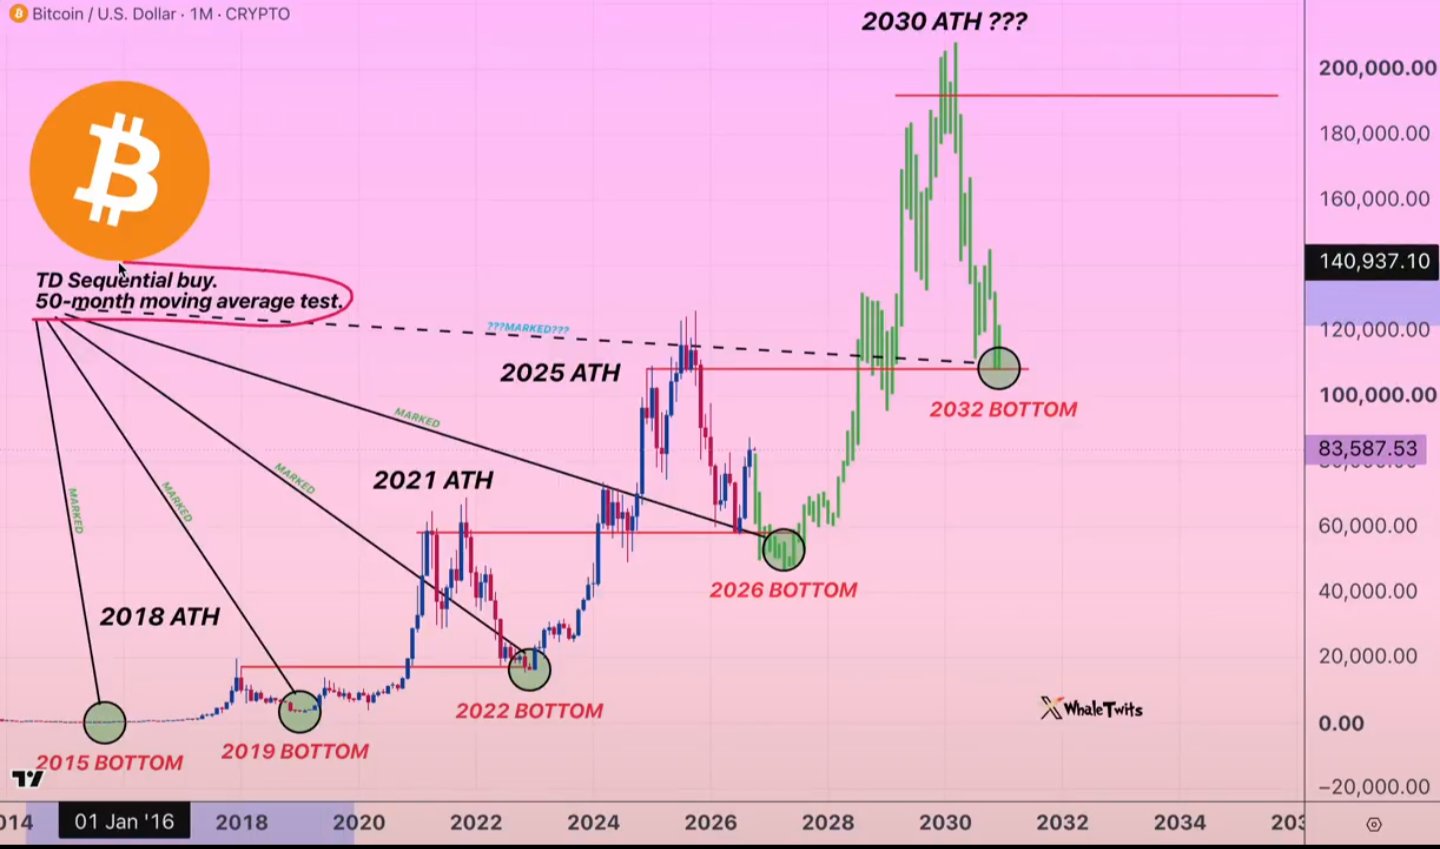
🚨 EL CICLO DE 4 AÑOS DE BITCOIN ESTÁ A PUNTO DE HACER QUE MILLONES DE INVERSORES SE ARREPIENTAN DE TODO. Y creo que el 2026 podría ofrecer una de las mayores oportunidades de compra de la década. MIRA ESTE PATRÓN. 2013: VENDER 2017: VENDER 2021: VENDER 2025: VENDER Cada cuatro años, Bitcoin ha entrado históricamente en una ventana importante de pico de ciclo. Y cada vez, el mercado bajista siguiente creó oportunidades que la mayoría de los inversores estaban demasiado aterrorizados para aprovechar. AHORA MIRA EL CICLO COMPLETO. 2011: COMPRAR 2012: MANTENER (HODL) 2013: VENDER 2014: MERCADO BAJISTA 2015: COMPRAR 2016: MANTENER (HODL) 2017: VENDER 2018: MERCADO BAJISTA 2019: COMPRAR 2020: MANTENER (HODL) 2021: VENDER 2022: MERCADO BAJISTA 2023: COMPRAR 2024: MANTENER (HODL) 2025: VENDER 2026: MERCADO BAJISTA ¿VES LO QUE ESTÁ PASANDO? Si el patrón histórico continúa, esto es lo que podría venir A CONTINUACIÓN. 2027: COMPRAR 2028: MANTENER (HODL) 2029: VENDER 2030: MERCADO BAJISTA Y aquí es donde las cosas se ponen interesantes. La mayoría de los inversores esperan desesperadamente que Bitcoin no caiga más. YO ESPERO LO CONTRARIO. Porque las fortunas más grandes no se hacen comprando cuando todo el mundo celebra nuevos máximos históricos. Se hacen acumulando cuando el mercado parece completamente desesperanzador. Recuerda mis predicciones anteriores. Predije públicamente el suelo de $16K de Bitcoin en 2022. Advertí sobre el pico del ciclo de $126K en octubre de 2025. Y en junio de 2026, identifiqué la zona de $60K como una oportunidad de compra. Ahora me estoy preparando para mi PRÓXIMA gran entrada. Pero esto es lo que la mayoría de la gente no entiende. El ciclo de cuatro años es un patrón histórico, no una garantía. No compraré a ciegas solo porque el calendario diga 2027. Quiero ver una capitulación real. Vendedores agotados. Una zona de soporte importante. Y confirmación de que la presión de venta finalmente está desapareciendo. AHÍ ES CUANDO ESTARÉ LISTO. Las mismas personas aterrorizadas por comprar Bitcoin durante un mercado bajista podrían estar persiguiéndolo por encima de los $100K cuando comience la próxima corrida alcista. Y para entonces, la mayor oportunidad ya podría haber desaparecido. GUARDA ESTE GRÁFICO. Regresa en 2027. Sigue + activa las notificaciones. Cuando vea formarse el próximo gran suelo, compartiré mi predicción públicamente. EL PRECIO DE BITCOIN QUE TODOS TEMEN HOY PODRÍA SER EL PRECIO AL QUE DESEARÍAN HABER COMPRADO MAÑANA. $BTCUSDT #IMPACTbyTrade
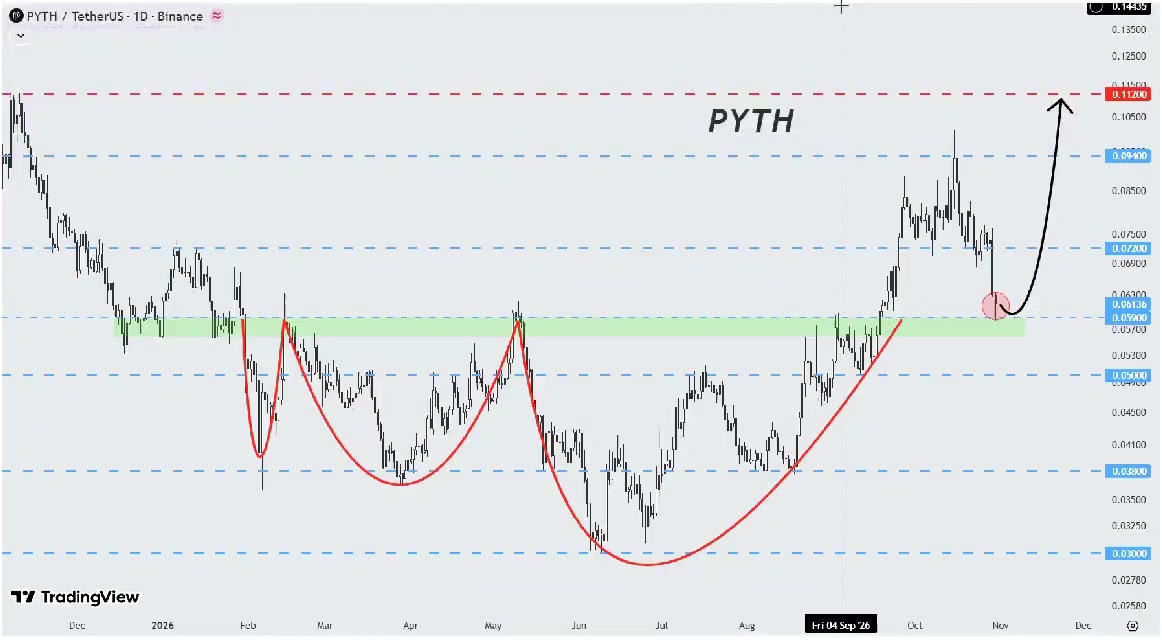
$PYTHUSDT $2 billones en volumen. Retesteo en curso 👀 Pyth Network está retesteando la línea de cuello (neckline) de un suelo redondeado (rounding bottom) completado en el marco temporal diario. - Más de $3.1 mil millones han sido asegurados por los oráculos de Pyth. - Soportó $2 billones en volumen de trading en el Q3. - Se acaban de añadir feeds del Tesoro de EE. UU. para clientes institucionales. La infraestructura está construida. Ahora el precio necesita rebotar. Niveles objetivo: 🎯 $0.072 🎯 $0.094 🎯 $0.112
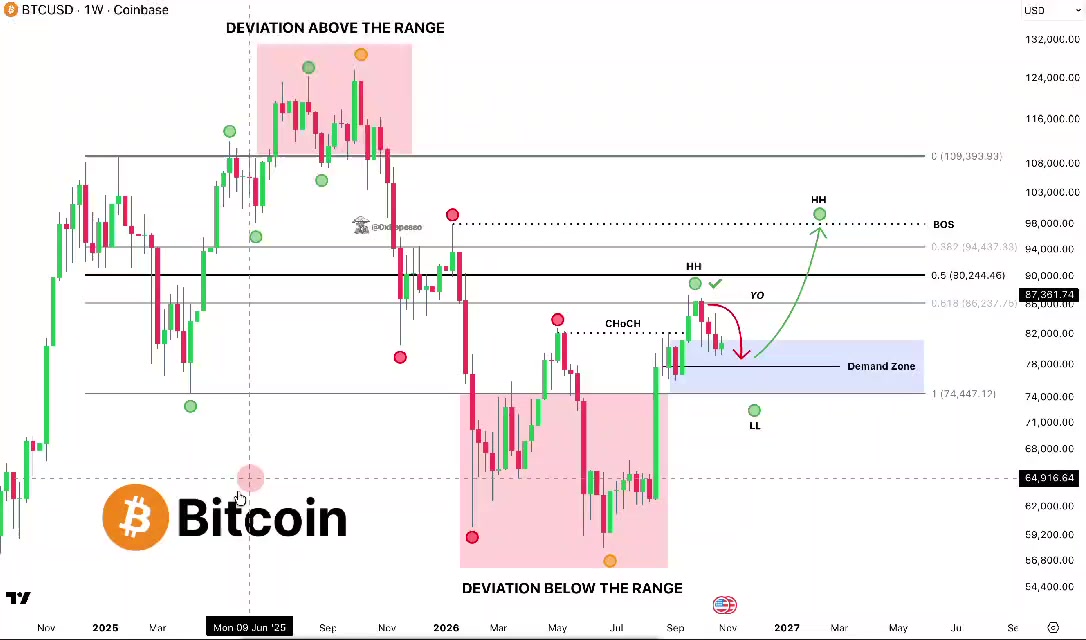
🚨 BITCOIN ($BTCUSDT) ESTÁ ENTRANDO EN LA ZONA DE COMPRA EXACTA QUE MAPEÉ HACE MESES El suelo de $60k, el rally CHoCH, el rechazo de máximo más alto en la Apertura Anual Cada etapa se desarrolló paso a paso Ahora el precio corrige hacia la zona de demanda de $78k a $82k Aquí es donde planeo cargar mis bolsas spot La estructura es similar a ciclos anteriores hasta ahora: Suelo de $60k -> CHoCH -> HH en la YO -> Corrección hacia la Demanda -> HL -> Rally a un nuevo ATH Confío en un HL aquí y la ruptura de la estructura por encima de los $94k confirma la expansión No estoy adivinando y no estoy persiguiendo el precio La zona se está acercando y les actualizaré sobre las entradas #ByXIMPACT