Bronu Silva
11763Me gusta14Compartir en el chat247Aficionados156Seguir
OG Crypto Trader & Ambassador | Daily alpha on $BTC $ETH $SOL & altcoin comebacks | Spotting quick wins with Cryptolume screener |Let's ride the waves together
OG Crypto Trader & Ambassador | Daily alpha on $BTC $ETH $SOL & altcoin comebacks | Spotting quick wins with Cryptolume screener |Let's ride the waves together
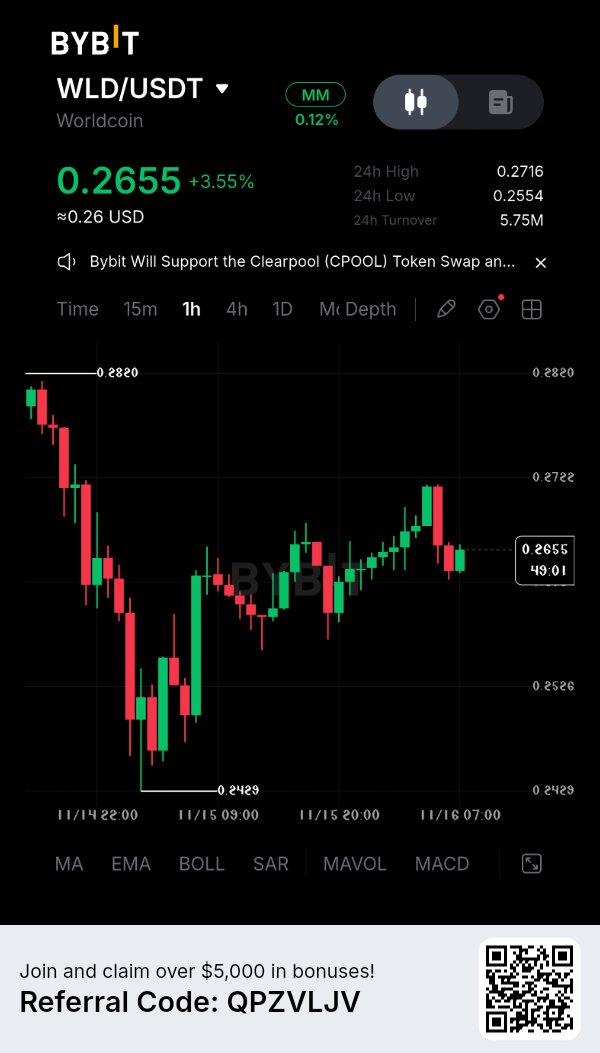
$WLDUSDT Bulls Are Trying to Take Control. Is Another Move Coming? Worldcoin is showing signs of recovery on the 1H chart after a strong bounce from the $0.2429 support area. WLD is currently trading around $0.2655, up approximately 3.55%. Buyers have managed to recover from the recent low, but the price is now facing resistance after rejection near $0.2716. Key Levels to Watch Support Zones: - $0.2625 – $0.2635 - $0.2550 – $0.2560 - $0.2525 – Major support area Resistance Zones: - $0.2680 – $0.2690 - $0.2715 – Immediate resistance - $0.2820 – Major upside target Potential Trading Setup Entry 1: $0.2625 – $0.2640 on a confirmed bullish bounce. Entry 2: Above $0.2690 after a strong 1H candle close and successful retest. Take Profit: - TP1: $0.2715 - TP2: $0.2760 - TP3: $0.2820 Stop Loss: Below $0.2590 for the pullback setup. Bearish Scenario If WLD loses the $0.2625 support with a strong 1H candle close, the bullish setup becomes weaker. A breakdown could open the way toward $0.2555 and potentially $0.2525. My Trading View The structure is showing recovery, but bulls still need to reclaim the $0.2690–$0.2715 resistance zone to confirm stronger upside momentum. I would rather wait for confirmation than chase a green candle. Patience and proper risk management matter more than entering every move. Keep your eyes on WLD. The next reaction around support and resistance could define its short-term direction. Trade smart. Protect your capital. Let the setup come to you. #ByXIMPACT
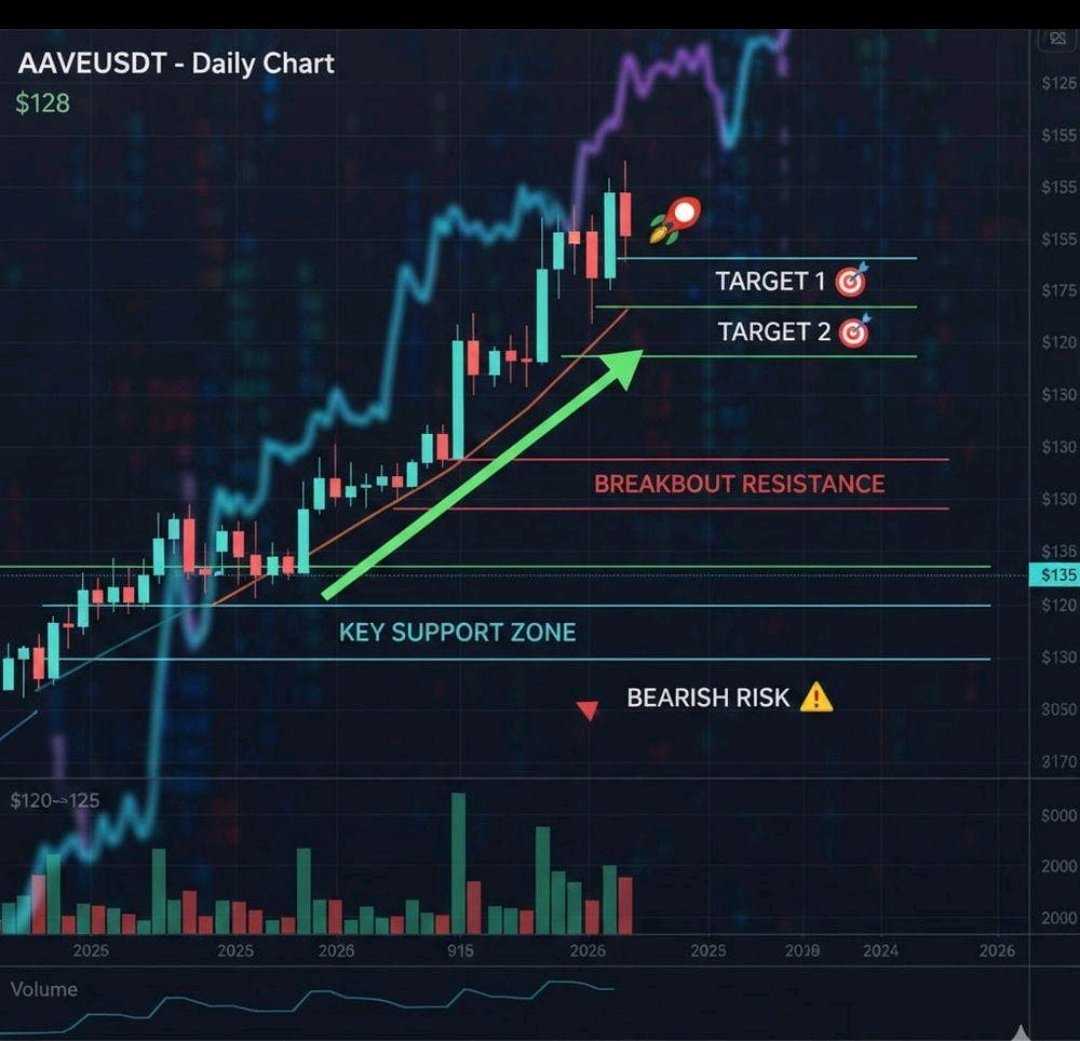
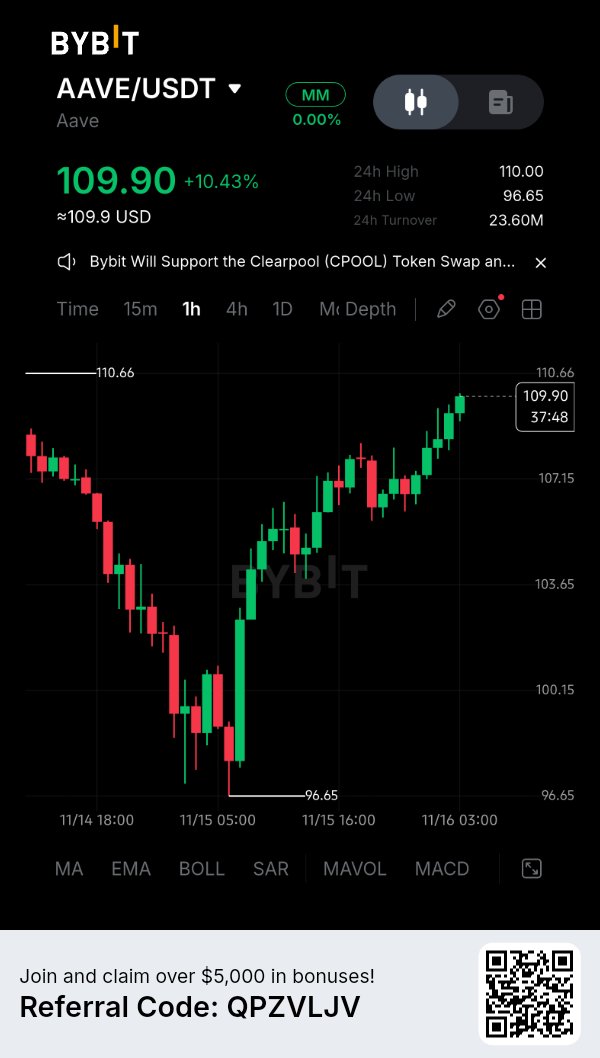
🚀 $AAVEUSDT Análisis Técnico – ¡Los toros se acercan a una ruptura importante! AAVE muestra una fuerte presión de compra tras recuperarse desde el área de soporte de $96.65. El precio cotiza actualmente alrededor de $109.90, con una ganancia del 10.43%. El gráfico de 1H muestra una estructura de recuperación clara, con los compradores empujando gradualmente el precio hacia la zona de resistencia de $110. Pero la gran pregunta es si los toros pueden romper con éxito este nivel. Analicemos los niveles de trading importantes. 📊 Resumen Actual del Mercado Par: AAVE/USDT Precio Actual: $109.90 Cambio en 24H: +10.43% Máximo en 24H: $110.00 Mínimo en 24H: $96.65 Volumen en 24H: $23.60M Temporalidad: 1H 🟢 Niveles de Soporte Importantes $107.15 – $106.50: Soporte inmediato y área potencial de retroceso. $105.00 – $104.50: Zona de soporte secundario. $103.65 – $102.00: Área de demanda importante. $100.15 – $96.65: Zona de soporte principal a la baja. 🔴 Niveles de Resistencia Importantes $110.00 – $110.66: Resistencia inmediata y área de ruptura. $111.50 – $112.00: Siguiente objetivo potencial al alza. $113.00: Objetivo psicológico si el impulso alcista continúa. 📈 Estrategia de Trading LONG Configuración 1 – Entrada tras retroceso Zona de entrada: $107.50 – $108.50 Stop Loss: Debajo de $106.50 Take Profit 1: $110.00 Take Profit 2: $111.50 Take Profit 3: $113.00 Espera a una vela de rechazo alcista y confirmación antes de entrar. Configuración 2 – Entrada por ruptura Entrada: Por encima de $110.70 después de un cierre de vela de 1H confirmado. Zona de retesteo: $110.00 – $110.70 Stop Loss: Debajo de la estructura de retesteo confirmada. Take Profit 1: $111.50 Take Profit 2: $112.00 Take Profit 3: $113.00 Un volumen fuerte durante la ruptura aumentaría la confianza en la configuración. 📉 Estrategia de Trading SHORT Si AAVE no logra romper la zona de resistencia de $110.00 – $110.66 y forma un fuerte rechazo bajista, podría desarrollarse una oportunidad de venta en corto. Zona de entrada: $110.00 – $110.50 después de confirmación bajista. Stop Loss: Por encima de $111.00 Take Profit 1: $108.50 Take Profit 2: $107.50 Take Profit 3: $106.50 Evita vender en corto si los compradores logran romper y mantenerse por encima de la resistencia. 🧠 Consejos de Trading Profesional 1. Observa el cierre de la vela de 1H alrededor de $110.66. 2. Confirma la fuerza de la ruptura con el volumen de trading. 3. Evita entrar directamente en la resistencia. 4. Espera un retesteo antes de hacer una operación de ruptura. 5. Mantén el riesgo limitado al 0.5%–1% de tu capital de trading. 6. Utiliza siempre un stop loss y considera tomar ganancias parciales. 🎯 Mi Perspectiva del Mercado AAVE tiene actualmente una estructura alcista a corto plazo tras su fuerte recuperación desde $96.65. La zona de $110.00 – $110.66 es el área más importante a vigilar. Una ruptura confirmada podría abrir el camino hacia $111.50 y potencialmente $113.00. Sin embargo, un rechazo desde esta resistencia podría desencadenar un retroceso hacia $107.15 o $105.00. Mi estrategia es simple: preferiría esperar la confirmación en lugar de perseguir las velas verdes actuales. Opera con un plan. Protege tu capital. Deja que el mercado confirme tu configuración. ¿Cuál es tu predicción? ¿AAVE romperá $110.66 y se moverá hacia $113, o los vendedores defenderán esta resistencia? Comparte tus pensamientos abajo. #ByXIMPACT #WSOTMuestraTuOperaciónIAParaGanar10USDT #La salida de Jensen Huang pone a prueba el liderazgo de IA de Nvidia #Las pruebas del IPP de EE. UU. para la operación de tasas más altas por más tiempo #LaInflaciónEnEUAseDisparaYLasaApuestasDeAumentoDeTasasSuben $AAVEUSDC
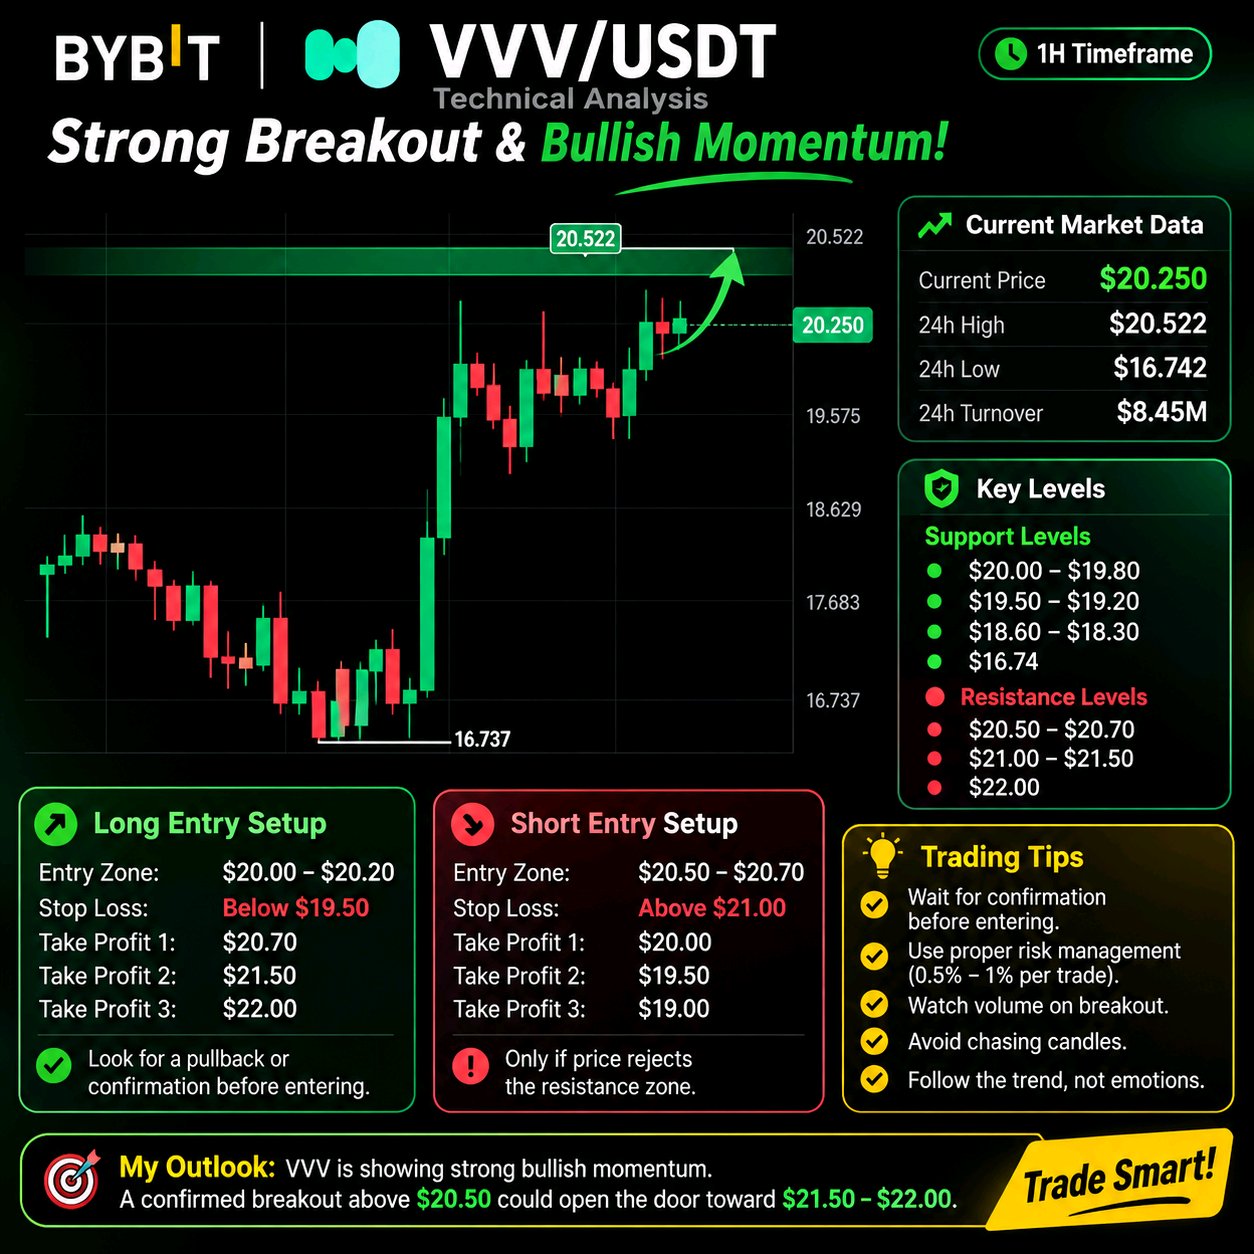
🚀 $VVVUSDT ¡Los toros están tomando el control! ¿Es $22 el próximo objetivo? VVV está mostrando un fuerte impulso alcista después de recuperarse de la zona de soporte de $16.737. El precio ha subido hacia los $20.250, registrando una impresionante ganancia del 19.54%. Los compradores claramente están mostrando fuerza, pero la próxima zona de resistencia será muy importante para la continuación de este movimiento. Echemos un vistazo a los niveles importantes y posibles oportunidades de trading. 📊 Resumen actual del mercado Par: VVV/USDT Precio actual: $20.250 Cambio en 24H: +19.54% Máximo en 24H: $20.522 Mínimo en 24H: $16.742 Volumen en 24H: $8.45M Temporalidad: 1H 🟢 Zonas de soporte importantes $20.00 – $19.80: Soporte inmediato y posible área de entrada en retrocesos. $19.50 – $19.20: Soporte secundario donde los compradores pueden intentar defender el precio. $18.60 – $18.30: Zona de demanda importante y área de consolidación previa. $16.74: Mínimo reciente importante. 🔴 Zonas de resistencia importantes $20.50 – $20.70: Resistencia inmediata y área de ruptura. $21.00 – $21.50: Próxima posible zona de resistencia. $22.00: Objetivo psicológico al alza si el impulso alcista continúa. 📈 Estrategia de trading LONG Configuración 1: Entrada en retroceso Zona de entrada: $19.80 – $20.10 Stop Loss: Debajo de $19.40 Take Profit 1: $20.50 Take Profit 2: $21.00 Take Profit 3: $21.50 Espera confirmación alcista alrededor del soporte antes de entrar. Evita comprar simplemente porque el precio está subiendo. Configuración 2: Entrada en ruptura Entrada: Arriba de $20.55 después de un cierre confirmado de vela de 1H. Zona de retesteo: $20.40 – $20.55 Stop Loss: Debajo de $20.00, ajustado a la estructura de retesteo. Take Profit 1: $21.00 Take Profit 2: $21.50 Take Profit 3: $22.00 Una ruptura respaldada por un volumen fuerte proporcionaría una mejor confirmación. 📉 Estrategia de trading SHORT Si VVV no logra romper la zona de resistencia de $20.50 – $20.70 y forma un fuerte rechazo bajista, podría desarrollarse una configuración de short. Zona de entrada: $20.45 – $20.70 después de confirmación bajista. Stop Loss: Arriba de $21.00 Take Profit 1: $20.00 Take Profit 2: $19.50 Take Profit 3: $19.20 No abras una posición en corto si los compradores logran romper y mantenerse por encima de la resistencia. 🧠 Consejos de trading profesional 1. Observa el cierre de la vela de 1H alrededor de $20.50. 2. Revisa el volumen de trading antes de confiar en una ruptura. 3. Espera los retesteos en lugar de perseguir las velas verdes. 4. Usa un stop loss en cada operación. 5. Arriesga solo del 0.5% al 1% de tu capital de trading por configuración. 6. Considera tomar ganancias parciales en cada objetivo. 🎯 Mi perspectiva de mercado VVV actualmente tiene una estructura alcista a corto plazo después de su fuerte recuperación desde $16.737. El nivel de $20.50 es el área más importante a observar. Una ruptura confirmada podría crear una oportunidad hacia los $21.50 y potencialmente $22.00. Sin embargo, un rechazo desde la resistencia podría traer una corrección saludable hacia los $20.00 o $19.50. Mi enfoque sería esperar confirmación en lugar de perseguir el pump actual. Opera la configuración, no la emoción. ¿Qué opinas tú? ¿VVV romperá por encima de $20.50 y se moverá hacia $22, o los vendedores empujarán el precio de vuelta hacia $19.50? #ByXIMPACT #WSOTMuestraTuOperaciónIAParaGanar10USDT #La salida de Jensen Huang pone a prueba el liderazgo de IA de Nvidia #Las pruebas del IPP de EE. UU. para la operación de tasas más altas por más tiempo #LaInflaciónEnEUAseDisparaYLasaApuestasDeAumentoDeTasasSuben $BTCUSDT
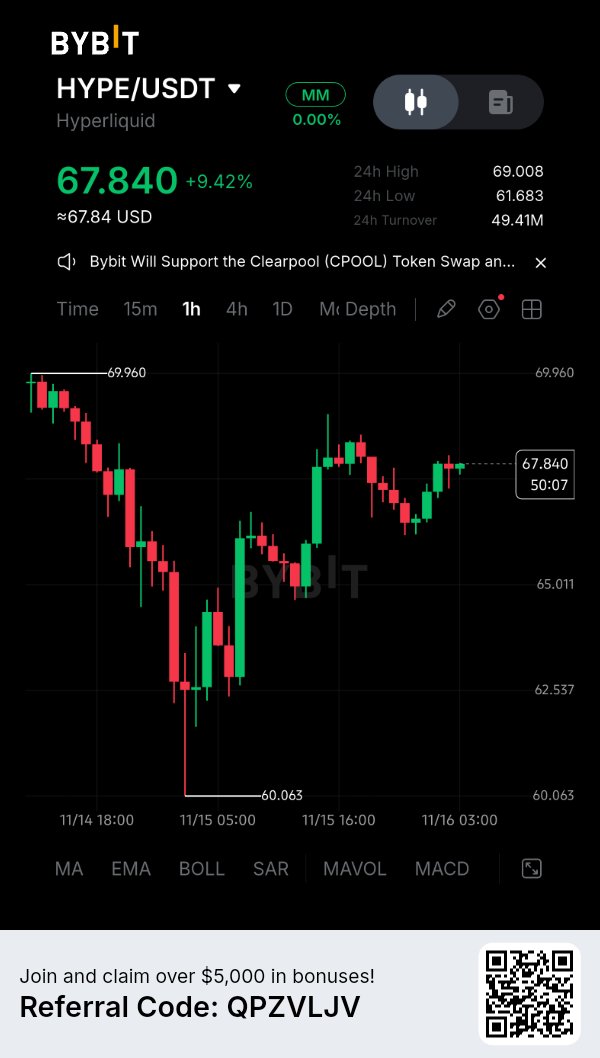
🚨 $HYPEUSDT Análisis Técnico – ¡Los toros están contraatacando! HYPE está mostrando una fuerte recuperación después de caer hacia la zona de soporte de $60.06. Los compradores han intervenido agresivamente, impulsando el precio de regreso a $67.84, con aproximadamente un 9.42% de ganancias visibles en el gráfico. Sin embargo, el próximo movimiento será muy importante. El precio se está acercando a una zona de resistencia mayor, y los traders deben buscar confirmación antes de entrar en una posición. 📊 Estructura Actual del Mercado (Gráfico de 1H) Precio actual: $67.84 Máximo 24H: $69.00 Mínimo 24H: $61.68 Mínimo principal del gráfico: $60.06 El mercado se ha recuperado con fuerza de su mínimo reciente. El impulso a corto plazo parece alcista, pero la región de $68.50–$69.00 podría generar presión de venta. 🎯 Niveles de Soporte Importantes 1. $67.00 – $66.50: Soporte inmediato y posible zona de retroceso. 2. $65.50 – $65.00: Área de soporte importante para los compradores. 3. $63.00 – $62.50: Zona de demanda mayor de la recuperación anterior. 4. $60.06: Mínimo reciente del gráfico y referencia principal a la baja. 🔴 Niveles de Resistencia Mayores 1. $68.50 – $69.00: Zona de resistencia inmediata. 2. $69.90 – $70.50: Posible objetivo al alza tras una ruptura confirmada. 3. $72.00: Siguiente objetivo psicológico si continúa el impulso alcista. 📈 Posibles Setups de Entrada en LONG Setup 1 – Entrada por Retroceso Zona de entrada: $66.50 – $67.20 Stop Loss: Debajo de $65.80 Take Profit 1: $68.00 Take Profit 2: $69.00 Take Profit 3: $70.00 Espera una vela de rechazo alcista o una reprueba de soporte confirmada antes de entrar. Setup 2 – Entrada por Ruptura Entrada: Arriba de $69.10 después de un cierre de vela de 1H confirmado. Confirmación: Espera una reprueba exitosa de $69.00. Stop Loss: Debajo de la estructura de reprueba. Take Profit 1: $70.00 Take Profit 2: $70.50 Take Profit 3: $72.00 Evita perseguir una ruptura sin confirmación. 📉 Posible Setup de Entrada en SHORT Si HYPE no logra romper la zona de resistencia de $68.50–$69.00 y produce un claro rechazo bajista: Zona de entrada: $68.30 – $68.90 después de confirmación bajista. Stop Loss: Arriba de $69.50 Take Profit 1: $67.20 Take Profit 2: $66.50 Take Profit 3: $65.00 Una posición en corto solo debe considerarse si los vendedores recuperan el control. Una ruptura fuerte por encima de la resistencia invalida este setup. 🧠 Estrategia de Trading Profesional Aquí hay cinco cosas que observaría antes de tomar una operación: 1. Observa el cierre de la vela de 1H alrededor de $69.00. 2. Verifica el volumen durante cualquier ruptura. 3. Evita entrar en medio de una zona de resistencia. 4. Espera repruebas en lugar de perseguir velas verdes. 5. Mantén el riesgo entre el 0.5% y el 1% de tu capital de trading por setup. Mi Panorama de Mercado HYPE tiene actualmente un impulso de recuperación positivo a corto plazo, pero el nivel de $69.00 es el punto de decisión clave. Una ruptura confirmada podría abrir la puerta hacia los $70–$72. Por otro lado, el rechazo desde la resistencia podría traer otro retroceso hacia $67 o incluso $65. La mejor operación no siempre es la primera. La paciencia, la confirmación y una gestión de riesgo adecuada importan más que predecir cada vela. ¿Cuál es tu expectativa para HYPE? ¿Los toros romperán los $69 y empujarán hacia los $72, o los vendedores defenderán la resistencia nuevamente? Comparte tu análisis abajo. #ByXIMPACT
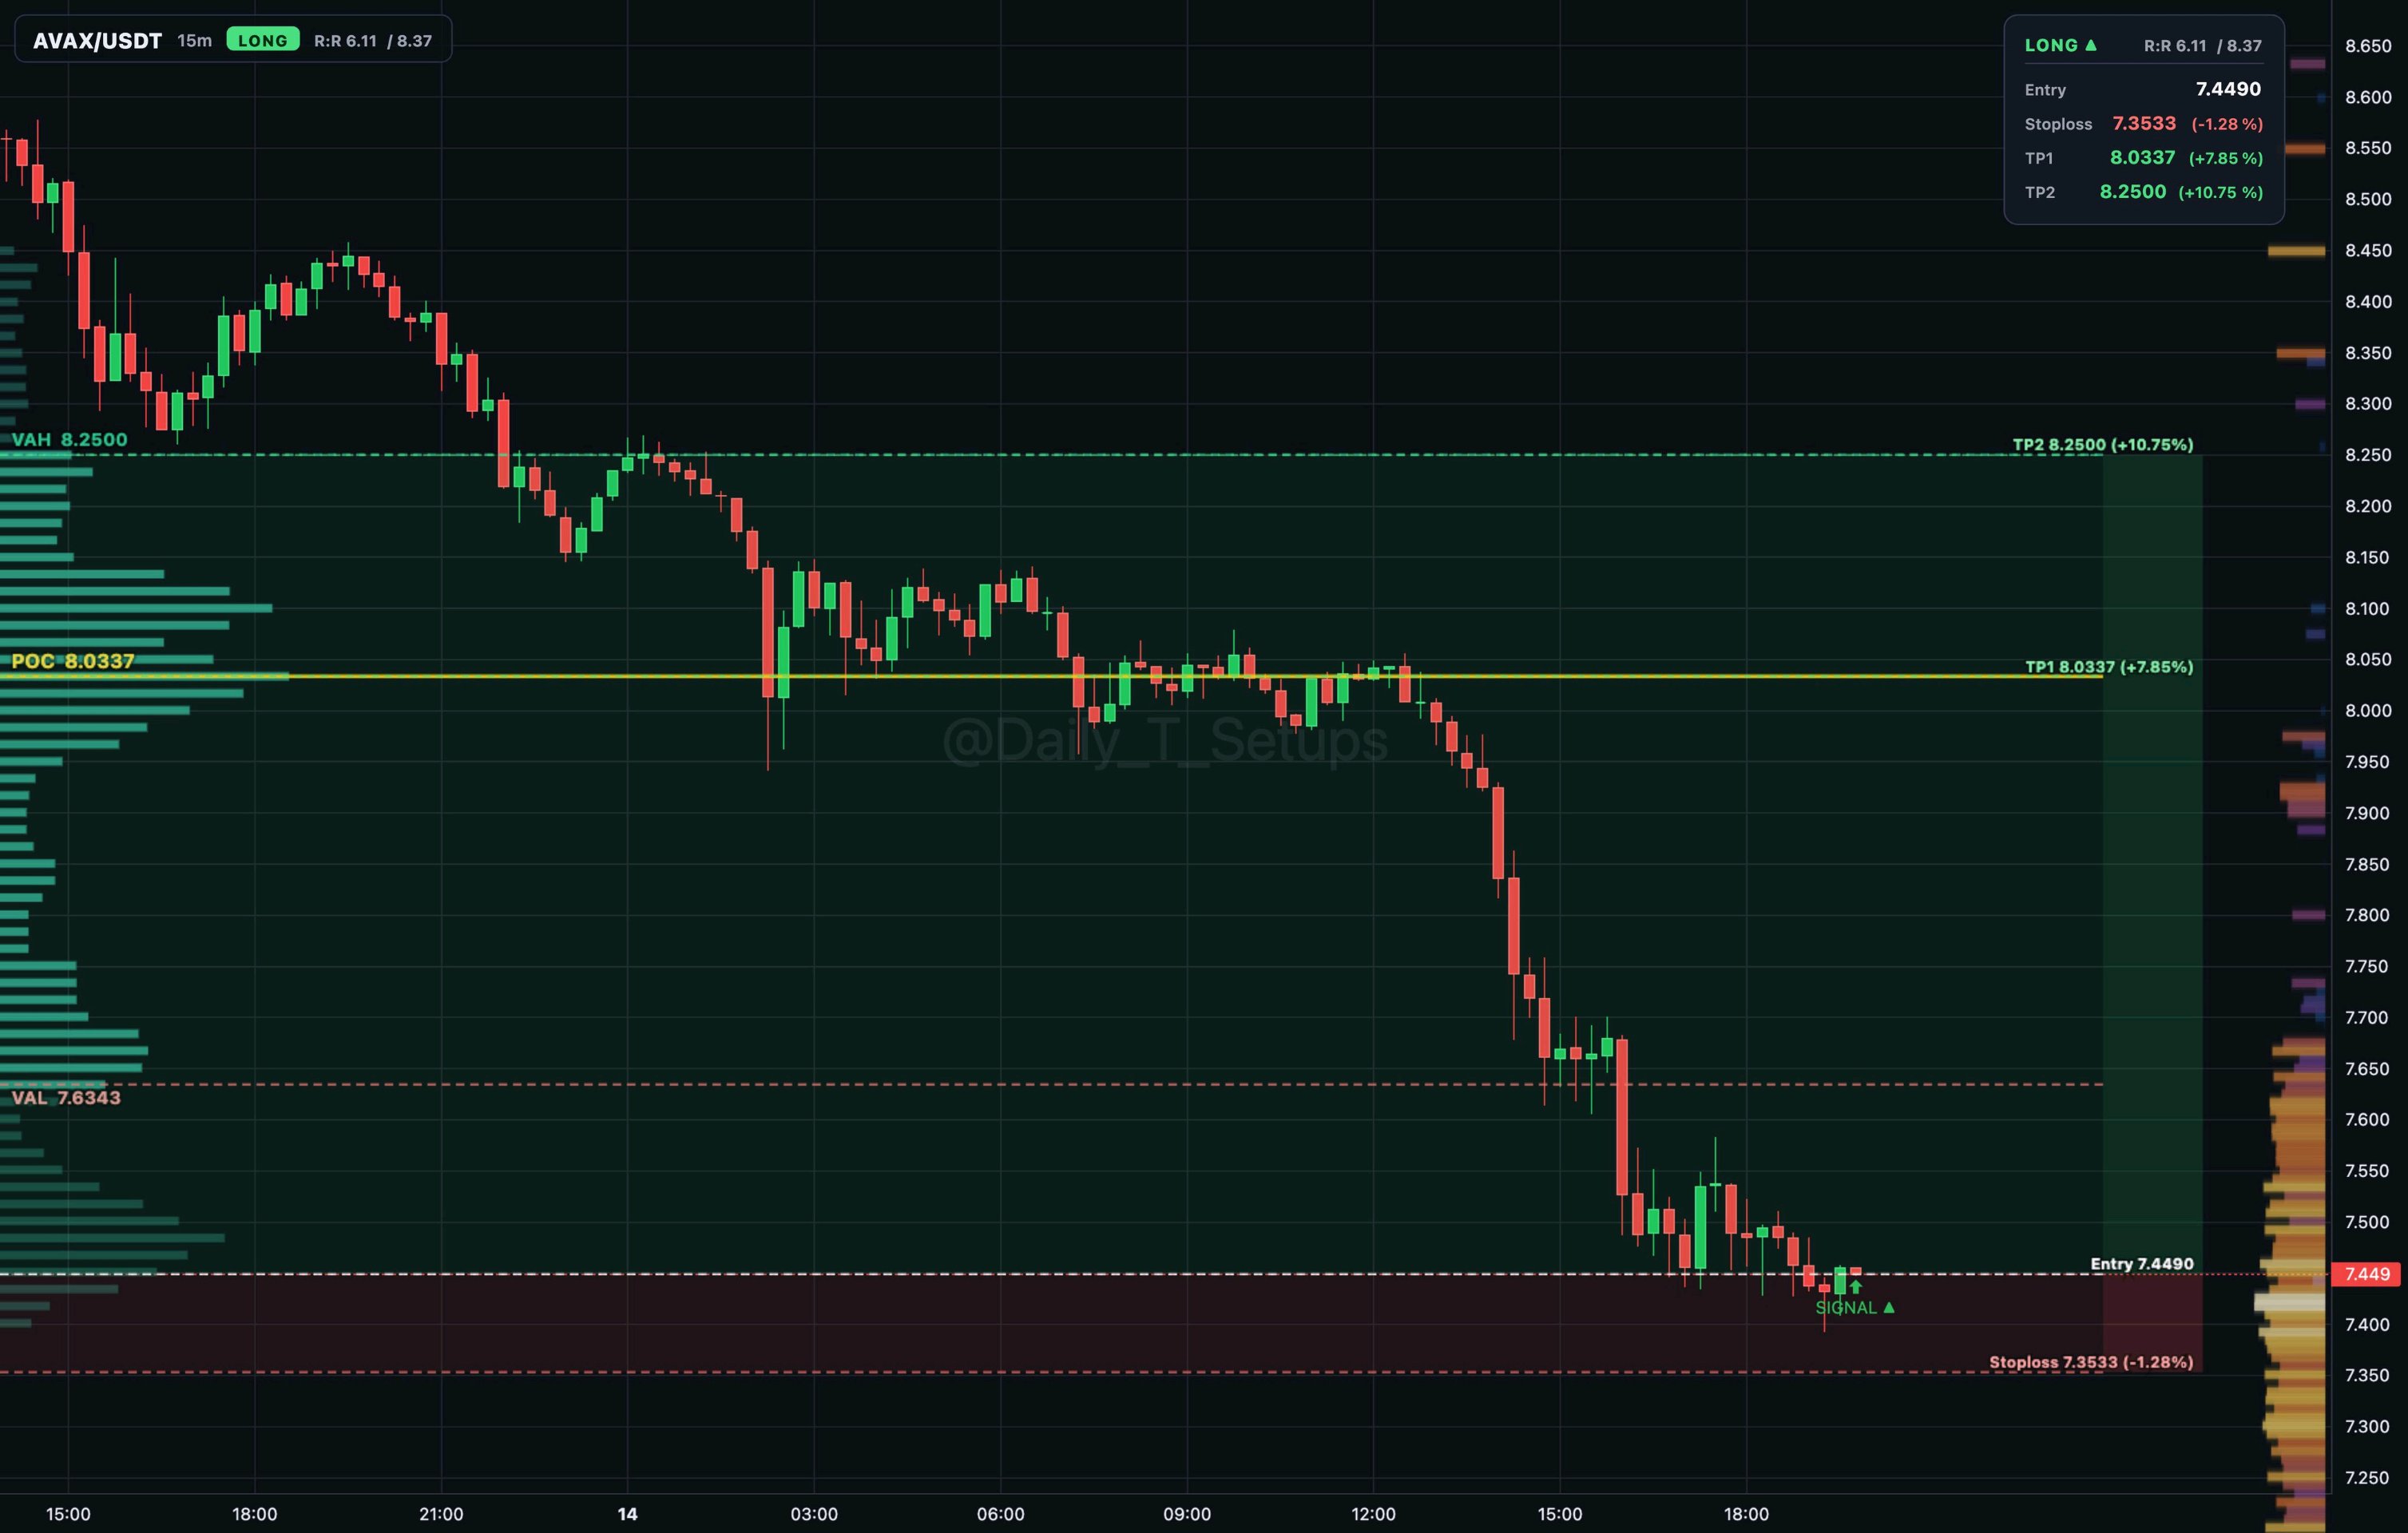
$AVAXUSDT auction rotation shows buyers absorbing below VAL at 7.634. 🔼 Long setup 📍 Entry: 7.454 🛑 Stop: 7.359 (-1.3%) 🎯 TP1: 8.034 (+7.8%) 🎯 TP2: 8.250 (+10.7%) ⚖️ Half off at TP1 → stop to entry #ByXIMPACT #WSOTShowYourAITradeToEarn10USDT #JensenHuangExitTestsNvidiasAILeadership #USPPITestsTheHigherForLongerTrade #USInflationRunsHotAndRateHikeBetsRise
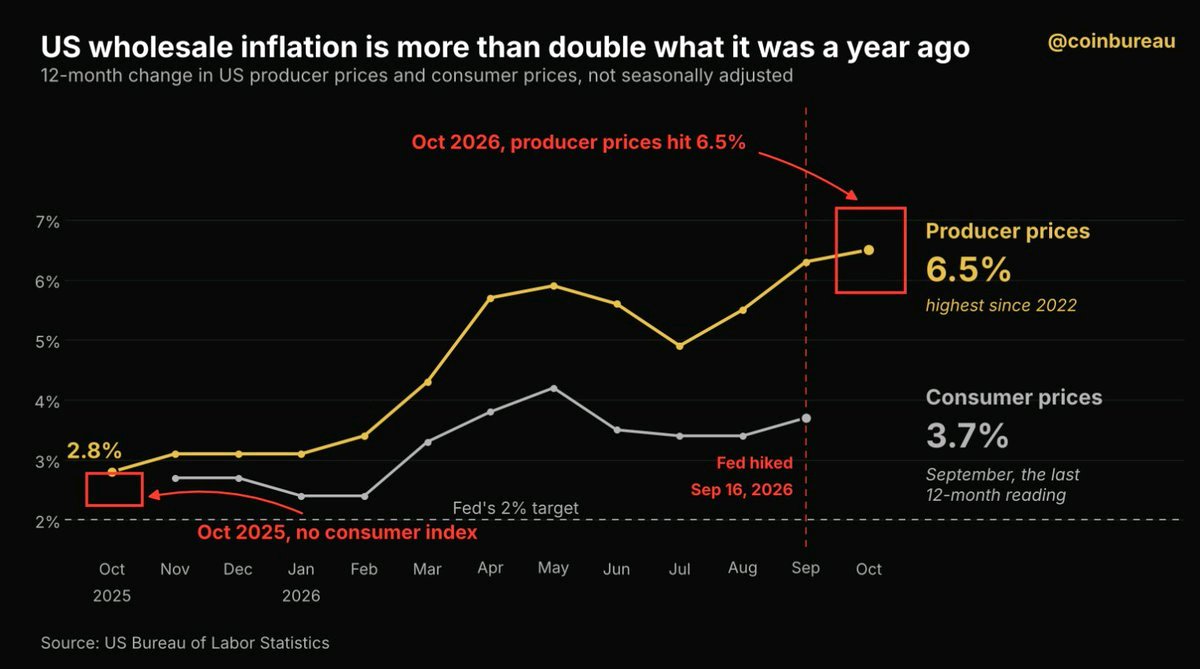
US wholesale inflation is now more than double what it was a year ago. Producer prices rose 6.5% over the year to October, up from 2.8% a year earlier. That is the largest 12-month rise since November 2022, when it hit 7.4%. In September, the last month both annual rates were published, producer prices rose 6.3% against 3.7% for consumer prices. There is no 12-month consumer figure for October, because BLS never published the October 2025 consumer price index. Month to month, seasonally adjusted, producer prices rose 0.3% in October, down from a revised 1.4%. But the measure that strips out food, energy and trade services rose 0.5%, the same as in September. The Fed meets December 8 and 9, after raising rates in September. #ByXIMPACT #WSOTShowYourAITradeToEarn10USDT #JensenHuangExitTestsNvidiasAILeadership #USPPITestsTheHigherForLongerTrade #USInflationRunsHotAndRateHikeBetsRise $BTCUSDT $LAVAUSDT
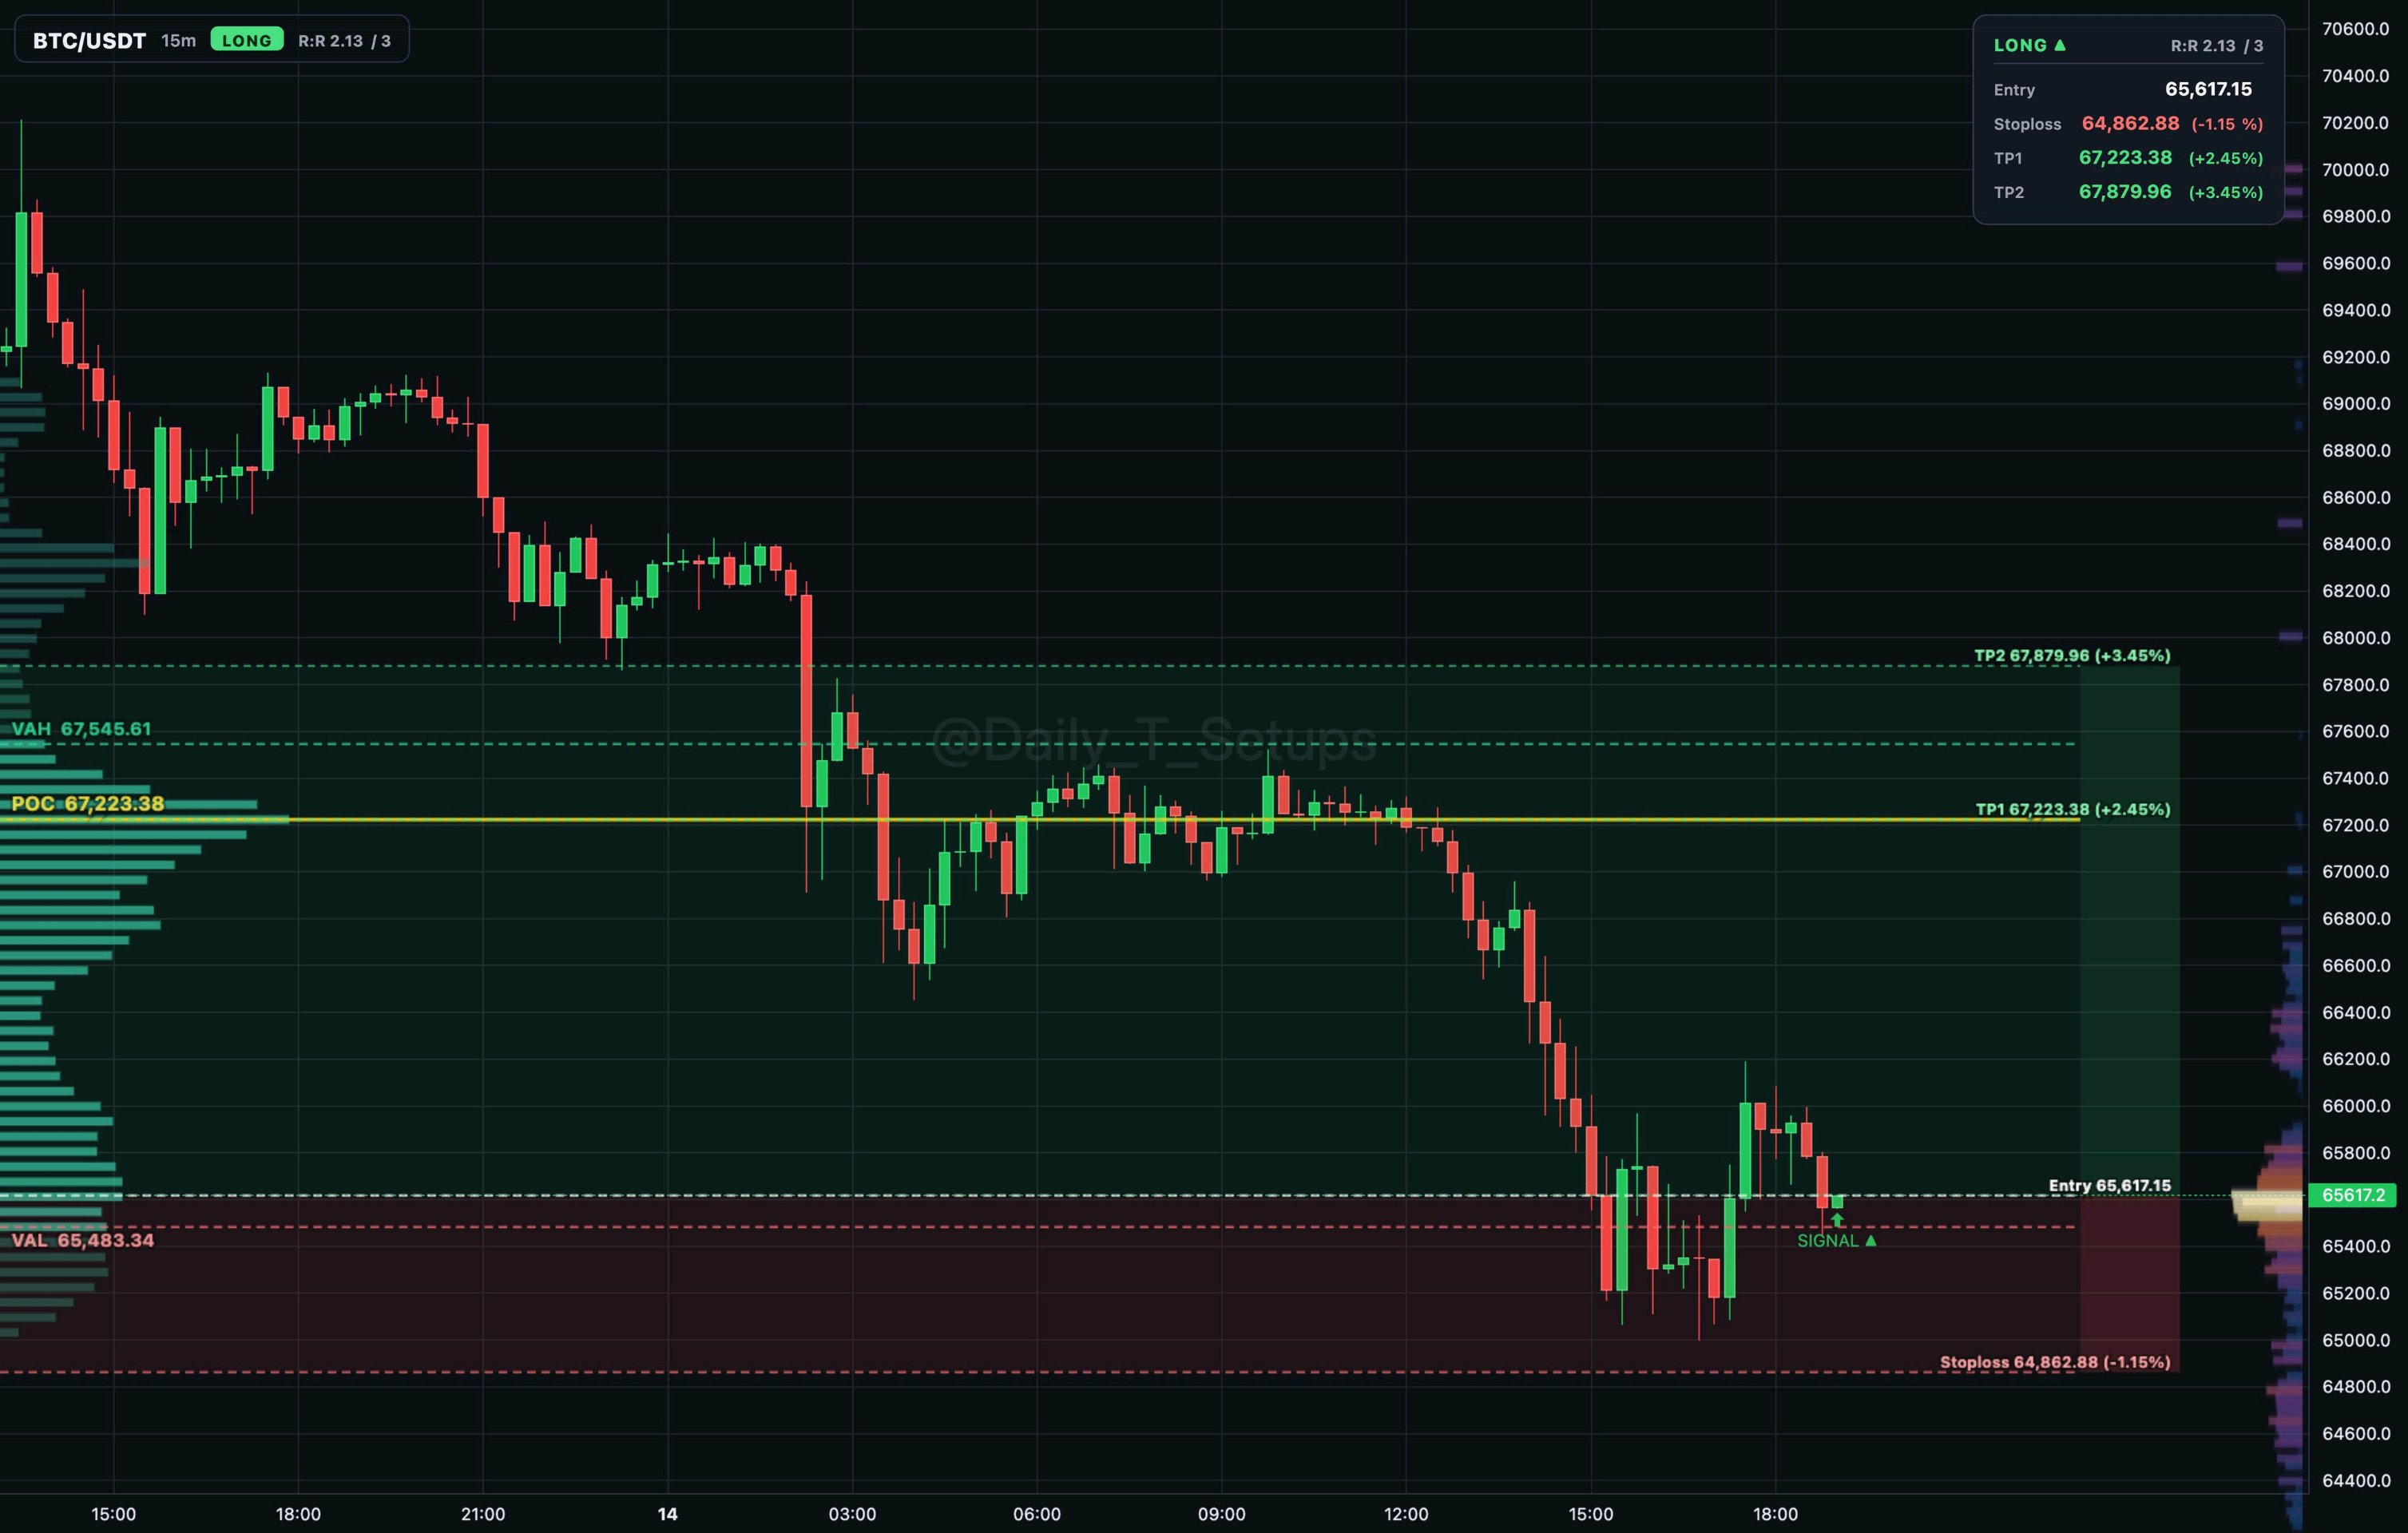
$BTCUSDT la rotación de la subasta muestra a los compradores absorbiendo el valor interno entre el VAL en 65,483.34 y el VAH en... 🔼 Configuración de compra (Long) 📍 Entrada: 65,568.53 🛑 Stop: 64,864.01 (-1.1%) 🎯 TP1: 67,223.38 (+2.5%) 🎯 TP2: 67,682.09 (+3.2%) ⚖️ Venta de la mitad en TP1 → stop a precio de entrada #ByXIMPACT #WSOT2026 #WSOTMuestraTuOperaciónIAParaGanar10USDT #La salida de Jensen Huang pone a prueba el liderazgo de IA de Nvidia #Las pruebas del IPP de EE. UU. para la operación de tasas más altas por más tiempo
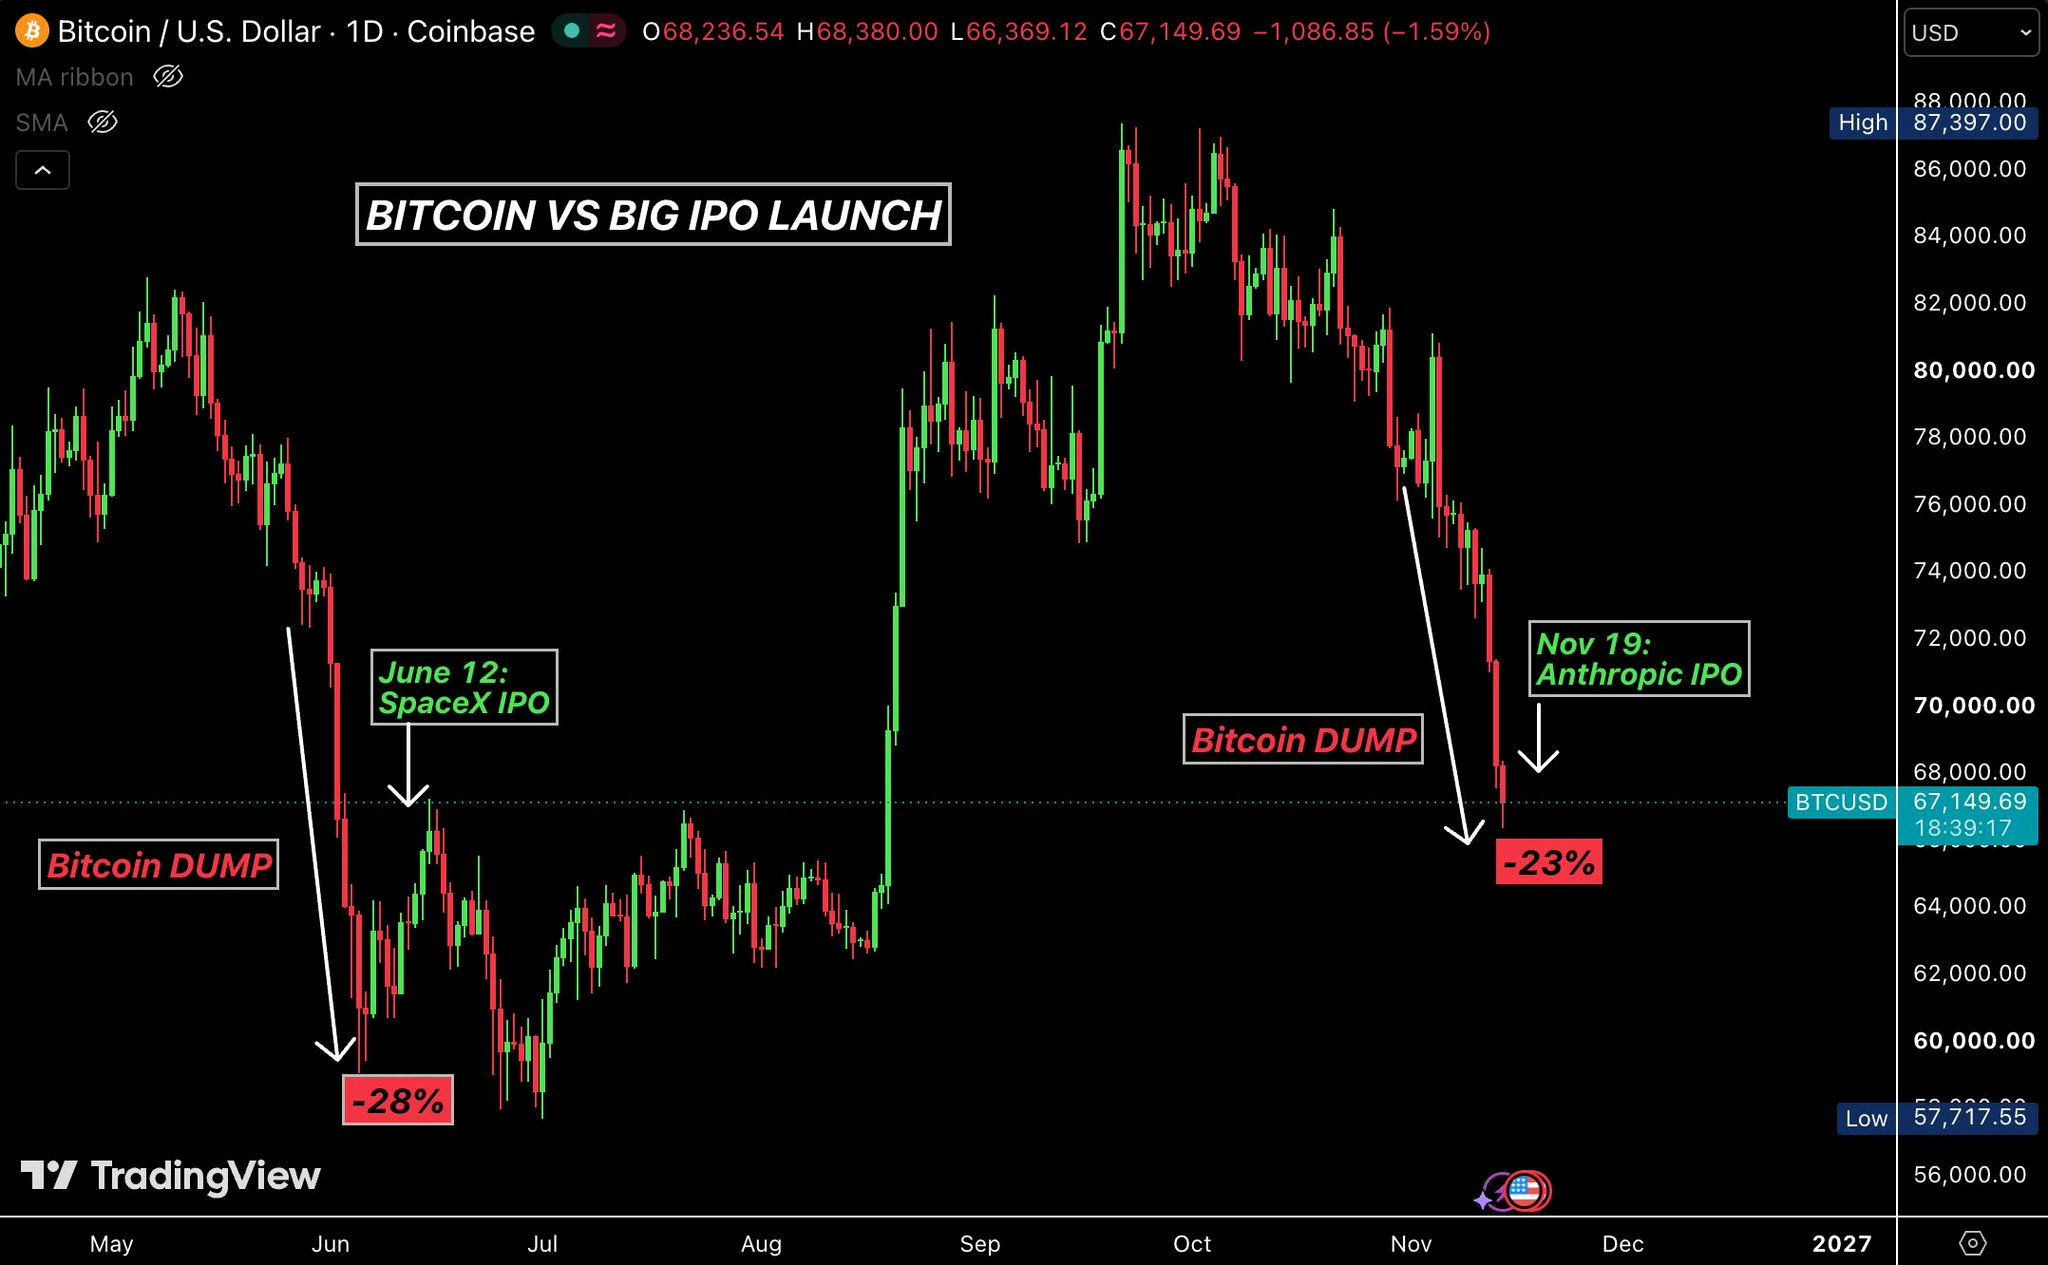
Why Bitcoin is dumping?
Why Bitcoin is dumping? US investors are reportedly selling Bitcoin ETFs to get into the Anthropic IPO. Nearly $2.35 BILLION worth of Bitcoin ETFs have been sold so far this month. We saw something similar during the SpaceX IPO in June. Money moves to the next big thing, and crypto takes a temporary hit. Such dips have historically created some of the best buying opportunities. #ByXIMPACT #WSOTShowYourAITradeToEarn10USDT #JensenHuangExitTestsNvidiasAILeadership #USPPITestsTheHigherForLongerTrade #USInflationRunsHotAndRateHikeBetsRise $BTCUSDT
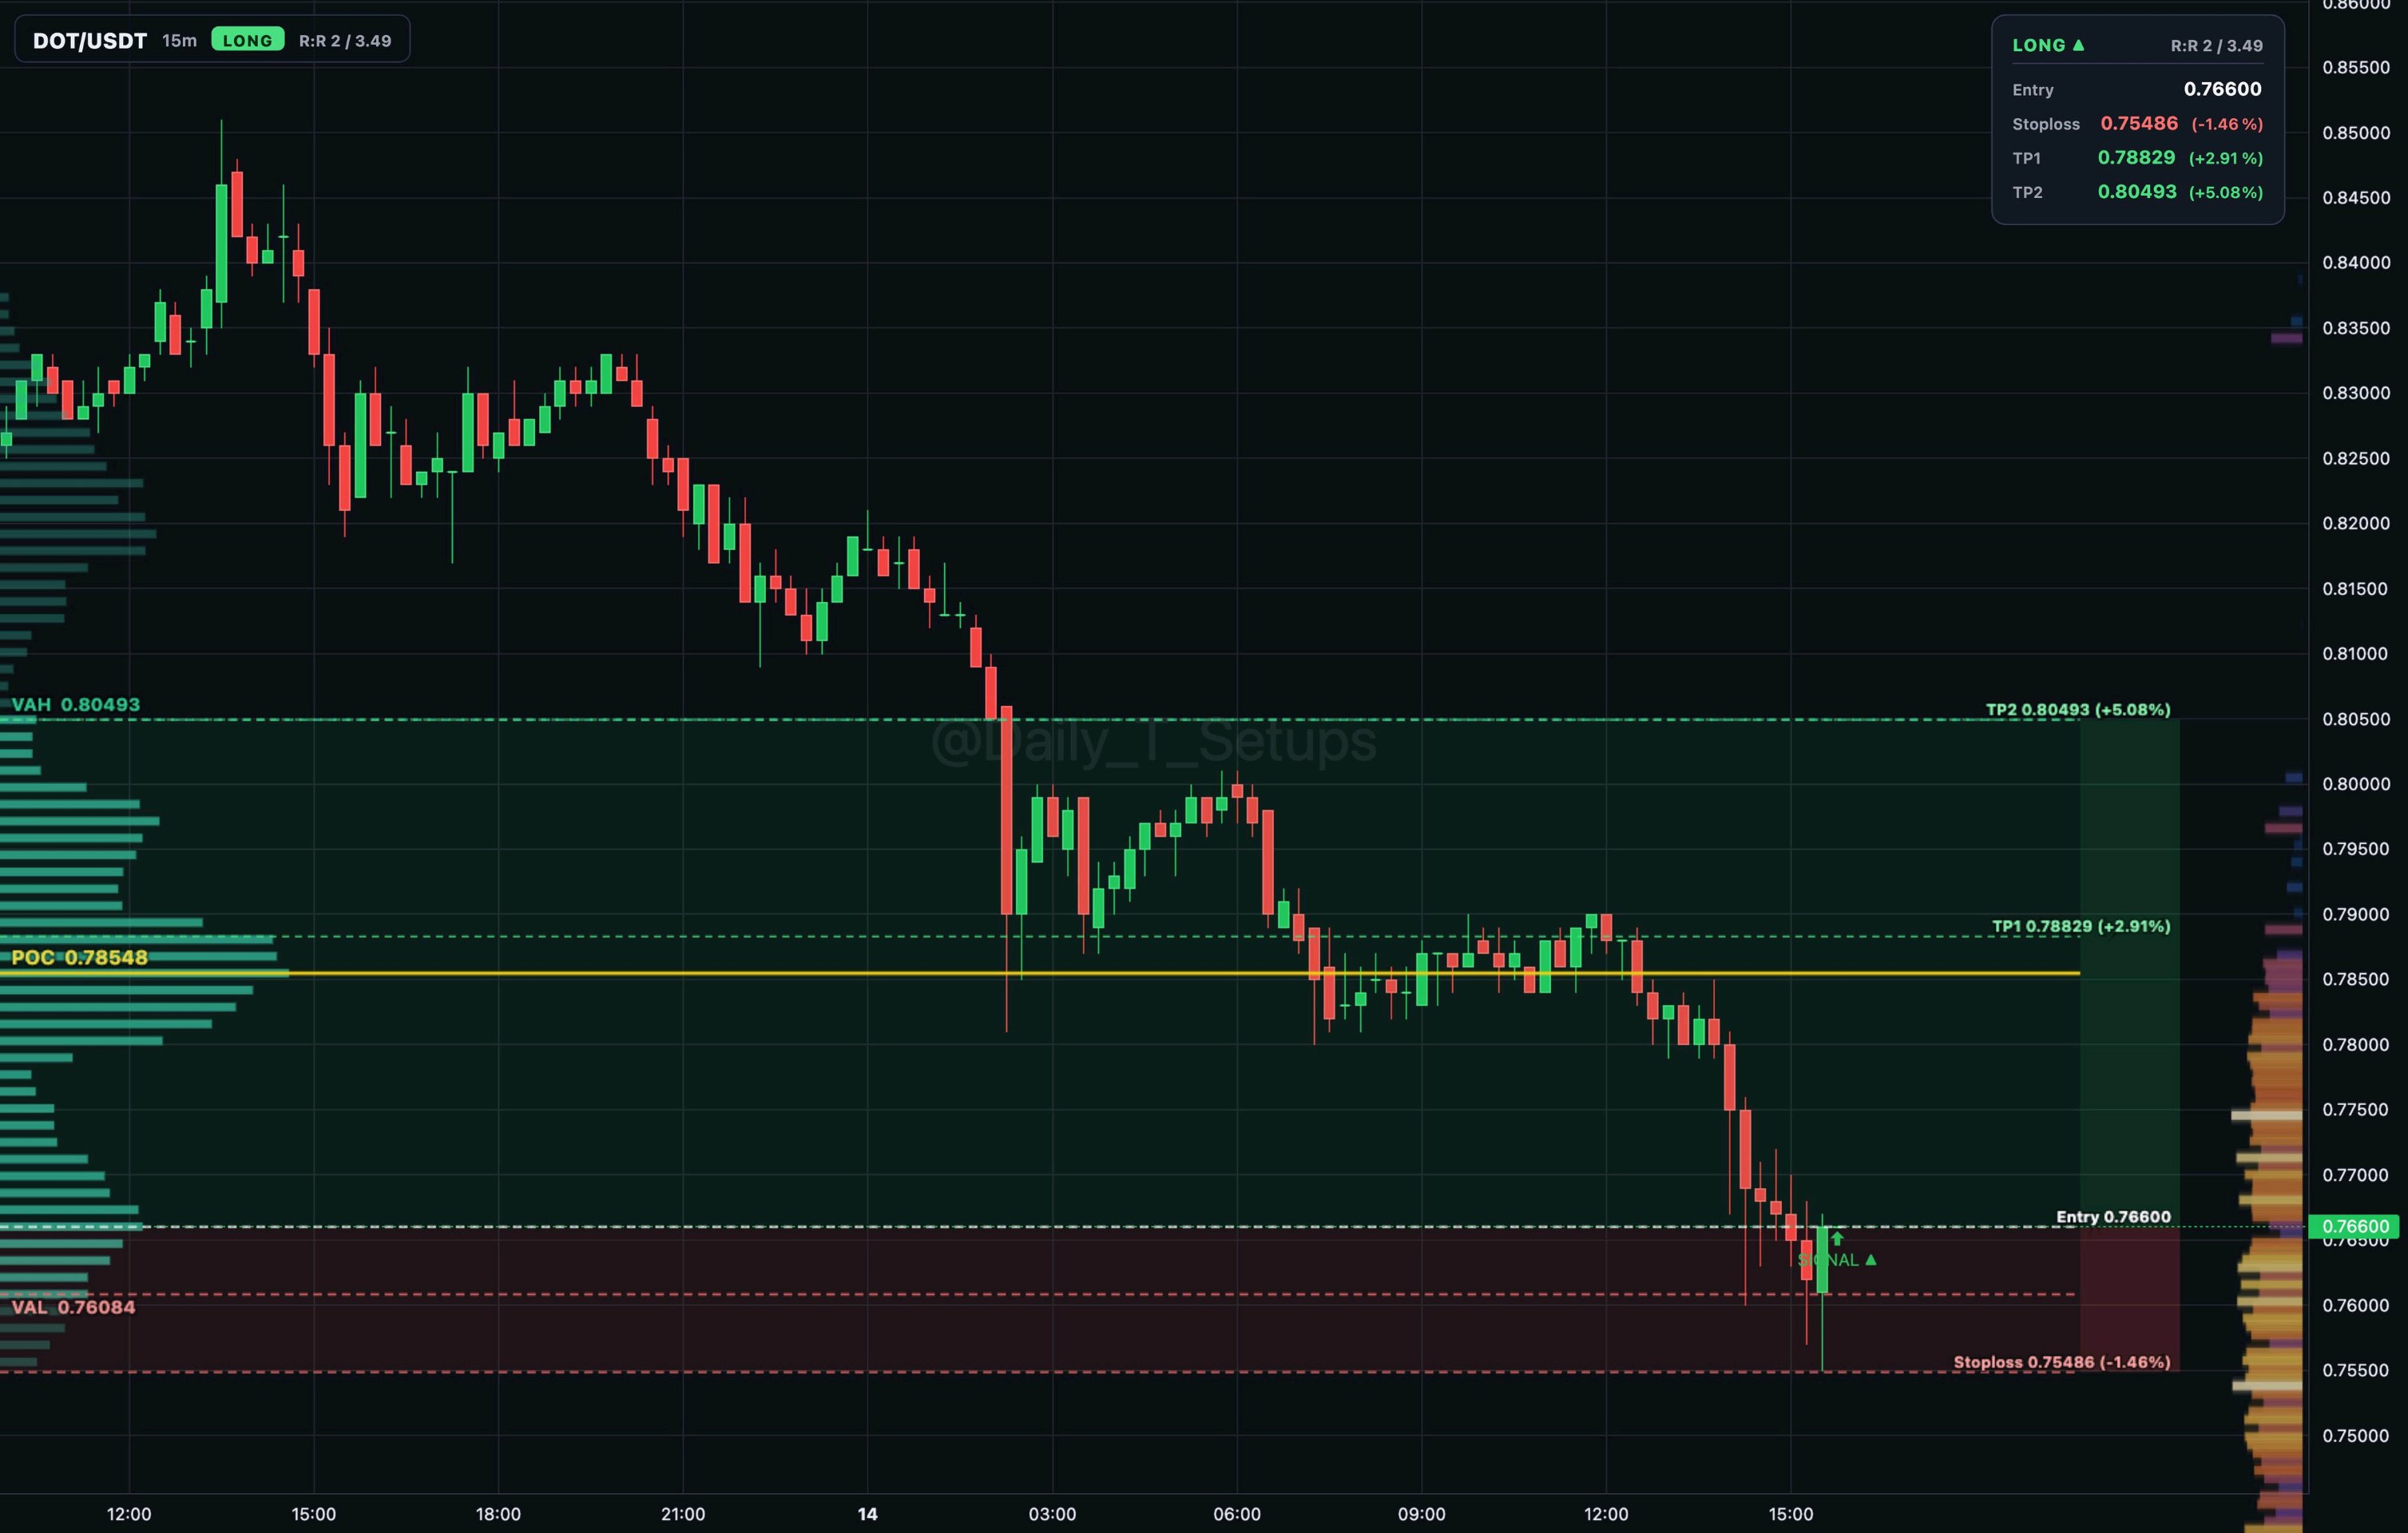
$DOTUSDT auction rotation shows balanced rotation inside value between 0.76084 and 0.80493. 🔼 Long setup 📍 Entry: 0.766 🛑 Stop: 0.75486 (-1.5%) 🎯 TP1: 0.78829 (+2.9%) 🎯 TP2: 0.80493 (+5.1%) ⚖️ Half off at TP1 → stop to entry #ByXIMPACT #WSOTShowYourAITradeToEarn10USDT #WSOT2026
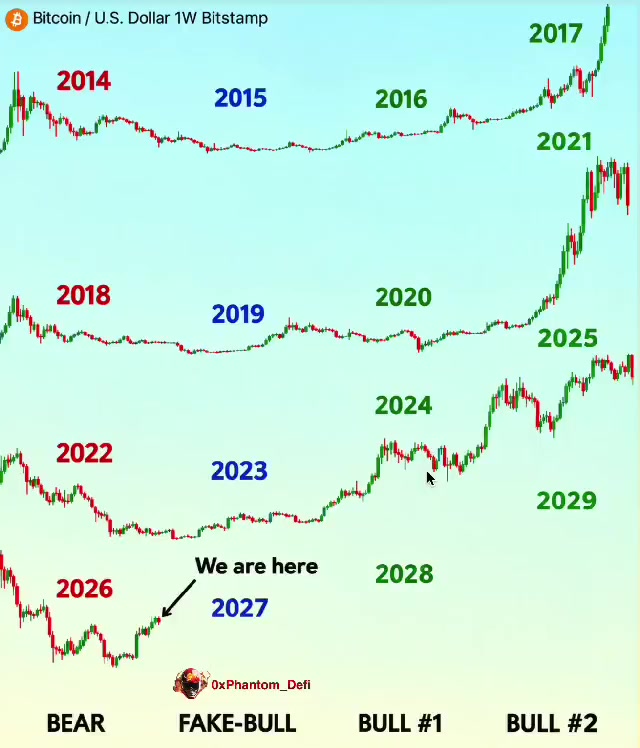
🚨 BITCOIN IS REPEATING THE SAME 4-YEAR CYCLE FOR THE FOURTH TIME. And what this pattern suggests about 2027 could catch MILLIONS of investors off guard. LOOK AT THIS CHART. 2014: BEAR MARKET 2015: RECOVERY 2016: EARLY BULL MARKET 2017: EXPLOSIVE RALLY 2018: BEAR MARKET 2019: RECOVERY 2020: EARLY BULL MARKET 2021: EXPLOSIVE RALLY 2022: BEAR MARKET 2023: RECOVERY 2024: EARLY BULL MARKET 2025: CYCLE TOP Now look at what could come NEXT. 2026: BEAR MARKET 2027: RECOVERY? 2028: EARLY BULL MARKET? 2029: NEXT CYCLE TOP? FOUR CYCLES. THE SAME 4-YEAR STRUCTURE. But here's where things get REALLY interesting. Every bear market year on this chart coincides with U.S. midterm elections. Every recovery year follows those elections. Every early bull market phase coincides with a Bitcoin halving. And the last three major cycle tops occurred approximately: → 526 days after the halving. → 548 days after the halving. → 534 days after the halving. THAT'S AN INCREDIBLY SIMILAR TIMELINE. But something has CHANGED this time. And almost nobody is talking about it. FIRST: Bitcoin's latest decline has been significantly smaller. Previous bear markets saw drawdowns of roughly 77% to 85%. This time? $126,000 → $58,600. A decline of approximately 53%. SECOND: The correction happened MUCH faster. Previous cycles took roughly 363 to 406 days to reach their bottoms. This time, Bitcoin reached $58,600 just 268 days after its peak. READ THAT AGAIN. A smaller correction. A faster decline. But potentially the SAME underlying cycle structure. Which brings us to the most important question: IS $58,600 ALREADY THE BITCOIN CYCLE BOTTOM? Or is one FINAL capitulation still ahead? I'm watching both scenarios closely. Because if this four-year pattern repeats, 2027 could become one of the most important accumulation years of the entire decade. And with the next Bitcoin halving expected around April 2028, the timing becomes even more interesting. I'm NOT saying history guarantees another bull market. But I'm also NOT ignoring a pattern that has appeared across three completed cycles. SAVE THIS CHART. Come back to it in 2027. I've spent over 12 years studying financial markets and identifying major turning points. And when I see the next major Bitcoin buying opportunity, I'll share it HERE FIRST. Follow and turn on notifications. Because the BIGGEST opportunities don't appear when everyone is bullish. They appear when almost nobody believes the next bull market is even possible. #ByXIMPACT #WSOTShowYourAITradeToEarn10USDT #JensenHuangExitTestsNvidiasAILeadership #USPPITestsTheHigherForLongerTrade #USInflationRunsHotAndRateHikeBetsRise
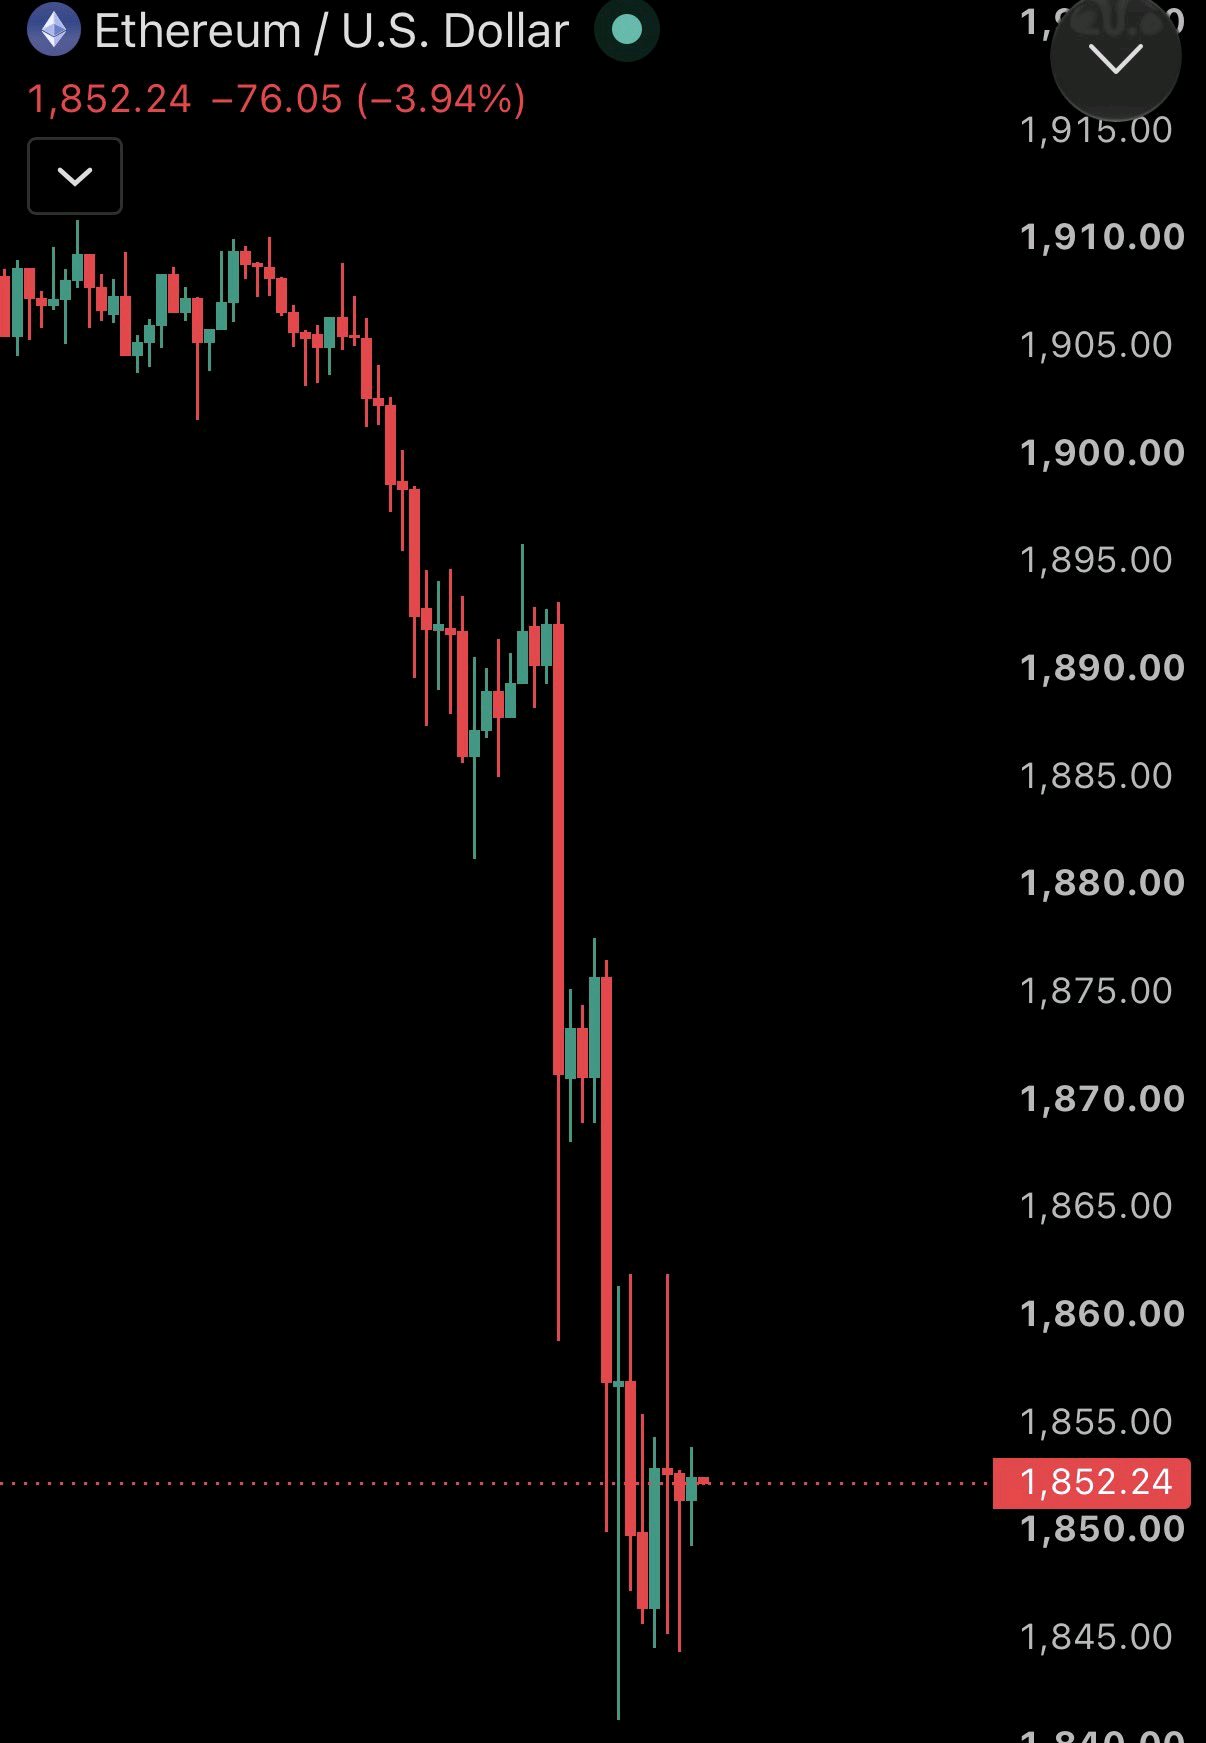
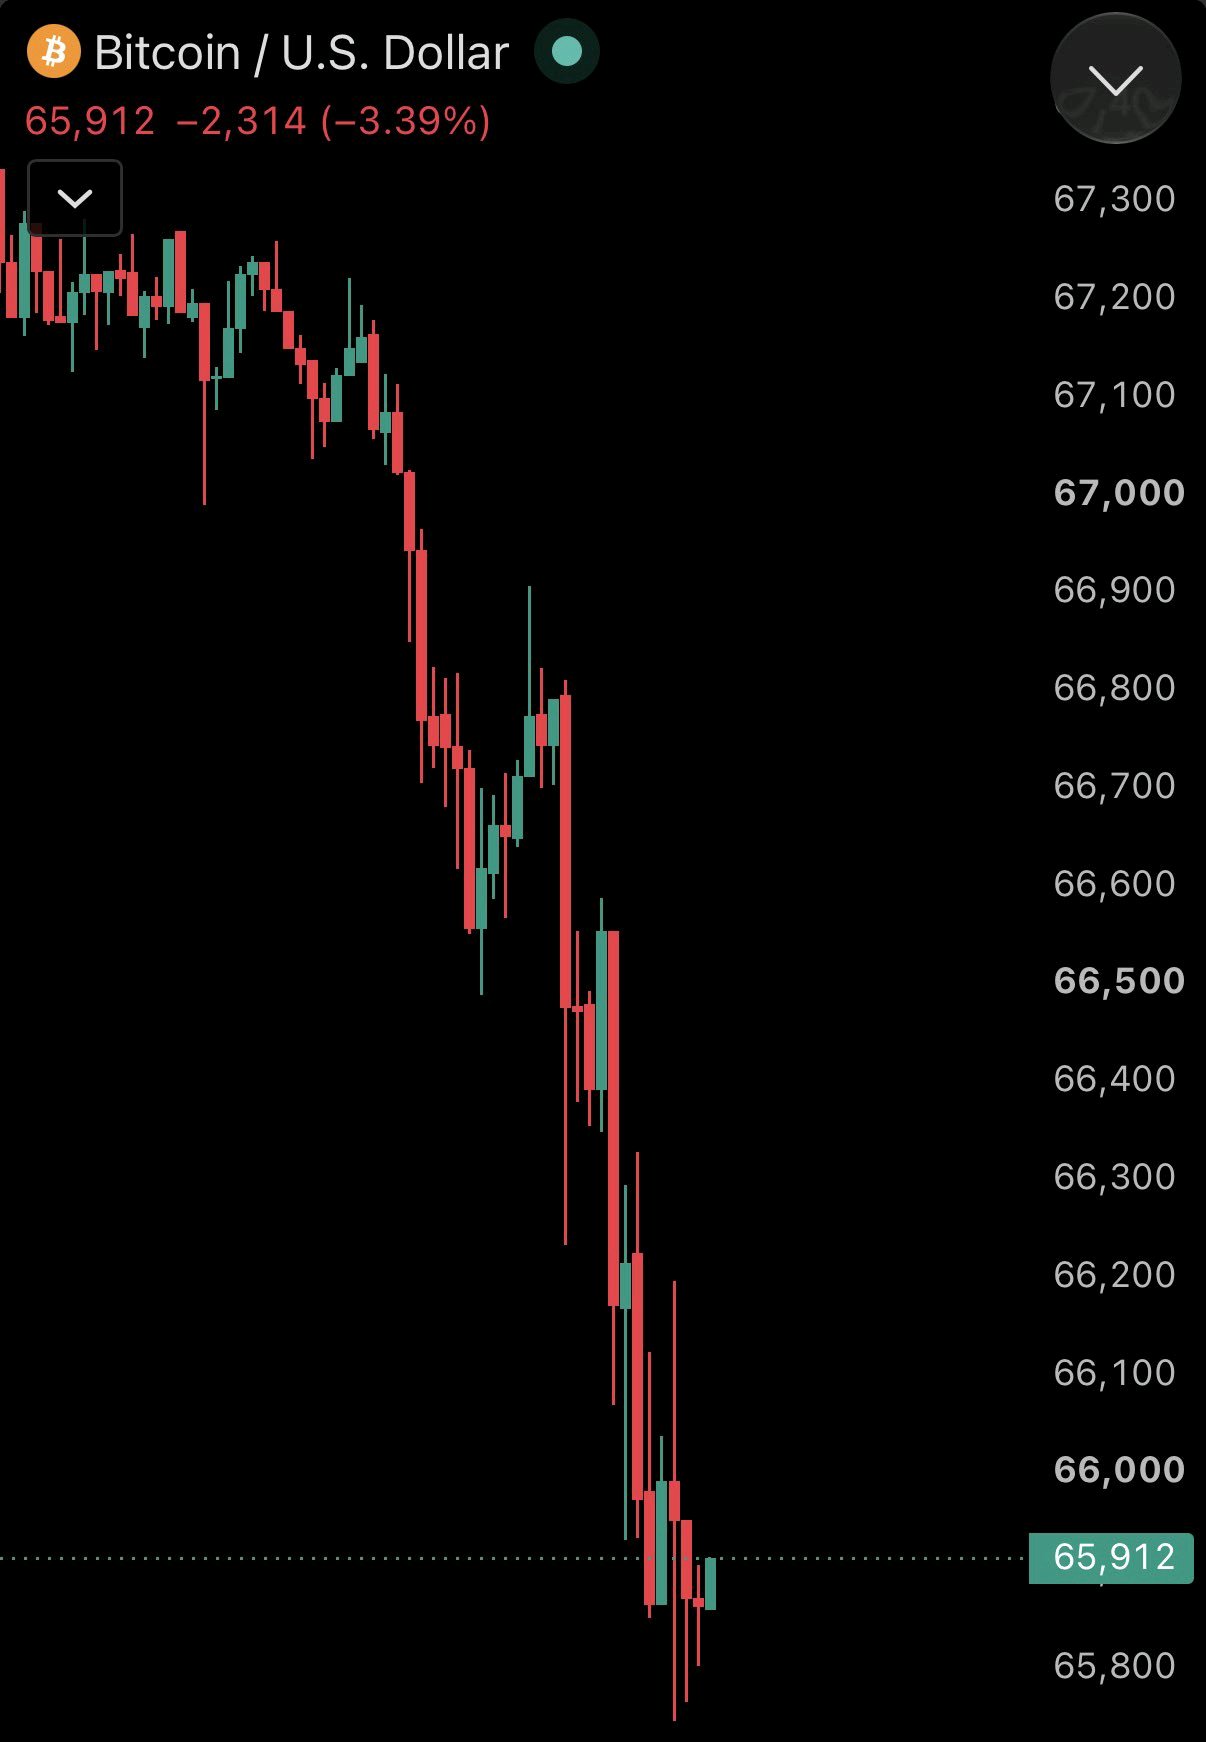
Bitcoin falls below $66,000 and ETH falls below $1,850 as $215 million worth of levered positions are liquidated in 60 minutes. Crypto is seeing one of its most brutal weeks of the year #ByXIMPACT
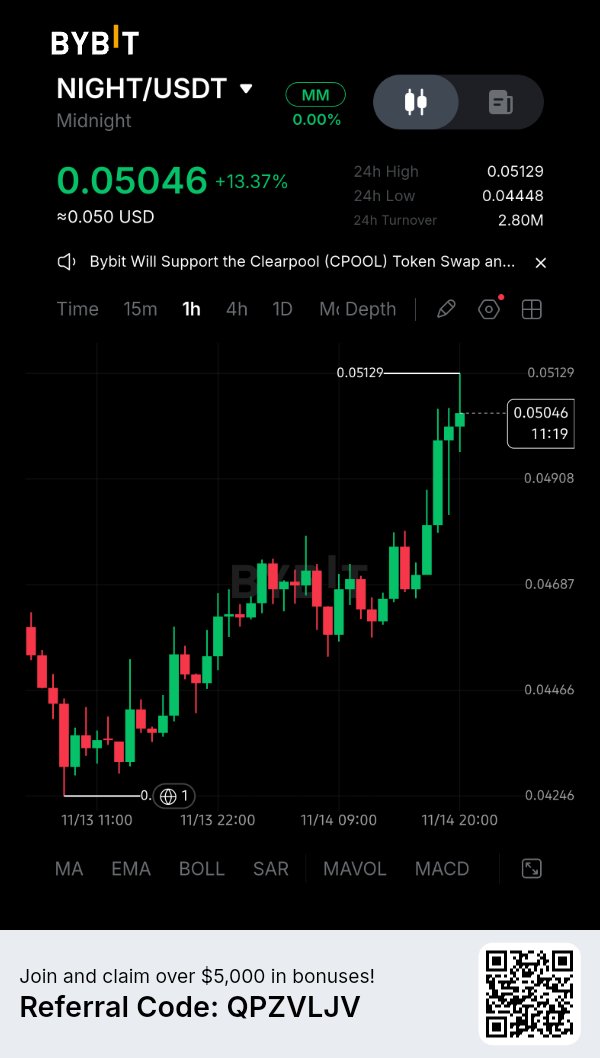
NIGHT is showing strong momentum on Bybit.
$NIGHTUSDT is trading around $0.05046 and is up more than 13% on the 1H chart. Buyers are clearly stepping in and pushing the price higher after a steady recovery. The next important level to watch is $0.05129. A clean break above this resistance could bring more buying interest. If the price faces rejection, $0.0490 and $0.0469 are important support areas to watch. My focus is on how NIGHT closes around the current resistance. No need to chase a green candle. Wait for confirmation and always manage your risk. Let's see if buyers can keep this momentum going. #ByXIMPACT
🚨 Bitcoin is approaching one of the MOST IMPORTANT buying zones in its history. And this Bitcoin strategy has worked across the last 3 halving cycles. Here's how it works. BUY Bitcoin 500 days before the halving. SELL Bitcoin 500 days after the halving. Sounds simple, right? But look at what happened during previous cycles. • 2015: Bitcoin bottomed around 500 days before the 2016 halving and entered a massive bull market. • 2019: Bitcoin had already bottomed before the 2020 halving and eventually rallied toward $69,000. • 2022: Bitcoin bottomed roughly 500 days before the 2024 halving and went on to reach new all-time highs. And now we're approaching the same period once again. The next Bitcoin halving is expected in 2028. That means the historical accumulation window is getting closer. What's even more interesting? Bitcoin is already experiencing a massive correction, while fear is returning to the market. Historically, these periods have created some of the BEST long-term buying opportunities. Of course, historical patterns don't guarantee future results. But if this 500-day cycle repeats itself, we could be approaching another major Bitcoin accumulation opportunity. History might be about to repeat itself. #WSOTShowYourAITradeToEarn10USDT #JensenHuangExitTestsNvidiasAILeadership #USPPITestsTheHigherForLongerTrade #USInflationRunsHotAndRateHikeBetsRise $BTCUSDT $DOGEUSDT #ByXIMPACT
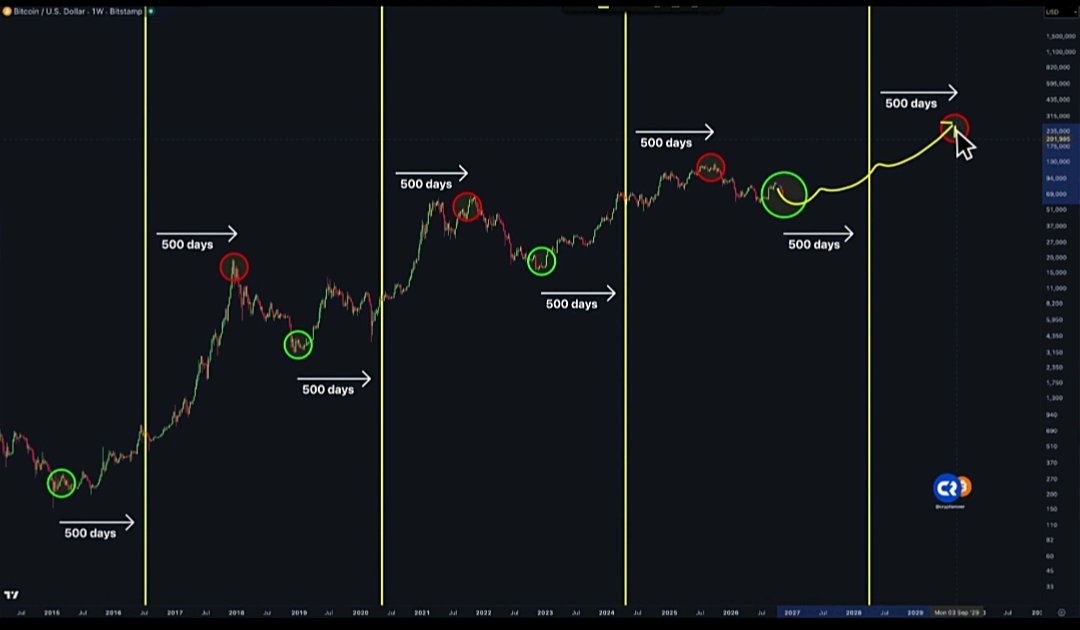
$PIEVERSEUSDT is showing some interesting price action on the 1H chart. The price is currently around 1.7795, up more than 5% in the last 24 hours. After a strong move toward 1.90, the price is now consolidating around 1.77–1.80. Here are a few levels I am watching: Support: 1.72 and 1.63 Resistance: 1.81 and 1.90 A breakout above 1.81 could bring more buying interest, while losing 1.72 may lead to another pullback. My approach is to wait for confirmation before entering and avoid chasing a sudden pump. Always manage risk and use a proper stop loss. Let's see which direction PIEVERSE takes next. #ByXIMPACT
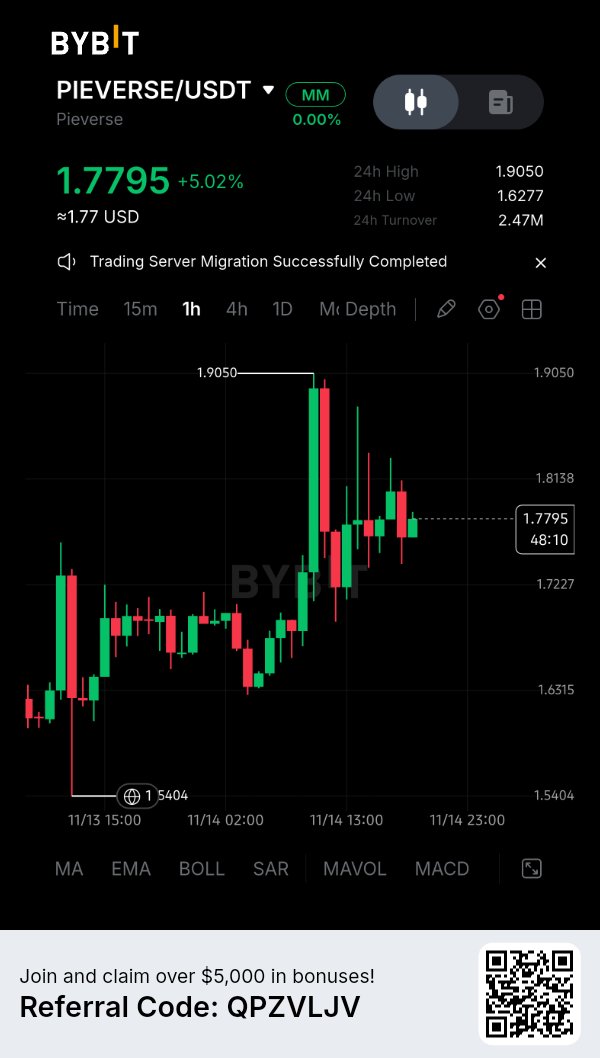
$BTCUSDT is starting to follow the global liquidity trend again. This is a relationship I’m keeping a close eye on. If global liquidity turns upward and Bitcoin follows its historical pattern, we could see a strong move ahead. The next liquidity reversal could be a major catalyst for Bitcoin. #ByXIMPACT
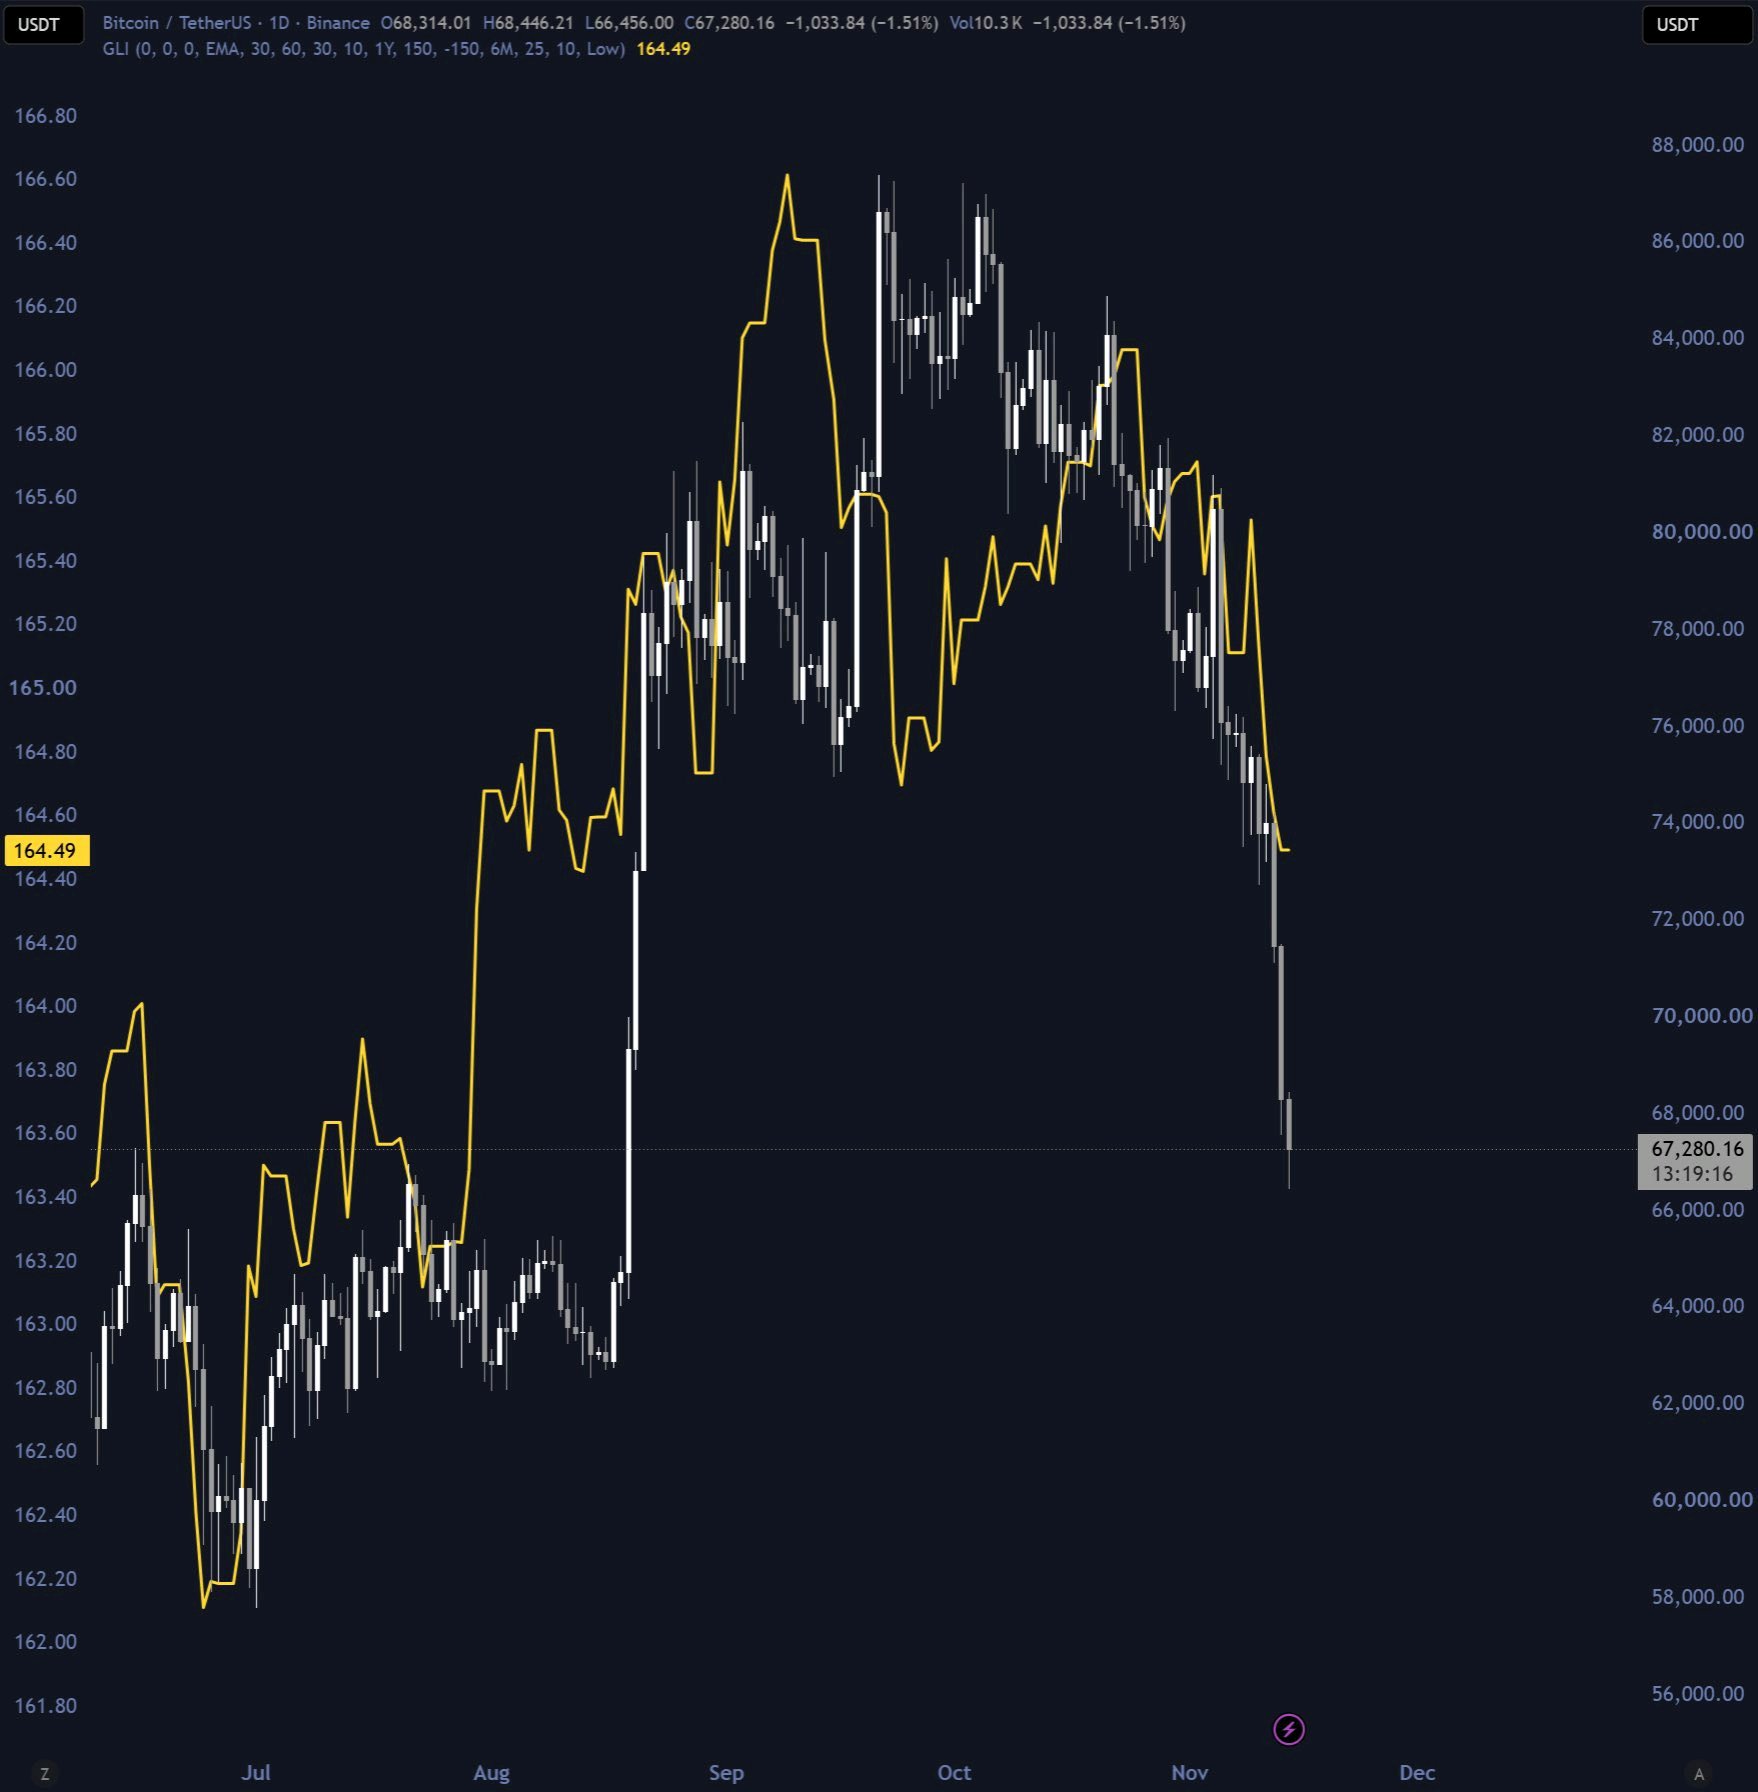
INJ is showing strong bullish momentum!
$INJUSDT is currently trading around $8.19 and is up more than 10% on the 1H chart. Buyers have stepped in strongly after the recent dip and pushed the price toward the $8.31 resistance level. The latest candles show strong buying pressure but price is now approaching an important resistance area. Important Entry Zones • $8.00–$8.05: First potential entry zone if price pulls back and holds support. • $7.70–$7.80: Another support area to watch for a possible bounce. • $7.45–$7.55: Stronger pullback zone if the market corrects further. • Above $8.32: Breakout entry can be considered after a confirmed candle close and successful retest. Upside Targets • $8.32 – First resistance • $8.50 – Next target • $8.70 – Higher target if bullish momentum continues Trading Tips 1. Avoid chasing the price after a strong pump. 2. Wait for a proper pullback or breakout confirmation. 3. Always use a stop-loss to protect your capital. 4. Keep leverage low during volatile market conditions. 5. Take partial profits as price reaches important resistance levels. My View INJ is showing good short-term strength. However $8.32 is the key level to watch. A clean breakout above this area could create room for further upside. Patience is important. A good entry with proper risk management is always better than chasing a green candle. #ByXIMPACT #WSOTShowYourAITradeToEarn10USDT #JensenHuangExitTestsNvidiasAILeadership #USPPITestsTheHigherForLongerTrade #USInflationRunsHotAndRateHikeBetsRise
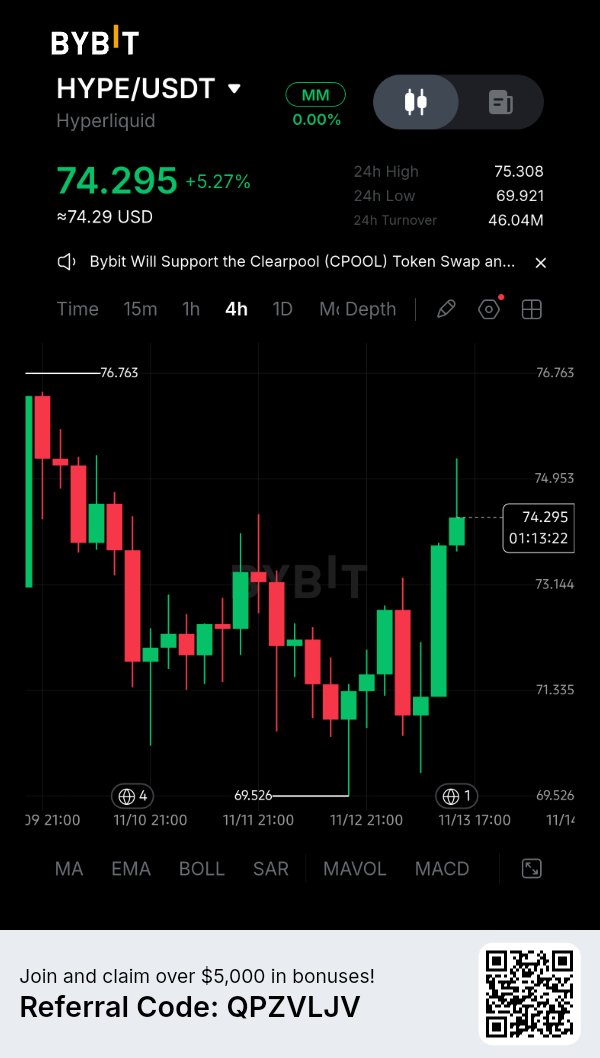
HYPE is showing positive momentum!
$HYPEUSDT is currently trading around $74.29 and is up more than 5% on the 4H chart. After spending some time moving sideways and testing lower levels buyers are starting to show strength again. Important Entry Zones • $73.10–$73.60: Potential entry zone if price pulls back and holds support. • $71.30–$71.80: A deeper support area to watch for a possible bounce. • Above $75.30: Breakout entry can be considered after a confirmed 4H close and successful retest. Upside Targets • $75.30 – First resistance • $76.00 – Next target • $76.75 – Higher resistance zone Trading Tips 1. Don't rush into a trade just because the price is moving up. 2. Wait for confirmation before entering. 3. Always use a stop-loss to manage risk. 4. Avoid high leverage during volatile market conditions. 5. Never risk more than you can afford to lose. My View HYPE looks promising in the short term but $75.30 is an important level to watch. A clean breakout and successful retest could create an opportunity for further upside. Patience and proper risk management are always important in trading. #ByXIMPACT
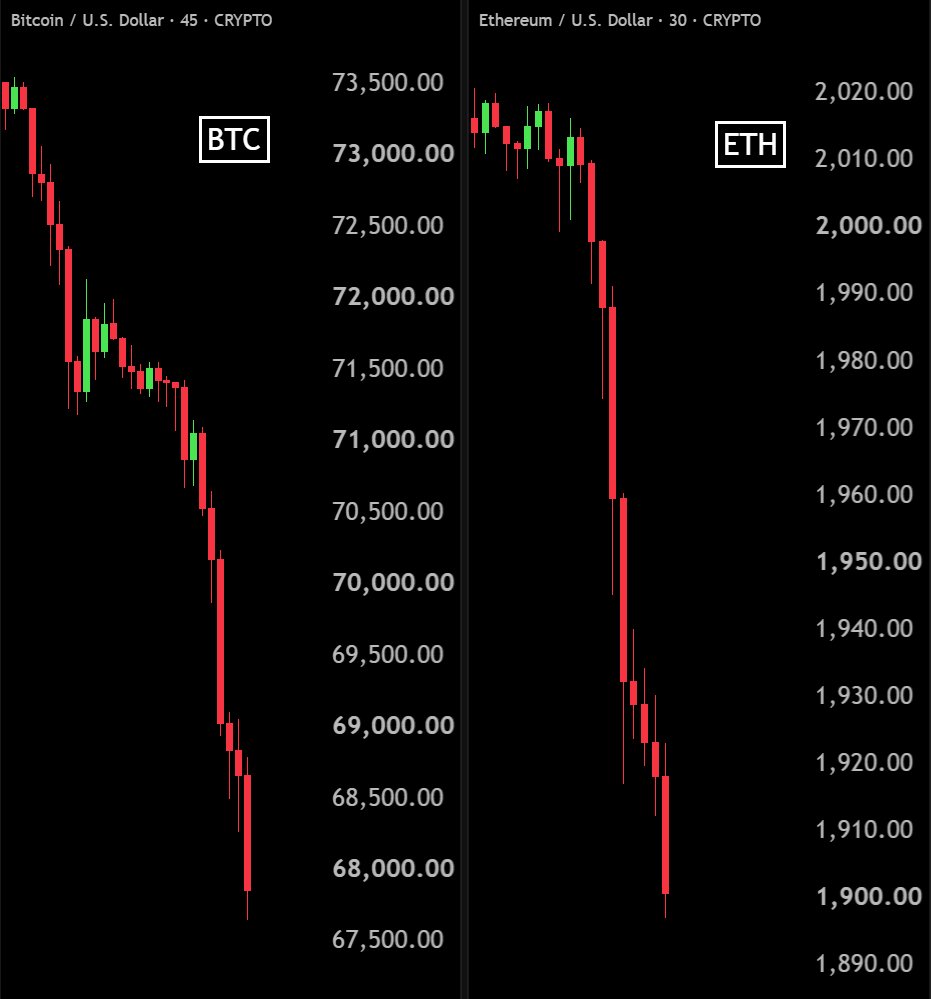
BLOODBATH IN CRYPTO MARKET
BLOODBATH IN CRYPTO MARKET $1.6 Billion has been liquidated from crypto market in the last 24 hours. $BTCUSDT below $68,000 $ETHUSDT below $1,900 $SOL below $80 $XRP below $1 $BNB below $630 #ByXIMPACT
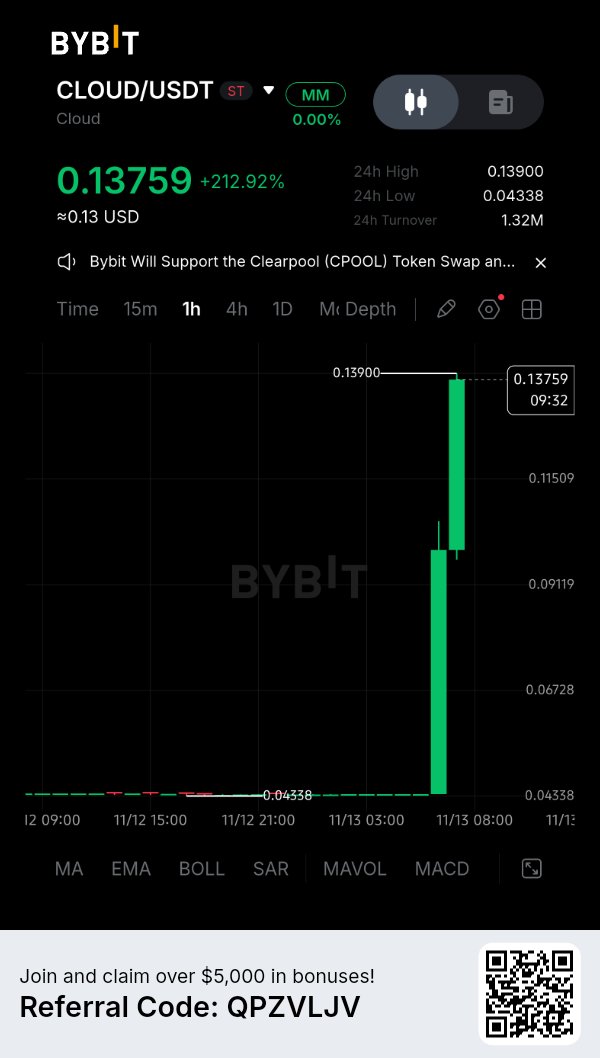
$CLOUDUSDT is showing significant momentum on Bybit, with its price rising over 212% to around $0.137. The recent chart movement highlights strong buying activity and growing market interest. Volume is also worth watching as the price approaches the $0.139 resistance area. The next move will be important. Holding the current levels could support further upside, while a pullback would be worth monitoring. As always, focus on market structure and manage risk carefully before entering any trade. #ByXIMPACT
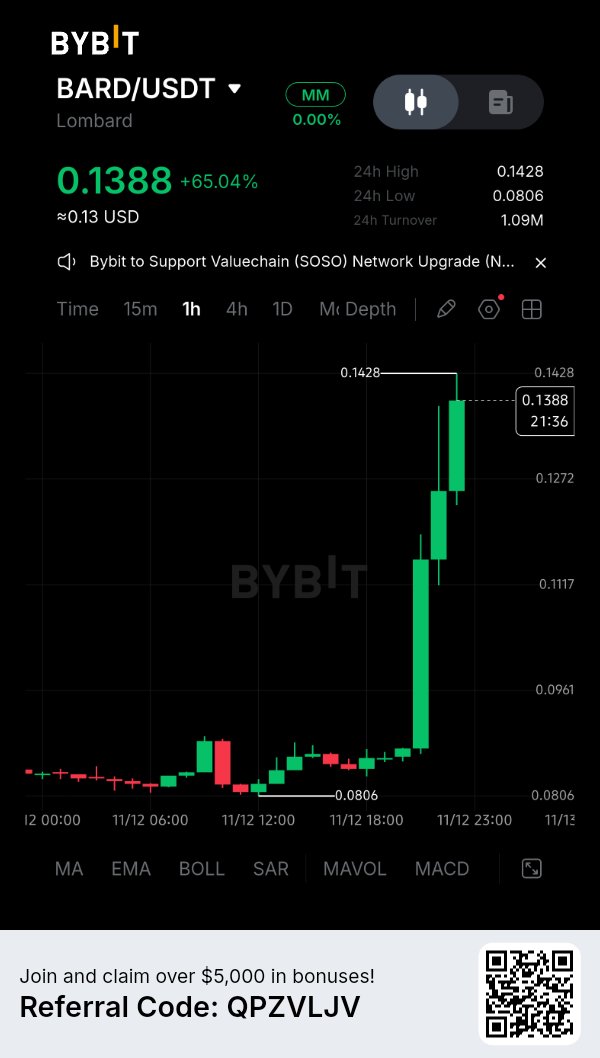
$BARDUSDT Price Action Breakdown: Anatomy of a Supply Rejection 📈📉 When you see a parabolic +65% expansion like this on the 1H chart, emotions run high, but a professional trader looks strictly at market structure and liquidity pools. Here is how I am breaking down the current setup: * The Expansion Phase: Price exploded out of the $0.0806 lows, pressing aggressively into the $0.1428 local resistance. That kind of vertical move forces a lot of late retail longs into the order book. 🔹 The Absorption & Retracement: Notice how the sharp green candles are met with consolidation near $0.1388. This indicates that early buyers are beginning to take profits, creating a natural supply wall. 🔹 The Trading Plan: ❌ Never FOMO chase the high. Buying the absolute top of an impulse move carries an asymmetric downside risk. ✅ Patience pays. I am waiting to see if price forms a high-timeframe bullish flag or cleanly tests local support clusters before deploying capital. Let the market come to your levels. How are you playing this volatility? Are you scaling out or waiting for a dip? Let's talk strategy below. 👇 Disclaimer: For educational and analytical purposes only. Not financial advice. #ByXIMPACT